Article

The Effect of Husbandry and Original Location on the Fouling of Transplanted Panels

Ocean Engineering and Marine Science, Florida Institute of Technology, 150 W University Blvd, Melbourne, FL 32901, USA
*
Author to whom correspondence should be addressed.
J. Mar. Sci. Eng. 2023, 11(3), 478; https://doi.org/10.3390/jmse11030478
Submission received: 31 January 2023 / Revised: 21 February 2023 / Accepted: 22 February 2023 / Published: 23 February 2023
(This article belongs to the Special Issue Feature Papers in Marine Biology)

Abstract

:
The best way to stop the introduction of non-indigenous species (NISs) is by preventing their transport. In the case of ship hulls, this may be accomplished by managing entrainment onto the hull. This study was designed to examine the role of hull husbandry, i.e., cleaning and grooming, in fouling community structure and to determine the effect of husbandry on the recolonization of surfaces after a transplant was performed. A series of panels were placed at two locations along the east coast of Florida (Port Canaveral and Sebastian Inlet) that are typified by distinct fouling communities. Panels were subjected to one of three treatments: groomed weekly, cleaned every two months, or freely fouling. After four months, all panels were cleaned and transplanted between sites; no further husbandry was performed. Fouling community composition and coverage was characterized at monthly intervals both before and after transplantation. Hull husbandry was found to affect coverage and composition, with groomed panels carrying a lower cover of macrofouling in general. The effect of the original location on subsequent fouling composition and recolonization by specific organisms was confirmed for encrusting bryozoans, barnacles, sponges, and tunicates. Hull husbandry also affected subsequent fouling with specific preferences shown for surfaces that had been groomed, cleaned and undisturbed.

1. Introduction

Ships, through hull, ballast, and niche fouling, are an important vector for the introduction of non-indigenous species (NISs) [1,2,3,4,5,6,7]. Despite selecting for a smaller subset of species than ballast water, hull and niche fouling are potentially more important vectors, since those species are more likely to survive transport and their control is not legislated [8]. Prevention through vector control and reducing the size, range, and potential dispersal of an outbreak is the best way to mitigate the risk of introducing NISs [1,9,10]. Hull husbandry may offer a way to reduce the risk that hull conditioning will lead to increased transfer of NISs.
The use of risk analysis to predict NISs is relatively new. Biosecurity refers to a regulatory framework intended to prevent, reduce, and manage invasive species; it includes border surveillance to identify exotic species, quarantine to prevent invasion, response when transported exotics are found, and control of established pests [11]. One of the first steps is to identify the vector and determine the likelihood that organisms will be entrained, transported, and established in the new environment [11,12,13]. The risk of successful invasion increases as the density or frequency of release increases; it also depends on the combination of fouling community characteristics (i.e., composition, dispersal method, growth form, reproductive status, amount of fouling), the processes that occur during or prior to transit (i.e., the length of the voyage, maintenance history, age and condition of antifouling coating, speed, survivorship during vessel passage) and the match or mismatch between the donor and recipient ports. If environmental conditions in the recipient environment are conducive to survival of the invader, the risk of invasion should increase with increasing time spent in that port [4].
Preventing invasion is the primary tool of risk management and may be accomplished through the prevention of exposure, enhancement of vector immunity, and quarantine and sanitation of infected vectors [10,11]. The International Maritime Organization (IMO) has begun to work on a framework designed to decrease the transfer of NISs [7]. Many countries have also begun to develop laws emphasizing the importance of hull condition for ships entering their territorial waters. The best practice that has been identified is to maintain the ship as free from fouling as is practical [7,14,15,16,17]. In addition to preventing or decreasing the transfer of invasive species, a ship with a clean hull will also have improved hydrodynamic performance and energy efficiency and decreased maintenance costs and greenhouse gas emissions [14,17,18,19,20,21,22].
The typical solution to a fouled ship hull is cleaning. The efficacy of cleaning varies by species, but in general is most effective against biofilms and algae, moderately effective against mussels and other animals attaching with a byssus, and least effective and most variable against cementing and mobile species [23,24]. Cleaning has been shown to affect microbial diversity and macrofouling community structure [25,26]. This is especially noticeable when organisms are imperfectly removed. The rapid regrowth of algae from fragments (macro and micro) has been shown on ship hulls [23]. In other cases, the removal of calcareous fouling led to a rapid growth of hydroids [27], possibly because the disturbance of cleaning favors certain, often non-native or poorly competing species, over others [28]. On Navy ships, surfaces that had been cleaned three times or more refouled rapidly, despite the presence of intact antifouling coatings. This was attributed to the presence of a leached layer that was unable to be removed after three cleanings [27].
Hull cleaning is reactive; requires a diver, which introduces health and safety risks; and can damage coatings [7,14,15,21,29]. Cleaning may damage or roughen coatings [23], creating a patchwork of different topographies. Barnacles are known to preferentially recruit to crevices, pits, and grooves when appropriately scaled to the size of the larvae [30,31,32]. The fouling green algae, Ulva linza, were found to not only prefer to settle in the bottom of pits but also to select the corner where the side of the pit meets the bottom [33]. Corals have been found to recruit preferentially in grooves left by the grazing activity of Echinometra mathaei [34] and into empty burrows of Lithophaga curta [35]. Survivorship is higher in pits, grooves, and crevices that are close to the size of the larvae and provide refuge from predation, scouring, and removal by water action [36,37]. This cue is considered much more important to non-colonial organisms, such as barnacles and tube worms, because colonial organisms such as bryozoans can survive partial mortality, quickly outgrow the refuges and are, therefore, less benefitted by them [37].
In-water cleaning is assumed to increase the risk of introducing alien species through the survival and growth of defouled fragments and the release of propagules [4,23,38]. Approximately 62% of organisms removed during in-water cleaning using scrapers and soft cloths were found to be viable, whereas only an average of 23% of those removed during shore-based cleaning were viable [39]. However, survival is species-specific, highly dependent on fragment size, and negatively affected by turbidity, sedimentation, and predation [38,40]. The cleaning method depends on the type of ship, with yachts primarily defouled using hand-held scrapers, whereas larger vessels are cleaned using diver-operated multi-brush vehicles [4]. Soft-bodied organisms were less damaged and had higher viability and survivorship when cleaned in water using scrapers, whereas multi-brush tools tend to crush and fragment defouled material [4,39]. Additionally, intact organisms may be dislodged from the hull by divers and equipment and fall to the bottom, where survival is possible [4]. For some organisms, physical disturbance, such as that experienced during in-water cleaning, will trigger spawning. The probability of successful introduction for propagules is increased by both the density and frequency of release [4]. In-water cleaning has been banned in some countries and ports because of concerns with toxin release and the release of alien species [4,41]. Restrictions on in-water cleaning may act as a disincentive to defoul, which could lead to increased risk from heavily fouled ships visiting a port with intact fouling assemblages [4,24].
Despite the potential drawbacks, cleaning offers benefits, including a reduction in fuel consumption and greenhouse gas emissions, the ability to maintain speed, the ability to extend the longevity of coating systems and delay dry docking, simplified hull inspection, reduced volume of waste in dry dock, the continued efficiency of sonar operations, and hydroacoustic stealth, which is required for military vessels to complete missions. In-water cleaning creates a cleaner unfouled space than transit alone; therefore, hull cleaning is preferable to no husbandry as a way to prevent the transportation of NISs [24]. Cleaning or grooming performed when fouling is still at the biofilm stage has the potential to reduce environmental impact and remove marine organisms frequently enough that they are unable to adhere tightly [42,43].
A gentle, proactive, mechanical, regularly repeated form of hull cleaning known as grooming has recently been studied as a method to control hull fouling [17,21,22,44,45,46,47]. Even as early as 1977, the potential benefits of a fully automated grooming system were recognized [42]. However, grooming has now been shown to maintain surfaces free of the majority of fouling and debris for extended periods of time [17,44,45,46,47].
It has been shown that prior fouling can condition a silicone surface and alter the community and the response of specific organisms that recolonize after transplant [48]. The question now is whether this effect can be altered with different levels of husbandry. The purpose of this experiment is threefold. The first is to investigate the effect of different husbandry methods on fouling community structure. The second is to investigate how husbandry affects recolonization after transplant. The third is to investigate how the original location affects recolonization after transplant. The specific hypotheses tested were: (1) groomed surfaces will have lower fouling cover than cleaned or ungroomed surfaces; (2) cleaned surfaces will have lower fouling cover than ungroomed surfaces; (3) fouling communities that develop on transplanted panels will more closely resemble the original fouling community; and (4) fouling communities on panels that had experienced prior grooming or cleaning will recolonize similarly to freely fouling panels after transplant in terms of cover and composition.

2. Materials and Methods
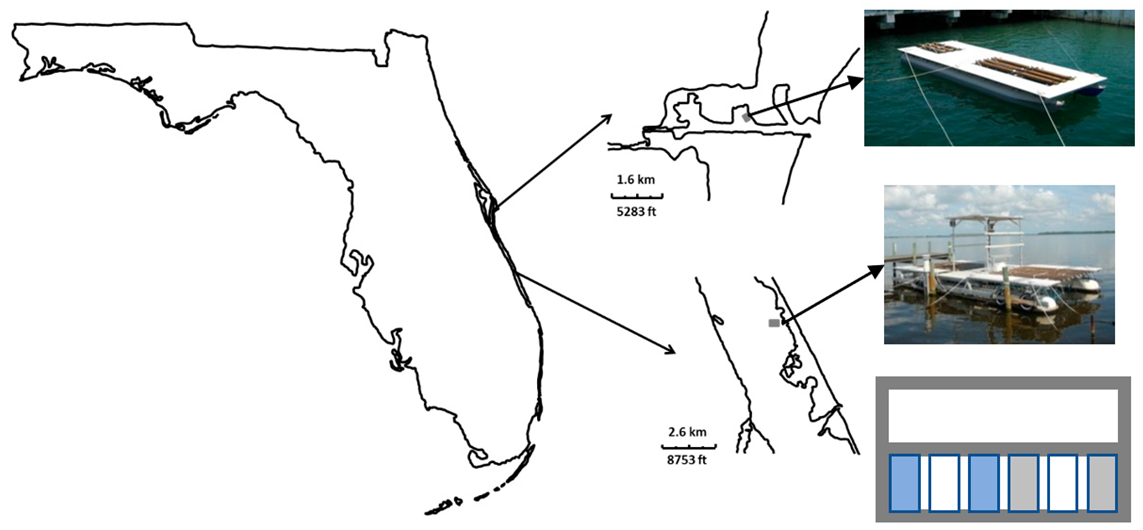
2.1. Study Sites

Two sites along the east coast of Florida, USA were used in this experiment (Figure 1): Port Canaveral at Poseidon Pier on Canaveral Air Force Base and Sebastian, 3 miles north of the Sebastian Inlet.

2.2. Panel Preparation

Three coatings were selected for this experiment: International Intersleek 700 (IS700), International Intersleek 900 (IS900), and Dow Corning 3140 (DC3140). The two Intersleek coatings are historic, commercially available silicone coatings that have extensive experimental records. IS700 contains an oil additive to improve release properties. IS900 is a fluorinated silicone coating that creates an amphiphilic surface with regions of differing surface energy. It was developed to improve release characteristics against fouling groups, such as diatoms, that attach strongly to silicone coatings. The final coating, DC3140 is a pure, silicone caulk with no additives, that was included as an unaltered silicone standard [49,50,51].
Polyvinylchloride (PVC) panels measuring 10.16 × 20.32 cm (4 × 8 in) were prepared. They were washed to remove residues and roughened with a 320 grit wet/dry sand paper to prepare them for coating. The panels were coated on both sides. The first coat was a barrier epoxy 0.2 mm (8 mils) wet film thickness (WFT). Forty-eight panels were coated with DC3140 at a WFT of 0.5 mm (18 mils), 48 with IS700 and the remaining with IS900. Both international coating systems were coated according to manufacturer’s specifications (tie coat WFT 0.15 mm (6 mils), top coat WFT 0.2 mm (8 mils)). Panels were divided into three different treatments: uncleaned or freely fouling (U); cleaned (C), which were scraped every two months to remove macrofouling; and groomed (G), which were lightly brushed with a rotating tool weekly. Panels were identified with colored zip-ties denoting starting location, transplant location, and treatment, then randomized and placed onto PVC pipe frames for immersion the field sites. Frames were set up so that one panel from each treatment was on each frame with one replicate facing north and the other facing south. Each site received two frames spaced on the immersion platform with four replicates of each treatment.

2.3. Field Testing

Panels were immersed starting in March 2011 at Sebastian and Port Canaveral. Frames were removed from the water weekly so that grooming could occur on the appropriate panels. Every month, panels were pulled from the water, photographed, and visually assessed according to ASTM 6990. In this method, the total percent cover and cover of specific taxa directly attached to the panel are visually estimated in the field. Data were reported as total percent cover of macrofouling, and cover of specific taxonomic groups (i.e., hydroids, barnacles, tube worms, etc.) is presented separately. Visual assessment occurred before cleaning or grooming was performed, to assess the fouling that had accumulated since the last treatment. Cleaning occurred on the appropriate panels every two months. After four months, panels were transplanted among sites. One set of panels from each treatment was transplanted, one set remained in the original location. Prior to transplanting, all panels were scraped with a plastic putty knife, wiped with a microfiber cloth and cleaned of all visible fouling, regardless of whether they were transplanted to the new location or remained in the original location. Identifying zip-ties were swapped with new ones to remove any possible remnants of fouling organisms. Once the panels had been cleaned, they were placed in a specialized holder which suspended them over ice in a cooler for transport. Transplanted panels were out of water for less than 24 h. After transplant, all panels were allowed to foul freely with visual assessment performed monthly. The experiment ran until September 2011.

2.4. Statistical Analysis

Data were entered into Primer-e for community analysis using SIMPER analysis of dissimilarity. To determine specific differences, ANOVAs were run. Before panels were transplanted, two-way repeated measures ANOVAs were run using location and treatment as factors. After transplant, three-way ANOVAs were run using origination, transplant and treatment as factors.

3. Results

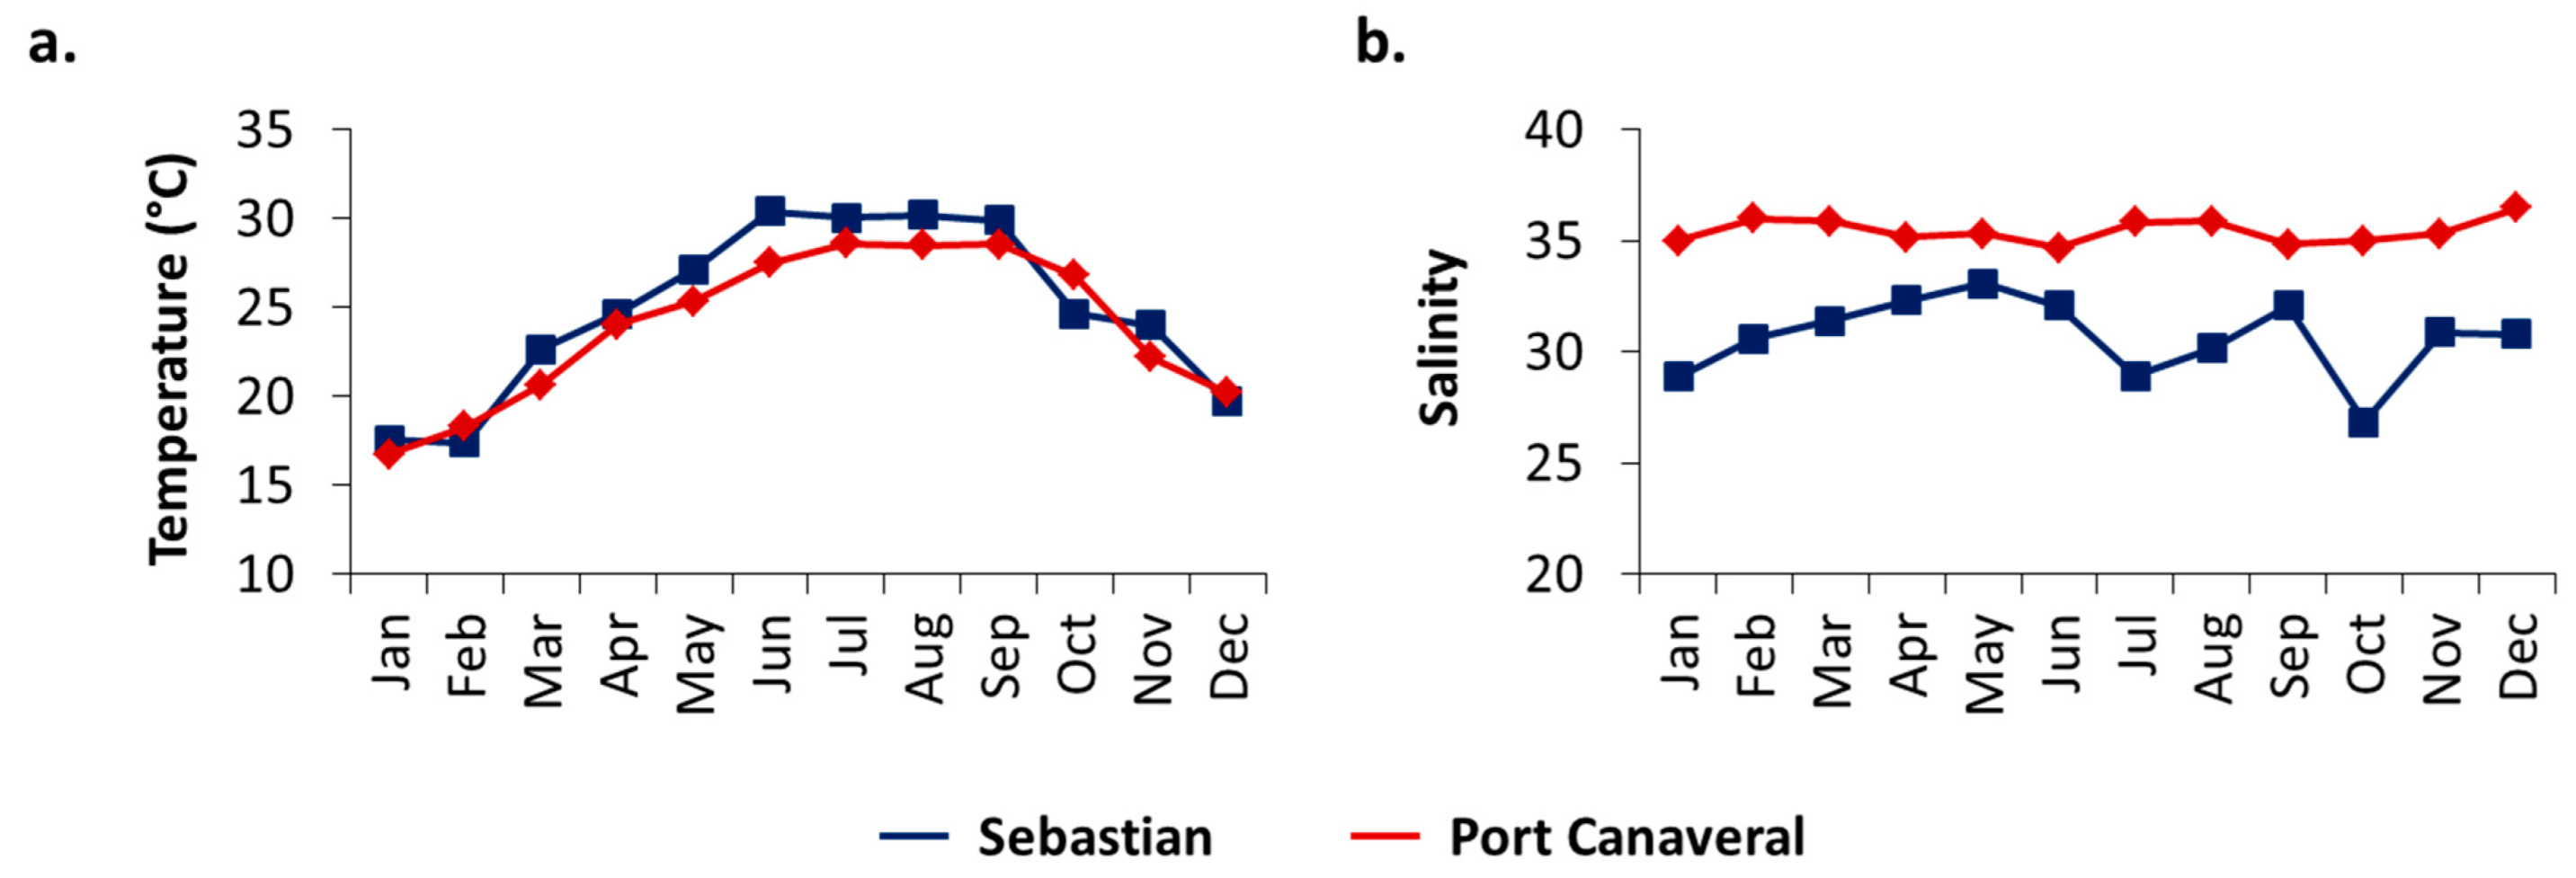
3.1. Salinity and Temperature

Sebastian and Port Canaveral present different environments to settling organisms. The temperature was similar between the two sites, while the salinity was very different (Figure 2). Both sites are seasonal and subtropical; Sebastian’s average temperature is 25.5 °C ± 6.2 whereas Port Canaveral’s is 25.4 °C ± 3.2. However, Sebastian is a more brackish and lagoonal site with an average salinity of 30.1 ± 3.7. Port Canaveral, on the other hand, is in the inlet and is much more oceanic with an average salinity of 35.5 ± 1.4. Salinity at Sebastian was more variable, over time, than Port Canaveral.

3.2. Community—Pre-Transplant

The fouling communities that developed before the panels were transplanted varied by site and treatment. In Sebastian, communities were dominated by arborescent bryozoans, barnacles, tube worms, and sponges. Those in Port Canaveral were dominated by encrusting and arborescent bryozoans, tube worms, and tunicates. Macrofouling on uncleaned and cleaned panels accumulated quickly in a site-specific manner, whereas groomed panels had low macrofouling cover. Despite similarities in overall pattern, the three coatings had differences in the magnitude of fouling and so were considered separately.
On IS700, the fouling community differed by treatment and site, although differences were not apparent until month 3 (Figure 3). On uncleaned panels, macrofouling increased in Sebastian until July, when it decreased. This pattern was repeated on the cleaned panels with similar organisms, although fouling never reached the cover it had on uncleaned panels. Groomed panels were primarily fouled with biofilms, although low levels of macrofouling were present and were dominated by arborescent bryozoans and hydroids. The fouling community in Port Canaveral on uncleaned panels also increased but dropped off in June only to rebound in July with an increase in the cover of encrusting bryozoans. Cleaned panels showed a clear drop in fouling in the first month after cleaning; however, fouling quickly rebounded in July and cover was only slightly less than that on the uncleaned panels. Groomed panels were even more dominated by biofilms on IS700 in Port Canaveral, although a low cover of arborescent bryozoans and hydroids was present. Uncleaned panels had the most unique fouling communities in June, primarily due to biofilms, arborescent bryozoans (cleaned panels only), tube worms (groomed panels only) and tunicates. In July, uncleaned and cleaned treatments were similar, whereas groomed surfaces were more than 50% dissimilar. These differences were primarily due to biofilms, hydroids, encrusting bryozoans, and sponges (cleaned panels only).
On IS900, fouling was lower and the similarity between sites higher than on IS700. Differences were primarily due to a higher cover of tunicates and encrusting bryozoans on uncleaned and cleaned panels in Port Canaveral and a higher cover of tube worms on uncleaned panels in Sebastian (Figure 4). Fouling did not differ greatly between treatments until July, when dissimilarity increased to greater than 40%. On uncleaned and cleaned panels in Sebastian, fouling cover increased until June when it leveled out. In Port Canaveral, uncleaned and cleaned panels were more variable, with cover increasing in May, leveling out for June and increasing again in July. Groomed panels had very little cover of macrofouling and were dominated by biofilms. In July, the three treatments differed primarily because of biofilms, encrusting bryozoans, tube worms (only uncleaned and cleaned), and sponges.
Fouling on DC3140 was more variable, both between sites and among treatments and heavier than on the commercial silicones (Figure 5). Differences in fouling between sites were primarily due to arborescent bryozoans, hydroids, and tunicates. Treatments began to show dissimilarities as early as May. Fouling on uncleaned and cleaned panels in Sebastian increased until June, when macrofouling cover dropped. In Port Canaveral on uncleaned panels, macrofouling increased rapidly to almost 100% cover then decreased slightly in July. Cleaned panels showed a large increase in fouling cover in May, followed by a rapid decrease in cover in June and a smaller increase in July. Cover on groomed panels was lower and consisted primarily of biofilms; however, macrofouling cover was higher on panels in Sebastian and was primarily due to hydroids and arborescent bryozoans. In June, there were large dissimilarities between uncleaned and groomed surfaces (78.68) and uncleaned and cleaned panels (58.43) with smaller differences between cleaned and groomed surfaces (45.17). These differences were due to biofilms, arborescent bryozoans, and tunicates. Differences may have been due to the amount of time the surfaces were exposed without any treatment; the uncleaned panels had been exposed 3 months whereas the cleaned panels had been treated only 1 month earlier and the groomed panels had only 1 week of fouling accumulated. In July, there was an overall decrease in dissimilarity among treatments, although surfaces remained distinguishable. The differences were primarily due to biofilms, hydroids, encrusting bryozoans, sponges, and tunicates.

3.3. Treatment Effects—Pre-Transplant

In general, grooming was successful at keeping panels clean. When only macrofouling was considered, groomed surfaces always had significantly lower fouling than uncleaned or cleaned surfaces on IS700, IS900, and DC3140 (Figure 6, Figure 7 and Figure 8, respectively). This was true in May, June, and July. Additionally, many specific organisms showed the same pattern (i.e., biofilms, encrusting bryozoans, arborescent bryozoans, barnacles, tube worms, sponges, and tunicates; data not shown). However, hydroids did not follow this trend (Figure 9). Depending on the time and the coating, either cleaned or groomed surfaces had significantly higher cover than uncleaned, which is the opposite of the normal pattern.

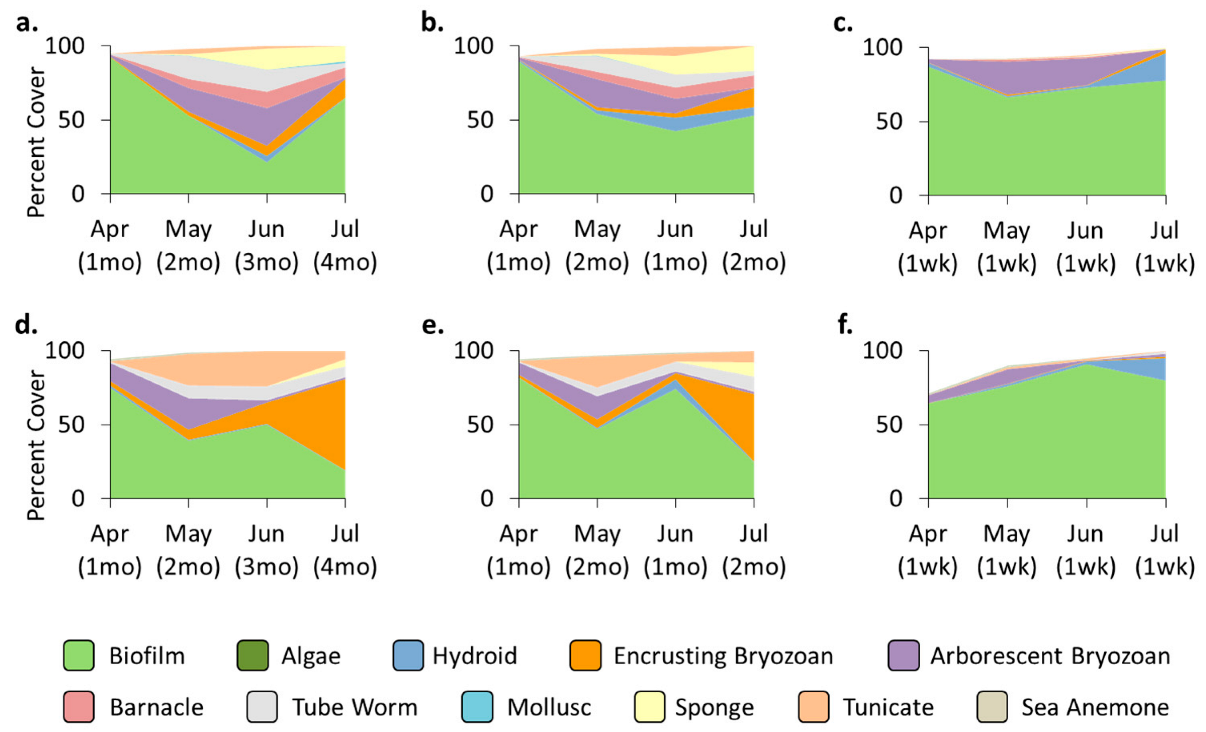
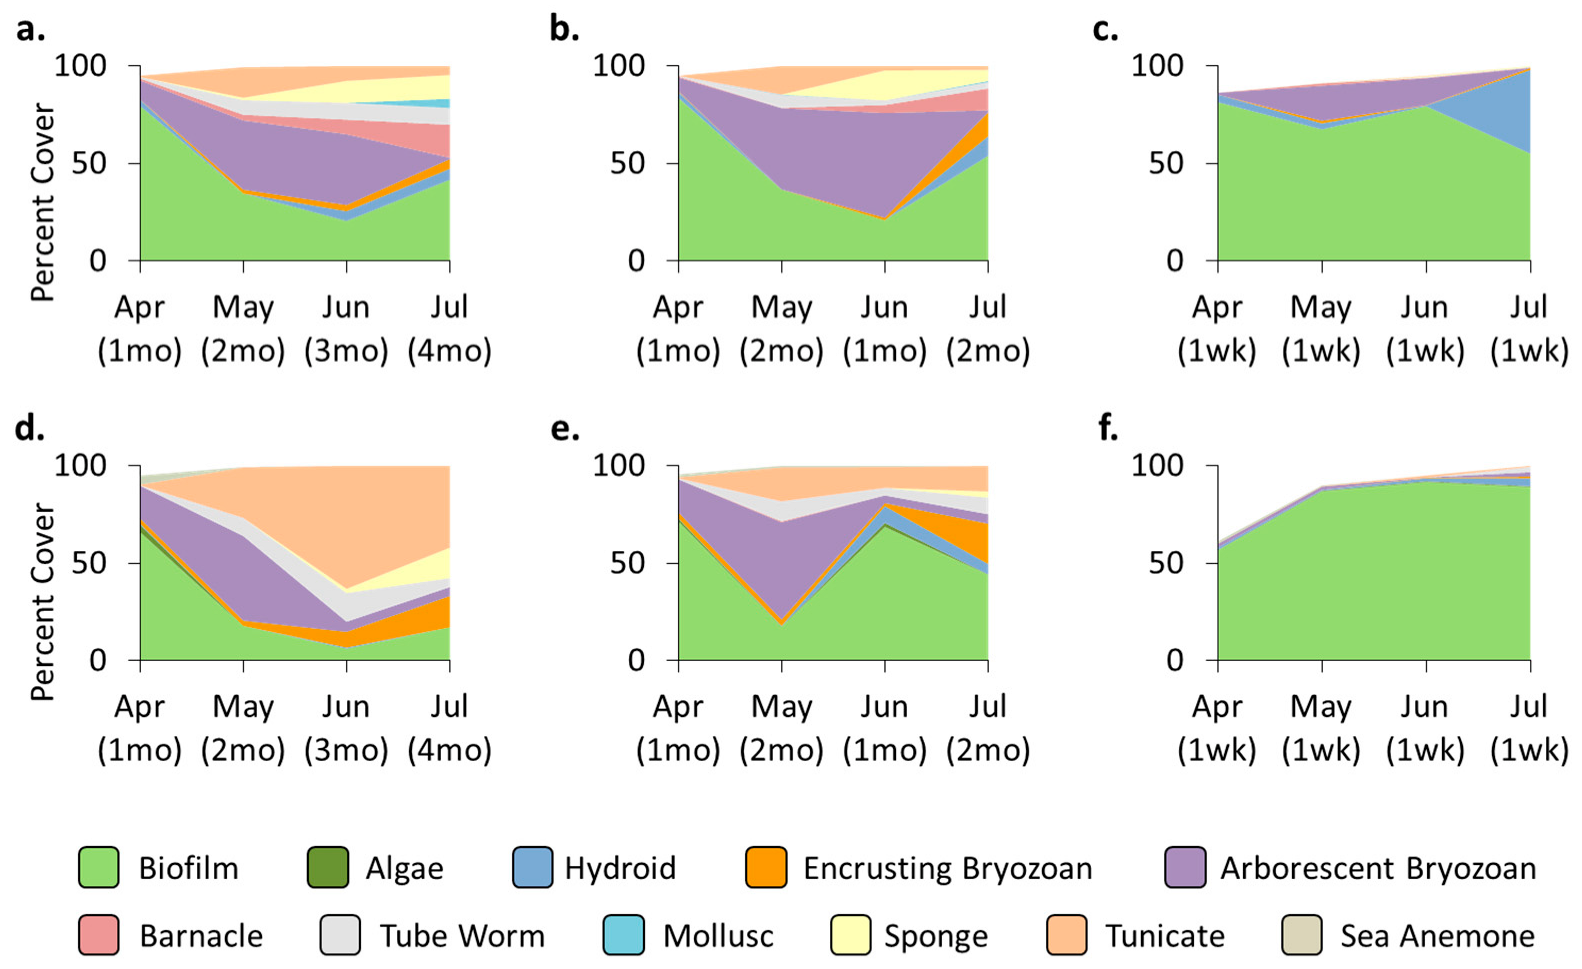
3.4. Location Effects—Post-Transplant

Original location affected re-colonization after transplant for several organisms (Figure 10). Encrusting bryozoans had significantly higher cover on IS700 in August on panels that had come from Port Canaveral than on those that remained in Sebastian. Barnacles always had higher cover on panels from Sebastian once panels were transplanted to Port Canaveral on all three coatings. On cleaned IS700 in September, the cover of sponges was significantly higher on panels from Port Canaveral. The cover of tunicates was significantly lower on panels from Sebastian in August on IS900 once panels were transplanted to Port Canaveral.

3.5. Treatment Effects—Post-Transplant

Prior treatment affected re-colonization after transplant for many organisms, with a preference for uncleaned, cleaned and groomed panels. A significant preference for uncleaned and cleaned surfaces was found for macrofouling in general on DC3140 in September at Port Canaveral. Additionally, in September on DC3140, uncleaned surfaces in Sebastian had significantly higher cover of encrusting bryozoans than the cleaned and groomed ones (Figure 11). Barnacles and sponges showed a preference for cleaned surfaces (Figure 12). The cover of barnacles in August on IS900 in Sebastian and Port Canaveral was significantly higher on cleaned panels than on uncleaned and groomed ones. In September, the cover of sponges was significantly higher on cleaned than on uncleaned and groomed panels on IS700 in Port Canaveral when looking at panels that originated in Port Canaveral and on IS900 in Sebastian. A preference for groomed surfaces was also found (Figure 13). In August on IS700 in Sebastian, the cover of macrofouling was significantly higher on groomed than on uncleaned panels. This was primarily due to a significantly higher cover of hydroids on groomed panels than on uncleaned and cleaned ones. This significant preference for groomed surfaces over uncleaned and panels by hydroids was also found on DC3140 in September in Sebastian. Unlike the pattern found in August on IS900, barnacles had significantly higher cover on groomed than on uncleaned and cleaned panels in September on IS700 in Sebastian.

4. Discussion

This research has shown that hull husbandry practices affect fouling community composition. Grooming maintains surfaces at a low level of macrofouling, with biofilms occupying most of the exposed surface. Uncleaned and cleaned surfaces collected more types and higher cover of macrofouling. This is in line with a previous study which found that ungroomed silicone began to accumulate macrofouling after 78 days whereas frequent grooming was able to maintain silicone panels with low levels of biofilm for 120 days, when the experiment was ended [44]. Although the research presented here was short-term, previous research has shown the long-term efficacy of grooming in maintaining surfaces free of macrofouling, albeit using a different grooming tool [17,44,45,52].
Unlike grooming, cleaning did not affect fouling community structure or percentage of cover greatly when compared with the uncleaned freely fouling treatment. On the two commercial coatings, dissimilarity between cleaned and uncleaned surfaces was low and only increased when panels had been cleaned one month prior to sampling. On DC3140, the cleaned and uncleaned surfaces were more than 50% dissimilar in June, one month after panels had been cleaned, and only 40% dissimilar in July, when the uncleaned panels had 4 months of accumulated fouling and the cleaned ones had 2 months’ accumulation. Except for June IS700, when cleaned and groomed surfaces were relatively similar, groomed panels were always less similar to uncleaned and cleaned panels than they were to each other. More specifically, uncleaned panels were significantly more fouled than groomed panels 57 times. Cleaned panels were significantly more fouled than groomed panels 38 times. Uncleaned panels were only significantly more fouled than cleaned panels five times, generally the first inspection after a cleaning. This is in contrast to other studies, which have found that cleaned surfaces attract up to six times more recruitment than surfaces with intact fouling assemblages and those that had been cleaned and sterilized [4,10].
The consistent exception to the pattern of lower fouling on groomed panels is hydroids, which had significantly higher cover on groomed surfaces than on uncleaned or cleaned ones. Previous research has shown that the removal of calcareous fouling can lead to a rapid growth of hydroids [27]. Surfaces that are not cleaned or groomed are heavily fouled and likely gain protection by the usurpation of space, predation on larvae, and larval avoidance [10]. Conversely, cleaning and even more so, grooming open primary space for colonization and species that can colonize rapidly and tolerate disturbance will be favored [28,53]. Plentiful primary space favors the dominance of poor space competitors by changing the system from one that is space-limited and competition-driven to a propagule supply-limited settlement-driven one; it also improves survival and subsequent growth [53]. The results seen here suggest that hydroids prefer disturbed areas because they are quick to invade and occupy open space but not able to compete when space is limiting.
This research has reaffirmed that the prior location affects fouling community composition after a transplant. For organisms that responded to the prior location, two patterns of cover were seen. Encrusting bryozoans, barnacles, and tunicates all had significantly higher cover on panels which came from a location that had originally had high cover of these organisms. Conversely, sponges had higher cover on panels that were not transplanted. These patterns follow those seen in a previous transplant experiment for barnacles, tunicates, and sponges [48]. The research presented here is also in agreement with research performed in Australia on biocide-containing coatings, which found that encrusting bryozoans, barnacles, and sponges responded to cues or the remains of fouling communities from the marina where they were dominant before the transplant [10].
Finally, this research has shown that the effect of husbandry on fouling community structure continues after transplant and the cessation of any treatment. On 3140 in Port Canaveral two months post-transplant, uncleaned and cleaned panels had higher cover of macrofouling than the groomed ones, which follows pre-transplant patterns. However, on IS700 in Sebastian one month post-transplant, macrofouling cover was significantly higher on groomed panels than on uncleaned ones, primarily due to the high cover of hydroids on these panels. In fact, hydroids continued to have significantly higher cover on panels that had been groomed than on uncleaned or cleaned panels, which follows the pre-transplant patterns. After transplant on DC3140, encrusting bryozoans had higher cover on the uncleaned than the cleaned or groomed panels, despite this coating having a uniformly low cover of encrusting bryozoans before transplant. For sponges, cover was higher on cleaned panels, but this result was only significant for groomed panels in Sebastian. The effect of husbandry on barnacles was variable post-transplant. In Sebastian and Port Canaveral, cover of barnacles was higher on cleaned panels than on uncleaned ones and groomed ones in August on IS900. On IS700, however, groomed panels had higher cover of barnacles than the uncleaned and cleaned ones.
Previous research has shown that recruitment is highest on panels that have been cleaned. Organisms that responded favorably to cleaning included bivalves, tunicates, encrusting bryozoans, hydroids, tube worms, and sponges [10]. The research presented here shows that for barnacles, sponges, and hydroids, cleaning and grooming enhance recruitment post-transplant. In this study, encrusting bryozoan cover was significantly higher on panels that had been uncleaned prior to transplant; however, previous studies found that encrusting bryozoans were one of the organisms most enhanced by cleaning [10]. Additionally, tube worms and tunicates were highly enhanced by cleaning in the previous study [10]; whereas in this study, husbandry did not affect recruitment of these organisms after transplant.
Non-indigenous and particularly invasive species are one of the greatest threats to marine biodiversity; they are a contributor to environmental change through their role as ecosystem engineers, they are a threat to environmental and human health, and the rate of introductions is increasing [1]. Due to the cost of mitigation and near impossibility of eradication once an introduction has occurred, prevention is the best way to mitigate the negative effects from NISs [1,9,10]. Unfortunately, it is impossible to completely prevent the introduction of alien species, so methods to reduce the risk and manage invasions are needed [1]. Cleaning may not be an effective method of vector control. Cleaned surfaces rapidly recolonize [4,10] and are quickly indistinguishable from uncleaned surfaces. Additionally, fragments of tunicates, sponges, bryozoans, and whole organisms dislodged during in-water cleaning have been found to be viable [39]. Sterilization was the only effective measure for reducing the rate of recruitment to AF paints [10]. Grooming is effective at lowering the recruitment of most fouling organisms. However, colonization if grooming ceases is rapid, since surfaces are not sterilized and cues are not removed. Therefore, grooming is a good vector-management solution and will potentially mitigate the risk of transporting and introducing alien species as long as the cycle continues uninterrupted.

5. Conclusions

This research has shown that:
-
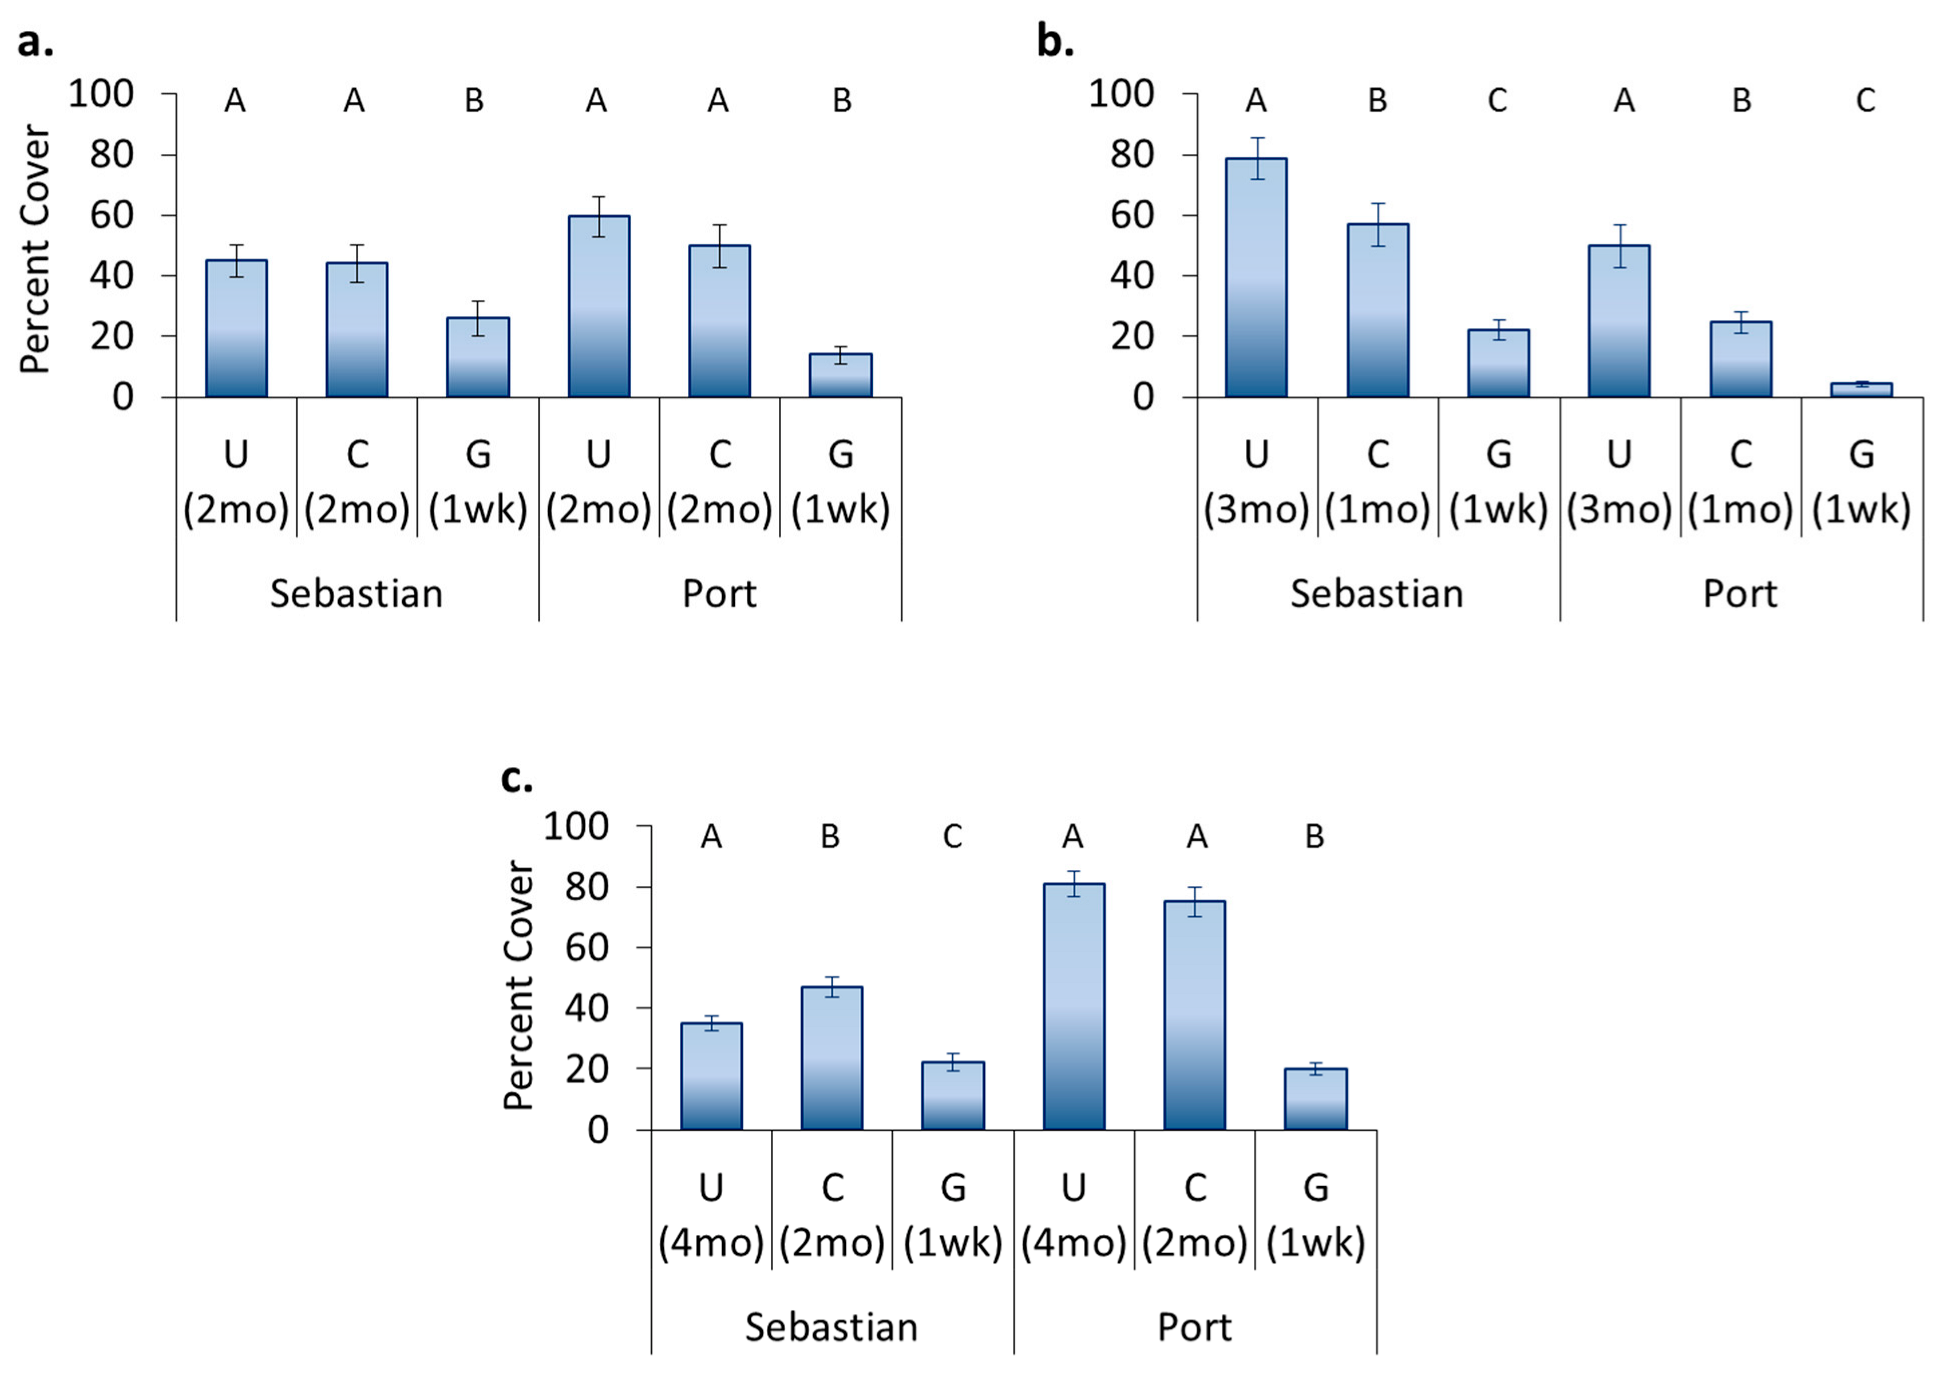
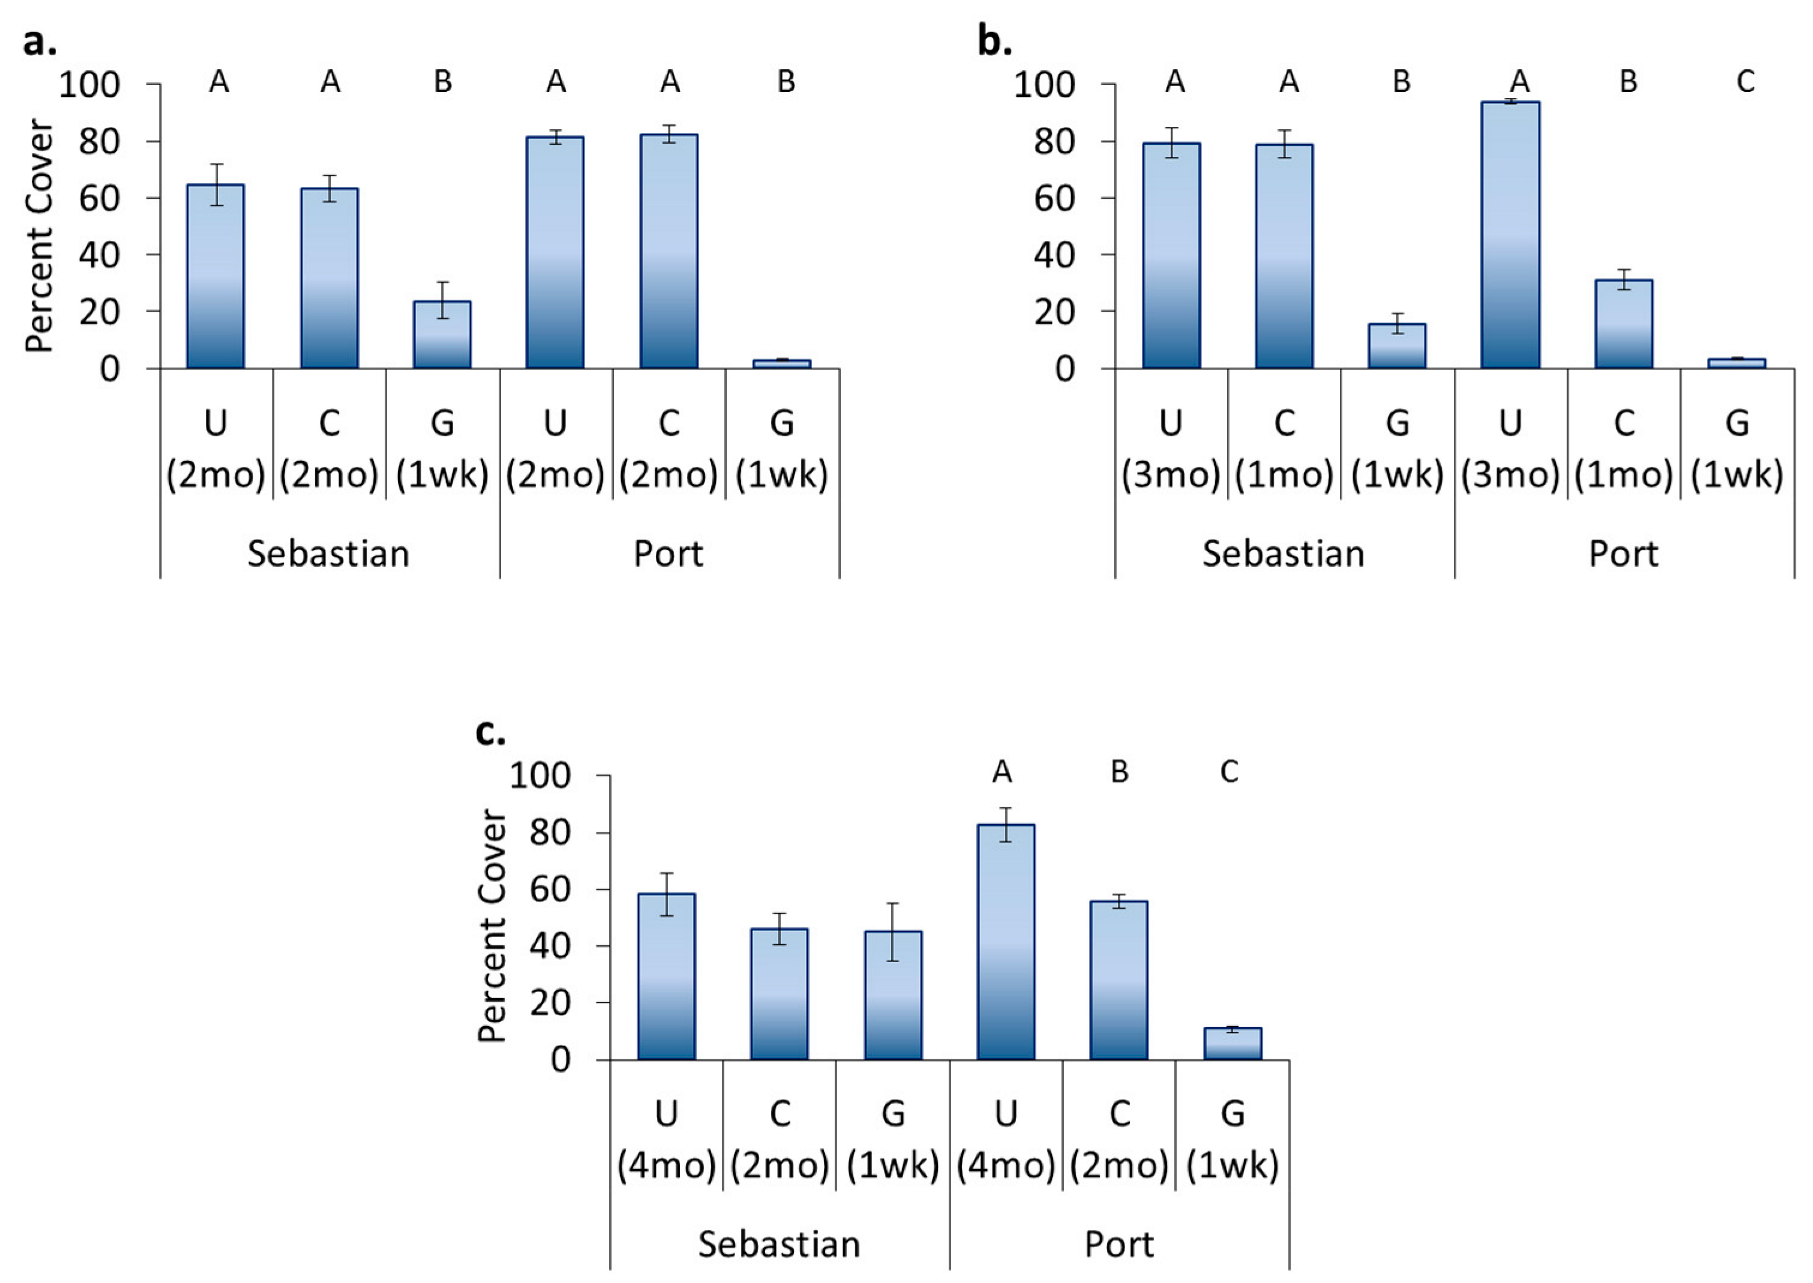
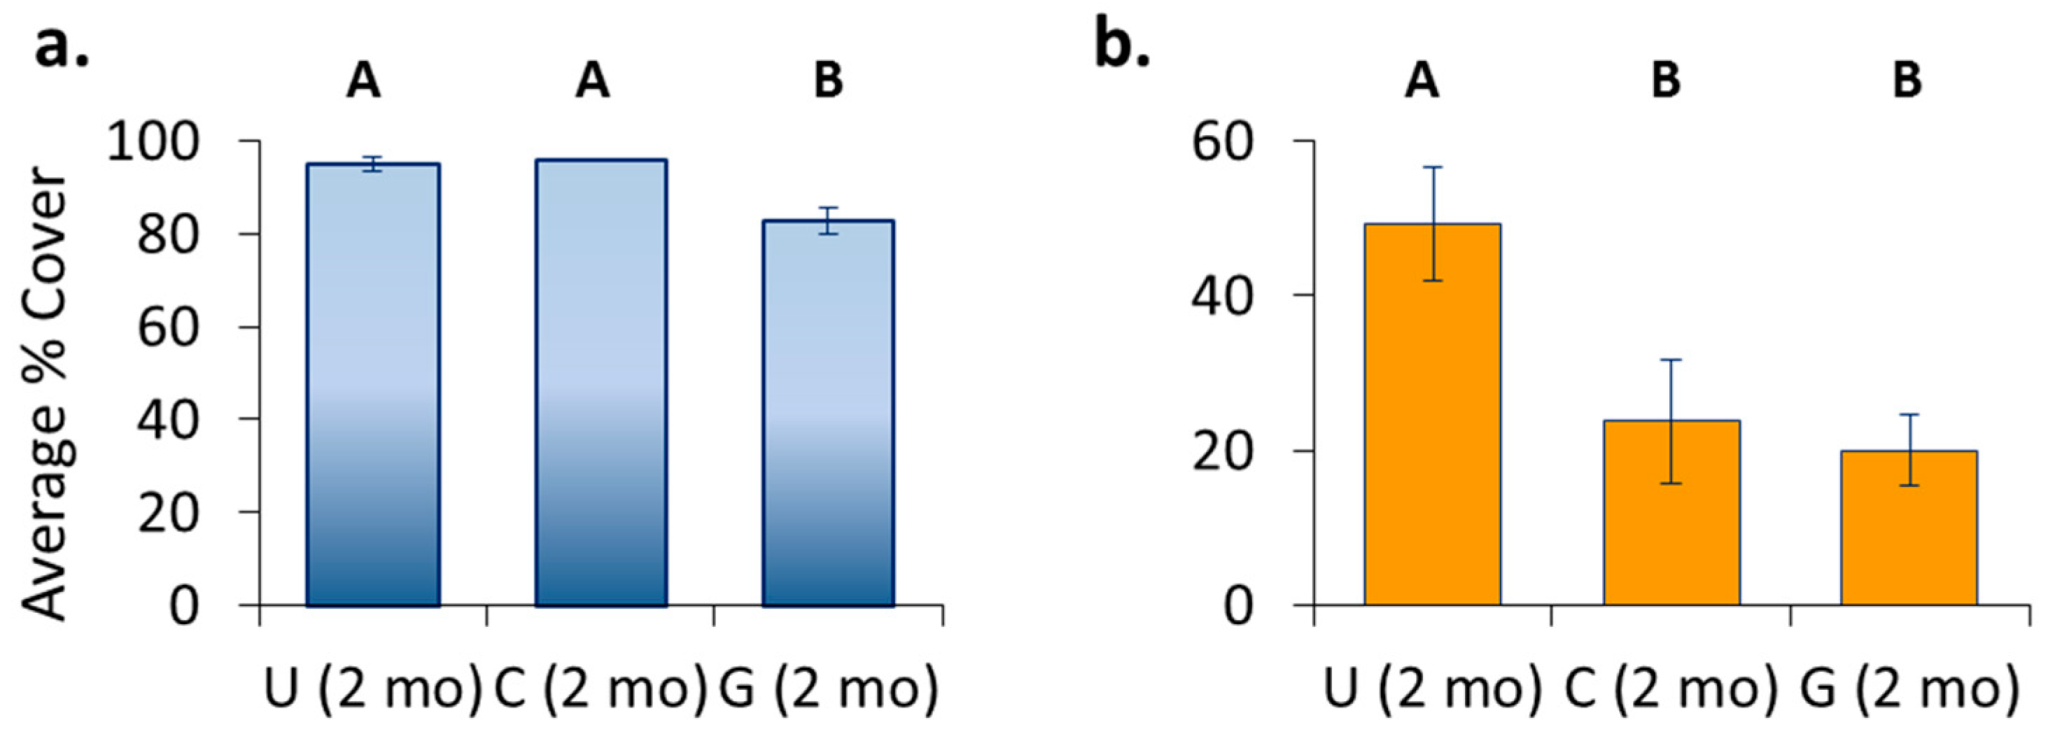
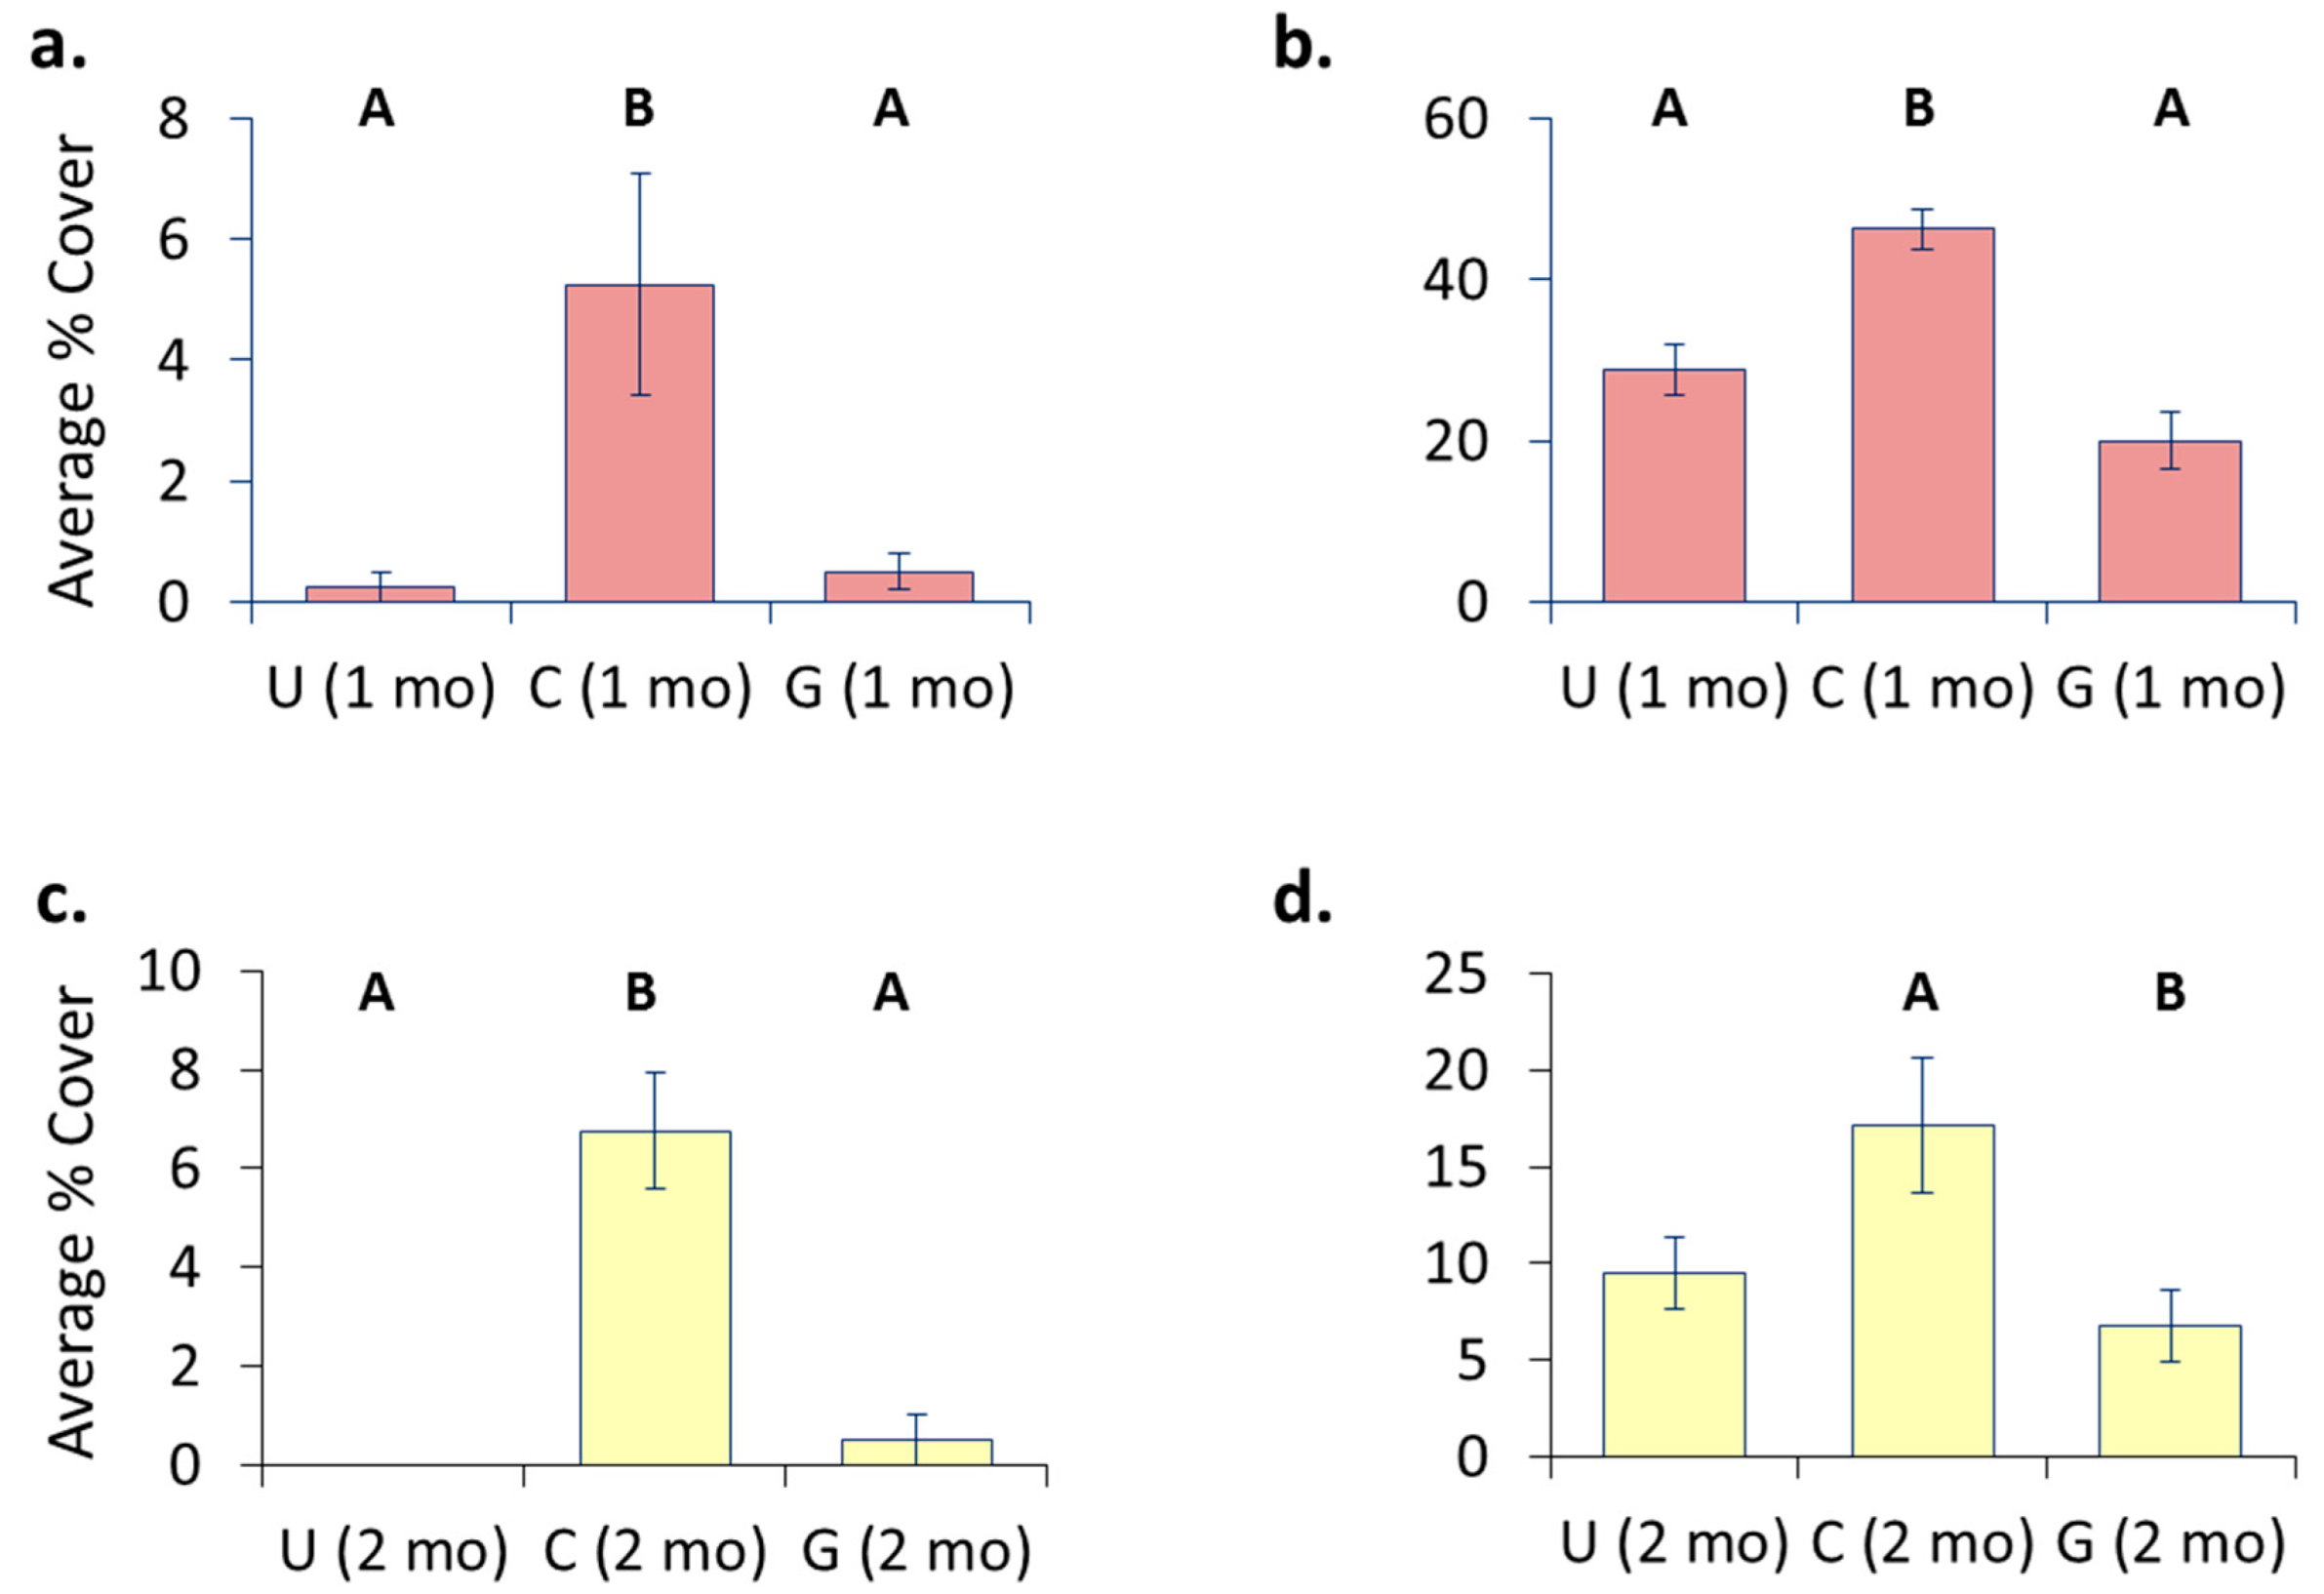
Hull husbandry affects fouling accumulation with groomed surfaces generally having the lowest cover.
-
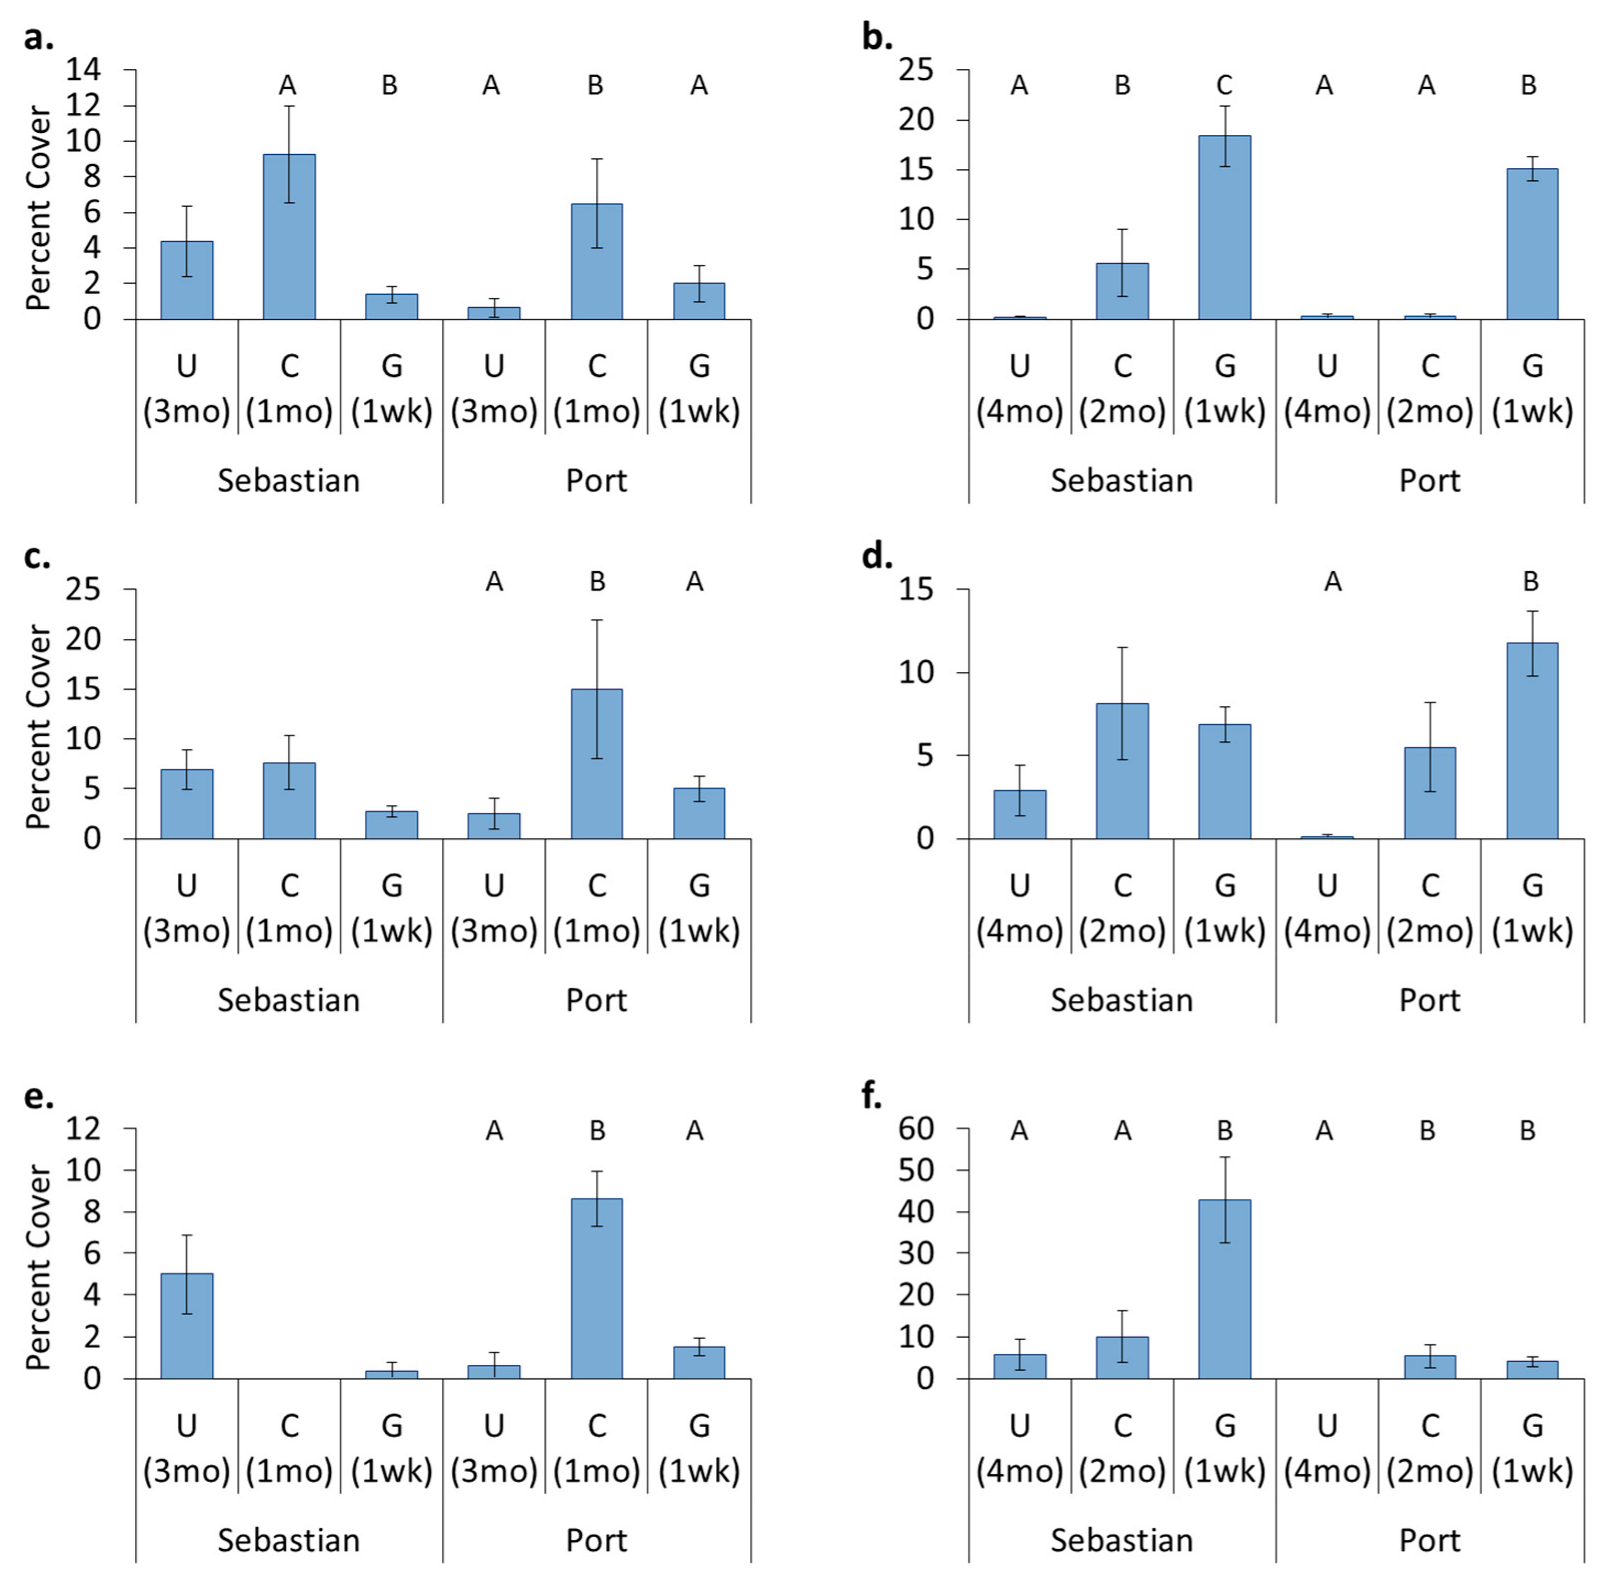
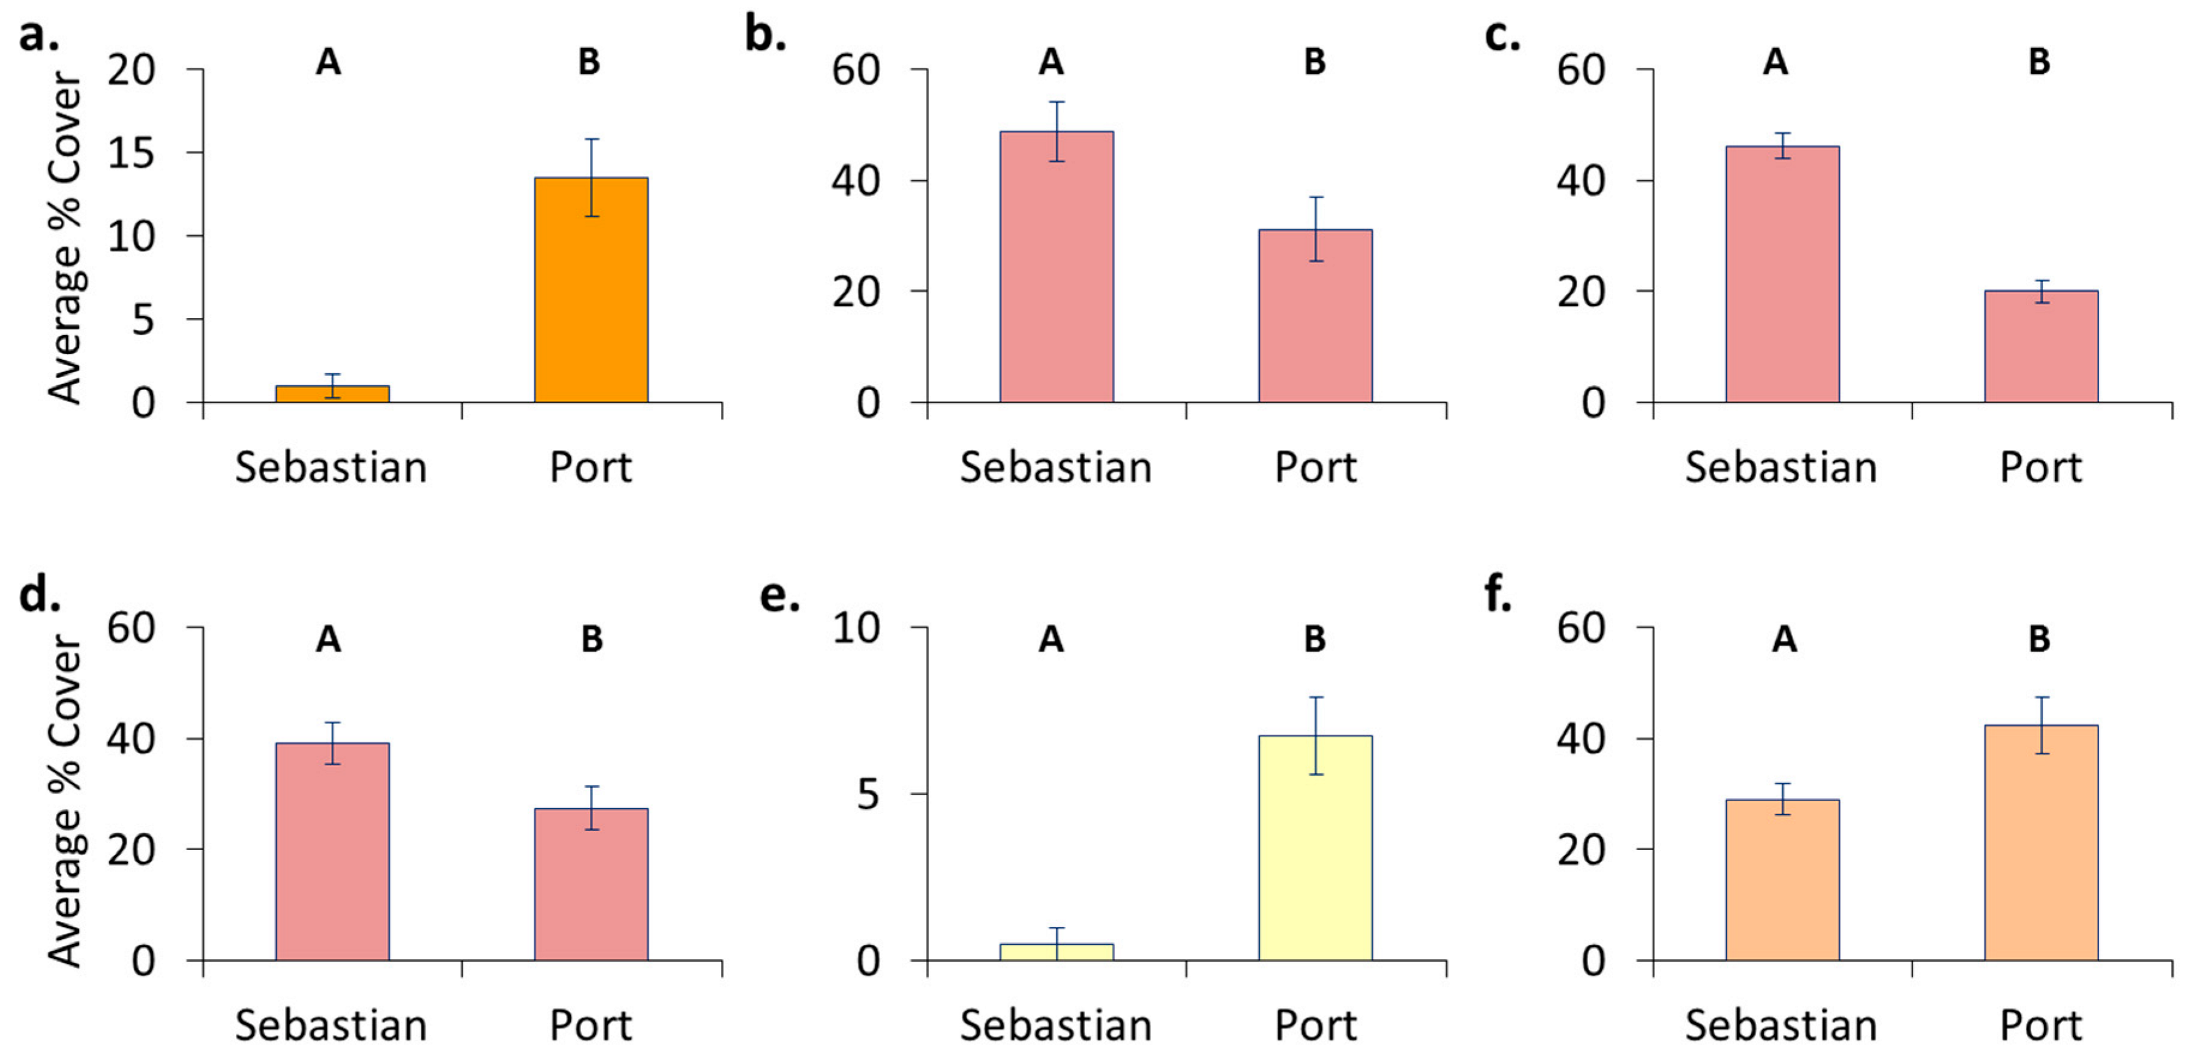
Original location affects recolonization after transplant. Encrusting bryozoans, barnacles, and tunicates all had significantly higher cover on panels which came from a location where these organisms originally dominated, whereas sponges had higher cover on panels that stayed in place.
-
Hull husbandry affects recolonization after transplant and the discontinuance of treatment. Encrusting bryozoans preferred surfaces that had been freely fouling, barnacles and sponges preferred surfaces that had been cleaned, and hydroids showed a continuing preference for surfaces that had been groomed.
-
Grooming maintains surfaces free of macrofouling for long periods of time [17,48]. Once grooming stops, hydroids and potentially other taxa colonize these surfaces preferentially. The best way to lower the risk of transporting and introducing NISs is to continue grooming. This maintains hulls in a clean condition, which is on target to become an international biosecurity requirement [7,16].

Author Contributions

This research was performed as part of E.R.’s dissertation under the supervision of G.S. Conceptualization, data curation, formal analysis, methodology, resources, validation and writing (draft and final) were performed by E.R. Supervision, project administration, validation and writing—review and editing were performed by G.S. All authors have read and agreed to the published version of the manuscript.

Funding

This research was funded by Office of Naval Research (ONR), grant numbers N00014-10-1-0919 and N00014-11-1-0915.

Institutional Review Board Statement

Not applicable.

Informed Consent Statement

Not applicable.

Data Availability Statement

The data presented in this study are available in this article.

Acknowledgments

The authors would like to thank the support from ONR program chairs, Stephen McElvany and Paul Armistead. We would additionally like to acknowledge field support from Abraham Stephens, and all our Center for Corrosion and Biofouling Control (CCBC) colleagues.

Conflicts of Interest

The authors declare no conflict of interest.

References

  1. Bax, N.; Williamson, A.; Aguero, M.; Gonzalez, E.; Geeves, W. Marine invasion alien species: A threat to global biodiversity. Mar. Policy 2013, 27, 313–323. [Google Scholar] [CrossRef]
  2. Dafforn, K.; Glasby, T.; Johnston, E. Differential effects of tributyltin and copper antifoulants on recruitment of non-indigenous species. Biofouling 2008, 24, 23–33. [Google Scholar] [CrossRef] [PubMed]
  3. Fernandez, L. NAFTA and member country strategies for maritime trade and invasive species. J. Environ. Manag. 2008, 89, 308–321. [Google Scholar] [CrossRef] [PubMed]
  4. Hopkins, G.; Forrest, B. Management options for vessel hull fouling: An overview of risks posed by in-water cleaning. ICES J. Mar. Sci. 2008, 65, 811–815. [Google Scholar] [CrossRef] [Green Version]
  5. Piola, R.; Johnston, E. The potential for translocation of marine species via small-scale disruption to antifouling surfaces. Biofouling 2008, 24, 145–155. [Google Scholar] [CrossRef]
  6. Hopkins, G.; Forrest, B. A preliminary assessment of biofouling and non-indigenous species associated with commercial slow-moving vessels arriving in New Zealand. Biofouling 2010, 26, 613–621. [Google Scholar] [CrossRef]
  7. IMO. Guidelines for the Control and Management of Ships’ Biofouling to Minimize the Transfer of Invasive Aquatic Species. MEPC 62/24/Add.1. 2011. Available online: https://wwwcdn.imo.org/localresources/en/KnowledgeCentre/IndexofIMOResolutions/MEPCDocuments/MEPC.207(62).pdf (accessed on 3 March 2012).
  8. Sylvester, F.; Kalaci, O.; Leung, B.; Lacoursiere-Roussel, A.; Murray, C.; Choi, F.; Bravo, M.; Therriault, T.; MacIsaac, H. Hull fouling as an invasion vector: Can simple models explain a complex problem? J. Appl. Ecol. 2011, 48, 415–423. [Google Scholar] [CrossRef]
  9. Mack, R.; Simberloff, D.; Lonsdale, W.; Evans, H.; Clout, M.; Bazzaz, F. Biotic invasions: Causes, epidemiology, global consequences, and control. Ecol. Appl. 2000, 10, 689–710. [Google Scholar] [CrossRef]
  10. Floerl, O.; Inglis, G.; Hayden, B. A risk-based predictive tool to prevent accidental introductions of nonindigenous marine species. Envi. Manag. 2005, 35, 765–778. [Google Scholar] [CrossRef]
  11. Hewitt, C.; Campbell, M. Mechanisms for the prevention of marine bioinvasions for better biosecurity. Mar. Pollut. Bull. 2007, 55, 395–401. [Google Scholar] [CrossRef]
  12. Hayes, K.; Sliwa, C. Identifying potential marine pests—A deductive approach applied to Australia. Mar. Pollut. Bull. 2003, 46, 91–98. [Google Scholar] [CrossRef]
  13. Campbell, M.; Hewitt, C. Assessing the port to port risk of vessel movements vectoring non-indigenous marine species within and across domestic Australian borders. Biofouling 2011, 27, 631–644. [Google Scholar] [CrossRef]
  14. McClay, T.; Zabin, C.; Davidson, I.; Young, R.; Elam, D. Vessel Biofouling Prevention and Management Options Report; Coast Guard New London ct Research and Development Center: New London, CT, USA, 2015. [Google Scholar]
  15. Scianni, C.; Georgiades, E. Vessel in-water cleaning or treatment: Identification of environmental risks and science needs for evidence-based decision making. Front. Mar. Sci. 2019, 26, 467. [Google Scholar] [CrossRef] [Green Version]
  16. Georgiades, E.; Kluza, D.; Bates, T.; Lubarsky, K.; Brunton, J.; Growcott, A.; Smith, T.; McDonald, S.; Gould, B.; Parker, N.; et al. Regulating vessel biofouling to support New Zealand’s marine biosecurity system—A blue print for evidence-based decision making. Front. Mar. Sci. 2020, 19, 390. [Google Scholar] [CrossRef]
  17. Ralston, E.; Gardner, H.; Hunsucker, K.; Swain, G. The effect of grooming on five commercial antifouling coatings. Front. Mar. Sci. 2022, 9, 836555. [Google Scholar] [CrossRef]
  18. Dafforn, K.; Lewis, J.; Johnston, E. Antifouling strategies: History and regulation, ecological impacts and mitigation. Mar. Pollut. Bull. 2011, 62, 453–465. [Google Scholar] [CrossRef]
  19. Schultz, M.; Bendick, J.; Holm, E.; Hertel, W. Economic impact of biofouling on a naval surface ship. Biofouling 2011, 27, 87–98. [Google Scholar] [CrossRef]
  20. Davidson, I.; Scianni, C.; Hewitt, C.; Everett, R.; Holm, E.; Tamburri, M. Assessing the drivers of ship biofouling management—Aligning industry and biosecurity goals. Biofouling 2016, 32, 411–428. [Google Scholar] [CrossRef]
  21. Hunsucker, K.; Vora, G.; Hunsucker, J.; Gardner, H.; Leary, D.; Kim, S.; Lin, B. Biofilm community structure and the associated drag penalties of a groomed fouling release ship hull coating. Biofouling 2018, 34, 162–172. [Google Scholar] [CrossRef]
  22. Hunsucker, K.; Ralston, E.; Gardner, H.; Swain, G. Specialized grooming as a mechanical method to prevent marine invasive species recruitment and transport on ship hulls. In Impacts of Invasive Species on Coastal Environments: Coasts in Crisis; Makowski, C., Finkl, C., Eds.; Springer: Cham, Switzerland, 2019; pp. 247–265. [Google Scholar]
  23. Marsland, A.; Moss, B. The effects of underwater scrubbing on ship-fouling algae. BSRA Rep. 1975, 42. [Google Scholar]
  24. Davidson, I.; McCann, L.; Sytsma, M.; Ruiz, G. Interrupting a multi-species bioinvasion vector: The efficacy of in-water cleaning for removing biofouling on obsolete vessels. Mar. Pollut. Bull. 2008, 56, 1538–1544. [Google Scholar] [CrossRef] [PubMed]
  25. Nickels, J.; Bobbie, R.; Lott, D.; Martz, R.; Benson, P.; White, D. Effect of manual brush cleaning on biomass and community structure of microfouling film formed on aluminum and titanium surfaces exposed to rapidly flowing seawater. Appl. Environ. Microbiol. 1981, 41, 1442–1453. [Google Scholar] [CrossRef] [Green Version]
  26. Floerl, O.; Inglis, G.; Marsh, H. Selectivity in vector management: An investigation of the effectiveness of measures used to prevent transport of non-indigenous species. Biol. Invasions 2005, 7, 459–475. [Google Scholar] [CrossRef]
  27. Cologer, C. Six year interaction of underwater cleaning with copper based antifouling paints on Navy ships. Nav. Eng. J. 1984, 96, 200–208. [Google Scholar] [CrossRef]
  28. Bando, K. The roles of competition and disturbance in a marine invasion. Biol. Invasions 2006, 8, 755–763. [Google Scholar] [CrossRef]
  29. Hearin, J.; Hunsucker, K.; Swain, G.; Gardner, H.; Stephens, A.; Lieberman, K. Analysis of mechanical grooming at various frequencies on a large scale test panel coated with a fouling release coating. Biofouling 2016, 32, 561–569. [Google Scholar] [CrossRef]
  30. Pech, D.; Ardisson, P.; Bourget, E. Settlement of a tropical marine epibenthic assemblage on artificial panels: Influence of substratum heterogeneity and complexity scales. Estuar. Coast. Shelf Sci. 2002, 55, 743–750. [Google Scholar] [CrossRef]
  31. Chabot, R.; Bourget, E. Influence of substratum heterogeneity and settled barnacle density on the settlement of cyprid larvae. Mar. Biol. 1988, 97, 45–56. [Google Scholar] [CrossRef]
  32. Crisp, D. Overview of research on marine invertebrate larvae, 1940–1980. In Marine Biodeterioration: And Interdisciplinary Study; Costlow, J., Tipper, R., Eds.; Naval Institute Press: Annapolis, MD, USA, 1984. [Google Scholar]
  33. Callow, M.; Jennings, A.; Brennan, A.; Seegert, C.; Gibson, A.; Wilson, L.; Feinberg, A.; Baney, R.; Callow, J. Microtopographic cues for settlement of zoospores of the green fouling alga Enteromorpha. Biofouling 2002, 18, 237–245. [Google Scholar] [CrossRef]
  34. Birkeland, C.; Randall, R. Facilitation of coral recruitment by echinoid excavations. Proc. 4th Int. Coral Reef Symp 1981, 1, 695–698. [Google Scholar]
  35. Highsmith, R. Burrowing by the bivalve mollusk Lithophaga curta in the living reef coral Montipora berryi and a hypothesis of reciprocal larval recruitment. Mar. Biol. 1980, 56, 155–162. [Google Scholar] [CrossRef]
  36. Maldonado, M.; Uriz, M. Microrefuge exploitation by subtidal encrusting sponges: Patterns of settlement and post-settlement survival. Mar. Ecol. Prog. Ser. 1998, 174, 141–150. [Google Scholar] [CrossRef] [Green Version]
  37. Walters, L.; Wethey, D. Settlement and early post-settlement survival of sessile marine invertebrates on topographically complex surfaces: The importance of refuge dimensions and adult morphology. Mar. Ecol. Prog. Ser. 1996, 137, 161–171. [Google Scholar] [CrossRef] [Green Version]
  38. Hopkins, G.; Forrest, B.; Piola, R.; Gardner, J. Factors affecting survivorship of defouled communities and the effect of fragmentation on establishment success. J. Exp. Mar. Biol. Ecol. 2011, 396, 233–243. [Google Scholar] [CrossRef]
  39. Woods, C.; Floerl, O.; Jones, L. Biosecurity risks associated with in-water and shore-based marine vessel hull cleaning operations. Mar. Pollut. Bull. 2012, 64, 1392–1401. [Google Scholar]
  40. Bullard, S.; Sedlack, B.; Reinhardt, J.; Litty, C.; Gareau, K.; Whitlatch, R. Fragmentation of colonial ascidians: Differences in reattachment capability among species. J. Exp. Mar. Biol. Ecol. 2007, 342, 166–168. [Google Scholar] [CrossRef]
  41. Floerl, O.; Coutts, A. Potential ramification of the global economic crisis on human-mediated dispersal of marine non-indigenous species. Mar. Pollut. Bull. 2009, 58, 1595–1598. [Google Scholar]
  42. Cologer, C.; Bohlander, G.; Preiser, H. Review of underwater cleaning methods and their interaction on Navy anti-fouling paint systems. J. Coat. Technol. 1977, 49, 51–60. [Google Scholar]
  43. Borchardt, J. Grooming the fleet. Mech. Eng. 2010, 132, 33–35. [Google Scholar] [CrossRef] [Green Version]
  44. Tribou, M.; Swain, G. The use of proactive in-water grooming to improve the performance of ship hull antifouling coatings. Biofouling 2010, 26, 47–56. [Google Scholar] [CrossRef]
  45. Hearin, J.; Hunsucker, K.; Swain, G.; Stephens, A.; Gardner, H.; Lieberman, K.; Harper, M. Analysis of long-term mechanical grooming on a large-scale test panel coated with an antifouling and a fouling-release coating. Biofouling 2015, 31, 625–638. [Google Scholar] [CrossRef] [PubMed]
  46. Hunsucker, K.; Braga, C.; Erdogan, C.; Gardner, H.; Hearin, J.; Ralston, E. The advantages of proactive in-water hull grooming from a biologist’s perspective. In In Proceedings of the HullPIC 18. 3rd Hull Performance & Insight Conference, Redworth, UK, 12–14 March 2018; pp. 210–222. [Google Scholar]
  47. Swain, G.; Erdogan, C.; Foy, L.; Gardner, H.; Harper, M.; Hearin, J.; Hunsucker, K.; Hunsucker, J.; Lieberman, K.; Nanney, M.; et al. Proactive in-water ship hull grooming as a method to reduce the environmental footprint of ships. Front. Mar. Sci. 2022, 8, 2017. [Google Scholar] [CrossRef]
  48. Ralston, E.; Swain, G. The ghost of fouling communities past: The effect of original community on subsequent recruitment. Biofouling 2014, 30, 459–471. [Google Scholar] [CrossRef] [PubMed]
  49. Kolle, S.; Ahanotu, O.; Meeks, A.; Stafslien, S.; Kreder, M.; Vanderwal, L.; Cohen, L.; Waltz, G.; Lim, C.; Slocum, D.; et al. On the mechanism of marine fouling-prevention performance of oil-containing silicone elastomers. Sci. Rep. 2022, 12, 11799. [Google Scholar] [CrossRef]
  50. Hunsucker, K.; Swain, G. In situ measurements of diatom adhesion to silicone-based ship hull coatings. J. Appl. Phycol. 2016, 28, 269–277. [Google Scholar] [CrossRef]
  51. Lejars, M.; Margaillan, A.; Bressy, C. Fouling Release Coatings: A nontoxic alternative to biocidal antifouling coatings. Chem. Rev. 2012, 8, 4347–4390. [Google Scholar] [CrossRef]
  52. Tribou, M.; Swain, G. The effects of grooming on a copper ablative coatin: A six year study. Biofouling 2017, 33, 494–504. [Google Scholar] [CrossRef]
  53. Clark, G.; Johnston, E. Propagule pressure and disturbance interact to overcome biotic resistance of marine invertebrate communities. Oikos 2009, 118, 1679–1686. [Google Scholar] [CrossRef]
Figure 1. Map showing the location of the study sites, the two test barges and a diagram of the frame layout. Panels are suspended horizontally on PVC frames and suspended on the test barges.
Jmse 11 00478 g001
Figure 2. Environmental conditions at Sebastian and Port Canaveral: (a) Temperature, (b) Salinity.
Jmse 11 00478 g002
Figure 3. Fouling community structure on IS700 at Sebastian (ac) and Port Canaveral (df). The first column (a,d) are the uncleaned panels, the second (b,e) are cleaned, and the third (c,f) are the groomed panels. The X-axis is the sampling month and the Y-axis is average percent cover.
Jmse 11 00478 g003
Figure 4. Fouling community structure on IS900 at Sebastian (ac) and Port Canaveral (df). The first column (a,d) are the uncleaned panels, the second (b,e) are cleaned and the third (c,f) are the groomed panels. The X-axis is the sampling month and the Y-axis is average percent cover.
Jmse 11 00478 g004
Figure 5. Fouling community structure on DC3140 at Sebastian (ac) and Port Canaveral (df). The first column (a,d) are the uncleaned panels, the second (b,e) are cleaned and the third (c,f) are the groomed panels. The X-axis is the sampling month and the Y-axis is average percent cover.
Jmse 11 00478 g005
Figure 6. Differences in average, total macrofouling cover on IS700 due to treatment. (a) In May, groomed panels had significantly lower macrofouling cover than uncleaned (Sebastian p = 0.001; Port p < 0.001) or cleaned (Sebastian p = 0.002; Port p < 0.001) panels at both locations. (b) In June at both locations, uncleaned panels had higher macrofouling cover than cleaned or groomed panels and cleaned panels had higher cover than groomed panels (p < 0.001). (c) In July at Sebastian, cleaned panels had significantly higher cover than uncleaned (p = 0.04) or groomed (p < 0.001) panels and uncleaned panels had significantly higher cover than groomed (p = 0.02) surfaces. At the Port, groomed (p < 0.001) panels had significantly lower macrofouling cover than uncleaned or cleaned panels. Error bars represent one standard error. The X-axis is treatment and the Y-axis is average percent cover. Treatments are uncleaned (U), cleaned (C) and groomed (G). The time in the parenthesis is elapsed time since treatment. Letters above the bars denote statistical significance (i.e., As are statistically similar to, but significantly different than, Bs).
Jmse 11 00478 g006
Figure 7. Differences in average total macrofouling cover on IS900 due to treatment. (a) In May in Sebastian, cleaned panels had higher cover of macrofouling than groomed panels (p < 0.01). In Port Canaveral, groomed panels had significantly lower cover than uncleaned and cleaned ones (p < 0.001). (b) In June in Sebastian, uncleaned panels had significantly higher cover than cleaned (p = 0.004) and groomed (p < 0.001) panels; cleaned panels had significantly higher cover than groomed (p < 0.001) panels. In Port Canaveral, groomed panels had significantly lower cover than uncleaned (p = 0.001) and cleaned (p < 0.001) panels. (c) In July in Sebastian, groomed panels had significantly lower cover than uncleaned or cleaned (p < 0.001) panels. In Port Canaveral, uncleaned panels had significantly higher cover than cleaned (p = 0.006) and groomed (p < 0.001) panels; cleaned panels had significantly higher cover than groomed panels (p < 0.001). Error bars represent one standard error. The X-axis is treatment and the Y-axis is average percent cover. Treatments are uncleaned (U), cleaned (C) and groomed (G). The time in the parenthesis is elapsed time since treatment. Letters above the bars denote statistical significance (i.e., As are statistically similar to, but significantly different than Bs).
Jmse 11 00478 g007
Figure 8. Differences in average, total macrofouling cover on DC3140 due to treatment. (a) In May, macrofouling cover was significantly lower on groomed than on uncleaned or cleaned panels at both locations (p < 0.001). (b) In June in Sebastian, macrofouling cover on groomed panels was significantly lower than on uncleaned or cleaned panels (p < 0.001). In Port Canaveral, uncleaned panels had the highest cover and groomed panels the lowest (p < 0.001). (c) In July in Port Canaveral, cover was significantly higher on uncleaned and cleaned panels than groomed panels (p < 0.001); cover on uncleaned panels was significantly higher than on cleaned panels (p < 0.001). Error bars represent one standard error. The X-axis is treatment and the Y-axis is average percent cover. Treatments are uncleaned (U), cleaned (C) and groomed (G). The time in the parenthesis is elapsed time since treatment. Letters above the bars denote statistical significance (i.e., As are statistically similar to, but significantly different than, Bs).
Jmse 11 00478 g008
Figure 9. Differences in average cover of hydroids on IS700 (a,b), IS900 (c,d), and DC3140 (e,f). (a) In June on IS700 in Sebastian, cover of hydroids was significantly higher on cleaned than on groomed panels (p = 0.004). In Port Canaveral, cover of hydroids was significantly higher on cleaned than on uncleaned (p < 0.001) and groomed panels (p = 0.003). (b) In July on IS700 in Sebastian, cover of hydroids was significantly higher on groomed than on uncleaned or cleaned panels (p < 0.001); cover was higher on cleaned than on uncleaned panels (p = 0.04). In Port Canaveral, cover on groomed panels was higher than on uncleaned or cleaned panels (p < 0.0010. (c) In June on IS900 in Port Canaveral, cover of hydroids was significantly higher on cleaned than on uncleaned (p < 0.001) or groomed panels (p = 0.007). (d) In July on IS900 in Port Canaveral, cover of hydroids was significantly higher on groomed than on uncleaned panels (p = 0.002). (e) In June on DC3140 in Port Canaveral, cover of hydroids was significantly higher on cleaned than on uncleaned or groomed panels (p < 0.001). (f) In July on DC3140 in Sebastian, cover of hydroids was significantly higher on groomed than on uncleaned or cleaned panels (p < 0.001). In Port Canaveral, cover of hydroids on uncleaned panels was significantly lower than on cleaned (p < 0.001) or groomed (p = 0.004) panels. Error bars represent one standard error. The X-axis is treatment and the Y-axis is average percent cover. Please note the Y-axes vary. Treatments are uncleaned (U), cleaned (C) and groomed (G). The time in the parenthesis is elapsed time since treatment. Letters above the bars denote statistical significance (i.e., As are statistically similar to, but significantly different than, Bs).
Jmse 11 00478 g009
Figure 10. Differences in fouling due to prior location. (a) Cover of encrusting bryozoans in Sebastian on Groomed IS700 in August was lower on panels from Sebastian than on those that came from Port Canaveral (p = 0.002). (b) Cover of barnacles in Port Canaveral on IS700 in August was higher on panels from Sebastian than on those from Port Canaveral (p = 0.038). (c) Cover of barnacles in Port Canaveral on cleaned IS900 in August was higher on panels from Sebastian than on those from Port Canaveral (p < 0.001). (d) Cover of barnacles in Port Canaveral on DC3140 in August was higher on panels from Sebastian than on those from Port Canaveral (p = 0.042). (e) Cover of sponges in Port Canaveral on cleaned IS700 in September was lower on panels from Sebastian than on those from Port Canaveral (p = 0.012). (f) Cover of tunicates in Port Canaveral on IS900 in August was lower on panels from Sebastian than on those from Port Canaveral (p = 0.033). The X-axes are treatments; the Y-axes are average percent cover. Please note the Y-axes differ. Letters above the bars denote statistical significance (i.e., As are statistically similar to, but significantly different than, Bs).
Jmse 11 00478 g010
Figure 11. Differences in fouling due to prior husbandry, uncleaned dominance. (a) Cover of macrofouling on 3140 at Port Canaveral in September was significantly higher on uncleaned and cleaned panels than on groomed ones on panels that came from the Port (p < 0.001). (b) Cover of encrusting bryozoans on 3140 at Sebastian in September was significantly higher on uncleaned than on cleaned or groomed panels (p = 0.011). The X-axes are treatments; the Y-axes are average percent cover. Please note that Y-axes vary. Treatments are uncleaned (U), cleaned (C) and groomed (G). The time in the parenthesis is elapsed time since cleaning and transplant. Letters above the bars denote statistical significance (i.e., As are statistically similar to, but significantly different than, Bs).
Jmse 11 00478 g011
Figure 12. Differences in fouling due to prior husbandry, cleaned dominance. (a) Cover of barnacles on IS900 at Sebastian in August was significantly higher on cleaned panels than uncleaned ones on panels that came from Sebastian (p < 0.05). (b) Cover of barnacles on IS900 at Port Canaveral in August was significantly higher on cleaned than on uncleaned and groomed panels on panels that came from Sebastian (p < 0.001). (c) Cover of sponges on IS700 at Port Canaveral in September was significantly higher on cleaned panels than on uncleaned and groomed ones on panels of Port origin (p < 0.05). (d) Cover of sponges on IS900 at Sebastian in September was significantly higher on cleaned panels than on groomed ones (p = 0.024). The X-axes are treatments; the Y-axes are average percent cover. Please note that Y-axes vary. Treatments are uncleaned (U), cleaned (C) and groomed (G). The time in the parenthesis is elapsed time since cleaning and transplant. Letters above the bars denote statistical significance (i.e., As are statistically similar to, but significantly different than, Bs).
Jmse 11 00478 g012
Figure 13. Differences in fouling due to prior husbandry, groomed dominance. (a) Macrofouling cover on IS700 at Sebastian in August was significantly higher on groomed than on uncleaned panels (p = 0.004). (b) Cover of barnacles on IS700 at Sebastian in September was significantly higher on groomed than on uncleaned and cleaned panels (p < 0.05). (c) Cover of hydroids on IS700 at Sebastian in August was significantly higher on groomed than uncleaned and cleaned panels (p = 0.007). (d) Cover of hydroids on 3140 at Sebastian in September was significantly higher on groomed than on uncleaned panels (p = 0.017). The X-axes are treatments; the Y-axes are average percent cover. Please note that Y-axes vary. Treatments are uncleaned (U), cleaned (C) and groomed (G). The time in the parenthesis is elapsed time since cleaning and transplant. Letters above the bars denote statistical significance (i.e., As are statistically similar to, but significantly different than, Bs).
Jmse 11 00478 g013
Disclaimer/Publisher’s Note: The statements, opinions and data contained in all publications are solely those of the individual author(s) and contributor(s) and not of MDPI and/or the editor(s). MDPI and/or the editor(s) disclaim responsibility for any injury to people or property resulting from any ideas, methods, instructions or products referred to in the content.

