Article

Efficiency Enhancement of Marine Propellers via Reformation of Blade Tip-Rake Distribution

School of Naval Architecture & Marine Engineering, National Technical University of Athens (NTUA), Heroon Polytechniou 9, 15780 Athens, Greece
*
Author to whom correspondence should be addressed.
J. Mar. Sci. Eng. 2023, 11(11), 2179; https://doi.org/10.3390/jmse11112179
Submission received: 22 October 2023 / Revised: 10 November 2023 / Accepted: 13 November 2023 / Published: 16 November 2023
(This article belongs to the Special Issue Advances in Innovative Solutions for Ship Energy Efficiency)

Abstract

:
This work addresses the effects of blade tip-rake reformation on the performance of marine propellers using a low-cost potential-based vortex-lattice method (VLM) and the high fidelity artificial compressibility CFD-RANS solver MaPFlow. The primary focus lies on determining whether the low-cost VLM, in conjunction with a multidimensional parametric model for the tip-rake and pitch/camber distributions, can produce a propeller geometry with improved efficiency. Due to the availability of experimental and numerical data, the NSRDC 4381-82 propellers were selected as reference geometries. Torque minimization serves as the objective function in the gradient-based optimization procedure under a thrust constraint, which translates into efficiency enhancement at the selected design advance ratio. The optimized 4381 propeller yields a +1.1% improvement in efficiency based on CFD-RANS, whereas for the modified skewed 4382 propeller, the efficiency gain is +0.5%. The performance enhancement is also evident at a region near the design advance ratio. The results suggest that the exploitation of low-cost VLM solvers can significantly reduce the CFD simulations required in the optimization process and thus can be effectively used for the design of propellers with tip-rake reformation.

1. Introduction

The demand for more energy efficient vessels will continue to be of utmost importance for shipping companies in the next years in order to comply with new IMO regulations (see https://www.imo.org/en/MediaCentre/HotTopics/Pages/Reducing-greenhouse-gas-emissions-from-ships.aspx, accessed on 10 November 2023) and the European Union’s Green Deal (see https://www.consilium.europa.eu/en/policies/green-deal/fit-for-55-the-eu-plan-for-a-green-transition/, accessed on 10 November 2023) that aims to reduce emissions by at least 55% until 2030. For this purpose, among other solutions including the exploitation of marine renewables, the installation of various hydrodynamic energy-saving devices (ESDs) is considered, especially in connection with the ship propulsion systems, in the effort toward a more environmentally friendly maritime industry. Furthermore, retrofitting solutions, aimed at improving the hydrodynamic performance of ships, is a subject of intensive investigation today.
A particular class of propulsion solutions deals with stern devices controlling the hydrodynamic flow properties, leading to drag reduction and improving the hull–propeller interaction and the propeller performance; see, e.g., the comprehensive review by Spinelli et al. [1]. Typically ESDs are categorized as upstream and downstream devices based on the operation principle. Upstream devices are installed in the upstream of a propeller and by interfering with the inflow, they aim to improve propeller efficiency. These include (i) pre-ducts, see e.g., the work of Kinnas et al. [2], and (ii) pre-swirl stators and fins. On the other hand, downstream devices are mounted in the wake of a propeller and improve the overall efficiency of the system by recovering rotational losses of the wake. Notable devices include (i) rudder fins and (ii) propeller boss cap fins (PBCF) that mitigate losses from hub vortices. Apart from ESDs, unconventional propellers, such as the contracted tip-loaded (CLT) propellers and the highly-skewed KAPPEL designs, emerged via extensive experimental and numerical studies with an aim to produce blade geometries with enhanced efficiency and improved cavitation performance, as discussed in Carlton [3]. Each concept has its strengths and limitations since compliance with design requirements and other aspects, such as cavitation mitigation, low acoustic noise, maximum efficiency structural integrity, and other techno-economic factors, are often contradictory.
The CLT designs were motivated by the idea of tip-vortex-free propellers and are quite distinguishable from conventional geometries due to the substantial tip chord length and the large end plates attached to the tip [4]. The end plates follow the entire tip chord length and point toward the blade’s pressure sides. These designs are typically unskewed, introduce mechanical strength challenges, and may be prone to certain types of cavitation, as discussed in [5,6,7,8]. In [9], emphasis is given on the numerical investigation of winglet effects on tip vortex cavitation (TVC). Traditional design methods may fail to produce CLT designs that outperform conventional blades, and therefore, optimization based methodologies may be more suitable for the preliminary design phase, as discussed in the recent work by Gaggero et al. [10]. In their work, a CLT propeller geometry is produced via an optimization process and is then studied in terms of open-water propeller performance, unsteady cavitation, and induced pressure pulses to highlight the advantages of CLT designs. The KAPPEL propeller was proposed in the early 2000s after a long development process [3]. It stands out from the CLT design in several ways. The blade tips are lifted and curved gradually towards the suction side of the propeller with a large amount of skew. In that sense, the blades are non-planar lifting surfaces, differing substantially from most conventional propellers. Sea trials with the conventional propeller and the KAPPEL propeller have been performed and have proved an efficiency gain of 4% in favor of the new propeller. The efficiency enhancement was attributed to lower propeller-induced pressure fluctuations, as shown in [11].
Successful designs of unconventional propellers are proprietary or patented works, and consequently, the blade geometry data available in the literature for bench marking is limited. Recent work by [12] investigates the effects of various tip-rake distributions on the performance of KAPPEL-like propellers in terms of the propulsive performance and the mitigation of cavitation phenomena, suggesting that a 2.5% performance enhancement is observed from the RANSE-CFD computations. Findings indicate that an increase in tip-rake magnifies the low-pressure value and area on the suction side blade surface, which, together with a phenomenon of the tip-vortex stretching and an inhibition of wake vortex contraction, are beneficial to the elevation of propulsion efficiency.
Regarding the numerical methods typically used for the design and analysis of propeller performance, both potential-based codes and RANSE-CFD are being used. In the work by Brizzolara et al. [13], a systematic comparison between RANS and the panel methods for propeller analysis is discussed to highlight the strengths and limitations of each method. The analysis indicates that low-cost numerical tools provide results with acceptable accuracy, in terms of the open water propeller integrated characteristics, and substantially support multi-dimensional blade geometry optimization. In general, the numerical solution of linearized propeller lifting-surface design problems lies in two categories. The first is the well-known vortex-lattice method, e.g., [14,15], and the second is the family of 3D panel methods formulated on potential or velocity representations, see e.g., [16,17], allowing also for the development of formulations that take into consideration cavitation effects as shown in Fine and Kinnas [18]. The use of lifting-line and lifting-surface methods for the optimization of a propeller with a tip-fin and skew reformation has been studied by Anderson [19], where towing tank experiments confirmed the findings of the optimization study.
The state-of-the-art literature in multi-fidelity optimization offers a wide range of solutions that exploit low- and high-fidelity solvers, such as [20]. However, since only a few works address the topic of tip-rake propeller optimization in the literature, see e.g., [10,21,22] and Maghareh and Ghassemi [23], it is important to investigate the limitations of using lower-fidelity models in propeller geometry optimization prior to the exploitation of more sophisticated multi-fidelity frameworks and approaches for propeller optimal design. Considering all the above works, existing tools for calculating the hydrodynamic performance of marine propellers in usual operating conditions are used and extended in the present study to account for geometry modification effects with emphasis on blade tip-reformation.
The novelty of the present work lies in the use of a low-cost vortex-lattice solver for the modification of propeller geometry, in the sense of tip-rake, pitch, and maximum camber distribution reformation, with emphasis on performance gain via optimization. The optimal propeller geometries are then analyzed using viscous CFD to quantify the gain in performance due to geometry modification effects. Vortex-lattice methods are extremely cost effective, since each simulation requires only a few seconds on a typical personal computer, and have been shown to be very efficient in similar problems, i.e., from the field of bio-mimetic propulsion and scenarios of animal flight; see, e.g., [24]. The VLM has been further extended and systematically applied to derive an optimized solution concerning propeller blade geometry and modifications by various authors; see, e.g., [25,26]. However, the successful application of VLM is based on the use of high fidelity CFD and experimental fluid dynamics (EFD) in order to calibrate the parameters controlling various phenomena such as leading-edge suction force and viscous-drag correction.
The optimization is performed with respect to the opposing torque by the propeller as the objective function and the goal is to increase the propeller efficiency without affecting greatly the design advance ratio of the propeller (i.e., the design point for a given vessel). VLM is used in order to optimize an initial propeller design, using the blade tip-rake deformation points as degrees of freedom, and the CFD solver MaPFlow [27,28] is used to obtain results for the initial and the optimized geometry. The latter model employs general polyhedral multi-block meshes, in which the geometries under consideration are fully detailed. Also, near-body cells are usually highly flattened and with prescribed lateral height, in order to formally employ eddy-viscosity models (mainly RANS), thus allowing to resolve in highly turbulent regimes. Examples of MaPFlow applications can be found in [27], demonstrating its usefulness for simulating the performance of marine propellers and for other problems in ocean and marine engineering in Ref. [28].
A systematic application and verification of both methods is provided for the five-bladed NSRDC 4381 propeller model geometry without skew, which was selected due to the availability of experimental data. The VLM results for the NSRDC 4382 with skew are also provided for completeness; however, the present methodology can be extended to other propeller models of the same series, such as the skewed N4382-4 as well as other propeller designs. The description of the propeller geometries is also included in the present work for completeness; however, the data can be found in the original report from NSRDC in [29] and also in Brizzolara et al. [13].
The remaining work is organized as follows: in Section 2, the numerical models are presented. In Section 3, the proposed parametrization of the propeller blade with tip-rake reformation is presented in detail. Information is also included regarding the optimization problem formulation that addresses the performance enhancement of the reference propeller operation at the design point. Section 4 contains numerical results that consist of sensitivity analysis for both solvers, verification based on a comparison with the open water curve experimental data, and finally, the modified propeller geometry as deduced from a gradient-based optimization study. The final section contains the conclusions and directions for future work.

2. Numerical Model and CFD Code

The open water performance of a propeller can be evaluated using various numerical tools including lifting-surface theory models and Reynolds-averaged Navier-Stokes equations (RANSE) finite-volume solvers. In the present work, the results are obtained firstly, using a Vortex-Lattice Method (VLM), and secondly, using the CFD code MaPFlow. VLM is based on the ideal-flow assumptions including viscous corrections that are calibrated using available experimental data and RANS simulations.

2.1. The Vortex-Lattice Model

In VLM, the propeller blades and the wake are modelled as a surface with continuous distribution of vorticity, which is classified as the bound and trailing vorticity; see Figure 1. The fluid flow domain outside the vorticity surface is assumed incompressible, irrotational, and inviscid. From a discrete point-of-view, this continuous distribution can be approximated using vortex-ring elements, as shown in Figure 1a for the case of a four-bladed, 30 deg skewed propeller with a positive blade-tip-rake (towards suction side). The vortex-ring mesh is positioned based on the {1/4, 3/4} rule, as shown in Figure 1b; see also Katz and Plotkin [30]. The edges of the closed ring elements consist of vortex filaments with the same strength Γ i satisfying the continuity of vorticity in the discrete sense. In the present formulation, the mean camber surface of each propeller blade is considered; thus, the thickness effects are neglected. The induced velocity on each control point, positioned at the center of each vortex-ring as shown also in Figure 1b, can be calculated analytically via an implementation of the Biot–Savart law. The induced velocity by all discrete vortex-segments can be calculated analytically. For a linear vortex-segment, the M 1 M 2 calculation of the induced velocity is based on the following formula,
V ( r ) = Γ i 2 π h cos θ 1 cos θ 2 e ,
where V is the velocity induced at point M c , e denotes the unit vector perpendicular to the plane formed by the three points M 1 , M 2 , M c . Also, h is the perpendicular distance from the control point M c to the line segment, and Γ i the strength of the filament. The direction of the induced velocity can be obtained from the right-hand screw rule, and for each vortex-ring in the configuration, the above rule is applied four times.
Regarding the boundary conditions, a flow-tangency condition is imposed on each control point on the propeller blade mesh, as follows
V + V B i + V W i n i = 0 ,
where V denotes the freestream velocity, V B i is the disturbance velocity generated by the bound vortex rings, V W i is the velocity induced by the trailing vortex wake, and n i is the unit normal vector at the control point of the ith-element M c i = ( x c i , y c i , z c i ) . The modulus of the freestream velocity at each point is given by V 2 = V a 2 + ω r 2 and is due to the axial flow V a and tangential flow velocity ω r at each radial position r = y 2 + z 2 due to propeller rotation at a constant angular velocity ω = 2 π n R P S , where n R P S denote the revolutions per second. In this setup, the freestream velocity is determined based on the selected propeller advance coefficient J which is defined as,
J = V a / n R P S D ,
where D = 2 R denotes the propeller diameter and R its radius, respectively.
For the steady-flow problem treated here, an additional boundary condition, namely the Kutta condition, needs to be satisfied at the blade’s trailing edge (TE). Within the context of the proposed VLM, the wake mesh is generated in the sense of cylindrical surfaces, based on the propeller’s pitch distribution. In addition, the Kutta condition is satisfied by assuming that the vortex-ring elements on the blade mesh adjacent to the trailing edge have the same vorticity as their neighbors in the wake. Thus, vortex-ring strengths on the wake vary only in the span-wise direction. This assumption allows information from the TE to “travel” in the trailing-wake direction as a consequence of Kelvin’s theorem in the discrete sense; see, e.g., Kerwin and Greely [15]. Figure 1a shows schematically the propeller/wake mesh used in VLM simulations. Moreover, it is important to note that the total number of unknowns, for the ideal-flow problem introduced in this section, is determined by the number of vortex-ring elements on the propeller blade mesh.
The vortex ring strengths on the blade surface are calculated by solving a set of linear equations based on the kinematic boundary condition enforced at each control point,
j = 1 N e l A i j Γ j = V n i ,
where Γ j denotes the vortex ring strength and N e l = N b n b l is the total number of control points, including all blades n b l . After the solution has been obtained, the mean total velocity V m = 0.5 V u + V l is calculated at each control point and the corresponding modulus V m = V m . From the definition of vorticity as a velocity jump via the lifting surface and the steady Bernoulli theorem [22], the following discrete expression for the pressure difference on each control point is used,
Δ C p i = C L E 2 V m V 2 G i ,
where C L E denotes a leading-edge suction force correction coefficient with typical values within the interval {0.85–0.95}. Taking into account the symmetry between the blades in steady flow, the open water propeller characteristics [3], namely the thrust coefficient K T , torque coefficient K Q , and efficiency η at the selected advance coefficient, are obtained via the summation of contributions on the key blade, as follows,
K T = n b l j = 1 N b T j n r p s 2 D 4 ,   with   T j = A j 0.5 V 2 Δ C p j n x j C D r a g V t x , j | V t , i | ,
where n b l denotes the number of blades, T j is the thrust force developed by each vortex-ring element on the key blade, and C D r a g is the friction-drag coefficient. A consideration of friction-drag effects is included using the empirical formula, C D r a g = C F + C a ( Re ) a e f f 2 . The formula comprises of a skin-friction resistance coefficient C F = 0.0858 / [ log 10 Re + 1.22 ] 2 involving the local Reynolds number, the roughness of the blade’s surface, and a coefficient dependent on the effective angle of attack denoted by a e f f , see also [31]. Also, A j is the vortex ring surface area, n x j is the unit normal vector projected in the x-axis, and the same holds for the tangent velocity component V t x , j . For the torque coefficient, it holds,
K Q = n b l j = 1 N b Q j + 2 Q j D r a g n r p s 2 D 5 , where Q j = A j 0.5 V 2 Δ C p j n y j z c j + n z j y c j , Q j D r a g = A j C D r a g 0.5 | V t , j | V t y , j z c j + V t z , j y c j .
Finally, the open water efficiency is calculated as follows,
η = J 2 π K T K Q
For the numerical implementation, the NTUA in-house VLM code is used, whereas Matlab© (ver.R2018, MathWorks, USA) is used for the pre- and post-processing of results. At the first stage, the surface blade mesher creates the vortex ring network to approximate the camber surface of one blade and then the solver, using rotation symmetry, takes into account the full geometry of the propeller.

2.2. CFD Code

For the numerical part of the investigation, the present study uses the CFD code MaPFlow (see Ntouras et al. [28]), an in-house software developed at the National Technical University of Athens. MaPFlow can admit general polyhedral multi-block meshes and accounts for turbulent phenomena with the use of eddy-viscosity models. In our case, the unsteady Reynolds-Averaged Navier–Stokes Equations are solved (URANSE).
The model is capable of solving both compressible and fully incompressible flows using the artificial compressibility method for the latter. In all cases, the convective fluxes are discretized using the approximate Riemann solver of Roe and the flow field reconstruction is performed with a second-order piecewise linear interpolation scheme. Viscous fluxes are discretized using a central second-order scheme, along with the use of a directional derivative to account for the skewness of cells. For the time integration, an implicit second-order backwards differentiation formula (BDF) is used together with local time-stepping in the pseudo-time iterations. The implicit scheme demands that the non-linear advection terms are linearized in time using the Jacobian matrix.
The governing system of equations written in differential form consists of the continuity equation and momentum vector equations,
1 β p τ + u = 0 ,
ρ u τ + ρ u t + ρ u u + p + · τ ̿ = 0 .
In the above equations, p and u denote the four unknown fields, which are the pressure, and the three-dimensional velocity field, with ρ denoting the constant density field, τ ̿ the tensor of the viscous stresses, and finally, τ and t the fictitious and real time, respectively. As already mentioned, the equations are augmented by the pseudo-time derivatives of the variables. The aim of the numerical procedure is to drive these derivatives to zero, therefore making the velocity field divergent-free and retrieving the original unsteady system of equations. The coupling of the equations is performed during the pseudo-time, where a relation between the density and the pressure field is assumed and controlled via the relation ρ p | τ = 1 β , where β is a free parameter.
The present study examines the flow around a propeller. The governing equations are solved in the relative frame of reference, in which the geometric domain is rotating with an angular velocity ω. Let r = (x, y, z) be the position vector, re-writing Equation (9) with respect to the relative velocity vector u r = u ω × r , and after some algebraic manipulations the following expressions are obtained:
1 β p τ + u = 0 ,
ρ u τ + ρ u t + ρ u u + p + · τ ̿ ρ ω × r = 0 .
It is noticed that the mass equation (augmented continuity equation) remains unaffected by the variable transformation, since the mass balance is invariant to a system’s rotation. The source term ρ ω × r expresses the Coriolis force due to rotation. By integrating the system of Equations (10a) and (10b) over a control volume Ω with a corresponding boundary interface Ω , the resulting vector equation emerges:
Γ Ω Q τ d Ω + Γ e Ω Q t d Ω + Ω F c F v d S = Ω S q d Ω .
In the above, Q is the vector of the unknown variables (pressure p , velocity u), vector S q contains the various source terms of the equations, such as the Coriolis forces, F c and F v are the vectors of convective and diffusive fluxes normal to a face, respectively. The two flux vectors are given by Equation (11). By Δ V , we express the velocity difference between the contravariant velocity V n = u · n and the grid face velocity due to the mesh motion V g = ω × r · n , where n = ( n x , n y , n z ) . The convective and viscous fluxes are
F c = V n u Δ V + p n x ρ v Δ V + p n y ρ w Δ V + p n z ,   F v = 0 τ x x n x + τ x y n y + τ x z n z τ y x n x + τ y y n y + τ y z n z τ z x n x + τ z y n y + τ z z n z .
The matrices Γ and Γ e denote the artificial compressibility matrix and the transformation matrix from primitive to conservative variables, respectively,
Γ = 1 ρ β 0 0 ρ Ι ̿ 3 × 3 ,   Γ e = 0 0 0 ρ Ι ̿ 3 × 3 ,
where Ι ̿ 3 × 3 is the 3 by 3 identity matrix. Furthermore, the viscous fluxes are computed using the Boussinesq approximation for the turbulence modeling, as follows
τ ̿ = τ i j = μ t + μ u i x j + u j x i 2 3 ρ k δ i j .
In Equation (13), μ is the dynamic viscosity of the fluid, μ t is the turbulent viscosity, k the turbulent kinetic energy, and δ i j is Kronecker’s symbol. The turbulence viscosity is computed using the two-equation k-ω SST model of Menter [32]. The k-ω SST model is one of the most widely used RANS models and has a verified performance in simulating near-wall external hydrodynamic flows in the turbulent regime. Its use guarantees an adequate representation of the blade surface distribution of pressure and shear stresses as well as the wake structures (followed by the appropriate mesh refinement).
Usually, in open-water propeller simulations, periodic boundary conditions are employed and only one blade is modelled, with the exception of highly skewed propellers. The far-field boundary is an adequately large cylinder spanning 5 propeller diameters radially and 10 diameters aft of the propeller. These dimensions are chosen as a standard ITTC practice for open water propeller simulations. Additionally, the hub of the blades is a cylinder of the diameter equal to 1/5 of the diameter of the propeller with a semi-spherical ending ahead of the blade. In the boundary of the hub, no-through conditions are applied (inviscid wall) in order to exclude the hub from the force calculation. A typical configuration of the computational domain is presented in Figure 2.
As far as the CFD setup is concerned, all simulations are conducted in a steady state configuration, with the exception of the 4381 propeller in which both steady and unsteady simulations were conducted in order to justify that the current phenomenon has a steady state convergence. As a result, both simulations (steady and unsteady) produced a relative maximum error of 10 5 , which was the convergence criterion that was used throughout the current study.

3. Parameterization and Optimization Methodology

The state-of-the-art literature in multi-fidelity optimization offers a wide range of solutions that exploit low- and high-fidelity solvers, such as [20]. However, since only a few works address the topic of tip-rake propeller optimization in the literature, as discussed in [11,21,23], it is important to investigate the limitations of using lower-fidelity models in propeller geometry optimization prior to the exploitation of more sophisticated multi-fidelity frameworks and approaches for propeller optimal design.
In this work, we investigate whether the results of an optimization study conducted using a vortex-lattice solver can produce modified propeller geometries that show efficiency gain when simulated using viscous CFD. Vortex-lattice methods are extremely cost effective, since each simulation requires only a few seconds on a typical personal computer and have been shown to be very efficient in similar problems, see, e.g., [24]. In particular, the methodology implemented here consists of the following steps:
  • Select a reference propeller geometry and produce the open water curves using both computational tools. During this process, if available, the VLM coefficients (leading-edge suction force, friction drag) can be calibrated using the available experimental data.
  • Determine the upper/lower bounds of the selected design variables (rake, pitch, maximum camber, etc.) and perform an optimization study using VLM. Gradient-based methods can be sensitive to initial design vector selection and may be prone to locate the local optima. A remedy to this, which is considered common practice, is to solve the same optimization problem starting from different initial design vectors and keeping the best candidate solution among the results. This approach to optimization is implemented here.
  • Then, perform viscous-CFD simulations using MaPFlow to predict the open water performance of the modified propeller near the design point and quantify the performance gain due to geometry modification.
  • Finally, calibrate VLM using available data from the viscous-CFD simulations and predict the open water curves at J = {0.4–1}. Essentially, calibration occurs in the sense of best fit between the CFD data and the open water curves.

3.1. Parametric Model for the Tip-Rake Reformed Geometry

The geometrical model used to represent the rake distribution consists of a combination of linear and quadratic terms. Starting from the blade root up to a selected transition point, the rake is linear, i.e., typical generator line rake, whereas after the transition point, the rake distribution is quadratic. At the transition point we demand slope continuity. The two degrees-of-freedom (dofs) for the tip-rake parameterization are the radial position of the transition point and the maximum non-dimensional rake at the tip. In Figure 3, a schematic representation of the 2-dof rake parametric model is provided.
The pitch and maximum camber distributions are also quantities under modification. The reference distributions are approximated using B-Spline interpolation (fourth order), and then the control points with a radial coordinate greater than a specified value are multiplied with a coefficient to produce the 1-dof reformation of the curve. This model is shown in Figure 4, where the red squares denote the activated control points of the pitch representation that are multiplied with the coefficient. This approach ensures that the distributions remain unaltered in the vicinity of the root section to avoid flow separation near the hub. Taking into consideration all of the above, the modified propeller geometry is based on optimally tuning the above 4-dof parametric model controlling the tip-rake, pitch, and maximum camber distributions.

3.2. Optimization Problem

The present study is focused on enhancing the propulsive performance of the reference propeller at the design advance coefficient by optimally tuning the 4-dofs to generate a modified propeller geometry with a distinct blade tip-rake reformation without significant thrust reduction at the design advance ratio. The examined optimization problem is formulated as follows,
min x f ( x ) = 10 K Q J d s u c h   t h a t   ( 1 p ) K T r e q J d K T J d ( 1 + p ) K T r e q J d l b b n u b
where J d is the propeller advance coefficient at the design point, b n = { x 1 , x 2 , x 3 , x 4 } denotes the design variable vector that contains the geometric dofs, and p = 3.5% is a tolerance measure for the thrust constraint. Regarding the design variables, x 1 denotes the radial position of the transition point in tip-rake distribution, x 2 the maximum non-dimensional rake at the tip, x 3 the pitch proportional coefficient and x 4 the maximum camber proportional coefficient, as discussed in the previous Section 3.1.
It is also important to note that the propeller sections are kept the same as the experiments from [29], where a NACA a = 0.8 mean line and a NACA 66-modified thickness distribution is considered. In this regard, a similar approach from Kinnas et al. [2] is implemented for the problem of optimal blade design using constraints targeting torque minimization under a fixed thrust. In their work, VLM is used for the optimization studies, whereas RANS-CFD simulations were also performed for further analysis, indicating that the methodology presented here can also be extended for the design of propeller sections.
It is important to note here that the gain in efficiency is a result of the modification of the resulting pressure distribution on the modified propeller blade. The effects on tip-rake reformation, as well as the modification in the pitch or maximum camber distribution, on the cavitation performance of the blade are non-trivial and future work will be focused on investigating these effects. Unconventional propeller geometries, such as the CLT propellers or KAPPEL propellers, yield efficiency enhancement but may be prone to other types of cavitation [3].
For the solution of this optimization problem, the nonlinear programming Matlab© (ver.R2018, MathWorks, USA) solver “fmincon” is implemented. The results presented in this work are produced using the sequential quadratic programming algorithm via the “sqp” option that is suitable for handling nonlinear constraints. The upper and lower bounds are listed in Table 1. It is important to note that other gradient-based solvers might not require the pre-definition of upper/lower bounds. The Hessian matrix is calculated using central finite differences and all VLM numerical simulations were performed on a system with AMD Ryzen 9 3900XT 12-core CPU, 32 GB RAM, and an NVIDIA GeForce RTX 3080 GPU. A typical evaluation of a candidate solution requires a few seconds for a spatial discretization per blade of NEC = 8, with NEA = 15 vortex rings in the chordwise and spanwise direction, respectively.
Gradient-based algorithms, such as the fmincon, may be sensitive to the starting point; therefore, the results presented and discussed in the sequel are the best solutions among a sample of (5) solutions obtained from the optimization using different starting points. Matlab (ver.R2018, MathWorks, USA) provides random number generator functions that can be used for this purpose.

4. Results

For our study case, we have selected the five-bladed 4381-82 propellers from the tunnel experiments conducted in 1968 at the Naval Ship Research and Development Center (NSRDC) with the data available in [13]. The NSRDC propeller series were initially developed to investigate skew effects on cavitation; however, due to the availability of the open water curve data, they are often used in the literature in benchmarking studies. The geometric parameters required to reproduce the propeller blades are included in Appendix A; see also Brizzolara et al. [29]. The 4381 model has zero skew, whereas the 4382 model has a maximum skew of 36 deg. Both propeller models have a zero generator-line rake.
Starting with the verification of our computational tools, Section 4.1.1 and Section 4.1.2 contain the results of the sensitivity analysis studies performed for the vortex-lattice method and MaPFlow solver respectively, concerning the open water performance of the 4381 propeller at the design advance coefficient. Then, in Section 4.2, we compare the open water curve predictions obtained from the VLM and CFD with the experimental measurements from NSRDC. Finally, Section 4.2 is dedicated to the results of the optimization methodology and the modified propeller models.

4.1. Verification

In this section, the sensitivity analysis results for both solvers are presented and the potential-flow model (VLM) and the viscous CFD solver (MaPFlow) are provided for the 4381 propeller at the model scale with a diameter of D = 0.305 m.

4.1.1. VLM Sensitivity Analysis

Table 2 contains indicative results concerning the open water performance of the NSRDC 4381 propeller at the design point (J = 0.889) using sparse and dense VLM meshes to ensure convergence and justify the mesh specifications to be used in the optimization study. On this basis, a mesh of 15 × 8 vortex rings on each blade is selected, as shown in Figure 5. For the analysis, the leading edge suction force coefficient C L E and the viscous drag C d r a g are tuned based on the experimental data from [29]. The reference quantities are the open water curve metrics; namely, the thrust coefficient (KT), the torque coefficient (10 KQ), and the efficiency (η).

4.1.2. CFD Sensitivity Analysis

Regarding the CFD simulations, a grid independence study is carried out for the NSRDC 4381 propeller. One blade is modelled with periodic boundary conditions and three successively refined grids are generated. The coarse one consists of 2.3 million elements, the medium one consists of 7.5 million elements, and the finer has 12.7 million elements. In all grids, the first layer of the wall has the same height, corresponding to a value y+ < 1 for the whole blade region. The smallest cell size of the blade surface reaches 0.01 mm in the dense grid, starting from 0.05 mm in the coarsest grid. Table 3 summarizes the findings of the grid independence studies, with respect to the dense grid open water results. It is evident that the medium grid provides a grid-independent solution; thus, it is employed for the rest of the work. Since more than one propeller model is considered in this work, the grids for the propellers modelled are similar to the medium grid in terms of the spanwise, chordwise, and boundary layer resolution. For comparison purposes, Table 4 summarizes the results with respect to the available experimental data.

4.1.3. Open Water Curves for Reference Propeller Models 4381 and 4382

We proceed by performing simulations for the open water curves of the 4381 and 4382 propellers using both computational tools for validation. The data required to reconstruct the blade geometries are included in Appendix A for completeness. More precisely, simulations are performed for six advance coefficients J = {0.7, 0.75, 0.889, 0.95, 1.0, 1.1}. A wider range of advance coefficients in the vicinity of design advance coefficient J = 0.889 was examined with VLM due to the lower computational cost of the method. The open-water curve comparison shown in Figure 6 and Figure 7 illustrate that both the VLM and CFD results are in good agreement with the experimental data in both thrust and torque coefficient prediction mostly near the design advance coefficient and the higher values. However, in J where the values are smaller than 0.889, there is an observable difference between CFD and the experiments. As a result, the efficiency (which is used for optimization) is close to the experiments and follows the same behavior as J increases. The ideal-flow solver is also proven to be suitable for open water curve prediction in the vicinity of the design point, where accuracy is sufficient (<3%) and obtained at a fraction of the computational cost required for the CFD simulations. In the results presented in Figure 6 and Figure 7, VLM was calibrated using experimental data. However, inefficient calibration of the viscous drag and leading-edge suction force coefficient might sacrifice some accuracy when predicting the open water curves for new propeller geometries.
Each computational tool comes with certain capabilities regarding the post-processing of results. To begin with, the VLM model is able to produce indicative results for the pressure difference on the blades and the average velocity on each vortex ring as shown in Figure 8 for the examined propeller geometries. On the other hand, CFD is able to produce higher-fidelity pressure contours and stream traces of total velocity, which can be valuable in interpreting the effects of geometry changes, as shown in the following section for the reference and modified propeller geometries.

4.2. Propeller Performance Improvement by Blade Tip Geometry Reformation

In this section, we present the results of the optimization studies for reference geometries 4381 and 4382. In both cases, the reference propeller is a five-bladed model with a diameter D = 0.305 m. The design advance coefficient, for which a maximization of efficiency is attempted via blade tip-rake reformation, is J = 0.889. During the optimization, the VLM viscous drag coefficient is set to zero, whereas the leading-edge suction force coefficient is kept the same as the reference propeller geometry. This decision is justified from the fact that changes in the rake distribution are expected to affect significantly the viscous pressure on the blades; thus, it is omitted during the first step in the optimization study. However, for the optimal geometry, additional simulations with CFD are used for viscous drag coefficient calibration. Regarding the control points defining the pitch and maximum camber distributions, for the 4381 propeller, all control points are considered active. For the case of the 4382 propeller, control points with radial positions r/R > 0.5 are considered active, as shown in Figure 4. Only the active control points are to be multiplied with the proportional coefficient. It was found that for the skewed propeller, the pitch and maximum camber distributions with no alteration near the hub, yielded better performance, justifying the above decision.
The optimal propeller geometries where derived as the best candidates among (5) optimization studies performed for the same problem but starting with different initial reference geometries. The optimal design variable vectors for the examined propellers are summarized in Table 5. Regarding the rake transition point (x1), for both propellers the optimal value is close to 70% of tip radius R.
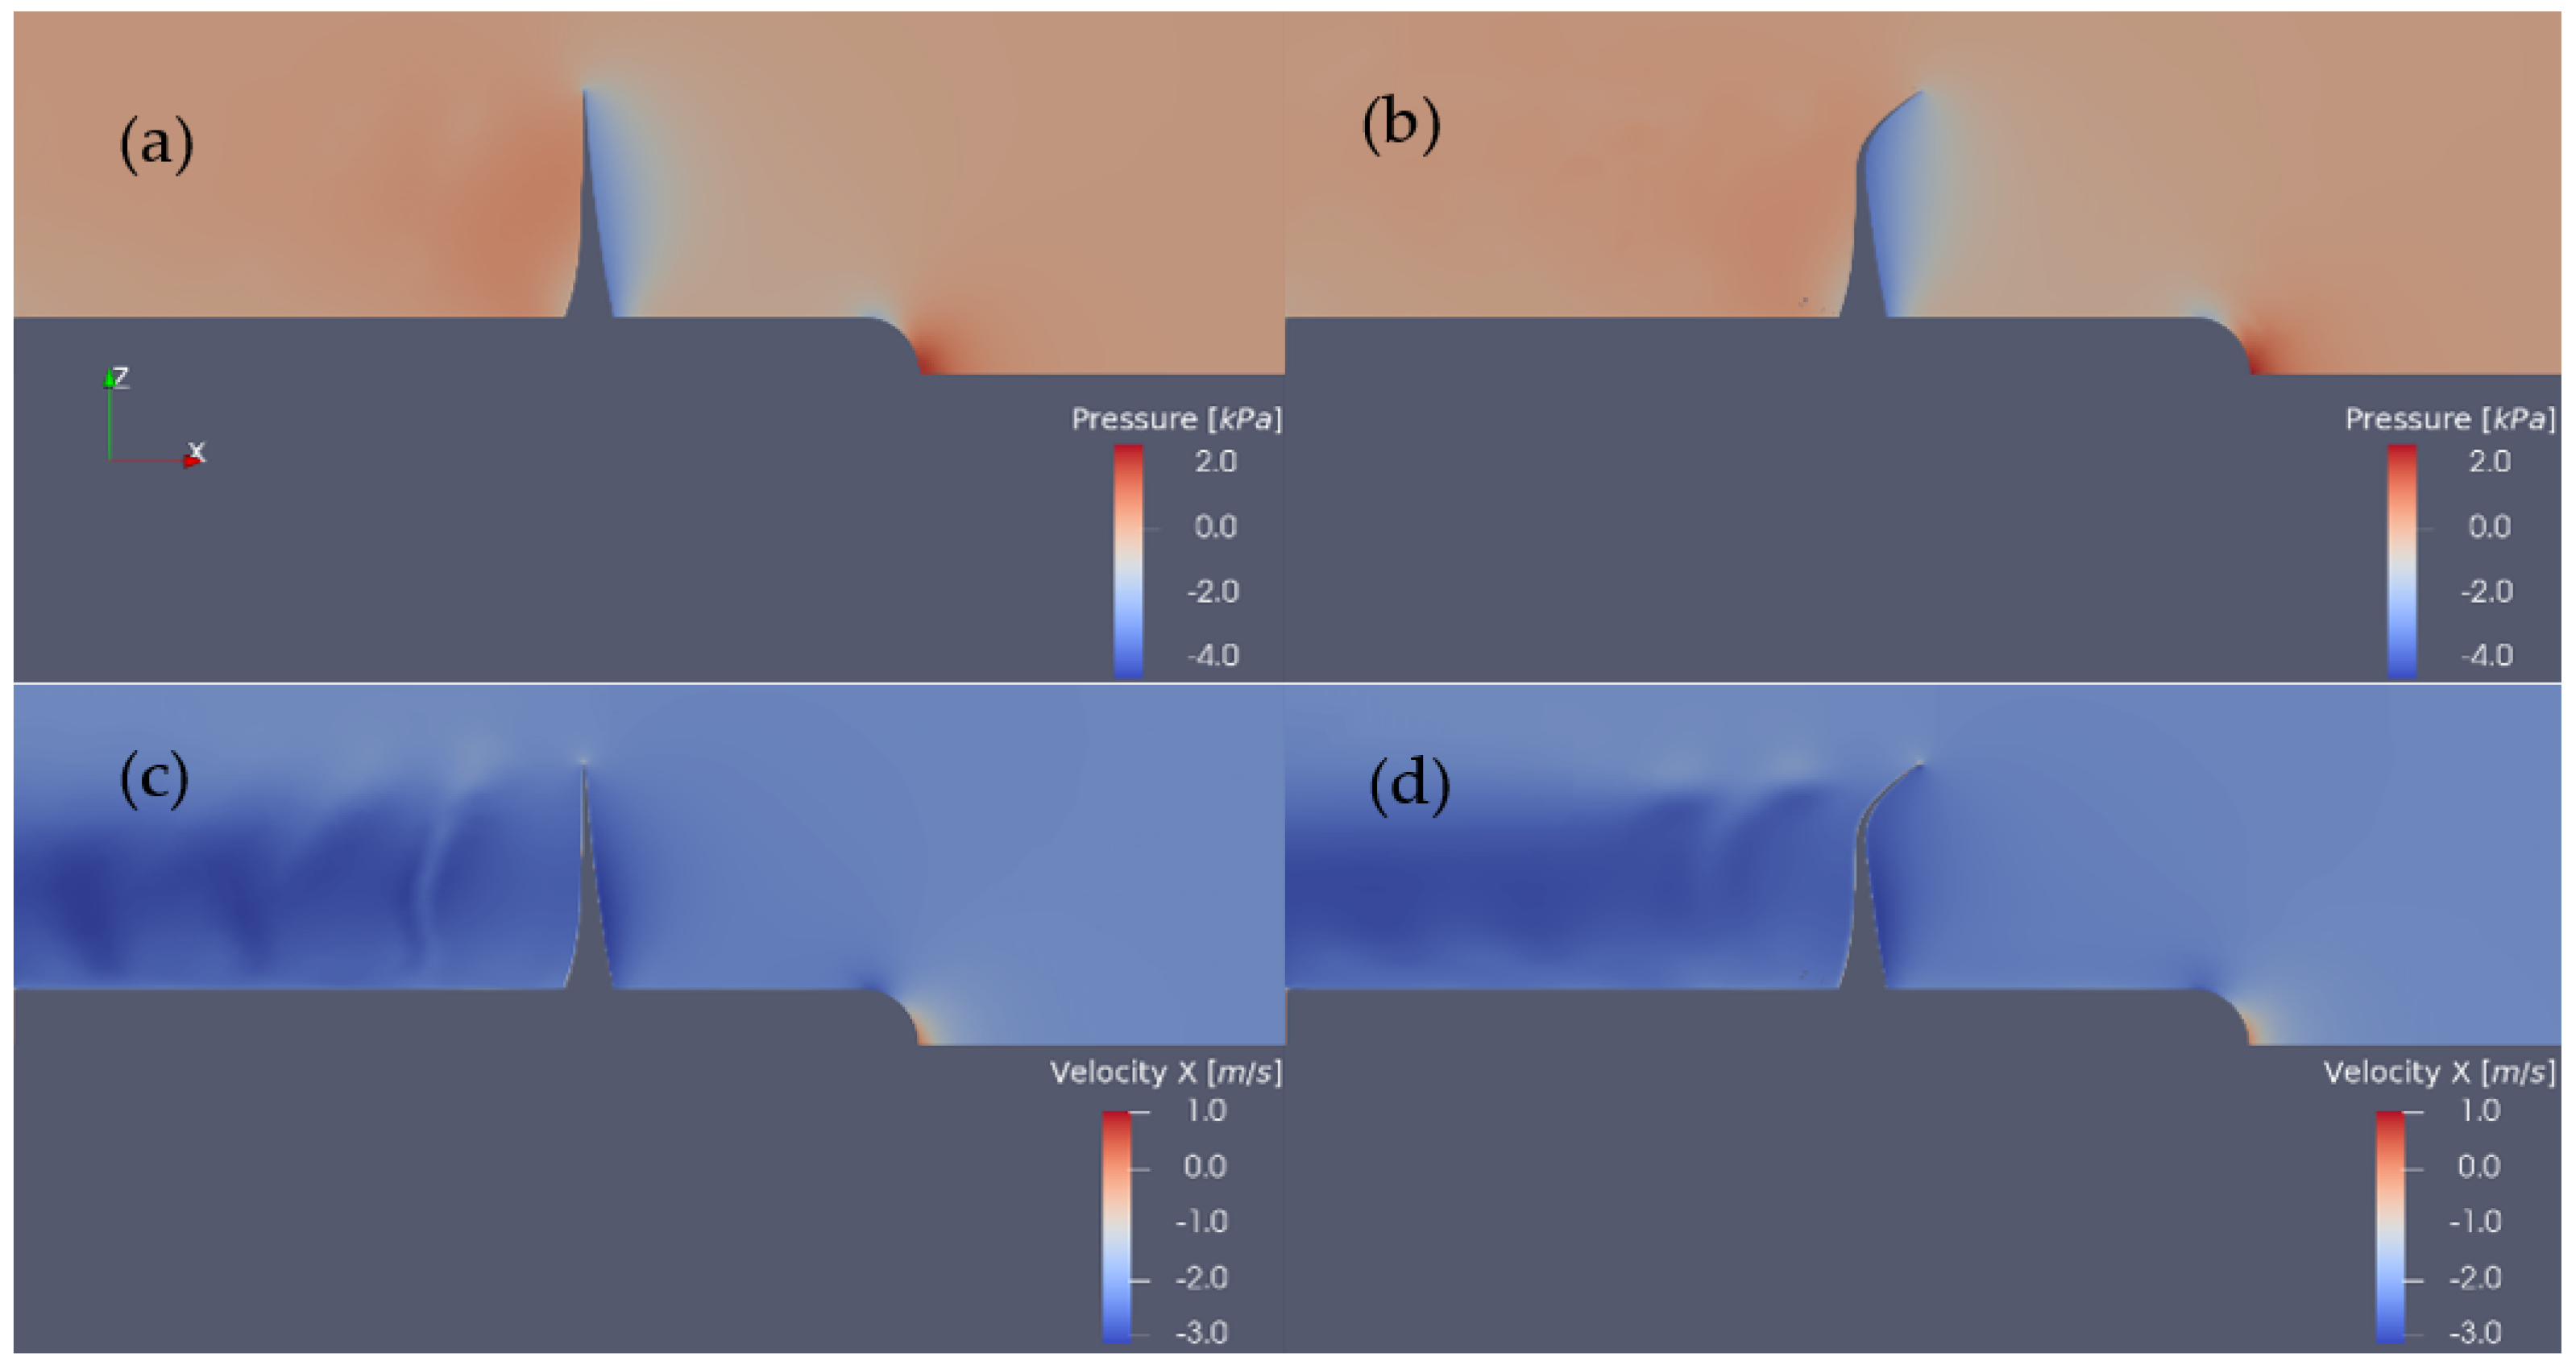
The optimal maximum rake (x2) in both cases corresponds to a suction-side rake, as shown in Figure 9 and Figure 10 for the modified 4381 and 4382 propellers, respectively. Finally, the optimal pitch and maximum camber proportional coefficients are smaller than the corresponding value of the reference geometry. The geometric parameters for the reference and modified propellers are provided in Appendix A. Regarding the CFD simulations for both the initial and modified geometries, we present below the selected plots. In Figure 9, contour plots concerning calculated velocity and pressure fields are presented on the vertical xy plane for both the initial 4381 propeller geometry and the modified one.
Moreover, in Figure 11, the corresponding comparison concerning the pressure contour on a cylindrical section at radius r/R = 0.95 is shown. In the contour of pressure (top subplots of Figure 9), we observe the different configuration of the suction side between the original and the modified blade (left and right subplots, respectively). The effect of the blade tip-rake can also be seen in the structure of the wake, as observed by the increase in the axial x-component velocity in the bottom subplots.
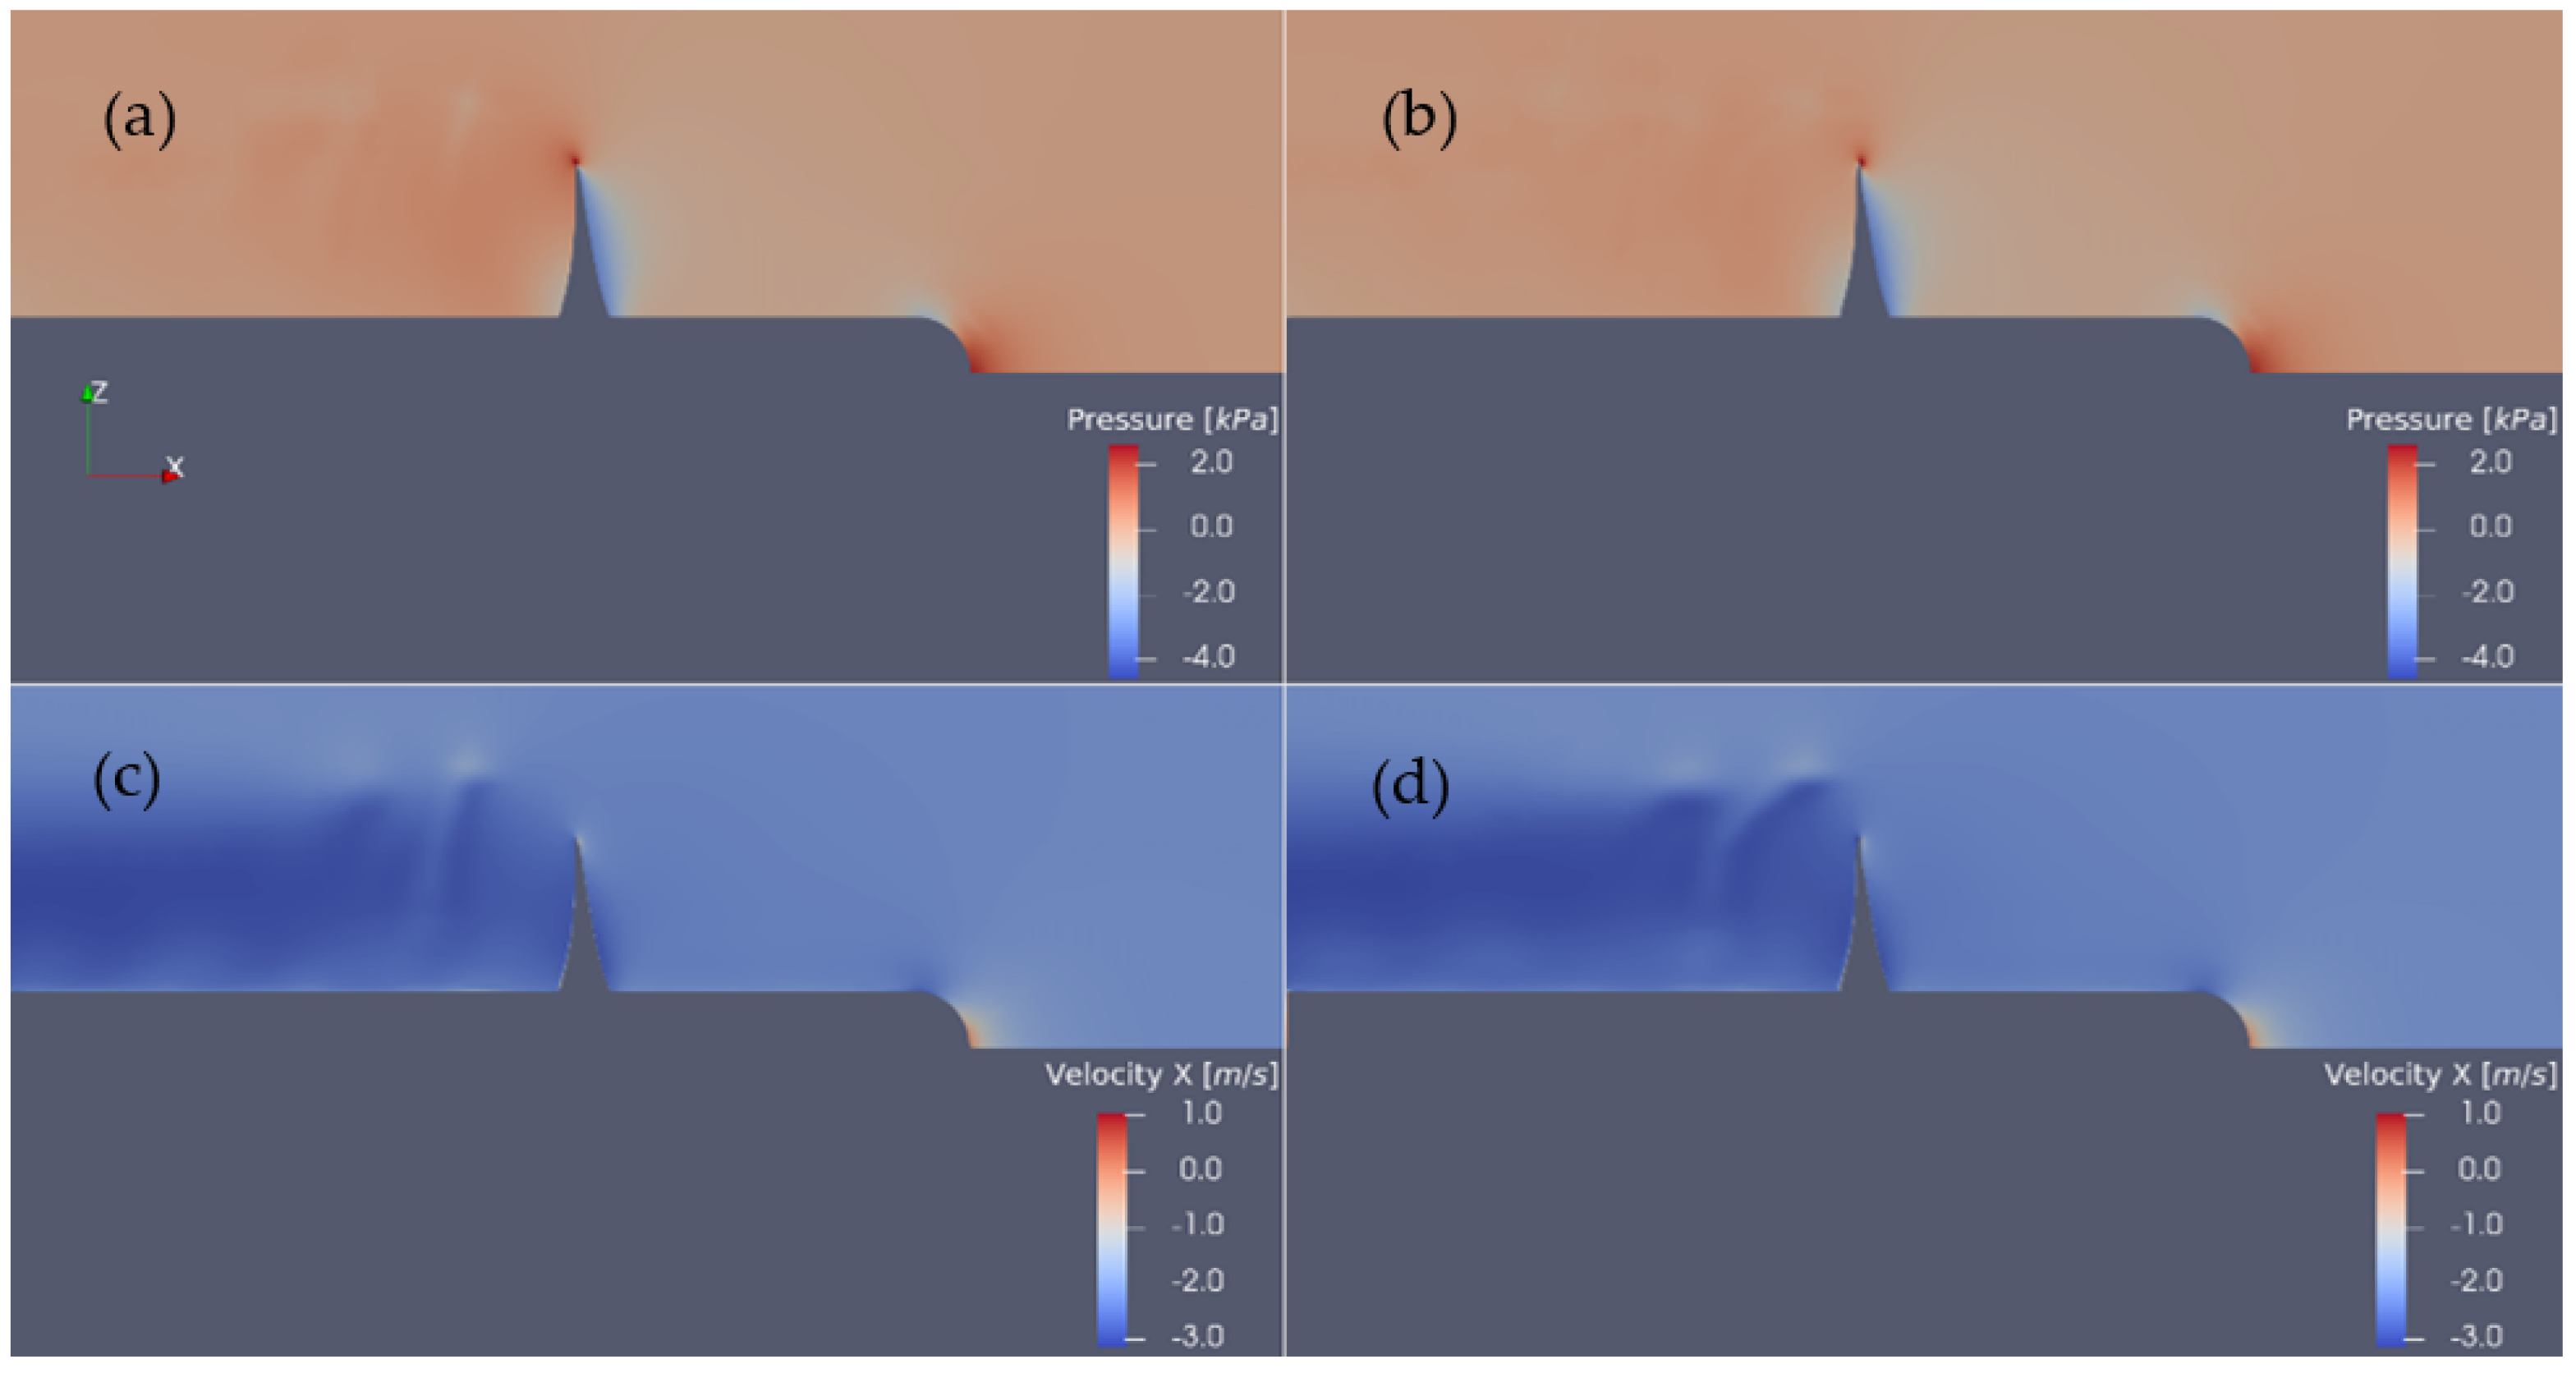
The corresponding plots concerning the initial 4382 skewed propeller geometry and the modified one are presented in Figure 10 and Figure 12. However, we notice that the differences concerning the added rake effect are not so obvious in the case of the skewed propeller 4382 in Figure 10, since in this case, the skew-induced rake influences the geometric modification of tip geometry. The comparison of the pressure contour for the initial and the tip-rake-modified skewed propellers on the cylindrical cut at radius r/R = 0.95 is illustrated in Figure 12. The difference concerning the locations of the hydrofoil is evident when comparing Figure 11 and Figure 12. A common observation from the results is that the modified part of the blade tip geometry increases the pressure at the stagnation point. This is justified since one of the parameters that is adjusted in the optimization process is the camber distribution along the radial increase.
More details concerning the velocity streamlines on the blade for the normal and skewed blade geometries are presented in Figure 13 and Figure 14, respectively, as obtained by the post-processing of the CFD results.
Furthermore, the pressure comparison between the original and the optimized propellers can be found in Figure 15, where the pressure coefficient is plotted over a normalized chord parameterization for four different cylindrical sections, namely r/R = {0.3, 0.5, 0.7, 0.9}. The normalization of pressure is performed using 1 / 2 ρ V 2 . By comparing the pressure coefficients, we can observe how the loading of the propeller changes in various radial positions. More specifically, at r/R = 0.3 and for both propellers, there is a difference in the pressure coefficient values at the TE indicating a global change in the flow field of the blade, which is also evident in Figure 13 and Figure 14. At r/R = 0.5, there is a drop at the pressure side which is mitigated by the higher velocities in the suction side. Lastly, at r/R = 0.7–0.9, it is clear that the decrease in the suction pressure contributes to a gain in the total sectional force and especially lift. In this setting, as suggested by Figure 16, for the modified 4381, the total thrust will be reduced, whereas for the modified 4382 propeller, the thrust is expected to increase.
In addition, Figure 16 contains the pressure coefficient envelope for the 4381 study case at radial position r = 0.7 R, as obtained using viscous-CFD and the calibrated VLM in terms of the reference and the modified geometries. The VLM runs for this case are based on a mesh of (11 × 6) and the coefficients are shown in Table 6 that follows, which contains a summary of the VLM friction-drag and leading-edge suction force coefficients obtained as a best fit to the CFD data. Typically, VLM post-processing is focused on the average velocity and the pressure difference; however, this shows that in general, the VLM are capable of producing additional results concerning the pressure coefficient on the upper and lower sides that can further facilitate the design and optimization of propeller blades.
Next, in Table 7, the relative changes between the reference and the modified propeller geometries in terms of the open water curve coefficients calculated using vortex-lattice and MaPFlow are presented. The ideal-flow model over predicts the gain in efficiency as expected. This over prediction, however, is expected to be less for the full-scale propeller geometry where Reynold’s number is significantly larger. The reduction in thrust is also more significant in CFD simulations, suggesting that careful examination of the modified propeller geometry needs to be performed before the optimal geometry is considered an alternative to the reference geometry for the design advance coefficient.
Generally, for the 4381-modified propeller geometry, a performance enhancement of 1.1% is accomplished based on the CFD results, indicating that the vortex-lattice can facilitate the optimization study of a propeller model in the preliminary phase. Similarly, for the case of the skewed propeller, an efficiency gain of 0.5% is predicted from the CFD results. In practical applications, the thrust coefficient needs to be kept very close to the design value. Particularly, the zero-skew 4381-modified geometry shows the 1.12% performance gain with a 4% and 5% decrease in the thrust and torque coefficient, respectively. Regarding the skewed propeller model, the modified 4382 shows a 0.5% efficiency gain based on viscous simulations which also corresponds to a 2.7% and 2.3% increase in the thrust and torque coefficients, respectively. It must be noted that contrary to the reduction in KT and KQ for 4382 obtained by using VLM, an increase in both coefficients is observed using CFD. This observation relies on the fact that VLM is calibrated using the experimental data of the original geometry.
The VLM results show similar trends with CFD in terms of efficiency gain, even though the ideal-flow model over predicts the efficiency gain and under predicts the reduction in thrust and torque. The overprediction of efficiency gain is expected, since ideal-flow models neglect viscous effects. It is evident from the findings that special attention needs to be paid to the optimization of skewed propellers since viscous effects are expected to be more significant. Especially for CFD, closer examination of the sectional thrust (normal in the propeller plane) and the circumferential force (tangent to the propeller plane) which affects torque can also be used to relate the final results with the details of the flow.
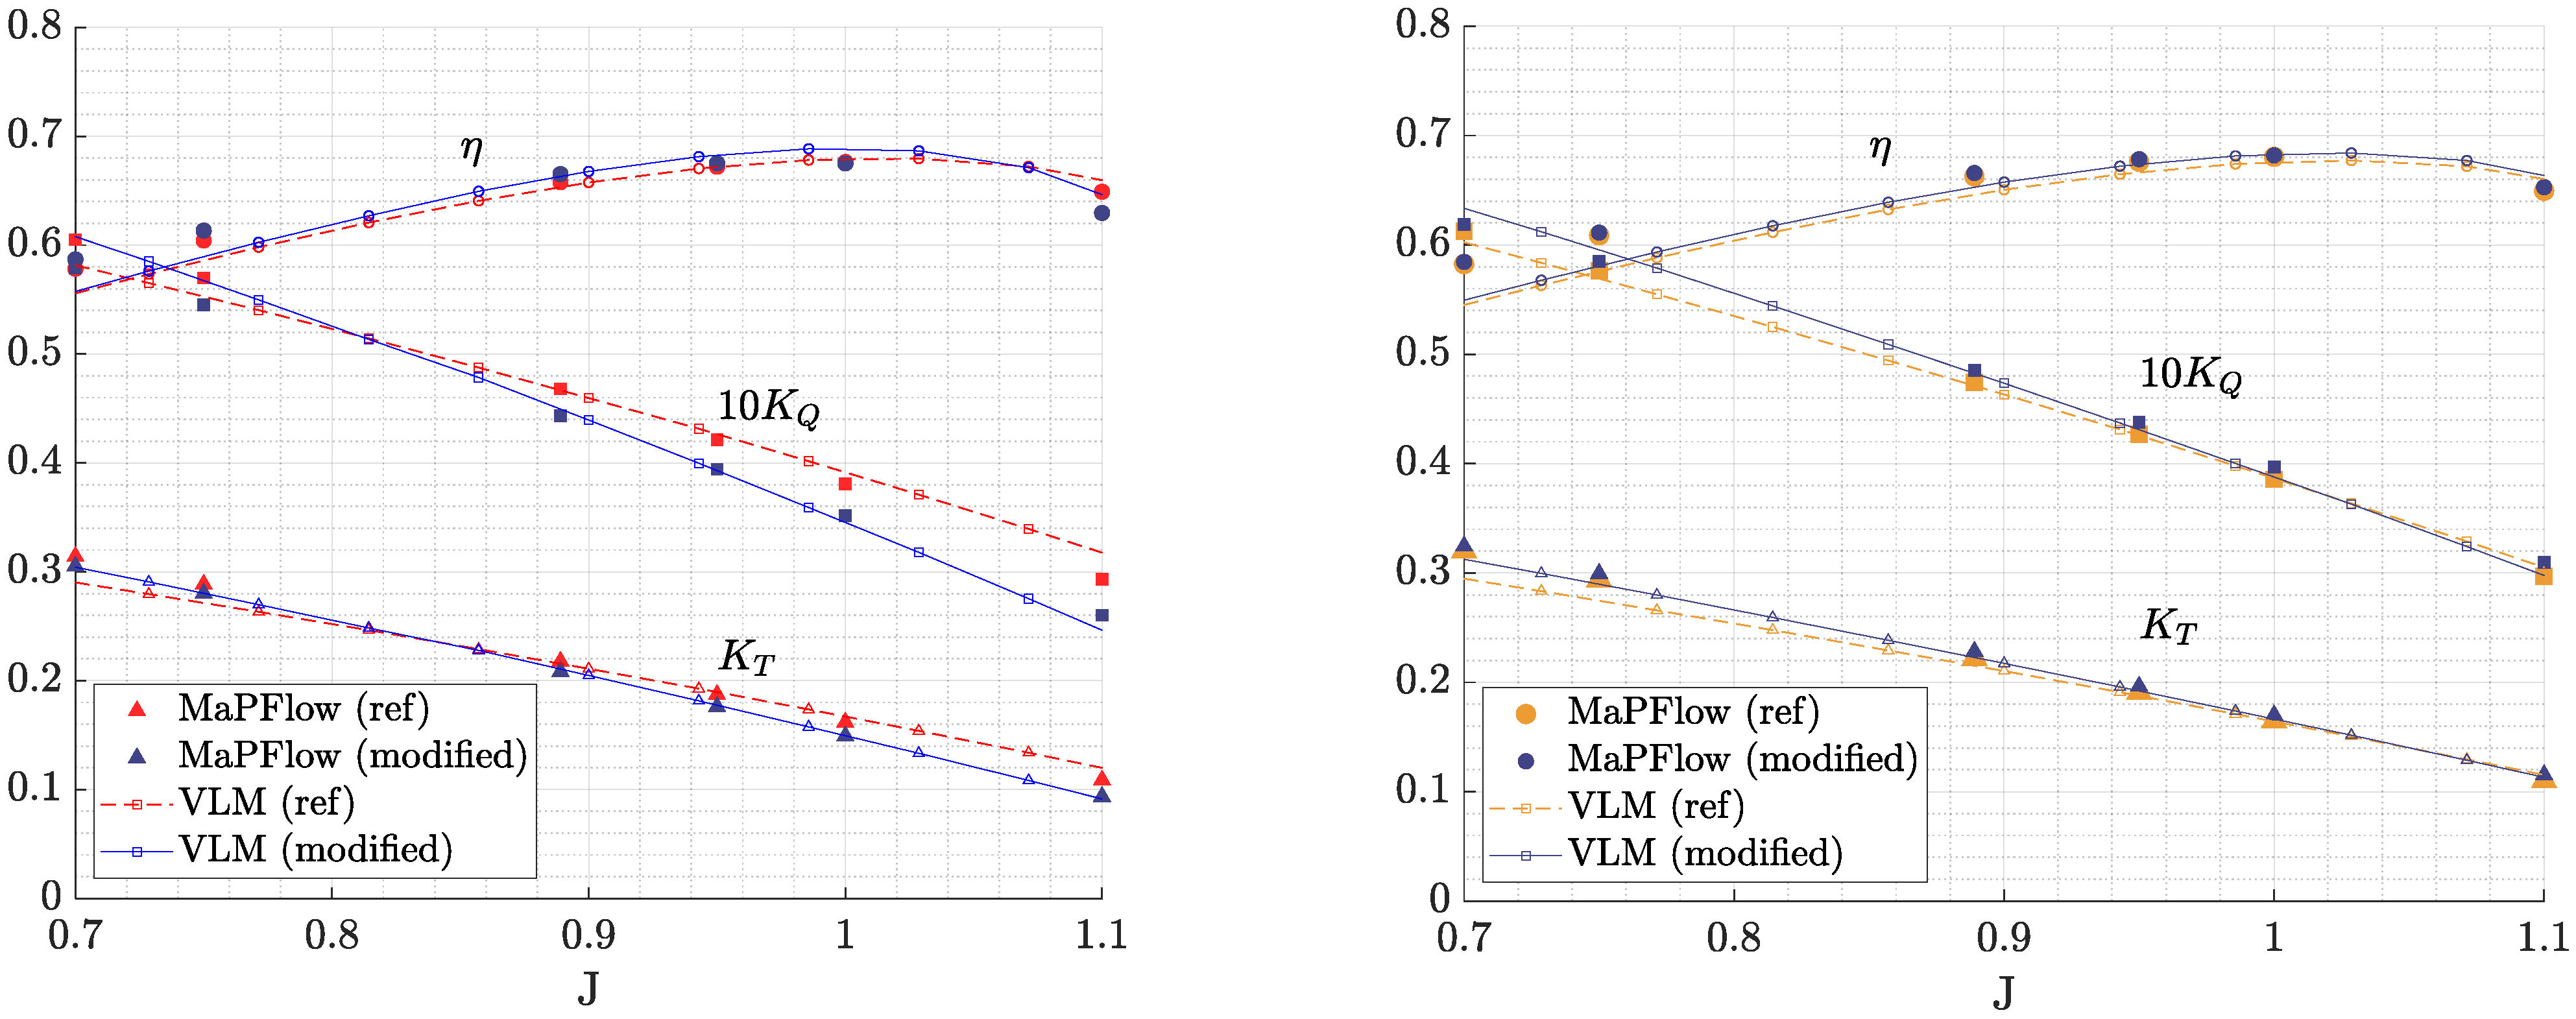
A comparison between the reference and the modified propeller open water curves obtained with the calibrated VLM and the viscous-CFD results is presented in Figure 17. In Figure 17, the MaPFlow results are included with symbols, i.e., triangles for the thrust coefficient, squares for the moment coefficient, and circles for the efficiency. The cost-effectiveness of the VLM allows for a denser grid for the open water curves and at a fraction of the computational cost required for the viscous-CFD.
It is important to note that the optimization studies conducted with the VLM, consider a zero friction-drag coefficient, with results provided in Table 7. Moreover, if CFD-calibrated coefficients are to be used for open water curve prediction, as shown in Figure 17 with the coefficients from Table 6, then VLM shows similar trends with the viscous-CFD, as expected for design advance ratios near the design point J = 0.889. It is evident from Figure 17 that for the case of the 4381 propeller, the proposed geometry modifications at advance coefficients between 0.8 and 1.0 lead to a thrust reduction, whereas for the 4382 case study at the same range of advance coefficients geometry modifications increase both thrust and the moment as predicted from CFD. This distinction, between the VLM settings during optimization and after calibration using CFD, is important for the present analysis.
However, at advance coefficients outside the range of J = {0.8–1.0} some numerical discrepancies are observed between the calibrated-VLM and the viscous-CFD predictions, which can be attributed to the limitations of the VLM in terms of predicting effects of large angles of attack and flow separation phenomena on open-water performance. This is evident for the efficiency predictions at advance coefficients greater than 1.0 for the study case of 4381 in Figure 17 (left). Moreover, some discrepancies are also evident for the thrust coefficient predictions at advance ratios greater than 1.0 for the 4382 study case at Figure 17 (right).
To sum up, the calibrated-VLM is capable of providing a good compromise between accuracy and computational cost in terms of open-water performance predictions at advance coefficients near the propeller design point.

5. Conclusions

In this work, the effects of blade tip-rake reformation on the open water performance of marine propellers are investigated using VLM and CFD. A blade geometry parametrization with multiple dofs that targets the tip-rake, pitch, and maximum camber distributions is introduced. Two gradient-based optimization studies are performed using the aforementioned blade parametrization and a cost-effective vortex-lattice method with the NSRDC 4381-82 propeller models as reference blade geometries. The proposed methodology explores the idea of using a cost-effective solver and a simple blade parametrization to produce modified propeller geometries with enhanced efficiency. A viscous RANS-CFD solver is used to verify whether the modified propeller geometries correspond to the predicted efficiency gain and also for calibrating the vortex-lattice leading-edge suction force and friction drag coefficients. Both numerical tools are validated via comparisons against the experimental data found in the literature for un-skewed and skewed propellers.
Gains in efficiency of the order of 1–2% are found that could be further increased by means of the enhanced geometrical model, which is essential for the satisfaction of the thrust constraint with a lower tolerance depending on the application. Useful improvements regarding the present methodology include (i) the use of potential-based formulations that also take into account the thickness effects, (ii) the further involvement of CFD in the optimization process, and (iii) the exploitation of additional geometrical parameters as design variables, which will be considered in future extensions. Also, it is important to note that cavitation phenomena need to be taken into consideration in order to avoid negative effects on efficiency, acoustic noise, and structural damage, and future work will also focus on this direction.
Finally, the present methodology after the above extensions could support the design of new propellers with improved efficiency based on the demands of the current IMO regulations and EU Green Deal directives for a more efficient and environmentally friendly maritime industry.

Author Contributions

Conceptualization, D.A., S.Z, G.P. and K.B.; methodology, K.B.; software, G.P. and K.B.; validation, D.A., S.Z. and G.P.; writing—original draft preparation, D.A. and S.Z.; writing—review and editing, G.P. and K.B.; supervision, G.P. and K.B. All authors have read and agreed to the published version of the manuscript.

Funding

This research received no external funding.

Institutional Review Board Statement

Not applicable.

Informed Consent Statement

Not applicable.

Data Availability Statement

Data are contained within the article.

Acknowledgments

The present work was supported by the Retrofit55 project and received funding from the European Union’s Horizon Europe research and innovation program under the grant agreement No 101096068. The opinions expressed in this document reflect only the author’s view and in no way reflect the European Commission’s opinions. The European Commission is not responsible for any use that may be made of the information it contains. The doctoral studies of D. Anevlavi are currently supported by the Special Account for Research Funding (E.L.K.E.) of National Technical University of Athens (N.T.U.A.), operating in accordance with Law 4485/17 and National and European Community Law. Concerning CFD, the mesh production is performed with the help of the ANSA pre-processor, a product of BETA CAE systems, and the post-processing was performed with Paraview, which is an open-source product. This work was supported by the computational time granted from the Greek Research & Technology Network (GRNET) in the National HPC facility—ARIS.

Conflicts of Interest

The authors declare no conflict of interest.

Appendix A. Propeller Geometries

Table A1. Propeller model 4381, data from [13,29].
r/Rc/DP/Dtmax/cfmax/cθsXR/R
0.20000.17401.33200.24940.035100
0.25000.20201.33800.19600.036900
0.30000.22901.34500.15620.036800
0.40000.27501.35800.10680.034800
0.50000.31201.33600.07680.030700
0.60000.33701.28000.05660.024500
0.70000.34701.21000.04210.019100
0.80000.33401.13700.03140.014800
0.90000.28001.06600.02390.012300
0.95000.21001.03100.02290.012800
1.00000.01000.99500.01600.012300
Table A2. Modified propeller model 4381. Positive rake values (suction side).
r/Rc/D(P/D)tmax/c(fmax/c)θs(XR/R)
0.20000.17401.31200.24940.034200
0.25000.20201.31730.19600.035800
0.30000.22901.32440.15620.035600
0.40000.27501.33690.10680.033600
0.50000.31201.31350.07680.029500
0.60000.33701.25680.05660.023400
0.70000.34701.18690.04210.018200
0.80000.33401.11390.03140.014100.0213
0.90000.28001.04540.02390.011900.1010
0.95000.21001.01220.02290.012300.1628
1.00000.01000.97950.01600.011900.2392
Table A3. Propeller model 4382, data from [13,29].
r/Rc/DP/Dtmax/cfmax/cθsXR/R
0.20000.17401.45500.24940.043000
0.25000.20201.44400.19600.03952.32800
0.30000.22901.43300.15620.03704.65500
0.40000.27501.41200.10680.03449.36300
0.50000.31201.36100.07680.030513.94800
0.60000.33701.28500.05660.024718.37800
0.70000.34701.20000.04210.019922.74700
0.80000.33401.11200.03140.016127.14500
0.90000.28001.02700.02390.013431.57500
0.95000.21000.98500.02290.014033.78800
1.00000.01000.94200.01600.013436.0000
Table A4. Modified propeller model 4382. Positive rake values (suction side).
r/Rc/DP/Dtmax/cfmax/cθsXR/R
0.20000.17401.45390.24940.042600
0.25000.20201.44390.19600.03952.32800
0.30000.22901.42930.15620.03734.65500
0.40000.27501.39450.10680.03619.36300
0.50000.31201.33950.07680.032213.94800
0.60000.33701.26310.05660.026018.37800
0.70000.34701.17830.04210.020922.74700.0027
0.80000.33401.09020.03140.016827.14500.0432
0.90000.28001.00800.02390.014231.57500.1216
0.95000.21000.96800.02290.014933.78800.1751
1.00000.01000.92900.01600.014336.0000.2379

References

  1. Spinelli, F.; Mancini, S.; Vitiello, L.; Bilandi, R.; Carlini, M.D. Shipping Decarbonization: An Overview of the Different Stern Hydrodynamic Energy Saving Devices. J. Mar. Sci. Eng. 2022, 10, 574. [Google Scholar] [CrossRef]
  2. Kinnas, S.A.; Cha, K.; Kim, S. Comprehensive design method for open or ducted propellers for underwater vehicles. In Proceedings of the SNAME Maritime Convention, Providence, RI, USA, 27–29 October 2021. [Google Scholar]
  3. Carlton, J. Marine Propellers and Propulsion; Butterworth-Heinemann: Oxford, UK; Elsevier: Oxford, UK, 2007. [Google Scholar]
  4. Bertetta, D.; Brizzolara, S.; Canepa, E.; Gaggero, S.; Viviani, M. Efd and cfd characterization of a clt propeller. Int. J. Rotational Mach. 2012, 2012, 348939. [Google Scholar] [CrossRef]
  5. Reneger, P. Hull-Propeller Interaction and Its Effects on Propeller Cavitation. Ph.D. Thesis, Technical University of Denmark, Kgs, Lyngby, Denmark, 2016. [Google Scholar]
  6. Gaggero, S.; Brizzolara, S. Endplate Effect Propellers: A Numerical Overview. In Proceedings of the XIV Congress of the International Maritime Association of the Mediterranean, IMAM, Genova, Italy, 13–16 September 2011. [Google Scholar]
  7. Posa, A. Dependence of tip and hub vortices shed by a propeller with winglets on its load conditions. Phys. Fluids 2022, 34, 105107. [Google Scholar] [CrossRef]
  8. Kim, S.; Kinnas, S.A. Prediction of cavitating performance of a tip loaded propeller and its induced hull pressures. Ocean. Eng. 2022, 229, 108961. [Google Scholar] [CrossRef]
  9. Zhu, W.; Gao, H. A Numerical Investigation of a Winglet-Propeller using an LES Model. J. Mar. Sci. Eng. 2019, 7, 333. [Google Scholar] [CrossRef]
  10. Gaggero, S.; Gonzalez-Adalid, J.; Sobrino, M.R. Design of contracted and tip loaded propeller by using boundary element methods and optimization algorithms. Appl. Ocean. Res. 2016, 55, 102–129. [Google Scholar] [CrossRef]
  11. Andersen, P.; Friesch, J.; Kappel, J.J.; Lundegaard, L.; Patience, G. Development of a marine propeller with nonplanar lifting surfaces. Mar. Technol. SNAME News 2005, 42, 145–158. [Google Scholar] [CrossRef]
  12. Chen, C.-W.; Chen, X.-P.; Zhou, Z.-Y.; Chen, L.-W.; Zhang, C.; Zheng, T.-J.; Li, H.-M. Effect of tip rake distribution on the hydrodynamic performance of non-planar kappel propeller. J. Mar. Sci. Eng. 2023, 11, 748. [Google Scholar] [CrossRef]
  13. Brizzolara, S.; Villa, D.; Gaggero, S. A systematic comparison between RANS and panel methods for propeller analysis. In Proceedings of the 8th International Conference on Hydrodynamics, Nantes, France, 30 September–3 October 2008. [Google Scholar]
  14. Lee, J.K.C. Prediction of steady and unsteady performance of marine propellers by numerical lifting surface theory. Trans. Soc. Nav. Arch. Mar. Eng. SNAME 1978, 86, 218–256. [Google Scholar]
  15. Kerwin, J.; Greely, D. Numerical methods for propeller design and analysis in steady flows. Trans. SNAME 1982, 90, 415–453. [Google Scholar]
  16. Kinnas, S. Theory and numerical methods of hydrodynamic analysis of marine propellers. In Advances in Marine Hydrodynamics; Okhusu, M., Ed.; Computational Mechanics Publisher: Berlin/Heidelberg, Germany, 1996. [Google Scholar]
  17. Belibassakis, K.; Politis, G. A non-linear velocity based Boundary Element Method for the analysis of marine propellers in unsteady flow. Int. Shipbuild. Prog. 1998, 45, 93–133. [Google Scholar]
  18. Fine, N.; Kinnas, S. A boundary element method for the analysis of the flow around 3-D cavitating hydrofoils. J. Ship Res. 1993, 37, 213–224. [Google Scholar] [CrossRef]
  19. Anderson, P. Anderson, P. A Comparative study of conventional and tip-fin propeller performance. In Twenty-First Symposium on Naval Hydrodynamics; The National Academy Press: Washington, DC, USA, 1997. [Google Scholar]
  20. Kampolis, C.; Giannakolgou, K.C. A multilevel approach to single- and multiobjective aerodynamic optimization. Comput. Methods Appl. Mech. Eng. 2008, 197, 2963–2975. [Google Scholar] [CrossRef]
  21. Gaggero, S.; Vernengo, G.; Villa, D.; Bonfiglio, L. A reduced order approach for optimal design of efficient marine propellers. Ship Offshore Struct. 2020, 15, 200–214. [Google Scholar] [CrossRef]
  22. Kang, J.-W.; Shin, D.K.A.H. Study on the propulsion performance of varying rake distribution at the propeller tip. J. Mar. Sci. Eng. 2019, 7, 386. [Google Scholar] [CrossRef]
  23. Maghareh, M.; Ghassemi, H. Propeller Efficiency Enhancement by the Blade’s Tip Reformation. Am. J. Mech. Eng. 2017, 5, 70–75. [Google Scholar] [CrossRef]
  24. Ghommem, M.; Hajj, M.R.; Mook, D.T.; Stanford, B.K.; Beran, P.S.; Snyder, R.D.; Watson, L.T. Global optimization of actively morphing flapping wings. J. Fluids Struct. 2012, 33, 210–228. [Google Scholar] [CrossRef]
  25. Olsen, A.S. Optimization of Propellers Using the Vortex Lattice Method. Ph.D. Thesis, Department of Mechanical Engineering Technical University Denmark (DTU), Kongens Lyngby, Denmark, 2001. [Google Scholar]
  26. Lee, C.; Choi, Y.; Ahn, B.; Shin, M.; Jang, H. Performance optimization of marine propellers. Int. J. Nav. Arch. Oc. Engng. 2011, 2, 211–216. [Google Scholar] [CrossRef]
  27. Ntouras, D.; Papadakis, G.; Liarokapis, D.; Trachanas, G.; Tsabiras, G. Numerical and experimental investigation of a model scaled propeller. In Trends in Maritime Technology and Engineering; CRC Press: Boca Raton, FL, USA, 2022; Volume 1, pp. 409–415. [Google Scholar]
  28. Ntouras, D.; Papadakis, G. A coupled artificial compressibility method for free surface flows. J. Mar. Sci. Eng. 2020, 8, 590. [Google Scholar] [CrossRef]
  29. Boswell, R. Design, Cavitation Performance, and Open-Water Performance of a Series of Research Skewed Propellers. NSRDC Report 3339. 1971. Available online: https://resolver.tudelft.nl/uuid:11297534-6a96-485c-9413-1ad5e6599dcb (accessed on 9 November 2023).
  30. Katz, J.; Plotkin, A. Low-Speed Aerodynamics; Cambridge University Press: Cambridge, UK, 2001. [Google Scholar]
  31. Belibassakis, K.; Filippas, E. Ship propulsion in waves by actively controlled flapping foils. Appl. Ocean. Res. 2015, 52, 1–11. [Google Scholar] [CrossRef]
  32. Menter, F.R. Two-equation eddy-viscosity turbulence models for engineering applications. AIAA J. 1994, 32, 1598–1605. [Google Scholar] [CrossRef]
Figure 1. (a) Vortex element mesh on propeller blades with positive tip−rake (towards suction side) and corresponding trailing vortex wake mesh. The trailing edge of the blades is shown by using black lines. (b) Schematic representation of the vortex−element mesh and control points on the mean camber surface.
Jmse 11 02179 g001
Figure 2. The basic computational setup used for the CFD simulation. Typically, one blade is modelled with a periodic boundary condition.
Jmse 11 02179 g002
Figure 3. Tip-rake 2-dof parametric model, based on a linear and quadratic distribution.
Jmse 11 02179 g003
Figure 4. (a) Pitch and (b) maximum camber distributions, using 1-dof parametrization and modification based on a B-Spline interpolation. Active control points (for r/R > 0.5) are highlighted with red squares.
Jmse 11 02179 g004
Figure 5. Vortex−ring element mesh 15 × 8 with cosine−spacing spanwise for propeller 4381. (a) 3D view, (b) side view, and (c) plan view.
Jmse 11 02179 g005
Figure 6. Open water curves for 4381. Comparison between experimental data [29], vortex-lattice results with C D r a g = 0.0045, C L E = 0.93, and MaPFlow (dashed line). Symbol characterization: thrust coefficient (triangles), moment coefficient (squares), and efficiency (circles).
Jmse 11 02179 g006
Figure 7. Open water curves for 4382. Comparison between experimental data [29], vortex-lattice results, with C D r a g = 0.0050, C L E = 0.90, and MaPFlow (dashed line). Symbol characterization: thrust coefficient (triangles), moment coefficient (squares), and efficiency (circles).
Jmse 11 02179 g007
Figure 8. Post−processing vortex-lattice results for (a) 4381 and (b) 4382. Pressure difference on the mean camber blade surface with calculated mean velocity for J = 0.889.
Jmse 11 02179 g008
Figure 9. xy−plane view of the flow domain for 4381 by means of CFD simulations at J = 0.889: (a,b) pressure contour (in kPa), (c,d) x−component of the velocity (in m/s), (a,c) original geometry (zero rake), and (b,d) modified geometry (positive rake close to the tip).
Jmse 11 02179 g009
Figure 10. xy−plane view of the flow domain for propeller 4382 by means of CFD simulations at J = 0.889: (a,b) pressure contour (in kPa), (c,d) x−component of the velocity (in m/s), (a,c) original geometry (zero rake), and (b,d) modified geometry (positive rake close to the tip).
Jmse 11 02179 g010
Figure 11. Pressure contour (in kPa) for 4381 from CFD simulations at J = 0.889 on a cylindrical section at 95% of the propeller tip radius: (a) original geometry (zero rake), and (b) modified geometry (positive rake close to the tip).
Jmse 11 02179 g011
Figure 12. Pressure contour (in kPa) for propeller 4382 by means of CFD simulations at J = 0.889 on a cylindrical section at 95% of the propeller tip radius: (a) original geometry (zero rake), and (b) modified geometry (positive rake close to the tip).
Jmse 11 02179 g012
Figure 13. Pressure contour plot (in kPa) on the suction side and stream lines based on CFD results for propeller model 4381, operating at J = 0.889: (a) reference and (b) tip-rake-modified blade geometry.
Jmse 11 02179 g013
Figure 14. Pressure contour plot (in kPa) on the suction side and streamlines based on CFD results for the skewed propeller model 4382, operating at J = 0.889: (a) reference and (b) tip-rake-modified blade geometry.
Jmse 11 02179 g014
Figure 15. Calculated pressure coefficient (−Cp) at four blade sections at r/R = 0.3, 0.5, 0.7, 0.9, between initial (dash–dot lines) and tip-rake-modified (solid lines) for (left) 4381 and (right) 4382 propeller models. In the horizontal axis, 0.0 indicates the position of the leading edge.
Jmse 11 02179 g015
Figure 16. Comparison between the pressure coefficient (−Cp) distributions obtained using viscous-CFD and VLM for the 4381 reference and modified propellers for the radial position r/R = 0.7.
Jmse 11 02179 g016
Figure 17. Comparison between the reference and modified propeller open water curves obtained using VLM and CFD for 4381 [left] and 4382 [right] propeller models.
Jmse 11 02179 g017
Table 1. Design variable bounds (D: propeller diameter).
IDDescriptionLower BoundUpper Bound
x1Rake transition point 0.300.90
x2Maximum rake (Xr/R)−0.12D/R0.12D/R
x3Pitch proportional coeff.0.951.05
x4Max. camber proportional coeff.0.851.25
Table 2. Vortex-lattice model mesh sensitivity for 4381 at design J = 0.889.
Grid Mesh Sizes. Diff% Compared to Finer Grid Results
Exp.data(11 × 6)(13 × 7)(15 × 8)(20 × 10)(30 × 15)(40 × 20)
KT0.2084.393.901.950.9700.00-
10 KQ0.4454.353.892.280.91−0.22-
η0.661−0.301−0.301−0.301−0.151−0.151-
Table 3. MaPFlow: 4381 mesh sensitivity at design advance ratio with respect to dense mesh.
Cells (Million)Err KT (%)Err KQ (%)
Coarse2.34.73.42
Mid7.50.721.127
Dense12.7--
Table 4. MaPFlow: 4381 mesh sensitivity at design advance ratio with respect to experiments.
Cells (Million)Err KT (%)Err KQ (%)
Coarse2.37.0110.08
Mid7.55.007.19
Dense12.73.906.40
Table 5. Optimization results. Positive rake (suction side rake).
IDDescription43814382
x1Rake transition point 0.71360.6430
x2Maximum rake (Xr/R)0.2397 0.2414
x3Pitch proportional coeff.0.98450.9862
x4Max. camber proportional coeff.0.96891.0635
Active control pointsallr/R > 0.5
Table 6. Calibrated VLM coefficients using MaPFlow simulations.
43814382
ReferenceModifiedReferenceModified
C D r a g 0.00550.00370.00540.0041
C L E 0.900.970.890.97
Table 7. Modified propeller performance at J = 0.889.
43814382
VLMMaPFlowVLMMaPFlow
dKT (%)−3.228−4.265−3.4782.787
dKQ (%)−3.989−5.326−4.6372.308
dη (%)1.8571.1221.2160.468
Disclaimer/Publisher’s Note: The statements, opinions and data contained in all publications are solely those of the individual author(s) and contributor(s) and not of MDPI and/or the editor(s). MDPI and/or the editor(s) disclaim responsibility for any injury to people or property resulting from any ideas, methods, instructions or products referred to in the content.