Article

Effect of Propeller Face Camber Ratio on the Reduction of Fuel Consumption

1
Marine, Offshore and Subsea Technology (MOST) Group, Mechanical Engineering and Marine Technology, School of Engineering, Newcastle University, Newcastle Upon Tyne NE1 7RU, UK
2
Department of Naval Architecture and Marine Engineering, Faculty of Engineering, Alexandria University, Alexandria 21544, Egypt
*
Author to whom correspondence should be addressed.
J. Mar. Sci. Eng. 2024, 12(12), 2225; https://doi.org/10.3390/jmse12122225
Submission received: 15 November 2024 / Revised: 28 November 2024 / Accepted: 3 December 2024 / Published: 4 December 2024
(This article belongs to the Special Issue Advances in Innovative Solutions for Ship Energy Efficiency)

Abstract

:
This paper presents the effect of the face camber ratio (FCR) on propeller performance, cavitation, and fuel consumption of a bulk carrier in calm water. First, using a developed propeller optimization model coupling a ship performance prediction tool (NavCad) and a nonlinear optimizer in MATLAB, an optimized propeller design at the optimal engine operating point with minimum fuel consumption is selected. This optimized propeller demonstrates superior fuel efficiency compared to the one selected by using the traditional selection methods that prioritize only higher propeller efficiency. Afterward, the FCR is applied to the propeller geometry to evaluate the effect on propeller performance. The open water curves of propellers with different FCRs ranging from 0% to 1.5% are computed based on empirical formulas and computational fluid dynamics (CFD) simulations. Between the two techniques, a good agreement is noted in verifying the predictions. Then, the open water curves from CFD models are implemented into NavCad to evaluate the overall hydrodynamic performance of the propeller at the design point in terms of efficiency, quantify reductions in fuel consumption, and analyze changes in cavitation and noise criteria. The computed results show a reduction in fuel consumption by 3% with a higher FCR. This work offers a preliminary evaluation of propeller performance-based FCR and shows its benefits. This technique offers a promising solution for improving the energy efficiency of the ship and lowering the level of fuel consumption and exhaust emissions.

1. Introduction

Nowadays, finding effective solutions to reduce fuel consumption and exhaust emissions from marine vessels is crucial to comply with stringent regulations imposed by the International Maritime Organization (IMO) and its International Convention for the Prevention of Pollution from Ships (MARPOL) [1]. The main objective is to enhance the energy efficiency of ships, ensuring they use the lowest amount of fuel to achieve consistent speeds. Ship designers focus on improving the performance of each ship component to achieve cumulative improvements in energy efficiency [2,3]. According to the literature review and expert opinion, no single study provides a definitive best practice for maximizing efficiency due to numerous influencing factors that affect the final calculation of the energy efficiency of the ships [4]. These factors include the ship’s route and the weather surrounding [3,5,6,7], the voyage speed [8,9], cleaning hulls [10], and the use of energy-saving devices (ESD) [11,12,13,14]. The main effective solution, as it is directly related to carbon dioxide (CO2) emissions, is the type of fuel used with low carbon molecular to be an alternative to fossil fuels [15,16,17,18]. The propulsion system, typically consisting of a diesel engine coupled with a propeller via a propeller shaft (with or without a gearbox depending on whether the engine is a four-stroke or two-stroke), is critical in managing the ship’s operating point. Consequently, the marine propeller is a vital component in the overall system for achieving optimal performance and efficiency [19].
Different propeller shapes are generated, tested, and presented using polynomial equations to meet various marine application requirements [20]. These propeller series are characterized by the expanded blade area ratio (EAR) and pitch-to-diameter ratio (P/D), covering a broad range of operational conditions.
Typically, propeller selection via polynomial equations involves solving three variables with three equations [21]; this technique is used by propeller software, such as NavCad 2024 [22]. Additionally, some studies use the three-dimensional (3D) geometry of the propeller and integrate it into computational fluid dynamics (CFD) simulations for detailed analyses. These simulations not only evaluate propeller performance but also consider the flow around other elements like the rudder or ESDs. For instance, Nouri et al. [23] utilized CFD models coupled with an optimization model to enhance the efficiency of contra-rotating propellers (CRP) automatically by improving the propeller efficiency of the full set. Similarly, Gaggero et al. [24] applied the same technique to design propellers for fast ships, aiming to reduce cavitation. Obwogi et al. [25] demonstrated improved propulsion performance by considering rudder-bulb-fin configurations and optimizing various parameters of the overall system. Vlašić et al. [26] generated the 3D geometry with OpenProp [27] and validated CFD results against polynomial equations for broader application and design use. Bacciaglia et al. [28] employed OpenProp and particle swarm optimization (PSO) to optimize the 3D propeller geometry, accounting for detailed parameters at different propeller sections. Anevlavi et al. [29] optimized rake, pitch, and camber using CFD models, achieving a 1–2% efficiency gain compared to the base propeller.
While CFD computations provide detailed insights [30], their simulation time is significantly higher compared to using polynomial equations. Therefore, ship designers often prefer surrogate models during the preliminary stages of ship design. Gaafary et al. [31] used polynomial equations from the B-series, coupled with optimization techniques, to identify the optimal solutions for propeller performance and cavitation. The same concept has been developed by Xie [32] by considering a multi-objective optimization technique. Tadros et al. [33] utilized a local optimizer to combine fuel consumption and propeller efficiency, achieving an optimal propeller design that balances these parameters during ship operation. This methodology can also define multiple propeller designs based on varying ship speeds, aiding the ship master in reducing fuel consumption according to the design speed.
With the restrictions imposed towards achieving net-zero emissions, selecting a propeller from the standard series is insufficient; modifications are necessary to enhance performance and reduce cavitation. Cavitation, a common issue under high loading conditions and high propeller speeds, involves the formation and collapse of vapor-filled bubbles on the propeller blade surfaces, as observed in numerous experimental tests [34,35,36,37]. This phenomenon, identified by Parsons, Barnaby, and Thornycroft, leads to reduced propeller performance, noise, vibrations, and gradual blade damage. To mitigate these issues and achieve higher performance, various solutions are being explored. Key modifications include altering the blade profile using cupping techniques and adjusting the camber.
The propeller cup is recognized for its ability to enhance propeller performance. This deformation in the trailing edge, as in Figure 1, enables the propeller to operate at a higher effective pitch. Consequently, the lift force increases, delivering the necessary thrust at lower engine operating conditions and reducing cavitation [38]. The effectiveness of the propeller cup varies depending on the percentage of cupping applied, typically ranging from 0.5% to 1.5% of the propeller diameter for light and heavy cupping, respectively. This technique has been validated using CFD models, with Samsul [39] demonstrating a reduction in cavitation levels with the propeller cup compared to a standard propeller configuration.
Another technique employed to enhance propeller performance is the addition of face camber, as shown in Figure 2, which is known as “progressive pitch”. Progressive pitch entails a pitch configuration that begins lower at the leading edge and gradually increases towards the trailing edge. This modern approach offers superior performance compared to propellers with a constant pitch, where the pitch remains consistent along the entirety of the blade, from the leading edge to the trailing edge.
The face camber ratio (FCR) in a marine propeller, defined as the ratio of the maximum camber of the blade’s face to the chord length, is a crucial design parameter that influences hydrodynamic efficiency, cavitation control, and thrust generation. Optimal FCRs enhance lift while minimizing drag, thereby improving propulsion efficiency.
This contemporary design practice, akin to the propeller cup, aims to reduce cavitation by ensuring proper pressure distribution over the blade surface. A blade section with added face camber exhibits curvature on its pressure face, allowing the propeller to operate with less blade area than a flat-faced propeller, thus increasing efficiency.
Mohammad Nouri et al. [40] observed significant improvements in propeller performance and cavitation reduction with increasing camber ratios of up to 2%. Similarly, Guan et al. [41] optimized radial distributions of skew, chord length, pitch, and camber to improve propeller thrust coefficient and structural strength, noting that optimized solutions featured higher camber ratios than the originals.
From that point of view, this paper evaluates the effect of the FCR on propeller and ship performance using a simulation approach based on empirical formulas and the CFD model. Different levels of FCR are proposed to evaluate its effectiveness on ship and propeller performance. The open water curves of the proposed propellers are computed from empirical formulas and CFD models. Then, the open water curves-based CFD technique is implemented into NavCad to evaluate the operational performance of the propeller in terms of efficiency, quantify reductions in fuel consumption, and analyze changes in cavitation and noise criteria. This study aims to assist ship designers and decision-makers in considering different techniques and selecting optimal solutions for their vessels toward improving energy efficiency and achieving net-zero goals.
The remainder of this paper is organized as follows. The ship characteristics are presented in Section 2. The description of the numerical model used to perform the simulation is presented in Section 3. The computed results and the evaluation of the propeller performance are presented in Section 4. Finally, a summary of the main findings and future recommendations are presented in Section 5.

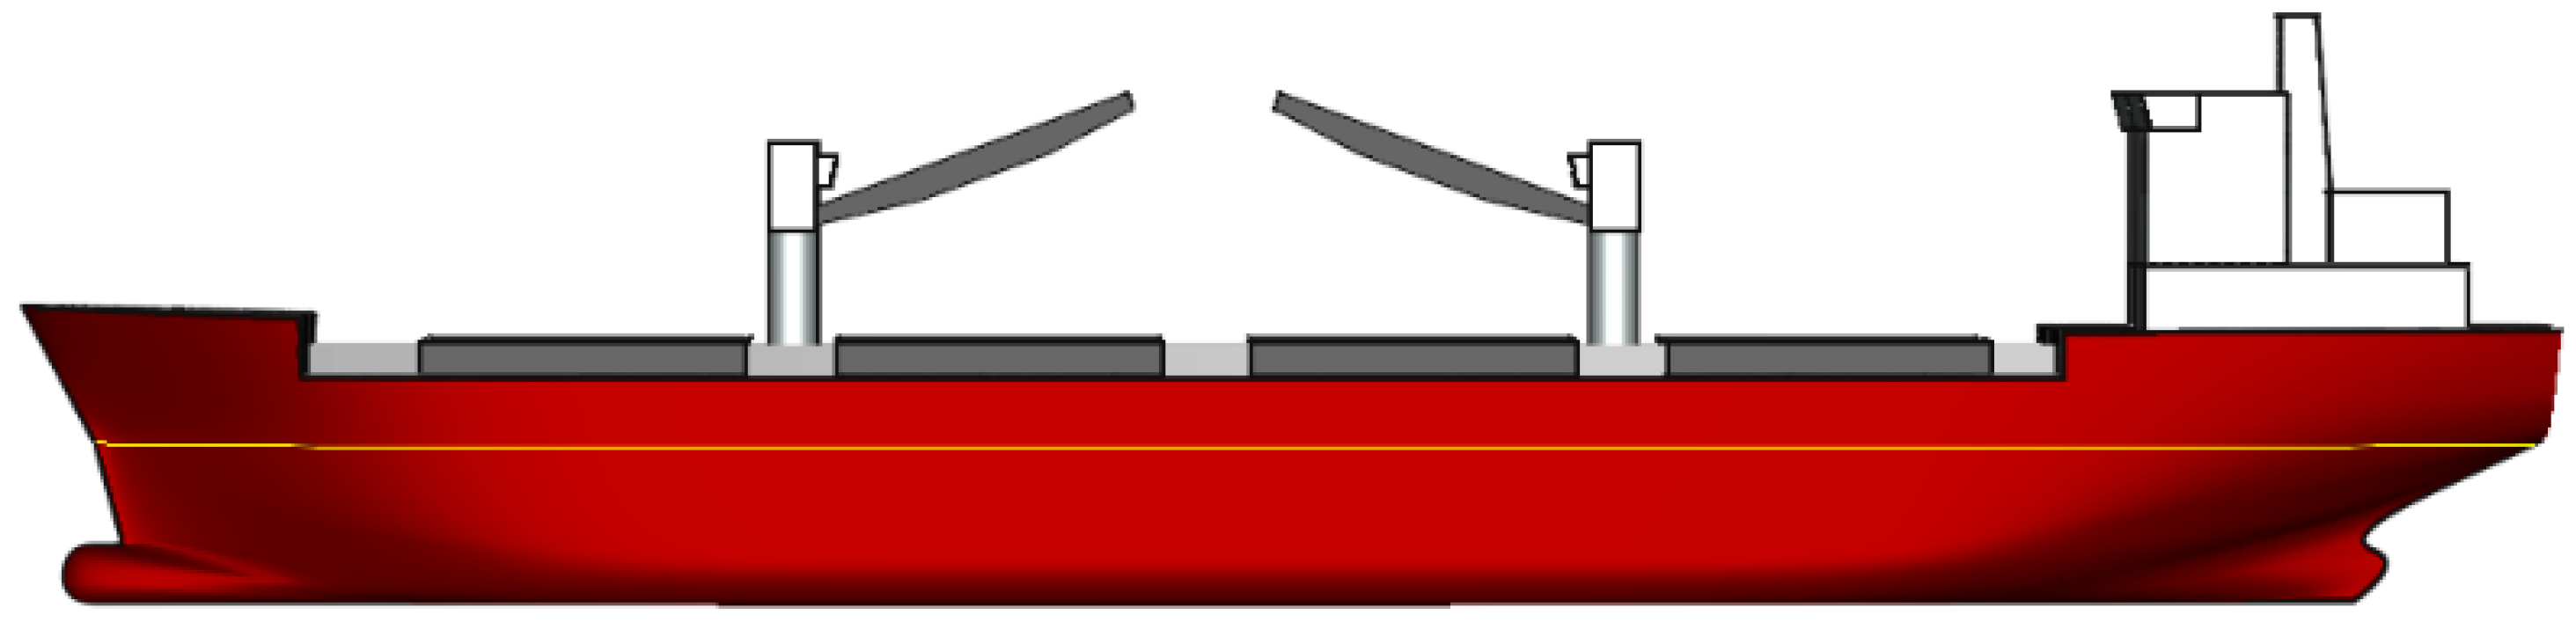
2. Characteristics of the Bulk Carrier Used in the Numerical Model

In this study, a bulk carrier with a 154 m length serves as the case study to perform the numerical simulation of the retrofit solution, as shown in Figure 3. The ship is equipped with a single-screw propulsion system and operates at a service speed of 14.5 knots. The characteristics of the ship, the installed main engine, and the attached propeller are presented in Table 1, Table 2, and Table 3, respectively.

3. Description of the Numerical Model

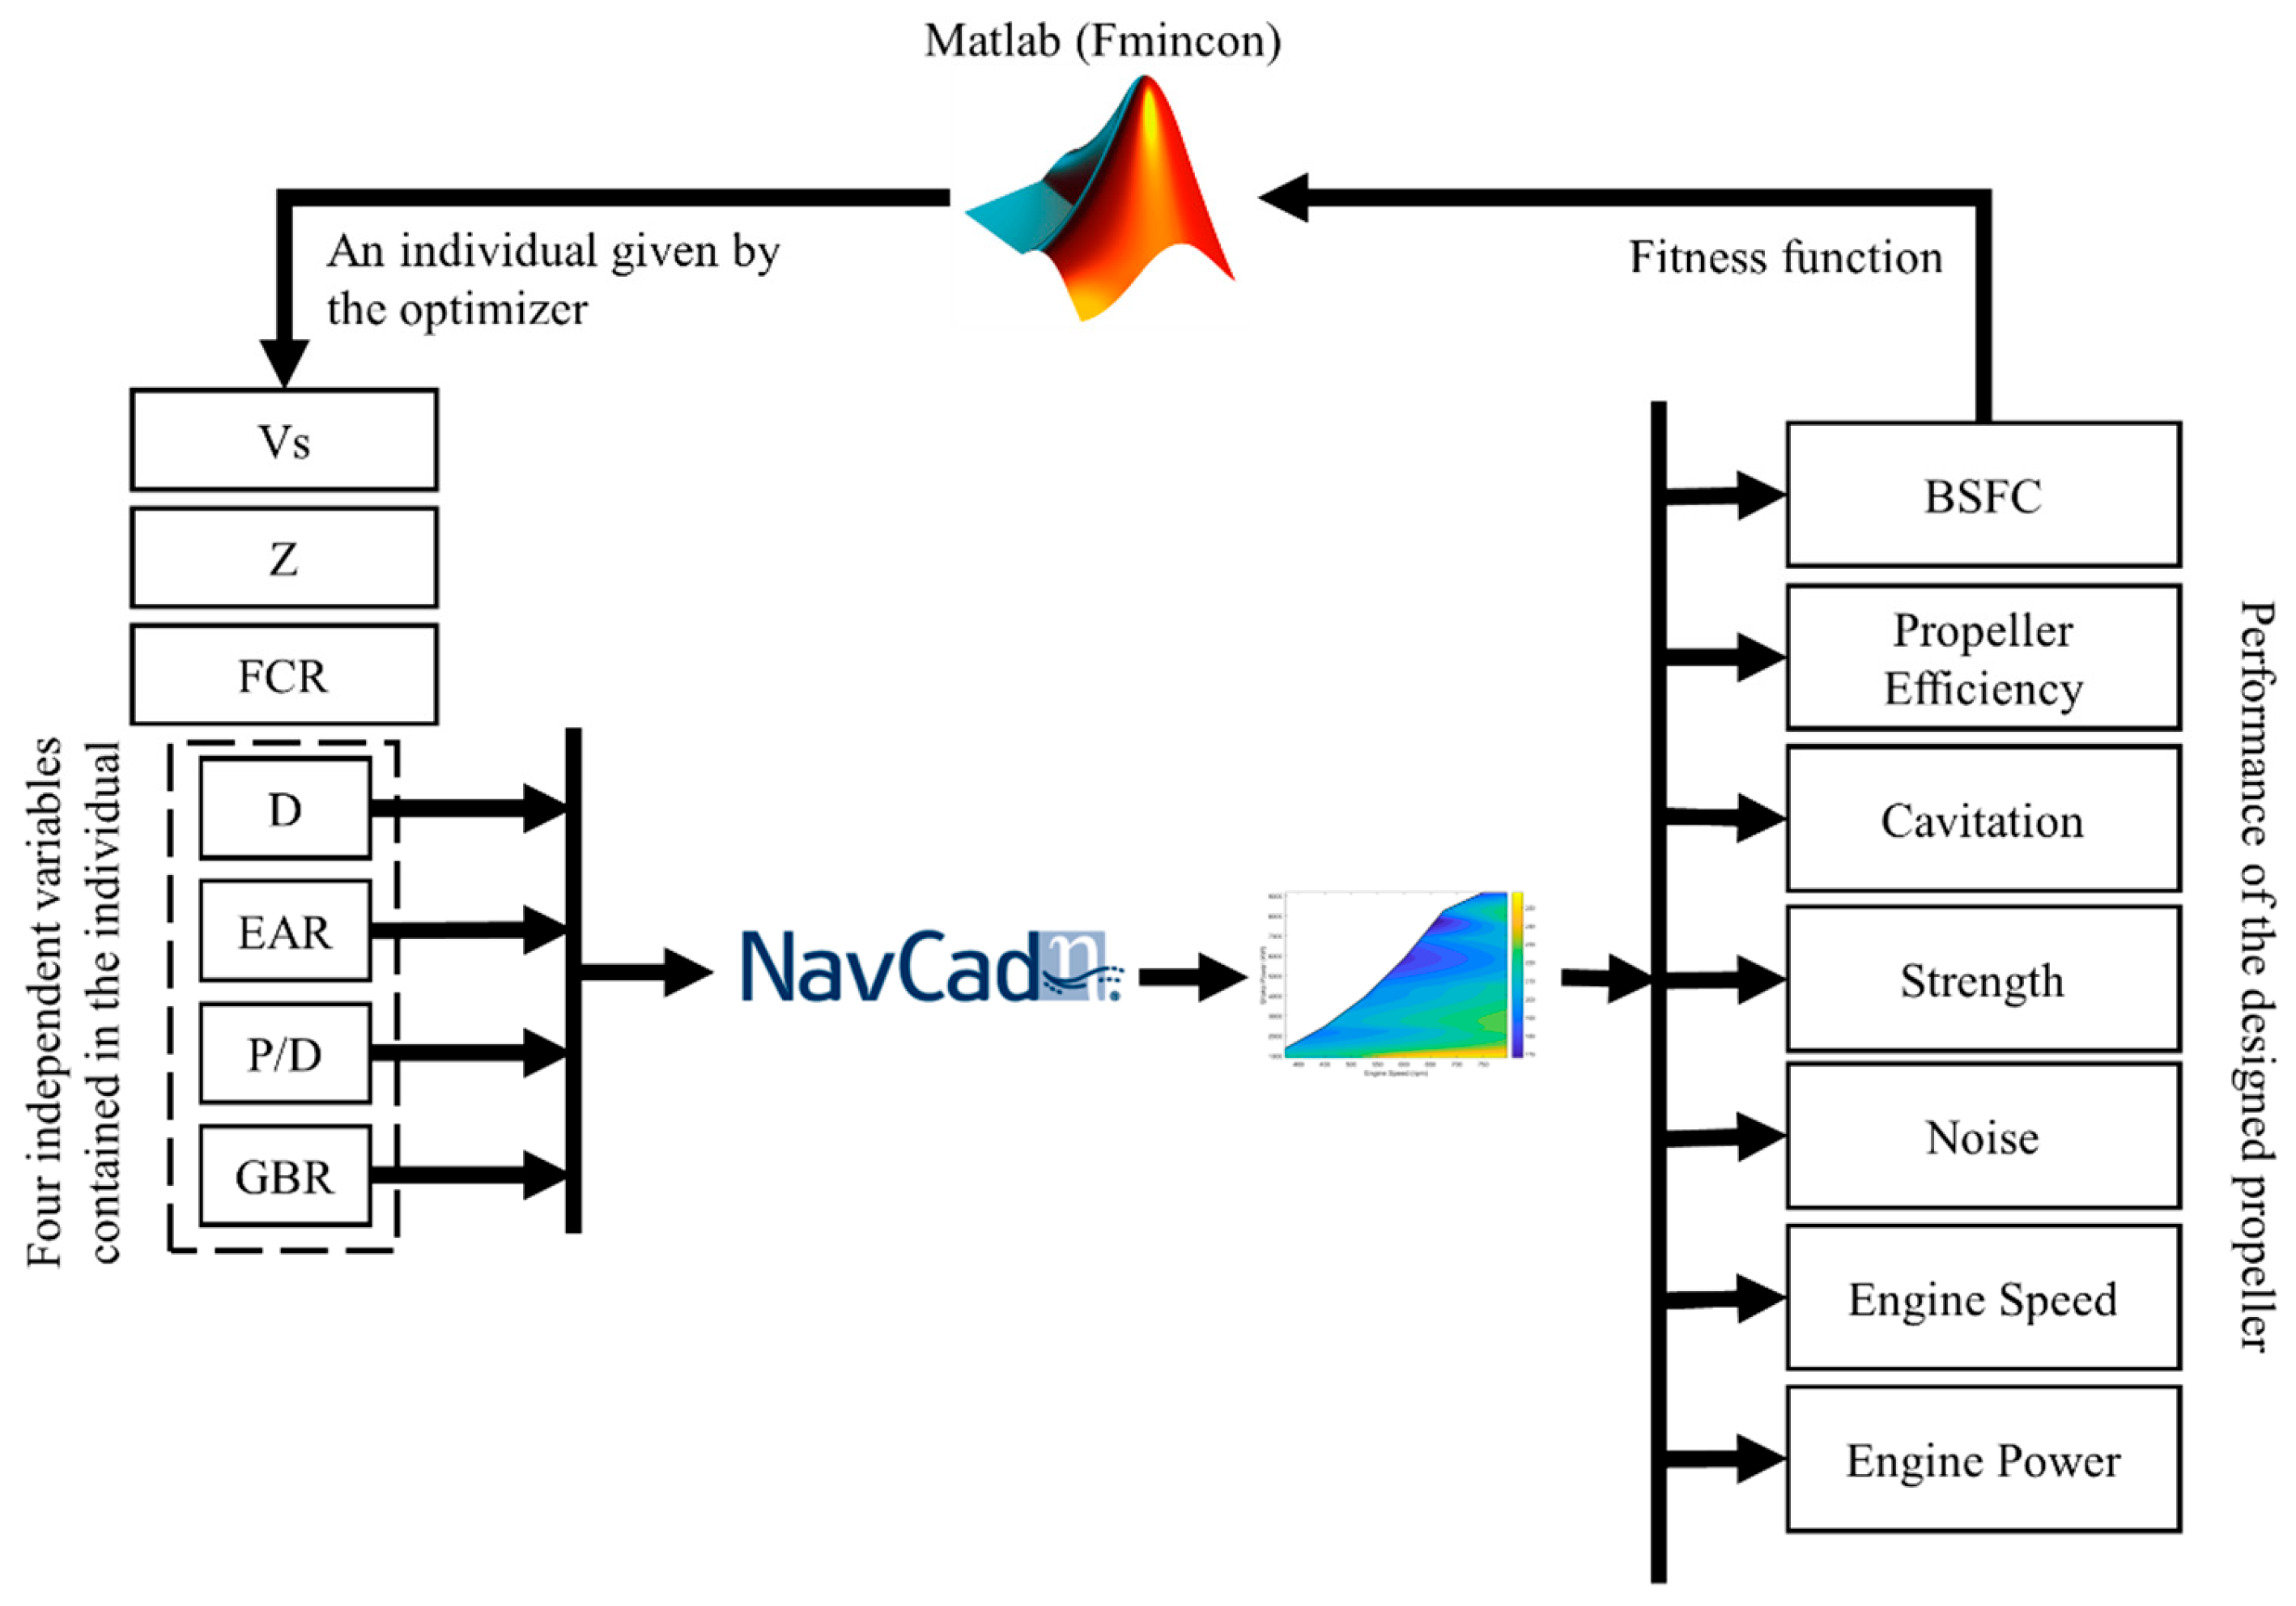
3.1. Propeller Optimization Model for the Operation Performance

The propeller optimization model is a numerical tool developed to optimize propeller performance for both design and operational concepts. This model, originally developed and used by Tadros et al. [43] to simulate propeller performance with the existing cupping technique, has been updated to include the FCR technique. The optimization model couples NavCad software [22] as a ship performance prediction tool and fmincon as a nonlinear optimizer implemented into MATLAB [44]. A schematic diagram of the propeller optimization model is shown in Figure 4. This model is linked to fuel consumption and exhaust emissions maps within the engine load diagram, aiming to determine the optimal propeller geometry that minimizes fuel consumption at a specific operating point. For this study, the propeller series considered is the B-series with a fixed number of blades (Z). The propeller geometry parameters include propeller diameter (D), EAR, P/D, and gearbox ratio (GBR). The primary objective, fuel consumption (FC), is computed based on ship speed (Vs) using the following equation:
F C kg / nm = B S F C × P B V S
where BSFC is the brake-specific fuel consumption in kg/kW·h, and PB is the brake power in kW and Vs in knots.
The main objective of the optimization model, along with the defined constraints, is to be integrated into a developed fitness function, as in Equations (2) and (3), which is always minimized. The constraints mainly address cavitation, noise, and strength issues to ensure the propeller’s safety under operating conditions. All results are exported from NavCad and processed through the optimizer in MATLAB. The fitness function used in this study shows its ability to reach the minimum value of fuel consumption while complying with all the defined constraints to reach zero values, as their absolute values are less than one. This type of fitness function is mainly developed for the genetic algorithm (GA) technique [45] but can be applied to different kinds of optimizers due to its ability to evaluate the values of both objectives and constraints in only one equation [46]. This model has been slightly converted from the standard optimization model to combine the objective and constraints into one single function called the fitness function. The main reason for this conversion is the reduction of simulation time to achieve the optimal solution.
F i t n e s s   F u n c t i o n = F C + R i = 1 j m a x ( g i ( x ) , 0 )
g i ( x ) = C r i t e r i o n C o m p u t e d C r i t e r i o n L i m i t s 1           f o r           C r i t e r i o n C o m p u t e d C r i t e r i o n L i m i t s C r i t e r i o n C o m p u t e d C r i t e r i o n L i m i t s + 1           f o r           C r i t e r i o n C o m p u t e d C r i t e r i o n L i m i t s
where g(x) is the static penalty function, x is the number of variables, j is the number of constraints, and R is a penalty function.
The optimization model is based on the fmincon function based on the interior point algorithm [47] to find the minimum of the problem using the following equation:
min x   f ( x )           such   that   c ( x ) 0 c e q ( x ) = 0 A x b A e q x = b e q l b x u b
where f(x) is the optimization model objective, c is the inequality constraints, ceq is the equality constraints, A as a matrix and b as a vector are the linear inequality constraints, Aeq as a matrix, and beq as a vector are the linear equality constraints, and lb and ub are the lower and upper bounds, respectively. The boundary conditions of EAR and P/D are defined according to the limits of the propeller series. The boundaries of propeller diameter vary between 40% and 60% of the ship draft, taking into account the available stern area to install a propeller. The gearbox boundaries are defined as a ratio between the engine speed operating range and suggested propeller speeds.
The engine maps have been generated using an engine optimization model to identify key parameters that minimize fuel consumption under specific operating conditions [48]. Since the ship’s installed engine behaves similarly to the simulated engine from the optimization model, these engine maps have been scaled to match the required speed and power. The optimizer searches for optimal points within a given range of speed and power to ensure better combustion from the diesel engine. This range varies from 50% to 90% of the rated power and from 60% to 100% of the rated speed. By scaling the engine maps, the model accurately reflects the real-world performance of the engine, allowing the optimizer to identify the most efficient operating points. This approach ensures that the propeller design is optimized not only for hydrodynamic performance but also for overall fuel efficiency and emissions reduction.
NavCad serves as the primary computational software for calculating ship resistance and propulsion using different empirical methods. Its capabilities can be extended by coupling it with other third-party codes via an application programming interface (API). This integrated approach ensures a comprehensive evaluation of propeller designs, balancing hydrodynamic calculations, fuel consumption, and operational safety. A schematic diagram of all the simulation and optimization processes is presented in Figure 5.
The main parameters of the selected ship are defined in the software, including the range of operating speeds. Following this, the losses in the gearbox and propeller shaft are set according to the recommended values. The propeller series, number of blades, and percentage of FCR are also specified. Once these primary parameters are established, the methods to compute ship resistance are selected based on the method expert ranking integrated into the software, which evaluates various criteria related to ship dimensions and speeds.
For ship resistance computation, the Holtrop method [49,50] is considered, while the method presented by Holtrop et al. [51] is used to calculate the wake fraction, thrust deduction factor, and relative rotative efficiency, which are key propulsive coefficients. A design margin of 10% is included during the ship resistance computation to account for uncertainties. The FCR is defined for a given range, which is equal to the depth of the face curvature divided by the chord length. This adjustment allows changes in propeller pitch, defined by the baseline (face pitch), enabling the propeller to provide the same thrust at lower power and reducing cavitation. The main equations due to the modifications in the blade section are presented in [20,52,53,54] to define the effective pitch and EAR due to the changes in blade sections.
These calculations are essential for evaluating the performance characteristics of the propeller, as well as for understanding the limitations related to cavitation and noise values. The advance coefficient (J), thrust coefficient (KT), torque coefficient (KQ), and propeller efficiency (ηo) are key parameters that help in assessing the effectiveness of the propeller design. The KT and KQ corrections for the applied FCR are also based on polynomial algorithms derived from collections of test data and higher-order calculations. The FCR corrections address propeller performance and adjust the cavitation criteria, as FCR changes the leading angle of attack and pressure distributions.
These main parameters are calculated using the following equations [20]:
J = V A n D
K T = T ρ n 2 D 4
K Q = Q ρ n 2 D 5
η o = K T K Q J 2 π
V A = V S ( 1 w )
T = R T 1 t
where VA is the advance speed, n is the propeller speed, ρ is the density, RT is the total resistance, T is the thrust, and Q is the torque.

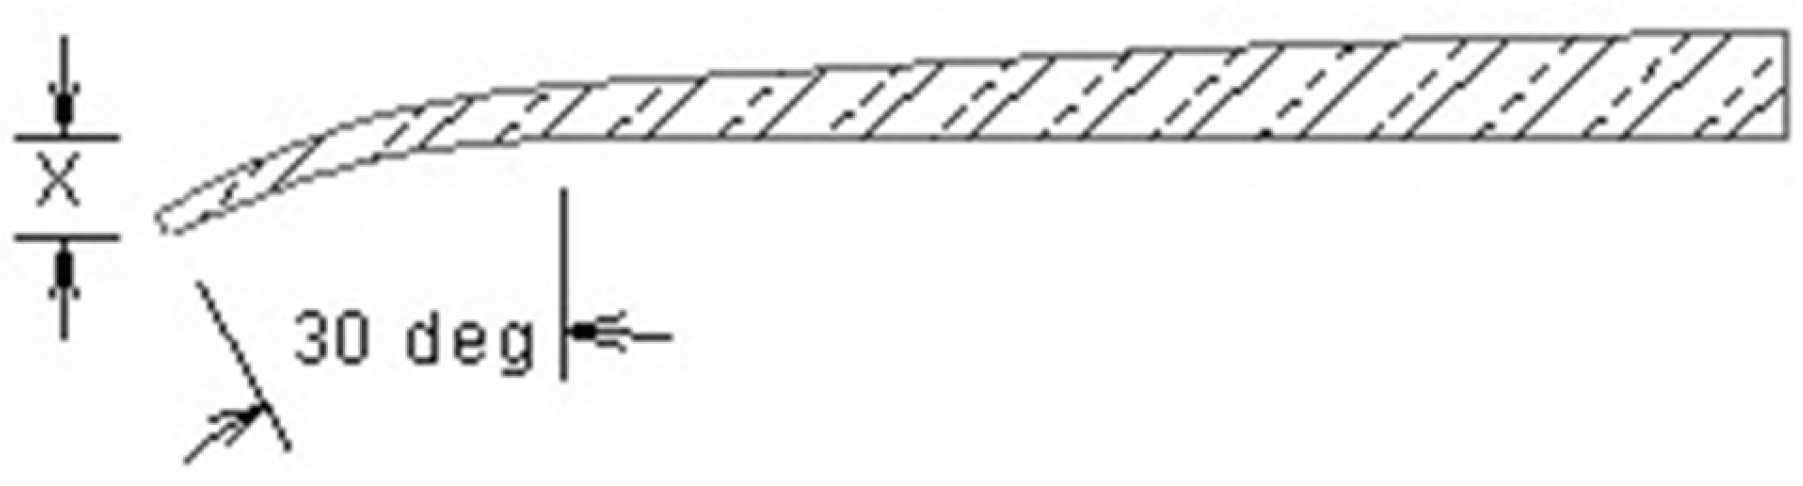
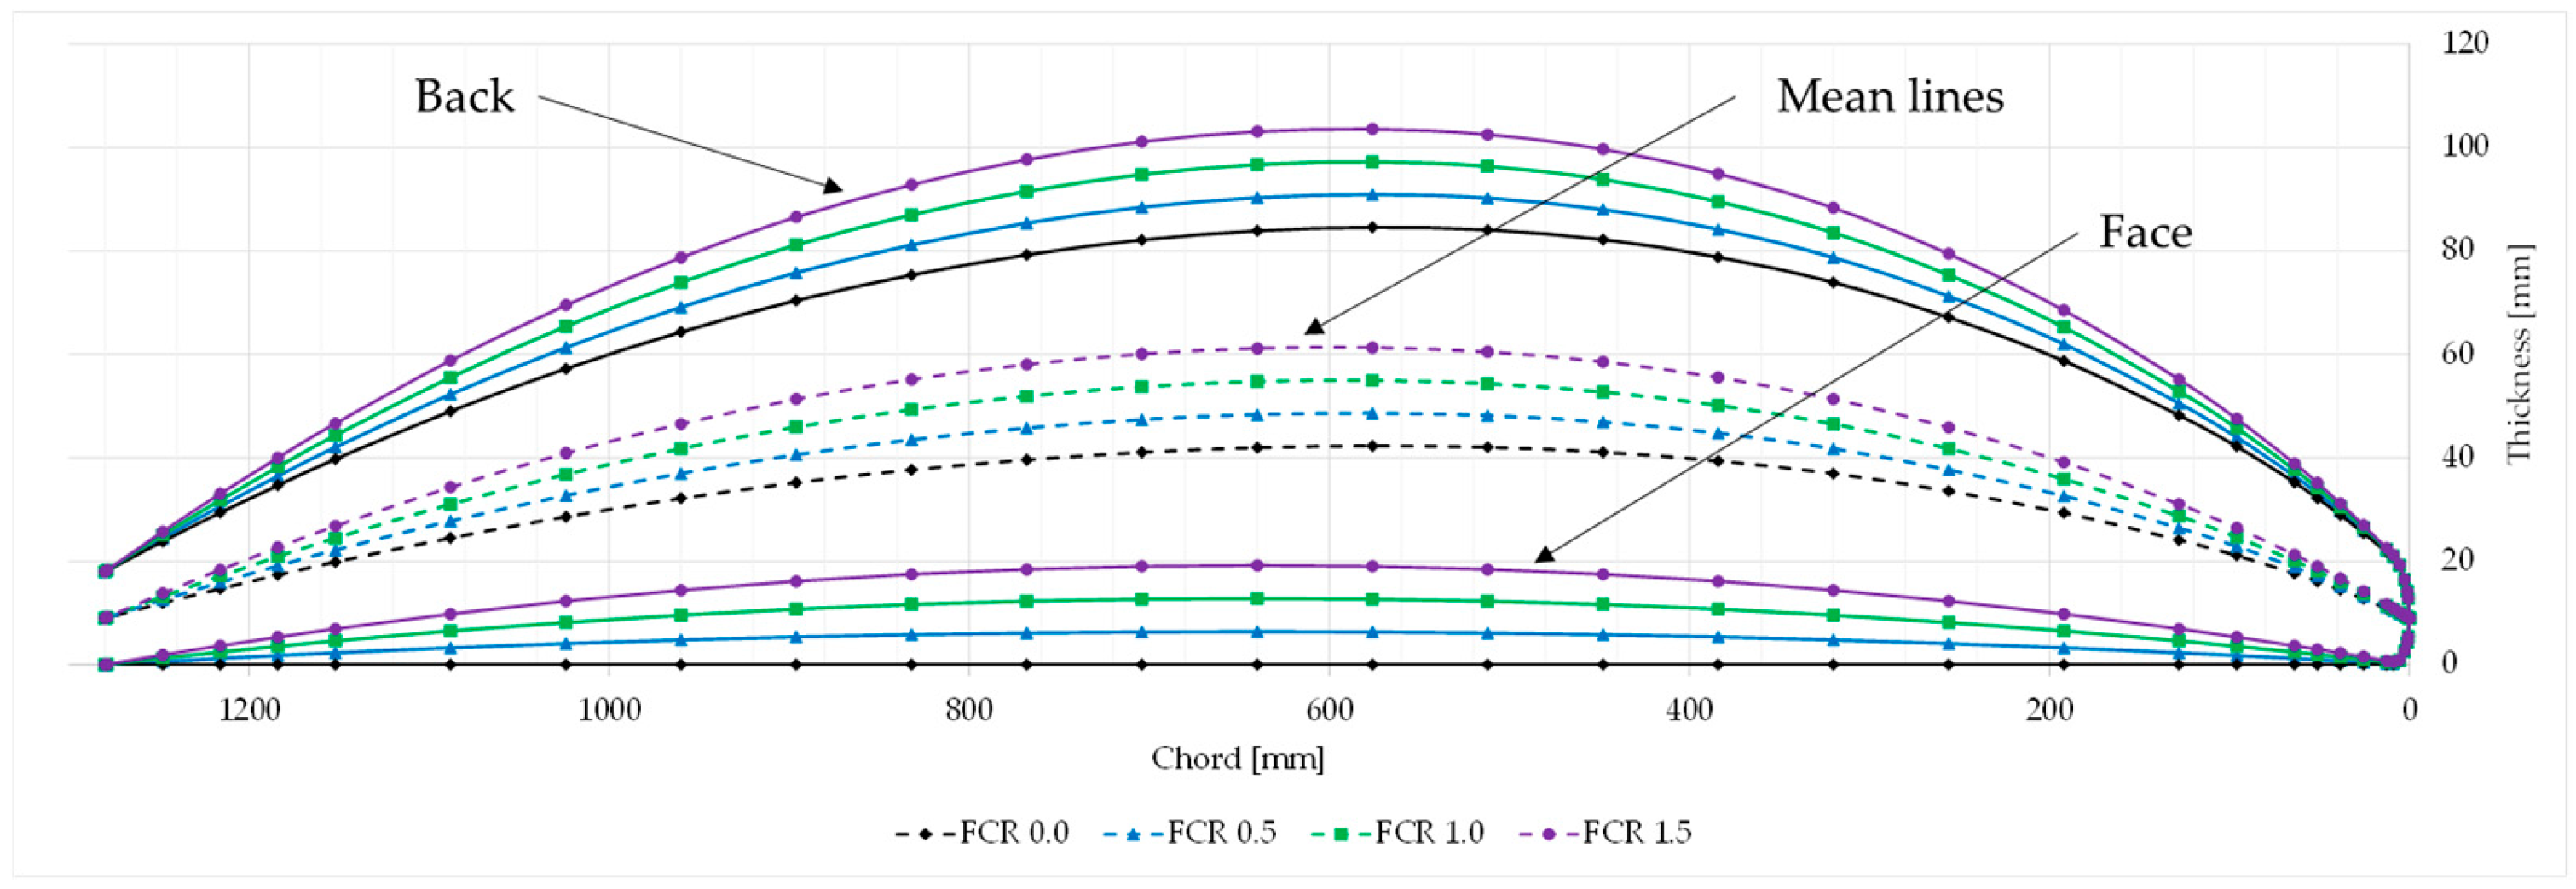
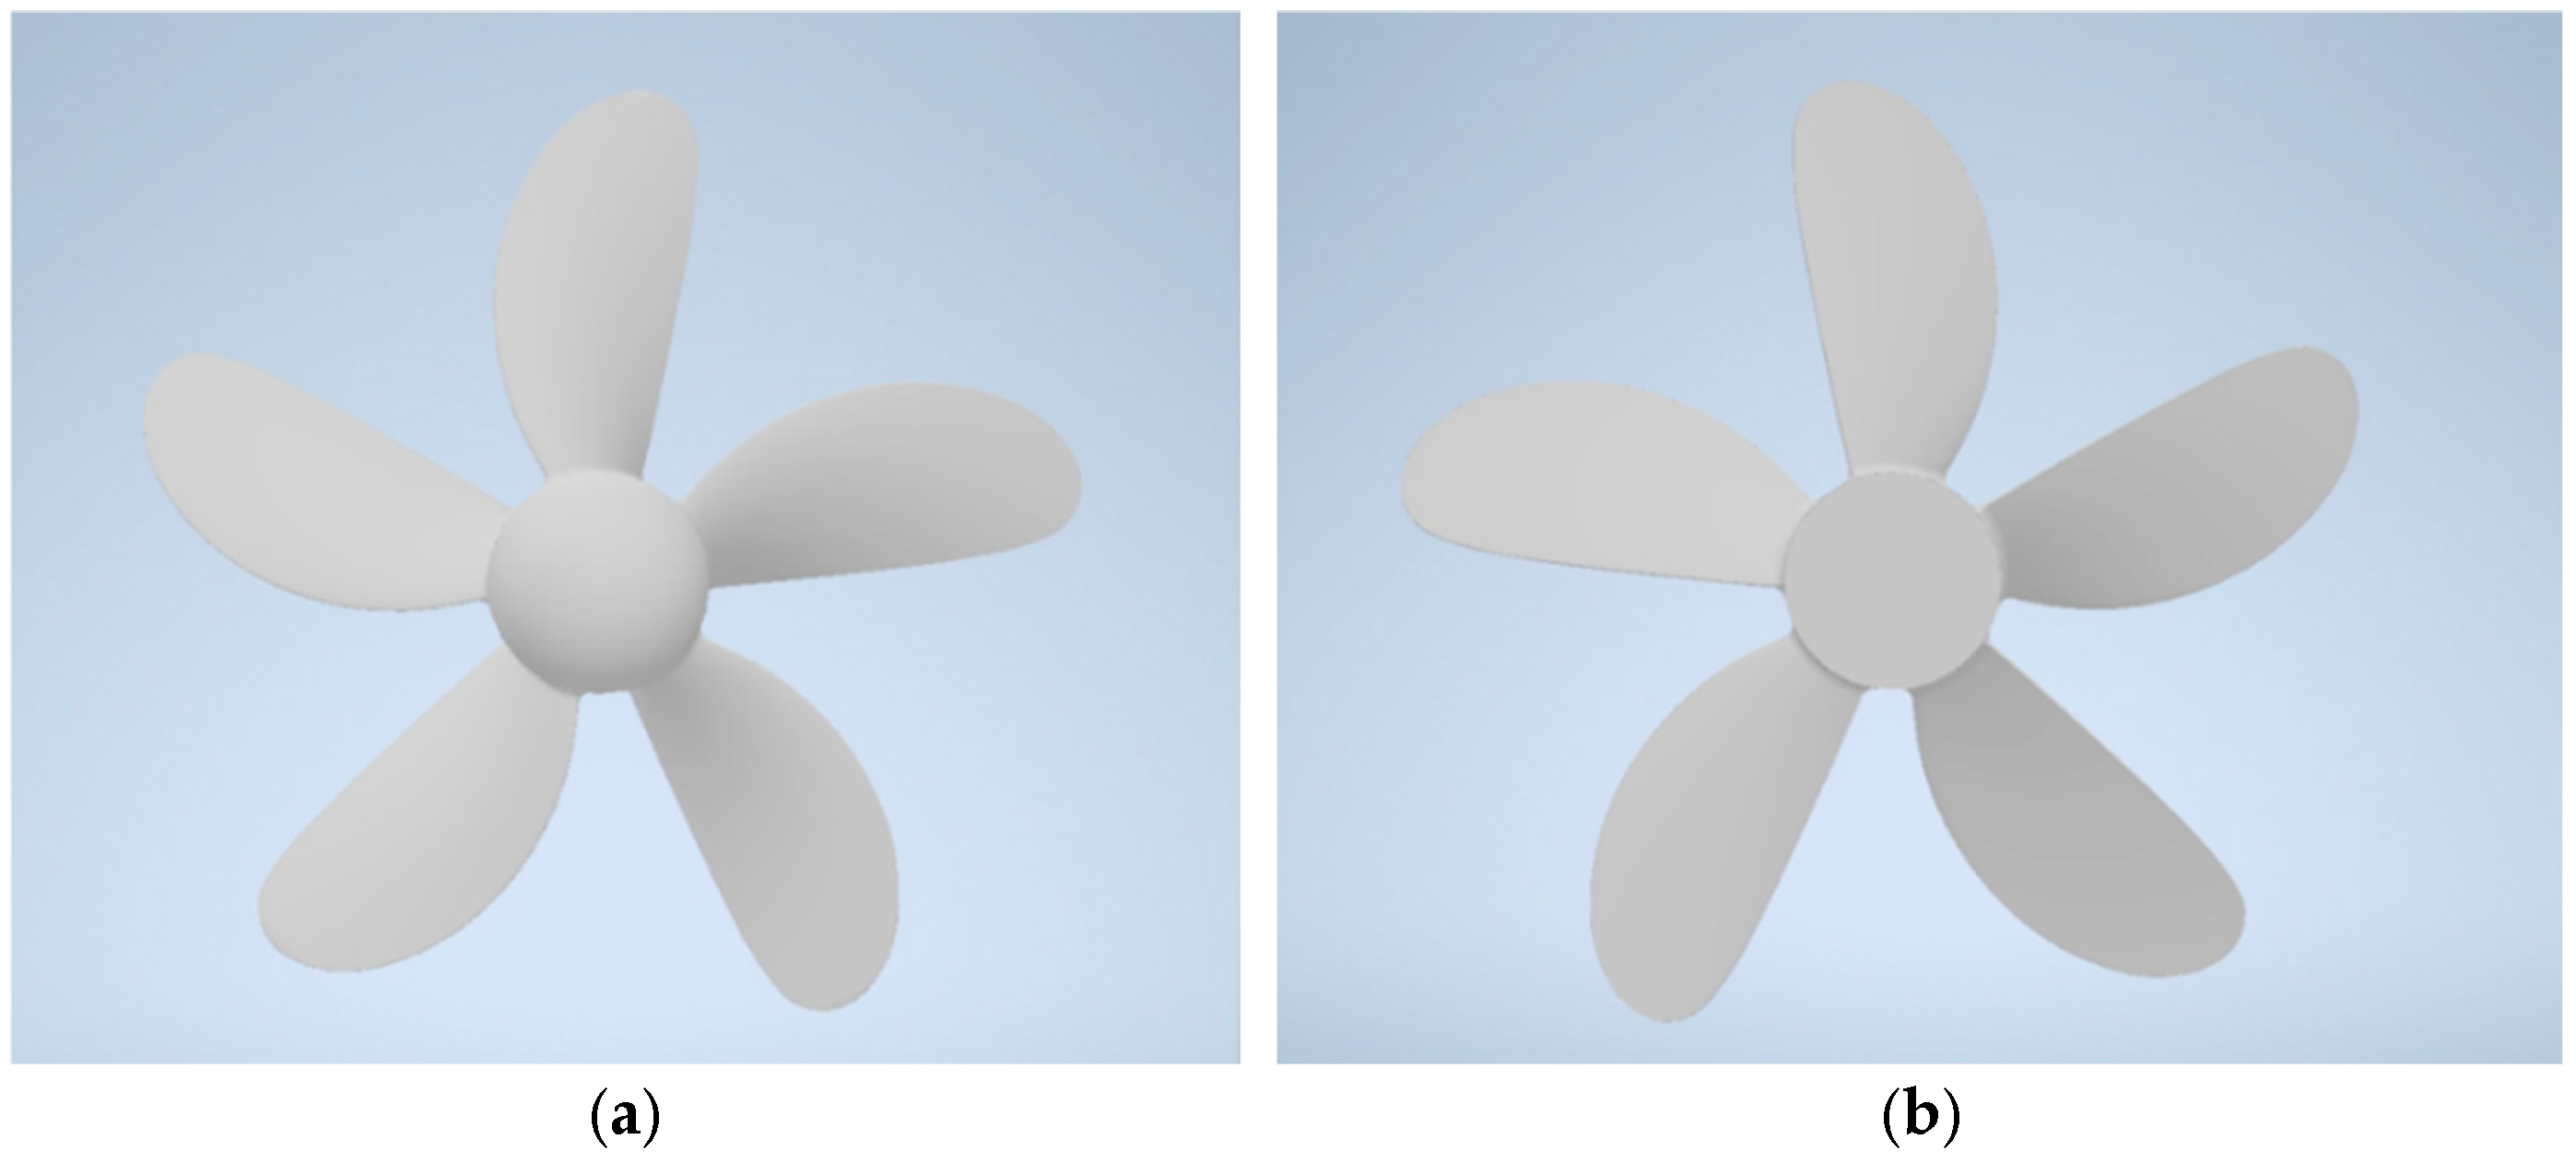
3.2. Propeller Models with Different FCR

Based on the previous calculations, the optimized propeller utilizing the minimum fuel consumption procedure has been employed to apply the FCR technique. By maintaining the same propeller geometry (D, EAR, P) while applying varying levels of FCR, the propeller performance is computed in each case. Three levels of percentage of FCR are considered as follows: (1) 0.5, (2) 1.0 and (3) 1.5. The propeller blades are generated using PropCad 2024 [55] based on the B-series, specifically designed in terms of thickness and chord. The differences between the blade section design at 0.7R are visually presented in Figure 6 to show the variations from the original design (black line). The propeller with 0.0% FCR, which serves as the unmodified benchmark propeller, is chosen as a representative example of the proposed propeller designs, as shown in Figure 7.

3.3. Propeller Performance Based on CFD Technique

Numerical simulations are conducted using the commercial software Simcenter STAR-CCM+ (Version 2301) [56] to investigate the hydrodynamic performance of various FCR propellers on a full scale to avoid any scaling effect [57]. The software solves the governor equations. Rigid Body Motion (RBM) is employed to model the propeller’s rotational motion, and the time step is set to 1 × 10⁻3 s. This time step allows propellers to rotate at 0.5 degrees per time step, which is consistent with the International Towing Tank Conference (ITTC) recommended range of 0.5 to 2 degrees. A first-order scheme is applied for temporal discretization.

3.3.1. Governor Equations

Navier–Stokes equations refer to the governing equations consisting of the continuity equation (conservation of mass) and the momentum equation (conservation of momentum), both derived from the conservation laws. By employing Reynolds decomposition, pressure and velocity are expressed as the sum of their time-averaged and fluctuating quantities, and the Reynolds-Averaged Navier-Stokes (RANS) equations are presented in the following expressions:
u i ¯ x i = 0
u i ¯ t + u ¯ j u i ¯ x j = 1 ρ p ¯ x i + ν 2 u i ¯ x j x j + g i u i u j ¯ x j
where i and j are the Cartesian coordinates, t is time, p is the pressure, u is the velocity, v is the fluid kinematic viscosity, gi is the acceleration due to gravity, and u i u j ¯ is Reynold stress term. In this study, an additional shear stress transport (SST) k − ω turbulence model is considered and involves two main transport equations, one for the turbulent kinetic energy (k) and another for the specific turbulence dissipation rate (ω) [58]. This allows linear Boussinesq’s hypothesis to be extended into nonlinear functions of strain and vorticity tensors to take into consideration turbulence anisotropy. More information can be found in the Simcenter STAR-CCM+ User Guide (2023) [56].

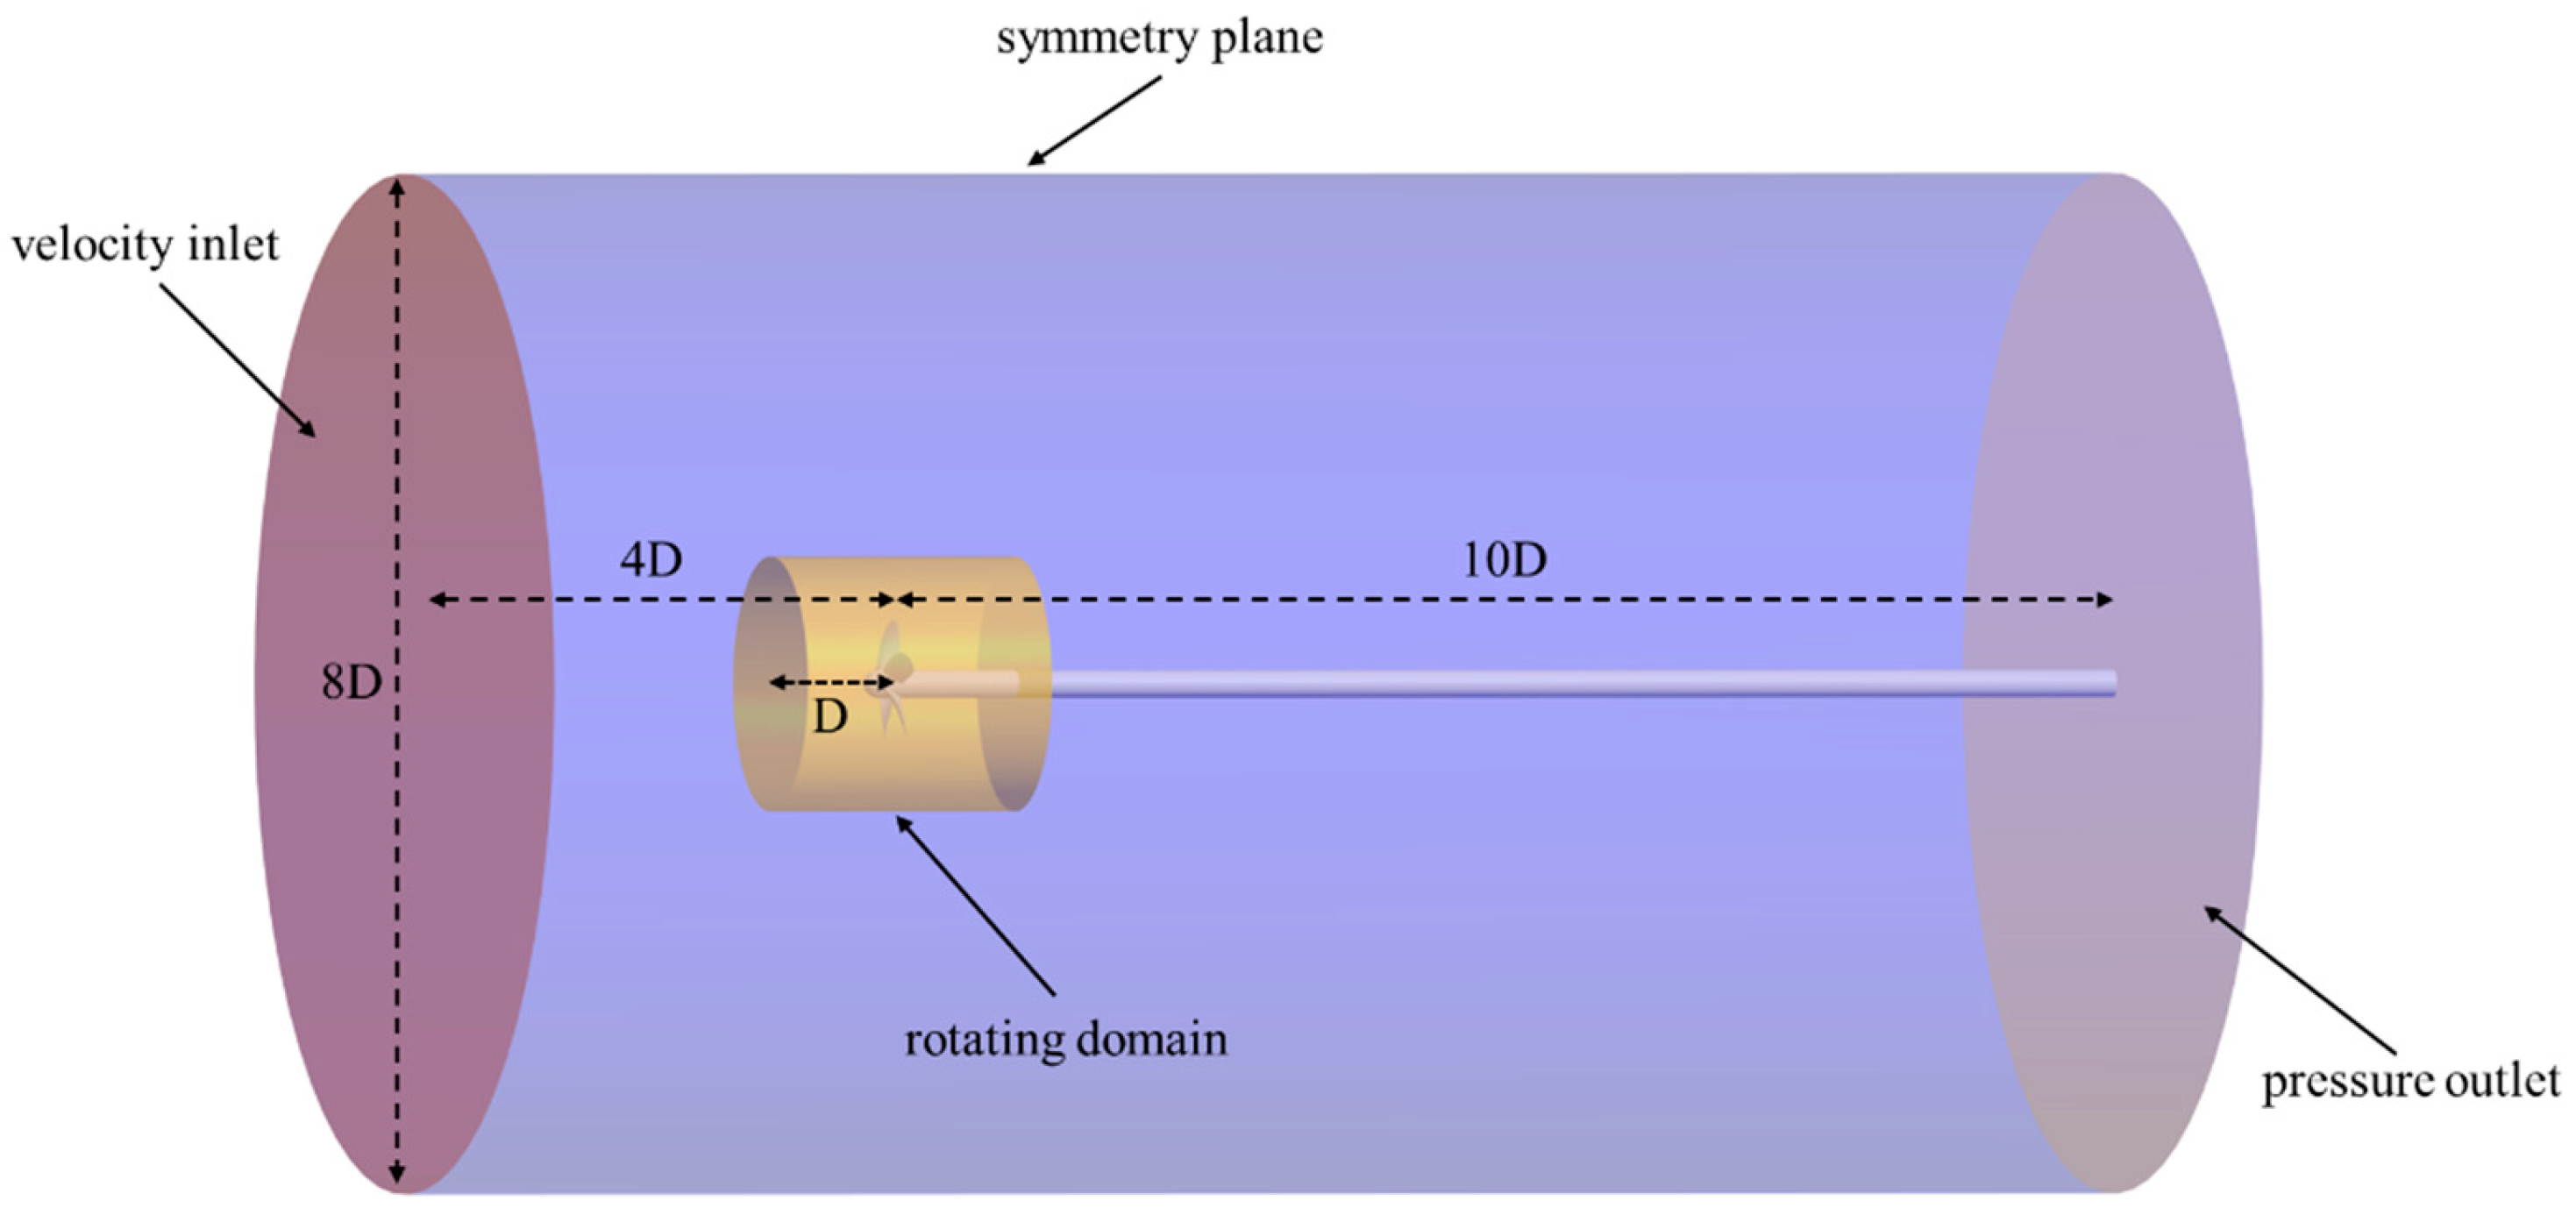
3.3.2. Computational Domain and Boundary Conditions

CFD analysis is conducted for propeller open-water performance analysis. The computational domain consists of a cylindrical volume, with the domain size determined by the propeller diameter D. The propeller is positioned 4D from the inlet, 4D from the outer circumferential surface, and 10D from the outlet, in accordance with ITTC guidelines [59] and shown in Figure 8. The inlet is defined as a velocity inlet, and the outlet is a pressure outlet; a symmetry plane is imposed on the circumferential surface of the cylinder. The propeller blades and shaft are defined as no-slip wall boundaries. The rotating domain has a radius of 1D and a length of 2D, and the boundary of the rotating domain surface is defined as an interface.

3.3.3. Mesh Generation

The automatic mesh tool with volumetric control is used to generate the unstructured hexahedral meshes in these computational domains, with the total mesh consisting of approximately 5 million cells across different camber ratio studies. A prism layer is applied near the propeller blades and shaft to capture the boundary layers accurately. A high dimensionless wall distance (y+) is employed, with the y+ larger than 30 on propeller blades in all performing simulations. Fine surface mesh and curve controls are applied to the propeller blades and edges to enhance mesh quality. The mesh of the propeller and computational domain is shown in Figure 9.

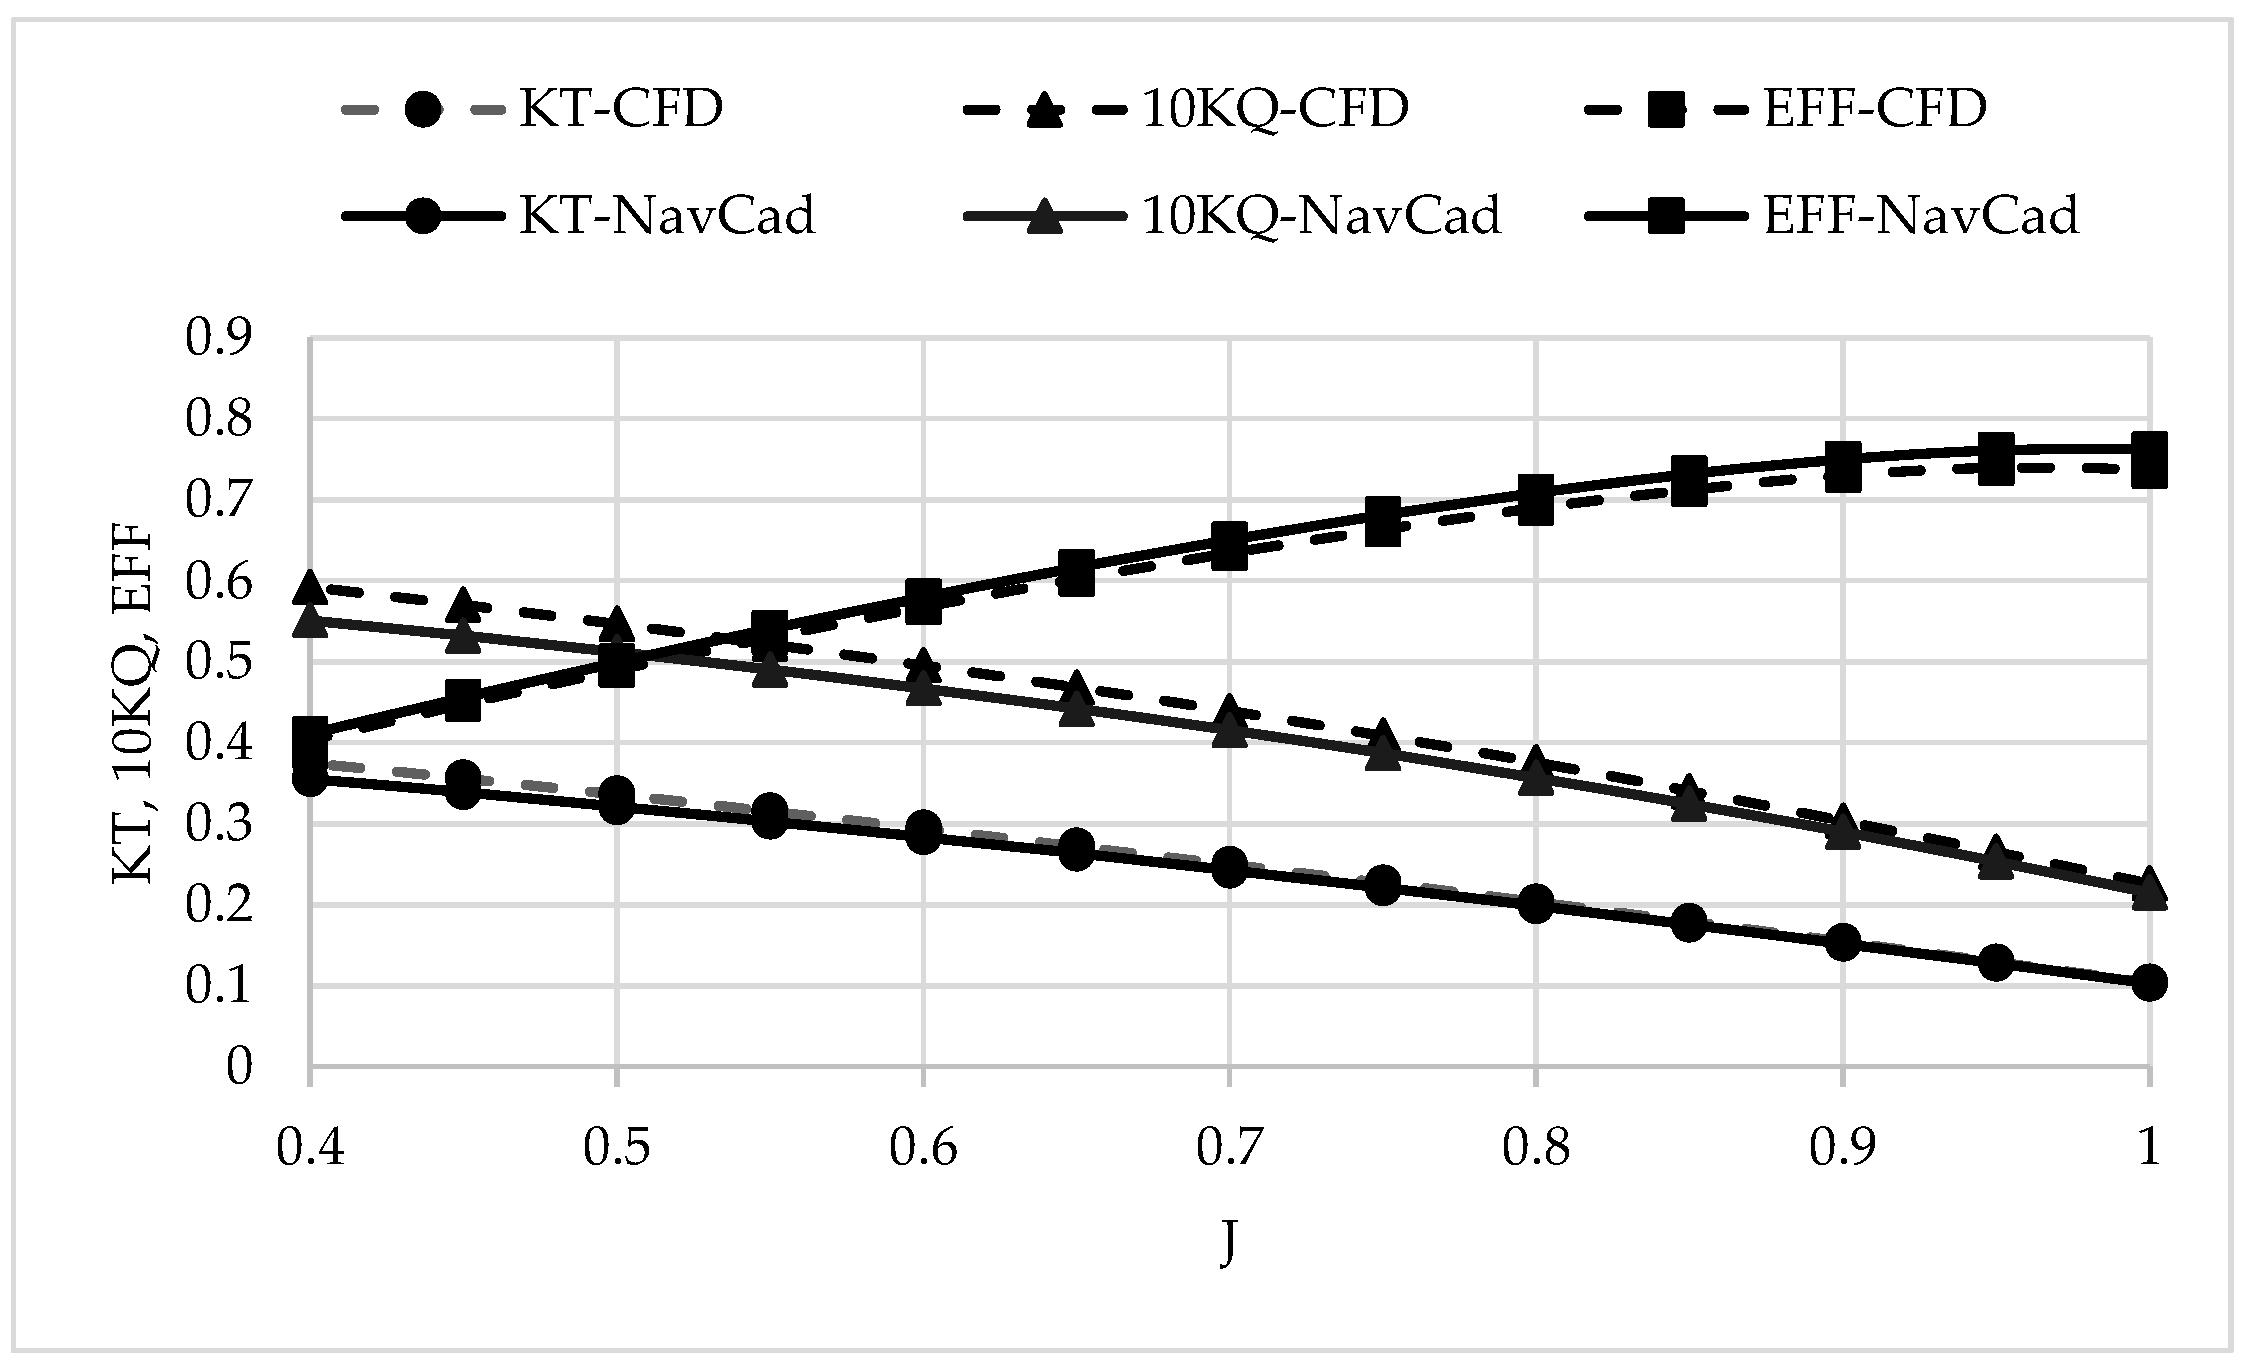
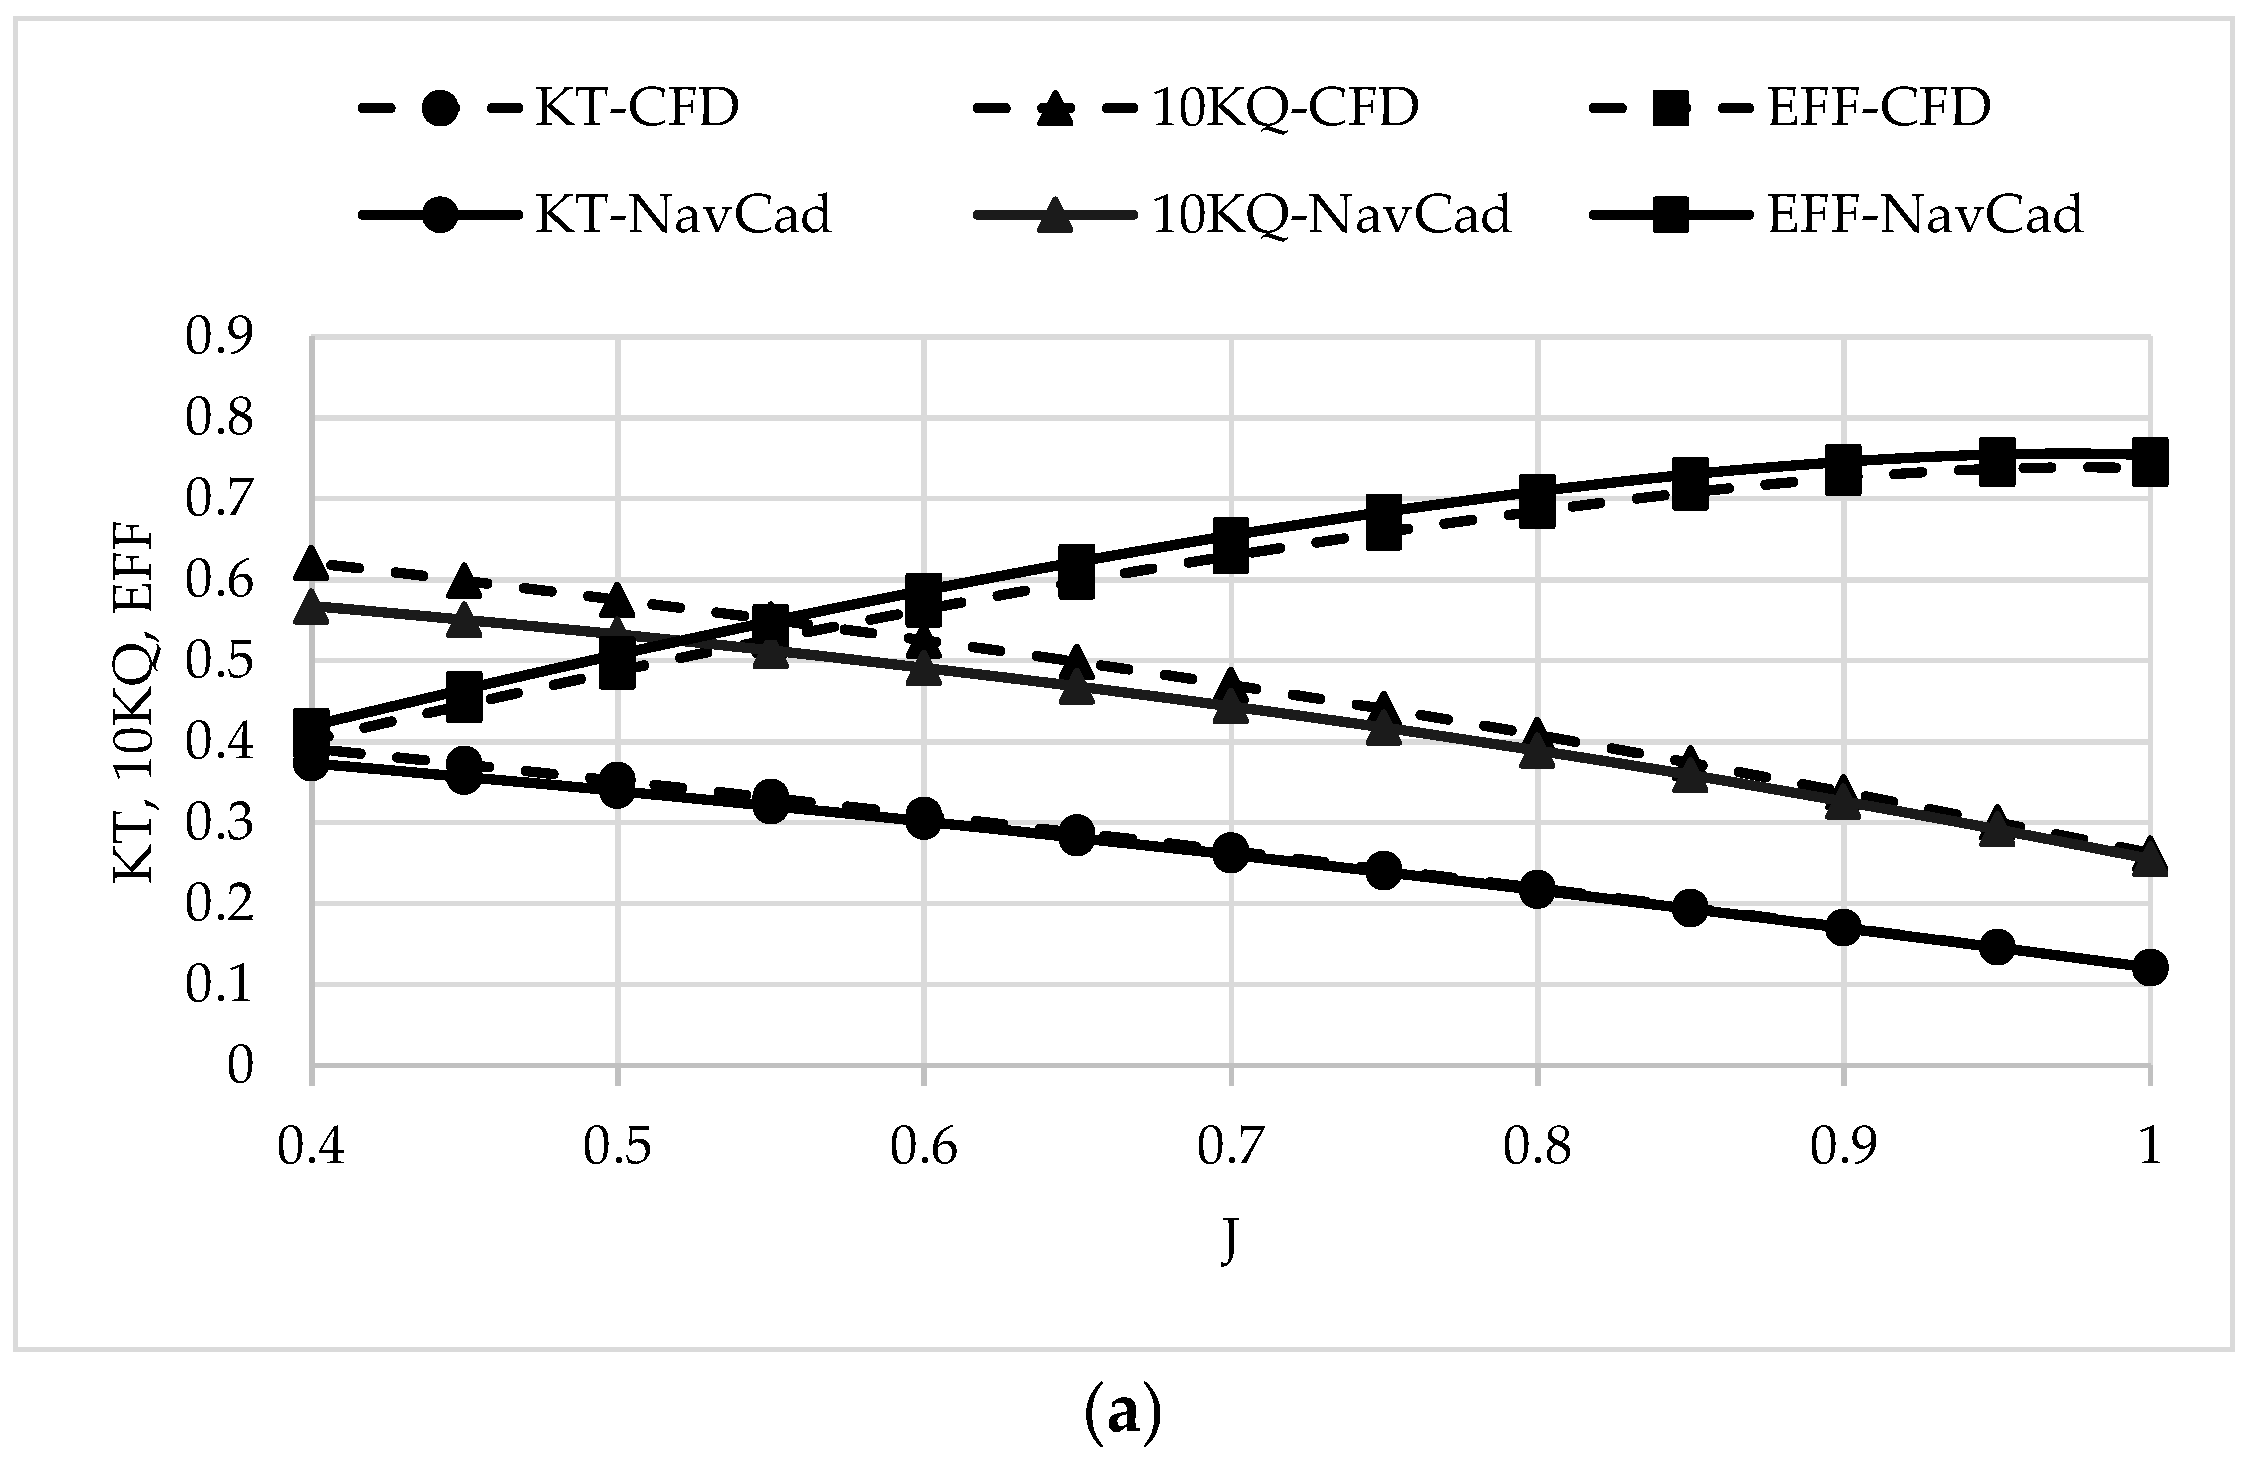
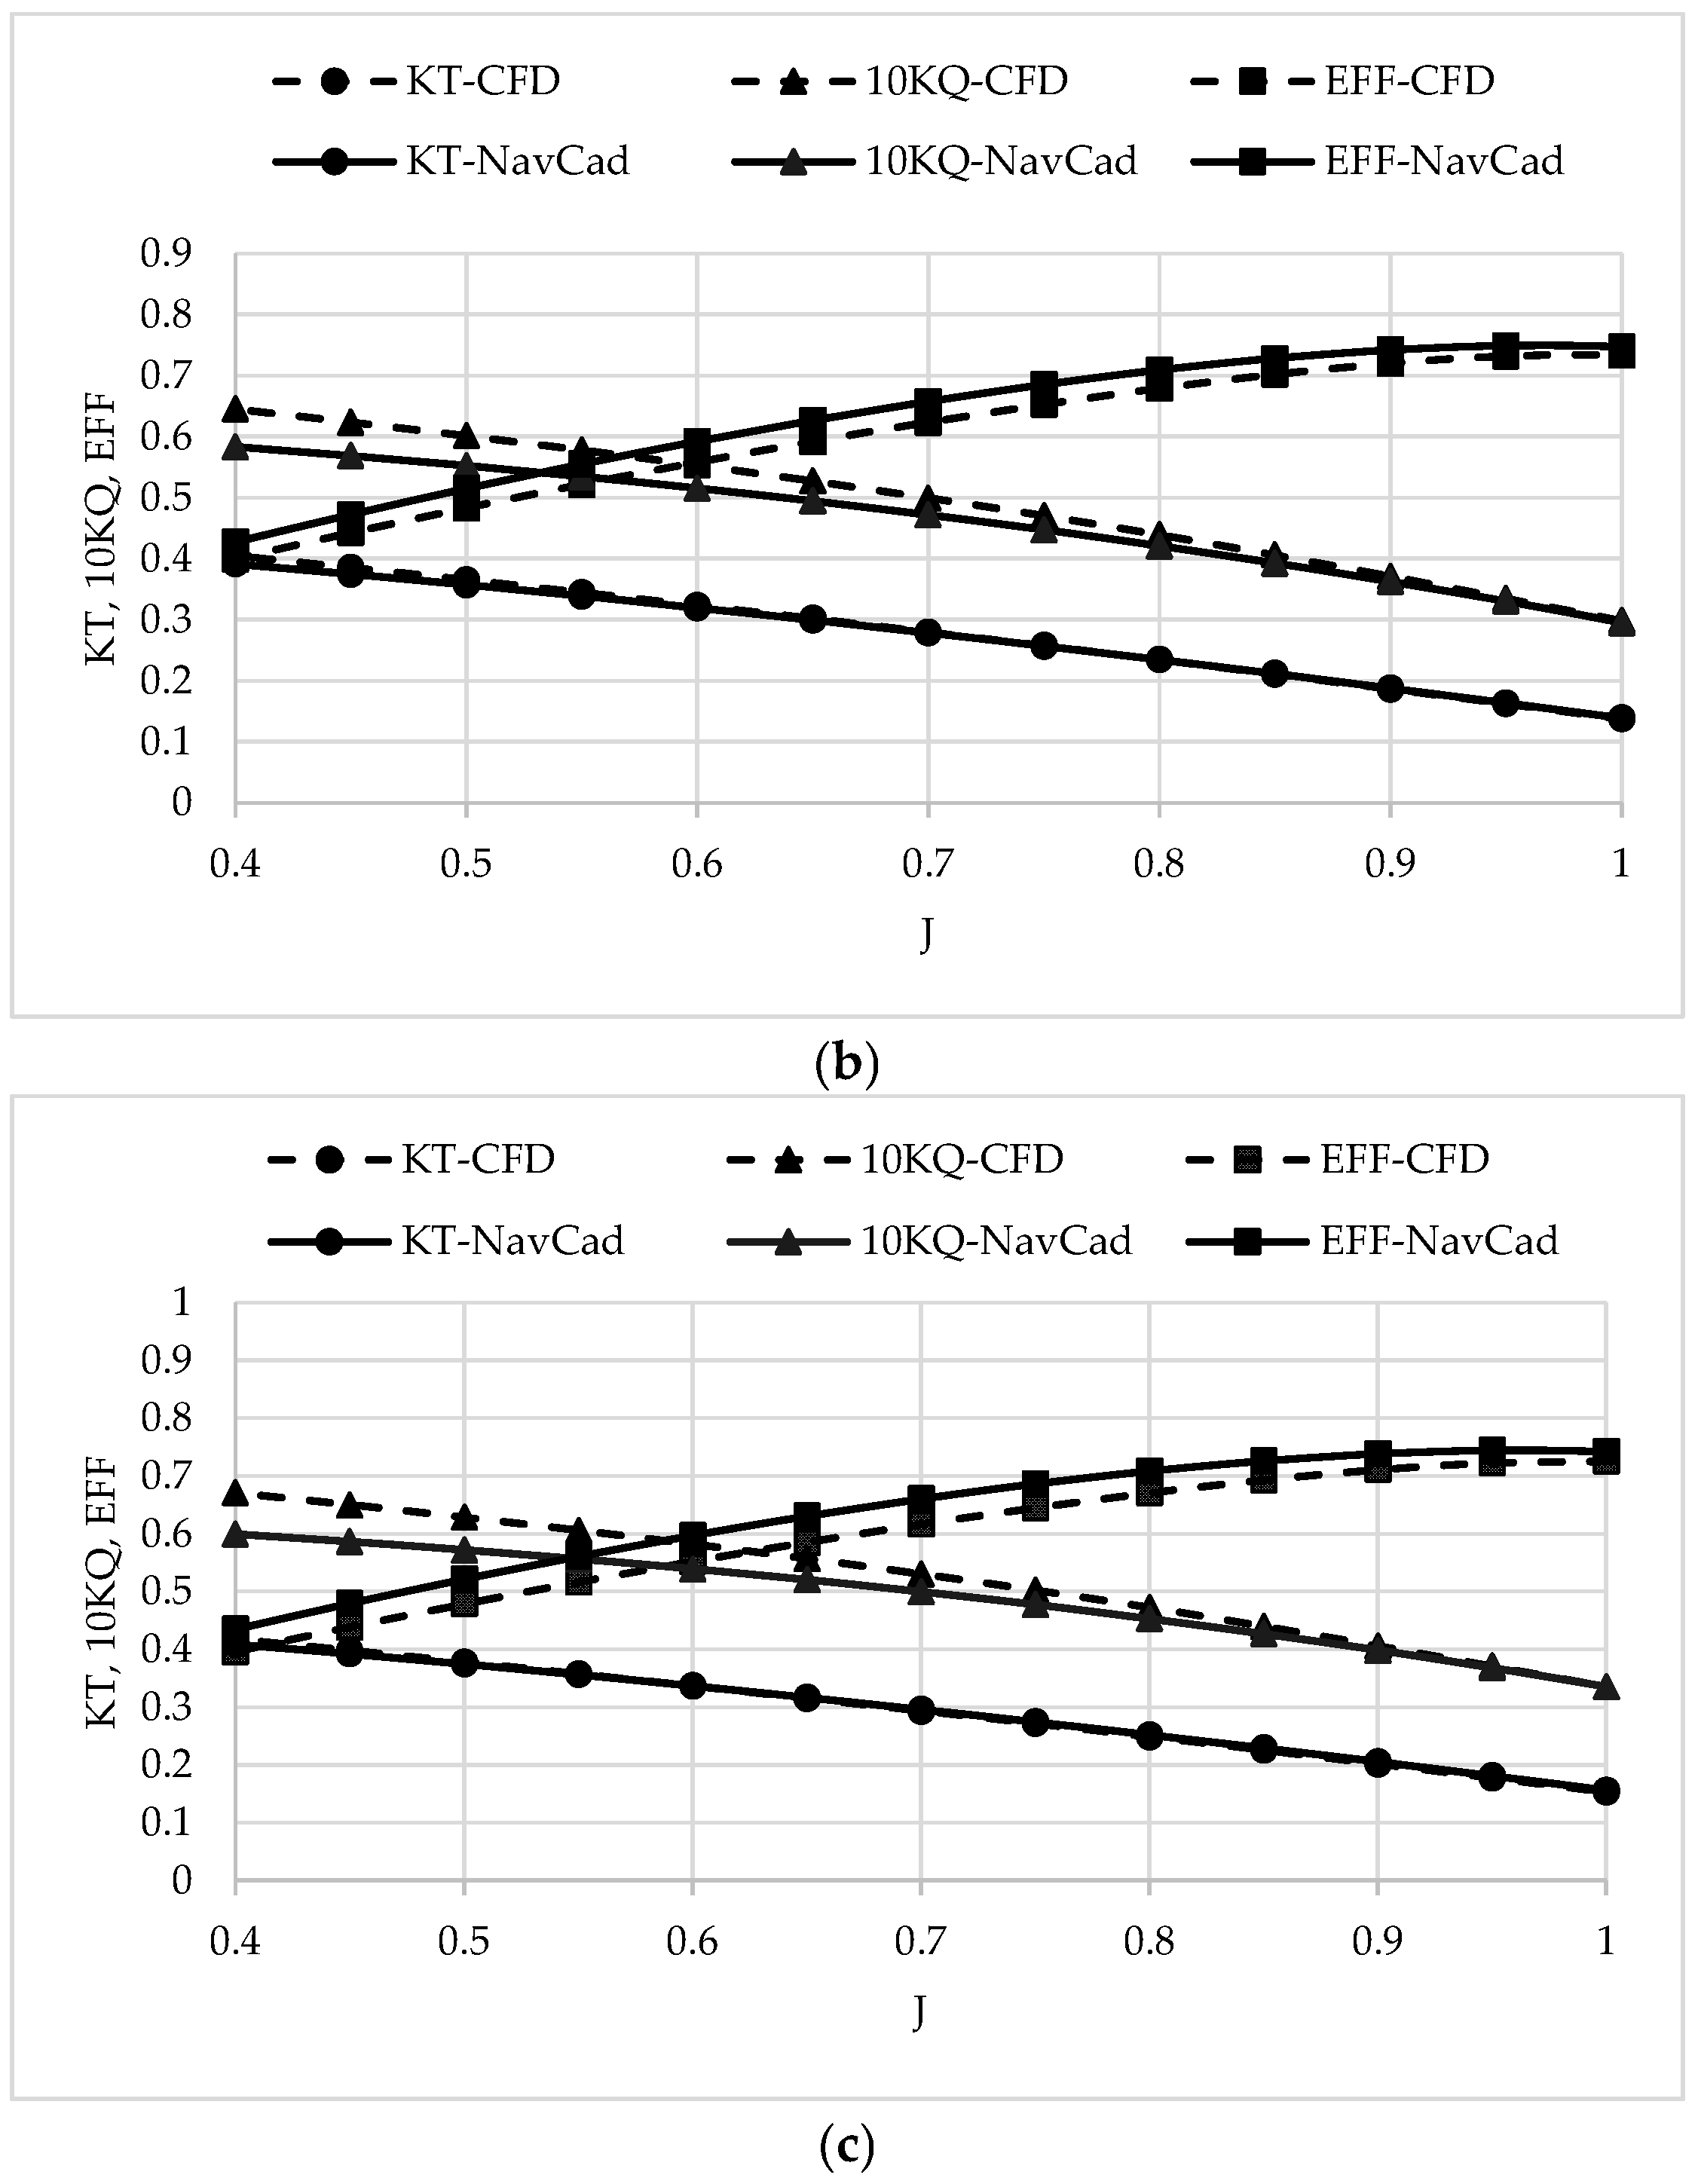
3.3.4. Validation of Propeller Performance Using CFD

To validate propeller performance across various FCRs, the geometry of a B-series propeller without any FCR modifications is first generated using PropCad 2024 [55]. This geometry is then integrated into a CFD simulation to ensure the model’s accuracy by comparing it to reference B-series data derived from polynomial equations. The open-water characteristics, including KT and KQ coefficients over a range of J, are computed and analyzed for both models. Results show a strong alignment between the computed curves of both models, as shown in Figure 10, indicating that the CFD model accurately represents the thrust and torque performance of the propeller with an average error of 3.2% and 5.8%, respectively, compared to the polynomial equations. This initial validation step is essential for selecting the appropriate CFD model configurations, which will later be used to simulate and assess the performance of modified propellers with various FCR adjustments. By confirming the model’s reliability, it lays the groundwork for simulating propeller designs with optimized efficiency characteristics.

3.3.5. Test Matrix of Different Camber Ratio Propellers

To evaluate the hydrodynamic characteristics of the full-scale propellers at different J, the propeller speed is held constant while the inlet velocity is varied. The J varies from 0.4 to 1 across the different FCR propeller designs. The incoming velocities (V) at the inlet boundary are determined based on the selected J values. Detailed information regarding the simulation conditions is provided in Table 4.

4. Results and Discussion

4.1. Effect of Optimizing the Propeller at the Minimum Fuel Consumption over the Maximum Propeller Efficiency

This section presents the propeller design method using two different techniques: (1) maximizing propeller efficiency and (2) minimizing fuel consumption. Different propeller geometries are selected to achieve the study’s objective while complying with all defined constraints.
Using the traditional propeller selection technique, the propeller is designed to maximize efficiency while adhering to cavitation and noise criteria limits. The simulation is performed directly in NavCad. The results of the propeller’s operating point are then integrated into the engine load diagram, and fuel consumption and exhaust emissions are calculated.
The second technique involves optimizing the propeller using the developed optimization model described in this paper. This model aims to minimize fuel consumption at the engine’s operating point. The propeller geometry and operating points are computed. In this case, FCR is not considered to directly compare the results of both simulation techniques, highlighting the reduction in fuel consumption achieved by the second technique over the first.
The propeller is designed from the B-series at five-blade and at the ship’s service speed of 14.5 knots. The propeller diameter is maximized in both cases to enhance efficiency. In the second technique, the EAR shows an 18% reduction compared to the first, which helps increase propeller efficiency. The pitch is increased by 34% in the second technique to provide the required thrust, while the propeller speed is reduced by around 18%. Both techniques achieve the same thrust, but the torque is higher in the second case. Propeller efficiency remains nearly the same for both cases, although the propeller coefficients are higher in the second case due to parameter adjustments as computed using Equations (5)–(8). The wake fraction and thrust deduction factor remain constant due to the method used consistently.
In terms of noise, the tip speed is reduced in the second case, proportional to the propeller speed, and both comply with the limit of 46 m/s for the five-blade propeller. For cavitation, the minimum EAR to avoid cavitation, according to Keller, is lower than the designed EAR, and both are equal to 0.47. The average loading pressure and back cavitation criteria are higher in the second case due to the lower EAR but remain within limits of 65 kPa and 15%, respectively. The second case shows a higher minimum pitch to avoid face cavitation, although both values are lower than the designed pitch. According to propeller operating conditions, the GBR is selected and is higher in the second case than in the first one.
Based on the designed propeller and GBR, the engine speed and brake power are computed. Within the engine load diagram, brake power is reduced by 0.5% in the second case compared to the first, leading to a 0.5% reduction in fuel consumption per nautical mile. Consequently, exhaust emissions are also reduced per nautical mile.
This study aids ship designers and decision-makers in considering different techniques and selecting optimal solutions for their vessels, as well as comparing the standard propeller with similar propellers with contemporary techniques such as FCR, as described in the following sections.

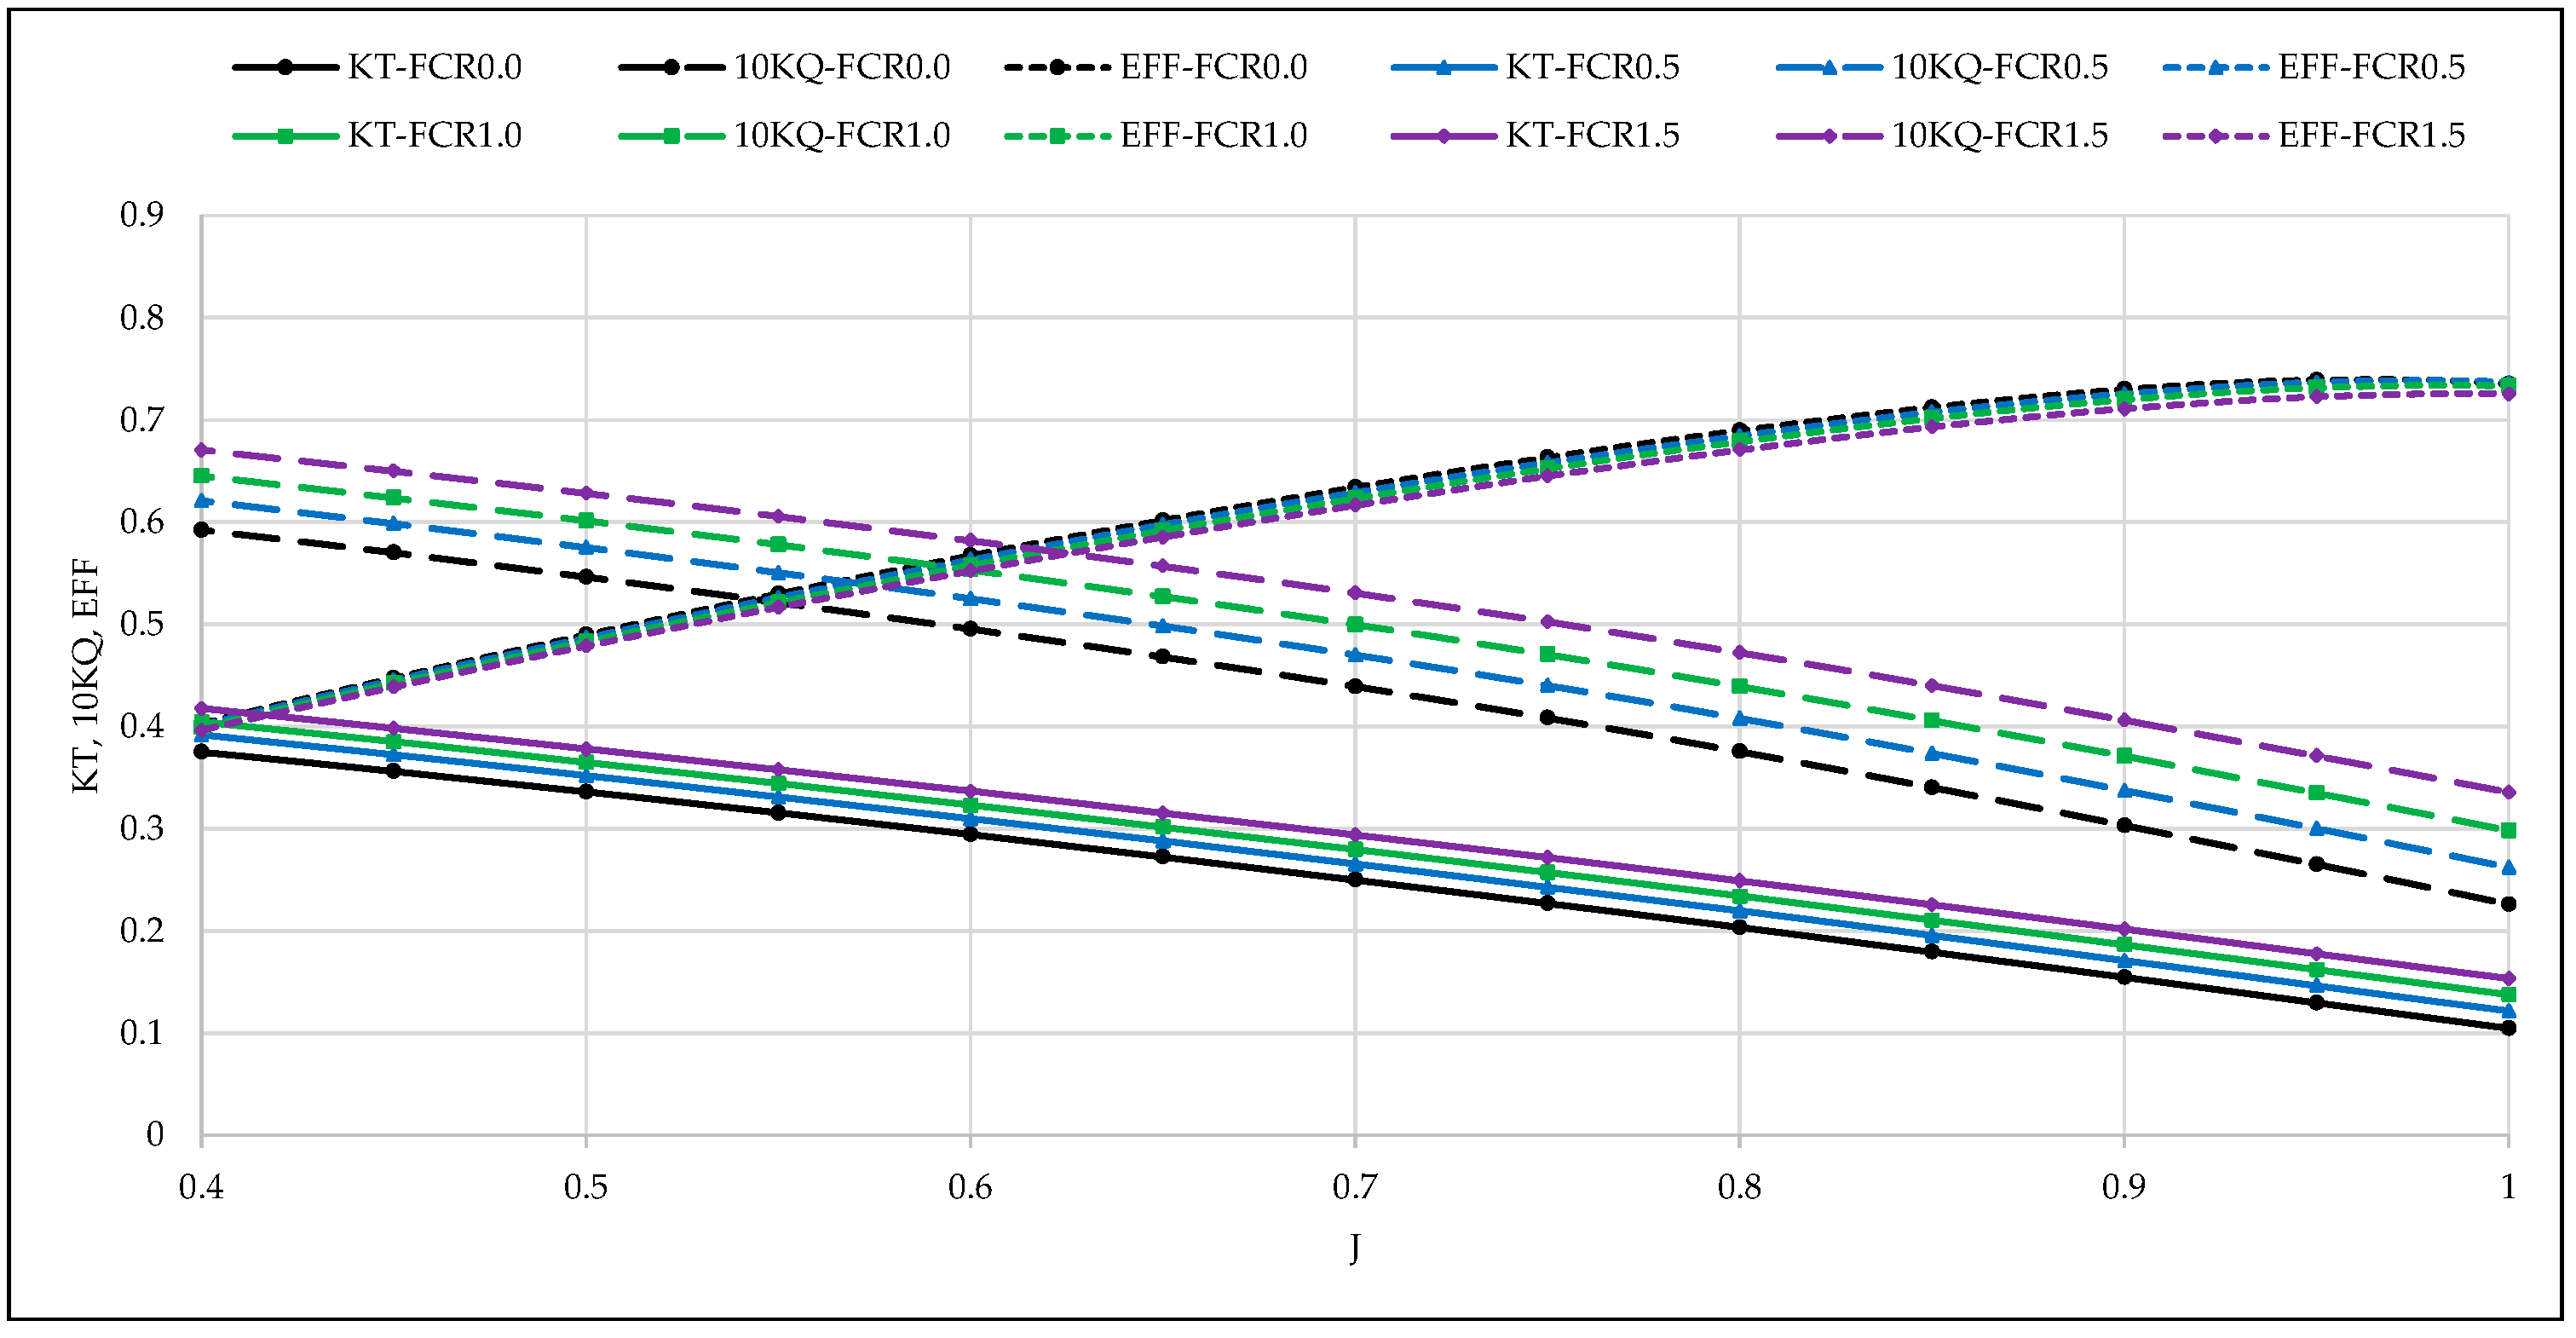
4.2. Effect of FCR on Propeller Performance

Using CFD models, the open-water curve for each proposed propeller is calculated at different FCR. Figure 11 presents a comparative analysis of performance parameters across different FCR levels. As FCR increases, the KT and KQ coefficients show a noticeable rise, indicating an improvement in propeller performance without altering the core geometry. This enhancement suggests that FCR adjustments could optimize thrust and torque output for the given operational conditions, potentially contributing to more efficient propulsion. However, the analysis also reveals a slight reduction in overall efficiency as FCR levels increase. This is primarily due to the increase in torque.
To ensure accuracy in the computed results for propellers with varying FCR values, the validated CFD configuration model, based on the reference B-series, is applied to simulate different proposed propellers by altering only the propeller geometry. Similar to the reference propeller, the open-water curve serves as a basis for comparing the performance derived from CFD simulations against empirical formulas. Figure 12 shows these comparisons, showing an average error percentage of 4% for the thrust coefficient and 6.2% for the torque coefficient across the three cases. This small margin of error highlights the reliability of the CFD model in predicting performance variations due to FCR adjustments. Consistent with the proposed method in NavCad, the model demonstrates improved performance with increasing FCR, validating its accuracy and effectiveness.
Based on the previous verification procedures, the propeller performance results are computed based on the open water curves generated from CFD models and implemented into NavCad. The results are presented in a normalized manner where the value of each parameter is divided by the maximum of all values in this parameter, as shown in Figure 13, Figure 14 and Figure 15, and the real values are presented in Appendix A. These Figures showcase the effects of varying FCR levels on key performance metrics, allowing for a clear comparison of how different FCR adjustments influence the overall efficiency and effectiveness of the propeller. By visualizing the changes in performance parameters, it becomes evident how the optimized FCR levels contribute to improved propulsion characteristics.
As shown in Figure 13, it has been observed that the propeller speed decreases by 5%, reaching its minimum level at a higher face camber ratio. This adjustment in FCR results in an enhancement in ηo due to the shift of the operating point, as noted in the increase of J.
The KT and KQ exhibit even more pronounced improvements, each increasing by more than 10% with the higher FCR compared to the reference propeller. These enhancements suggest a more effective conversion of engine power into thrust and rotational force, contributing to the overall propulsion efficiency.
According to the standard equations used, the wake fraction (w) and thrust deduction factor (t) remain consistent across the different simulated cases.
The noise and cavitation criteria have been analyzed and compared with the increase in the levels of FCR, as shown in Figure 14.
In terms of noise, the tip cavitation is notably reduced due to a decrease in propeller speed by up to 5%. This reduction in speed plays a crucial role in mitigating noise.
In terms of cavitation, the minimum EAR required to avoid cavitation, according to Keller, and the average loading pressure, in accordance with Burrill’s findings, do not show any significant changes in the different cases of FCRs. The percentage of back cavitation experiences an increase of 12.5% when comparing the propeller with a high FCR to the normal one. Also, the minimum pitch to diameter required to avoid face cavitation shows an increase. This increase is attributed to the higher J and KT, as these parameters are directly related to the pitch to diameter based on the equation developed by the team members of Hydrocomp [22]. While an increment in the value of the minimum pitch to diameter is required to avoid face cavitation, the designed pitch remains sufficiently high, ensuring the safety and integrity of the propeller. Despite this increment, the designed pitch provides a robust safety margin, effectively preventing cavitation and maintaining efficient propulsion.
While keeping the gearbox ratio constant, the engine speed and brake power are reduced to achieve the same propeller thrust necessary for the desired ship speed. This technique offers a significant reduction in fuel consumption, achieving an improvement of up to 3% with a high FCR compared to the initial propeller design. This reduction in fuel consumption not only enhances the operational efficiency of the vessel but also leads to a notable decrease in various exhaust emissions, as shown in Figure 15. By optimizing the propeller design with a higher FCR, the engine operates more efficiently at lower speeds and power outputs, maintaining the required thrust for propulsion. Figure 16 shows the propeller performance curves for different FCRs, showing a shift to the left towards higher loading conditions, even with the same primary propeller geometry. Despite this shift, the performance remains within the safe operating zone of the engine load diagram. This optimization ensures that the engine and propeller function smoothly under challenging weather conditions without imposing excessive loads on the engine.
By optimizing the GBR according to the rated operating point within the engine load diagram while maintaining the same propeller geometry, the propeller curves for different FCRs demonstrate consistent performance and shift to the right, offering greater flexibility for ship operations under high weather and loading conditions. The new propeller curves are presented in Figure 17, showing that optimizing the GBR for a new propeller design provides a comprehensive retrofit and flexible solution for the propulsion system.
This efficiency translates into less fuel burned per unit of distance traveled, thereby lowering the overall fuel consumption. The subsequent reduction in exhaust emissions, including CO2 and sulfur oxides (SOx), contributes to a more environmentally friendly operation. CO2 and SOx emissions directly correlate with fuel consumption since they are calculated using emission factors. Consequently, any changes in fuel consumption will result in proportional changes in CO2 and SOx emissions. An increase in the nitrogen oxides (NOx) by around 9% due to the changes in operating points and engine maps due to their dependence on the combustion behavior and the chemical reactions described by the extended Zeldovich mechanism [60]. This relationship indicates that improvements in fuel efficiency not only reduce fuel consumption but also lower emissions of CO2, SOx, and, to a slightly different extent, NOx.

5. Conclusions

This paper presents the effect of FCR on propeller performance during the preliminary stage of ship design, focusing on enhancing energy efficiency by improving fuel economy and reducing exhaust emissions. CFD models and empirical formulas are used to perform the computation to ensure the accuracy of the outcomes. FCR levels ranging from 0.5% to 1.5% are applied to a designed propeller, leading to several key findings:
  • The open-water curves from both CFD and NavCad models exhibit strong agreement across different propellers and FCR levels;
  • Increasing the FCR level slightly enhances propeller efficiency by improving thrust and torque coefficients;
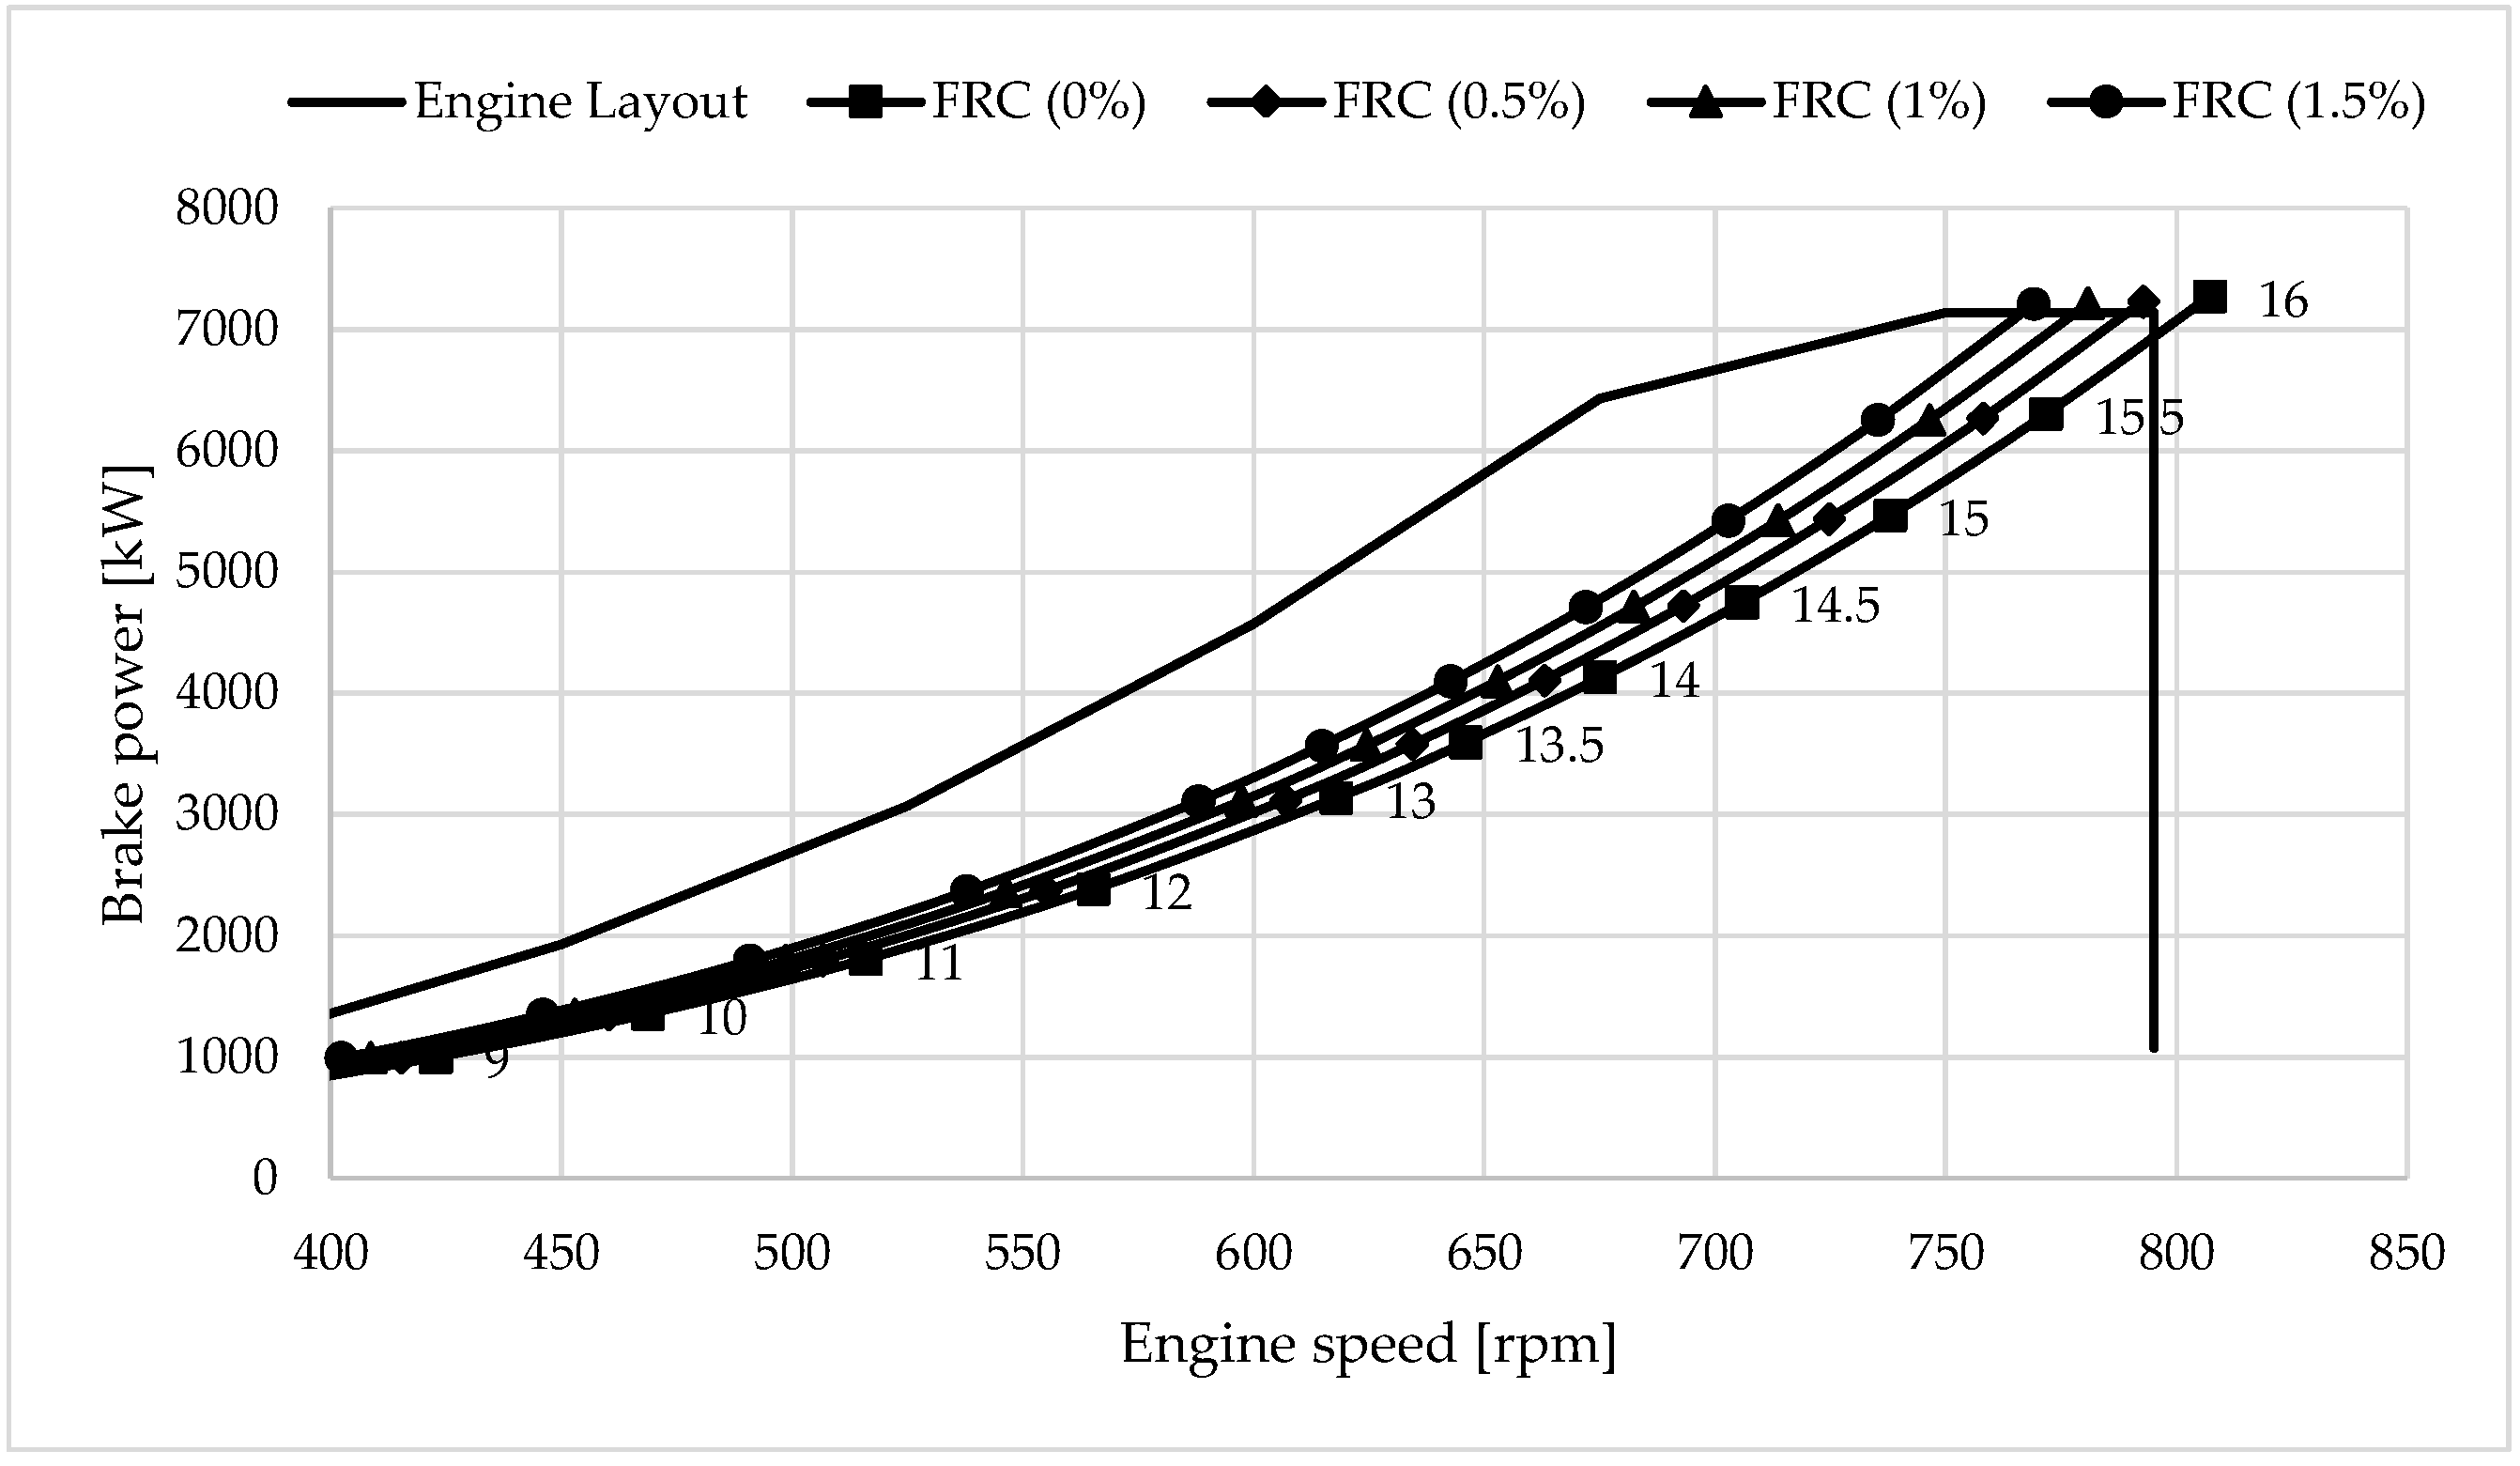
  • Higher FCR levels contribute to fuel savings and lower exhaust emissions, achieving up to a 3% reduction compared to the reference propeller;
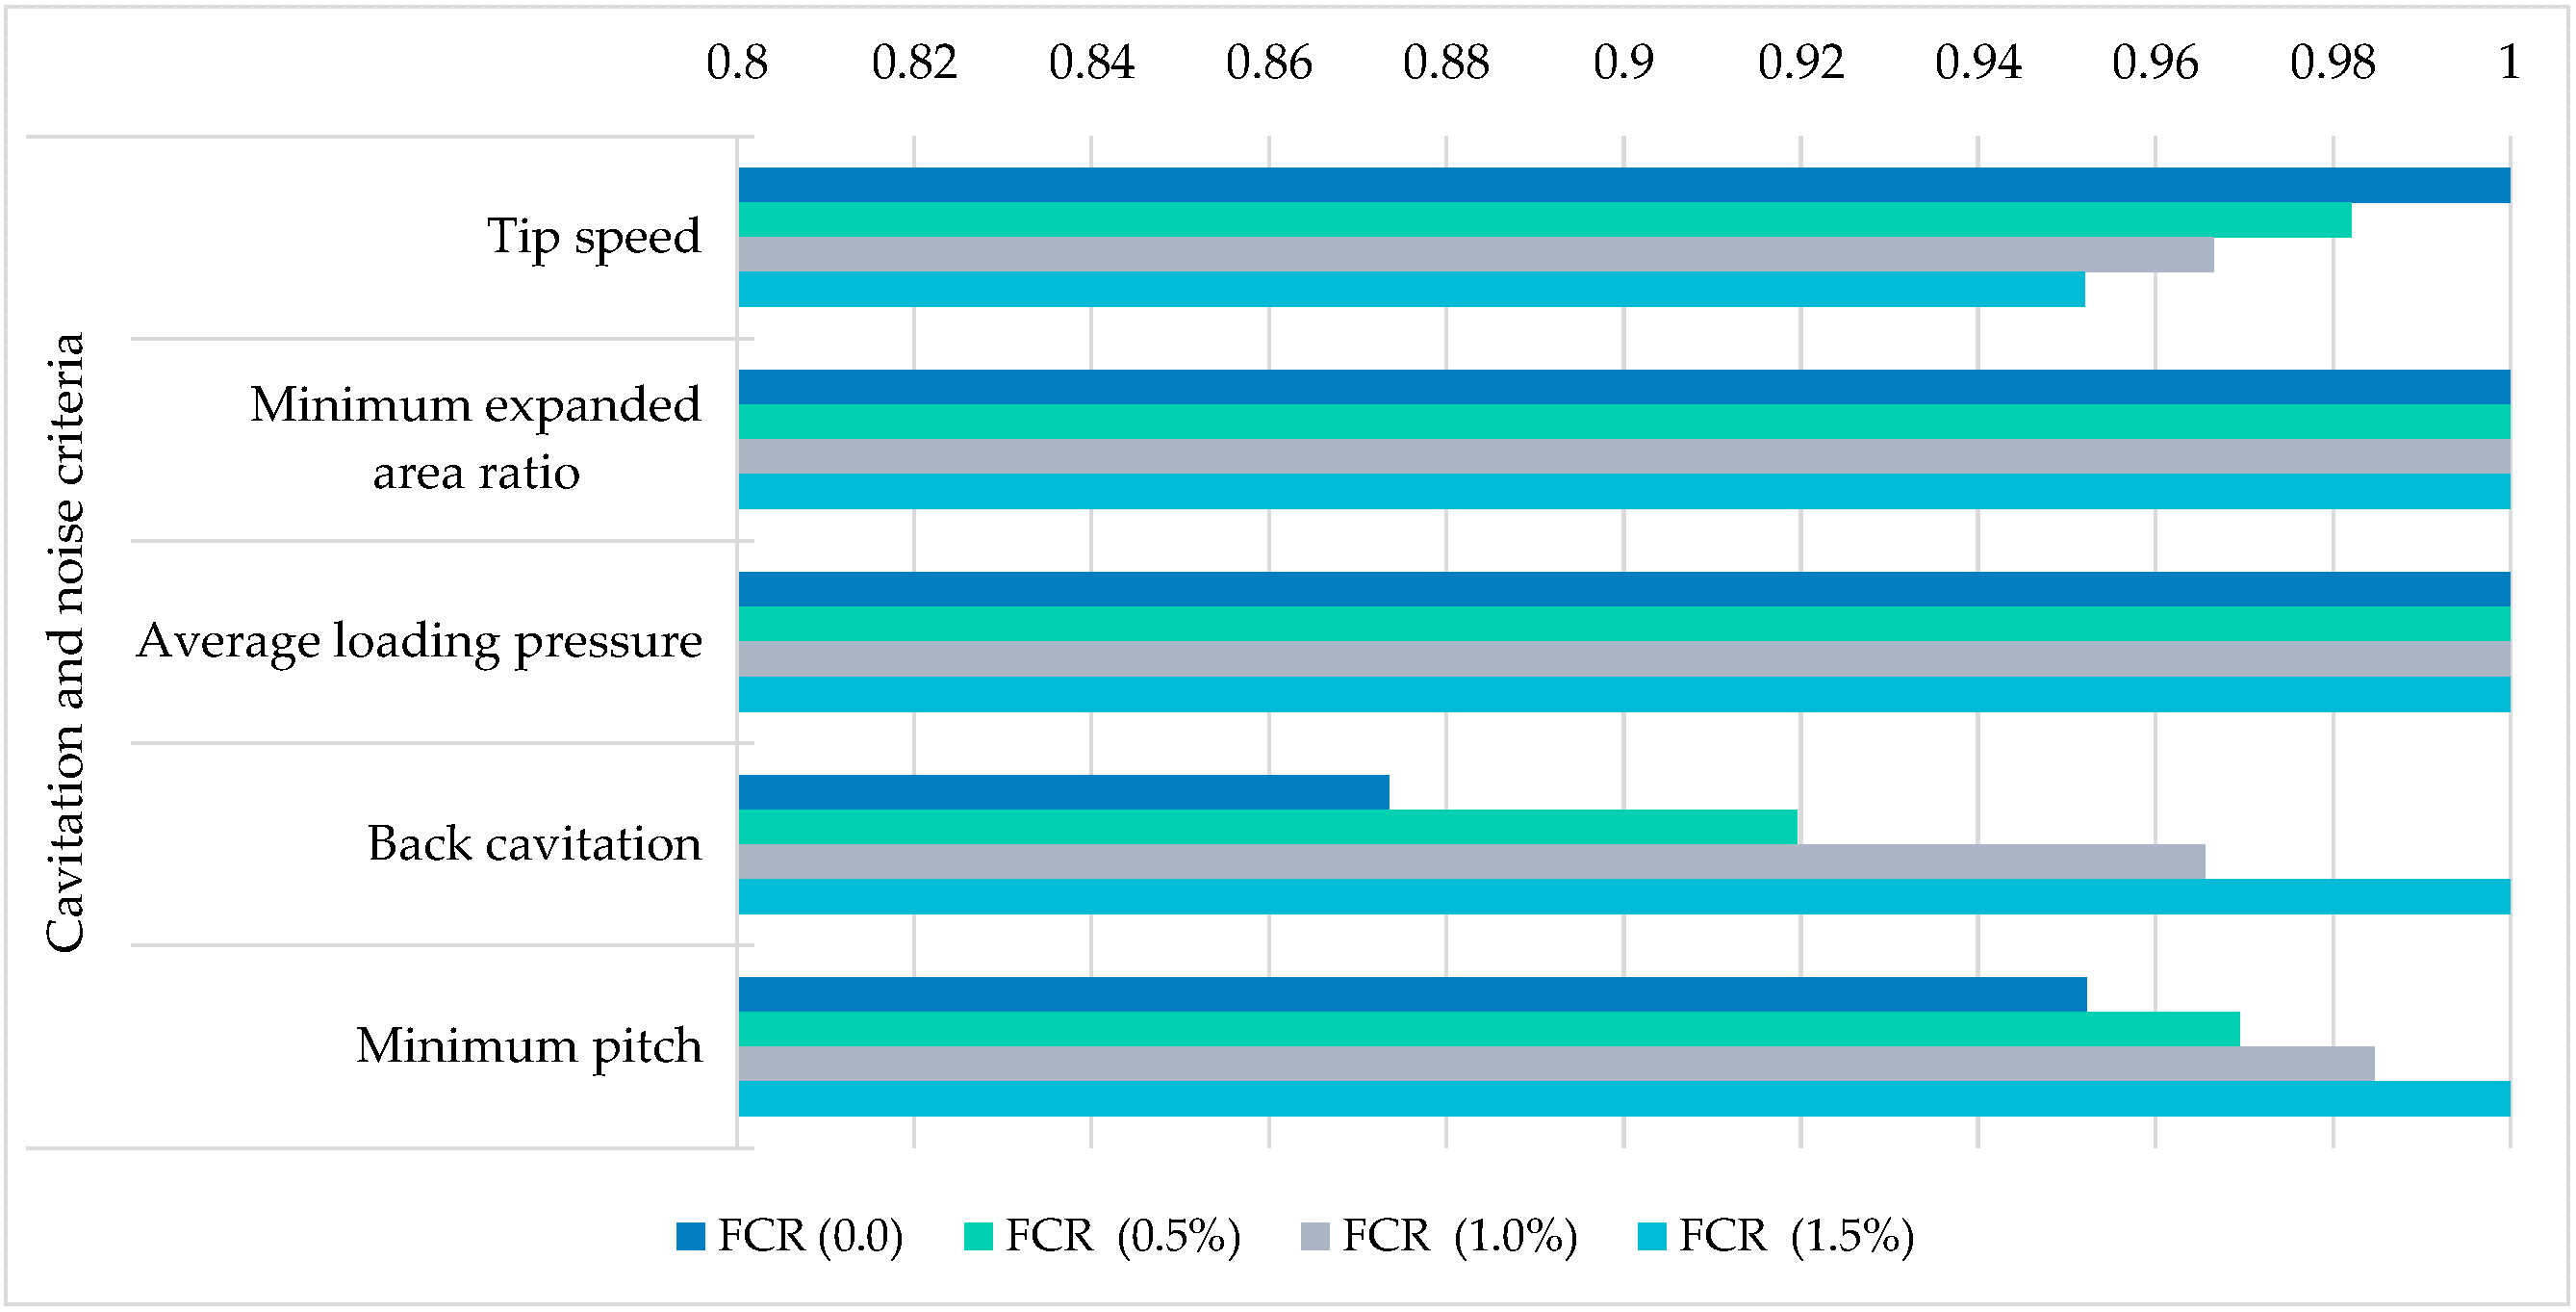
  • Noise levels are reduced by approximately 5% compared to the baseline, which improves operational comfort and environmental compliance;
  • There is no change in the cavitation criteria, such as the minimum expanded area ratio and average loading pressure. However, back cavitation and minimum pitch to avoid cavitation increase with higher FCR levels.
These insights are essential for optimizing propeller design to align with the ship’s operational profile, ensuring that the selected solution not only achieves performance targets but also supports sustainable and economical maritime operations. This comprehensive approach underscores the value of tailored designs that maximize efficiency, performance, and environmental compliance, supporting the industry’s broader goals of reducing environmental impact and operational costs.
This study offers a preliminary evaluation of propeller performance-based FCR techniques using empirical formulas and CFD models. Future work will involve experimental testing and CFD simulations for various propeller series, providing deeper insights into performance optimization and validating simulation results for detailed propeller design.

Author Contributions

The concept of the problem is developed by M.T. The analysis is performed by M.T. and Z.S. and the writing of the original draft manuscript was completed by M.T., Z.S. and W.S. All authors have read and agreed to the published version of the manuscript.

Funding

This research received no external funding.

Institutional Review Board Statement

Not applicable.

Informed Consent Statement

Not applicable.

Data Availability Statement

The data presented in this study are available on request from the corresponding author.

Conflicts of Interest

The authors declare no conflicts of interest.

Abbreviations

3DThree dimensional
AMatrix of linear inequality constraints
AeqMatrix of linear equality constraints
APIApplication programming interface
bVector of linear inequality constraints
beqVector of linear equality constraints
BSFCBrake-specific fuel consumption
cInequality constraints
ceqEquality constraints
CFDComputational fluid dynamics
CO2Carbon dioxide
CRPContra-rotating propeller
DPropeller diameter
DESDetached Eddy Simulation
DNSDirect Numerical Simulation
EARExpanded blade area ratio
EARminMinimum expanded blade area ratio to avoid cavitation
ESDEnergy saving devices
f(x)Optimization model objective
FCFuel consumption
FCRFace camber ratio
g(x)Penalty function
gAcceleration
GAGenetic algorithm
GBRGearbox ratio
i, jCartesian coordinates
IMOInternational Maritime Organization
ITTCInternational Towing Tank Conference
jNumber of constraints
JAdvance coefficient
kturbulent kinetic energy
KQTorque coefficient
KTThrust coefficient
lbLower bounds
LESLarge Eddy Simulation
MARPOLInternational Convention for the Prevention of Pollution from Ships
nPropeller speed
NOxNitrogen oxides
pPressure
P/DPitch-to-diameter ratio
PBBrake power
PSOParticle swarm optimization
QTorque
RConstant
RANSReynolds-Averaged Navier-Stokes
RBMRigid Body Motion
RTTotal resistance
SOxSulfur oxides
SSTShear stress transport
tTimeThrust deduction factor
TThrust
uVelocity
ubUpper bounds
vFluid kinematic viscosity
VIncoming velocities
VAAdvance speed
VsShip design speed
wWake fraction
xNumber of variables
y+ Dimensionless wall distance
ZNumber of propeller blades
γKinematic viscosityTurbulent viscosity
ηoOpen-water propeller efficiency
ρDensity
ωSpecific dissipation rate

Appendix A

Table A1. Propeller characteristics for different percentages of the FCR.
Solution
Technique
Max
Efficiency
Min Fuel Consumption
Software NavCadCFD
ParametersNo FCRNo FCRNo FCRLight FCRMedium FCRHeavy FCR
Propeller type Wageningen B-Series
Ship SpeedVs14.514.514.514.514.514.5
FCR [%]0.00.00.00.51.01.5
Propeller
characteristics
D [m]6.06.06.06.06.06.0
EAR [-]0.570.470.470.470.470.47
P [m]4.926.586.586.586.586.58
N [RPM]917574737271
Thrust [kN]576.5576.5576.5576.5576.5576.5
Torque [kN.m]473.7573.3588.3595.7604.0613.0
ηo [%]59.359.358.558.858.959.0
J [-]0.510.620.630.640.650.66
KT [-]0.190.280.280.290.300.31
KQ [-]0.020.050.050.050.050.06
w [-]0.380.380.380.380.380.38
t [-]0.190.190.190.190.190.19
Cavitation and noise criteriaTip Speed [m/s]28.623.623.322.922.622.2
EARmin [-]0.470.470.470.470.470.47
Average loading pressure [kPa]35.543.643.443.443.443.4
Back Cavitation [%]2.07.47.68.08.48.7
Pitchmin [m]4110.64978.75039.15131.05211.55292.3
Gearbox
characteristics
GBR [-]7.769.519.519.519.519.51
Engine
characteristics
Speed [RPM]706714706693682672
Speed percentage [%] *94.195.294.192.490.989.6
Brake Power [kW]471546824747472047134710
Engine load percentage [%] **66.065.666.5066.1266.0165.97
BSFC [g/kW.h]191.0192.0191.5189.6188.3187.0
Fuel consumption [kg/nm]62.1761.9562.6961.7461.1960.74
Exhaust
emissions
CO2 [kg/nm]197.1196.3198.7195.7194.0192.5
NOx [kg/nm]2.252.162.292.352.412.48
SOx [kg/nm]3.113.103.133.093.063.04
* Speed percentage is the ratio of the engine speed at the design condition to the engine-rated speed multiplied by 100. ** Engine load percentage is the ratio of the brake power at the design condition to the engine-rated power multiplied by 100.

References

  1. Tadros, M.; Ventura, M.; Guedes Soares, C. Review of current regulations, available technologies, and future trends in the green shipping industry. Ocean Eng. 2023, 280, 114670. [Google Scholar] [CrossRef]
  2. Bouman, E.A.; Lindstad, E.; Rialland, A.I.; Strømman, A.H. State-of-the-art technologies, measures, and potential for reducing GHG emissions from shipping—A review. Transp. Res. D Transp. Environ. 2017, 52, 408–421. [Google Scholar] [CrossRef]
  3. Karatuğ, Ç.; Tadros, M.; Ventura, M.; Guedes Soares, C. Decision support system for ship energy efficiency management based on an optimization model. Energy 2024, 292, 130318. [Google Scholar] [CrossRef]
  4. DNV. Maritime Forecast to 2050: Energy Transition Outlook 2020; DNV: Oslo, Norway, 2020. [Google Scholar]
  5. Vettor, R.; Guedes Soares, C. Development of a ship weather routing system. Ocean Eng. 2016, 123, 1–14. [Google Scholar] [CrossRef]
  6. Prpić-Oršić, J.; Vettor, R.; Faltinsen, O.M.; Guedes Soares, C. The influence of route choice and operating conditions on fuel consumption and CO2 emission of ships. J. Mar. Sci. Technol. 2016, 21, 434–457. [Google Scholar] [CrossRef]
  7. Zaccone, R.; Ottaviani, E.; Figari, M.; Altosole, M. Ship voyage optimization for safe and energy-efficient navigation: A dynamic programming approach. Ocean Eng. 2018, 153, 215–224. [Google Scholar] [CrossRef]
  8. Khan, S.; Grudniewski, P.; Muhammad, Y.S.; Sobey, A.J. The benefits of co-evolutionary Genetic Algorithms in voyage optimisation. Ocean Eng. 2022, 245, 110261. [Google Scholar] [CrossRef]
  9. Taskar, B.; Sasmal, K.; Yiew, L.J. A case study for the assessment of fuel savings using speed optimization. Ocean Eng. 2023, 274, 113990. [Google Scholar] [CrossRef]
  10. Farkas, A.; Degiuli, N.; Martić, I. The impact of biofouling on the propeller performance. Ocean Eng. 2021, 219, 108376. [Google Scholar] [CrossRef]
  11. Xing-Kaeding, Y.; Streckwall, H.; Gatchell, S. ESD design and analysis for a validation bulk carrier. Int. Shipbuild. Prog. 2017, 63, 137–168. [Google Scholar] [CrossRef]
  12. Tacar, Z.; Sasaki, N.; Atlar, M.; Korkut, E. An investigation into effects of Gate Rudder® system on ship performance as a novel energy-saving and manoeuvring device. Ocean Eng. 2020, 218, 108250. [Google Scholar] [CrossRef]
  13. Stark, C.; Xu, Y.; Zhang, M.; Yuan, Z.; Tao, L.; Shi, W. Study on Applicability of Energy-Saving Devices to Hydrogen Fuel Cell-Powered Ships. J. Mar. Sci. Eng. 2022, 10, 388. [Google Scholar] [CrossRef]
  14. Gaggero, S.; Martinelli, M. Pre-swirl fins design for improved propulsive performances: Application to fast twin-screw passenger ships. J. Ocean Eng. Mar. Energy 2023, 9, 69–91. [Google Scholar] [CrossRef]
  15. Mohd Noor, C.W.; Noor, M.M.; Mamat, R. Biodiesel as alternative fuel for marine diesel engine applications: A review. Renew Sust Energ Rev 2018, 94, 127–142. [Google Scholar] [CrossRef]
  16. Bicer, Y.; Dincer, I. Clean fuel options with hydrogen for sea transportation: A life cycle approach. Int. J. Hydrog. Energy 2018, 43, 1179–1193. [Google Scholar] [CrossRef]
  17. Hansson, J.; Månsson, S.; Brynolf, S.; Grahn, M. Alternative marine fuels: Prospects based on multi-criteria decision analysis involving Swedish stakeholders. Biomass Bioenergy 2019, 126, 159–173. [Google Scholar] [CrossRef]
  18. Islam Rony, Z.; Mofijur, M.; Hasan, M.M.; Rasul, M.G.; Jahirul, M.I.; Forruque Ahmed, S.; Kalam, M.A.; Anjum Badruddin, I.; Yunus Khan, T.M.; Show, P.-L. Alternative fuels to reduce greenhouse gas emissions from marine transport and promote UN sustainable development goals. Fuel 2023, 338, 127220. [Google Scholar] [CrossRef]
  19. Tadros, M.; Shi, W.; Xu, Y.; Song, Y. A unified cross-series marine propeller design method based on machine learning. Ocean Eng. 2024, 314, 119691. [Google Scholar] [CrossRef]
  20. Carlton, J. Marine Propellers and Propulsion, 2nd ed.; Butterworth-Heinemann: Oxford, UK, 2012. [Google Scholar]
  21. Markussen, P.A. On the Optimum Wageningen B-Series Propeller Problem with Cavitation-Limiting Restraint. J. Ship Res. 1979, 23, 108–114. [Google Scholar] [CrossRef]
  22. Hydrocomp. NavCad: Hydrodynamic and Propulsion System Simulation. HydroComp Inc. Available online: https://www.hydrocompinc.com/solutions/navcad/ (accessed on 15 April 2024).
  23. Nouri, N.M.; Mohammadi, S.; Zarezadeh, M. Optimization of a marine contra-rotating propellers set. Ocean Eng. 2018, 167, 397–404. [Google Scholar] [CrossRef]
  24. Gaggero, S.; Tani, G.; Villa, D.; Viviani, M.; Ausonio, P.; Travi, P.; Bizzarri, G.; Serra, F. Efficient and multi-objective cavitating propeller optimization: An application to a high-speed craft. Appl. Ocean Res. 2017, 64, 31–57. [Google Scholar] [CrossRef]
  25. Obwogi, E.O.; Shen, H.-l.; Su, Y.-m. The design and energy saving effect prediction of rudder-bulb-fin device based on CFD and model test. Appl. Ocean Res. 2021, 114, 102814. [Google Scholar] [CrossRef]
  26. Vlašić, D.; Degiuli, N.; Farkas, A.; Martić, I. The preliminary design of a screw propeller by means of computational fluid dynamics. Brodogradnja 2018, 69, 129–147. [Google Scholar] [CrossRef]
  27. Epps, B.P.; Kimball, R.W. OpenProp v3: Open-Source Software for the Design and Analysis of Marine Propellers and Horizontal-Axis Turbines. Available online: https://www.epps.com/openprop (accessed on 1 October 2016).
  28. Bacciaglia, A.; Ceruti, A.; Liverani, A. Controllable pitch propeller optimization through meta-heuristic algorithm. Eng. Comput. 2021, 37, 2257–2271. [Google Scholar] [CrossRef]
  29. Anevlavi, D.; Zafeiris, S.; Papadakis, G.; Belibassakis, K. Efficiency Enhancement of Marine Propellers via Reformation of Blade Tip-Rake Distribution. J. Mar. Sci. Eng. 2023, 11, 2179. [Google Scholar] [CrossRef]
  30. Perić, M. Prediction of cavitation on ships. Brodogradnja 2022, 73, 39–58. [Google Scholar] [CrossRef]
  31. Gaafary, M.M.; El-Kilani, H.S.; Moustafa, M.M. Optimum design of B-series marine propellers. Alex. Eng. J. 2011, 50, 13–18. [Google Scholar] [CrossRef]
  32. Xie, G. Optimal Preliminary Propeller Design Based on Multi-objective Optimization Approach. Procedia Eng. 2011, 16, 278–283. [Google Scholar] [CrossRef]
  33. Tadros, M.; Ventura, M.; Guedes Soares, C. Design of Propeller Series Optimizing Fuel Consumption and Propeller Efficiency. J. Mar. Sci. Eng. 2021, 9, 1226. [Google Scholar] [CrossRef]
  34. Ge, M.; Zhang, G.; Petkovšek, M.; Long, K.; Coutier-Delgosha, O. Intensity and regimes changing of hydrodynamic cavitation considering temperature effects. J. Clean. Prod. 2022, 338, 130470. [Google Scholar] [CrossRef]
  35. Ge, M.; Manikkam, P.; Ghossein, J.; Kumar Subramanian, R.; Coutier-Delgosha, O.; Zhang, G. Dynamic mode decomposition to classify cavitating flow regimes induced by thermodynamic effects. Energy 2022, 254, 124426. [Google Scholar] [CrossRef]
  36. Bertetta, D.; Brizzolara, S.; Gaggero, S.; Viviani, M.; Savio, L. CPP propeller cavitation and noise optimization at different pitches with panel code and validation by cavitation tunnel measurements. Ocean Eng. 2012, 53, 177–195. [Google Scholar] [CrossRef]
  37. Aktas, B.; Atlar, M.; Turkmen, S.; Shi, W.; Sampson, R.; Korkut, E.; Fitzsimmons, P. Propeller cavitation noise investigations of a research vessel using medium size cavitation tunnel tests and full-scale trials. Ocean Eng. 2016, 120, 122–135. [Google Scholar] [CrossRef]
  38. MacPherson, D.M. Small Propeller Cup: A Proposed Geometry Standard and a New Performance Model. In Proceedings of the 8th Propeller and Shafting Symposium (SNAME), Virginia Beach, VA, USA, 23–24 September 1997. [Google Scholar]
  39. Samsul, M.B. Blade Cup Method for Cavitation Reduction in Marine Propellers. Pol. Marit. Res. 2021, 28, 54–62. [Google Scholar] [CrossRef]
  40. Mohammad Nouri, N.; Mohammadi, S. Numerical investigation of the effects of camber ratio on the hydrodynamic performance of a marine propeller. Ocean Eng. 2018, 148, 632–636. [Google Scholar] [CrossRef]
  41. Guan, G.; Zhang, X.; Wang, P.; Yang, Q. Multi-objective optimization design method of marine propeller based on fluid-structure interaction. Ocean Eng. 2022, 252, 111222. [Google Scholar] [CrossRef]
  42. MAN Diesel & Turbo. Four-Stroke Project Guides. MAN Diesel & Turbo. Available online: https://www.man-es.com/marine/products/planning-tools-and-downloads/project-guides/four-stroke (accessed on 22 July 2022).
  43. Tadros, M.; Vettor, R.; Ventura, M.; Guedes Soares, C. Effect of propeller cup on the reduction of fuel consumption in realistic weather conditions. J. Mar. Sci. Eng. 2022, 10, 1039. [Google Scholar] [CrossRef]
  44. The MathWorks Inc. Fmincon. Available online: https://www.mathworks.com/help/optim/ug/fmincon.html (accessed on 2 June 2017).
  45. Michalewicz, Z.; Schoenauer, M. Evolutionary algorithms for constrained parameter optimization problems. Evol. Comput. 1996, 4, 1–32. [Google Scholar] [CrossRef]
  46. Zhao, J.; Xu, M. Fuel economy optimization of an Atkinson cycle engine using genetic algorithm. Appl. Energy 2013, 105, 335–348. [Google Scholar] [CrossRef]
  47. Byrd, R.H.; Mary, E.H.; Nocedal, J. An Interior Point Algorithm for Large-Scale Nonlinear Programming. SIAM J. Optimiz. 1999, 9, 877–900. [Google Scholar] [CrossRef]
  48. Tadros, M.; Ventura, M.; Guedes Soares, C. Optimization procedure to minimize fuel consumption of a four-stroke marine turbocharged diesel engine. Energy 2019, 168, 897–908. [Google Scholar] [CrossRef]
  49. Holtrop, J. A statistical re-analysis of resistance and propulsion data. Int. Shipbuild. Prog. 1984, 31, 272–276. [Google Scholar]
  50. Holtrop, J. A Statistical Resistance Prediction Method With a Speed Dependent Form Factor. In Proceedings of the Scientific and Methodological Seminar on Ship Hydrodynamics (SMSSH ’88), Varna, Bulgaria, 17–22 October 1988; Bulgarian Ship Hydrodynamics Centre: Varna, Bulgaria, 1988; pp. 1–7. [Google Scholar]
  51. Holtrop, J.; Mennen, G.G.J. An approximate power prediction method. Int. Shipbuild. Prog. 1982, 29, 166–170. [Google Scholar] [CrossRef]
  52. Kaplan, A. Progressive Pitch Distributions: (Part 2) Performance. HydroComp, Inc. Available online: https://www.hydrocompinc.com/wp-content/uploads/2020/02/NMPA-Newsletter-Part-2-HCI.pdf (accessed on 12 May 2024).
  53. Kuiper, G. Cavitation Inception on Ship Propeller Models. Ph.D. Thesis, Technical University Delft, Delft, The Netherlands, 1981. [Google Scholar]
  54. Van Oossanen, P. Calculation of Performance and Cavitation Characteristics of Propellers Including Effects on Non-Uniform Flow and Viscosity. Ph.D. Thesis, Technical University Delft, Delft, The Netherlands, 1974. [Google Scholar]
  55. Hydrocomp. PropCad: Propeller Design for Manufacture. Available online: https://www.hydrocompinc.com/solutions/propcad/#:~:text=PropCad%20keeps%20your%20drawings%2C%20reports,blade%20shapes%20with%20progressive%20pitch (accessed on 8 July 2024).
  56. Siemens. Simcenter STAR-CCM+ Documentation (Version 2301); Siemens Digital Industries Software: Plano, TX, USA, 2023. [Google Scholar]
  57. Grlj, C.G.; Degiuli, N.; Farkas, A.; Martić, I. Numerical Study of Scale Effects on Open Water Propeller Performance. J. Mar. Sci. Eng. 2022, 10, 1132. [Google Scholar] [CrossRef]
  58. Menter, F.R. Two-equation eddy-viscosity turbulence models for engineering applications. AIAA J 1994, 32, 1598–1605. [Google Scholar] [CrossRef]
  59. ITTC. ITTC–Recommended Procedures and Guidelines: Practical Guidelines for Ship Self-Propulsion CFD. In Proceedings of the 30th International Towing Tank Conference, ITTC, Hobart, Australia, 17–22 September 2014. [Google Scholar]
  60. Heywood, J.B. Internal Combustion Engine Fundamentals; McGraw-Hill: New York, NY, USA, 1988; pp. 72–83. [Google Scholar]
Figure 1. Section of a propeller blade with a cup [38].
Jmse 12 02225 g001
Figure 2. Section of a propeller blade with a face camber offset [22].
Jmse 12 02225 g002
Figure 3. Overview of ship profile of the bulk carrier.
Jmse 12 02225 g003
Figure 4. Schematic diagram of the developed propeller optimization model.
Jmse 12 02225 g004
Figure 5. Schematic diagram of the optimization tool for the concept of design.
Jmse 12 02225 g005
Figure 6. Comparison of blade sections at 0.7R for different FCRs.
Jmse 12 02225 g006
Figure 7. Front side and back side view of marine propeller integrated into the CFD model. (a) Front view of the propeller; (b) back view of the propeller.
Jmse 12 02225 g007
Figure 8. Computational domain and boundary conditions.
Jmse 12 02225 g008
Figure 9. Mesh of the propeller and computational domain.
Jmse 12 02225 g009
Figure 10. Comparison between the open water curves for B5–47 propeller performance.
Jmse 12 02225 g010
Figure 11. Comparison between the CFD open water curve of the propeller with different FCR.
Jmse 12 02225 g011
Figure 12. Comparison between the open water curves for B5–47 propeller performance at different FCR (a) 0.5%, (b) 1.0%, and (c) 1.5%.
Jmse 12 02225 g012aJmse 12 02225 g012b
Figure 13. Variation of normalized propeller characteristics for different FCR.
Jmse 12 02225 g013
Figure 14. Variation of normalized cavitation criteria for different FCR.
Jmse 12 02225 g014
Figure 15. Variation of normalized engine performance and exhaust emissions for different FCRs.
Jmse 12 02225 g015
Figure 16. Propeller curve inside the engine load diagram for different FCRs.
Jmse 12 02225 g016
Figure 17. Propeller curve inside the engine load diagram for different FCRs and optimized GBR.
Jmse 12 02225 g017
Table 1. Main characteristics of the bulk carrier.
ItemUnitValue
Length waterlinem154.00
Breadthm23.11
Draftm10.00
Displacementtonne27,690
Service speedknot14.5
Maximum speedknot16.0
Rated powerkW7140
Table 2. Main characteristics of diesel engine [42].
ItemUnitValue
Engine builder-MAN Energy Solutions
Brand name-MAN
Boremm320
Strokemm440
DisplacementLiter4954
Number of cylinders-14
Rated speedrpm750
Rated powerkW7140
Table 3. Main characteristics of propeller.
ItemUnitValue
Number of propellers-1
Propeller series B-series
Type of propeller-FPP
Diametermm6000
Expanded blade area ratio -0.57
Pitch-to-diameter ratio-0.82
Table 4. Test matrix for different propeller FCRs.
J [-]V [m/s]
FCR 0%0.4–13–7.5
FCR 0.5%0.4–13–7.5
FCR 1.0%0.4–13–7.5
FCR 1.5%0.4–13–7.5
Disclaimer/Publisher’s Note: The statements, opinions and data contained in all publications are solely those of the individual author(s) and contributor(s) and not of MDPI and/or the editor(s). MDPI and/or the editor(s) disclaim responsibility for any injury to people or property resulting from any ideas, methods, instructions or products referred to in the content.

