Risk Level Assessment of Typhoon Hazard Based on Loss Utility
Abstract
:1. Introduction
2. Materials and Methods
2.1. Study Area
- i.
- ii.
- When α = 0, .
- (1)
- Gumbel Copula function:
- (2)
- Frank Copula function:
- i.
- Since Equation (8) is calculated under the condition of relative loss, it is independent of the city scale. It means that the same value brings the same degree of aversion for different cities. l′ clearly has a range of [0,1].
- ii.
- The transformation of Equations (6) and (8) actually converts the random loss into a fixed loss. For instance, l′ = 30%, then it can be said that the typhoon risk faced by the city is equal to 30% of the total output loss of the city in the sense of relative loss aversion.
2.2. Data Sources
3. Engineering Calculation Example
3.1. Model Calculation
3.1.1. Probability of Typhoon Occurrence
3.1.2. Absolute Loss Aversion and Fixed Absolute Losses
3.1.3. Ranking of Typhoon Risks
3.2. Discussion
4. Conclusions
Author Contributions
Funding
Institutional Review Board Statement
Informed Consent Statement
Data Availability Statement
Conflicts of Interest
References
- Wang, L.; Chen, B.; Zhang, J. A new model for calculating the design wave height in typhoon-affected sea areas. Nat. Hazards 2013, 67, 129–143. [Google Scholar] [CrossRef]
- Zeng, Y.; Xie, Z.; Zou, J. Hydrologic and Climatic Responses to Global Anthropogenic Groundwater Extraction. J. Clim. 2017, 30, 71–90. [Google Scholar] [CrossRef]
- Hwang, S.; Son, S.; Lee, C.; Yoon, H.D. Quantitative assessment of inundation risks from physical contributors associated with future storm surges: A case study of Typhoon Maemi (2003). Nat. Hazards 2020, 104, 1389–1411. [Google Scholar] [CrossRef]
- Wang, L.; Huang, G.; Chen, Z. Risk analysis and assessment of overtopping concerning sea dikes in the case of storm surge. China Ocean. Eng. 2014, 28, 479–487. [Google Scholar] [CrossRef]
- Liu, G.; Cui, K.; Jiang, S. A new empirical distribution for the design wave heights under the impact of typhoons. Appl. Ocean. Res. 2021, 111, 102679. [Google Scholar] [CrossRef]
- Liu, G.; Gao, Z.; Chen, B. Extreme Values of Storm Surge Elevation in Hangzhou Bay. Ships Offshore Struct. 2021, 15, 431–442. [Google Scholar] [CrossRef]
- Tiedemann, H. Earthquakes and Volcanicn Eruptions: A Handbook on Risk Assessment; Swiss Reinsurance Company: Geneva, Switzerland, 1992. [Google Scholar]
- Gu, X.; Chen, Y.; Qian, Y.; Zhu, J.; Jiang, L. Evaluation of Typhoon Disaster in Ningbo and Risk Assessment Based on Analytical Hierarchy Process. J. Trop. Meteorol. 2018, 34, 489–498. [Google Scholar] [CrossRef]
- Huang, C.; Zheng, S. Fuzzy Evaluation of Typhoon Disaster Risk in Fujian. J. Green Sci. Technol. 2018, 20, 114–116. [Google Scholar] [CrossRef]
- Zhou, Y.; Cheng, X.; Cai, J. Study on Comprehensive Risk Assessment of Typhoon Disasters. China Public Secur. 2013, 1, 31–37. [Google Scholar] [CrossRef]
- Lu, Y.; Liu, H.; Wang, M. Typhoon Disaster Risk Assessment Based on Combined Weights and Fuzzy Stochastic Methods. Fuzzy Syst. Math. 2020, 34, 151–163. [Google Scholar]
- Chen, W.; Xu, W.; Shi, P. Risk assessment of typhoon disaster at county level in the Yangtze River Delta of China. J. Nat. Disasters 2011, 20, 77–83. [Google Scholar] [CrossRef]
- Yin, J.; Dai, E.; Wu, S. Integrated Risk Assessment and Zoning of Typhoon Disasters in China. Sci. Geogr. Sin. 2013, 33, 1370–1376. [Google Scholar] [CrossRef]
- Hahn, J.; Kim, J.; Kim, S.; Lee, J. Price discrimination with loss averse consumers. Econ. Theory 2018, 65, 681–728. [Google Scholar] [CrossRef]
- Liu, G.; Li, Y.; Li, X.; Han, L. Risk analysis of typhoon disaster in Guangdong based on the information diffusion technology. J. Saf. Environ. 2021, 21, 1684–1692. [Google Scholar] [CrossRef]
- Xu, Q.; Pan, J.; Liu, H. Risk Estimation of Typhoon Disaster Based on Three-dimensional Information Diffusion and Stochastic Process. J. Nanning Norm. Univ. 2020, 37, 54–69. [Google Scholar] [CrossRef]
- Bian, T.; Wang, T.; Zhou, Z. Measuring investors’ risk aversion in China’s stock market. Financ. Res. Lett. 2021, 42, 101891. [Google Scholar] [CrossRef]
- Fu, Q.; Lyu, Y.; Wu, Z.; Zhang, Y. Expectations-based loss aversion in contests. Games Econ. Behav. 2022, 133, 1–27. [Google Scholar] [CrossRef]
- Barseghyan, L.; Molinari, F.; O’Donoghue, T. The Nature of Risk Preferences: Evidence from Insurance Choices. Am. Econ. Rev. 2013, 103, 2499–2529. [Google Scholar] [CrossRef]
- Bi, J.; Cai, J. Optimal investment–reinsurance strategies with state dependent risk aversion and VaR constraints in correlated markets. Insur. Math. Econ. 2019, 85, 1–14. [Google Scholar] [CrossRef]
- Christensen, B.J.; Parra-Alvarez, J.C.; Serrano, R. Optimal control of investment, premium and deductible for a non-life insurance company. Insur. Math. Econ. 2021, 101, 384–405. [Google Scholar] [CrossRef]
- Carbajal, J.; Ely, J.C. A model of price discrimination under loss aversion and state-contingent reference points. Theor. Econ. 2016, 11, 455–485. [Google Scholar] [CrossRef]
- Raza, S.A.; Govindaluri, S.M. Pricing strategies in a dual-channel green supply chain with cannibalization and risk aversion. Oper. Res. Perspect. 2019, 6, 100118. [Google Scholar] [CrossRef]
- Wu, C.; Zheng, S.; Li, X. Effectiveness function models and it’s application about major industry accidents. J. Hefei Univ. Technol. 1996, 4, 113–117. [Google Scholar]
- Li, X.; Tang, W. On the application of the utility theory in the formal safety assessment of shipping safety. J. Saf. Environ. 2014, 14, 30–33. [Google Scholar] [CrossRef]
- Chen, L.; Zheng, J.; Gao, J.; Miao, H. Typhoon disaster emergency plan generation based on fuzzy risk assessment. J. Saf. Environ. 2022, 22, 1467–1476. [Google Scholar]
- Jung, E.; Kim, J. Optimal investiment strategies for the HARA utility under the constant elasticity of variance model. Insur. Math. Econ. 2012, 51, 667–673. [Google Scholar] [CrossRef]
- Hao, H.; Zhu, H. Comprehensive Utility Value of Each City in Henan Province. J. Henan Inst. Educ. 2021, 30, 16–22. [Google Scholar]
- Peng, J.; Xu, A.; Yang, Y. Measure Model of Security Risk Based on Utility. J. Beijing Univ. Posts Telecommun. 2006, 29, 59–62. [Google Scholar]
- Guo, J.; Huang, C.; Ai, F. Study of the typhoon dynamic risk in Guangdong province with respect to months and early warning. Syst. Eng. Theory Pract. 2015, 35, 1604–1616. [Google Scholar]
- Jiang, S.; Liu, Q. Beneficial Evaluation of Disaster Mitigation in Heightening Schemes of Embankment Engineering Based on Utility Theory. Water Resour. Plan. Des. 2019, 11, 99–102+107+162. [Google Scholar]
- Jiang, X. Research on the Risk Analysis and Management of Breakwater. Ph.D. Thesis, Tianjin University, Tianjin, China, 2007. [Google Scholar]
- Li, X. Study on Formal Safety Assessment of LNG Carrier Structures after Accidents. Ph.D. Thesis, Shanghai Jiao Tong University, Shanghai, China, 2018. [Google Scholar] [CrossRef]
- Wang, L.; Zhang, J.; Li, Y.; Zhang, Y. A statistical analysis of typhoon frequency and application in design wave height. Acta Oceanol. Sin. 2011, 30, 24–32. [Google Scholar] [CrossRef]
- Xu, J.; Ren, Q.; Lei, B. Anchoring bolt detection based on morphological filtering and variational modal decomposition. Trans. Nanjing Univ. Aeronaut. Astronaut. 2019, 36, 628–634. [Google Scholar]
- Chen, B.; Kou, Y.; Wang, Y. Analysis of storm surge characteristics based on stochastic process. AIMS Math. 2020, 6, 1177–1190. [Google Scholar] [CrossRef]
- Li, N.; Gu, X.; Liu, X. Return Period Analysis Based on Joint Distribution of Three Hazards in Dust Strom Disaster. Adv. Earth Sci. 2013, 28, 490–496. [Google Scholar]
- Liu, G.; Yu, Y.; Kou, Y. Joint probability analysis of marine environmental elements. Ocean. Eng. 2020, 215, 107879. [Google Scholar] [CrossRef]
- GB/T 19201-2006; Standardization Administration of China. Grade of tropical cyclones. China Meteorological Administration: Beijing, China, 2006.
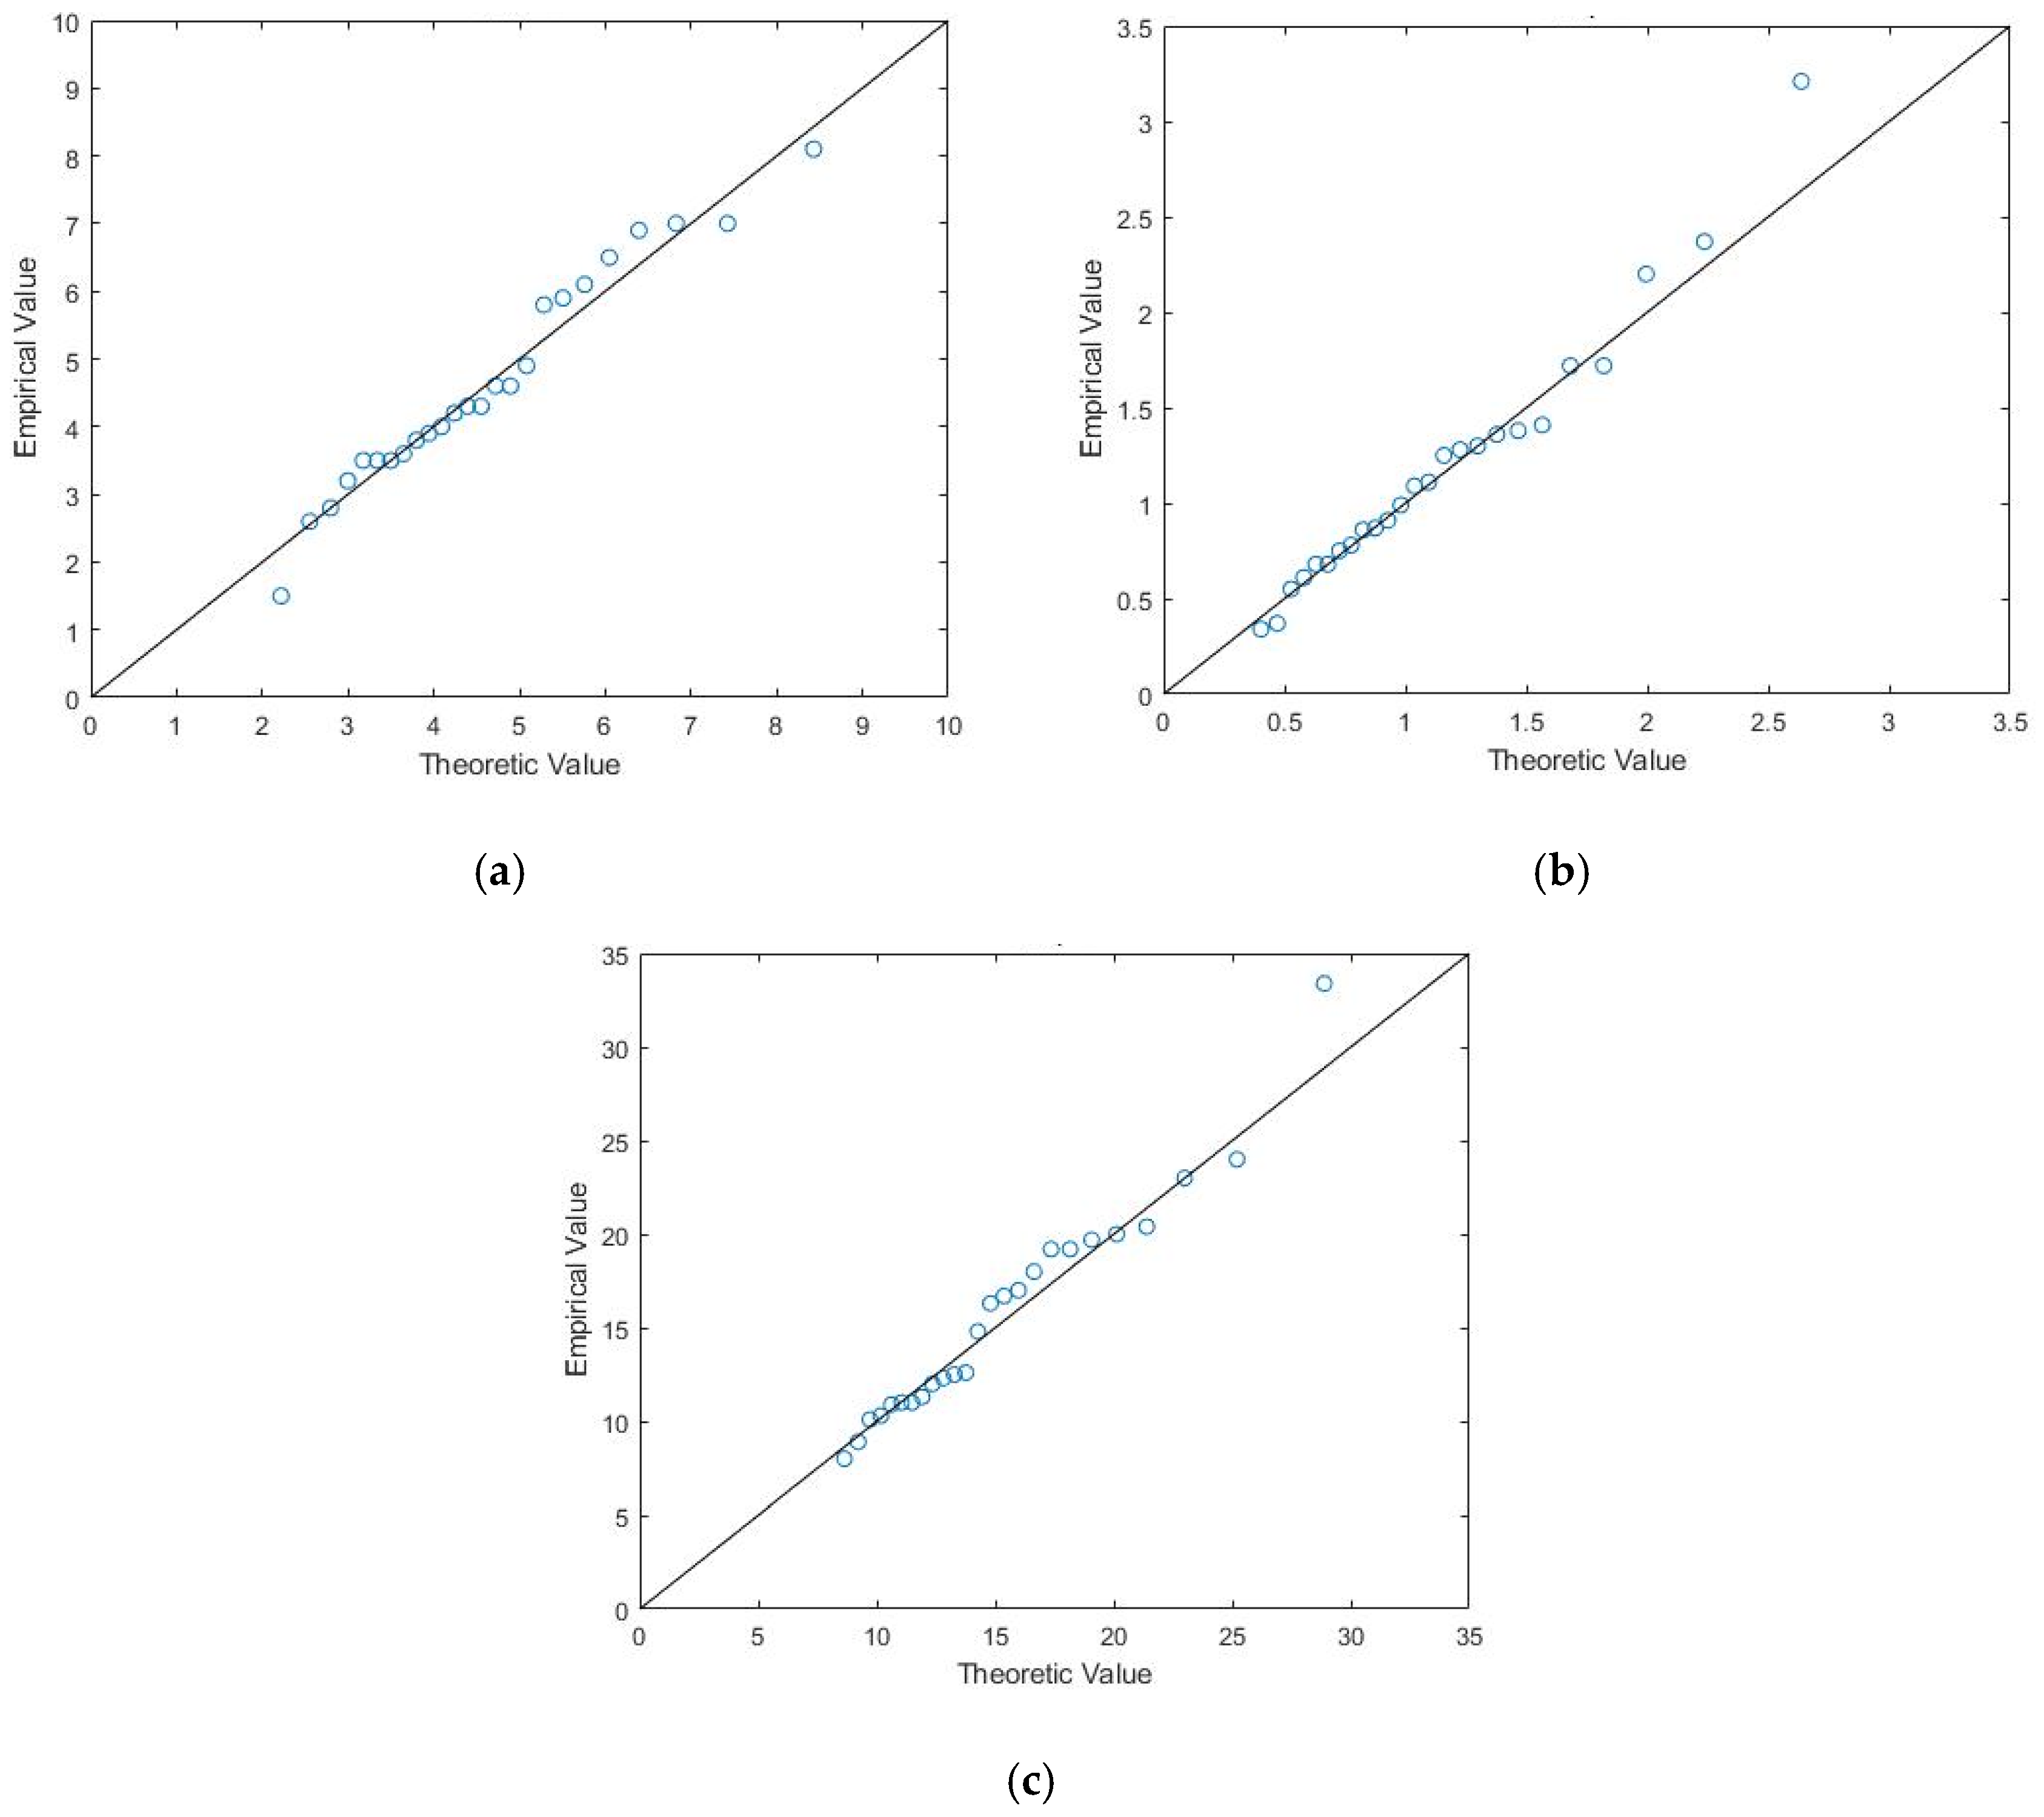


| Distributions | Wave Height (m) | Water Increment (m) | Wind Speed (m/s) |
|---|---|---|---|
| Gamma distribution | 0.11364 (0.9511) | 0.10621 (0.9405) | 0.17019 (0.4639) |
| Gumbel distribution | 0.11006 (0.9225) | 0.097616 (0.9908) | 0.15869 (0.5548) |
| Pearson-III distribution | 0.11716 (0.8825) | 0.093219 (0.9816) | 0.11475 (0.8970) |
| Copula Function | Frank | Gumbel | M61 | M62 | M63 |
|---|---|---|---|---|---|
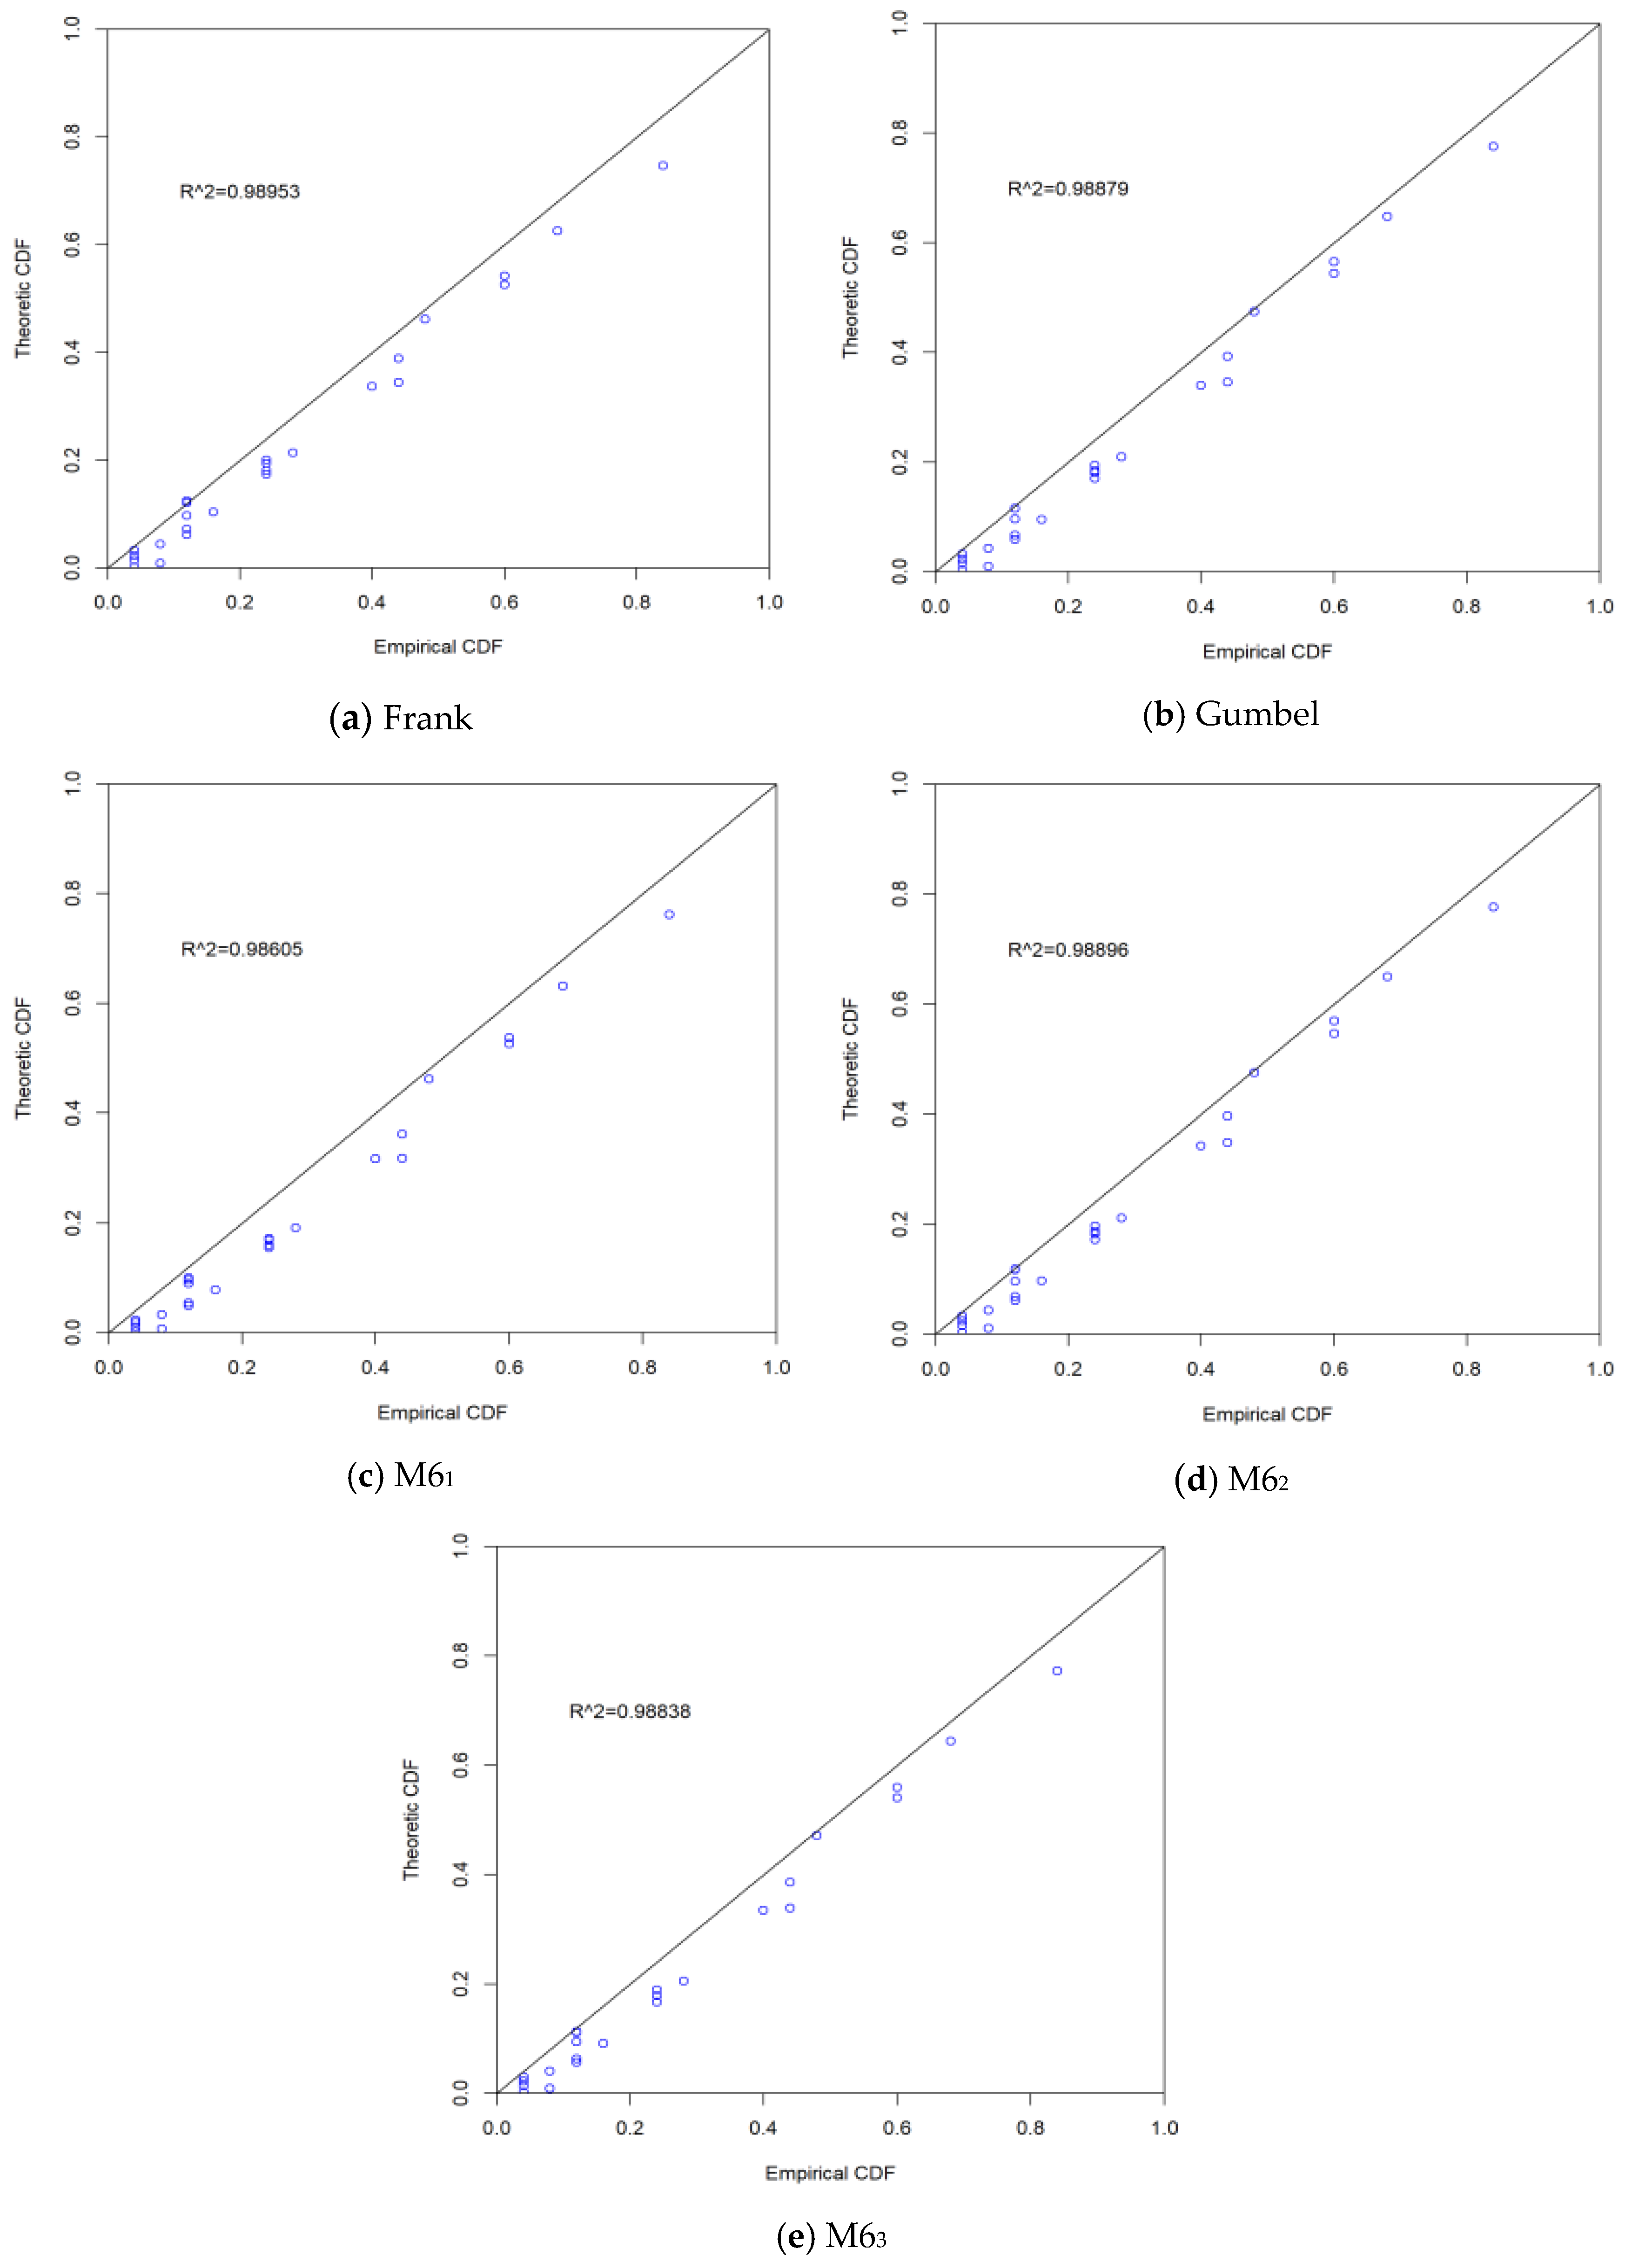
| Estimate | 2.67 | 1.415 | (1.836, 1.272) | (1.211, 1.433) | (1.399, 1.382) |
| AIC | −180.258 | −184.665 | −177.824 | −185.179 | −183.523 |
| RMSE | 0.0261 | 0.0239 | 0.0274 | 0.0237 | 0.0245 |
| Number | Name | Landing Time | Level | Typhoon Occurrence Probability F |
|---|---|---|---|---|
| 0606 | Prapiroon | 8.1 | 12 | 0.0881 |
| 0814 | Hagupit | 9.24 | 15 | 0.0347 |
| 1003 | Chanthu | 7.22 | 12 | 0.1248 |
| 1213 | Kai-tak | 8.17 | 13 | 0.1116 |
| 1306 | Rumbia | 7.2 | 11 | 0.2710 |
| 1409 | Rammasun | 7.18 | 15 | 0.0249 |
| 1522 | Mujigae | 10.4 | 15 | 0.0152 |
| (a) | (b) | (c) | (d) | (e) | (f) | ||
|---|---|---|---|---|---|---|---|
| Number | Name | R1 | R2 | UR1 | UR2 | l1 | l2 |
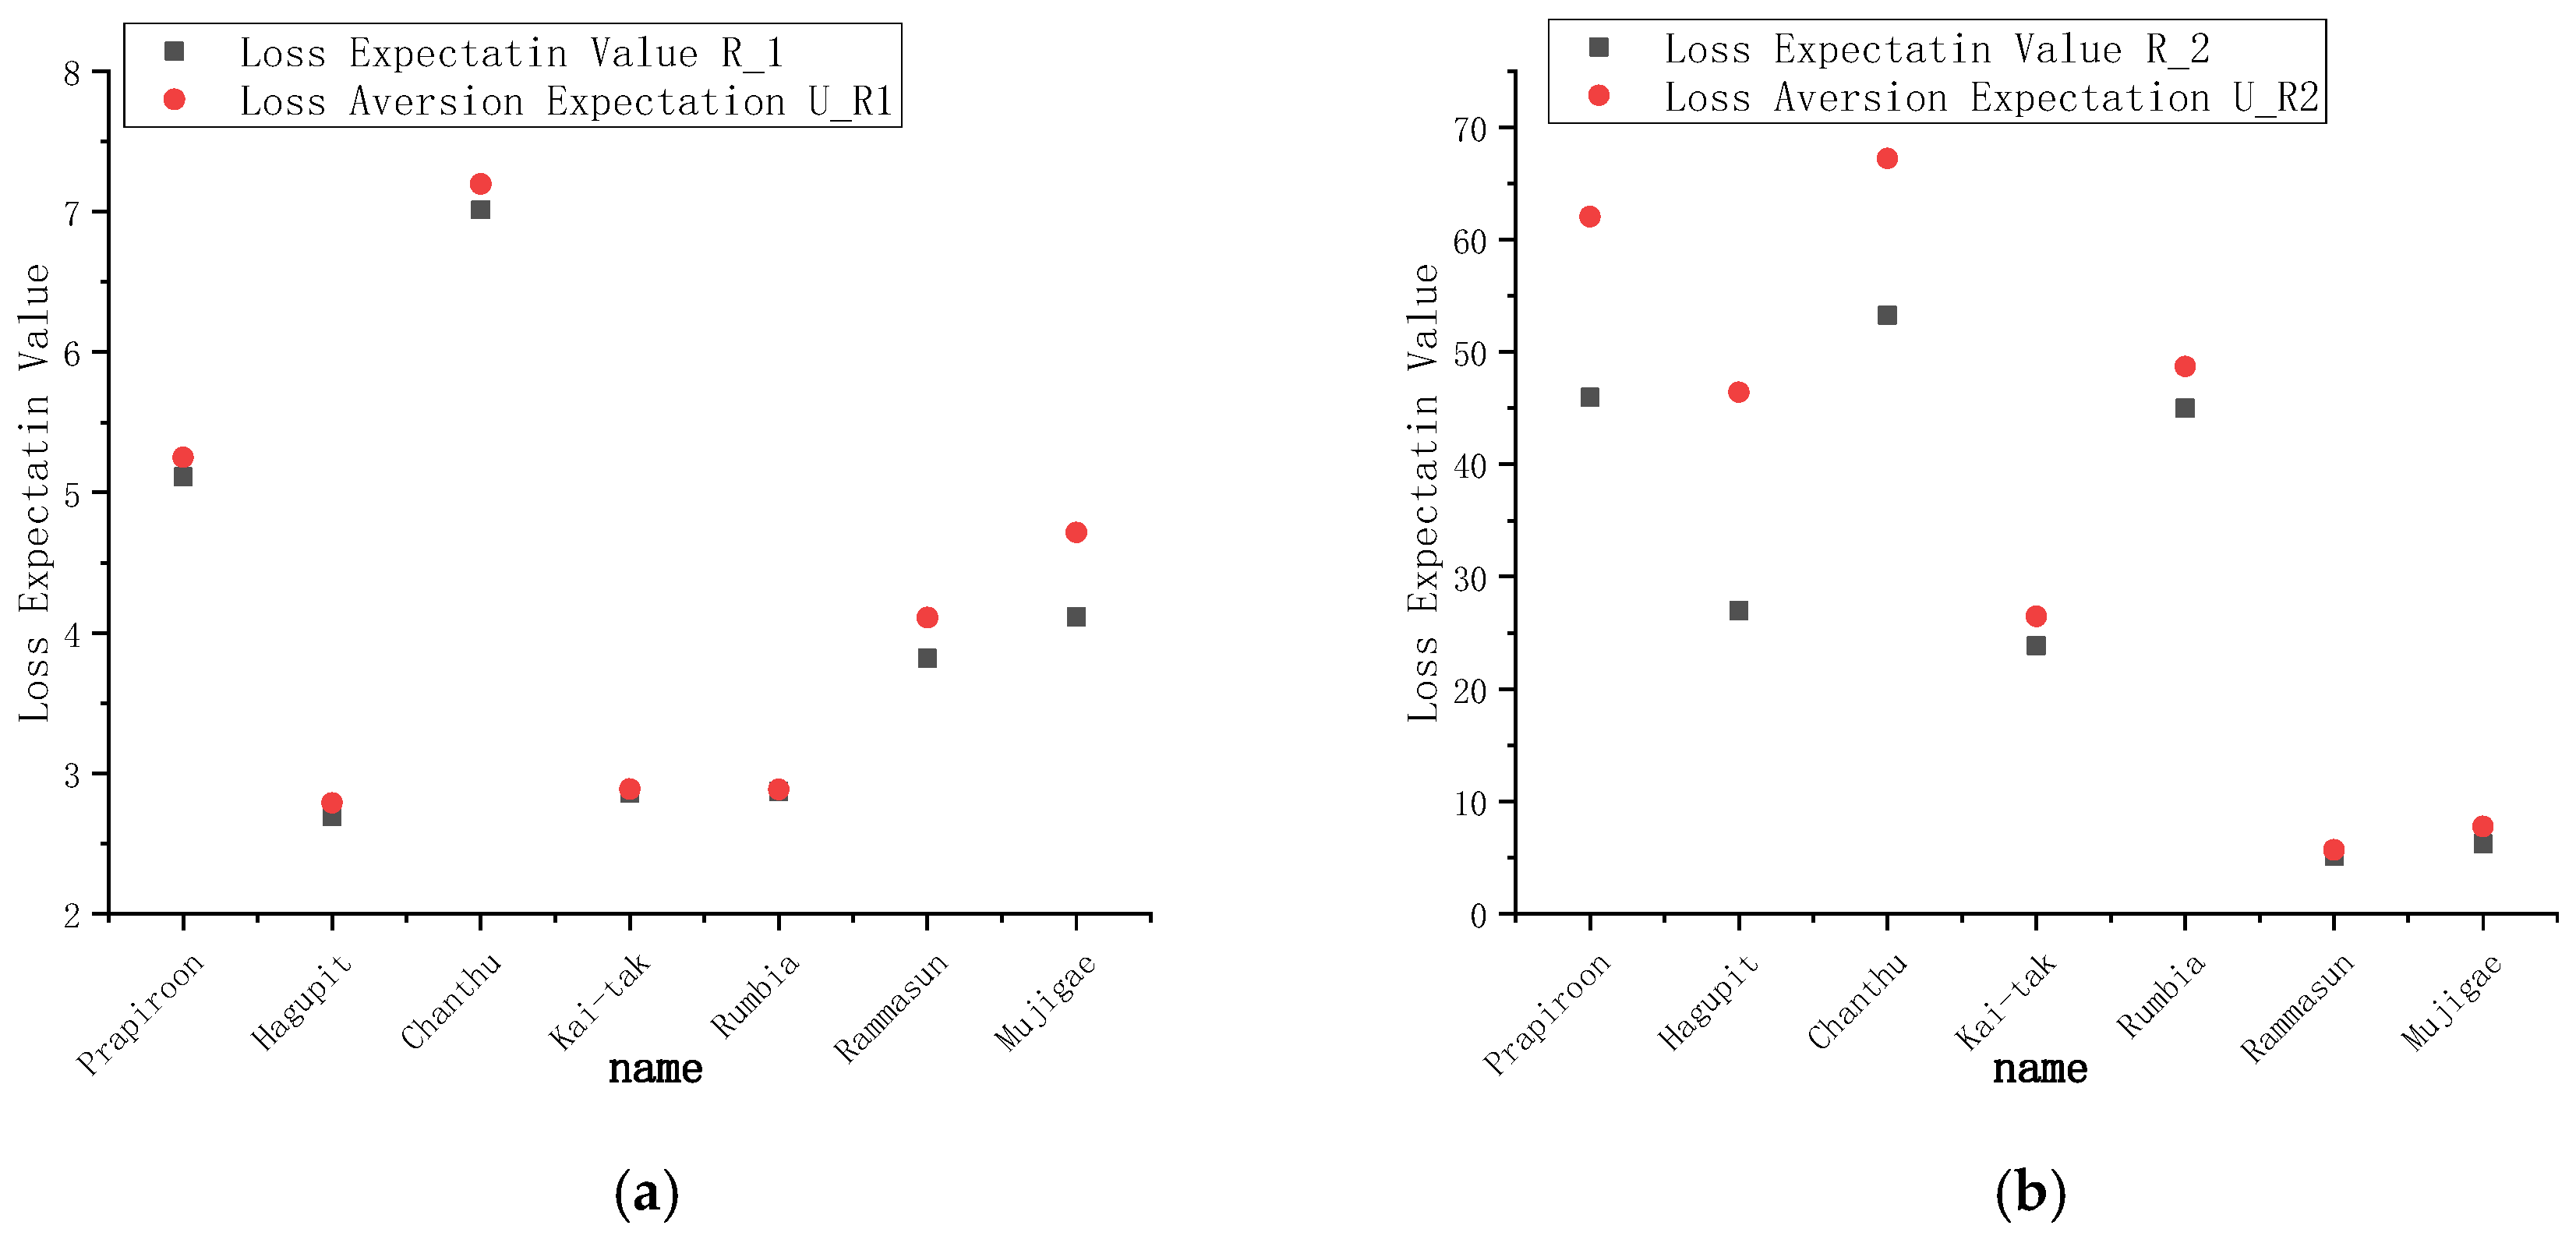
| 0606 | Prapiroon | 5.112 | 45.959 | 5.251 | 62.056 | 5.238 | 60.355 |
| 0814 | Hagupit | 2.693 | 26.993 | 2.791 | 46.434 | 2.788 | 45.477 |
| 1003 | Chanthu | 7.014 | 53.277 | 7.197 | 67.232 | 7.174 | 65.239 |
| 1213 | Kai-tak | 2.857 | 23.849 | 2.890 | 26.487 | 2.887 | 26.173 |
| 1306 | Rumbia | 2.873 | 44.986 | 2.886 | 48.724 | 2.883 | 47.671 |
| 1409 | Rammasun | 3.820 | 5.162 | 4.110 | 5.713 | 4.103 | 5.698 |
| 1522 | Mujigae | 4.115 | 6.241 | 4.716 | 7.791 | 4.706 | 7.764 |
| (a) | (b) | (c) | (d) | (e) | (f) | ||
|---|---|---|---|---|---|---|---|
| Name | Level | L1′ (%) | L2′ (%) | UR1′ | UR2′ | l1′ (%) | l2′ (%) |
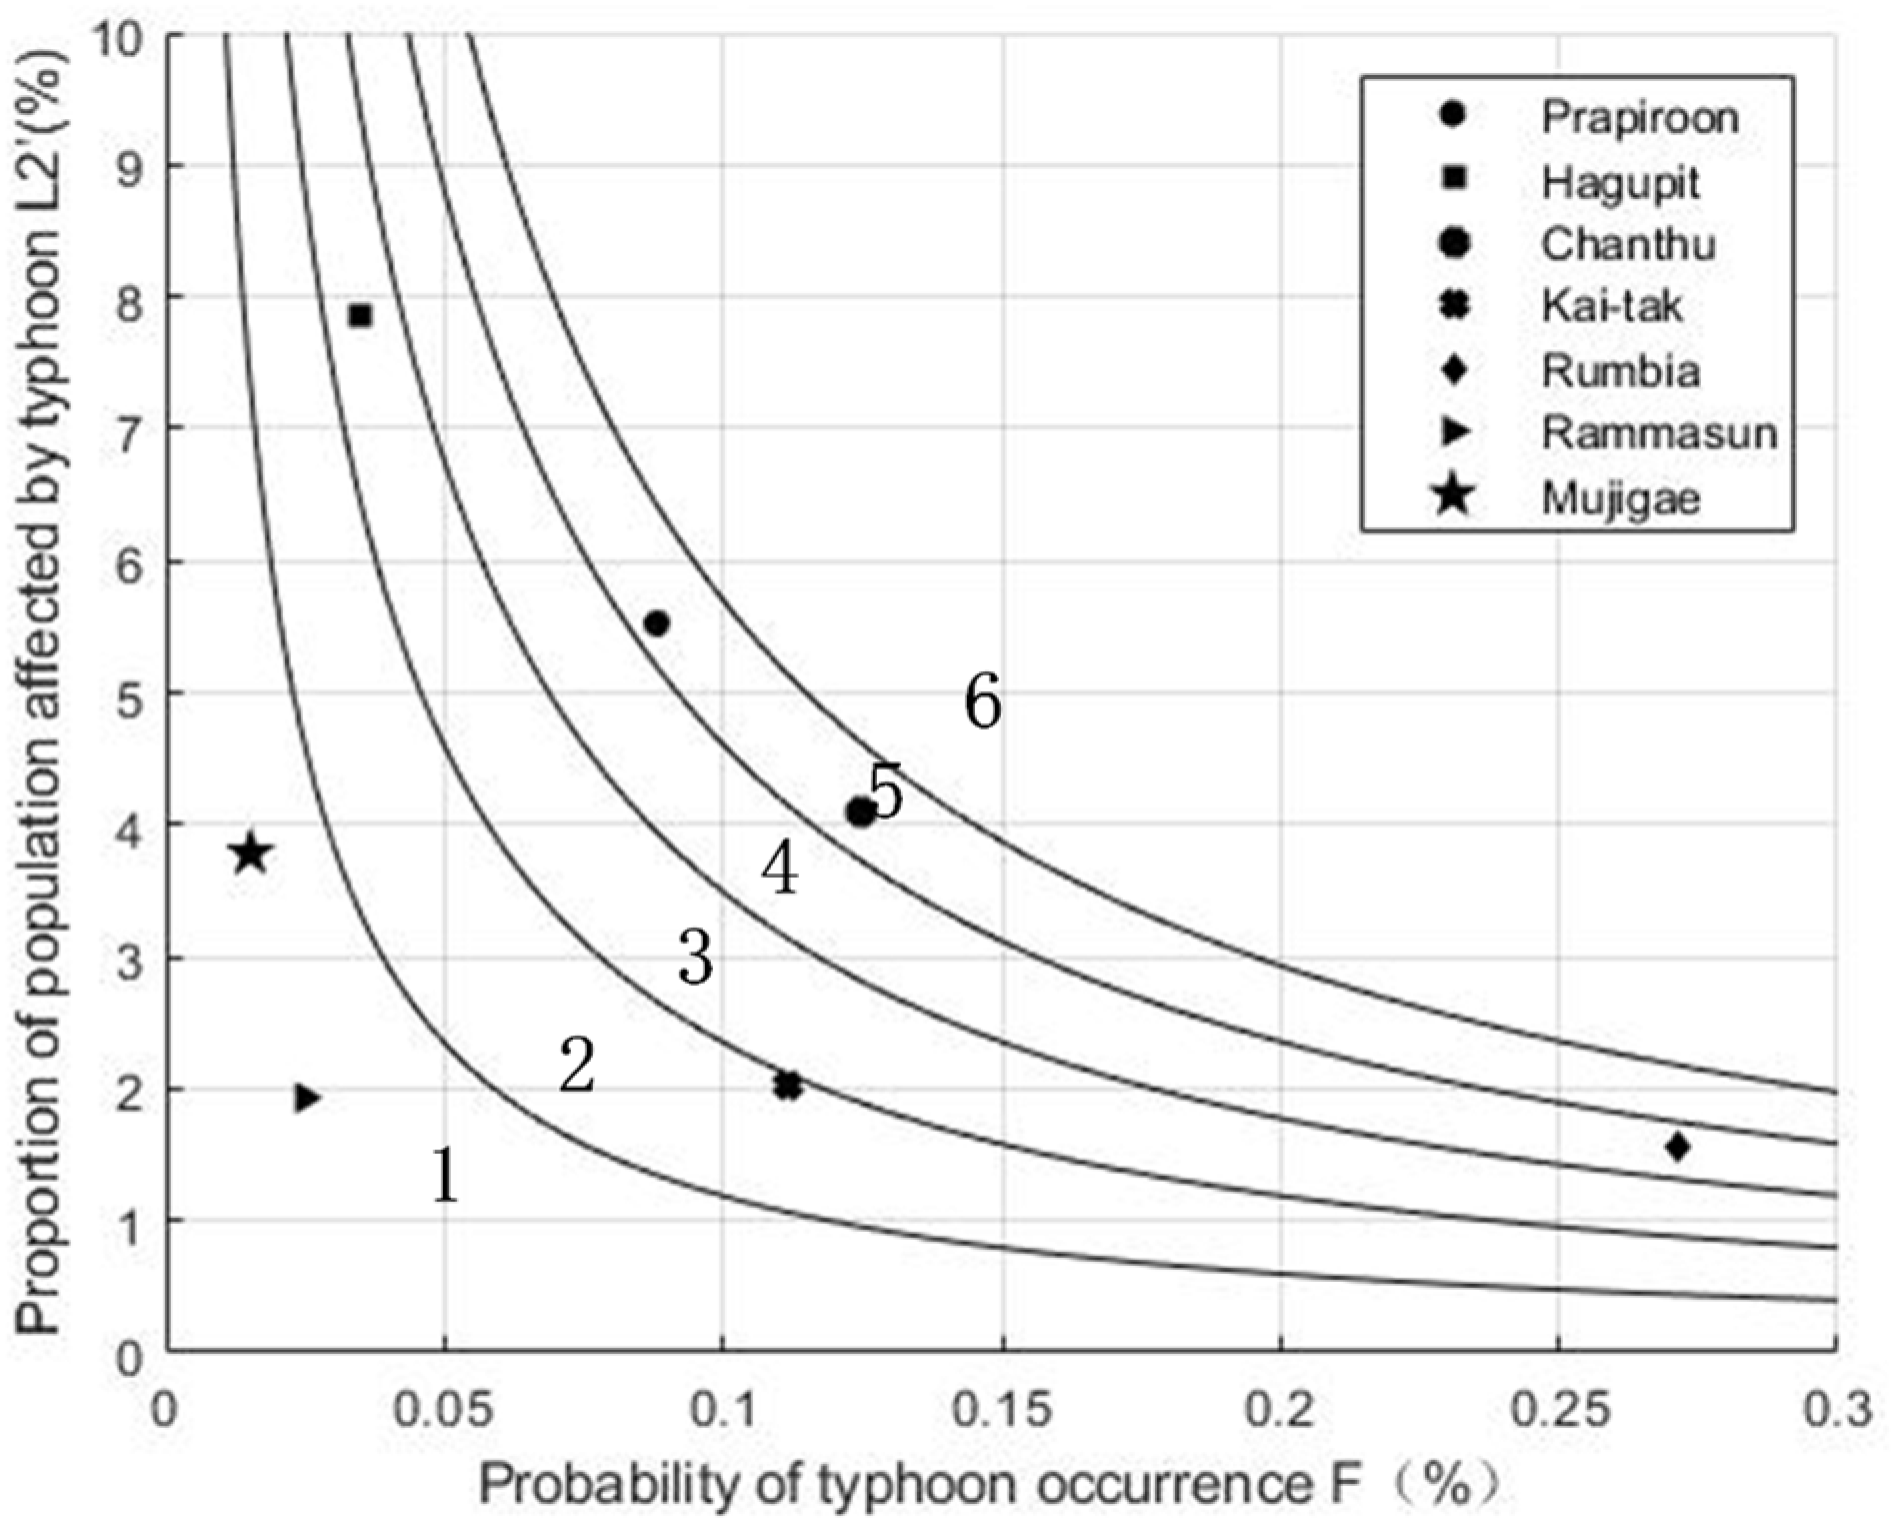
| Prapiroon | 12 | 0.2183 | 5.5250 | 0.0192 | 0.4872 | 0.0193 | 0.5117 |
| Hagupit | 15 | 0.2109 | 7.8628 | 0.0073 | 0.2732 | 0.0073 | 0.2947 |
| Chanthu | 12 | 0.1221 | 4.0887 | 0.0152 | 0.5105 | 0.0153 | 0.5285 |
| Kai-tak | 13 | 0.0449 | 2.0172 | 0.0050 | 0.2252 | 0.0050 | 0.2290 |
| Rumbia | 11 | 0.0170 | 1.5596 | 0.0046 | 0.4227 | 0.0046 | 0.4273 |
| Rammasun | 15 | 0.2262 | 1.9330 | 0.0056 | 0.0481 | 0.0056 | 0.0490 |
| Mujigae | 15 | 0.3718 | 3.7847 | 0.0057 | 0.0576 | 0.0057 | 0.0597 |
| Number | Name | Classification | ||
|---|---|---|---|---|
| L1′ | L2′ | (L1′+ L2′)/2 | ||
| 0606 | Prapiroon | Level 5 | Level 5 | Level 5 |
| 0814 | Hagupit | Level 2 | Level 3 | Level 3 |
| 1003 | Chanthu | Level 4 | Level 5 | Level 5 |
| 1213 | Kai-tak | Level 2 | Level 2 | Level 2 |
| 1306 | Rumbia | Level 2 | Level 4 | Level 3 |
| 1409 | Rammasun | Level 2 | Level 1 | Level 2 |
| 1522 | Mujigae | Level 2 | Level 1 | Level 2 |
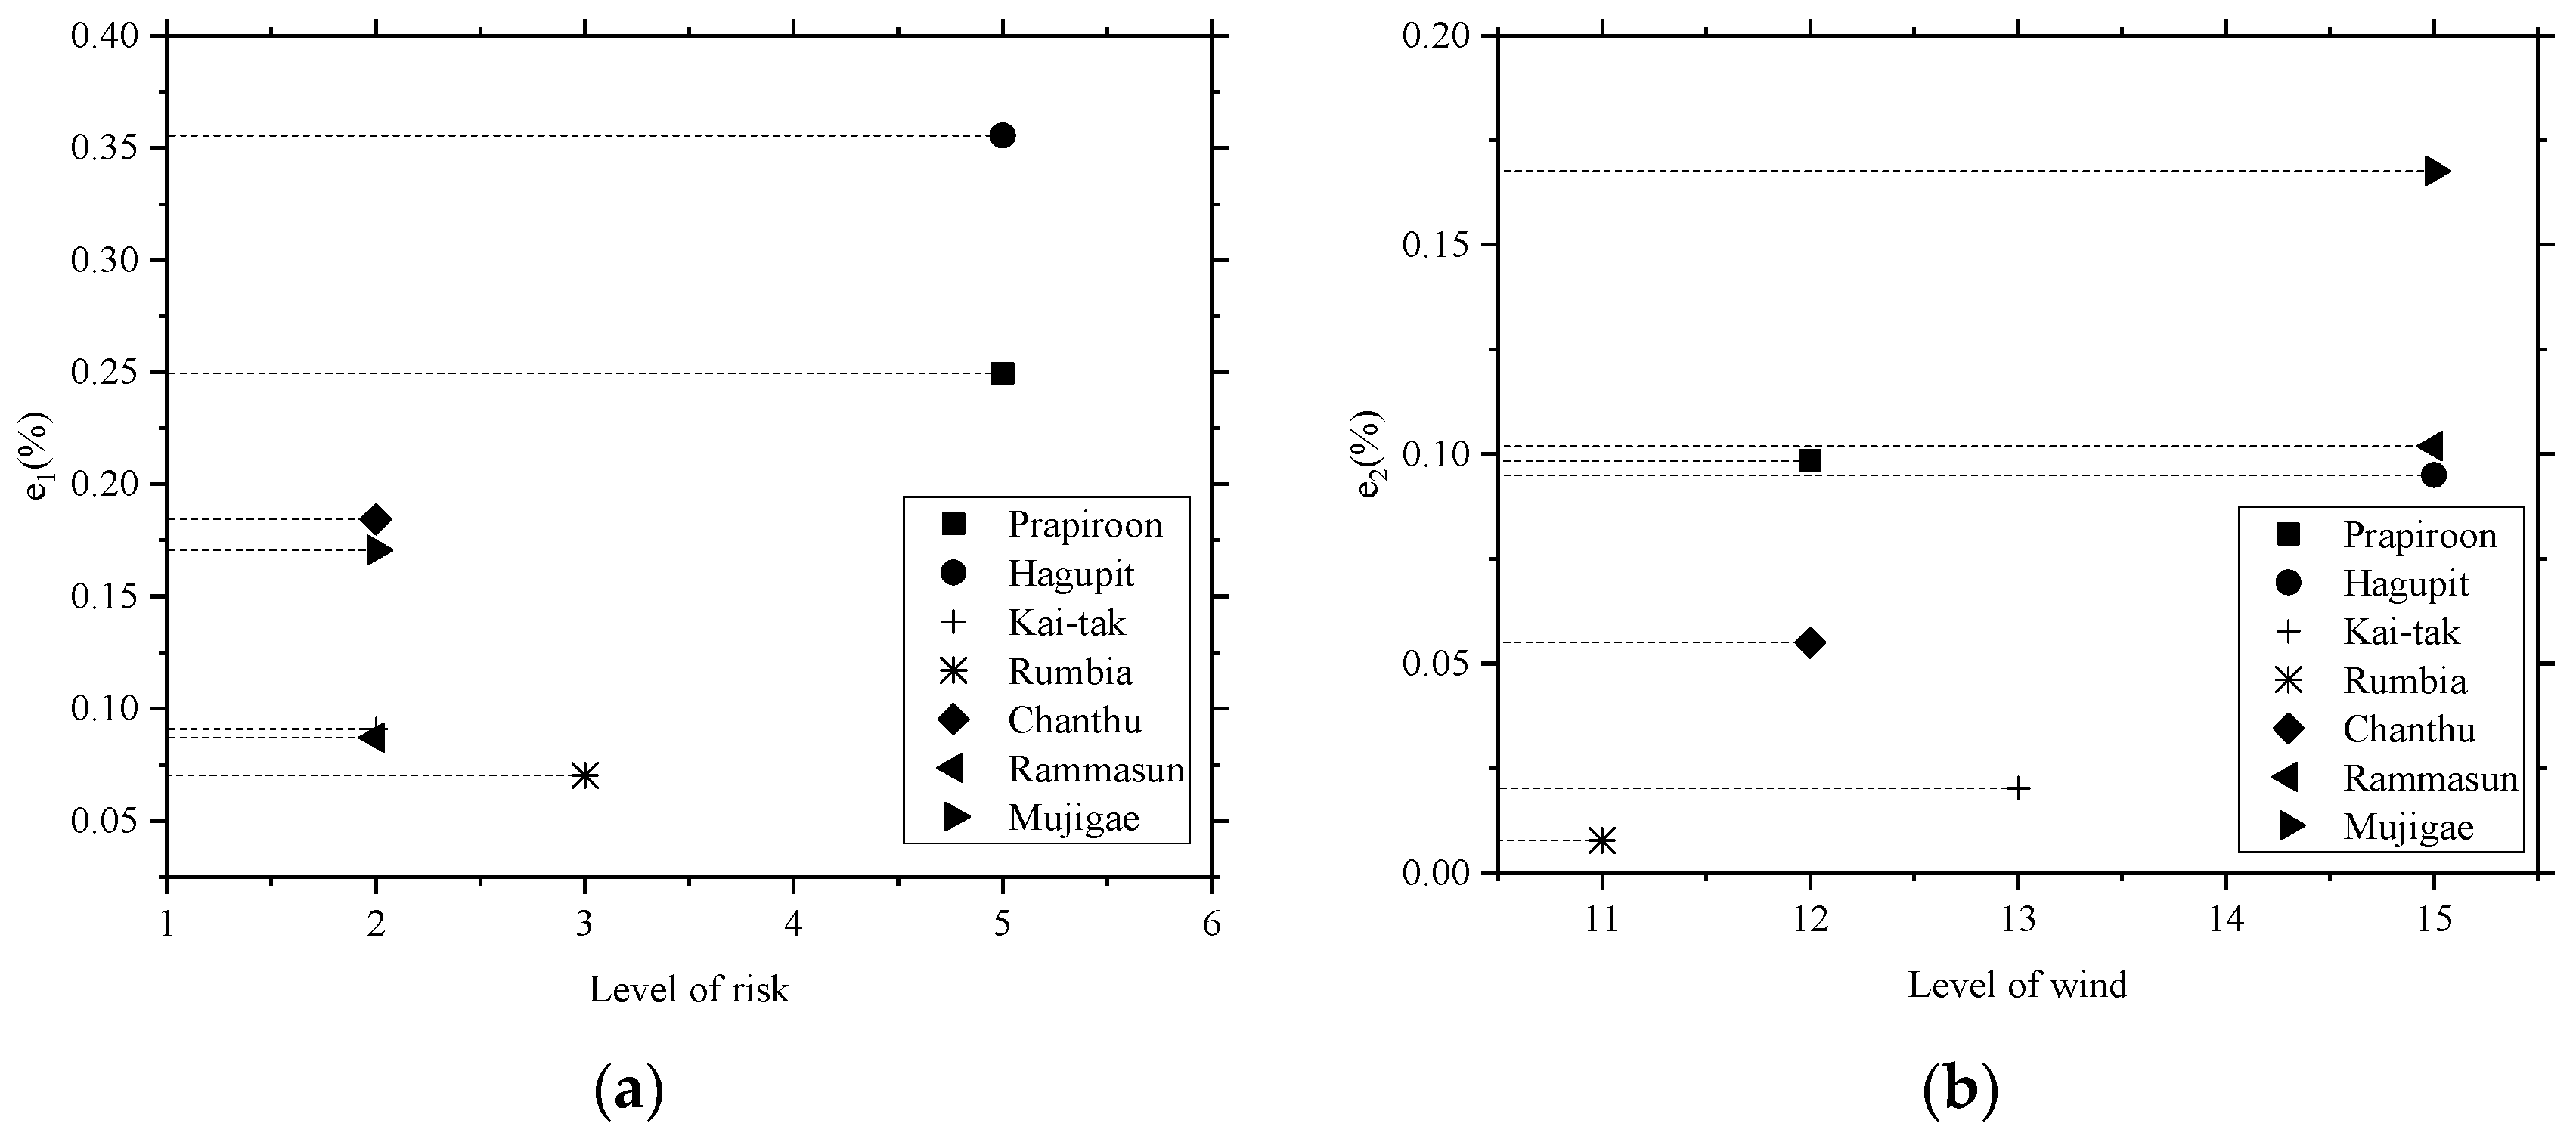
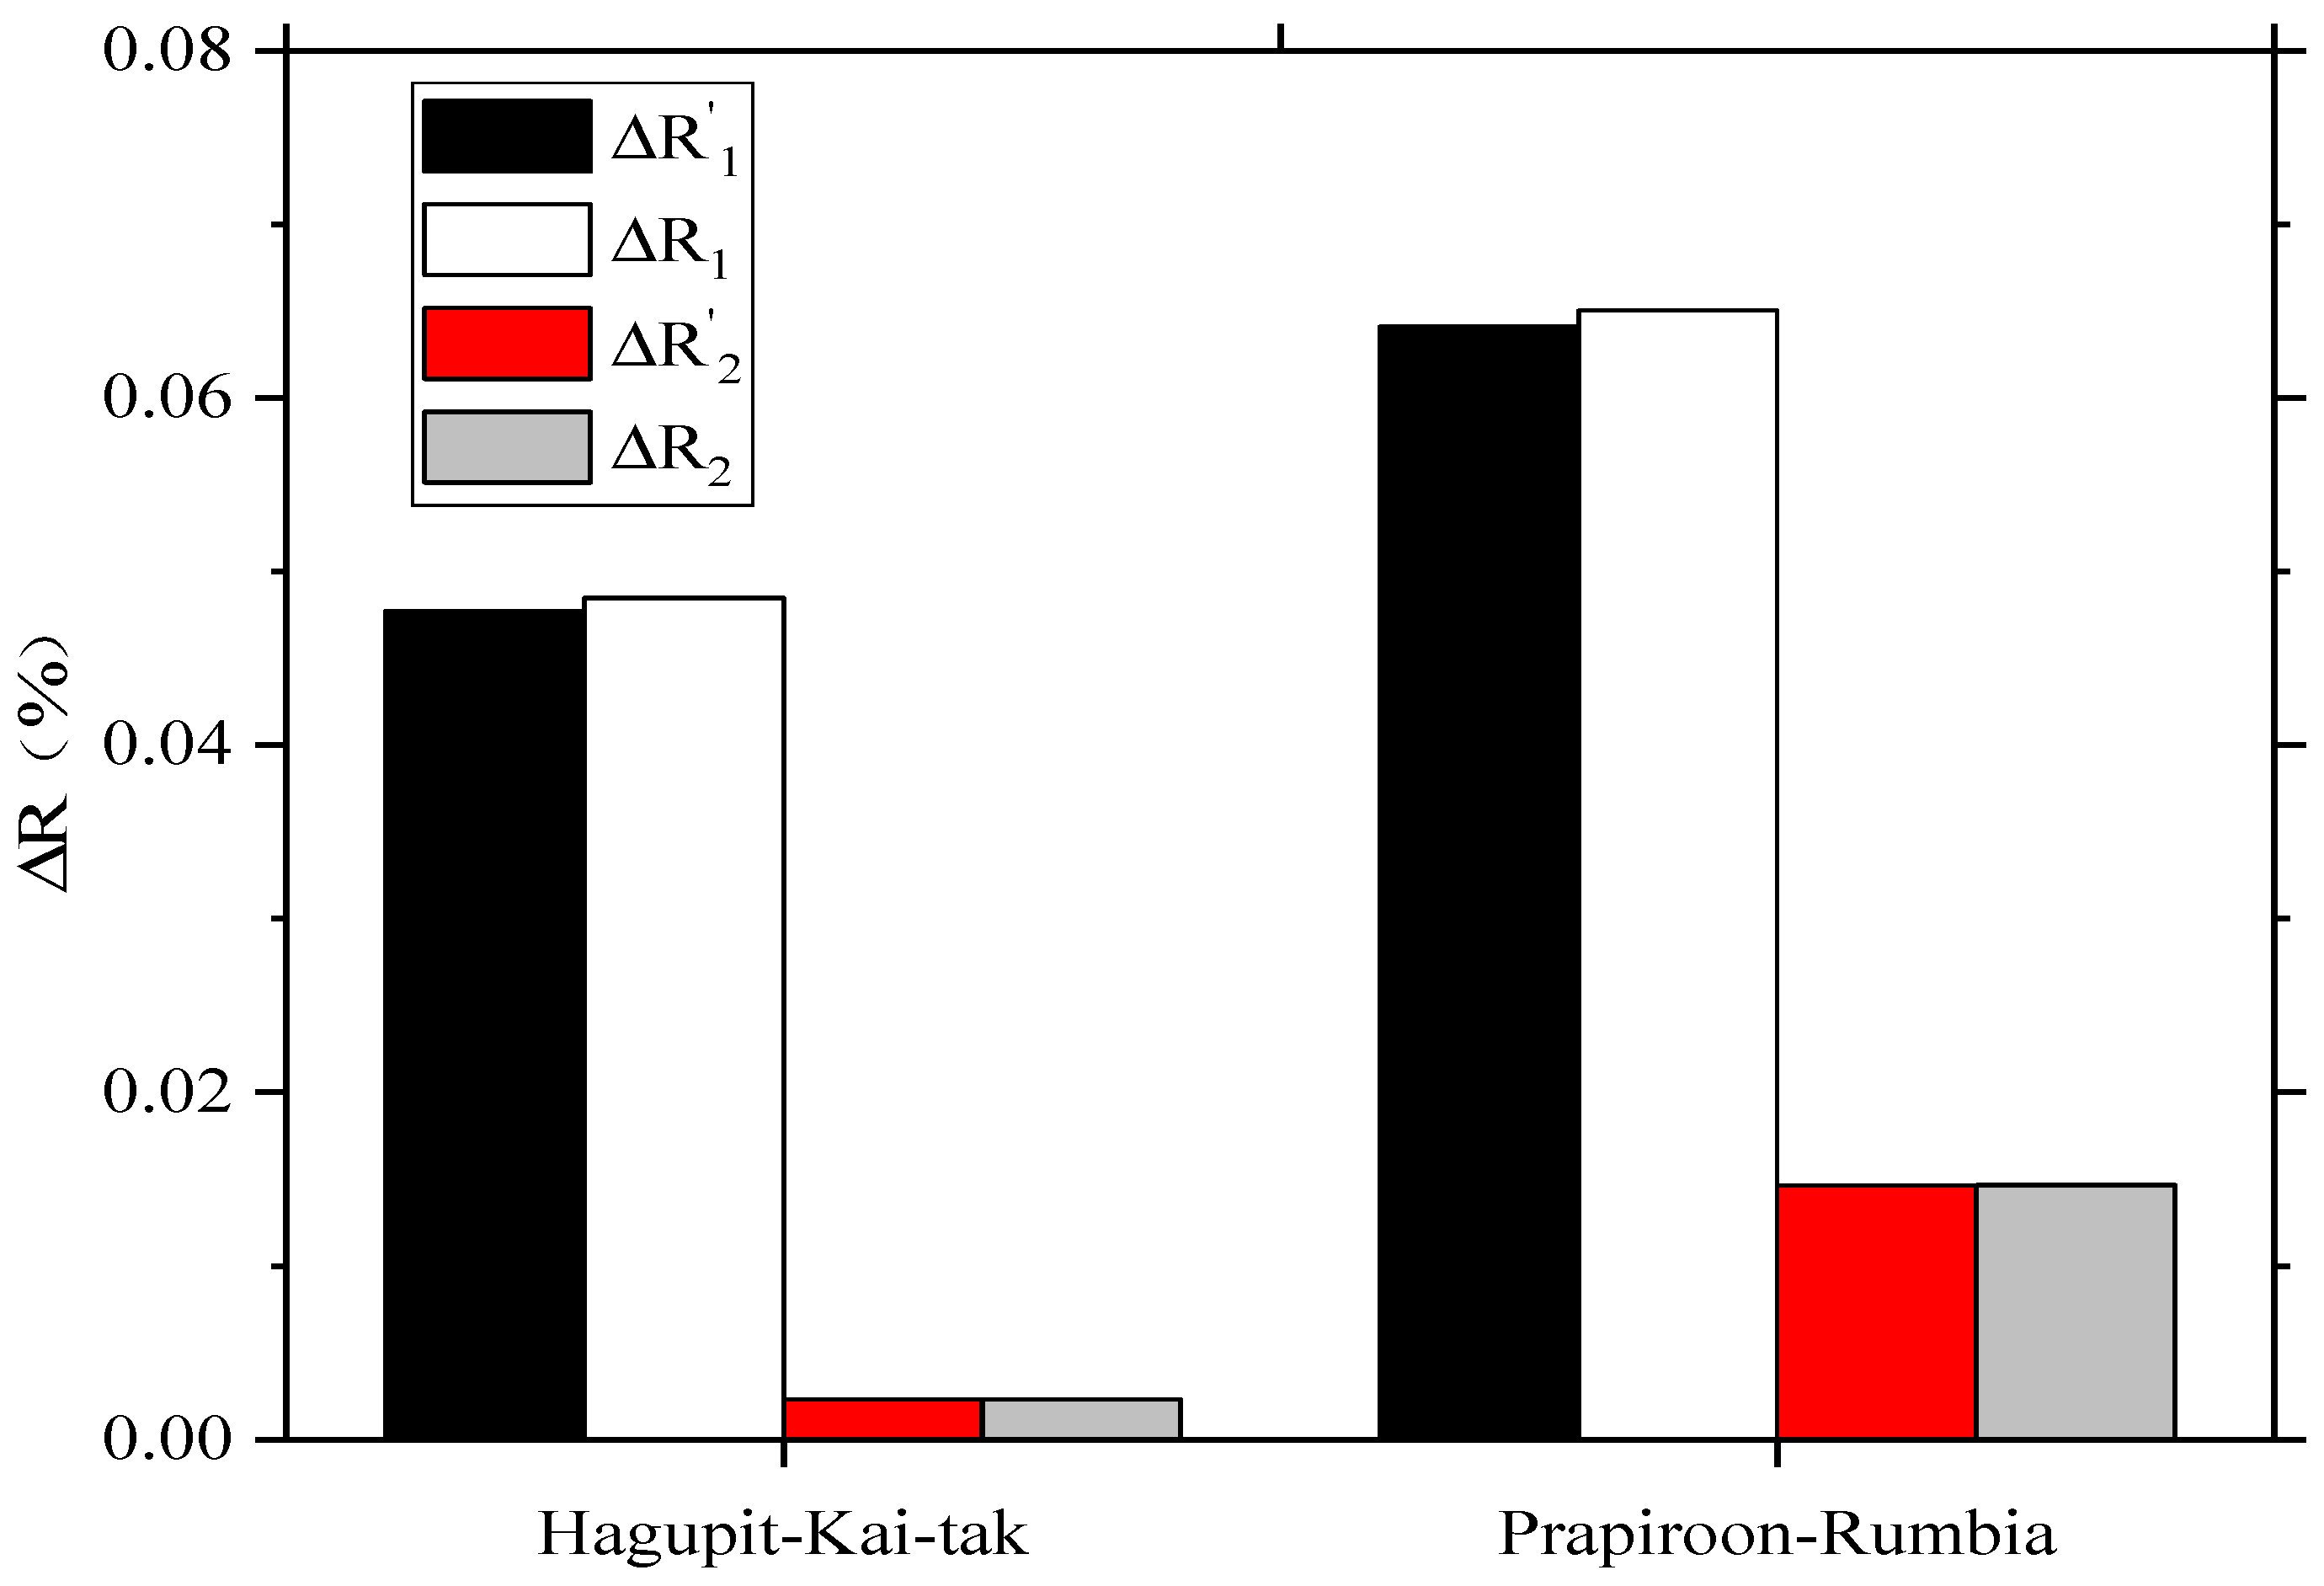
| (a) | (b) | (c) | (d) | (e) | (f) | Rank of Risk | Rank of Wind | ||
|---|---|---|---|---|---|---|---|---|---|
| Name | R′1 (%) | R1 (%) | e1 (%) | R′2 (%) | R2 (%) | e2 (%) | |||
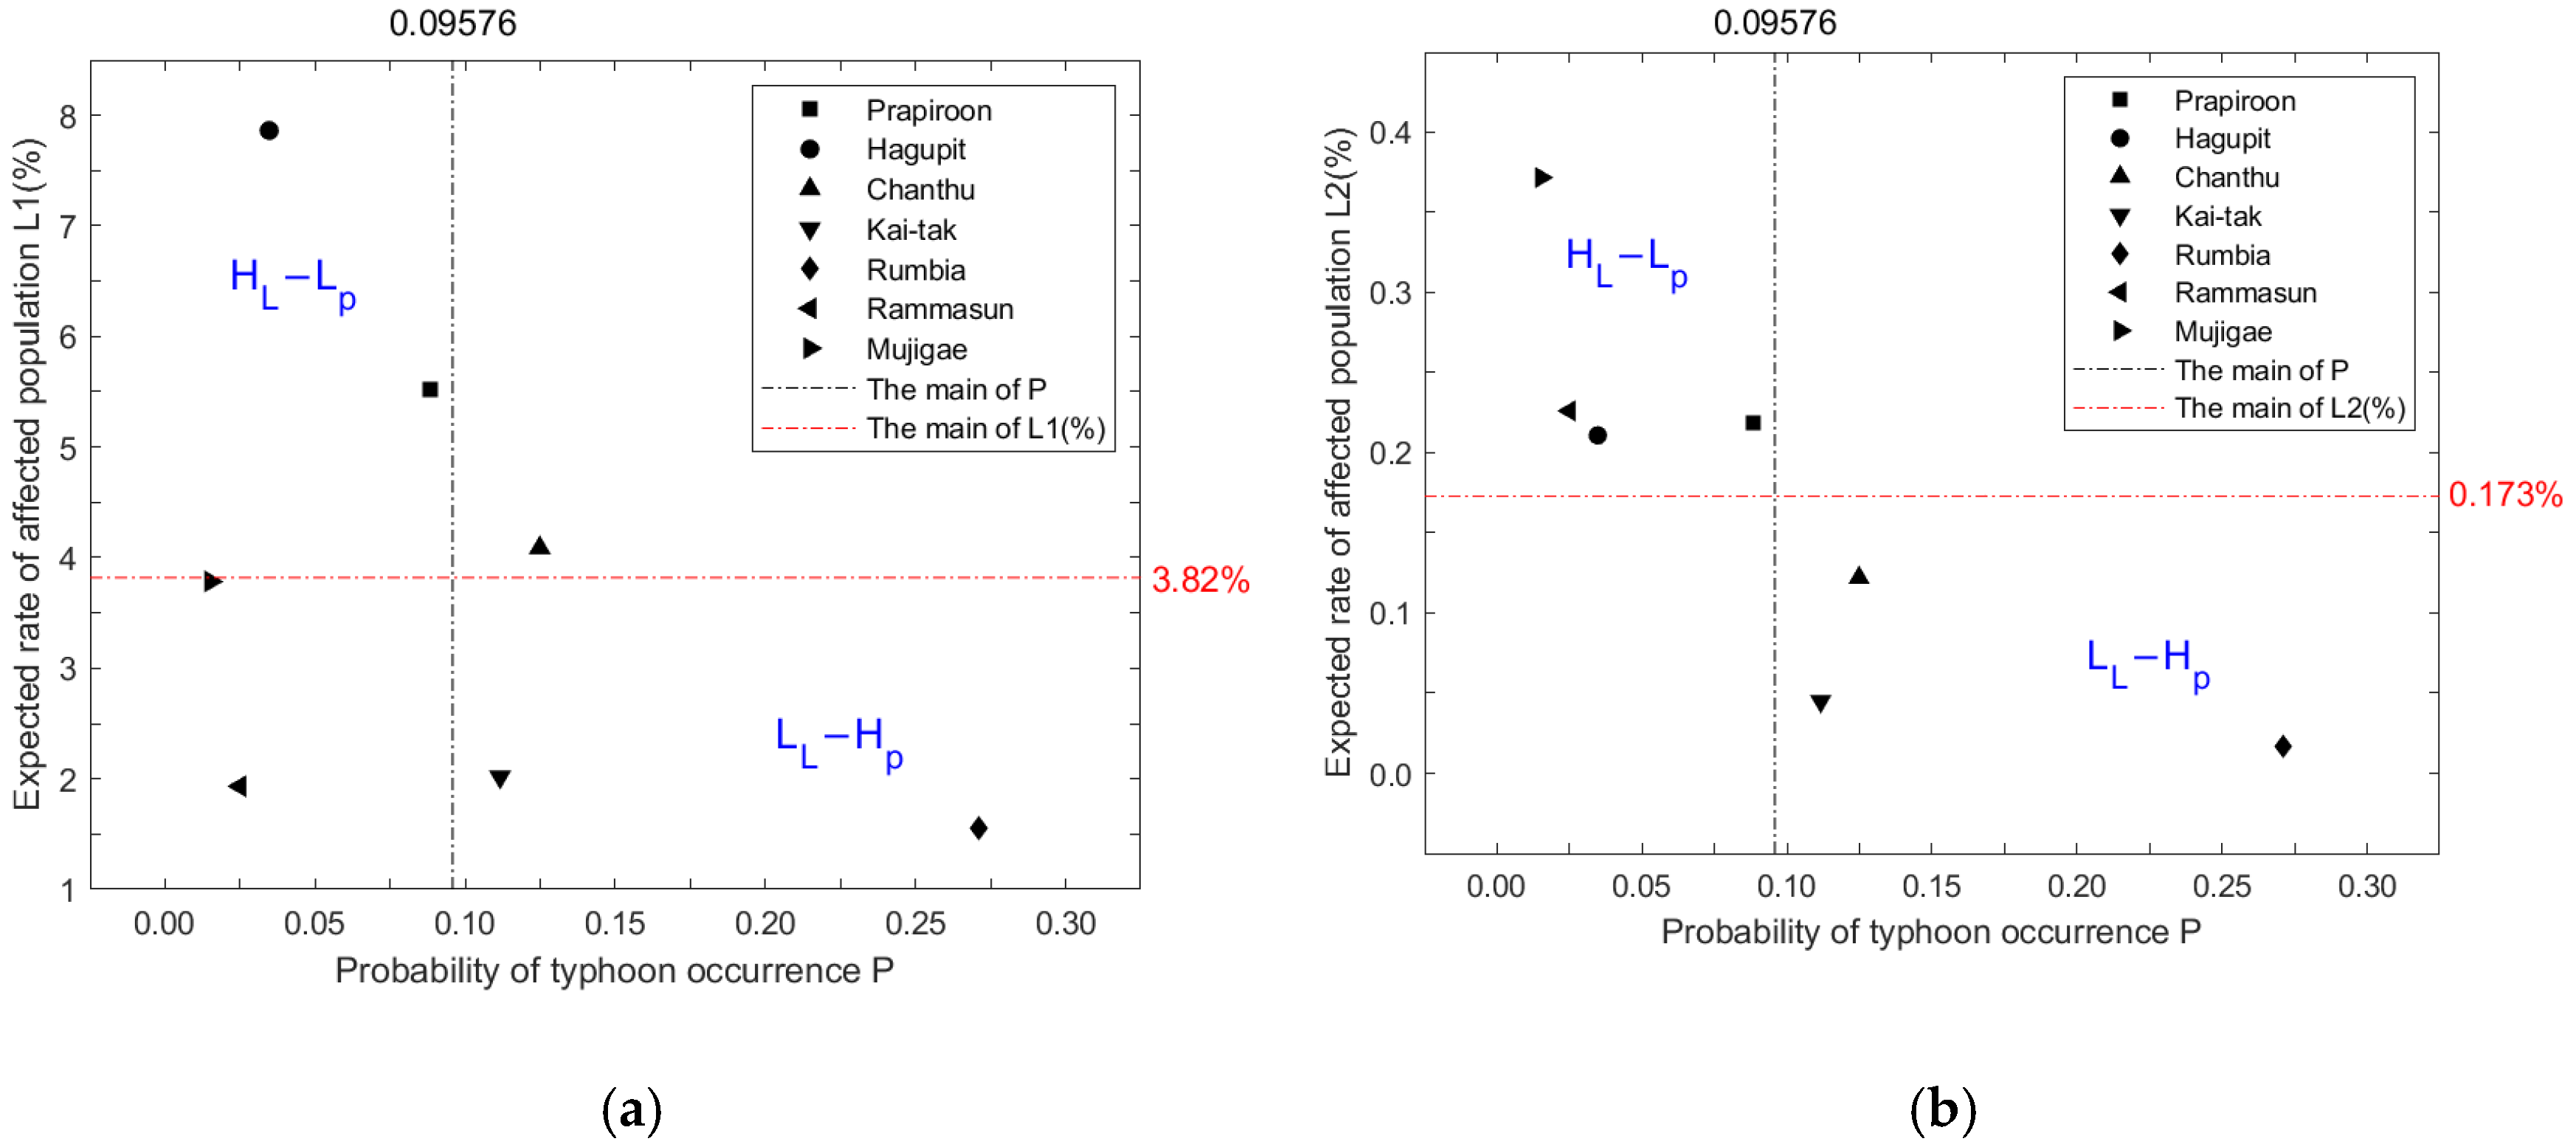
| HL-LP | Prapiroon | 0.4868 | 0.4880 | 0.2495 | 0.019232 | 0.019234 | 0.0984 | 5 | 15 |
| Hagupit | 0.2728 | 0.2738 | 0.3555 | 0.007318 | 0.007319 | 0.0950 | 5 | 12 | |
| LL-HP | Kai-tak | 0.2251 | 0.2253 | 0.0909 | 0.005011 | 0.005011 | 0.0202 | 2 | 12 |
| Rumbia | 0.4227 | 0.4229 | 0.0702 | 0.004607 | 0.004607 | 0.0077 | 3 | 15 | |
| Chanthu | 0.5103 | 0.5112 | 0.1844 | 0.015238 | 0.015239 | 0.0550 | 2 | 13 | |
| Rammasun | 0.0481 | 0.0482 | 0.0871 | 0.005632 | 0.005633 | 0.1019 | 2 | 15 | |
| Mujigae | 0.0575 | 0.0576 | 0.1707 | 0.005651 | 0.005652 | 0.1677 | 2 | 11 |
Disclaimer/Publisher’s Note: The statements, opinions and data contained in all publications are solely those of the individual author(s) and contributor(s) and not of MDPI and/or the editor(s). MDPI and/or the editor(s) disclaim responsibility for any injury to people or property resulting from any ideas, methods, instructions or products referred to in the content. |
© 2023 by the authors. Licensee MDPI, Basel, Switzerland. This article is an open access article distributed under the terms and conditions of the Creative Commons Attribution (CC BY) license (https://creativecommons.org/licenses/by/4.0/).
Share and Cite
Liu, G.; Yang, B.; Nong, X.; Kou, Y.; Wu, F.; Zhao, D.; Yu, P. Risk Level Assessment of Typhoon Hazard Based on Loss Utility. J. Mar. Sci. Eng. 2023, 11, 2177. https://doi.org/10.3390/jmse11112177
Liu G, Yang B, Nong X, Kou Y, Wu F, Zhao D, Yu P. Risk Level Assessment of Typhoon Hazard Based on Loss Utility. Journal of Marine Science and Engineering. 2023; 11(11):2177. https://doi.org/10.3390/jmse11112177
Chicago/Turabian StyleLiu, Guilin, Bokai Yang, Xiuxiu Nong, Yi Kou, Fang Wu, Daniel Zhao, and Pubing Yu. 2023. "Risk Level Assessment of Typhoon Hazard Based on Loss Utility" Journal of Marine Science and Engineering 11, no. 11: 2177. https://doi.org/10.3390/jmse11112177
APA StyleLiu, G., Yang, B., Nong, X., Kou, Y., Wu, F., Zhao, D., & Yu, P. (2023). Risk Level Assessment of Typhoon Hazard Based on Loss Utility. Journal of Marine Science and Engineering, 11(11), 2177. https://doi.org/10.3390/jmse11112177


