Communication

Ectopleura crocea (Cnidaria: Hydrozoa) Identified as a Predator of Pelagic Fish Eggs through Cytochrome c Oxidase I Metabarcoding

1
Fisheries Resources and Environment Division, South Sea Fisheries Research Institute, Yeosu 59780, Republic of Korea
2
Ocean Climate Response & Ecosystem Research Department, Korea Institute of Ocean Science & Technology, Busan 49111, Republic of Korea
*
Author to whom correspondence should be addressed.
J. Mar. Sci. Eng. 2023, 11(11), 2178; https://doi.org/10.3390/jmse11112178
Submission received: 17 September 2023 / Revised: 26 October 2023 / Accepted: 14 November 2023 / Published: 16 November 2023
(This article belongs to the Section Marine Biology)

Abstract

:
Fish eggs have a wide range of predators. However, observing these predators is challenging, as is identifying fish eggs based on morphological traits. In this study, we observed hydroids, which are sessile organisms, consuming pelagic fish eggs. We conducted cytochrome c oxidase I (COI) metabarcoding to identify both the predator and the prey species. Massive COI reads were de novo assembled and nine representative sequences were constructed. The predator, identified from the representative sequences and its morphological features, was determined as Ectopleura crocea. The fish eggs that had been preyed upon belonged to two species: Sillago japonica and Parajulis poecilepterus. Additionally, four arthropod species (Labidocera rotunda, Oithona similis, Paracalanus parvus, and Pseudevadne tergestina) were consumed, and their morphological traits could not be observed, due to digestion. COI metabarcoding was an effective tool for studying the feeding activity of these small predators.

1. Introduction

Numerous marine teleost fish species employ a spawning strategy of releasing abundant, dispersed pelagic eggs [1]. These eggs rely on their yolks for nourishment during development, minimizing the risk of starvation [2]. Fish eggs, which lack the ability to swim and cannot escape predators, have a high mortality rate due to predation [3,4].
Predators of pelagic fish eggs are highly diverse, ranging from invertebrates such as copepods to fish and birds [5]. Direct observation of such egg consumption within marine ecosystems is challenging [6]. An alternative approach is to examine fish eggs found in the stomachs of predators [7]. The accurate identification of prey species often depends on the state of their morphology [8]. Even when pelagic fish eggs remain intact, the identification of their species can be challenging due to the high morphological similarity among species [9].
Molecular identification based on the DNA barcode has become one of the ways to complement the difficulties of morphological identification [10,11,12,13]. Among the DNA-based methods, metabarcoding is applied for the sequencing and identification of bulk samples. Metabarcoding has been used to investigate species compositions in various fields such as fish eggs and larvae, zooplankton, and gut contents [14,15,16,17].
The present study aimed to suggest a new predator of fish eggs through the COI metabarcoding of hydroids that preyed upon the fish eggs discovered in the southern coastal waters of Korea. The hydroid, identified as Ectopleura crocea, is a native species of the North Atlantic and is known to feed on diatoms, crustaceans, copepods, and chaetognaths [18]. E. crocea, introduced into the Pacific Ocean via ships [19], was recorded as Tubularia mesembryanthemum in Korea in 1941 [20], and its morphology was recorded in 1969 [21]. Since then, investigations on distribution have mainly been conducted [22,23]. Here, we report for the first time the predator–prey relationship between E. crocea and the fish eggs and Arthropoda based on COI metabarcoding.

2. Materials and Methods

2.1. Sample Collection

The hydroids that consumed fish eggs were collected from the Tongyeong Megacosm Test Station (34.7701° N, 128.3829° E), which is operated by the Korea Institute of Ocean Science and Technology and located in the southern region of the Korean Peninsula. Seawater was drawn up using a submersible pump positioned at a depth of 3 m and subsequently filtered through a net with a mesh size of 300 μm. From the concentrated samples captured by the net, two hydroids containing fish eggs in their stomachs, designated H1 (collected on 16 July 2015, at a depth of 3 m, water temperature 21.1 °C) and H2 (collected on 29 July 2015, at a depth of 3 m, water temperature 23.4 °C), were isolated. These specimens were photographed using a digital camera attached to a dissecting microscope (Stemi 2000-C, Zeiss, Jena, Germany) and promptly preserved in 99% ethanol at the collection site. Morphological identification of the hydroids was conducted with reference to [21,22,24].

2.2. Genomic DNA Extraction, Amplification, and Sequencing

The genomic DNA of two specimens with intact bodies (H1 and H2) was extracted for species identification following the protocol of the MagListo™ 5M Genomic DNA Extraction Kit (Bioneer, Daejeon, Republic of Korea). A two-step polymerase chain reaction (PCR) approach was employed for sequencing using the MiSeq platform (Illumina, San Diego, CA, USA). The initial PCR utilized a primer containing the MiSeq adapter sequence, with the aim of amplifying the COI region (313 base pairs; mlCOIintF/jgHCO2198 [25]) in DNA Free-Taq Master Mix (CellSafe, Yongin, Republic of Korea). The PCR products were subsequently purified using the MagListo™ PCR/Gel Purification Kit (Bioneer, Daejeon, Republic of Korea), and then employed as templates for the second PCR. The second PCR was performed using the primer contained both adapter and index sequences of Nextera XT Index Kit (Illumina, San Diego, CA, USA), which facilitated the separation of sequences from each specimen. The first and second PCR conditions followed [26] and [27], respectively. The same purification process was used for the second PCR product as the first PCR product. Following the measurement of the DNA concentrations, these products were mixed at equal concentrations. The MiSeq platform was utilized to generate paired-end COI reads from the pooled samples, resulting in 159,058 reads for H1 and 199,526 reads for H2.

2.3. Sequence Analysis
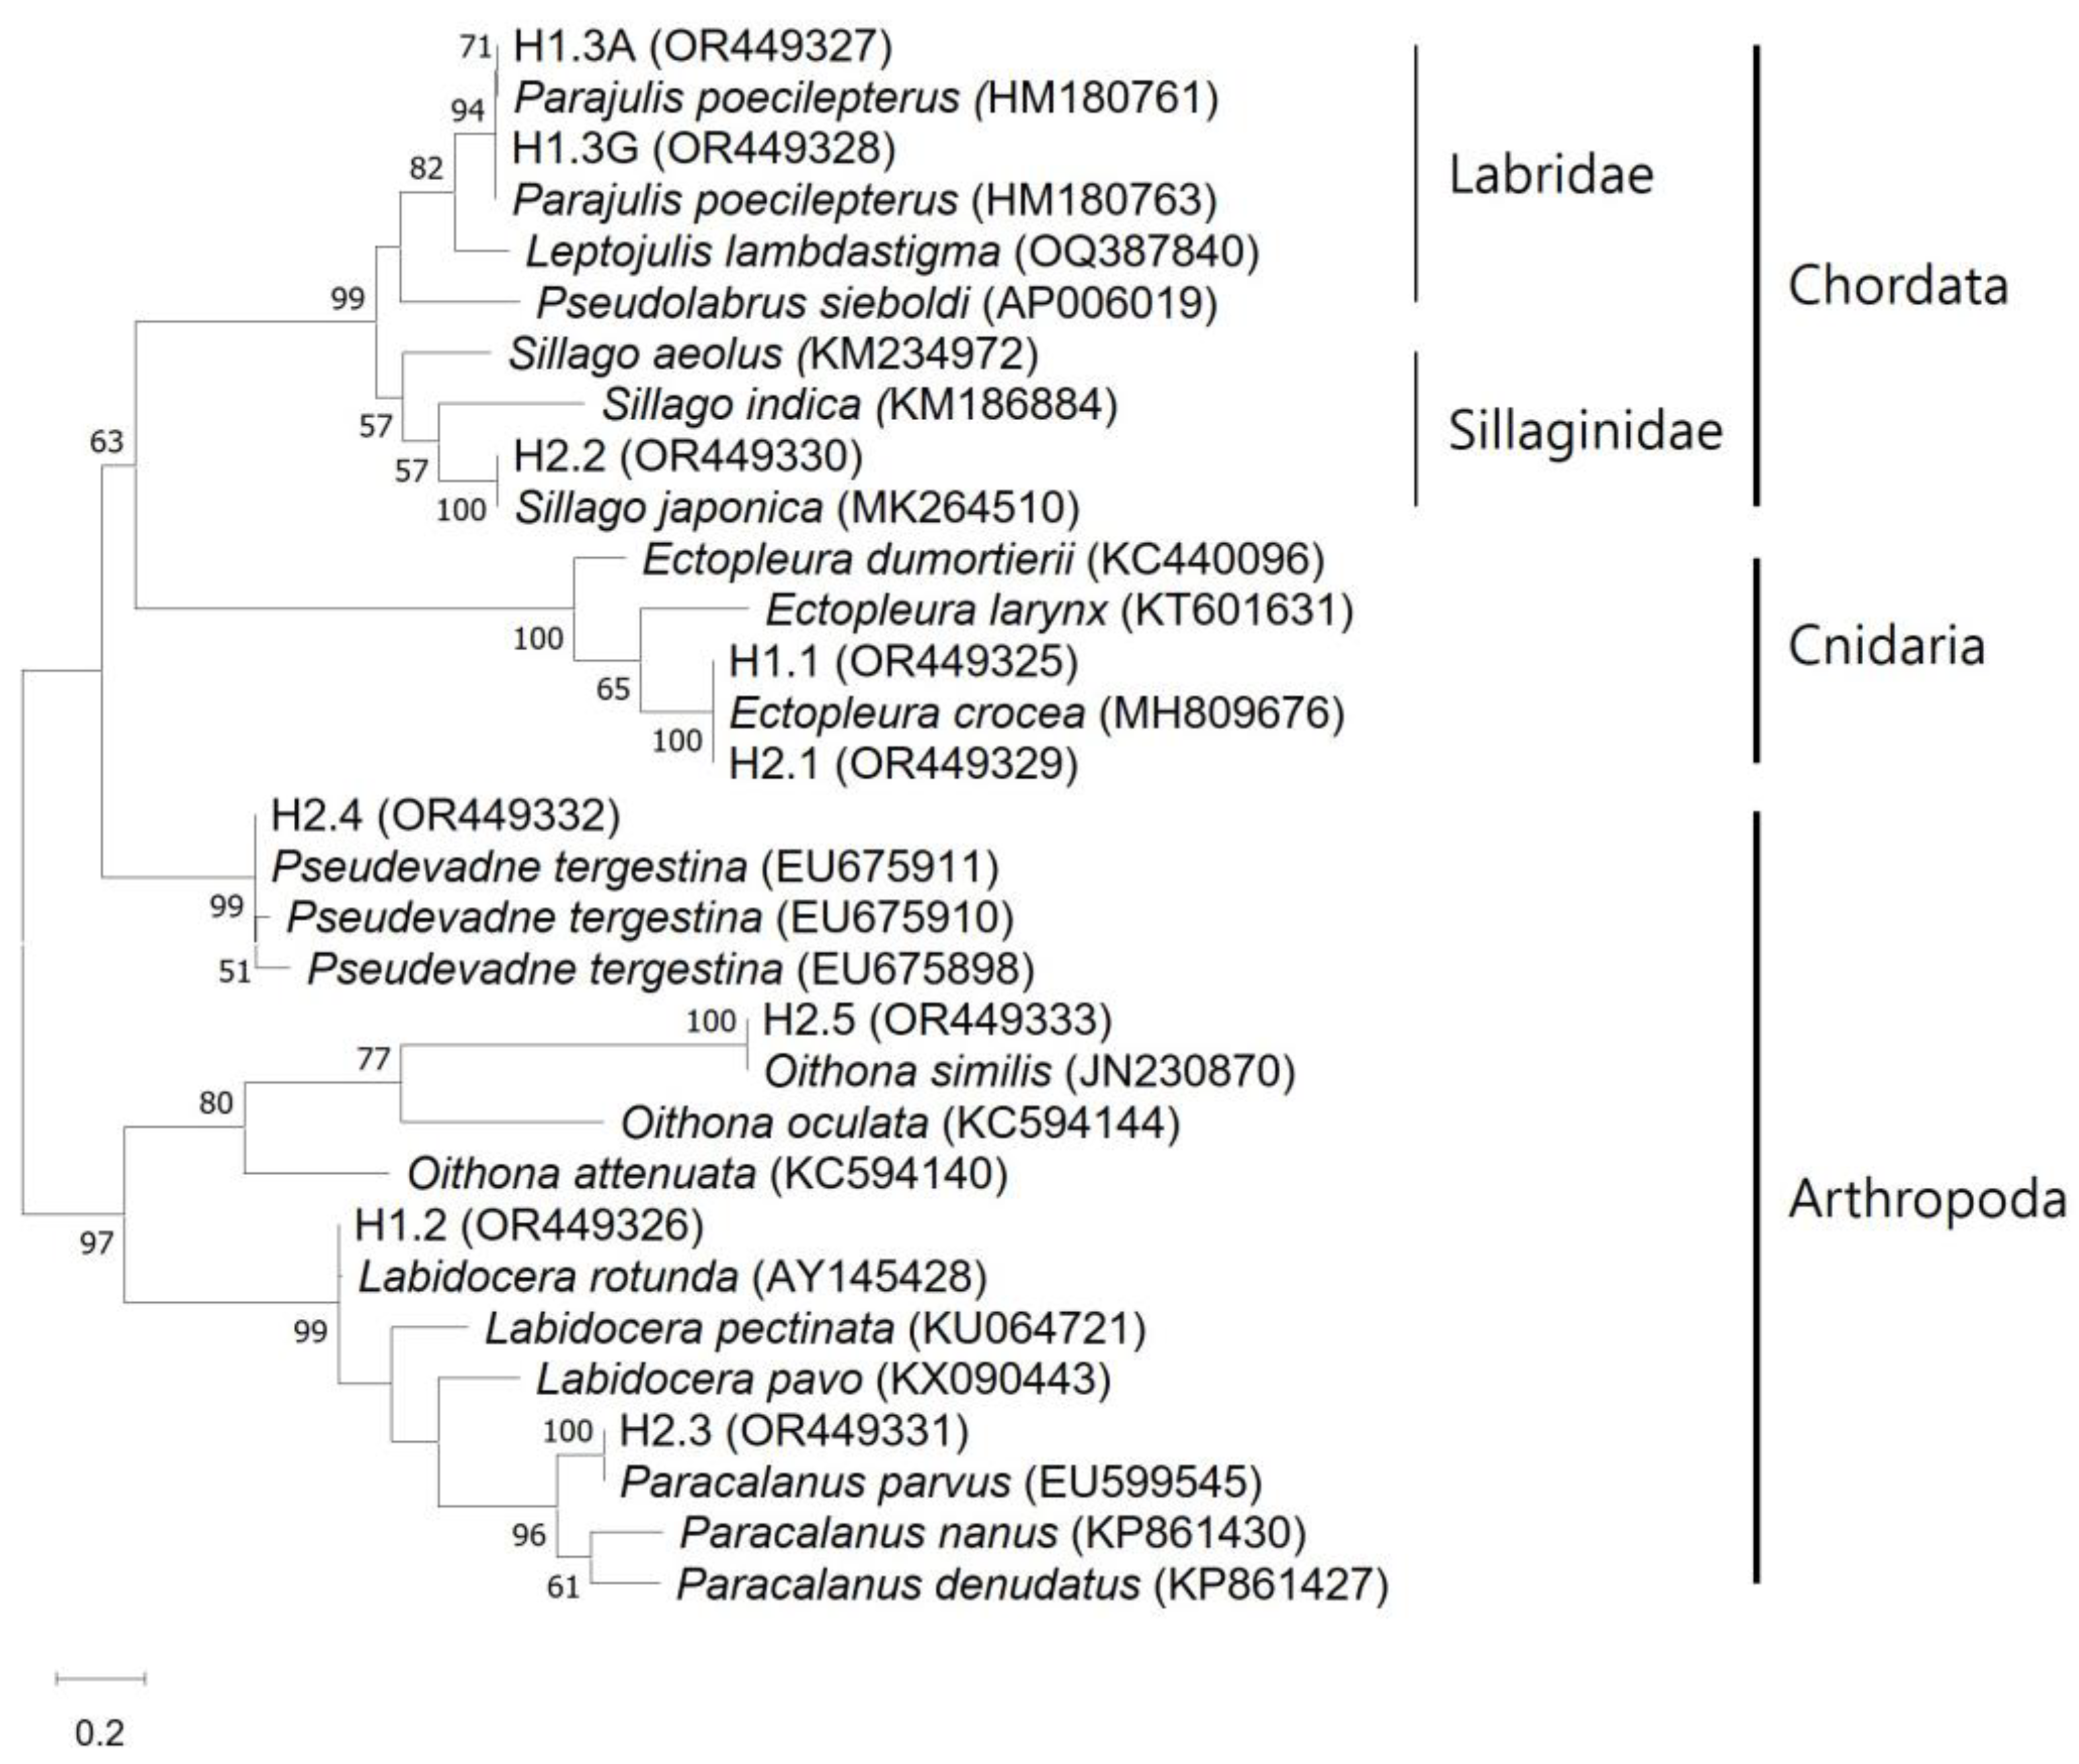
COI reads obtained from the two specimens were processed and then used to determine the species. The paired-end reads from the specimens were merged using BBmerge with a low merge rate [28]. Subsequently, the primer regions were eliminated from the merged reads utilizing Geneious R11 (https://www.geneious.com). Merged reads measuring between 310 and 316 base pairs in length were selected for further analysis, resulting in 6722 reads for H1 and 5210 reads for H2. The Geneious de novo assembler (set to Low Sensitivity/Fastest) was employed to assemble these merged reads into contigs for the construction of consensus sequences to represent each species. Consensus sequences composed of two or more contig reads were identified, resulting in 60 for H1 and 66 for H2.
From the consensus sequences consisting of contigs, sequences containing degenerate bases (e.g., R, Y, M, or K) were eliminated. After this process, 60 consensus sequences remained for H1, with a total of 6717 contig reads, while H2 had 50 consensus sequences with 5153 contig reads. From the consensus sequences featuring more than 100 contig reads (constituting >1% of the total), the final consensus sequences were extracted, totaling 5 from H1 and 10 from H2.
These consensus sequences were employed as reference sequences for mapping the merged paired-end reads using the Geneious R11 mapper (https://www.geneious.com). Following reference mapping, consensus sequences containing degenerate bases were discarded. This procedure led to the creation of a final set of nine representative sequences, including four from H1 and five from H2.
A BLAST search was performed using the nine representative sequences. The results revealed sequences with 100% coverage and pairwise identity values of 99% or greater compared to the representative sequences. Additionally, sequences of related taxa were extracted. Both the reference sequences and the representative sequences aligned using ClustalW [29] were utilized for the construction of a maximum-likelihood (ML) tree based on the HKY+G model (1000 bootstrap repetitions) in MEGA11 [30]. Ultimately, the representative sequences were classified into species based on their positions within the ML tree and genetic distances between the sequences.

3. Results

3.1. Morphology of Hydroids

For both hydroids (H1 and H2; Figure 1), the hydranth with a manubrium, gonophores, and distal and proximal tentacles were observed. The manubrium and gonangium were brown and transparent in color. All tentacles were transparent. Centered on the manubrium, distal tentacles were located at the upper entrance and proximal tentacles at the lower end. Sample H1 had gonangium surrounding the manubrium. H1 contained two fish eggs with one oil globule and H2 held one fish egg with one oil globule in the stomach.

3.2. Identification of Ectopleura crocea and Prey via Metabarcoding

COI metabarcoding identified the two specimens (H1 and H2) as Ectopleura crocea, which had preyed upon fish eggs. A total of nine representative sequences were obtained from the metabarcoding analysis, with four from H1 and five from H2 (Table 1). The ML tree constructed from representative and reference sequences distinguished three phyla: Cnidaria, Chordata, and Arthropoda (Figure 2). Representative sequences for predators and prey formed these clades, with each containing one species in one genus.
The representative sequences H1.1 (OR449325) from H1 and H2.1 (OR449329) from H2 formed a clade with the sequence (MH809676) of the predator E. crocea, which was also identified based on morphological characteristics. The genetic distance between H1.1 (OR449325), H2.1 (OR449329), and E. crocea (MH809676) in the Cnidaria clade was 0.000, which is much closer than the distance between species in the genus Ectopleura (0.216). Among representative sequences, H1.1 (OR449325) and H2.1 (OR449329) were constructed using the largest numbers of reads from H1 and H2, respectively (Table 1 and Table S1).
In addition to the representative sequences of predators, reference sequences of two species of Chordata, namely, Parajulis poecilepterus and Sillago japonica, showed a very high genetic similarity to representative sequences prepared from samples H1 and H2. Two sequences, H1.3A (OR449327) and H1.3G (OR449328) from H1, obtained from fish eggs had a 100% similarity with reference sequences for P. poecilepterus (HM180761 and HM180763). These two sequences differed in that position 223 was A in H1.3A and G in H1.3G. The genetic distance between these samples of P. poecilepterus was 0.003, significantly smaller than that between other species in the Labridae clade (0.242), namely, Leptojulis lambdastigma (OQ387840) and Pseudolabrus seiboldi (AP006019). Representative sequence H2.2 (OR449330) from H2 showed a 100% similarity with S. japonica (MK24510). The genetic distance between H2.2 and S. japonica (MK24510) was much smaller than the average genetic distance between species in the genus Sillago (0.282) (Table 1 and Table S1).
Additionally, four copepods, which are arthropods, were found in H1 and H2, including Labidocera rotunda, Paracalanus parvus, Pseudevadne tergestina, and Oithona similis. The genetic distance between L. rotunda (AY145428) and the representative sequence H1.2 (OR449326) of H1 was 0.007, much smaller than the distance of 0.224 among other species of the genus Labidocera (Table 1 and Table S1). Each of the three representative sequences from sample H2, H2.3 (OR449331), H2.4 (OR449332), and H2.5 (OR449333), formed a clade with a sample of known species, namely, Paracalanus parvus (EU599545), Pseudevadne tergestina (EU675911), and Oithona similis (JN230870), respectively. The genetic distance between each of these three representative sequences and reference sequences in the copepod clade was 0.000, indicating a much closer relationship than the average genetic distance among copepods of 0.502 (Table 1 and Table S1). These four species were not apparent during the external observation of E. crocea (Figure 1).

4. Discussion

This study investigated species of visually observed predator and prey (hydroids and fish eggs) as well as invisible prey (zooplankton) using COI metabarcoding. Diverse information on species composition and distributions and predator–prey relationships is necessary to understand the structure of ecosystems [31,32]. Predator–prey relationships are identified through direct observation in the wild or analysis of the stomach contents of collected specimens [33]. As an indirect method, these relationships can also be measured based on the relative composition ratio of stable isotopes in predators and prey [34]. One of the most widely used traditional analysis methods for predator–prey relationships is the identification of prey in the predator’s stomach contents [35,36]. This method provides a means to clarify the preferences of predators for certain species of prey [37]. Morphological traits, which are the criteria used for species identification of prey organisms, are inevitably damaged during predation and digestion [8]. Depending on the condition of the prey, species identification from stomach contents is often difficult or impossible. Recently, DNA barcoding and metabarcoding methods have been employed to overcome these difficulties [38,39,40].
The predator hydroid was identified as Ectopleura crocea and its prey included two species of fish eggs and four species of zooplankton. The major morphological characteristics of the hydroids (H1 and H2) such as the hydranth, manubrium, gonangium, and distal and proximal tentacles were identical to those of E. crocea [21,22,24]. The similarity between the nine representative sequences obtained from samples H1 and H2 and the reference sequences used for species identification was generally 100% (genetic distance, 0.000; Table S1). The representative sequences H1.1 (OR449325) and H2.1 (OR449329) from specimens H1 and H2, respectively, matched the sequence of E. crocea (MH809676) within the clade of genus Ectopleura (genetic distance, 0.000) (Figure 2). One species, Labidocera rotunda (AY145428), had a 99.4% sequence identity and a genetic distance of 0.007, much smaller than the genus Labidocera variation of 0.224. Interestingly, reference mapping to Parajulis poecilepterus (HM180761 and HM180763) using reads from the two egg-bearing H1 specimens generated two consensus sequences containing A and G at position 223, respectively. Considering the maternal inheritance of the mitochondrial DNA [41], the single-nucleotide polymorphism could indicate that these two eggs were released from different P. poecilepterus individuals. The genetic relationships between the representative and the reference sequences were useful for the intra- and interspecies identification of predators and prey.
Due to the feature of DNA metabarcoding, which is generally applied to a mixture of multiple index samples, cross-contamination (false positives) between samples may occur. Even if care is taken during experimental processes such as PCR amplification and sequencing, false positives identified after sequencing must be minimized in silico [42,43,44]. After sequencing our samples (H1 and H2), zooplankton that could not be identified in the external appearance of Hydra was discovered. First, we ruled out the possibility of zooplankton contamination because the two specimens were assessed along with other fish eggs physically separated from the zooplankton. And we strictly processed and filtered the reads to generate representative sequences. We also considered contamination from other fish eggs. A single species of fish was detected in two samples, each containing two fish eggs and one fish egg. In terms of the number of fish eggs, the theoretical maximum numbers of species for fish eggs per sample were 2 and 1, respectively, for H1 and 1 and 1 for H2. Moreover, the reads that make up the contig representing the fish eggs of these two species did not overlap between H1 and H2. Therefore, it was judged that contamination in this study was well controlled based on the experimental and sequencing process and the number of fish eggs.

5. Conclusions

Utilizing COI metabarcoding, not only did we detect fish eggs eaten by Ectopleura crocea, but also mostly digested zooplankton. E. crocea, the predator, preyed upon pelagic fish eggs, specifically Parajulis poecilepterus and Sillago japonica. Additionally, we found the presence of digested prey materials in the stomach of E. crocea, originating from four copepod species: Labidocera rotunda, Paracalanus parvus, Pseudevadne tergestina, and Oithona similis. The application of COI metabarcoding would be a promising tool for investigating this diminutive predator and its prey. In Korea, E. crocea is only recognized as an invasive species. Based on the results of this study, it is worth considering the role of E. crocea in coastal waters of Korea. Also, the discovery of a new predator of fish eggs, E. crocea, will expand our understanding of the feeding activities of E. crocea as well as fish egg mortality.

Supplementary Materials

The following supporting information can be downloaded at https://www.mdpi.com/article/10.3390/jmse11112178/s1, Table S1: Genetic distances within and between the COI sequences of hydroids that fed on fish eggs.

Author Contributions

Conceptualization, H.-Y.C. and S.K.; methodology, H.-Y.C.; software, H.-Y.C. and S.K.; validation, H.-Y.C. and S.K.; formal analysis, H.-Y.C. and S.K.; investigation, H.-Y.C.; resources, S.K.; data curation, H.-Y.C.; writing—original draft preparation, H.-Y.C.; writing—review and editing, S.K.; visualization, H.-Y.C. and S.K.; supervision, S.K.; project administration, S.K.; funding acquisition, S.K. All authors have read and agreed to the published version of the manuscript.

Funding

This research was funded by the Korea Institute of Ocean Science & Technology, grant numbers PEA0111 and PE99964.

Institutional Review Board Statement

Not applicable.

Informed Consent Statement

Not applicable.

Data Availability Statement

The COI sequence data that support the findings of this study are deposited in NCBI/GenBank (https://www.ncbi.nlm.nih.gov/genbank/; accessed on 16 August 2023.) under accession numbers OR449325-OR449333.

Acknowledgments

We express our gratitude to the researchers at the Tongyeong Megacosm Test Station of the KISOT for their invaluable assistance with the sampling process.

Conflicts of Interest

The authors declare no conflict of interest.

References

  1. Kendall, A.W.; Ahlstrom, E.H.; Moser, H.G. Early life history stages of fishes and their characters. In Ontogeny and Systematics of Fishes; Moser, H.G., Richards, W.J., Cohen, D.M., Fahay, M.P., Kendall, A.W., Richardson, S.L., Eds.; American Society of Ichthyologists and Herpetologists Special Publication: Lawrence, KS, USA, 1984; pp. 11–24. [Google Scholar]
  2. Houde, E.D. Fish early life dynamics and recruitment variability. Am. Fish. Soc. Symp. 1987, 2, 17–29. [Google Scholar]
  3. Cushing, D.H. A link between science and management in fisheries. Fish. Bull. 1974, 72, 859–864. [Google Scholar]
  4. Bunn, N.A.; Fox, C.J.; Webb, T. A Literature Review of Studies on Fish Egg Mortality: Implications for the Estimation of Spawning Stock Biomass by the Annual Egg Production Method; Centre for Environment, Fisheries, and Aquaculture Science: Lowestoft, UK, 2000; pp. 1–37. [Google Scholar]
  5. Hunter, J.R. Inferences regarding predation on the early life stages of cod and other fishes. In The Propagation of Cod Gadus morhua L.; Dahl, E., Danielssen, D.S., Moksness, E., Solemdal, P., Eds.; Flodevigen Rapportser: Arendal, Norway, 1984; pp. 533–562. [Google Scholar]
  6. Heath, M.R. Field investigations of the early life stages of marine fish. Adv. Mar. Biol. 1992, 28, 1–174. [Google Scholar]
  7. Fox, C.J.; Taylor, M.I.; Van der Kooij, J.; Taylor, N.; Milligan, S.P.; Albaina, A.; Pascoal, S.; Lallias, D.; Maillard, M.; Hunter, E. Identification of marine fish egg predators using molecular probes. Mar. Ecol. Prog. Ser. 2012, 462, 205–218. [Google Scholar] [CrossRef]
  8. Buckland, A.; Baker, R.; Loneragan, N.; Sheaves, M. Standardising fish stomach content analysis: The importance of prey condition. Fish. Res. 2017, 196, 126–140. [Google Scholar] [CrossRef]
  9. Shao, K.T.; Chen, K.C.; Wu, J.H. Identification of marine fish eggs in Taiwan using light microscopy, scanning electric microscopy and mtDNA sequencing. Mar. Freshw. Res. 2002, 53, 355–365. [Google Scholar] [CrossRef]
  10. Choi, H.Y.; Choi, H.C.; Kim, S.; Oh, H.J.; Youn, S.H. Discovery of pelagic eggs of two species from the rare mesopelagic fish genus Trachipterus (Lampriformes: Trachipteridae). J. Mar. Sci. Eng. 2022, 10, 637. [Google Scholar] [CrossRef]
  11. Zimmermann, J.; Glöckner, G.; Jahn, R.; Enke, N.; Gemeinholzer, B. Metabarcoding vs. morphological identification to assess diatom diversity in environmental studies. Mol. Ecol. Resour. 2015, 15, 526–542. [Google Scholar] [CrossRef]
  12. Cahill, A.E.; Pearman, J.K.; Borja, A.; Carugati, L.; Carvalho, S.; Danovaro, R.; Dashfield, S.; David, R.; Féral, J.P.; Olenin, S. A comparative analysis of metabarcoding and morphology-based identification of benthic communities across different regional seas. Ecol. Evol. 2018, 8, 8908–8920. [Google Scholar] [CrossRef]
  13. Lobo, J.; Shokralla, S.; Costa, M.H.; Hajibabaei, M.; Costa, F.O. DNA metabarcoding for high-throughput monitoring of estuarine macrobenthic communities. Sci. Rep. 2017, 7, 15618. [Google Scholar] [CrossRef]
  14. Kimmerling, N.; Zuqert, O.; Amitai, G.; Gurevich, T.; Armoza-Zvuloni, R.; Kolesnikov, I.; Berenshtein, I.; Melamed, S.; Gilad, S.; Benjamin, S.; et al. Quantitative species-level ecology of reef fish larvae via metabarcoding. Nat. Ecol. Evol. 2018, 2, 306–316. [Google Scholar] [CrossRef] [PubMed]
  15. Song, C.U.; Choi, H.; Jeon, M.S.; Kim, E.J.; Jeong, H.G.; Kim, S.; Kim, C.G.; Hwang, H.J.; Purnaningtyas, D.W.; Lee, S.; et al. Zooplankton diversity monitoring strategy for the urban coastal region using metabarcoding analysis. Sci. Rep. 2021, 11, 24339. [Google Scholar] [CrossRef] [PubMed]
  16. Breitbart, M.; Kerr, M.; Schram, M.J.; Williams, I.; Koziol, G.; Peebles, E.; Stallings, C.D. Evaluation of DNA metabarcoding for identifying fish eggs: A case study on the West Florida Shelf. PeerJ 2023, 11, e15016. [Google Scholar] [CrossRef]
  17. Gül, G.; Keskin, E.; Demirel, N. Comparison of fish prey contribution in the diet of European hake by visual assessment of stomach contents and DNA metabarcoding. Environ. Biol. Fishes 2023, 106, 613–625. [Google Scholar] [CrossRef]
  18. Genzano, G.N. Trophic ecology of a benthic intertidal hydroid, Tubularia crocea, at Mar del Plata, Argentina. J. Mar. Biol. Assoc. UK 2005, 85, 307–312. [Google Scholar] [CrossRef]
  19. Mills, C.E.; Marques, A.C.; Migotto, A.E.; Calder, D.R.; Hand, C.; Rees, J.T.; Haddock, S.H.D.; Dunn, C.W.; Pugh, P.R. Hydrozoa: Polyps, Hydromedusae, and Siphonophora. In The Light and Smith Manul, 4th ed.; Carlton, J.T., Ed.; University of California Press: Berkeley, CA, USA, 2007; pp. 118–167. [Google Scholar]
  20. Kamita, T.; Sato, T.N. Marine fauna at Jinsen (Incheon) Bay, Corea. J. Chosen Nat. Hist. Soc. 1941, 8, 2. [Google Scholar]
  21. Rho, R.J. Studies in the marine hydroids in Korea (2). J. Korean Res. Inst. Better Liv. Ewha Womans Univ. 1969, 2, 161–172. [Google Scholar]
  22. Park, J.H. Invertebrate Fauna of Korea. No. 1. Cnidaria: Hydrozoa: Thecata. Thecates; National Institute of Biological Resources: Incheon, Republic of Korea, 2010; Volume 4. [Google Scholar]
  23. Kim, P.; Yoon, T.J.; Shin, S. Environmental DNA and specific primers for detecting the invasive species Ectopleura crocea (Hydrozoa: Anthoathecata) in seawater samples. Sustainability 2020, 12, 2360. [Google Scholar] [CrossRef]
  24. Oregon Estuarine Invertebrates: Rudys’ Illustrated Guide to Common Species (Third Edition). Available online: https://researchguides.uoregon.edu/c.php?g=542184&p=3886596 (accessed on 1 September 2023).
  25. Leray, M.; Yang, J.Y.; Meyer, C.P.; Mills, S.C.; Agudelo, N.; Ranwez, V.; Boehm, J.T.; Machida, R.J. A new versatile primer set targeting a short fragment of the mitochondrial COI region for metabarcoding metazoan diversity: Application for characterizing coral reef fish gut contents. Front. Zool. 2013, 10, 34. [Google Scholar] [CrossRef]
  26. Choi, H.Y.; Chin, B.S.; Park, G.S.; Kim, S. Evidence of intrusion of a rare species, Peristedion liorhynchus, into Korean waters based on high-throughput sequencing of the mixed fish eggs. Korean J. Icthyol. 2022, 34, 8–15. [Google Scholar] [CrossRef]
  27. 16S Metagenomic Sequencing Library Preparation. Preparing 16S Ribosomal RNA Gene Amplicons for the Illumina MiSeq System. Available online: https://support.illumina.com/documents/documentation/chemistry_documentation/16s/16s-metagenomic-library-prep-guide-15044223-b.pdf (accessed on 1 September 2023).
  28. Bushnell, B.; Rood, J.; Singer, E. BBMerge–accurate paired shotgun read merging via overlap. PLoS ONE 2017, 12, e0185056. [Google Scholar] [CrossRef] [PubMed]
  29. Thompson, J.D.; Higgins, D.G.; Gibson, T.J. CLUSTAL W: Improving the sensitivity of progressive multiple sequence alignment through sequence weighting, position-specific gap penalties and weight matrix choice. Nucleic Acids Res. 1994, 22, 4673–4680. [Google Scholar] [CrossRef]
  30. Tamura, K.; Stecher, G.; Kumar, S. MEGA11: Molecular evolutionary genetics analysis version 11. Mol. Biol. Evol. 2021, 38, 3022–3027. [Google Scholar] [CrossRef] [PubMed]
  31. Hunsicker, M.E.; Ciannelli, L.; Bailey, K.M.; Buckel, J.A.; White, J.W.; Link, J.S.; Essington, T.E.; Gaichas, S.; Anderson, T.W.; Brodeur, R.D.; et al. Functional responses and scaling in predator–prey interactions of marine fishes: Contemporary issues and emerging concepts. Ecol. Lett. 2011, 14, 1288–1299. [Google Scholar] [CrossRef]
  32. Lee, S.; Youn, S.H. Integrated Ecosystem Assessments for Fisheries Management in the Yellow Sea, the East China Sea, and the East/Japan Sea. J. Mar. Sci. Eng. 2023, 11, 845. [Google Scholar] [CrossRef]
  33. Pryor, K.J.; Milton, A.M. Multi-species fish foraging associations during tool use by the graphic tuskfish Choerodon graphicus (De Vis 1885) (Labridae). Mar. Ecol. 2021, 42, e12669. [Google Scholar] [CrossRef]
  34. Rodríguez-Malagón, M.A.; Speakman, C.N.; Sutton, G.J.; Angel, L.P.; Arnould, J.P. Temporal and spatial isotopic variability of marine prey species in south-eastern Australia: Potential implications for predator diet studies. PLoS ONE 2021, 16, e0259961. [Google Scholar] [CrossRef]
  35. Hyslop, E.J. Stomach contents analysis—A review of methods and their application. J. Fish Biol. 1980, 17, 411–429. [Google Scholar] [CrossRef]
  36. Ibáñez, C.M.; Riera, R.; Leite, T.; Díaz-Santana-Iturrios, M.; Rosa, R.; Pardo-Gandarillas, M.C. Stomach content analysis in cephalopods: Past research, current challenges, and future directions. Rev. Fish Biol. Fish. 2021, 31, 505–522. [Google Scholar] [CrossRef]
  37. Chang, W.J.; Lee, D.S.; Lee, D.Y.; Park, Y.S.; Kwak, I.S. Analysis of food preference and competition based on stomach contents of fish species inhabiting fresh and brackish waters in South Korea. Ecol. Freshw. Fish 2023, 32, 64–79. [Google Scholar]
  38. Smith, P.J.; Mcveagh, S.M.; Allain, V.; Sanchez, C. DNA identification of gut contents of large pelagic fishes. J. Fish Biol. 2005, 37, 1178–1183. [Google Scholar] [CrossRef]
  39. Lutz, E.; Hirsch, P.E.; Bussmann, K.; Wiegleb, J.; Jermann, H.P.; Muller, R.; Burkhardt-Holm, P.; Adrian-Kalchhauser, I. Predation on native fish eggs by invasive round goby revealed by species-specific gut content DNA analyses. Aquat. Conserv. Mar. Freshw. 2020, 30, 1566–1577. [Google Scholar] [CrossRef]
  40. Coker, D.J.; DiBattista, J.D.; Stat, M.; Arrigoni, R.; Reimer, J.; Terraneo, T.I.; Villalobos, R.; Nowicki, J.P.; Bunce, M.; Berumen, M.L. DNA metabarcoding confirms primary targets and breadth of diet for coral reef butterflyfishes. Coral Reefs 2023, 42, 1–15. [Google Scholar] [CrossRef]
  41. Brown, K.H. Fish mitochondrial genomics: Sequence, inheritance and functional variation. J. Fish Biol. 2008, 72, 355–374. [Google Scholar] [CrossRef]
  42. Cibulskis, K.; McKenna, A.; Fennell, T.; Banks, E.; DePristo, M.; Getz, G. ContEst: Estimating cross-contamination of human samples in next-generation sequencing data. Bioinformatics 2011, 27, 2601–2602. [Google Scholar] [CrossRef] [PubMed]
  43. Fiévet, A.; Bernard, V.; Tenreiro, H.; Dehainault, C.; Girard, E.; Deshaies, V.; Hupe, P.; Delattre, O.; Stern, M.H.; Stoppa-Lyonnet, D.; et al. ART-DeCo: Easy tool for detection and characterization of cross-contamination of DNA samples in diagnostic next-generation sequencing analysis. Eur. J. Hum. Genet. 2019, 27, 792–800. [Google Scholar] [CrossRef]
  44. Jurasz, H.; Pawłowski, T.; Perlejewski, K. Contamination issue in viral metagenomics: Problems, solutions, and clinical perspectives. Front. Microbiol. 2021, 12, 745076. [Google Scholar] [CrossRef]
Figure 1. Photos of hydroids collected from the southern coast of Korea. Abbreviations: h, hydranth; m, manubrium; g, gonophore; d, distal tentacle; p, proximal tentacle. Yellow bar, 1 mm.
Jmse 11 02178 g001
Figure 2. ML tree based on the COI sequences of hydroids that fed on fish eggs. Bootstrap values (1000 replicates) greater than 50% are shown on the branches. The sequences obtained in this study are provided in Table 1.
Jmse 11 02178 g002
Table 1. Information about the representative sequences (Rep.) of samples and reference sequences (Ref.) from the National Center for Biotechnology Information.
Taxonomy Sample
PhylumSpeciesH1H2
Rep.
(accession number)
ReadsRef.
accession
number
Paired
identity
Rep.
(accession number)
ReadsRef.
accession
number
Paired
identity
CnidariaEctopleura
crocea
H1.1
(OR449325)
5477MH809676100.0H2.1
(OR449329)
1345MH809676100.0
ChordataParajulis
poecilepterus
H1.3A
(OR449327)
102HM180761100.0
Parajulis
poecilepterus
H1.3G
(OR449328)
146HM180763100.0
Sillago
japonica
H2.2
(OR449330)
1054MK264510100.0
ArthropodaLabidocera
rotunda
H1.2
(OR449326)
934AY14542899.4
Paracalanus
parvus
H2.3
(OR449331)
801KC784345100.0
Pseudevadne
tergestina
H2.4
(OR449332)
621EU675911100.0
Oithona
similis
H2.5
(OR449333)
298JN230870100.0
Total 6659 4119
Disclaimer/Publisher’s Note: The statements, opinions and data contained in all publications are solely those of the individual author(s) and contributor(s) and not of MDPI and/or the editor(s). MDPI and/or the editor(s) disclaim responsibility for any injury to people or property resulting from any ideas, methods, instructions or products referred to in the content.

