Article

Spatiotemporal Distribution and Evolution Characteristics of Water Traffic Accidents in Asia since the 21st Century

1
State Key Laboratory of Maritime Technology and Safety, Wuhan University of Technology, Wuhan 430063, China
2
National Engineering Research Center for Water Transport Safety, Wuhan University of Technology, Wuhan 430063, China
3
School of Transportation and Logistics Engineering, Wuhan University of Technology, Wuhan 430063, China
*
Author to whom correspondence should be addressed.
J. Mar. Sci. Eng. 2023, 11(11), 2112; https://doi.org/10.3390/jmse11112112
Submission received: 24 September 2023 / Revised: 31 October 2023 / Accepted: 2 November 2023 / Published: 5 November 2023

Abstract

:
As an important mode of transportation for the global trade, waterborne transportation has become a priority option for import and export trade due to its large load capacity and relatively low cost. Meanwhile, shipping safety has been highly valued. By collecting technological water traffic accident data from the EM-DAT database, the spatiotemporal distribution and evolution characteristics were investigated in Asia since 2000. The methods of gravity center and standard deviation ellipse analysis were utilized to determine the spatial and data-related characteristics of water traffic accidents. Temporally, the results indicated that accidents occurred most frequently during the seasons of autumn and winter, leading to a significant number of casualties. Spatially, both South-eastern Asia and Southern Asia emerged as regions with a high frequency of water traffic accidents, particularly along the borders of Singapore, Malaysia, Indonesia, and the Bay of Bengal region. In addition, the Daniel trend test and R/S analysis were conducted to demonstrate the evolution trend of accidents across various regions and seasons. The present study provides guidance for improving marine shipping safety, emergency resource management, and relevant policy formulation.

1. Introduction

Waterborne transportation, known for its energy efficiency [1], high cargo capacity, and cost-effectiveness [2], is the primary mode of international trade. Additionally, it is highly concerned as an important transportation mode which can construct a balance between overall economic development [3] and ecological environment protection in developing countries [4,5]. If a ship encounters a safety incident during its journey, the absence of timely and effective rescue efforts would result in substantial economic losses and loss of human lives. To mitigate the frequency of water traffic accidents and ensure maritime safety, the International Maritime Organization (IMO) [6] was established, and is dedicated to promoting a safe, efficient, and sustainable shipping industry.
The potential causes, underlying mechanisms, and risk assessments of water traffic accidents always differ between regions. For example, occurrences of inland shipping accidents in Europe are related to the geography, climate, national economic background, and safety culture characteristics [7]. The risk assessment of waterborne transportation becomes challenging due to the complex mechanisms and multivariate factors. Therefore, great effort has been devoted, both by academia and industry, to improve water transport safety. Cao et al. [8] provided a theoretical basis for the implementation direction of maritime safety development. Huang et al. [9] demonstrated that artificial intelligence-based risk assessment methods could provide systematic and comprehensive results. Ma et al. [10] synthesized DEMATEL (decision-making trial and evaluation laboratory), ISM (interpretative structural modeling method), FBN (fuzzy Bayesian network), and other methods to reveal influencing factors and their weights for maritime dangerous goods transportation accidents, and put forward a new comprehensive risk analysis method.
The analysis of water traffic accidents would also support the decision-making of the authorities, e.g., maritime administrations and waterway management departments. Hanafiah et al. [11] conducted vessel navigation safety analysis to improve the maritime situational awareness in the Malacca Straits which could help authorities to respond more effectively to accidents. Ma et al. [10] identified more than 20 influencing factors according to the reports of maritime dangerous goods transport accidents in China, and established a BN (Bayesian network) model, which provided a quantitative evaluation of risk factors. Fan et al. [12] analyzed the occurrence of shipping accidents from the perspective of seafarers, and put forward an evaluation framework of seafarers’ psychological quality based on the neurophysiology society. The framework would provide effective means for the selection of seafarers and their driving behavior evaluations. According to statistical analysis, a series of human-related factors, e.g., operation and psychological quality of crew, contributes to 70% of water traffic accidents [13,14]. In addition, the impact of vessel traffic service operators on the overall water traffic safety cannot be ignored [15].
In this article, the water traffic accidents data were extracted from the EM-DAT database from the beginning of the 21st century for Asia. Through the methods of gravity center analysis and standard deviation ellipse, the spatiotemporal distribution and evolution characteristics of water traffic accidents were analyzed. The incidence periods and locations were explored as well. The Daniel trend test and R/S analysis were adopted to estimate the development trend of water traffic accidents, which could provide a basis for water traffic accidents prevention in Asian countries and ensure maritime traffic safety.
The remaining part of the article is organized as follows. A brief introduction of the EM-DAT database is provided in Section 2. In Section 3, the specific methods are elaborated upon in detail. A comprehensive analysis and discussion on both spatiotemporal characteristics and evolution trend are presented in Section 4 and Section 5. The concluding remarks and prospects are provided in Section 6.

2. Data Sources

As a well-known disaster collection database, EM-DAT has recorded natural and other technological disasters worldwide since 1900, including the starting and ending time of the events, the causes (triggering factors), economic losses, secondary disasters, deaths, missing persons, and affected people caused by various events (injuries and homelessness due to disasters, etc.). The database has been widely utilized to reveal the evolution characteristics of disasters such as floods [16], landslides, and extreme weather conditions [17] on different scales in the world, which would be beneficial for risk assessment [18], emergency resourcing management, and disaster prevention [19,20,21] etc.
Notably, the EM-DAT database upholds stringent criteria governing the incorporation of disaster data; only events meeting specific conditions are deemed eligible for inclusion. Due to the special nature of the EM-DAT database, all water traffic accidents are categorized as one technological group and some specific accidents (e.g., fishing vessel accidents) are not included. This shortcoming might be overcome by introducing some other data sources (e.g., IMO, Lloyd’s List Intelligence [22,23], etc.). In addition, a minimum number of 10 deaths or 100 affected individuals applies for event qualification [24]. Alternatively, if the national government publicly declares a state of emergency during the incident or international assistance is solicited, the event would be recorded. These rigorous standards reinforce the integrity of the EM-DAT database. A total number of 397 accident records were adopted for analysis in the present study.

3. Methodology

3.1. The Methods of Gravity Center and Standard Deviation Ellipse

The center of gravity was put forward in the mechanical field in physics, and is considered as the point where forces are balanced in all directions in the regional space. The center of gravity analysis is widely applied to demonstrate spatial variation characteristics [25], thus their evolving features could be revealed for different time periods [26,27]. “.shp” files with site information (e.g., latitude and longitude) were imported to create an overall visualization of accident data. Scatterplots were thereby generated and the classification tool of ArcGIS was employed to visualize the severity and distribution characteristics. The gravity centers of various regions were calculated, on the basis of which standard deviation ellipses were obtained for different stages. Subsequently, all these elements were integrated to facilitate further analysis. The calculation of the gravity center is given as follows:
x I ¯ = j = 1 n x j w j / j = 1 n w j
y I ¯ = j = 1 n y j w j / j = 1 n w j
where ( x j , y j ) is the barycentric coordinate of the sub-region, w j is element value corresponding to the sub-region, and ( x I ¯ , y I ¯ ) is the barycentric coordinate of the main region.
The standard deviation ellipse was initially interpreted by Lefever [28] as a summary measure of two-dimensional points. Firstly, the standard deviation of a group of points scattered in two dimensions was obtained as an x axis and y axis, and then these two axes were rotated. Subsequently, the new standard deviation of the x axis and y axis was calculated, after which the rotation angle with the maximum standard deviation could be obtained. A new coordinate axis could thus be created to derive the short and long axes [29]. The short axis indicates the distribution range of elements, the long axis denotes the distribution direction of all elements, and the difference between the long and short axes represents the distribution directivity of elements. The center of the ellipse represents the central position of all elements. The calculation formulas are given below:
x = ( i = 1 n ( x i X ) 2 ) / n
y = ( i = 1 n ( y i Y ) 2 ) / n
where ( x i , y i ) is coordinates of element point which ranks in i place and ( X , Y ) denotes the regional barycentric coordinate. The rotation angle of ellipse is calculated as follows.
tan θ = ( i = 1 n x i 2 i = 1 n y i 2 ) + ( i = 1 n x i 2 i = 1 n y i 2 ) 2 + 4 ( i = 1 n x i y i ) 2 2 i = 1 n x i y i
where x i = x i X , y i = y i Y .
The calculation of the long and short axes is accomplished using the subsequent formulas:
φ x = ( i = 1 n ( x i cos θ y i sin θ ) 2 ) / n
φ y = ( i = 1 n ( x i sin θ y i cos θ ) 2 ) / n

3.2. Daniel Trend Test and R/S Analysis

The Daniel trend test is a statistical analysis method based on the Spearman rank correlation coefficient and can be accomplished by MATLAB. Given a dataset with a length smaller than four, it does not need to consider the data accuracy in the test process, but only sorts the time series [30]. The rank correlation coefficient r is calculated as follows:
r = 1 ( 6 i = 1 N d i 2 ) / ( N 3 N )
where d i = X i Y i , N is the length of the dataset. Provided that r > 0 , a rising trend in the data could be demonstrated, and vice versa [31].
R/S analysis is known as a traditional method for time series analysis [32]. By dividing the data of 23 years into T continuous intervals D n ( n = 1 , 2 , , t ) , each interval element is denoted as y k , n ( k = 1 , 2 , , n ) , and n is the integer part of 23 / T . The R/S statistic is accomplished by MATLAB and the principal equation is given as follows:
Q n = R n / S n
In addition, Q n can be obtained by following the principle of statistics.
Q n = C 1 × n H
The calculated H value (Hurst coefficient) is the index of the correlation and represents the trend of time sequences [30]. The specific values correspond to different evolution features as shown below.
0 < H < 0.5 ,   changing   trend   is   contrary   to   the   past H = 0.5 ,   unpredictable 0.5 < H < 1 ,   continue   the   changing   trend   of   the   past

4. Occurrence Analysis of Water Traffic Accidents

4.1. Time Series Analysis

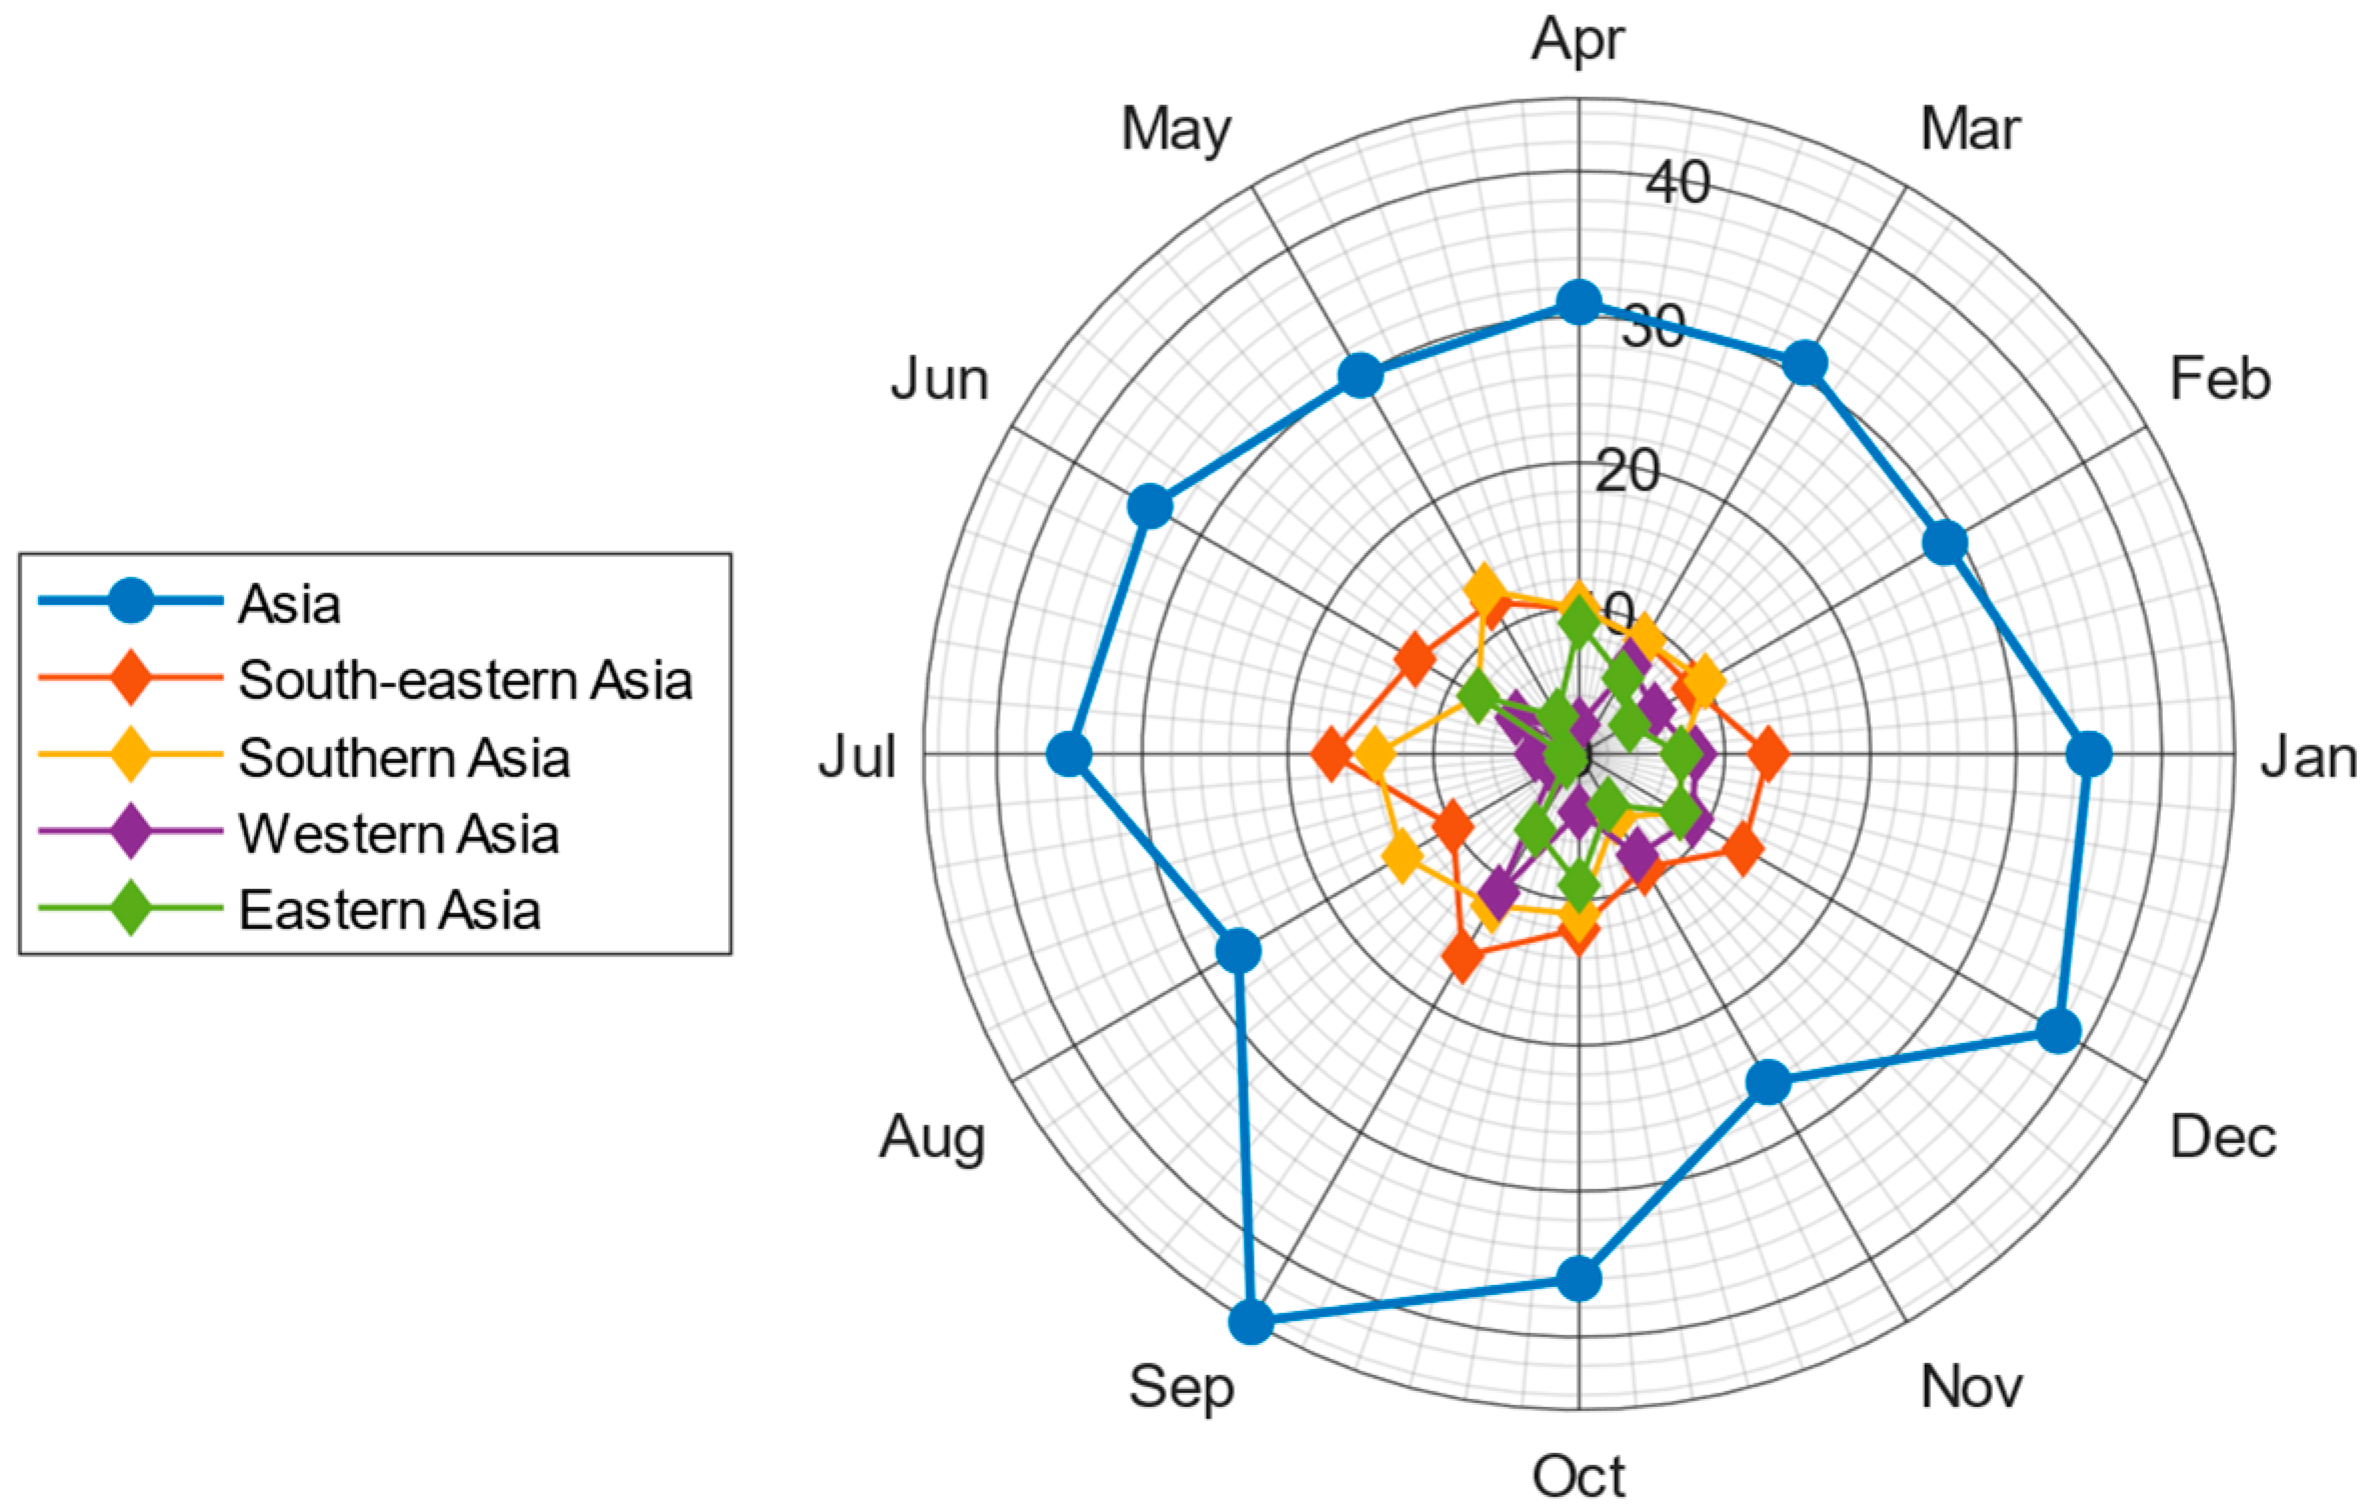
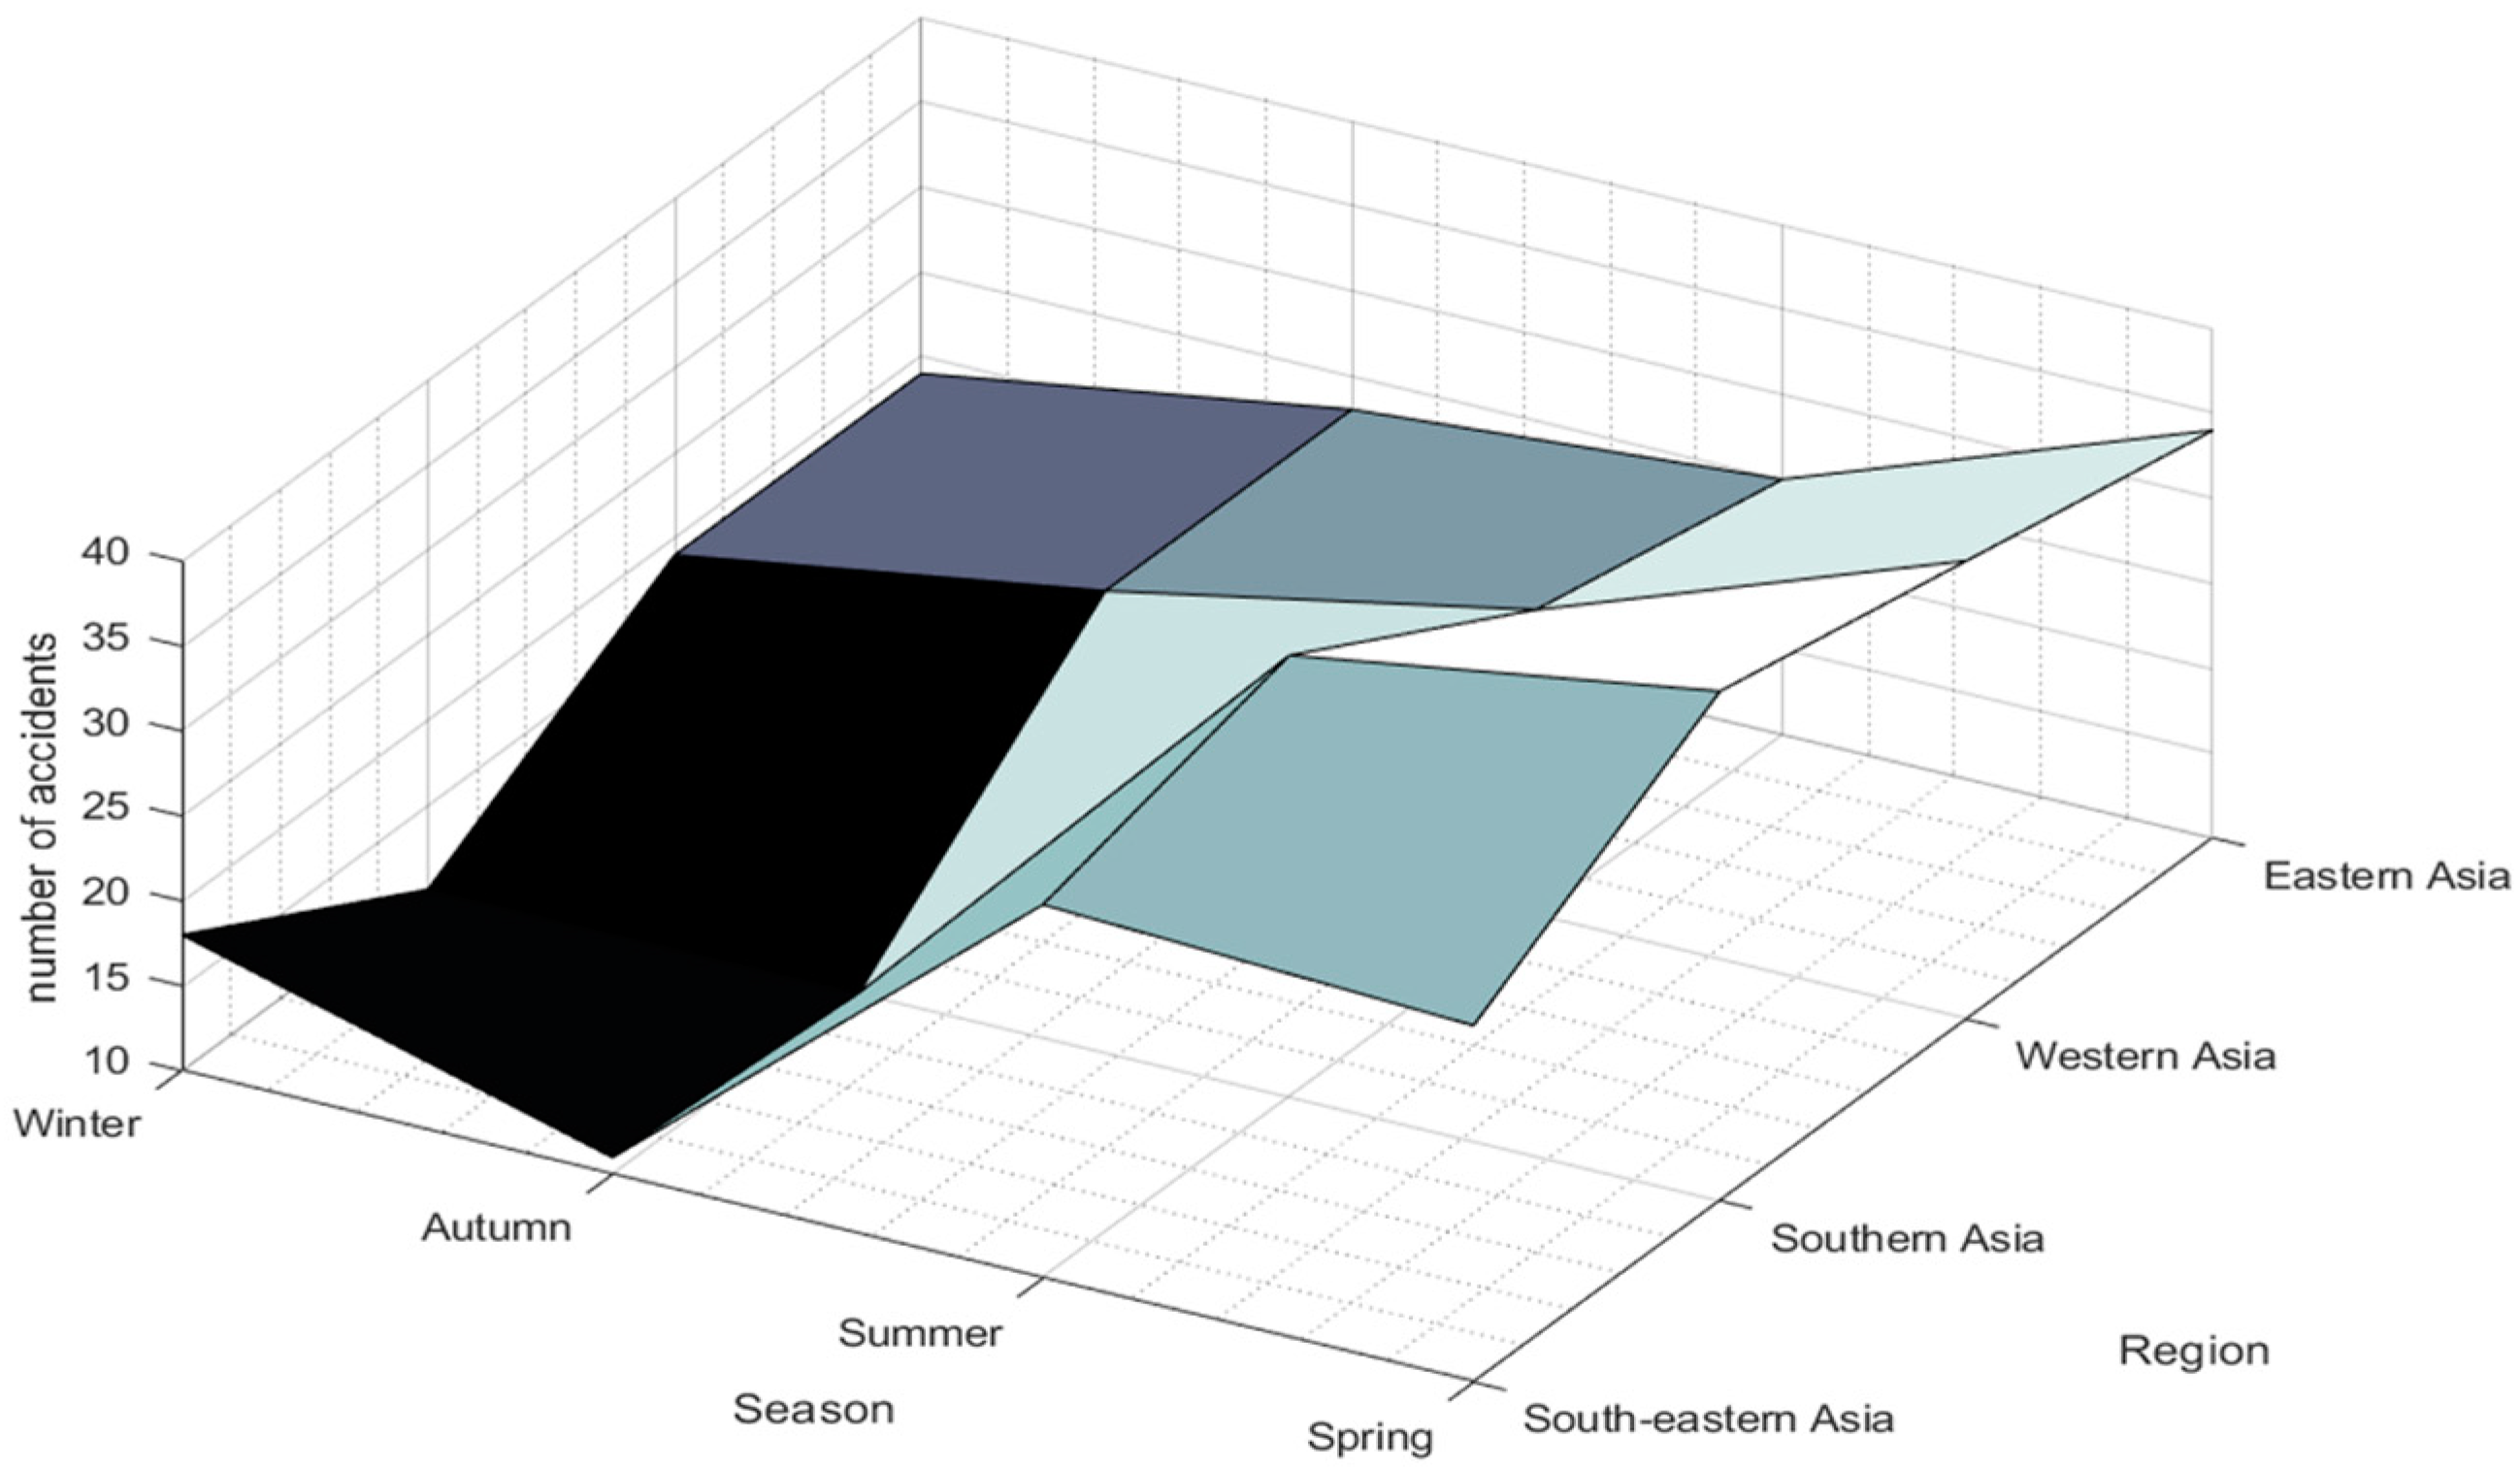
4.1.1. Seasonal Distribution of Water Traffic Accidents

The accident occurrence features could be explored for different Asian regions, as shown in Figure 1 and Figure 2. It is noted that the accident records greatly exceeded 30 for September, October, and December. In addition, the occurrence frequency of water traffic accidents in South-eastern Asia and Southern Asia are relatively higher than other regions, which might be attributed to the developed shipping industry in these regions. Within South-eastern Asia, the months of January, July, September, and December manifested heightened accident frequencies. Southern Asia, on the other hand, witnessed heightened occurrences in May, July, August, and September. In Western Asia, water traffic accidents were commonly observed in January, September, November, and December, while in Eastern Asia, accidents more frequently occurred in June, October, and December.
The seasonal distribution characteristics of water traffic accidents are demonstrated in Figure 2. Autumn stands out as the season with the majority of water traffic accidents, tallying 107 occurrences. Following closely, winter documented 102 incidents. Within this context, South-eastern Asia experienced frequent accidents in both summer and autumn, reaching 40 and 37, respectively. Meanwhile, Southern Asia recorded 36 incidents in summer, and Western Asia documented 23 occurrences each in autumn and winter. In Eastern Asia, notable accident frequencies were observed, encompassing 18 incidents in spring and 19 incidents in both autumn and winter.

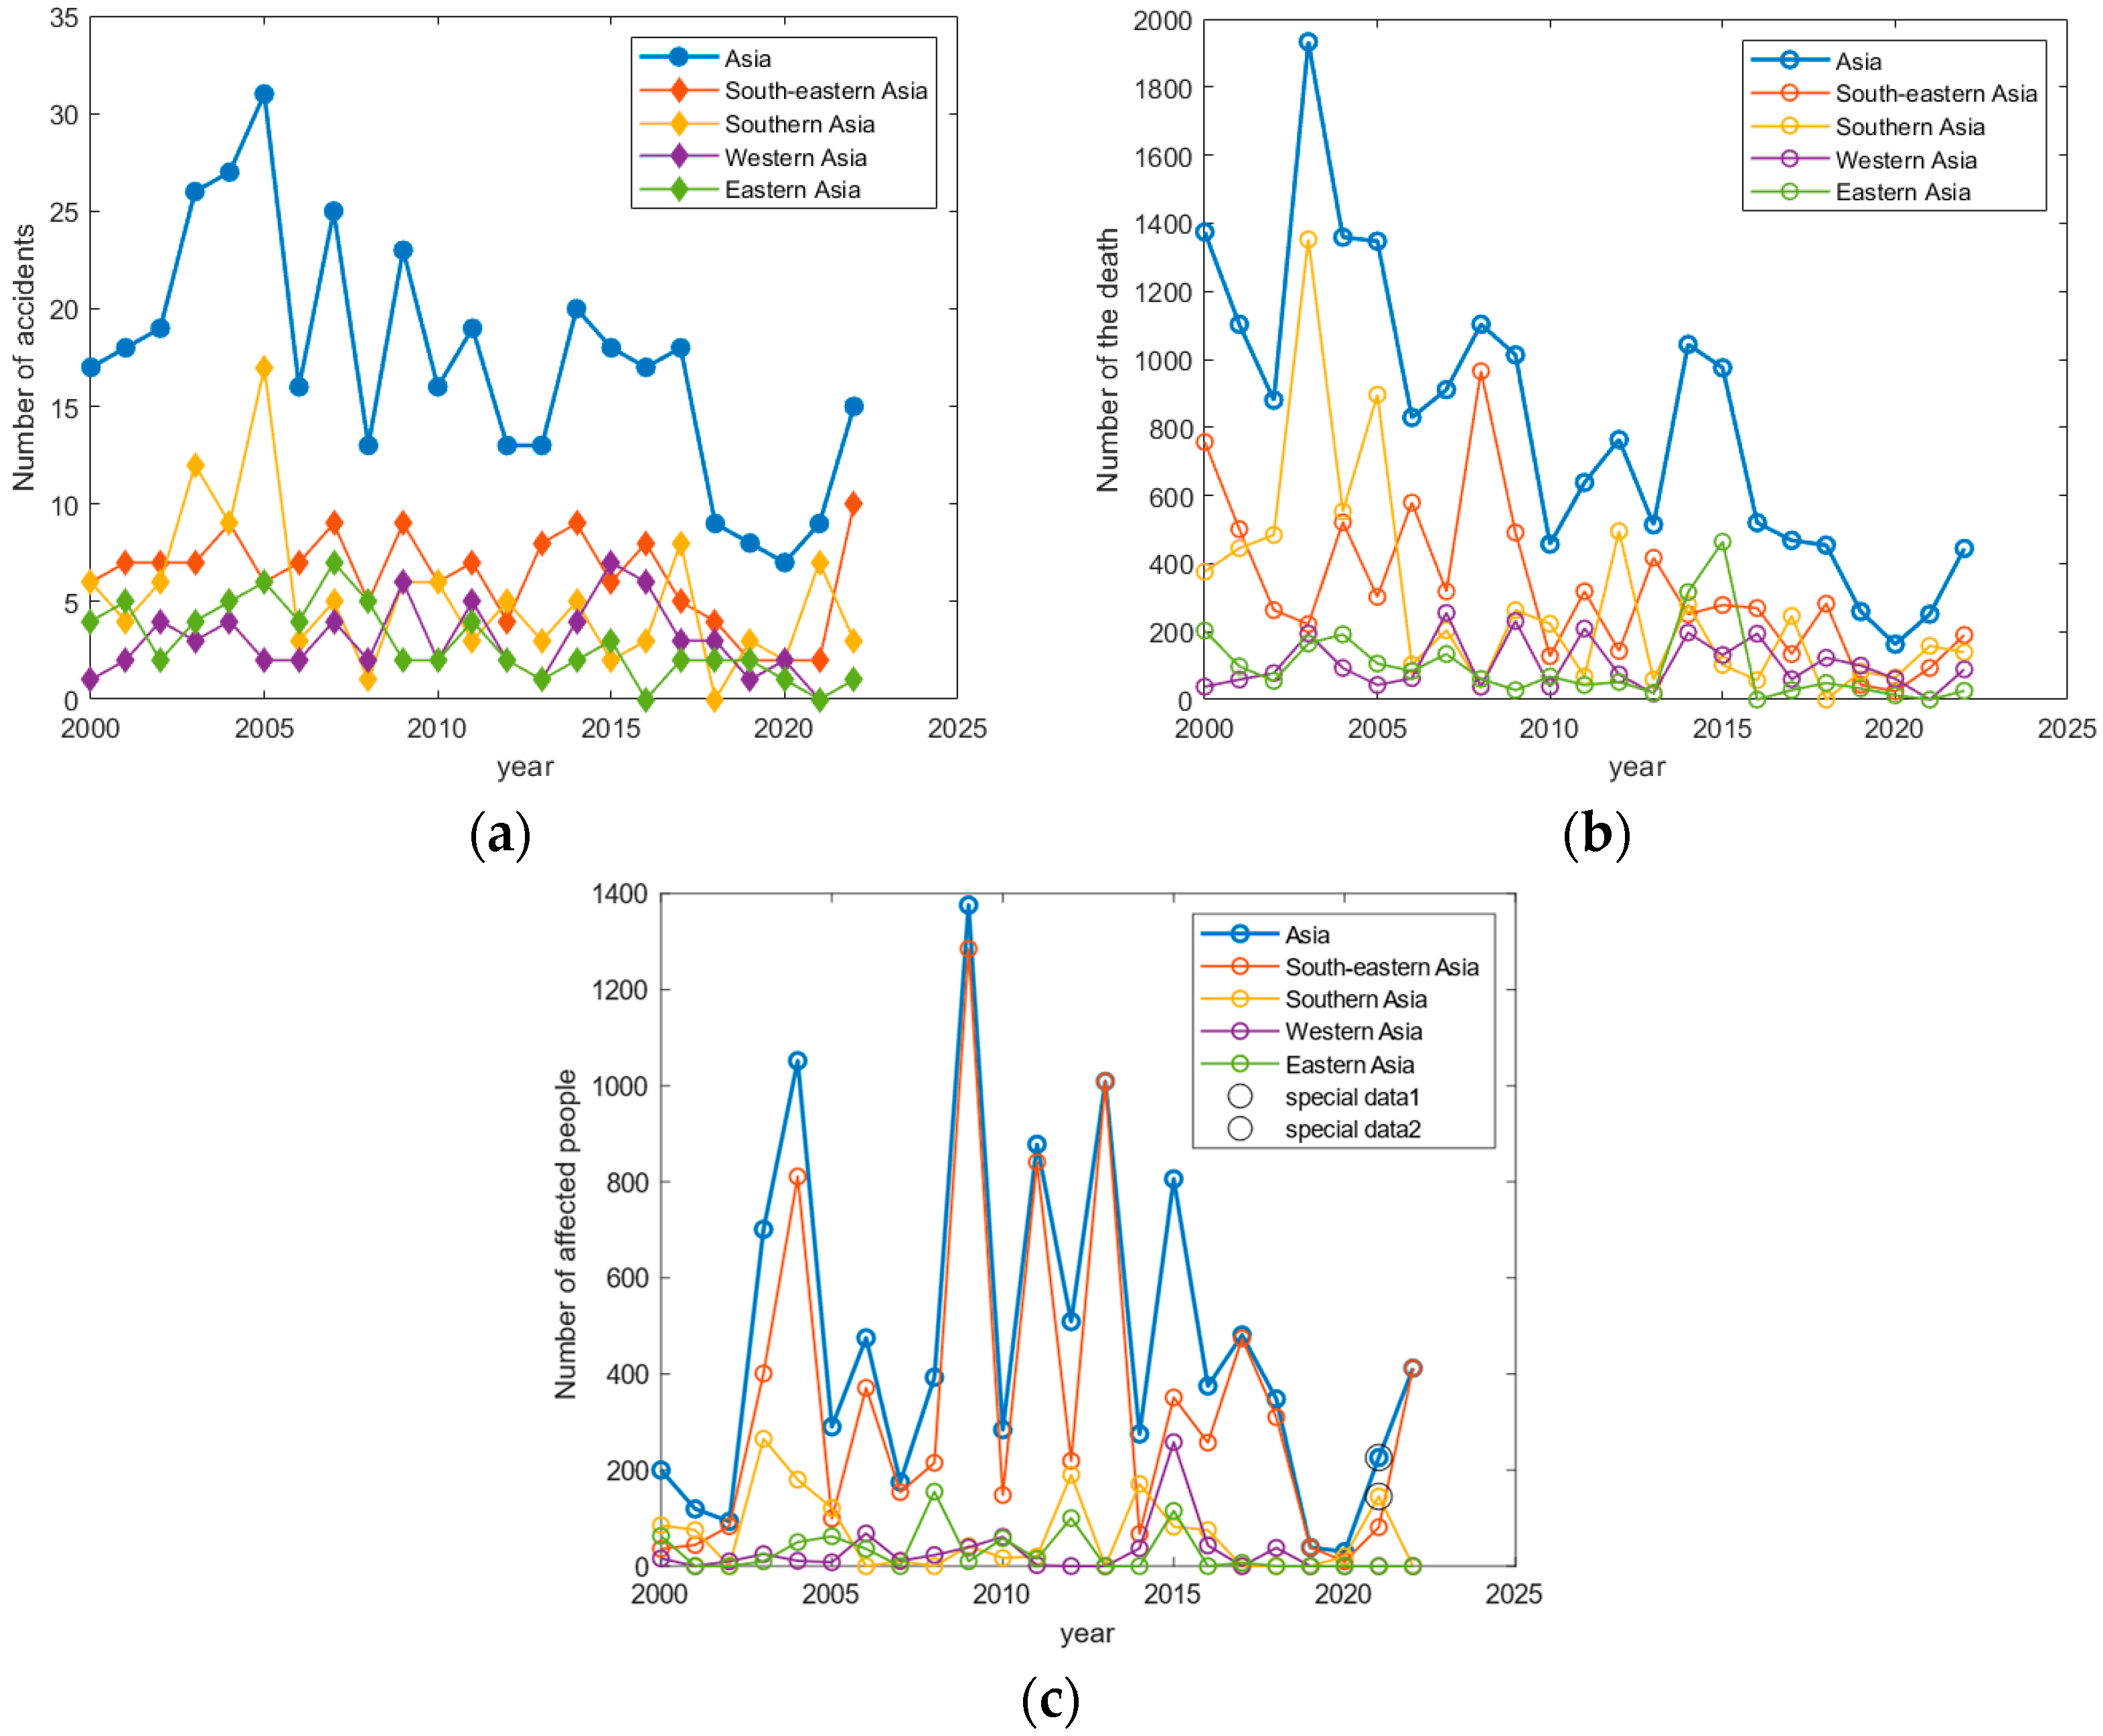
4.1.2. Yearly Distribution of Water Traffic Accidents, Deaths, and Affected Persons

In general, the temporal variation of water traffic accidents in Asia shows similar patterns with the number of deaths and affected people, i.e., an upward trend at the beginning of the 21st century, a fluctuating decline till 2020, and a minor upward trend in 2022 (as shown in Figure 3a–c). The peak values of water traffic accidents and deaths appeared in 2005 and 2003, respectively, while a maximum of affected people was observed in 2021 with an unprecedented 50,000. After inquiry, it was found that the marine environment was seriously polluted due to the fire and explosion of cargo ships in Sri Lanka [33], which may last for a decade and led to the explosive growth of affected groups. Therefore, this special case was excluded from the present study and the peak point was observed in 2009.
From a regional perspective, water traffic accidents exhibited a heightened frequency within South-eastern Asia and Southern Asia during the early years of the 21st century, as shown in Figure 3a. The accident occurrence in Asia experienced substantial fluctuations since 2007 without distinct discernible patterns for different regions. In terms of fatalities, the Southern Asia predominantly held the highest death tolls from 2000 to 2007 (as shown in Figure 3b).

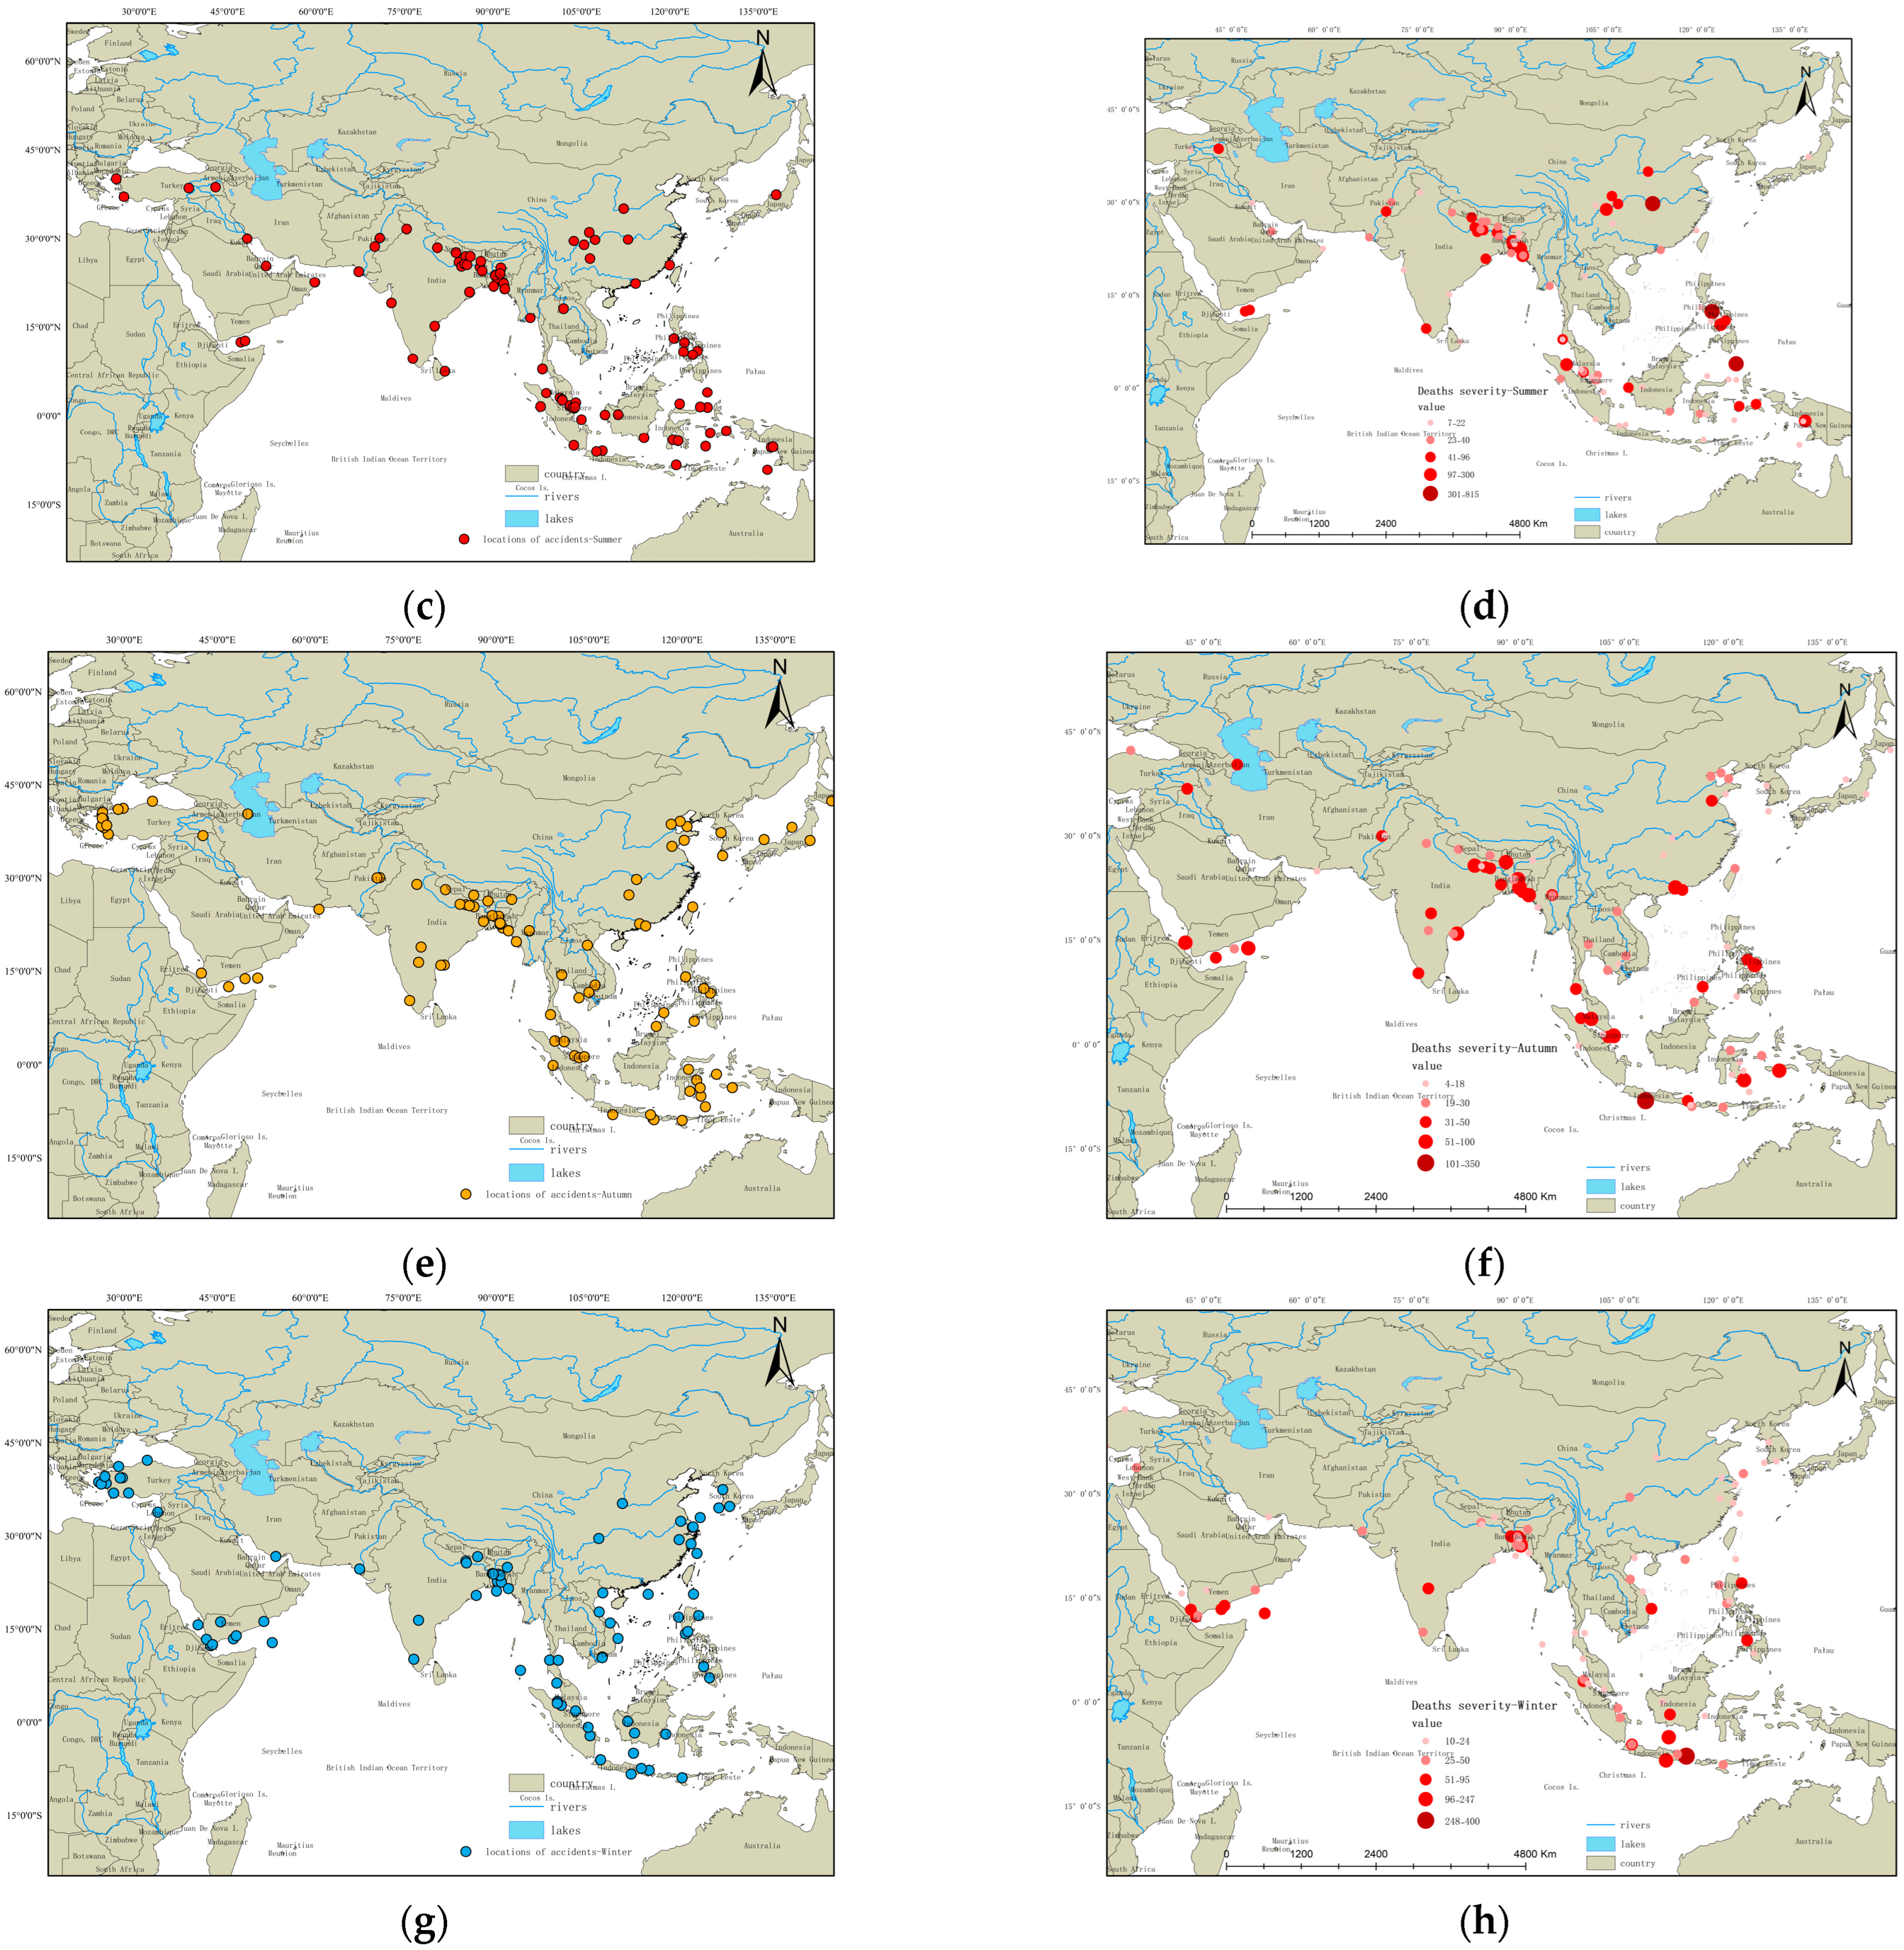
4.2. Spatial Distribution Analysis

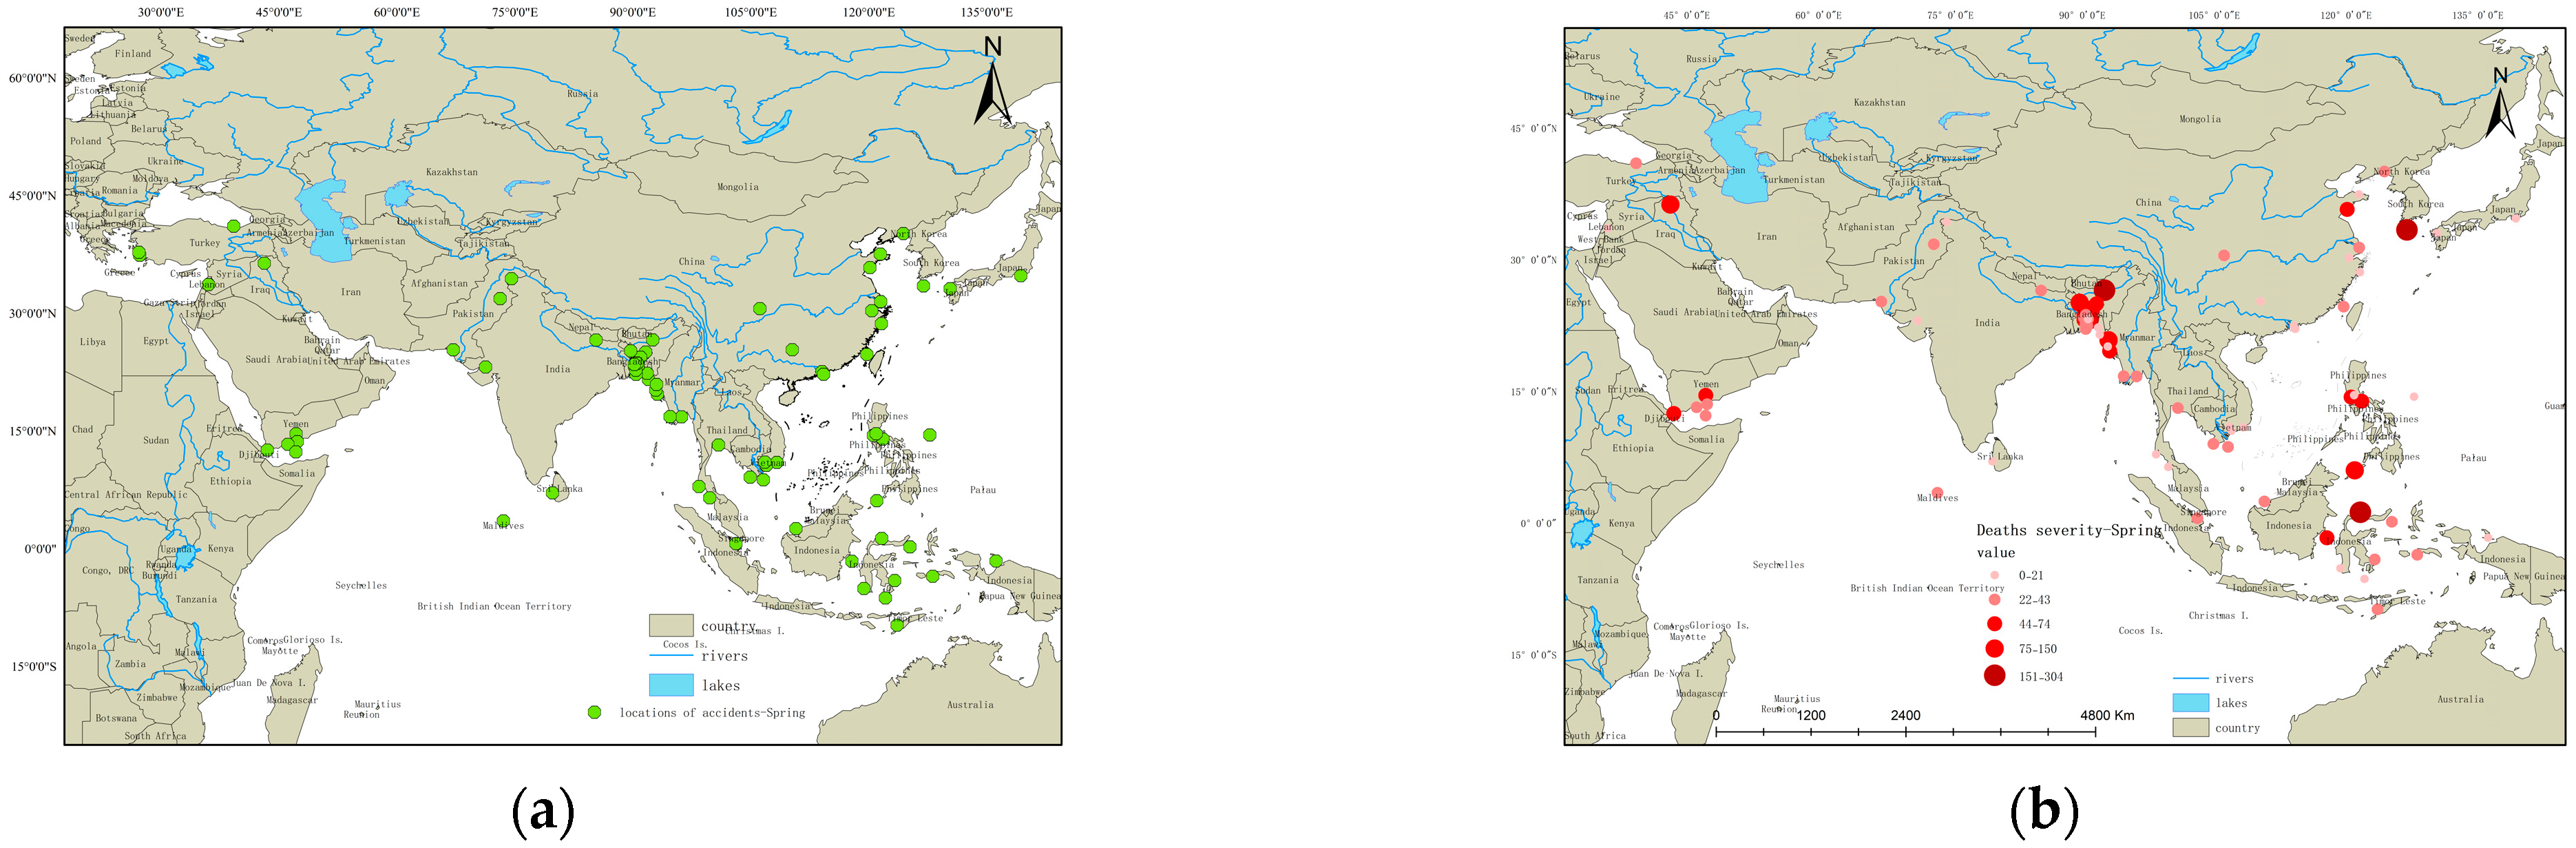
4.2.1. Spring Season

The site information of each water traffic accident was extracted from the EM-DAT database. Records were excluded if exact coordinate information was missing. The distribution diagram and heat map of water traffic accidents in spring are presented, respectively, in Figure 4a,b and Figure 5a.
Simultaneously, the database revealed a compelling correlation between accidents and the number of deaths attributed to the accidents. This correlation was visually depicted in Figure 4b, where the intensity of the marker color deepens in tandem with the rising death count. Notably, within the nexus of Southern Asia and South-eastern Asia, encompassing countries such as Myanmar, Bangladesh, and the northeastern coastal regions of India, the spring season witnessed 24 recorded accidents. Indonesia reported 16 cases, succeeded by Singapore, Malaysia, and other locales, each registering 13 incidents. The high-incident belt stretches from the central south (Bangladesh) to all directions with heat progressively tapering off, and faint upward trend in the southwest (Yemen), as shown in Figure 5a.
With regards to fatalities (as shown in Figure 4b), the majority remained at relatively lower levels. Bangladesh, the Makassar Strait, and the confluence of the Korea Strait and Tsushima Strait stood out as regions with elevated fatality counts. Most of these locations, where incidents occurred are the coastal areas and bustling port zones. Such areas would be recognized as high-frequency accident locations.
Intriguingly, among the 81 pinpointed accidents, nearly 10 took place in inland waterways; China, situated in Eastern Asia, accounted for seven of these inland incidents. This underscores the imperative of not only concentrating on coastal and open waters but also analyzing the distinct attributes of inland water traffic accidents, especially in a country like China, which actively promotes inland water transportation.

4.2.2. Summer Season

In the summer seasons, the same method of latitude and longitude positioning was applied, as illustrated in Figure 4c,d and Figure 5b. The spatial distribution of accidents in summer closely mirrored that of spring. The nexus of Southern Asia and South-eastern Asia remained the focal point of accidents, with Indonesia following closely behind. Singapore, Malaysia, and other regions also figured prominently. However, in comparison to spring, there was an increase of accidents for Indonesia, Singapore, and Malaysia, with increments of 3, 2, and 3, respectively.
The heatmap (Figure 5b) displays a relatively scattered pattern in summer, characterized by a tendency to spread and a larger presence of yellow and red areas. Concerning the fatality count, summer recorded a relatively elevated overall level. Notably, accidents with high fatality counts occurred in Eastern Asia’s inland river region in China, as well as in South-eastern Asian countries such as the Philippines, Malaysia, and East Timor. Southern Asia’s Bangladesh also witnessed a surge in accidents with substantial fatality rates. The potential causes of these phenomena require further consideration.
Combined with the findings from the spring, it is evident that the water traffic accidents and resulting casualties have increased in China. This underscores the imperative of treating inland waterway accidents with utmost seriousness, even if the navigation conditions for inland water traffic might be excellent.

4.2.3. Autumn Season

As shown in Figure 4e,f, the prevalence of accidents remained consistent between spring and summer. Once again, the Southern Asia and South-eastern Asia junction remains a focal point for accidents, tallying 24 cases. Indonesia followed closely with 13 incidents, while Turkey recorded 12 cases. Singapore, Malaysia, and Philippines all reported 11 cases each. The high mortality points of the death that occurred in southern Indonesia (e.g., Jakarta) are not reflected in the spring and summer seasons.
Notably, the hotspots (as shown in Figure 5c) shifted from the India–Bangladesh–Thailand–Cambodia–Singapore–Indonesia cluster in the spring and summer to a more diversified distribution, concentrating along the Turkey, Indonesia, and the border between India and Bangladesh. Moreover, areas with high fatality rates encompassed Indonesia, Singapore, Bangladesh, Yemen, and various other locations.
When considering inland water transportation, a notable decrease in the accident number was observed. This phenomenon is quite possibly caused by the onset of the dry season on inland rivers, leading to a reduction in the navigational capacity of rivers and a decrease in vessel traffic flow.

4.2.4. Winter Season

During the winter seasons, as shown in Figure 4g, the highest incidence of accidents was concentrated in South-eastern Asia, particularly in Singapore and Malaysia, which recorded 20 accidents in total. There were 17 records in Bangladesh and the northeastern coastline of India, i.e., at the junction of Southern Asia and South-eastern Asia. In Turkey, 11 records were reported. These regions account for approximately 55% of all winter accidents.
From the hotspot map of accident distribution (Figure 5d), it is evident that, in addition to the aforementioned areas, there was a notable increase in accidents along the eastern coastal regions of China, the coastal zones around Japan and South Korea in Eastern Asia, as well as in Yemen and Saudi Arabia in Western Asia. In addition, a high fatality rate was observed (as shown in Figure 4h) in some countries (e.g., Turkey, Yemen, Bangladesh, Singapore, and Indonesia).
Regarding the continued reduction of inland waterway accidents, this also substantiates the pertinent conclusions drawn in the preceding section (Section 4.2.3).

5. Results and Discussion

5.1. Daniel Trend Test and R/S Analysis

5.1.1. Daniel Trend Test Analysis
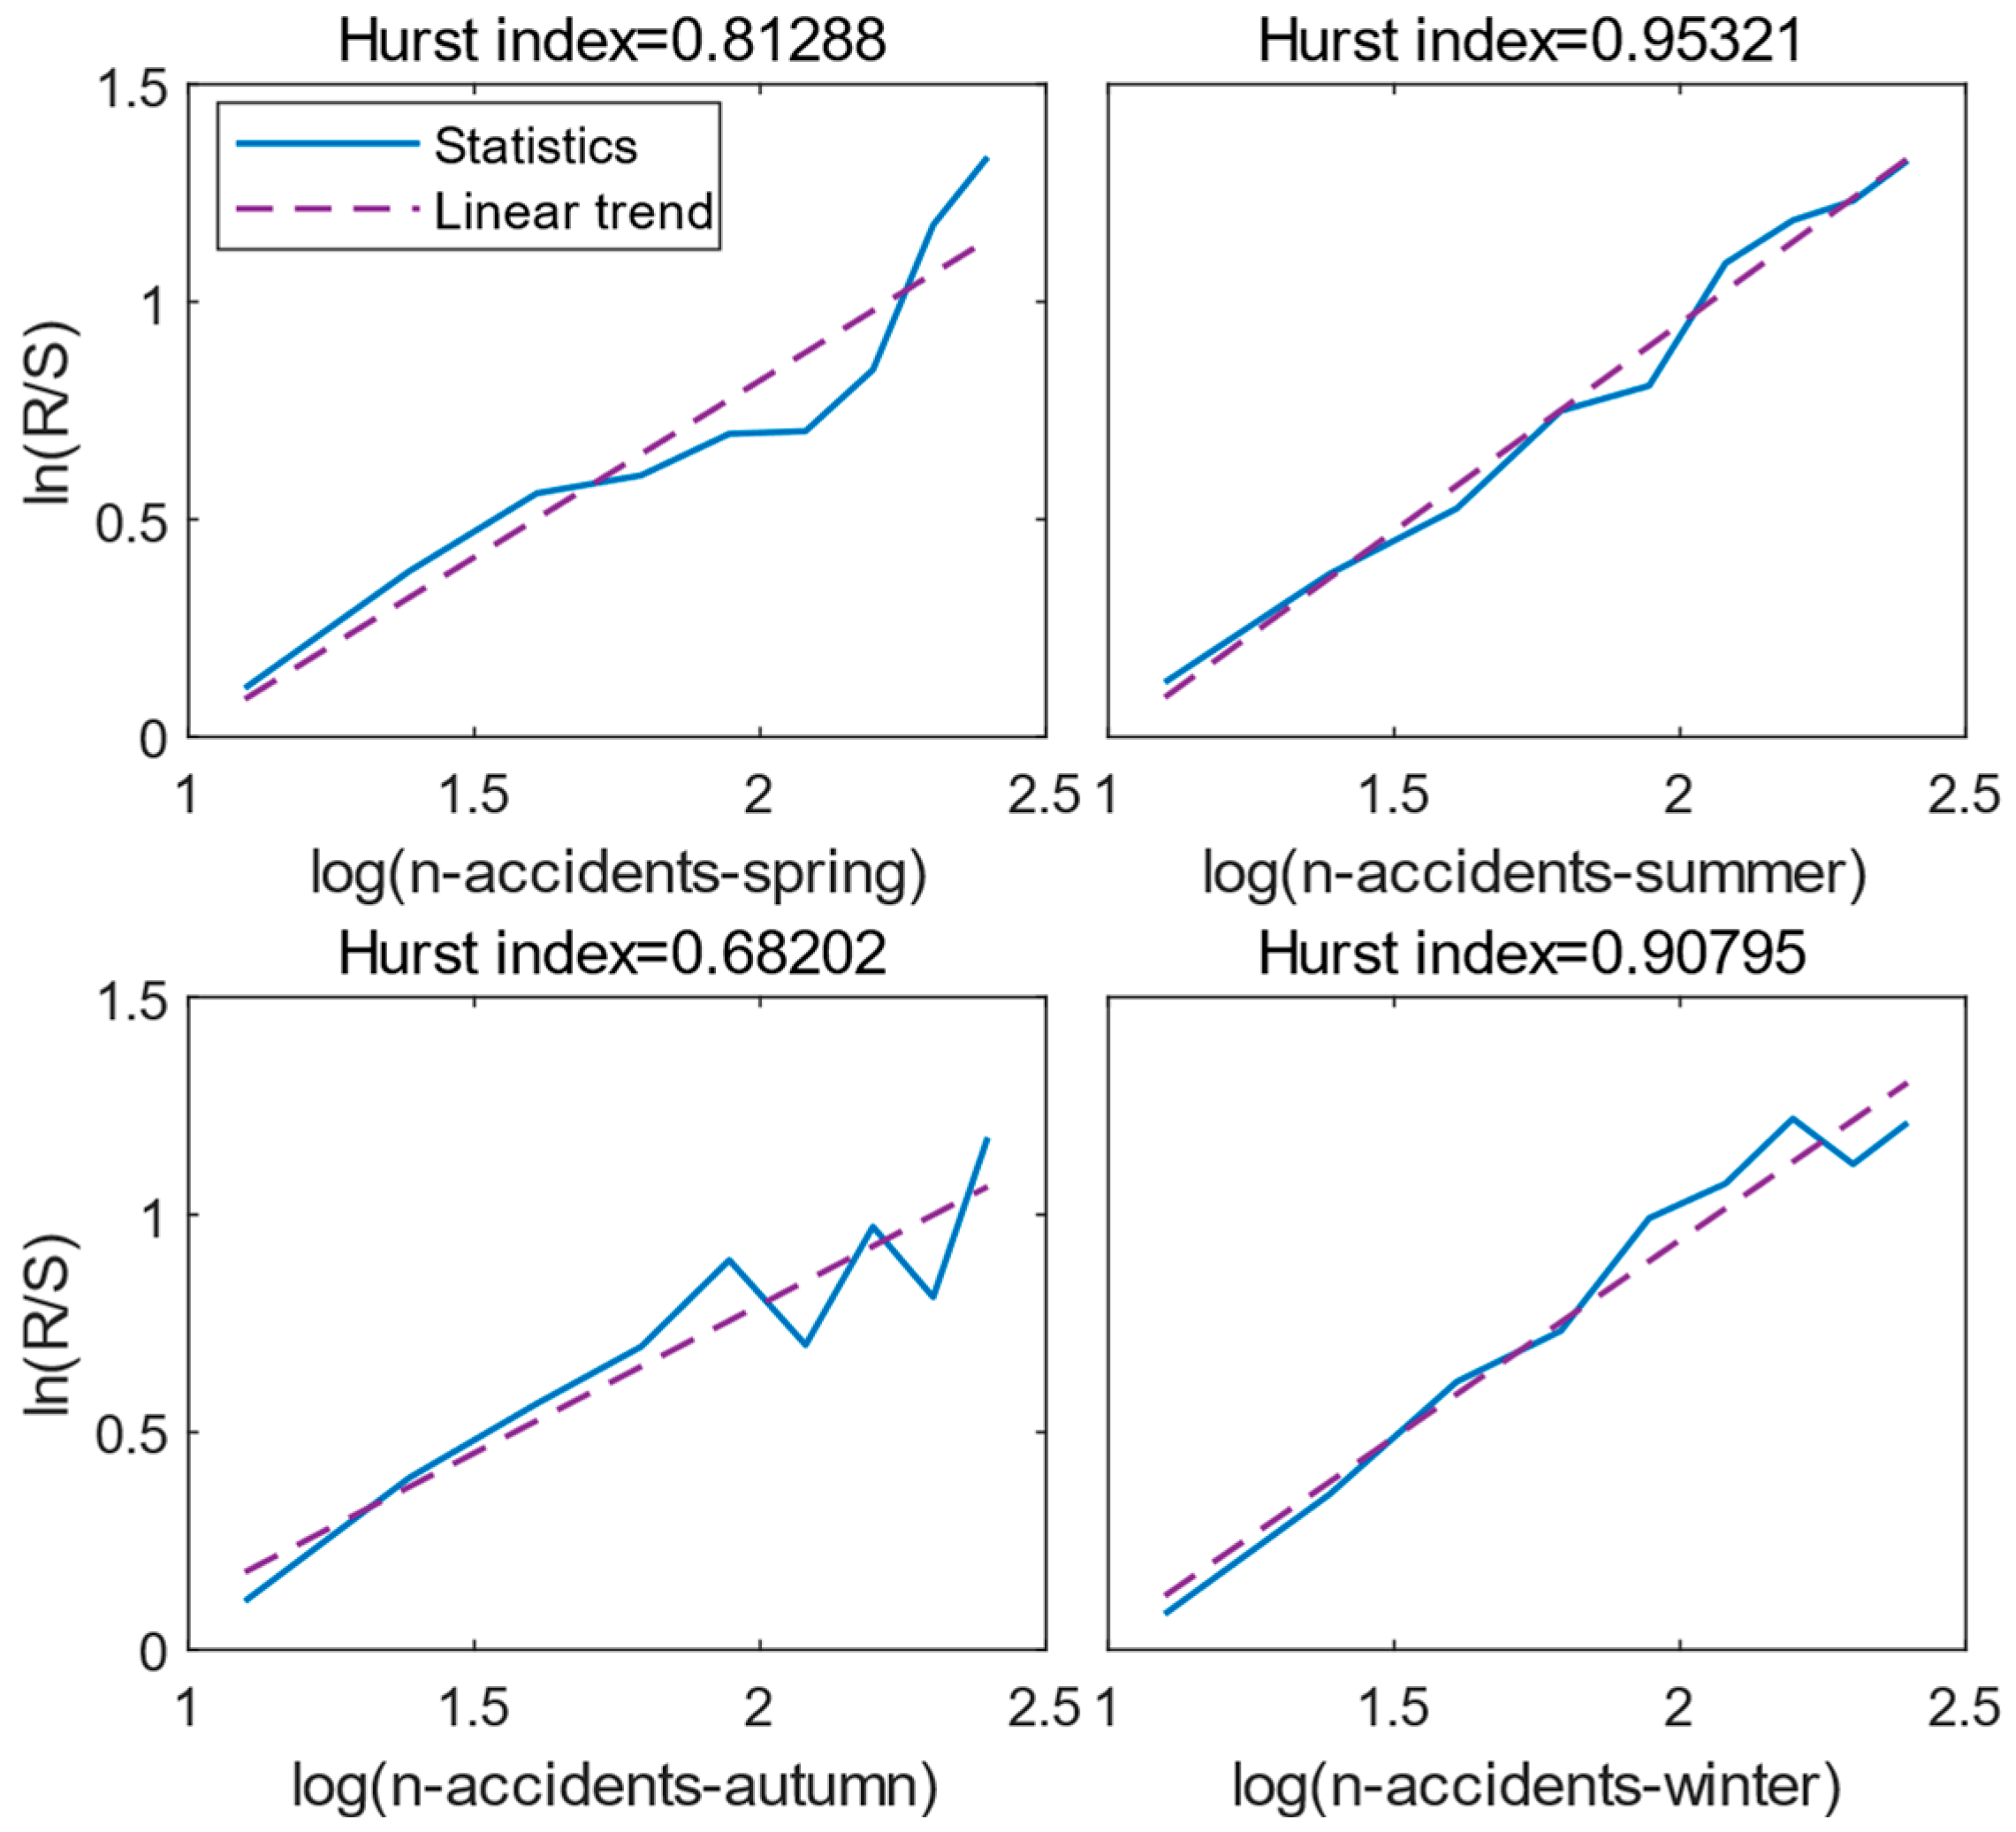
To reveal evolution trends of water traffic accidents, the time series were divided into five segments, each spanning 5, 5, 5, 5, and 3 years, respectively. The Daniel coefficients for both water traffic accidents and fatalities were thus calculated and compared with the Spearman rank test values. The magnitude of r signifies the temporal evolution trend, with a positive value indicating an increasing trend and a negative value indicating a decreasing trend [31]. When the absolute value of r surpasses the test value, it signifies a statistically significant trend, and vice versa.
As noted in Table 1, a decline in the number of water traffic accidents and fatalities was witnessed for whole of Asia, with a 95% level of significance. However, there was a noticeable upward trend in accidents during the early period of 21st century and the years following 2020. The former trend can be attributed to the aftermath of the Asian economic crisis in 1997, particularly affecting South-eastern Asia and Eastern Asia, where economic reconstruction was urgently conducted [34]. In this period, the coefficients for South-eastern Asia and Eastern Asia reached 0.850 and 0.750, respectively. The latter trend may be attributed to the global COVID-19 pandemic since 2020. In the post-pandemic era, countries have had to accelerate economic recovery and trade, leading to a substantial increase in shipping vessels and, consequently, a higher likelihood of water traffic accidents.
Generally speaking, the number of accidents in Eastern Asia, South-eastern Asia, Southern Asia, and Western Asia exhibited a declining trend, although the feature in South-eastern Asia is relatively weak. Moreover, the number of fatalities decreased significantly in all regions except Western Asia.

5.1.2. R/S Analysis

The utilization of the Hurst coefficient, similar to the Daniel coefficient, elucidates the evolution patterns of the dataset. However, the Hurst coefficient assumes a dual role; not only does it provide insights into historical trends, but also possesses predictive capabilities regarding future evolution. By computing the Hurst coefficients for variables such as the number of accidents, fatalities across different Asian regions, and the occurrences of water traffic accidents during distinct seasons, the nuanced trajectory of these crucial factors can be further demonstrated.
As shown in Table 2, the calculated Hurst values for water traffic accidents and fatality occurrences within the four regions consistently range between 0.5 and 1.0. This range underscores the enduring correlation embedded within these eight datasets. Given the persistent influence exerted by preceding data and in conjunction with the outcomes deduced from the Daniel trend analysis (2000–2022), it can be reasonably expected that the water traffic accidents and associated fatalities in Asia are poised to exhibit a subtle downward trajectory in the impending years.
To further explore the ability of this impact to persist, by taking double logarithmic value for R/S statistics and conducting linear fitting, a distinctive set of intersection points of accident frequency were obtained as 1.38, 1.60, 1.79, and 1.60, respectively, in Figure 6. The results show that the dataset of water traffic accidents will sustain its influence on the changing trend for the ensuing 4, 5, 6, and 5 years, respectively. Similarly, for fatality figures, the intersections are noted as 1.71, 1.38, 1.38, and 1.79, indicating a continuous data-driven impact on trend evolution for the subsequent 5.5, 4, 4, and 6 years, correspondingly. These calculated intervals forecast the persisting ripple effect of historical data on the future trajectory of these vital metrics.
In the context of the Hurst coefficients, it is evident that its range falls between 0.5 and 1.0 (as shown in Table 3), similar to the aforementioned Daniel coefficient. However, a notable distinction emerges where the seasonal index tends to gravitate towards 1.0. For instance, the Hurst index for summer accidents registered a substantial 0.95, underscoring a pronounced level of data correlation.
After being subjected to linear regression analysis (Figure 7), the intersection points for four seasons are derived as 1.65, 1.38, 1.30, and 1.40, respectively. This delineates a noteworthy insight that the data will sustain its influence on seasonal trends over successive timeframes of the next 5, 4, 3.5, and 4 years, respectively.

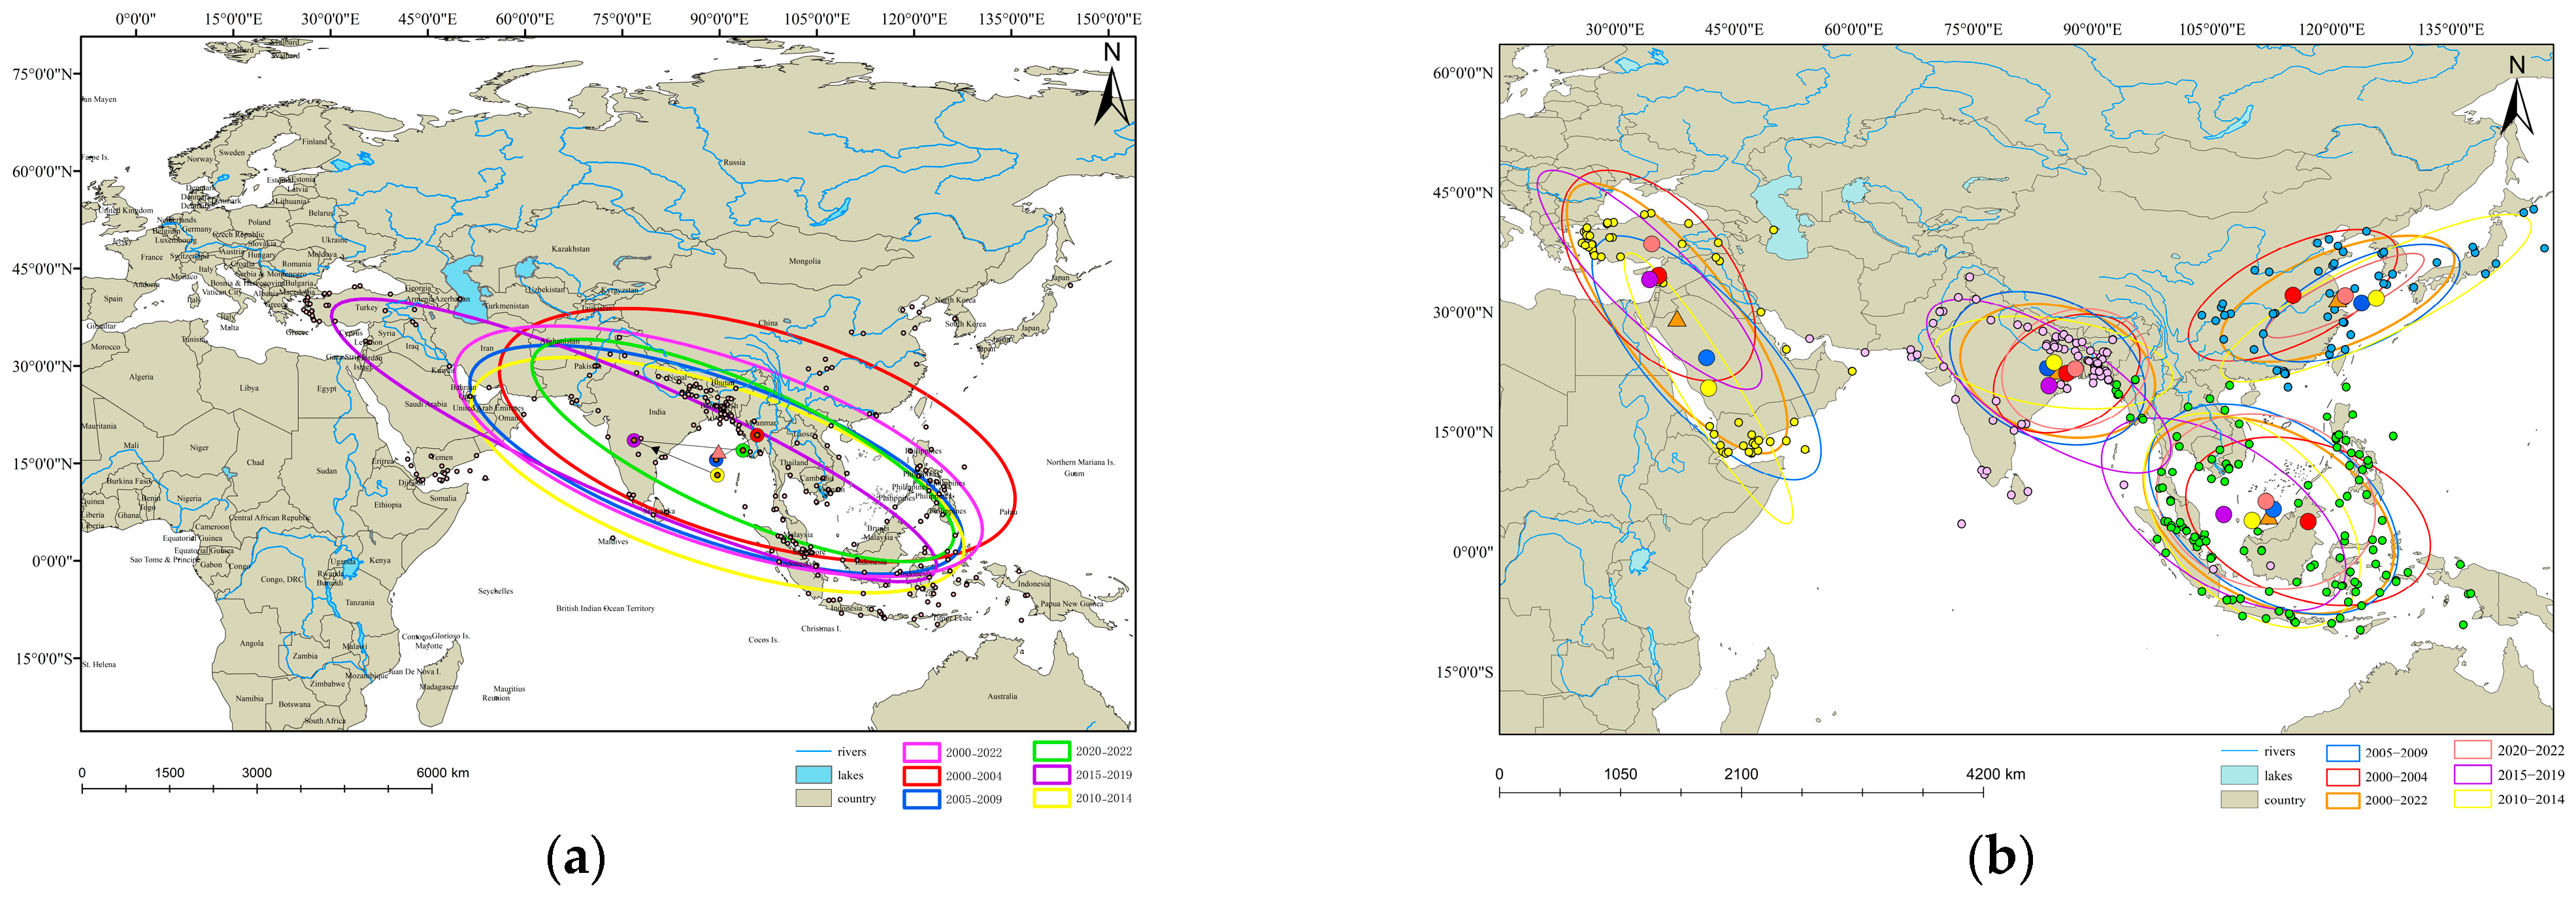
5.2. Evolution Features of Standard Deviation Ellipse and Gravity Center

The spatial distribution of water traffic accidents was explored in terms of gravity center and the standard deviation ellipse of accident frequencies for Asian and its sub-regions. A comprehensive analysis of the Asia area is presented in Figure 8a, while detailed results are provided for the sub-regions in Figure 8b. The specific coordinates of gravity centers and axes lengths of the standard deviation ellipses are tabulated in Table 4 and Table 5.
Over the whole research period of 2000–2022, the center of gravity for water traffic accidents was situated at (89.835° E, 16.862° N). The center of gravity was initially positioned in Myanmar from 2000 to 2004, shifted southwest to the Bay of Bengal waters from 2005 to 2009, continued southward while remaining within the Bay of Bengal from 2010 to 2014, then shifted northwest to regions near India from 2015 to 2019. Subsequently, it migrated southeast and settled on the boundary of Myanmar and the Bay of Bengal. This migration represents the furthest movement among the four shifts in these five periods.
From the perspective of gravity center distribution, the locations of the gravity center differ for five time periods, four of which were located in or near South-eastern Asia. Only the center of gravity for 2015–2019 was positioned in Southern Asia, India. This is attributed to the dense vessel traffic flow through the navigable straits in South-eastern Asia, coupled with the substantial volume of ships, which increases the likelihood of accidents. Additionally, countries such as Bangladesh in Southern Asia and Vietnam in South-eastern Asia have numerous ports (e.g., seventeen in Vietnam, seven in Bangladesh) and rely heavily on exports (export to China, Malaysia, etc.) for their economic development. This leads to a surge in vessel traffic flow through the Straits of Malacca and the South China Sea, potentially resulting in water traffic accidents.
Figure 8b provides a visual representation of the standard deviation ellipses and center of gravity analyses for water traffic accidents across Asia. It was found that accidents frequently occurred (i.e., concentration of gravity centers) in Malaysia and Singapore in South-eastern Asia, the Bay of Bengal in Southern Asia, the western periphery of Turkey in Western Asia, and the southeast region of China in Eastern Asia. The phenomenon of high-frequency water traffic accidents might be attributed the Straits of Malacca, Bay of Bengal region, Mediterranean Economic Belt, and China’s Golden Waterway where the shipping industry is well developed. It needs to be emphasized that the Strait of Malacca is a crucial international trade route shared by all countries [35], thus carries a large amount of maritime vessel traffic flow [36]. To ensure navigation safety in this area, maritime supervision efficiency remain focal points of ongoing research [11].

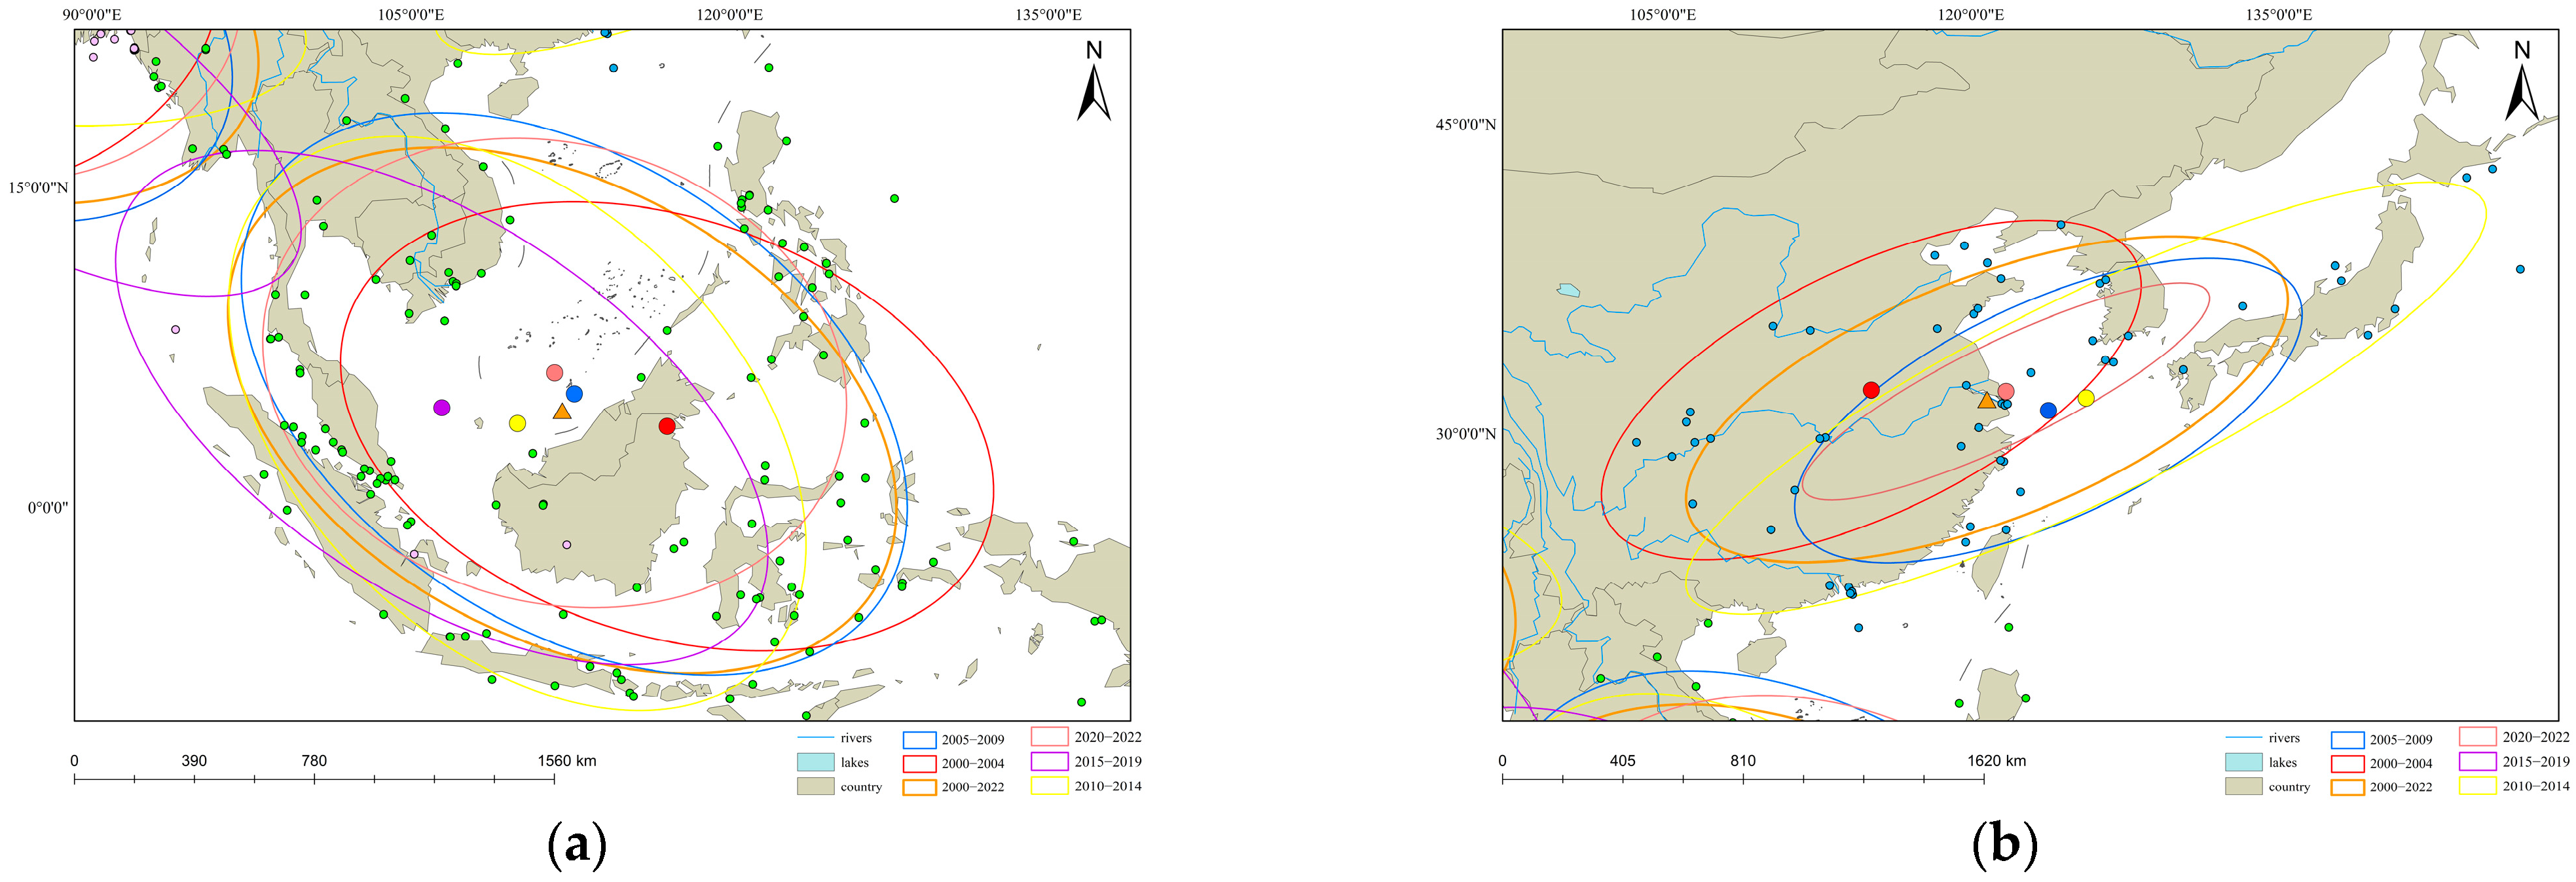
5.2.1. South-Eastern Asia

Between 2000 and 2022, the center of gravity for water traffic accidents in South-eastern Asia resided at (112.121° E, 4.523° N), i.e., the juncture of James Shoal and Malaysia (East). In the initial period of 2000 to 2004, the center of gravity was situated in northern Indonesia near Brunei. It shifted northwest to the James Shoal–Malaysia (East)–Brunei junction during 2005 to 2009. From 2010 to 2014, it migrated southwest to the western waters of Malaysia (East). It moved northwest again to the junction connecting Malaysia (West), Vietnam, and the South China Sea. In the most recent three years, the center of gravity shifted northeastward, nearing the border between James Shoal and the Nansha Islands. Over the entire period, it is evident that the center of gravity in South-eastern Asia consistently hovered around the South China Sea and Malaysia, except the early years (2000–2004) when it was situated in Indonesia as shown in Figure 9a.
Following the standard deviation ellipses analysis within the South-eastern Asia, it was found that the disparities between the long and short axes consistently remained within 10 km during different time periods, which suggests a relatively concentrated data distribution feature. In combination with the center of gravity patterns, it is concluded that the focal area of water traffic accidents in South-eastern Asia is located in the South China Sea because of its important role for the Asian Maritime Silk Road. South-eastern Asia historically constituted the primary trade hinterland of the early Maritime Silk Road [37]. The Maritime Silk Road has built close ties between China and Asian countries, and has promoted all-round cooperation. As an important part of the global shipping routes, thousands of ships pass through this area every day, thereby resulting in a higher risk of water traffic accidents.

5.2.2. Eastern Asia

The water traffic accident data of 2015–2019 were insufficient for center of gravity and standard deviation ellipse analysis, thus the dataset was neglected in the present study.
Over the time period of 2000 to 2022, the center of gravity consistently resided in Suzhou, China, a city situated along the Grand Canal route. The Grand Canal is the earliest and longest artificial waterway in the world, and has played a great role in the economic and cultural development and exchanges between the north and south regions of China. In the time period of 2000 to 2004, and the most recent three years, the centers of gravity were located in the vicinity of the Yangtze River estuary. Conversely, during 2005–2009 and 2010–2014, the centers of gravity were situated in the East China Sea. The evolution features of gravity centers in different periods are correlated with the development strategy of shipping industry in China. China holds a prominent role as the leading nation in the Eastern Asian Maritime Silk Road [38].
Furthermore, results from the standard deviation ellipse analysis consistently exhibited a predominant northeast–southwest directional distribution, with weaker data intensity distributed in the northwest–southeast direction, as shown in Figure 9b.
This phenomenon may be affected by the lengths of coastline in Eastern Asia. The coastline of the Eastern Asia is concentrated around China, Japan, and South Korea, who own approximately 32,000 km (ranked 6th in the world), 29,000 km (ranked 7th in the world,) and 2413 km (ranked 52nd in the world), respectively. The presence of extensive coastlines facilitates the establishment of deep-water ports, allowing for the optimal utilization of coastal advantages for the development of maritime transportation. Additionally, these three nations are major importers and exporters in Asia. Consequently, the number of vessels traversing these coastlines has experienced a notable increase, leading to a higher risk of water transport safety incidents. The analysis also confirmed that a significant portion of these accidents tend to occur at the junctions of these three countries as shown in Figure 4a,e,g.
Throughout the entire research period, the center of gravity was positioned within the inland regions of China. This phenomenon might be attributed to developed inland shipping infrastructures in China, e.g., the Golden waterway of the Yangtze River and the Grand Canal. Simultaneously, the Chinese government has consistently supported the digital development of inland waterway shipping [39]. It is worth noting that inland water traffic accidents might happen occasionally with substantial casualties, such as the sinking accident of the Eastern Star in 2015. This incident underscores the gravity center of water traffic accidents in this specific period.

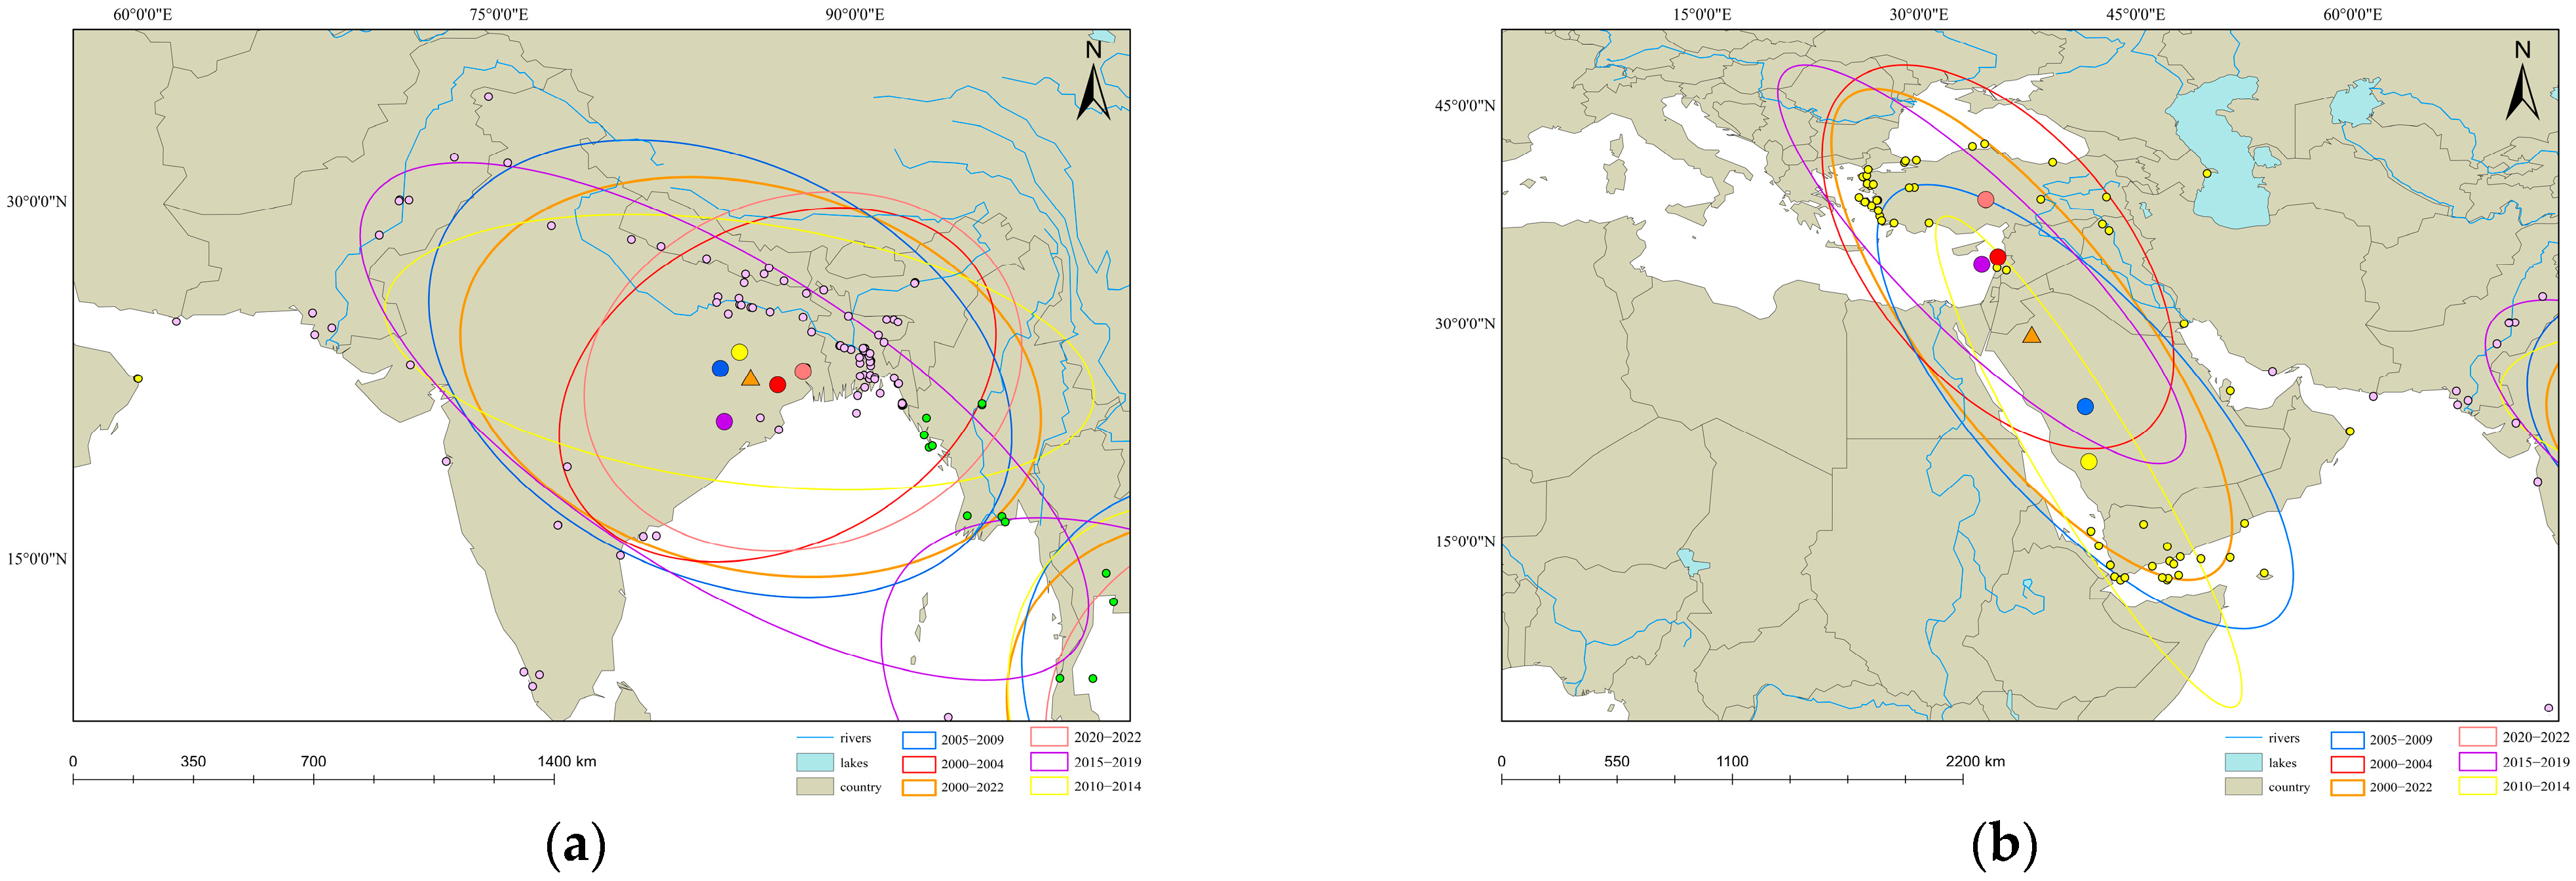
5.2.3. Southern Asia

The gravity centers in Southern Asia consistently clustered in the eastern region of India, near the Bay of Bengal, as shown in Figure 10a. India and Bangladesh emerged as the primary nations where accidents occurred with high frequency. A notable observation is that the majority of accidents were concentrated in the inland waterways and coastal regions of Bangladesh. In India, the capacity transfer of road and railway transportation to inland waterway transportation has encountered numerous challenges, resulting in suboptimal waterway management and high frequency occurrence of water accidents [40]. Meanwhile, the coastal areas of Bangladesh are prone to natural disasters such as storm surges and hurricanes, which increase accident rates and exert significant impacts on the maritime transportation safety [41].
A clear directional distribution pattern of the standard deviation ellipse was observed in South-eastern Asia, Eastern Asia, and Western Asia for different time periods. However, in Southern Asia, there were notable variations in the standard deviation ellipse during different periods. In the time period of 2000 to 2004 and in 2020 to 2022, the data display a northeast–southwest distribution, with minimal disparities between the long and short axes, indicating relatively concentrated data. In the time periods of 2005 to 2009 and 2015 to 2019, a northwest–southeast distribution pattern was observed. The former is characterized by data concentration, while the latter is distributed in a distinct direction and features a significant difference between the long and short axes, extending up to 11 km. The data distribution during 2010–2014 appears primarily horizontal, with a slight rotation toward the northwest–southeast direction.
Interestingly, the gravity center and the ellipse axes of the 2000–2004 period closely resemble those of 2020–2022, as shown in Figure 10a. In these instances, the center of gravity (with a mere 1-degree difference in longitude) and the standard deviation ellipse (featuring only a 0.6-km difference in the short axis) nearly overlap. This suggests that water traffic accidents in this area may follow a periodic pattern. Further data analysis is required to validate this preliminary conclusion.

5.2.4. Western Asia

In the context of gravity center distribution, from 2000 to 2022, the focal point for water traffic accidents in Western Asia consistently gravitated towards the northwest of Saudi Arabia, in proximity to Jordan, as shown in Figure 10b. During 2000 to 2004, the gravity center was situated in Syria along the Mediterranean region. Subsequently, this point shifted southeast to the central part of Saudi Arabia from 2005 to 2009, and continued its journey southwards to the southern region of Saudi Arabia near the Red Sea. Later, the center of gravity shifted significantly northward to an area positioned between the middle of Lebanon and Cyprus in the Mediterranean Sea from 2015 to 2019, marking the most extensive migration distance. Finally, in the most recent three years, the center of gravity has settled in Central Turkey.
An intriguing observation emerges from the gravity center distribution analysis. In all five time periods, the gravity centers consistently aligned along a northwest–southeast axis. This alignment is also clear when examining the standard deviation ellipses. This suggests that water traffic accidents in Western Asia are concentrated along this trajectory, corresponding to the interconnectedness of Turkey, Saudi Arabia, and Yemen at the national level [30]. The rationale behind this phenomenon may be attributed to the Mediterranean Sea facilitating exports for countries like Turkey and Lebanon, while the Red Sea, Gulf of Aden and Arabian Gulf have become vital maritime regions for the export trade of Saudi Arabia, Yemen, and Oman.

5.3. Discussion

The international shipping industry contributes more than 80% of world trade volume. It is imperative to reveal spatiotemporal characteristics of water traffic accidents, thereby more appropriate and effective countermeasures could be proposed to ensure navigational safety. The EM-DAT database has provided a systematic data source for thorough analysis of water traffic accidents worldwide. Both spatial statistical analysis and time series analysis methods were introduced to investigate the features of water traffic accidents in Asia since the 21st century.
The evolution features and intrinsic correlation of water traffic accidents were investigated through time series analysis (i.e., Daniel trend test and R/S analysis). The present study indicates that most of the water traffic accidents occurred in September, October, and December, i.e., in autumn and winter. This might be attributed to the harsh wave conditions and wind speed [42]. An increasing trend has been observed since 2020 (as shown in Figure 3). The calculated Hurst values of water traffic accidents and fatalities fall in a range of 0.5 to 1.0 (as presented in Figure 6 and Figure 7). It is expected that the water traffic accidents and associated fatalities in Asia will show a decreasing trend over the coming years, which agree with the conclusions drawn by Zhou et al. [43].
Following the spatial statistical analysis by gravity centers and standard deviation ellipses, water traffic accidents showed evident spatial variation features during different stages. Water traffic accidents frequently occurred in the South-eastern Asia and Southern Asia (as shown in Figure 4 and Figure 5). This is closely related to the advanced shipping industry of countries within these regions (e.g., Singapore, Malaysia, etc.) and busy shipping routes (e.g., North Pacific shipping line and the Strait of Malacca). The results are consistent with the published literature [43]. With the gradual improvement of inland waterway conditions, China’s inland waterway shipping has developed rapidly. The inland river freight volume exceeded 4.4 billion tons in 2022, with an increase rate of 5.1%. The dense vessel traffic flow and trend of larger ships has resulted in a challenging task for the maritime administration of inland shipping. Local extreme weather conditions may cause water traffic accidents, leading to tragic consequences (e.g., The Eastern Star accident in June 2015 [44]). In addition to the primary cause of human error [14], more effort needs be paid to identify key environmental risk factors and evaluate their impacts on water traffic safety [43].
The present study fills the gap in the analysis of characteristics of water transport accidents in Asia, and the current results are of great significance for improving maritime safety services and risk management of shipping companies. It is worth noting that strict criteria have been applied for disaster data inclusion in the EM-DAT database. More sufficient data are thus required to conduct a comprehensive study of risk causes and emergency response strategy in water traffic accidents. Other databases (e.g., IMO, Lloyd’s List Intelligence, etc.) can provide a good supplement for relevant research. Some interesting results of accident association rules in Artic waters [22], environmental risk factors [43], and regional frequency density [30] have been reported. The incorporation of knowledge graph theories [8] and ergonomics in further studies may provide valuable insights into the underlying mechanisms of water traffic accidents.

6. Conclusions

In the present study, the EM-DAT database was utilized to perform characteristics analysis of water traffic accidents in Asia since the 21st century. Some preliminary conclusions are drawn as follows:
  • Both South-eastern Asia and Southern Asia were identified as high incidence areas of water traffic accidents. Most of the accidents occur in September, October, and December, i.e., in autumn and winter. Overall, the occurrence frequency of water traffic accidents in Asia shows a feature of an upward trend at the beginning of the 21st century, a fluctuating decline till 2020 and a minor increasing trend in 2022.
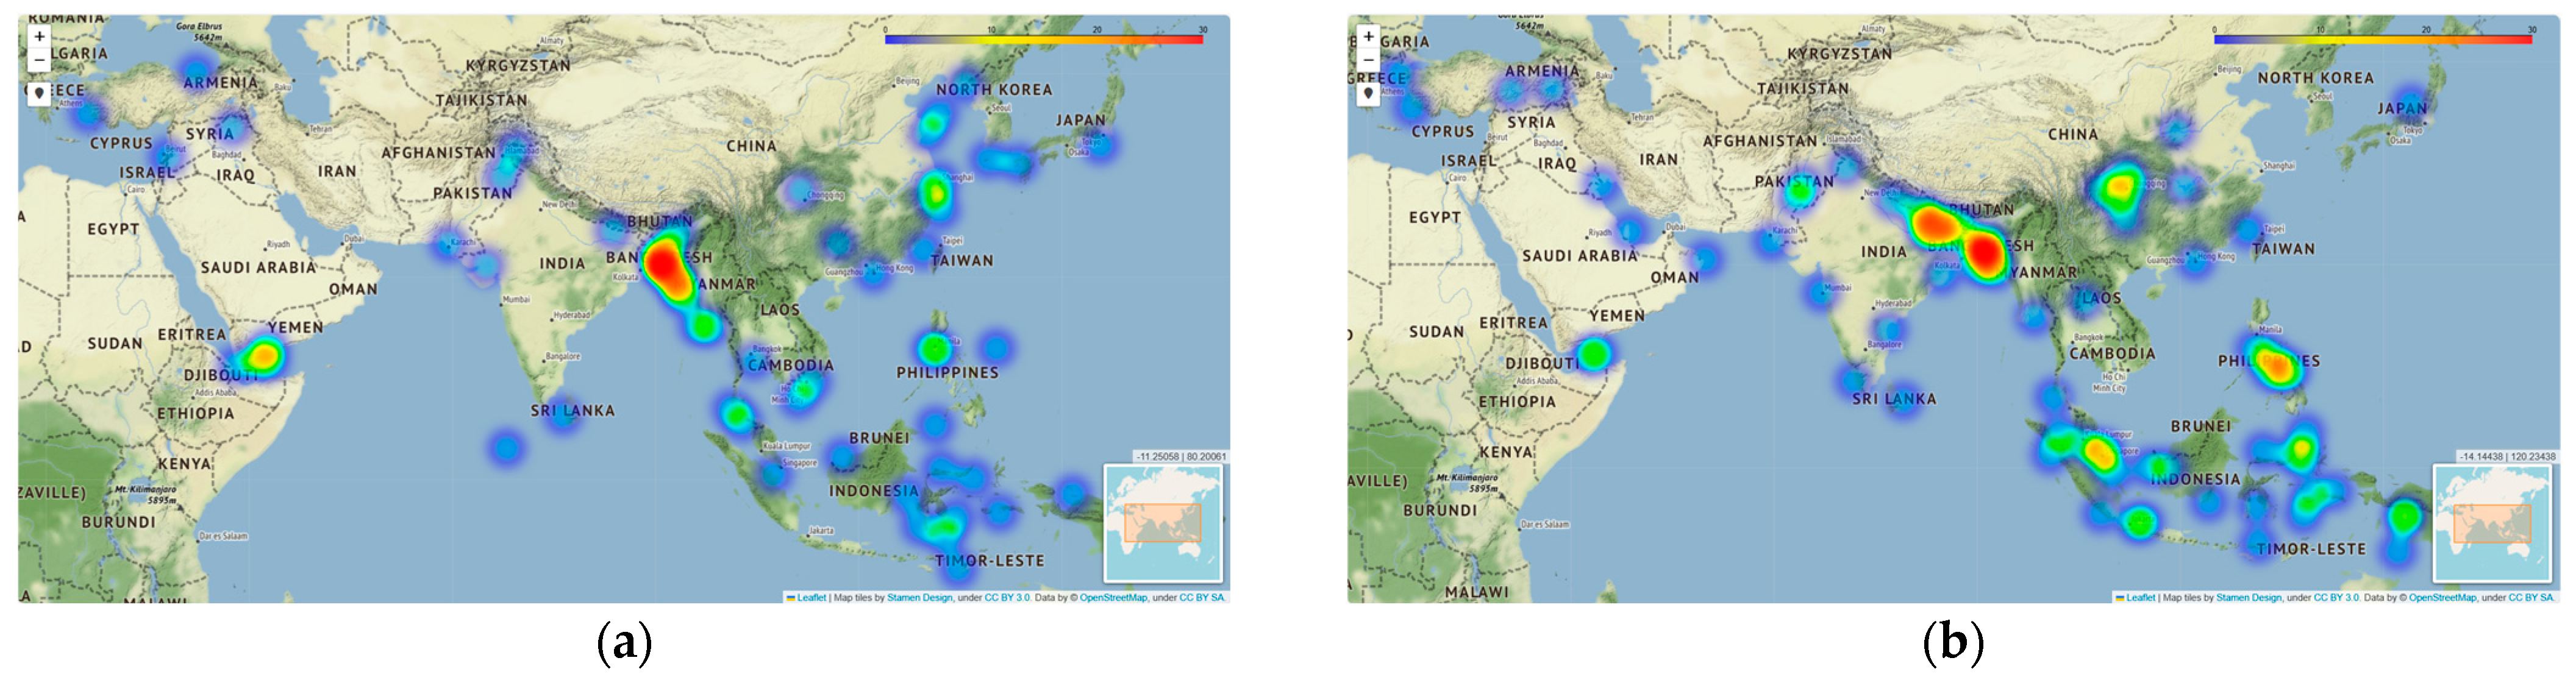
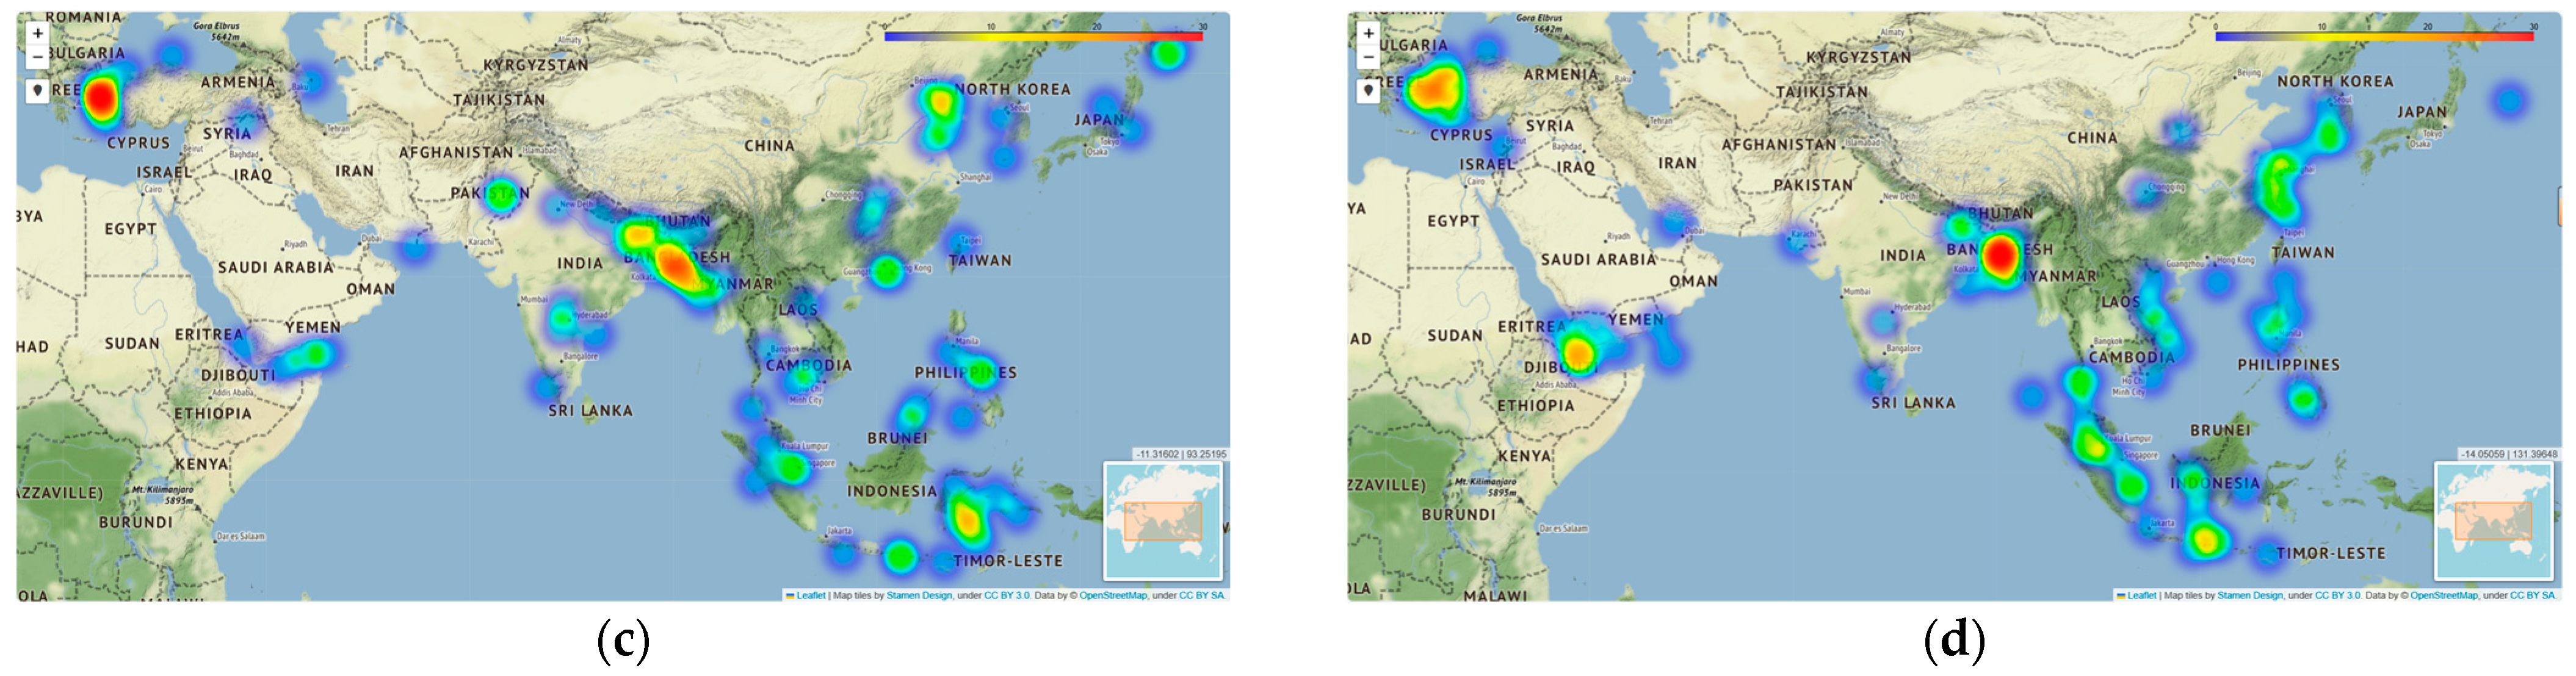
  • Heat maps and scatter diagrams were presented to demonstrate the distribution patterns of water traffic accidents in different sub-regions. The regional and seasonal evolution trends are anticipated to persist for 4~6 years and 3~5 years, respectively, based on the Daniel trend analysis and Hurst coefficients calculations.
  • The spatial analysis of water traffic accident data demonstrates that the gravity center of Asia is located at the junction between India and Bangladesh. The evolution features of different sub-regions were presented and analyzed. The geographical conditions, industrial planning, and development strategies of Asian countries might have an impact on the distribution and evolution characteristics of water traffic accidents. The potential causes of accidents were also briefly discussed for different sub-regions.
The scope of the present study was confined to a detailed analysis of water traffic accidents in Asia since the 21st century. The results provide a guidance of improving vessel traffic services and disaster prevention. Due to the nature of the EM-DAT database, the potential causes and underlying mechanisms of water traffic accidents were not thoroughly investigated which would be the topic of future studies.

Author Contributions

Conceptualization, Z.P. and Z.J.; methodology, Z.P., X.C. and J.Y.; software, Z.P., X.C. and J.Y.; validation, Z.J.; investigation Z.P. and J.Y.; resources, X.C. and J.Y.; writing—original draft preparation Z.P. and Z.J.; writing—review and editing, Z.J.; visualization, Z.P. and X.C.; supervision, Z.J. All authors have read and agreed to the published version of the manuscript.

Funding

The present study was financially supported by the National Natural Science Foundation of China, Grant Number 52071250 and 51709220.

Institutional Review Board Statement

Not applicable.

Informed Consent Statement

Not applicable.

Data Availability Statement

Access to the data will be considered upon request.

Acknowledgments

We would like to thank the EM-DAT database for the data provided.

Conflicts of Interest

The authors declare no conflict of interest.

References

  1. Tolliver, D.; Lu, P.; Benson, D. Comparing rail fuel efficiency with truck and waterway. Transp. Res. Part Transp. Environ. 2013, 24, 69–75. [Google Scholar] [CrossRef]
  2. Caris, A.; Limbourg, S.; Macharis, C.; Van Lier, T.; Cools, M. Integration of inland waterway transport in the intermodal supply chain: A taxonomy of research challenges. J. Transp. Geogr. 2014, 41, 126–136. [Google Scholar] [CrossRef]
  3. Dávid, A.; Madudová, E. The Danube river and its importance on the Danube countries in cargo transport. Transp. Res. Procedia 2019, 40, 1010–1016. [Google Scholar] [CrossRef]
  4. Ministry of Transport of the People’s Republic of China. Notice of the Ministry of Transport on the Issuance of the Outline for the Development of Inland Waterway; Ministry of Transport of the People’s Republic of China: Beijing, China, 2020. Available online: https://www.gov.cn/zhengce/zhengceku/2020-06/04/content_5517185.htm (accessed on 19 October 2023).
  5. Ministry of Ports, Shipping and Waterways Government of India. Maritime India Vision 2030; Ministry of Ports, Shipping and Waterways Government of India: New Delhi, India, 2021. Available online: https://sagarmala.gov.in/sites/default/files/MIV%202030%20Report.pdf (accessed on 19 October 2023).
  6. International Maritime Organization. 30 Years at IMO HQ; International Maritime Organization: London, UK, 2023. Available online: https://wwwcdn.imo.org/localresources/en/About/HistoryOfIMO/Documents/30%20years%20at%20IMO%20HQ.pdf (accessed on 19 October 2023).
  7. Bačkalov, I.; Vidić, M.; Rudaković, S. Lessons learned from accidents on some major European inland waterways. Ocean Eng. 2023, 273, 113918. [Google Scholar] [CrossRef]
  8. Cao, Y.; Wang, X.; Yang, Z.; Wang, J.; Wang, H.; Liu, Z. Research in marine accidents: A bibliometric analysis, systematic review and future directions. Ocean Eng. 2023, 284, 115048. [Google Scholar] [CrossRef]
  9. Huang, X.; Wen, Y.; Zhang, F.; Han, H.; Huang, Y.; Sui, Z. A review on risk assessment methods for maritime transport. Ocean Eng. 2023, 279, 114577. [Google Scholar] [CrossRef]
  10. Ma, L.; Ma, X.; Lan, H.; Liu, Y.; Deng, W. A methodology to assess the interrelationships between contributory factors to maritime transport accidents of dangerous goods in China. Ocean Eng. 2022, 266, 112769. [Google Scholar] [CrossRef]
  11. Md Hanafiah, R.; Zainon, N.S.; Karim, N.H.; Abdul Rahman, N.S.F.; Behforouzi, M.; Soltani, H.R. A new evaluation approach to control maritime transportation accidents: A study case at the Straits of Malacca. Case Stud. Transp. Policy 2022, 10, 751–763. [Google Scholar] [CrossRef]
  12. Fan, S.; Blanco-Davis, E.; Fairclough, S.; Zhang, J.; Yan, X.; Wang, J.; Yang, Z. Incorporation of seafarer psychological factors into maritime safety assessment. Ocean Coast. Manag. 2023, 237, 106515. [Google Scholar] [CrossRef]
  13. Fan, S.; Yang, Z. Towards objective human performance measurement for maritime safety: A new psychophysiological data-driven machine learning method. Reliab. Eng. Syst. Saf. 2023, 233, 109103. [Google Scholar] [CrossRef]
  14. Galieriková, A. The human factor and maritime safety. Transp. Res. Procedia 2019, 40, 1319–1326. [Google Scholar] [CrossRef]
  15. Crestelo Moreno, F.; Roca Gonzalez, J.; Suardíaz Muro, J.; García Maza, J.A. Relationship between human factors and a safe performance of vessel traffic service operators: A systematic qualitative-based review in maritime safety. Saf. Sci. 2022, 155, 105892. [Google Scholar] [CrossRef]
  16. Hu, P.; Zhang, Q.; Shi, P.; Chen, B.; Fang, J. Flood-induced mortality across the globe: Spatiotemporal pattern and influencing factors. Sci. Total Environ. 2018, 643, 171–182. [Google Scholar] [CrossRef]
  17. Lee, W.V. Historical global analysis of occurrences and human casualty of extreme temperature events (ETEs). Nat. Hazards 2014, 70, 1453–1505. [Google Scholar] [CrossRef]
  18. De Moraes, O.L.L. Some evidence on the reduction of the disasters impact due to natural hazards in the Americas and the Caribbean after the 1990s. Int. J. Disaster Risk Reduct. 2022, 75, 102984. [Google Scholar] [CrossRef]
  19. López-Peláez, J. Co-evolution between structural mitigation measures and urbanization in France and Colombia: A comparative analysis of disaster risk management policies based on disaster databases. Habitat Int. 2011, 35, 573–581. [Google Scholar] [CrossRef]
  20. Mavhura, E. Disaster mortalities and the Sendai Framework Target A: Insights from Zimbabwe. World Dev. 2023, 165, 106196. [Google Scholar] [CrossRef]
  21. Shi, S.; Yao, F.; Zhang, J.; Yang, S. Evaluation of Temperature Vegetation Dryness Index on Drought Monitoring Over Eurasia. IEEE Access 2020, 8, 30050–30059. [Google Scholar] [CrossRef]
  22. Fu, S.; Liu, Y.; Xi, Y.; Wan, H. Feature Analysis and Association Rule Mining of Sship Accidents in Arctic Waters. Adv. Polar Sci. 2020, 32, 102–111. [Google Scholar] [CrossRef]
  23. Lloyd’s List Intelligence. Shipping and Maritime Intelligence; Lloyd’s List Intelligence: London, UK, 2021; Available online: https://www.seasearcher.com/ (accessed on 22 October 2023).
  24. Adhikari, P.; Hong, Y.; Douglas, K.R.; Kirschbaum, D.B.; Gourley, J.; Adler, R.; Robert Brakenridge, G. A digitized global flood inventory (1998–2008): Compilation and preliminary results. Nat. Hazards 2010, 55, 405–422. [Google Scholar] [CrossRef]
  25. Klein, L.R. Measurement of a shift in the world’s center of economic gravity. J. Policy Model. 2009, 31, 489–492. [Google Scholar] [CrossRef]
  26. Grether, J.-M.; Mathys, N.A. Is the World’s Economic Center of Gravity Already in Asia? SSRN Electron. J. 2008, 42, 47–50. [Google Scholar] [CrossRef]
  27. Liang, L.; Chen, M.; Luo, X.; Xian, Y. Changes pattern in the population and economic gravity centers since the Reform and Opening up in China: The widening gaps between the South and North. J. Clean. Prod. 2021, 310, 127379. [Google Scholar] [CrossRef]
  28. Lefever, D.W. Measuring Geographic Concentration by Means of the Standard Deviational Ellipse. Am. J. Sociol. 1926, 32, 88–94. [Google Scholar] [CrossRef]
  29. Rogerson, P.A. Historical change in the large-scale population distribution of the United States. Appl. Geogr. 2021, 136, 102563. [Google Scholar] [CrossRef]
  30. Wei, C.; Guo, B.; Zhang, H.; Han, B.; Li, X.; Zhao, H.; Lu, Y.; Meng, C.; Huang, X.; Zang, W.; et al. Spatial–temporal evolution pattern and prediction analysis of flood disasters in China in recent 500 years. Earth Sci. Inform. 2022, 15, 265–279. [Google Scholar] [CrossRef]
  31. Liu, J.; Chen, T.; Chi, D. Rainfall trend analysis of the northwest Liaoning Province based on Daniel and Mann-Kendall test. J Shenyang Agric. Univ. Soc. Ed. 2014, 45, 599–603. [Google Scholar] [CrossRef]
  32. Liu, Y.; Yang, Z.; Huang, Y.; Liu, C. Spatiotemporal evolution and driving factors of China’s flash flood disasters since 1949. Sci. China Earth Sci. 2018, 61, 1804–1817. [Google Scholar] [CrossRef]
  33. International Maritime Organization. X-Press Pearl—Incident Information Centre; 9875343; International Maritime Organization: London, UK, 2021. Available online: https://www.x-presspearl-informationcentre.com/ (accessed on 22 October 2023).
  34. Hopkins, S. Economic stability and health status: Evidence from East Asia before and after the 1990s economic crisis. Health Policy 2006, 75, 347–357. [Google Scholar] [CrossRef] [PubMed]
  35. Zaman, M.B.; Kobayashi, E.; Wakabayashi, N.; Maimun, A. Risk of Navigation for Marine Traffic in the Malacca Strait Using AIS. Procedia Earth Planet. Sci. 2015, 14, 33–40. [Google Scholar] [CrossRef]
  36. Rusli, M. Navigational Hazards in International Maritime Chokepoints: A Study of the Straits of Malacca and Singapore. J. Int. Stud. 2020, 8, 47–75. [Google Scholar] [CrossRef]
  37. Bellina, B.; Favereau, A.; Dussubieux, L. Southeast Asian Early Maritime Silk Road trading polities’ hinterland and the sea-nomads of the Isthmus of Kra. J. Anthropol. Archaeol. 2019, 54, 102–120. [Google Scholar] [CrossRef]
  38. Schottenhammer, A. The “China Seas” in world history: A general outline of the role of Chinese and East Asian maritime space from its origins to c. 1800. J. Mar. Isl. Cult. 2012, 1, 63–86. [Google Scholar] [CrossRef]
  39. Chang, Y.-C.; Liu, S.; Zhang, X. The construction of Global Maritime Capital—Current development in China. Mar. Policy 2023, 151, 105576. [Google Scholar] [CrossRef]
  40. Trivedi, A.; Jakhar, S.K.; Sinha, D. Analyzing barriers to inland waterways as a sustainable transportation mode in India: A dematel-ISM based approach. J. Clean. Prod. 2021, 295, 126301. [Google Scholar] [CrossRef]
  41. Rose, L.; Bhaskaran, P.K. Tidal Prediction for Complex Waterways in the Bangladesh Region. Aquat. Procedia 2015, 4, 532–539. [Google Scholar] [CrossRef]
  42. Antão, P.; Soares, C.G. Analysis of the influence of human errors on the occurrence of coastal ship accidents in different wave conditions using Bayesian Belief Networks. Accid. Anal. Prev. 2019, 133, 105262. [Google Scholar] [CrossRef]
  43. Zhou, X.; Ruan, X.; Wang, H.; Zhou, G. Exploring spatial patterns and environmental risk factors for global maritime accidents: A 20-year analysis. Ocean Eng. 2023, 286, 115628. [Google Scholar] [CrossRef]
  44. Wang, Y.; Zio, E.; Wei, X.; Zhang, D.; Wu, B. A resilience perspective on water transport systems: The case of Eastern Star. Int. J. Disaster Risk Reduct. 2019, 33, 343–354. [Google Scholar] [CrossRef]
Figure 1. Monthly distribution of water traffic accidents in Asia from year 2000 to year 2022.
Jmse 11 02112 g001
Figure 2. Seasonal distribution of water traffic accidents in Asia from year 2000 to year 2022.
Jmse 11 02112 g002
Figure 3. Yearly variation of water traffic accidents (a), accident-resulted deaths (b), and affected people (c) from 2000 to 2022.
Jmse 11 02112 g003
Figure 4. Distribution diagram of water traffic accidents (left panel) and deaths (right panel) in Asia. From top to bottom, Spring (a,b); Summer (c,d); Autumn (e,f) Winter: (g,h).
Jmse 11 02112 g004aJmse 11 02112 g004b
Figure 5. Heat map of water traffic accidents in Asia for different seasons. Spring (a); Summer (b); Autumn (c); Winter (d).
Jmse 11 02112 g005aJmse 11 02112 g005b
Figure 6. Hurst coefficient of water traffic accidents (left panel) and accident-related deaths (right panel) in different regions of Asia.
Jmse 11 02112 g006
Figure 7. Hurst coefficient calculations of water traffic accidents for different seasons.
Jmse 11 02112 g007
Figure 8. Evolution features of water traffic accidents in Asia. (a) Gravity centers of the Asia region; (b) Gravity centers of four sub-regions in Asia. The triangle represents the gravity center of the whole research period from 2000 to 2022.
Jmse 11 02112 g008
Figure 9. Evolution features of water traffic accidents in (a) South-eastern Asia and (b) Eastern Asia.
Jmse 11 02112 g009
Figure 10. Evolution features of water traffic accidents in (a) Southern Asia and (b) Western Asia.
Jmse 11 02112 g010
Table 1. Daniel coefficient of Asia and regions in different periods.
AreaYearr
(Accidents/Death)
Trend
(Downward-D/Rise-R)
Significance of 95%
Asia2000–2022−0.636 (−0.825)D/DY/N
2000–20041.000 (0.100)R/RY/Y
2005–2009−0.500 (−0.100)D/DN/N
2010–2014−0.050 (0.700)D/RN/Y
2015–2019−0.800 (−1.000)D/DY/Y
2020–20221.000 (1.000)R/RY/Y
Eastern Asia2000–2022−0.824 (−0.669)D/DY/Y
2000–20040.750 (−0.100)R/DY/N
2005–2009−0.500 (−0.700)D/DN/Y
2010–2014−0.450 (0.100)D/DN/N
2015–2019−0.550 (−0.100)D/DN/N
2020–20220.250 (−0.500)R/DN/Y
South-eastern Asia2000–2022−0.225 (−0.649)D/DN/Y
2000–20040.850 (−0.400)R/DY/N
2005–20090.350 (0.500)R/RN/N
2010–20140.700 (0.500)R/RY/N
2015–2019−0.900 (−0.400)D/DY/N
2020–20220.750 (1.000)R/RY/Y
Southern Asia2000–2022−0.513 (−0.601)D/DY/Y
2000–20040.250 (0.900)R/RN/Y
2005–2009−0.300 (−0.300)D/DN/N
2010–2014−0.500 (0.100)D/RN/Y
2015–2019−0.050 (−0.300)D/DN/N
2020–20220.500 (0.500)R/RY/Y
Western Asia2000–2022−0.197 (0.041)D/RN/N
2000–20040.350 (0.900)R/RN/Y
2005–20090.450 (0.200)R/RN/N
2010–2014−0.050 (0.000)D/—N/—
2015–2019−1.050 (−0.600)D/DY/Y
2020–2022−0.500 (0.500)D/RY/Y
Table 2. Hurst coefficient calculations of accidents and deaths in different areas.
South-Eastern AsiaSouthern AsiaWestern AsiaEastern Asia
Accidents0.653150.870110.748310.73104
Deaths0.810370.804810.653120.82565
Table 3. Hurst coefficient calculations of water traffic accidents for different seasons.
SeasonsSpringSummerAutumnWinter
H0.812880.953210.682020.90795
Table 4. Coordinates of gravity center in Asia and four sub-regions for different time periods.
YearRegions
AsiaSouth-Eastern AsiaEastern AsiaSouthern AsiaWestern Asia
2000–202289.835° E, 16.862° N112.121° E, 4.523° N120.785° E, 31.639° N85.600° E, 22.596° N37.789° E, 29.207° N
2000–200495.808° E, 19.344° N117.056° E, 3.776° N115.153° E, 32.086° N86.736° E, 22.269° N35.452° E, 34.534° N
2005–200989.482° E, 15.562° N112.690° E, 5.295° N123.776° E, 31.095° N84.321° E, 22.955° N41.490° E, 24.239° N
2010–201489.683° E, 13.192° N110.014° E, 3.908° N125.611° E, 31.697° N85.131° E, 23.641° N41.738° E, 20.441° N
2015–201976.816° E, 18.543° N106.453° E, 4.650° N121.713° E, 32.022° N84.493° E, 20.734° N34.334° E, 34.029° N
2020–202293.597° E, 16.996° N111.765° E, 6.276° N— —87.807° E, 22.833° N34.610° E, 38.495° N
Table 5. Axes lengths of standard deviation ellipse for Asia and four sub-regions in different time periods. (Mm-megameter, km-kilometer; the former data denote the long axis while the latter represent the short axis).
YearRegions
Asia
(Mm)
South-Eastern Asia (km)Eastern Asia (km)Southern Asia (km)Western Asia (km)
2000–202242.699, 14.32316.919, 10.61715.575, 5.88712.450, 8.0507.055, 20.689
2000–200441.211, 16.25115.852, 9.76814.325, 5.9389.709, 6.7478.626, 15.743
2005–200940.018, 12.36017.347, 10.86613.391, 5.26812.923, 8.7067.244, 19.703
2010–201439.847, 13.64016.127, 10.26121.587, 4.90915.060, 5.4523.411, 19.659
2015–201950.655, 9.36317.460, 8.70310.957, 2.44617.599, 6.59019.008, 5.090
2020–202235.340, 10.13413.933, 10.746— —9.369, 7.348— —
Disclaimer/Publisher’s Note: The statements, opinions and data contained in all publications are solely those of the individual author(s) and contributor(s) and not of MDPI and/or the editor(s). MDPI and/or the editor(s) disclaim responsibility for any injury to people or property resulting from any ideas, methods, instructions or products referred to in the content.

