Review

Living on the Coast in Harmony with Natural Processes

by
José Simão Antunes Do Carmo
Department of Civil Engineering, Faculty of Sciences and Technology, Polo II, University of Coimbra, 3030-788 Coimbra, Portugal
J. Mar. Sci. Eng. 2023, 11(11), 2113; https://doi.org/10.3390/jmse11112113
Submission received: 16 September 2023 / Revised: 1 November 2023 / Accepted: 1 November 2023 / Published: 5 November 2023
(This article belongs to the Special Issue The 10th Anniversary of JMSE - Review Collection)

Abstract

:
The coastal zone is a fascinating place that comprises the interface between sea and land. This interface, which is both very dynamic and sensitive, has been affected by strong urban and industrial pressures, and an increase in both traffic and recreational uses, leading to the deterioration of natural habitats and the growing instability of residential areas. Added to this disruption is ongoing climate change, which will lead to rising sea levels and increased wave action. Another problem we are increasingly concerned about is ocean pollution, which has been one of the main causes of threats to deep-water coral reef areas. The main sources of pollution include oil spills and offshore oil drilling. The effects of pollution caused by oil spills can not only seriously affect the global environmental balance of our planet but can also, on a different scale, seriously affect the economy of countries whose main resources depend heavily on the sea. Wave energy has the potential to alleviate the world's dependence on depleting fossil energy resources. With regard to coastal protection, the development of ecological solutions to preserve ecosystems and address coastal processes as an alternative to traditional coastal protection structures (seawalls, groins and breakwaters) is becoming increasingly important. These structures, generally referred to as passive measures, are usually built to alter the effects of sea waves, currents and the movement of sand along the coastline, with the aim of protecting beaches, ports and harbors. The concerns outlined are critically addressed throughout this review article. All of them are highly relevant today and, as demonstrated throughout this article, are expected to grow even more and with much more pronounced consequences starting from the middle of the current century.

1. Introduction—Coastal and Ocean Concerns

According to the EPA [1], people living in coastal areas will be strongly affected by ongoing climate change, as it will lead to rising sea levels, consequent flooding, and intensified wave action. As a result, coastal erosion and the amount of sediment in transit will increase [2].
While efforts are being made to reduce the causes and mitigate the effects of global climate change, they remain critical in coastal areas. In fact, many of the adaptation strategies implemented in coastal areas have proven to be inadequate or ineffective, and several coastal habitats are being affected [2,3,4,5,6,7,8,9].
More coastal flooding, more tropical storms, less biodiversity, fewer glaciers, and millions of people living in coastal regions at risk, are the broad strokes of the report by the UN’s Intergovernmental Panel on Climate Change (IPCC) [10].
Rising sea waters have been accelerated by the loss of ice from the Antarctic and Greenland ice caps. In Antarctica, ice loss was three times greater between 2007 and 2016 than it had been between 1997 and 2006, according to the report by IPCC [10]; in Greenland, it was twice as great. This acceleration in Antarctica could “potentially lead to a rise in sea levels of several meters in a few centuries”.
This report also shows the advantages of acting—and doing so as quickly as possible—and, at the same time, the drastic consequences of delayed action. The researchers make it clear that the oceans “critically depend on ambitious and urgent emission reductions”, coordinated with measures to adapt to the damage already done.
Meanwhile, coastal habitats face increasing risks around the world as a result of human action, both locally and contributing to ongoing climate change. Given the important contributions of coastal habitats to coastal protection, fish production and the economy of local communities, the degradation of these habitats represents huge cultural and economic losses, as well as an increased risk of coastal flooding [11,12,13,14,15,16,17]. A coherent review on the valuation and quantification of coastal ecosystems and services, including human-induced and climate change impacts on the monetary value of ecosystems, is provided by Mehvar et al. [18].
The risks of flooding in coastal areas, especially in low-land areas, due to climate action are high. Extreme sea levels can occur during storms, which can lead to coastal flooding in the absence of sufficient coastal protection. According to the European Environmental Agency (EEA), a 10 cm rise in sea level typically increases the frequency of flooding to a given height by a factor of approximately three [19]. Situations like those documented in Figure 1 are common in many regions of the globe. Future floods may not be (and hopefully will not be) as devastating as this one, but if current projections are maintained, small-scale events may become a daily issue for some coastal communities by the end of the century [20].
Most assessments of coastal vulnerability due to climate change focus primarily on the impacts of sea level rise. However, many other studies have shown that changes in storms and wave climate have the potential to cause more significant coastal impacts than those related to sea level rise.
According to Gomes et al. [21], there is clear evidence that extratropical systems in the North Atlantic basin have decreased overall in the last 50–100 years, but on the other hand, there has been an increase in the frequency of really strong storms.
Still with regard to the North Atlantic, it is known that global climate change has led to changes in the trajectories of extratropical storms with considerable regional changes associated with this change, although without a global intensification of extratropical cyclonicity [22].
As reported in [23,24], the occurrences recorded in January 2013 and throughout the winter of 2013/2014, due to the combination of an intense polar vortex and a strong jet stream in the North Atlantic, caused a set of low-pressure systems that crossed the Atlantic and reached the coasts of western Europe.
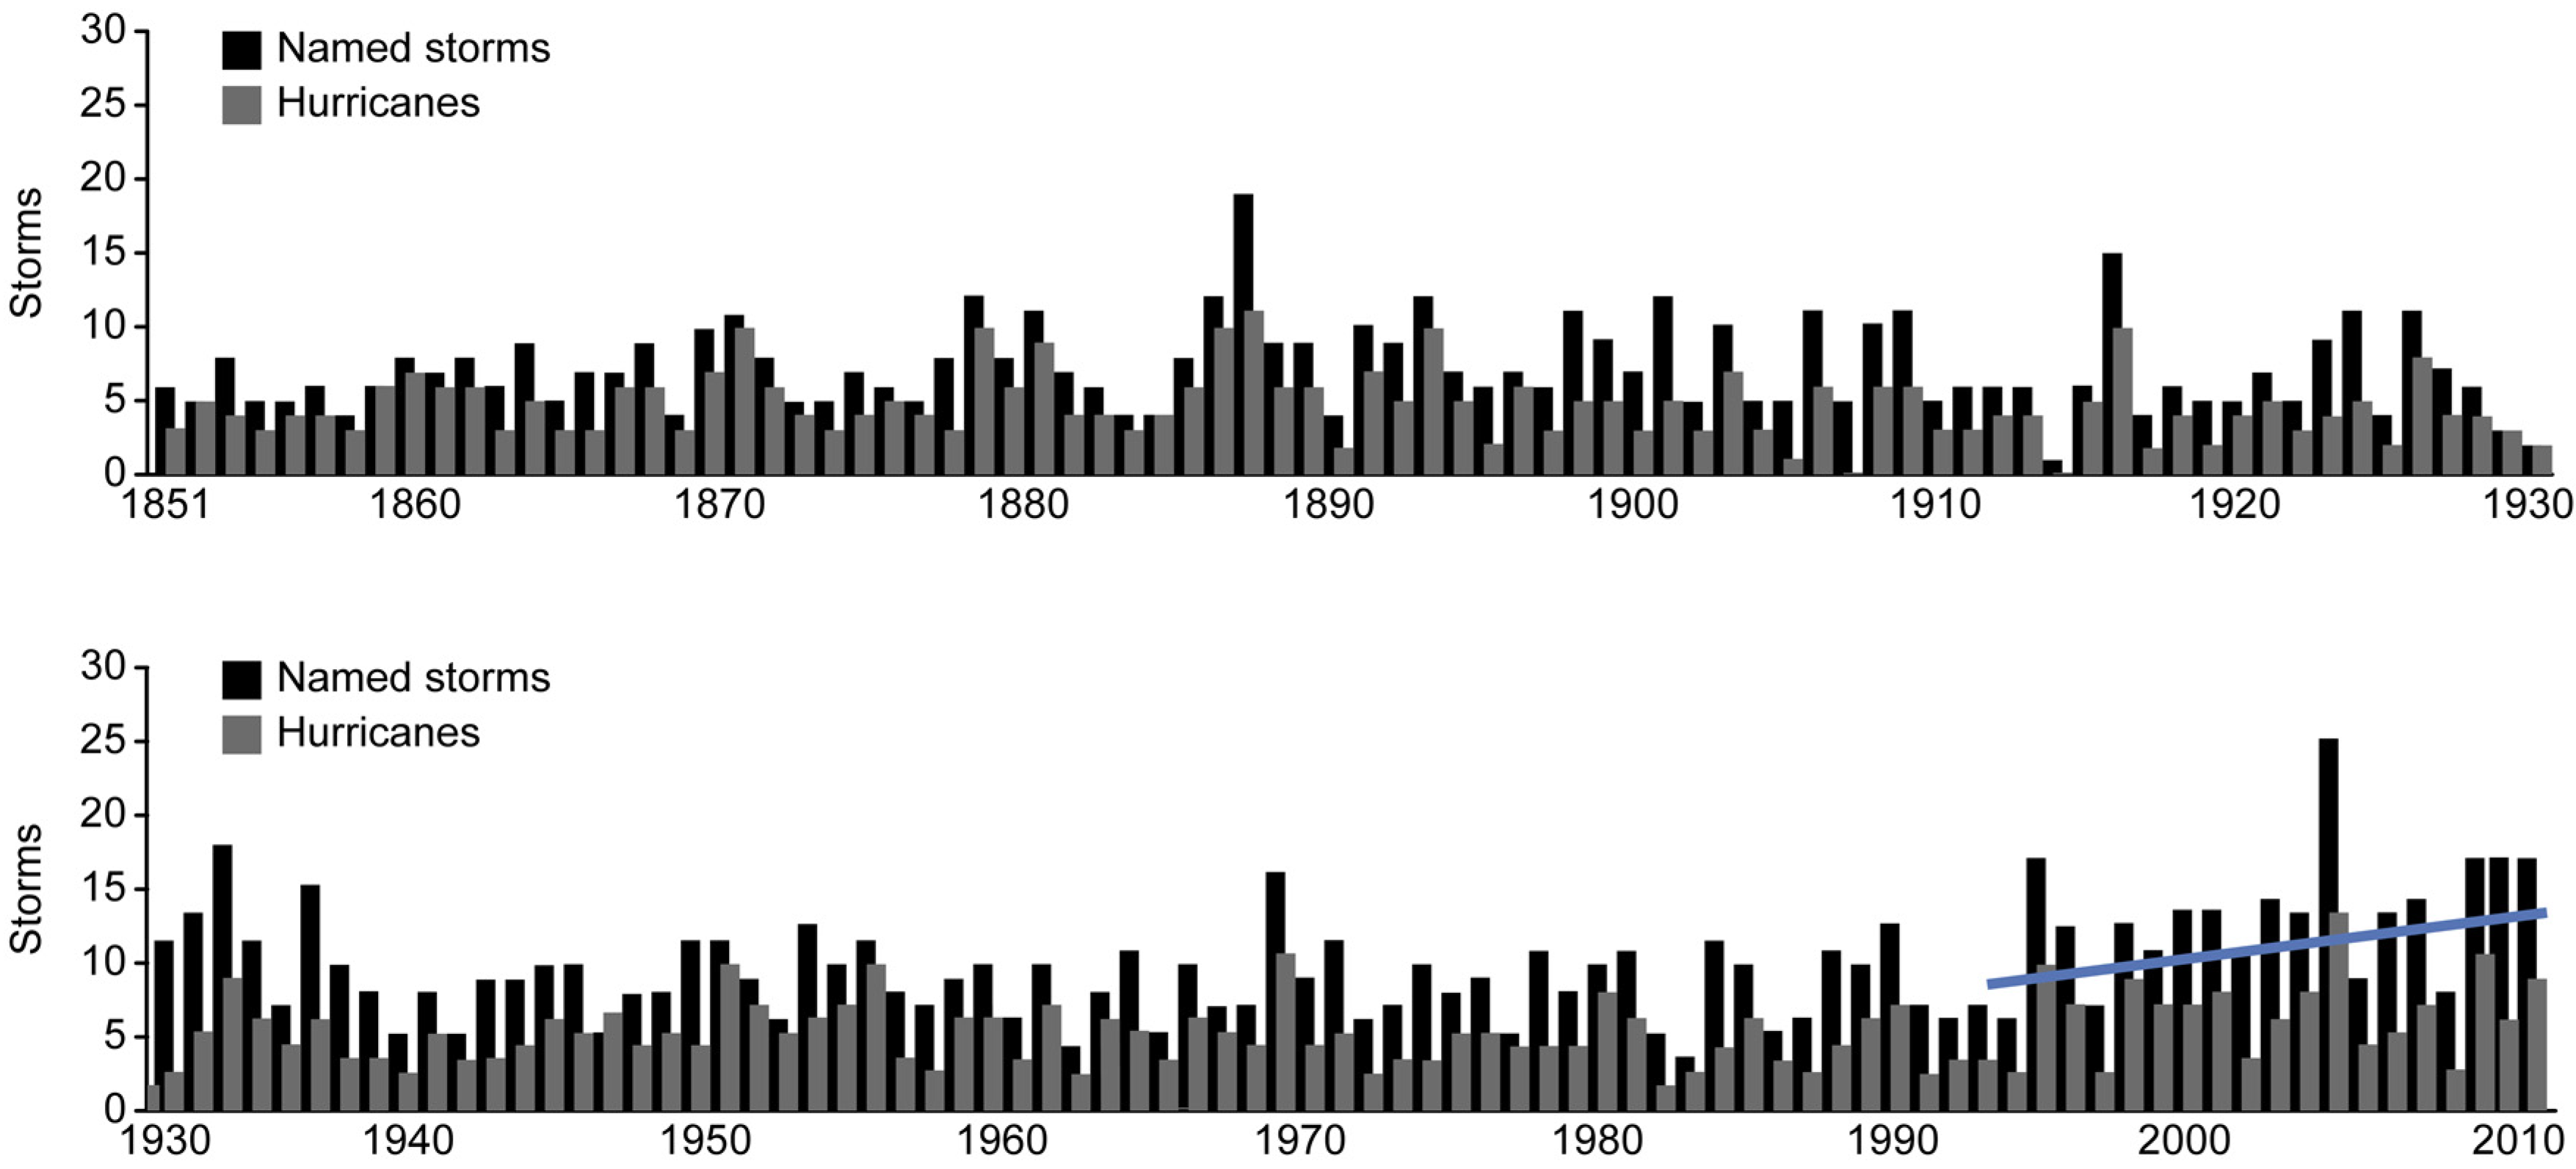
According to several recent studies, the intensity and frequency of storms is likely to increase with potential implications for the wave climate on the European Atlantic coast [25,26,27,28,29]. As shown in Figure 2, there was a very significant linear growth in the number of occurrences from the mid-1990s onwards [3].
To understand how the current climate could change in the future, different greenhouse gas emissions scenarios were developed based on assumptions about future demographic changes, economic development, and technological advances. The scenarios cover a wide range of the main demographic, economic, and technological drivers of future greenhouse gas and sulfur emissions, which include anthropogenic emissions of carbon dioxide, methane, nitrous oxide, sulfur dioxide, carbon monoxide, and nitrogen oxides, among others [30].
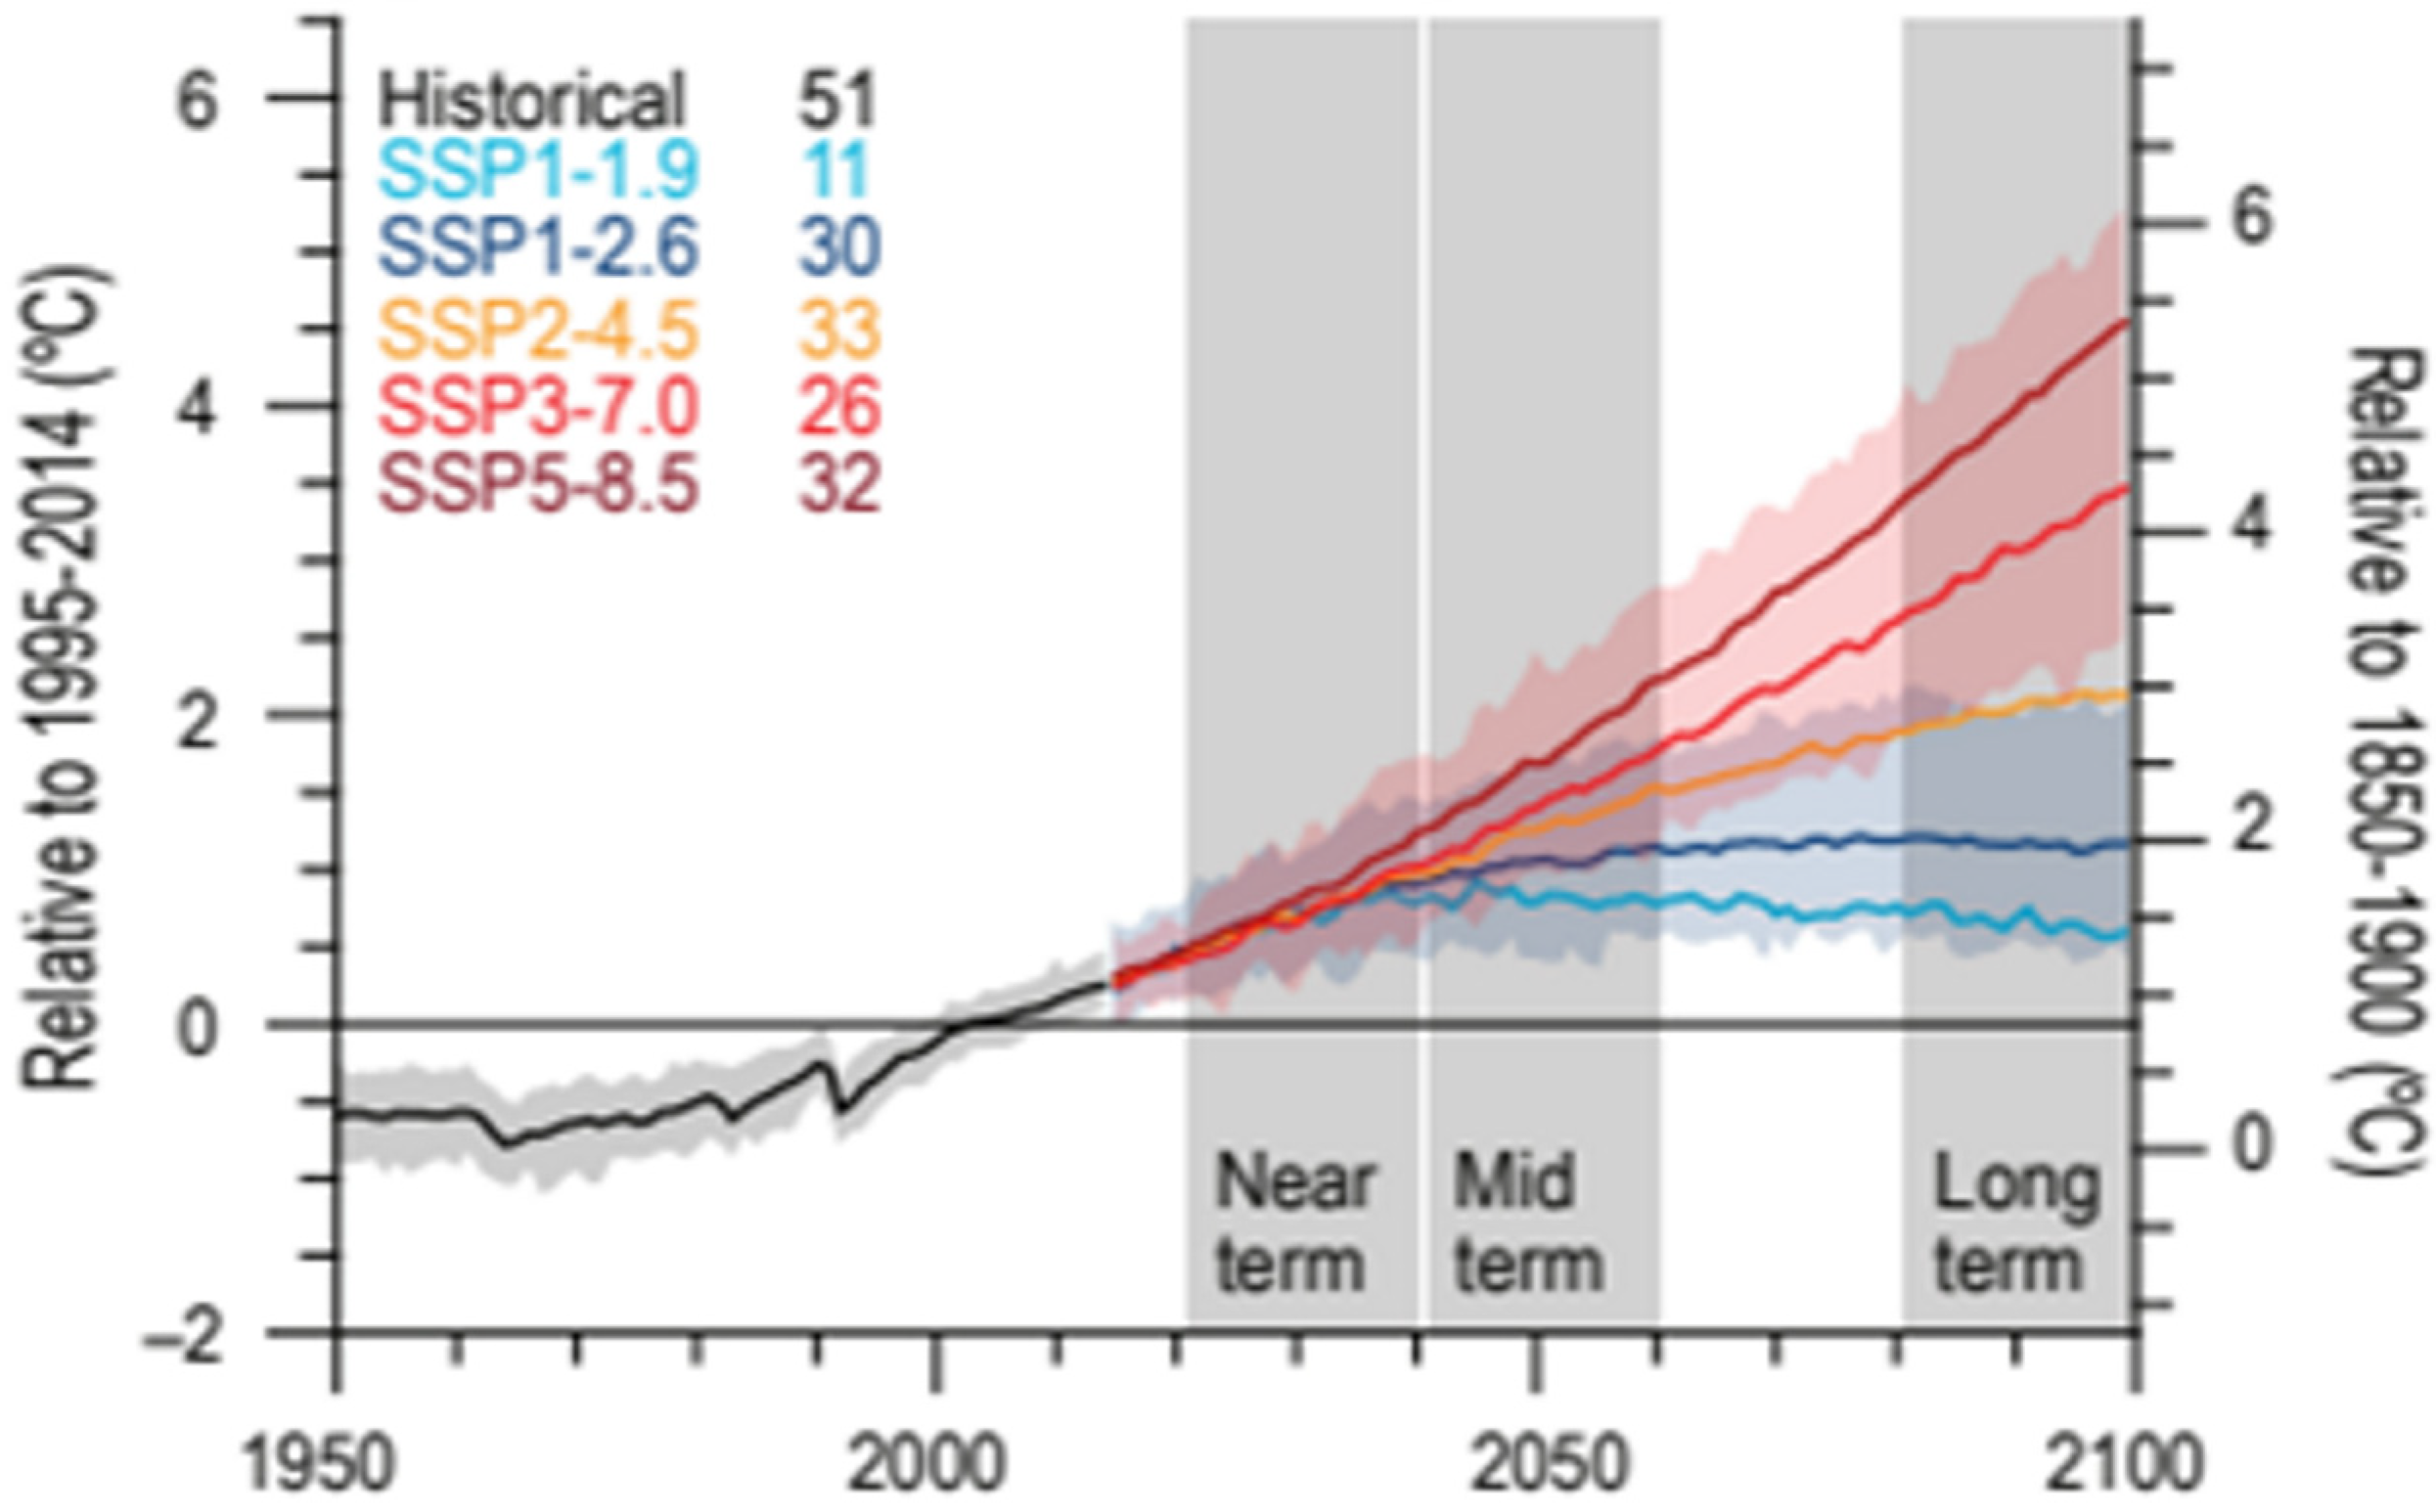
Each of the four scenarios developed represents a specific quantitative interpretation. Based on these emission ranges, concentration trajectories are similar until about 2025–2030 (Figure 3) and then diverge sharply. This figure shows ensemble-mean changes and uncertainties for 2021–2040 (near-term), 2041–2060 (mid-term), and the 2081–2100 (long-term), relative to 1995–2014 (present day) and the approximation to 1850–1900 (pre-industrial) [31].
Therefore, according to the Intergovernmental Panel on Climate Change [32,33], current environmental conditions will most likely tend to worsen with the increase in temperature, with a more significant increase in the number and intensity of storms being expected from the second half of the current century.
According to NOAA’s 2021 Annual Climate Report, “the combined temperature of land and ocean has increased at an average rate of 0.08 °C per decade since 1880; however, the average rate of increase since 1981 has been twice as fast: 0.18 °C per decade”. These values are in line with the IPCC graph shown in Figure 3 and are corroborated by [34], which reports a global average rate of temperature increase of 0.19 °C per decade from 1979 to 2022, with a 95% confidence interval ±0.02 °C [34]. Somewhere in the literature, it is also stated that 2012–2021 was the warmest decade on record since the beginning of thermometer-based observations.
If the current trend continues, this means an average temperature increase of ~1.4 °C by 2100, which may correspond to the most likely value or slightly above that estimated by SSP2-4.5, according to IPCC.
According to [2], analyses of long-term instrumental data for the European Atlantic coast also revealed significant wave height increasing trends of about 1–2% per year. This trend is an important factor that should be taken into account in future coastal management plans and emergency evacuation plans.
Also, in accordance with [2], 50% of the most intense hurricanes in memory and 80% of hurricanes with a diameter greater than around 1300 m have occurred in the Atlantic this century. Global climate change is expected to worsen this trend. The continued population increase along coastal zones exacerbates the importance of the effects of possible coastal flooding resulting from storms.
There are many impacts associated with the global warming trend that have become evident in recent years. Arctic summer sea ice coverage has declined dramatically, and the ocean’s heat content has increased. According to ESA [35], “sea level has risen globally by around 15 cm during the 20th century and is currently rising more than twice as fast at a rate of 3.6 mm per year (between 2006–2015)”.
According to [36], many plant and animal species are changing the geographical distribution and timing of their life cycles due to changes in warming and precipitation. In addition to the effects on the climate, the oceans are absorbing part of the excess CO2 from the atmosphere, leading to changes in their chemical composition and causing their acidification.
Sea level rise can have dramatic consequences for natural coastal systems. Among the most important biogeophysical effects are, although they do not occur simultaneously and with similar effects in different regions [37,38]:
  • Inundation, flood, and storm damage;
  • Erosion and sediment deficits;
  • Wetland loss (and change);
  • Rising water tables/impeded drainage;
  • Saltwater intrusion;
  • Biological effects.
Despite the appeals regularly made at successive meetings and protocols since 1992 with The United Nations Framework Convention on Climate Change (UNFCCC) adopted during the Rio de Janeiro Earth Summit in 1992, the commitments assumed so far are not enough and the forecasts continue to be dramatic, as Figure 3 and Figure 4 show, especially from the mid-21st century onwards.
An important consequence of global warming is the rise in sea levels through two mechanisms: (1) the melting of polar ice caps, which adds water to the oceans, and (2) the expansion of ocean water as it warms, leading to an increase in its volume and the consequent average rise in sea level.
According to the IPCC [33], Figure 4 shows the likely global average sea level rise in Greenhouse Gas Emissions (GHG) scenarios SSP1-1.9 and SSP5-8.5 for two periods, 2050 and 2100, relative to 1995–2014.
Another problem we face with growing concerns is ocean pollution, as it has been a major cause of threats to coral reef areas in deep waters. According to the Ocean Pollution Guide [39], around 20 billion tons of waste are dumped into the sea every year, often without any prior processing. Marine plastic pollution is also an important source of pollution in itself, especially microplastic pollution, in addition to acting as a concentration vector of other ocean chemical pollutants [40].
Among the main sources of marine pollution are oil spills and oil exploration offshore as well. It is well known that oceans have been, are and will continue to be an alternative source of fossil fuels. Oil explorations had a large increase on land in the nineteenth century. However, since the early twentieth century, with the depletion of some oil and gas reserves onshore, petroleum companies have been on a constant lookout for the availability of offshore resources [41,42].
In addition to the oil platforms, offshore oil and gas explorations require permanent support from ships to transport products, materials, and equipment. Although technology has improved, natural disasters, operational discharges, and accidents that cause oil spills occur frequently and can be disastrous in less favorable weather conditions [43]. However, it should be noted that accidental spills from tankers in 1985 amounted to around 400,000 tons and have declined to around 100,000 tons per year in more recent years.
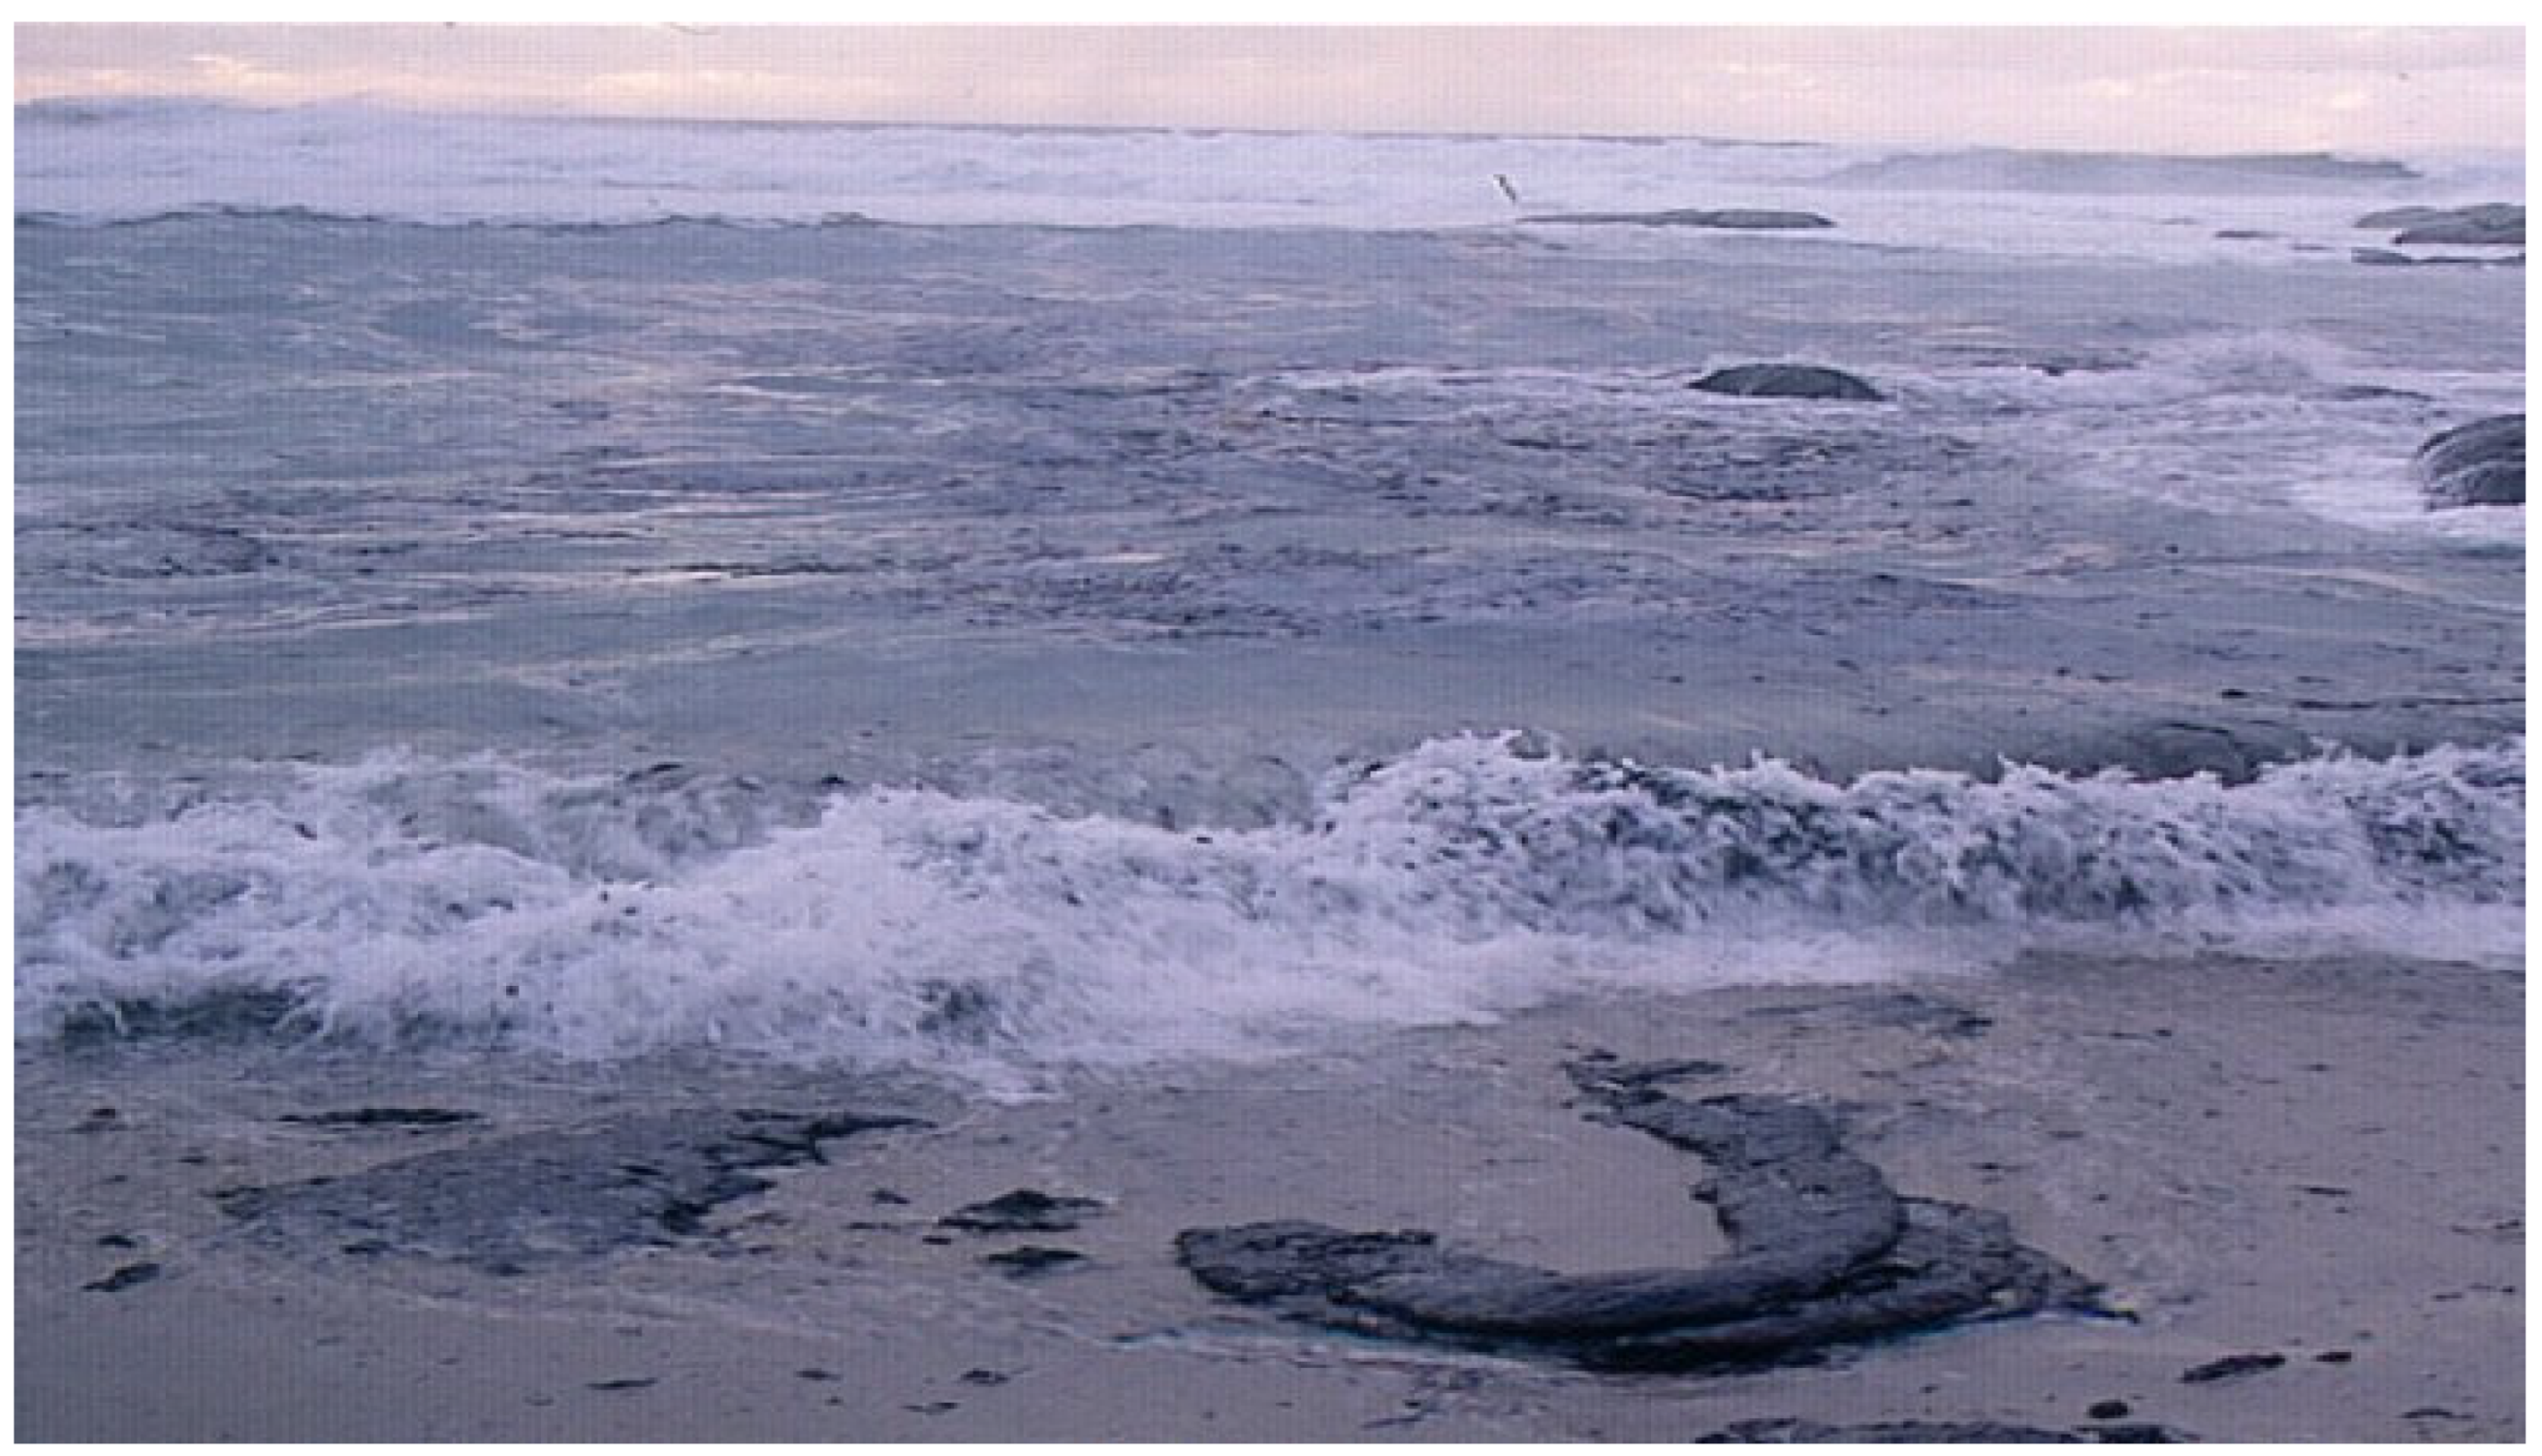
Figure 5 shows the coast of Galicia, Northern Spain, polluted after the accident of the oil tanker Prestige that occurred in the Atlantic Ocean in November 2002, when the vessel sank leaking around 30,000 tons of fuel oil [44].
According to [45], the oil tanker spills decreased consistently since the 1970s both in the number of oil spills and the amount of oil lost. The average number of spills per year in the 1970s was approximately 79 and decreased by over 90% to 6 in the 2010s. Moreover, the amount of oil spilled in the 2010s was 164 000 tons, which represents a 95% reduction since the 1970s.
However, although less frequent and in smaller amounts, the impacts of accidents involving oil tankers cannot be overlooked, as oil spills kill marine flora and fauna. While cetaceans migrate from their areas, the small fish, corals, and plants on the ocean floor suffer the most [46].
With regard to coastlines, the behavior of spilled hydrocarbons can be affected by several factors. As Chen et al. [47] showed, the type and composition of the spilled oil are the main factors that influence oil adhesion, as they are closely related to its physical properties, including its viscosity and density. Authors of [48] also pointed out that heavier oils are more adherent to the coastal surface than light oils, and that less fresh oils are also more adherent.
Shoreline characteristics, such as beach slope and substrate types, can also significantly affect the adhesion of spilled hydrocarbons. The smaller the shoreline substrate, the greater its surface area, so spilled hydrocarbons are more likely to adhere. Other coastal parameters, such as currents, waves, tides, and wind, also affect the adhesion of hydrocarbons.

2. On the Climate Change—Current Status and the Future

Climate change is defined as any change in weather averaged over time due to natural variability or because of human activity. Currently, there are many issues that we face in our daily lives as a result of ongoing climate change. When it comes to oceans and coastal areas, we are at risk from a range of climate change-related hazards and processes. The top 10 issues that, if left unchecked, will lead to deep changes in Earth’s climate, biophysical changes in coastal environments and ecosystems, and our current way of life include:
  • Global warming from fossil fuels.
  • Melting ice caps and sea level rise.
  • Ocean pollution.
  • Ocean acidification.
  • Groundwater salinity.
  • Biodiversity loss.
  • Severe storms.
  • Loss of climate regulation.
  • Overfishing.
  • Poor governance.
It is neither appropriate nor possible to address all concerns surrounding these topics in sufficient depth here. However, the need for an in-depth discussion on these topics and the implementation of appropriate guidelines to keep our ecosystems in balance is clear. In this work, we limit ourselves to touching on essential questions relating to the first three topics.

2.1. How Have Climate Issues Been Addressed in Recent Decades?

The state of our climate is continuously recorded and analyzed by various agencies and organizations, including the IPCC (Intergovernmental Panel on Climate Change), EPA (Environmental Protection Agency), UNEP (United Nations Environment Program), NOAA (National Oceanic and Atmospheric Administration), EEA (European Environment Agency), and EEB (European Environmental Bureau).
Many other organizations have warned about the continued degradation of our planet’s environmental conditions, notably UNESCO (United Nations Educational, Scientific, and Cultural Organization), the Asia Foundation, and Greenpeace, among others. These organizations have produced reports, usually annual, warning about the growing emissions of greenhouse gases; the global increase in the temperature, which is approaching levels that are difficult to bear; the pollution of the oceans; and rising average sea levels.
At the same time, several meetings have been organized in recent decades, protocols and treaties have been produced, and goals have been established. Among the main milestones are the Rio Summit in 1992, where it was assumed that integrating and balancing economic, social, and environmental concerns in meeting our needs is vital to sustaining human life on the planet; followed by the Kyoto Protocol in Japan in 1997; the long-term vision introduced by the Bali Action Plan in 2007; the goal of keeping global temperature rise below 2 °C in Copenhagen, Denmark, in 2009; the Green Climate Fund in Cancún, Mexico, created in 2010; the Durban Platform for Enhanced Action (ADP); and subsequent meetings in Warsaw, Poland, in 2013; Lima, Peru, in 2014; and COP21 held in Paris in 2015, France. A legally binding international treaty on climate change known as the Paris Agreement was adopted at the UN Climate Change Conference (COP21) and entered into force on 4 November 2016.
Despite all efforts made in recent decades to reduce greenhouse gas emissions and keep temperatures at acceptable levels, the results are disappointing. We must bear in mind that livelihood of the entire human population will be affected by the chain of consequences caused by climate change, which will inevitably lead to irreversible conditions due to unsustainability, especially from the second half of this century onwards.
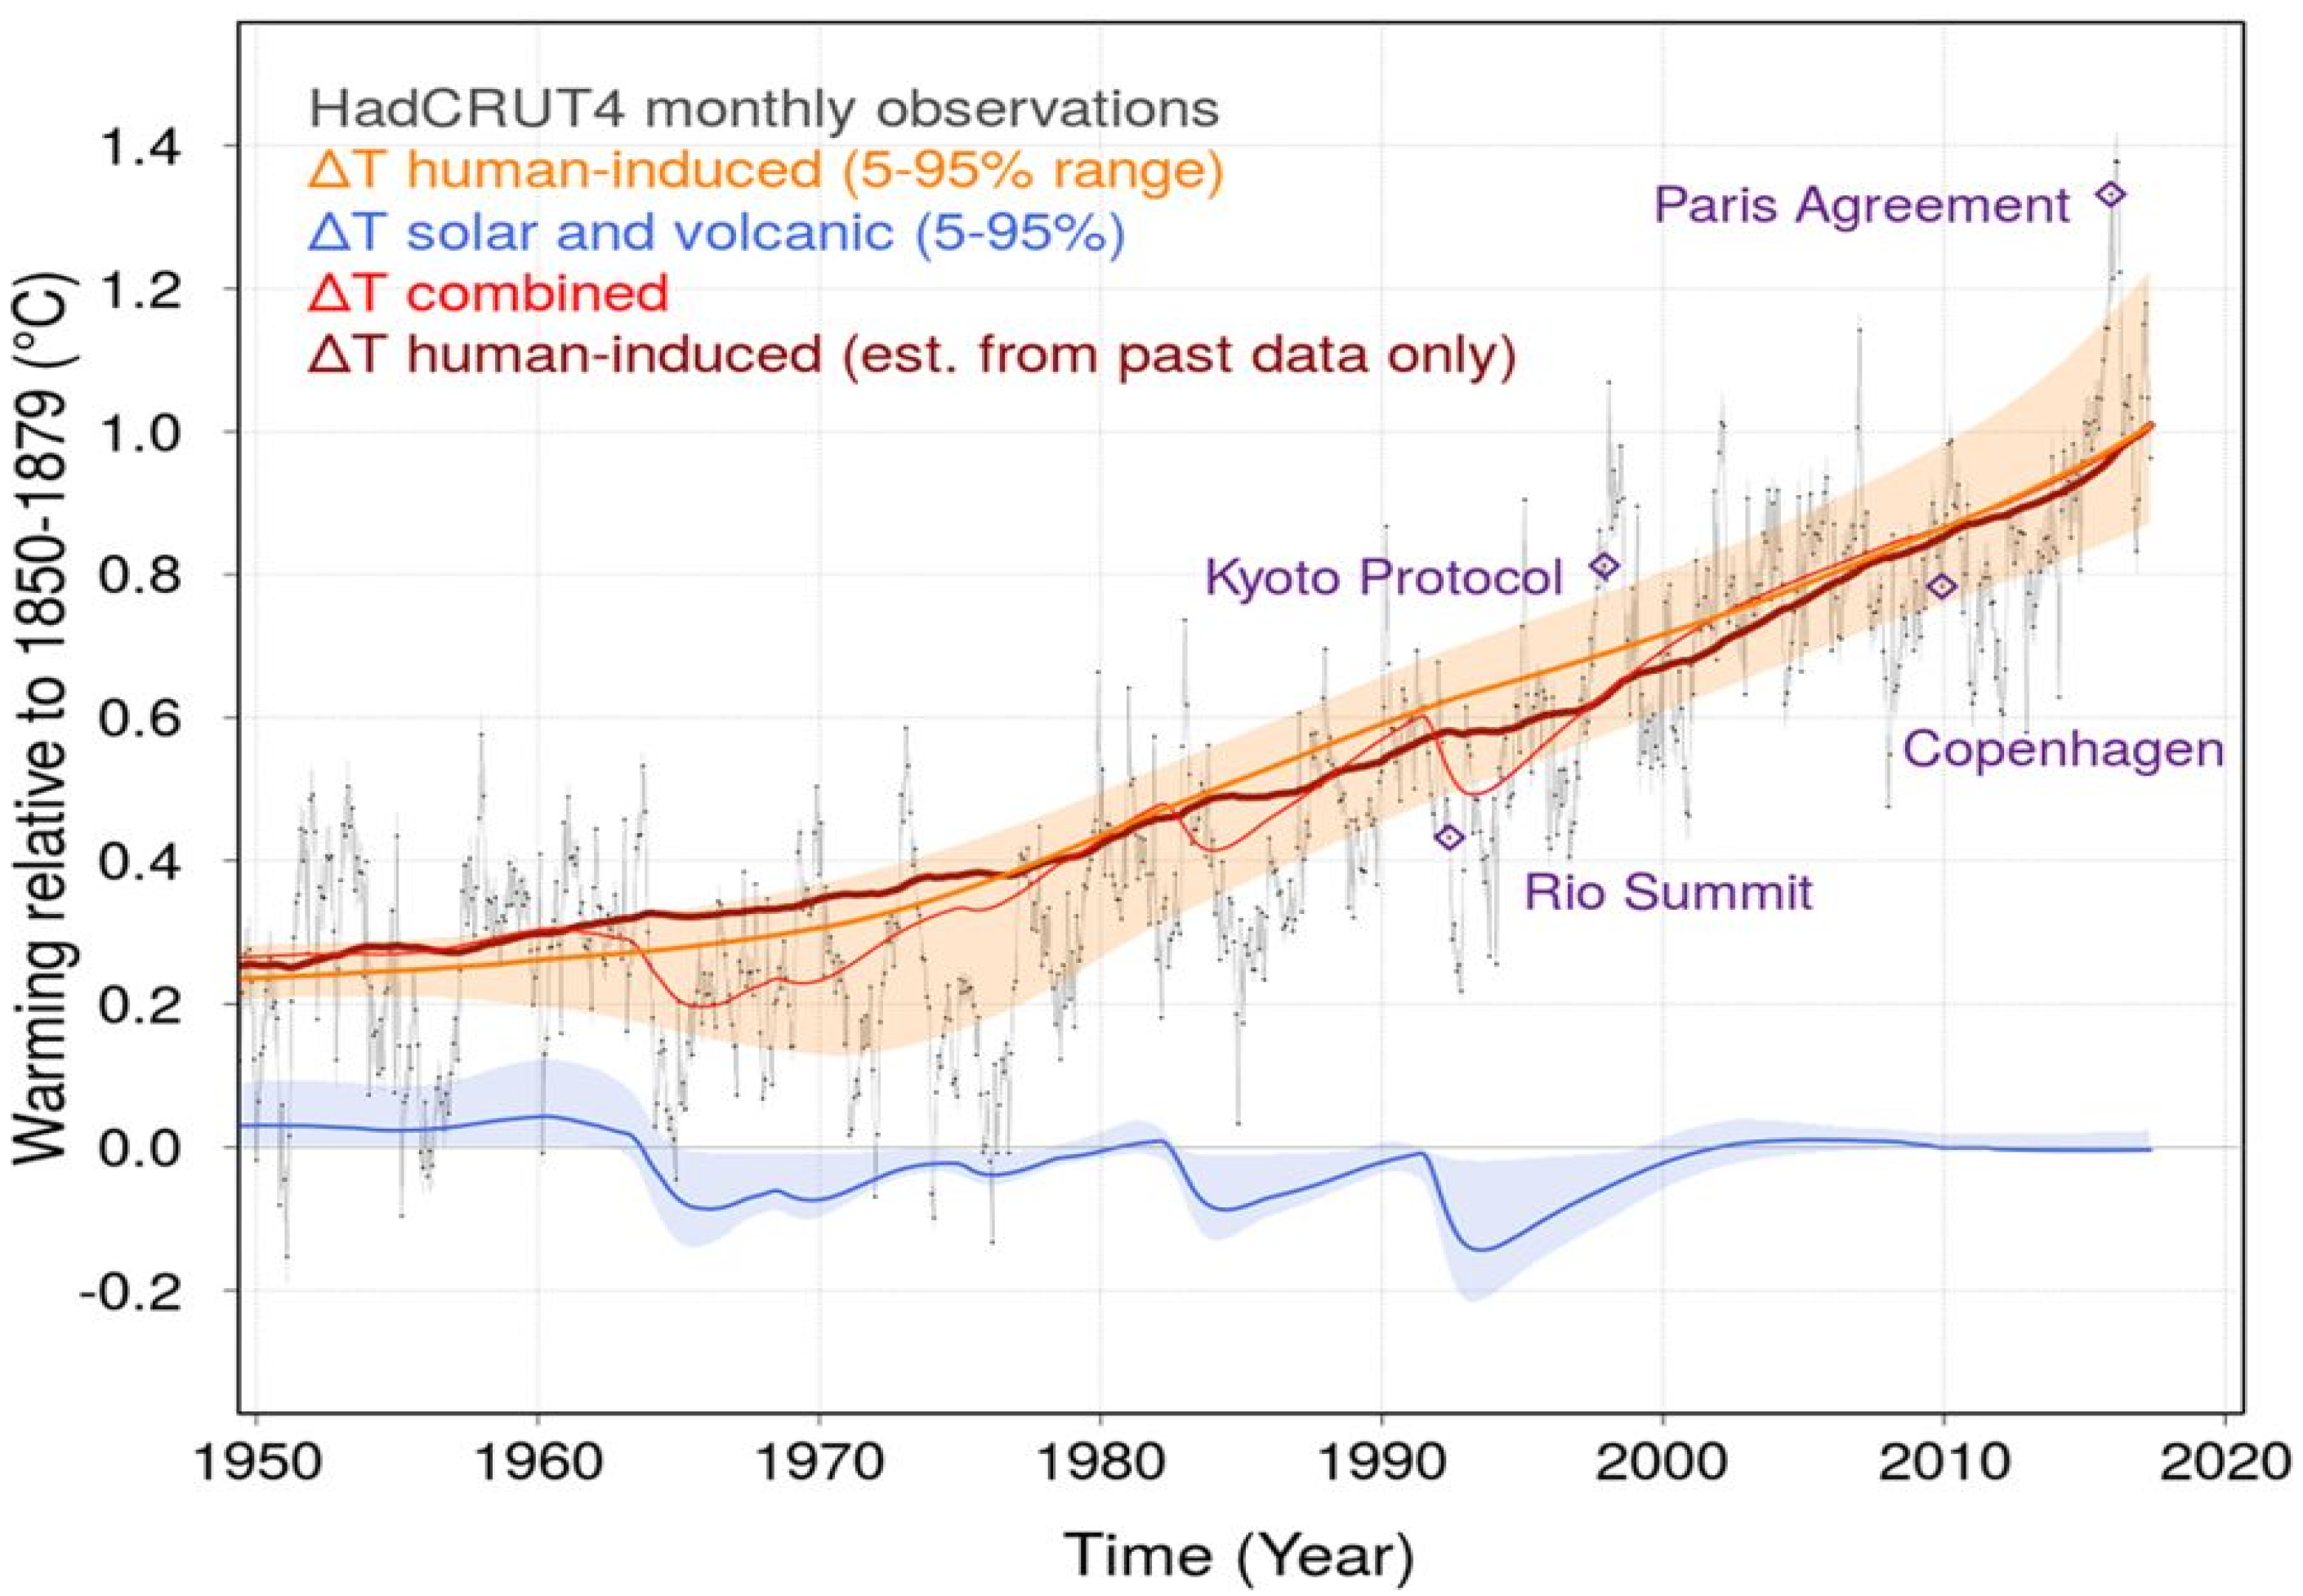
An index sufficiently revealing the lack of effectiveness of the actions developed is the Global warming index, or GWI, proposed by Haustein et al. [48]. The GWI is based on the standard “multi-fingerprinting” approach introduced by Hasselmann [49], which is also used by the IPCC. Using this Index, Haustein et al. [48] concluded that all warming observed since 1850–1879 is essentially anthropogenic (Figure 6).
Another monitoring tool for tracking climate protection performance is the annual Climate Change Performance Index (CCPI) published since 2005 [50,51]. Its methodology was revised in 2017 to fully incorporate the results of the Paris Agreement negotiations.
Countries covered by the CCPI in 2021 are responsible for more than 92% of all GHG emissions. Considering the development of some of the key indicators, namely GHG emissions, renewable energy, energy use, and climate policy, the most notable finding is that greenhouse gas emissions (GHG) per gross domestic product (GDP) is the only one continuously falling [49].
Therefore, despite all efforts to reduce GHG emissions, it is clear that global progress has been limited and predictions on degradation trends in climate and environmental conditions are not encouraging. As reported in the current IPCC, compared to 2020, levels of global emissions must be halved by 2030 to keep global warming within 1.5 °C.

2.2. What Can We Expect from Ongoing Climate Change?

Great advances have been made in the theory, observations, and modeling of Earth’s climate system. Such advances have made it possible to project future climate change with sufficient confidence and credibility. However, as reported by the Royal Society [36], for a number of reasons, “it is impossible to provide accurate estimates of how global or regional temperature trends will evolve decade by decade in the future”.
Still according to [36], it is impossible to accurately predict the amount of CO2 that human activities will emit, as this depends on “factors such as how the global economy develops and how society’s energy production and consumption will change in the future”. Furthermore, with current knowledge of the complexities of how climate feedback works, there are a range of possible outcomes, even for a specific CO2 emissions scenario. As far as can be predicted, in general, all models project that the Earth’s current warming trend will continue, with a significant increase from the middle of the current century.
Overall, as reported by [36,52], unless technological or policy changes leading to a reduction in current emission trends are considered, an increase in global average temperatures can be expected, which should be in the range of 0. 5 °C to 4.5 °C by 2100 (Figure 3), with a likely increase in the order of 1.5 °C to 2.0 °C for all scenarios.
If many of the current millions of tons of annual emissions are not drastically reduced, greenhouse gas concentrations in the atmosphere will continue to rise. Along with the environmental issues mentioned above, increasing greenhouse gas concentrations are expected to have several effects, namely increases in Earth’s average temperature, acidity of the oceans, frequency, intensity, and duration of extreme events, rising sea levels, threats to human health, and reduction in ice and snow cover, as well as permafrost [52].
According to [53], if greenhouse gas levels continue to rise at current levels, the Earth’s global average temperature will increase by a further 4 °C during the 21st century. Also, according to [53], without quick action to reduce greenhouse gas emissions, it will not be possible to maintain global average temperatures at an increase of 1.5–2.0 °C.

3. On the Ocean Pollution—Detection, Control, and Cleanup

The total amount of hydrocarbons annually introduced into the marine environment is estimated at around 3.2 million tons, being the pollution resulting from ship operations and oil tanker accidents, including oil exploration platforms, estimated at approximately 1.5 million tons. Accidental oil tanker spills represent an annual contribution of approximately 400 000 tons, most of which occur during routine loading, unloading, and provisioning operations [25].
After the occurrence and detection of an oil spill at sea, it is important to implement measures to mitigate its negative impacts. SAR remote sensing methods are generally the best suited for detecting oil spills after they occur [54,55,56,57]. However, mathematical modeling is a very powerful tool for managing an oil spill accident, namely, to monitor the evolution of the oil slick taking into account the spreading and weathering processes, such as evaporation, vertical dispersion, emulsification, and viscosity changes, and also for determining preventive measures [44,57].
By simulating the oil slick evolution, numerical models together with SAR satellite data and GIS technology (using SAR satellite data processing and adding it to ArcGIS Pro map, for example) make it possible to reorient the evolution of the oil slick at sea and redefine its characteristics, such as area and thickness, at detection points. In fact, whenever an accident of this type occurs, answers are essentially sought for the following questions:
  • What is the position of the oil slick?
  • Where is it heading?
  • What is the state of the product?
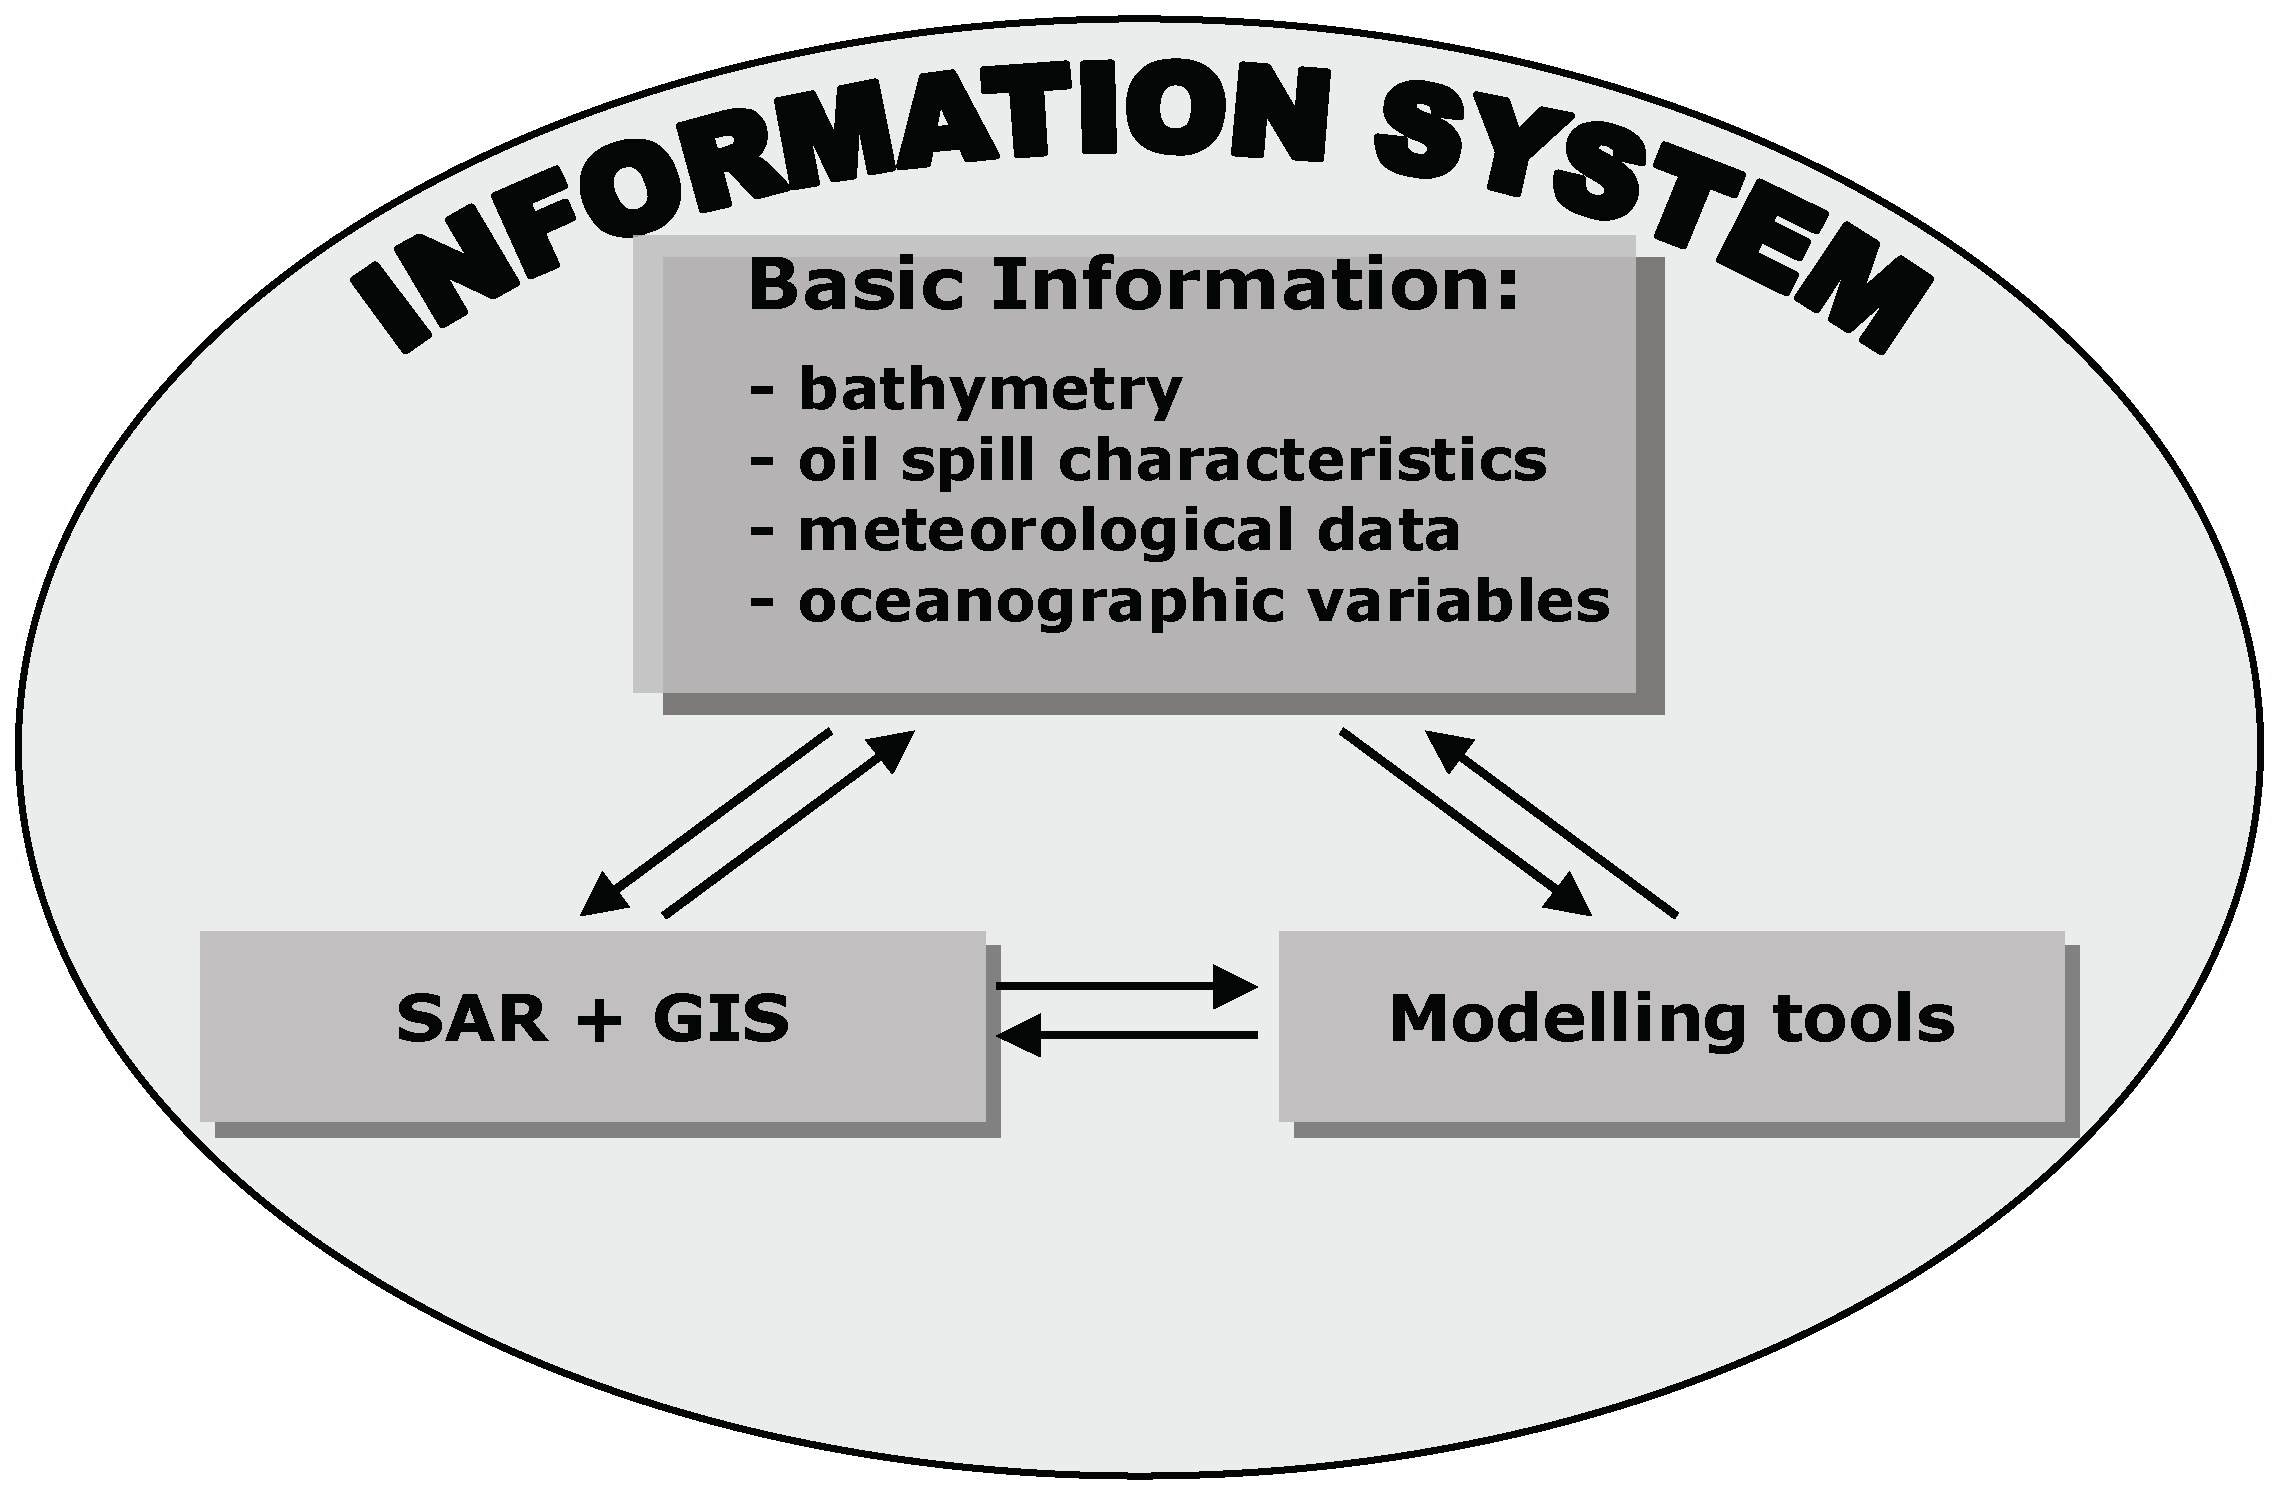
A management support tool developed for accidental hydrocarbon spills in the Atlantic coastal waters off the Iberian Peninsula is described in [44]. It is mainly composed of three interconnected modules: (1) the basic information for data organization and handling, which is organized into four different sets; (2) the SAR satellite data processing analysis and GIS visualization; and (3) the modelling tools for the spreading and weathering processes simulation and spilled oil transport (Figure 7).
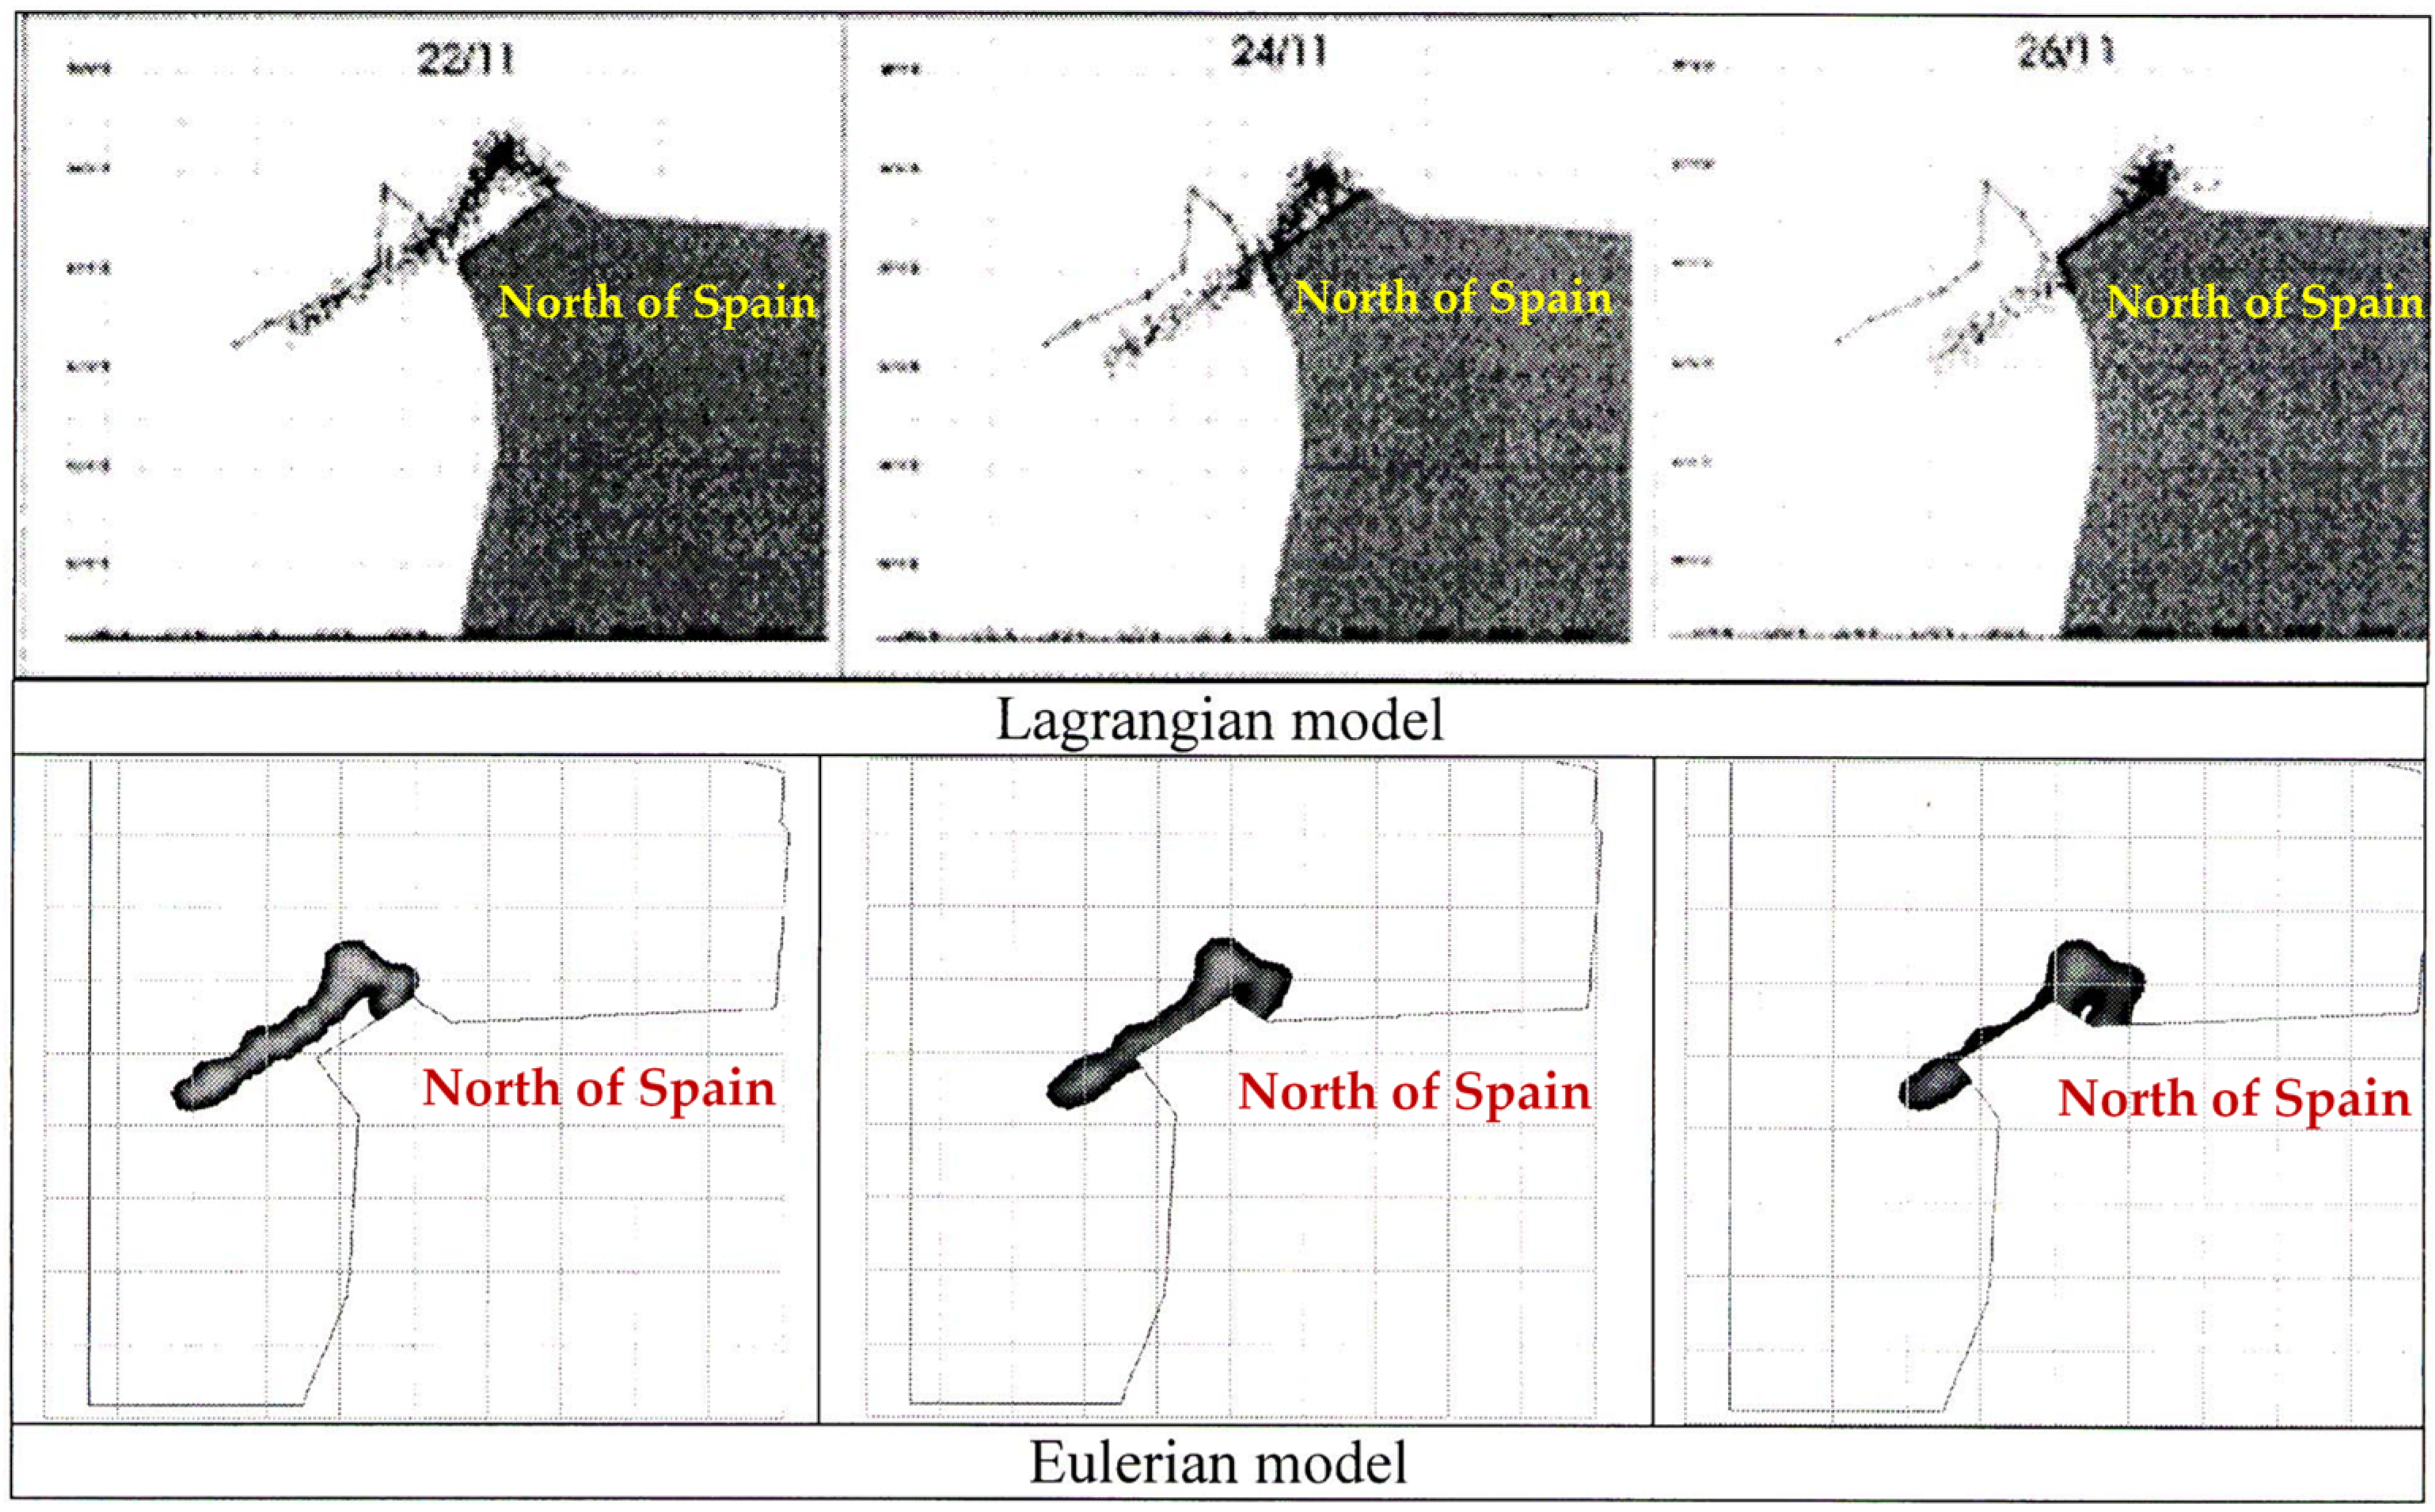
This computational structure was used to study the hydrodynamics at the time of the N/T Prestige accident occurred on 13 November 2002, and the evolution of the fuel oil mass spilled during the 15 days following the accident. For the description of the spilled oil slick transport, both a Lagrangian and a Eulerian mathematical formulation can be used. Figure 8 compares the simulation results of the spilled fuel oil mass using both descriptions. For modelling details and possible comparisons with the trajectories of deriving systems, see [44].
A numerical oil slick model that simulates the transport and weathering of an oil spill that occurred in a coastal area, coupled with a 3D hydrodynamic model, is presented in [58]. A three-dimensional model considering a Eulerian description of the oil slick evolution [59] was applied in an enclosed water body, in order to take immediate action upon the occurrence of such an accident. A two-dimensional oil spill model using a Eulerian description for oil slick evolution was used in [60] to investigate oil spread in a limited area in the southern part of the Korean Peninsula. A three-dimensional mathematical oil spill model that uses a Lagrangian formulation to assess the risk of oil spills along the coast of an island is presented in [61]. More recently, numerical simulation of the drift and spread of oil slicks in marine environments using the hydrodynamic model TELEMAC-2D and a stochastic approach based on a two-dimensional advection–diffusion equation transformed into a Lagrangian representation is presented in [62].
According to the WEO [63], more than a quarter of the current oil and gas supply is produced offshore and it is estimated that by 2040 the amount of energy-related offshore activity will increase.
Therefore, we must be prepared for any emergency related to an oil spill and cleaning up oil from the sea. Procedures must be adopted that include applications of marine monitoring tools to mitigate potential impacts arising from the exploration and transport of petroleum products.
Currently, the most common methods of cleaning the sea after an oil spill are oil booms, skimmers, sorbents, burning, dispersants, and other much safer methods such as hot water washing or high-pressure water washing, bioremediation, and natural recovery.
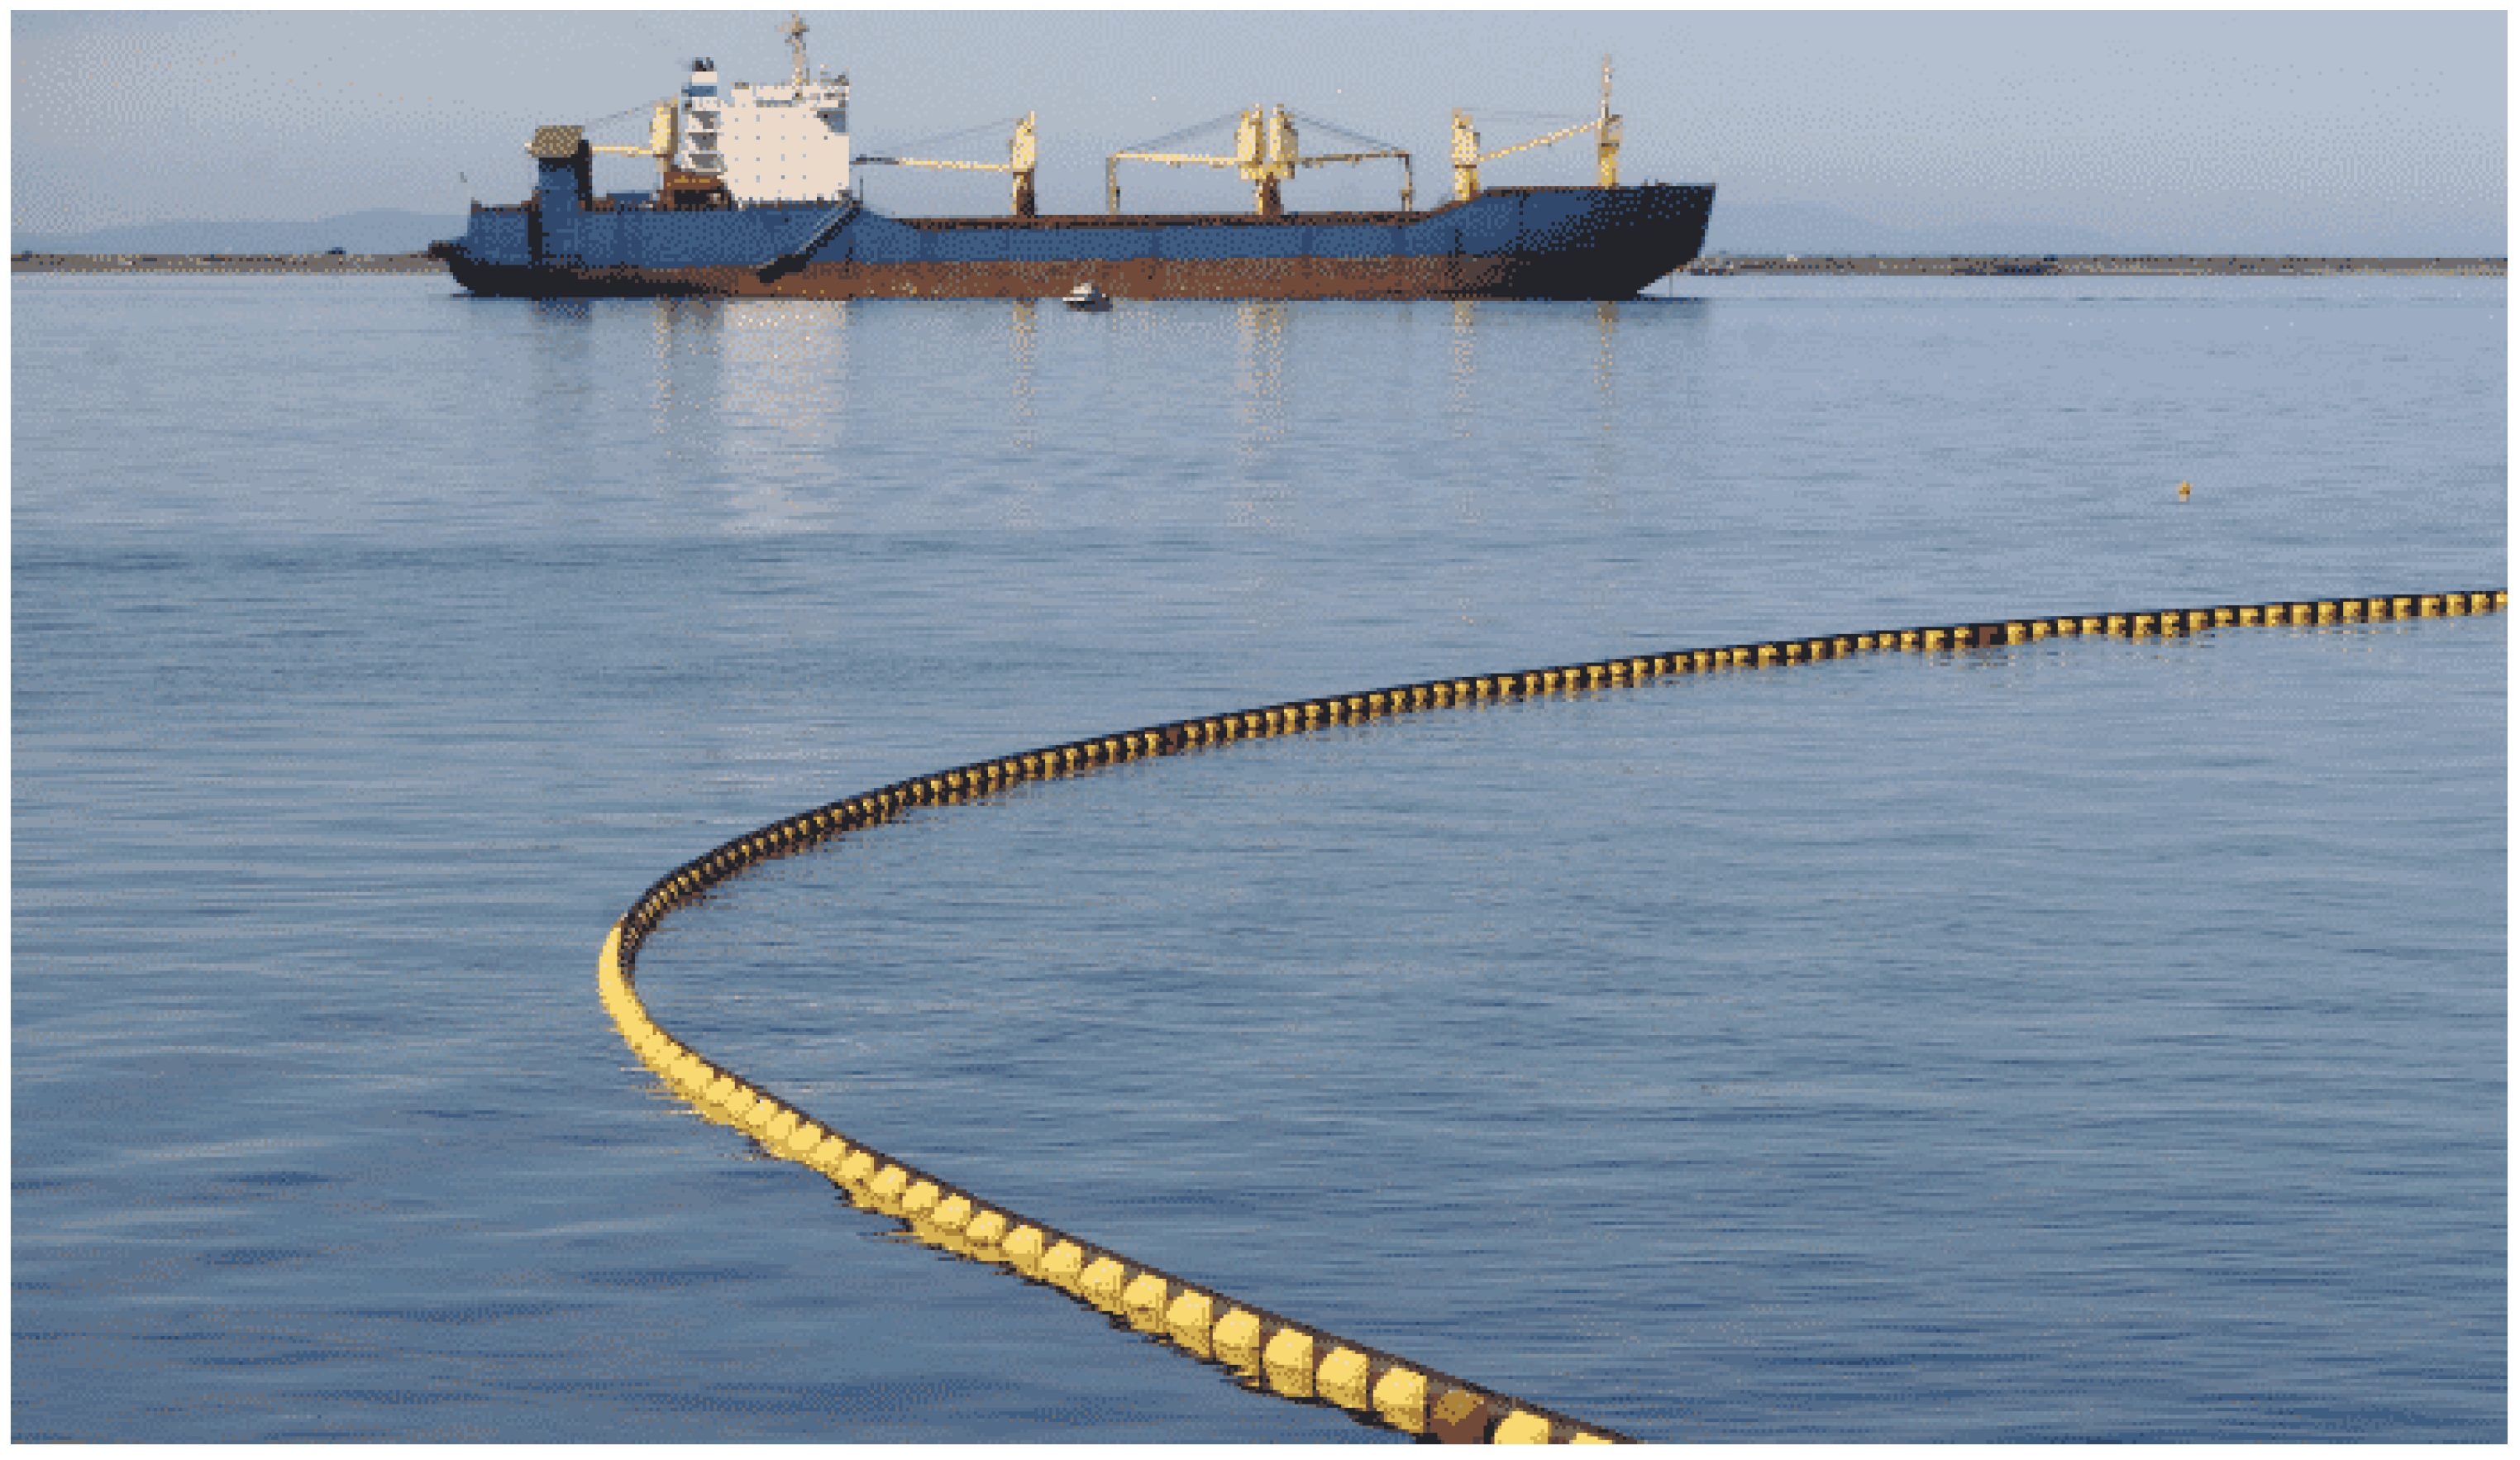
Oil booms, also called “Containment Bars”, are the most common and popular equipment used in oil cleaning due to their simpler design and easier execution. The mechanism consists of enclosing the oil in a smaller area, preventing it from spreading further [64]. Figure 9 shows a type of oil bloom installed for representational purposes.
The skimmers or oil scoops are fitted onto boats and serve to extract the floating oil or greasy contaminants bounded by the oil booms; basically, they suck all greasy products spread over the confined surface of the water in the oil booms. The use of sorbents aims to adsorb or absorb liquids. It is a common and easy process of oil cleaning using, in general, peat, straw, and hay.
The burning method is the most efficient oil cleaning method as it can efficiently remove 98% of the total spilled oil. Dispersants are used when oil cannot be confined to booms and are intended to initiate the disintegration of the oil.
Other methods often employed for safer cleanups of offshore oil spills are hot water washing or high-pressure water washing, bioremediation, and natural recovery.

4. In the Coastal Zone—Coastal Protection and Adaptation Measures

4.1. Coastal Protection—Traditional Approach

Vulnerabilities and risks in coastal areas have increased, with a much sharper increase expected from the middle of this century. As reported in [3], whether resulting from local actions or contributing to global warming and climate change, human activity has been the main cause of existing imbalances.
As reported in [2,3], traditional hard engineering protection techniques, such as the use of passive measures, which consist of constructions normal to or in direction of the shoreline as, e.g., breakwaters, groins, seawalls, and jetties and revetments, are inadequate to combat large-scale erosion. These structures could even contribute to increase erosion in areas more or less distant from the implantation sites.
Various studies on the performance of these structures have been carried out for a long time. We need only mention the studies by Kraus and Dougal [65] and Dean et al. [66]. The effects of seawalls on a beach were investigated by [65]. Among the main conclusions, authors of [65] stated that erosion does not necessarily occur on seawalls or can be difficult to predict, since it is not related to the height of the incident wave, and also that reflection does not seem to greatly influence the overall shape of the beach profile. In an attempt to reduce beach erosion and wave impact on a protective seawall in Palm Beach, Florida, an experimental submerged breakwater (reef) was proposed. In order to provide a basis for evaluating the effects of this installation, a comprehensive field monitoring program was carried out [66]. The authors concluded that the reef would cause an additional erosion rate above background erosion and would therefore have a negative effect on beach stability.
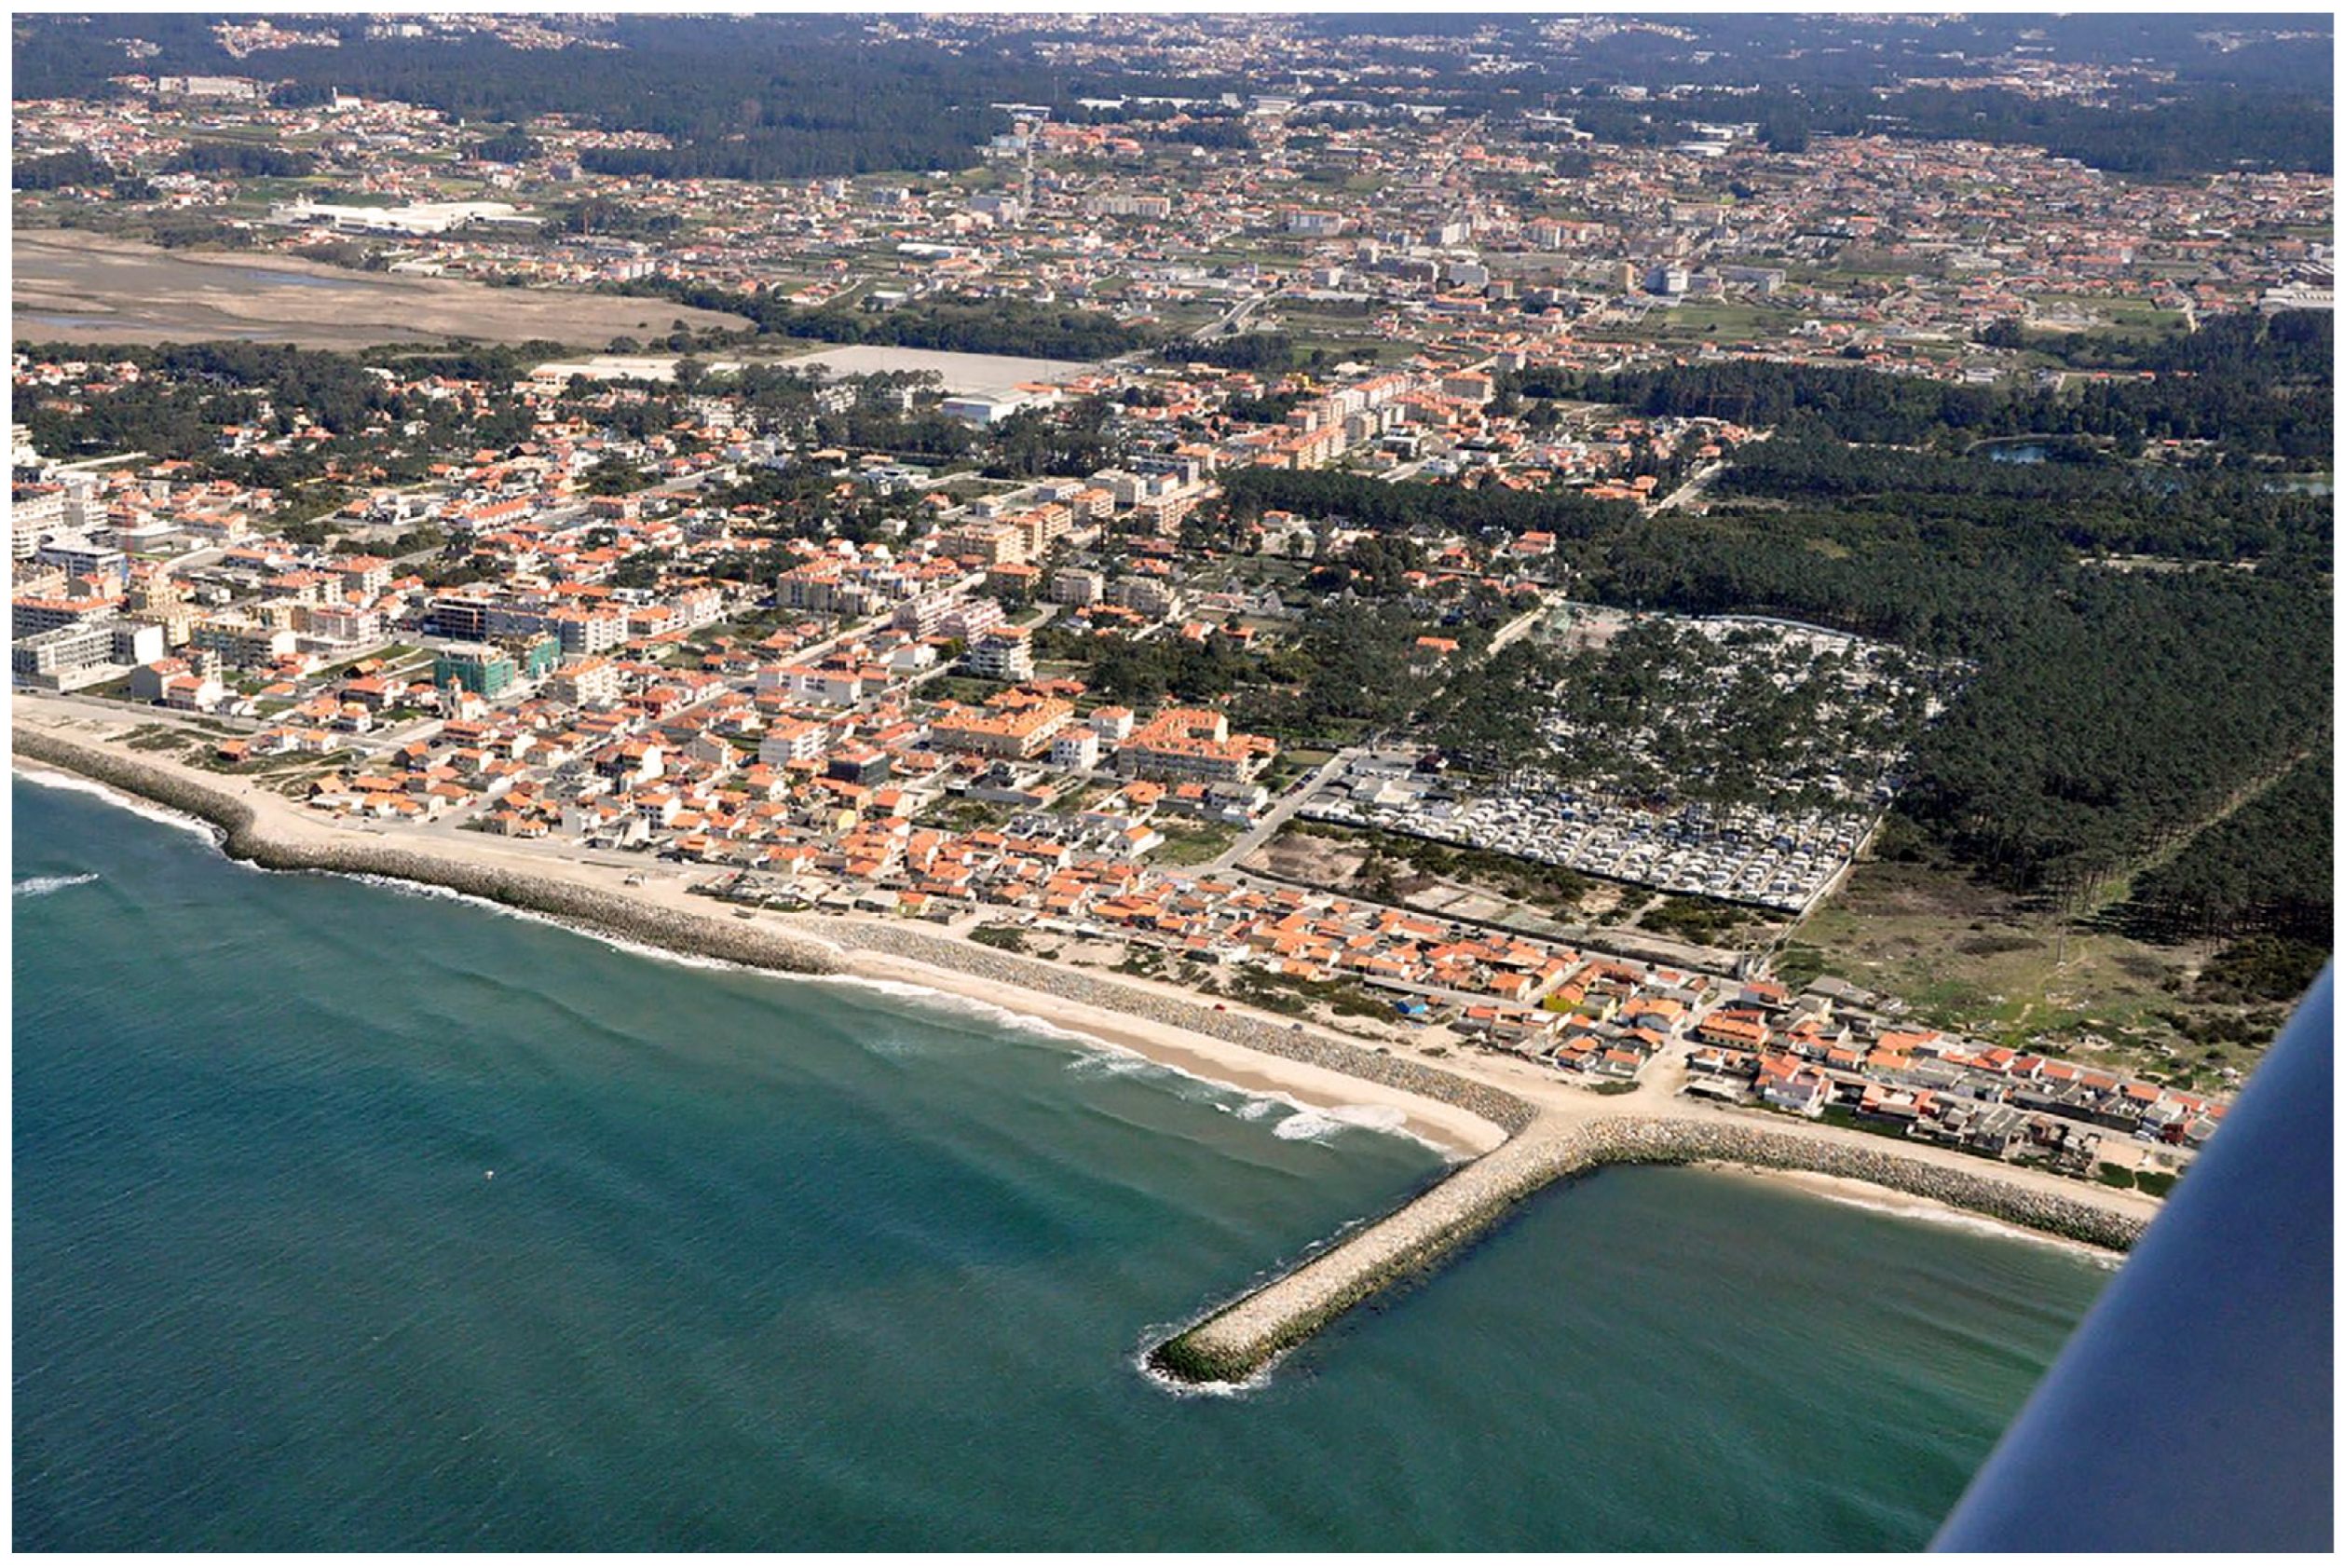
However, in emergency situations, the implementation of “hard engineering structures” may become necessary [67,68]. This is the case of urban areas at high risk, only maintained at the expense of hard engineering projects, such as the urban front shown in Figure 10, which is only possible to maintain at the expense of seawalls and groins.
These structures are usually built to alter the effects of ocean waves, currents, and sand movement along the coastline with the aim of protecting beaches, ports, and harbors. However, in many cases, passive measures, such as seawalls, breakwaters, and groins, have caused a large amount of downdrift erosion problems with high associated costs. The great visual impact of these emerging structures, such as breakwaters and groins, is another weak point to take into account. Furthermore, these structures are expensive and have high maintenance costs.
To overcome these drawbacks, low-crested structures (LCSs) were suggested in the DELOS project [69]. As this project emphasizes, since wave energy can pass over the structure, an LCS is more stable than the conventional type. It also suggests design guidelines for low-crested structures to take into account the multiple effects of these structures on the coastal environment.
Not infrequently, traditional passive structures also accelerate coastal erosion by redirecting wave energy. Also, this type of protection can have very important environmental effects with high repercussions in various sectors such as tourism and industrial, agricultural, commercial, and recreational activities. With regard to ecological functions, these structures are not suitable for creating attractive environments for fish. They are really not ecofriendly.
On very energetic coasts, such as the Atlantic coast, active measures, such as sand supply and artificial dunes, are not, in themselves, a sufficiently effective measure and must be complemented with additional wave energy dissipation structures and different types of vegetation. In fact, the action of waves and currents generate forces that easily move the unconsolidated sand and soils around these structures, resulting in rapid changes in the shoreline.
Soft protections, also referred to as active measures, such as natural or manmade sand dunes with vegetation (Figure 11), complemented by nearshore nourishment to decrease dune front erosion, are suitable solutions. Indeed, nearshore nourishment is a proven nature-based solution that mimics the natural migration processes of storm bars. It has been widely used along different coastal zones worldwide since the beginning of the current century. However, it should be noted that the artificial feeding process has to be repeated frequently, perhaps once a year, thus incurring additional costs and potentially leading to nonnegligible environmental problems.
By placing an artificial storm bar, the profile becomes unbalanced, and the nearshore nourishment widens and protects the beach and dune. With an artificial storm bar installed before a storm arrives, wave energy is reduced as the waves pass over. The larger waves break so that the energy of the waves reaching the swash zone is considerably reduced, decreasing erosion of the upper beach and the dune front. The same goal of protecting the upper beach and dune front can also be achieved through the installation of multifunctional artificial reefs, as below.

4.2. Adaptation Measures—Adaptive Management Process

We have to adapt to climate change because, otherwise, the negative impacts will be too great. In fact, adaptation is vital as implementing changes lessens the impact of flooding. By adaptation, an adjustment in natural or human systems in response to actual or expected climate changes or their impacts is intended, so as (1) to reduce harm and/or (2) to exploit beneficial opportunities.
Coastal adaptation is an ongoing and iterative process that will benefit from periodic evaluation of performance coupled with an adaptive management process to fine-tune implementation. According to [71,72], an adaptive management process consists of several steps, which are interconnected and basically follow the sequence shown in Figure 12.
Taking into account the local context, the key criteria for deciding the best adaptation option are:
  • Technical effectiveness
Will the adaptation option be effective in resolving problems arising from climate change, whilst also meeting current sustainable development objectives?
  • Costs
What is the cost of implementing and maintaining the adaptation measure over the projected lifetime?
  • Benefits
What are the types and magnitudes of benefits generated and that will benefit from the adaptation measure?
  • Implementation
Are there scientific and technical skills and financial capacity to design and implement the adaptation measure?
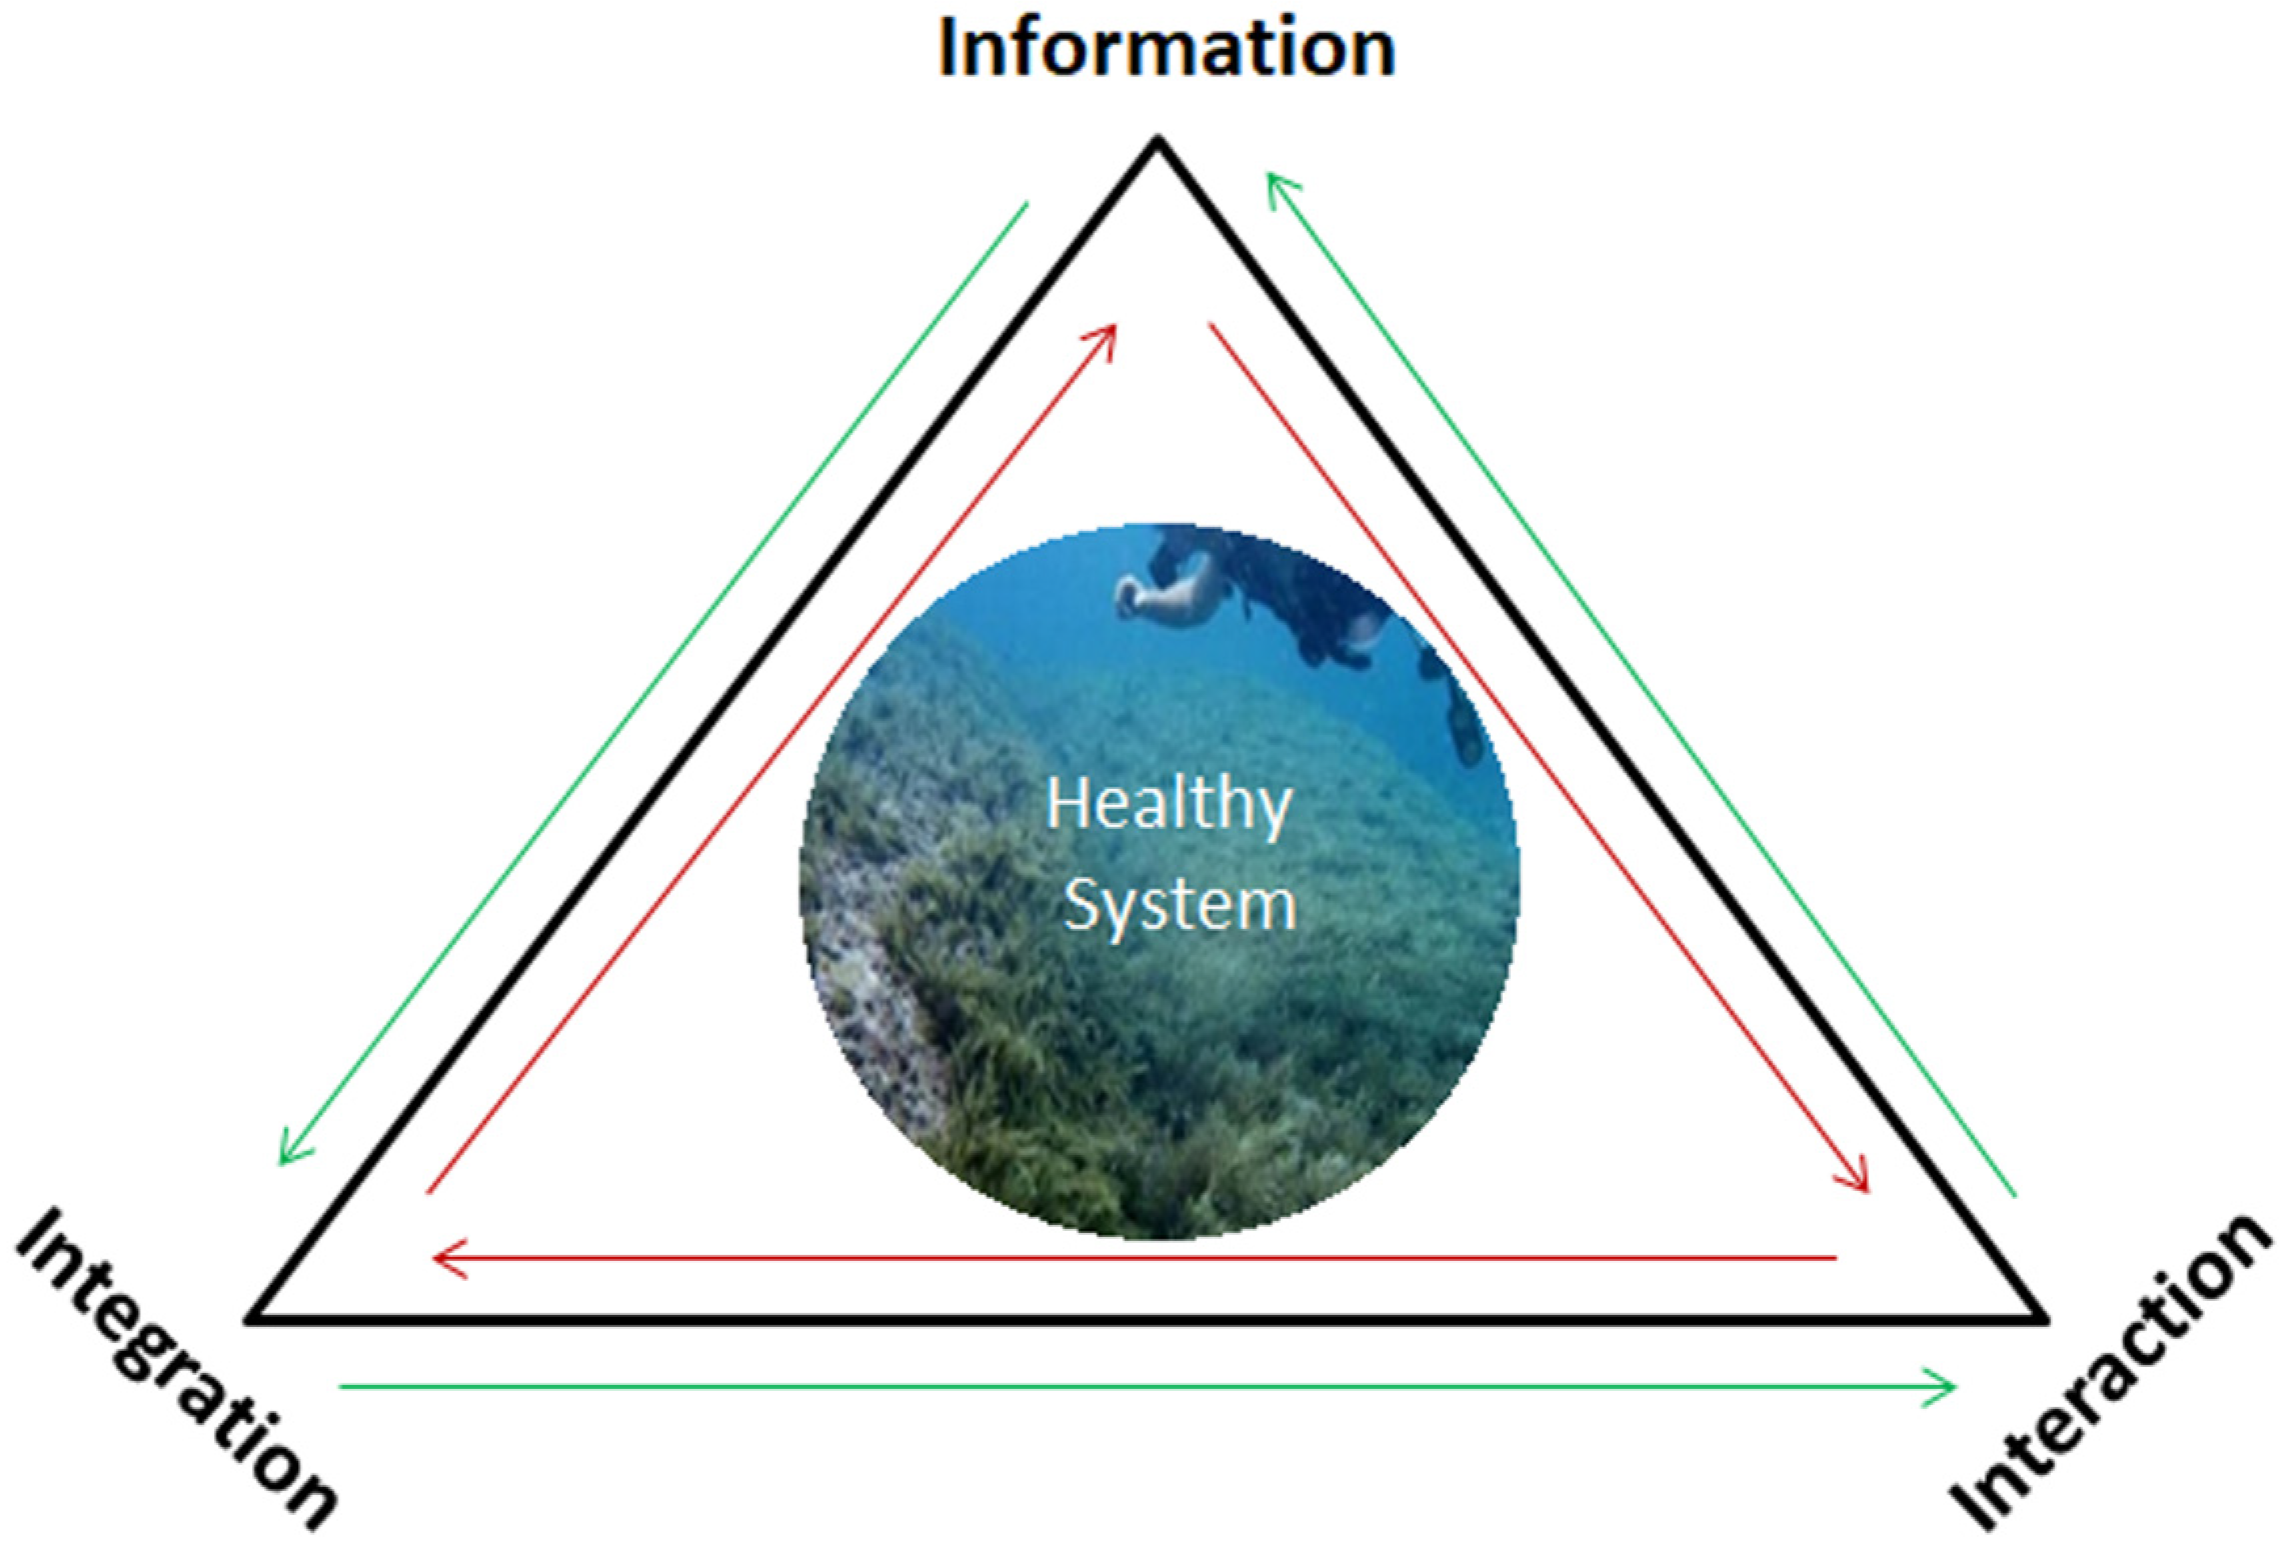
Furthermore, to be successful in decision making, the coastal manager must be aware of the duty to inform, integrate, and interact with all potential interested or affected parties, namely:
  • Public institutions (local, regional, national);
  • Technicians (engineers, geologists, biologists, economists, sociologists, lawyers, etc.);
  • Nongovernmental organizations;
  • Stakeholders;
  • Businesspeople;
  • Investors;
  • Residents;
  • Citizens, etc.
Additionally, coastal managers should be always available to discuss and respect all opinions. This means a relational procedure mainly based on three dimensions: information, integration, and interaction, as shown in Figure 13.
Throughout the process, it should be noted that implementing an adaptation measure (generally based on technological or engineering interventions) is not enough. It is equally important to equip individuals or groups with the ability to respond to and reduce harm from climate change.

4.3. Adaptation Strategies—Ecofriendly and Balanced Multipurpose Solutions

According to [73], coral reefs are home to over 25 percent of all marine life and are among the world’s most fragile and endangered ecosystems. However, although coral reefs are considered one of the most vulnerable ecosystems to climate change, they can in fact be strategic environments to mitigate some of the effects of this phenomenon. The ecosystem services of shoreline protection, for example, delivered by coral reefs all around the world can help tackle problems such as coastal erosion, flooding, and other processes intensified by climate change, as well as mean sea-level variations. Reguero et al. [74] showed how coral reefs can mitigate increasing flood damage through coastal protection services.
However, in addition to climate change, coral reefs face multiple stressors at different scales such as overfishing and water pollution. The most important cause of coral reefs degradation in shallow waters near shore is in fact the overexploitation of their resources, along with warmer atmospheric temperatures and increasing levels of carbon dioxide in seawater.
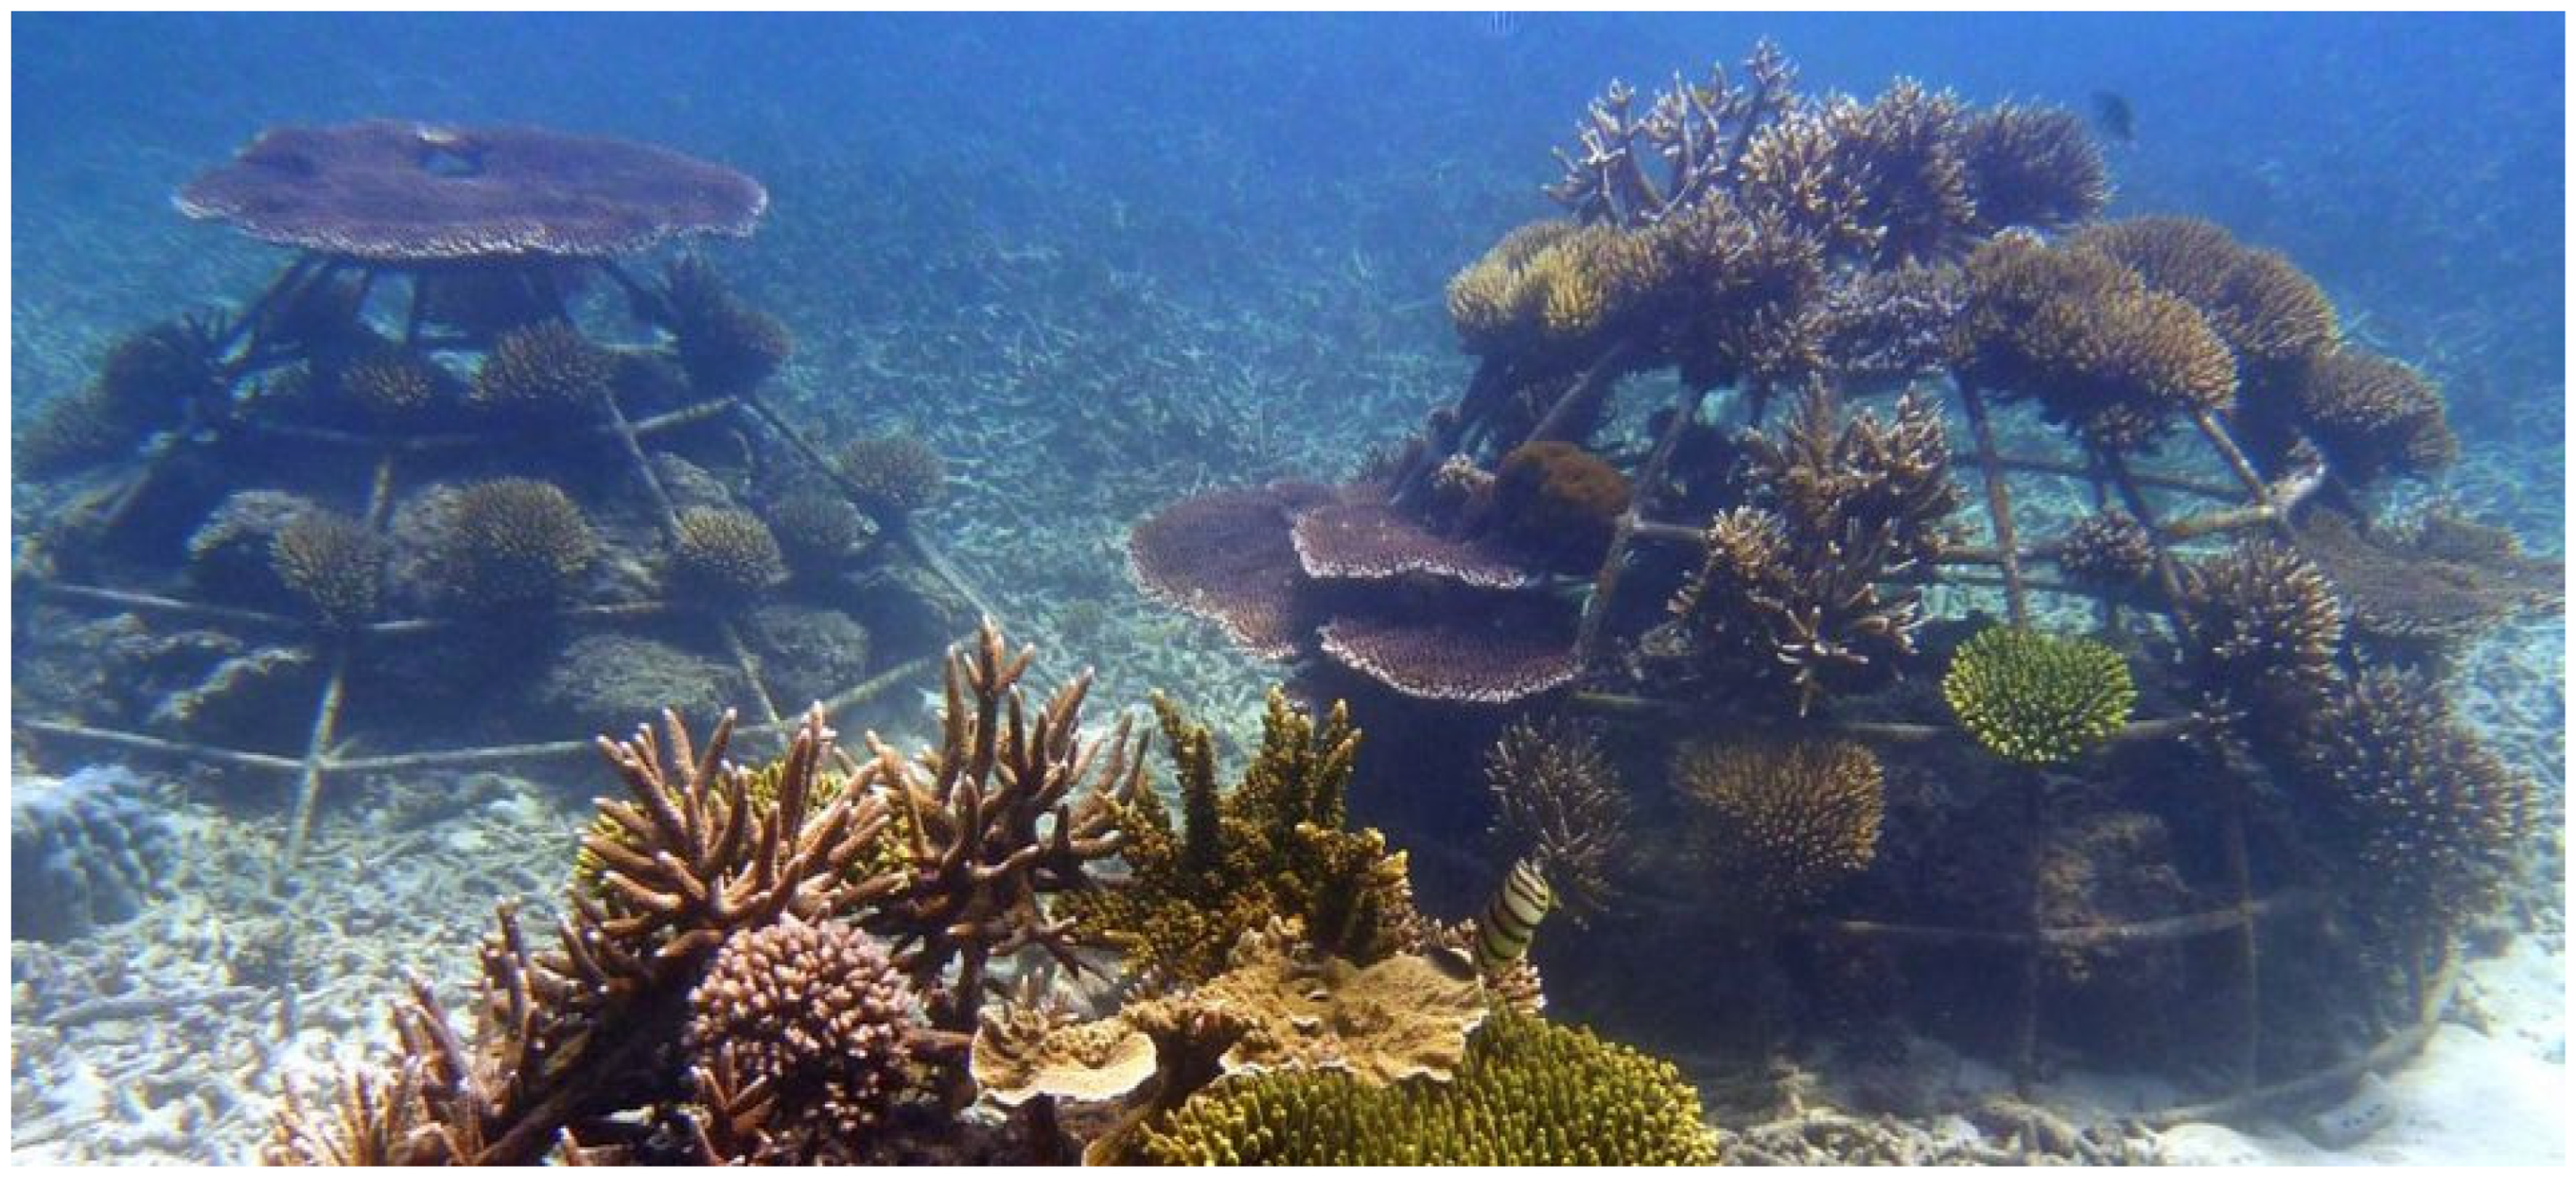
In the last few decades, mankind has destroyed over 35 million acres of coral reefs. According to several studies, if the present rate of destruction continues, 70–90% of the world’s coral reefs are expected to disappear within our lifetimes. Global climate change is really a major concern today. Comparing to natural coral reefs, artificial coral reefs (Figure 14) are usually more restricted in size, due to the cost of building them, whereas natural reefs are often spread over much wider areas.
As reported by [74], artificial coral reefs are often used to restore natural coral reefs worldwide. In general, they are made from a variety of natural or synthetic materials and constructed in very different shapes and styles. The purpose of these artificial coral reefs is generally to replicate what would be found on a natural reef.
A common type of submerged breakwater is made up of hemispherical hollow artificial reefs. Examples of that are the studies of the parameters that influence wave transmission through perforated hollow hemispherical shape artificial reefs presented in [76,77]. The influences of water depth, the height and period of the incident wave, and the configuration of the reef on wave transmission were investigated.
In [78] a hemispherical-shaped unit designed with many circular holes was presented and evaluated for its ability to attenuate surface waves in the coastal zone for coastal protection purposes. A semi-empirical formula was provided to predict the performance of this structure. An empirical expression for wave transmission in permeable submerged structures is also presented in [79].
Artificial reefs are built for the specific purpose of promoting an area’s marine life, which often happens in deep waters, or they are built for multifunctional purposes. In addition to increasing the environmental value of the area where they are constructed, artificial reefs constructed in intermediate and shallow water conditions can reduce incoming wave energy at the shoreline. They thereby protect the coastline behind breakwaters and can improve surfing possibilities [2,70,80].
Acting as physical barriers, these structures induce changes in the intensity and direction of the bottom current, water flow, and turbulence patterns, thus contributing to the enrichment of the water column and the attraction of fish. The turbulence generated promotes water oxygenation for the plants and animals that flourish and live in or are attracted to the area surrounding the structure. Furthermore, upwelling brings benthic waters from a nutrient-rich bottom to the surface, thereby increasing biological production [81,82].
In addition to providing several ecological functions, these structures also provide shelter for some species of fish and serve as a refuge against currents, waves, and predators. Therefore, as reported in [83,84], the many benefits that artificial reefs contribute to human communities include food, recreation, coastal protection, and many other ecological goods and services.
According to Yip [85], for reefs to fulfill all these aspects, adequate analyses of location, materials, equipment, labor, transport, and financing are essential. Equally important is the involvement of coastal communities to avoid possible conflicts of interest.
It is also important to keep in mind the need to monitor the natural and artificial ecological systems to understand their emerging behaviors, such as spatiotemporal evolution and extreme events, among others.
To overcome the negative effects of traditional hard engineering protections, submerged constructions such as multifunctional artificial reefs are increasingly popular. These constructions have some promising aspects: (i) they provide an unimpaired visual amenity; (ii) they can offer tourist and economic benefits by improving the surfing conditions; (iii) they can contribute to the enlargement of beaches; and (iv) they have environmental benefits by providing an excellent substrate for marine flora and the development of a diverse ecosystem [85,86,87].
To meet these performance aspects, the most suitable construction material for multifunctional artificial reefs is geotextile, used as sand containers or geotube systems. Numerical results of a submerged reef proposed to protect the dune system of Leirosa, Portugal, against erosion and increase the excellent existing conditions for surfing are shown in Figure 15.
However, these structures also have limitations that include the little experience of coastal engineering contractors in the use of sand-filled geotextiles, the low resistance of the geotextile fabric to mechanical damage, and the lack of design guidance of coastal structures using geotextiles. In addition to the low resistance of the geotextile material, the difficulties in installing the geotextile containers and the scouring process are the factors that most contribute to affect the overall strength of the structure [89].
Therefore, the development of innovative ecofriendly solutions to preserving ecosystems and contributing to coastal protection is of utmost importance. Such approaches seek to reinforce the benefits of traditional natural defenses such as beaches, natural dunes, and buffer zones.
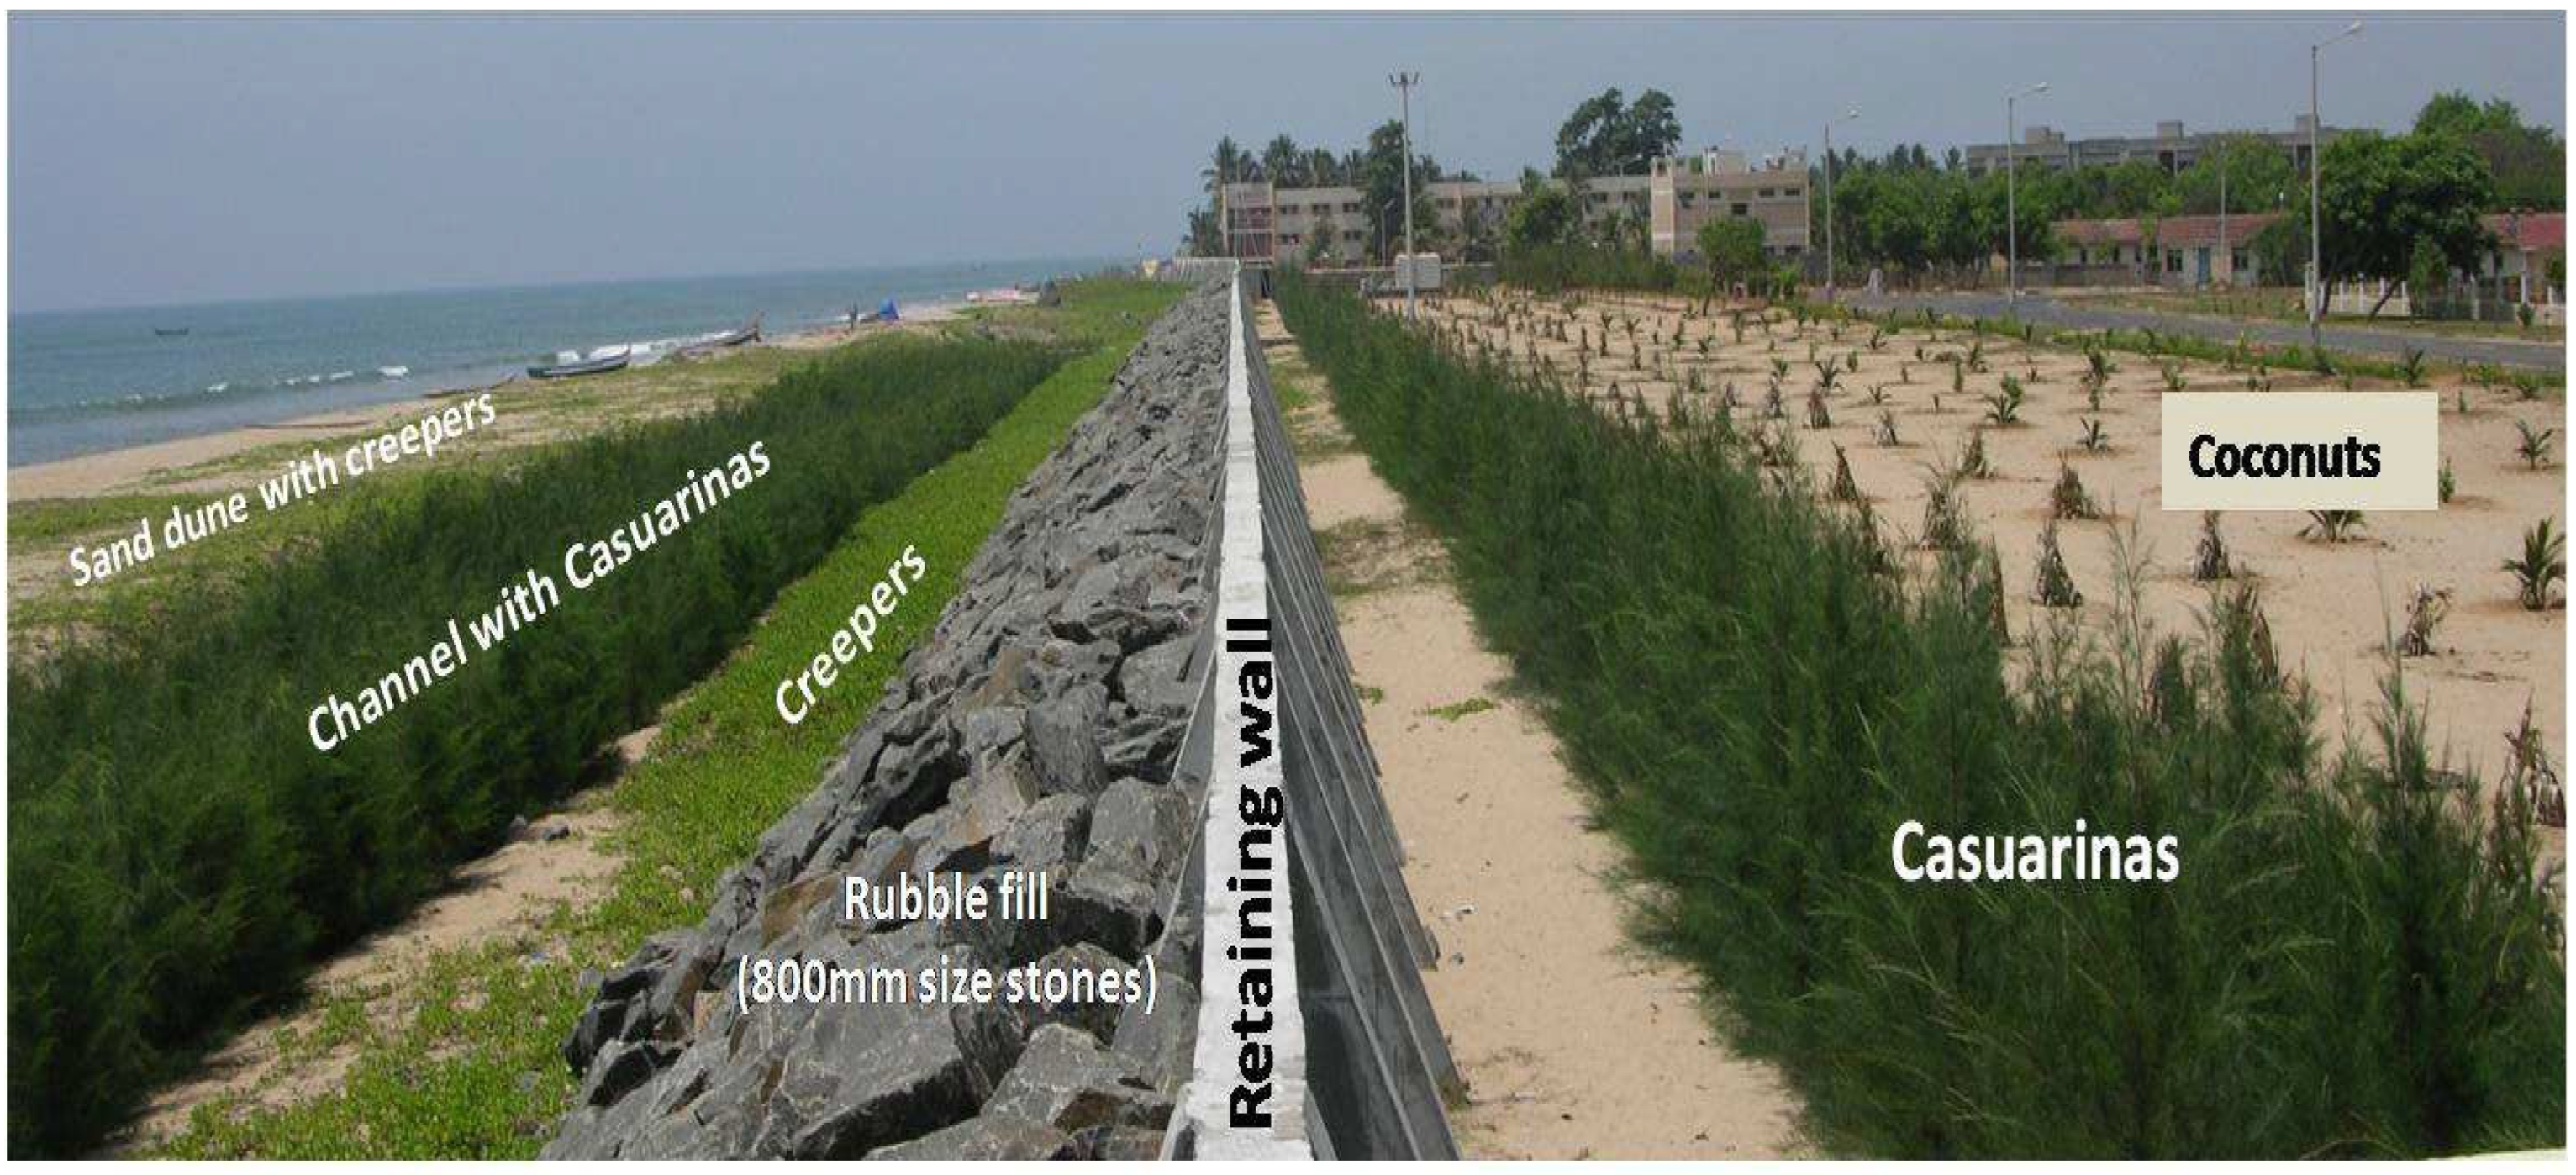
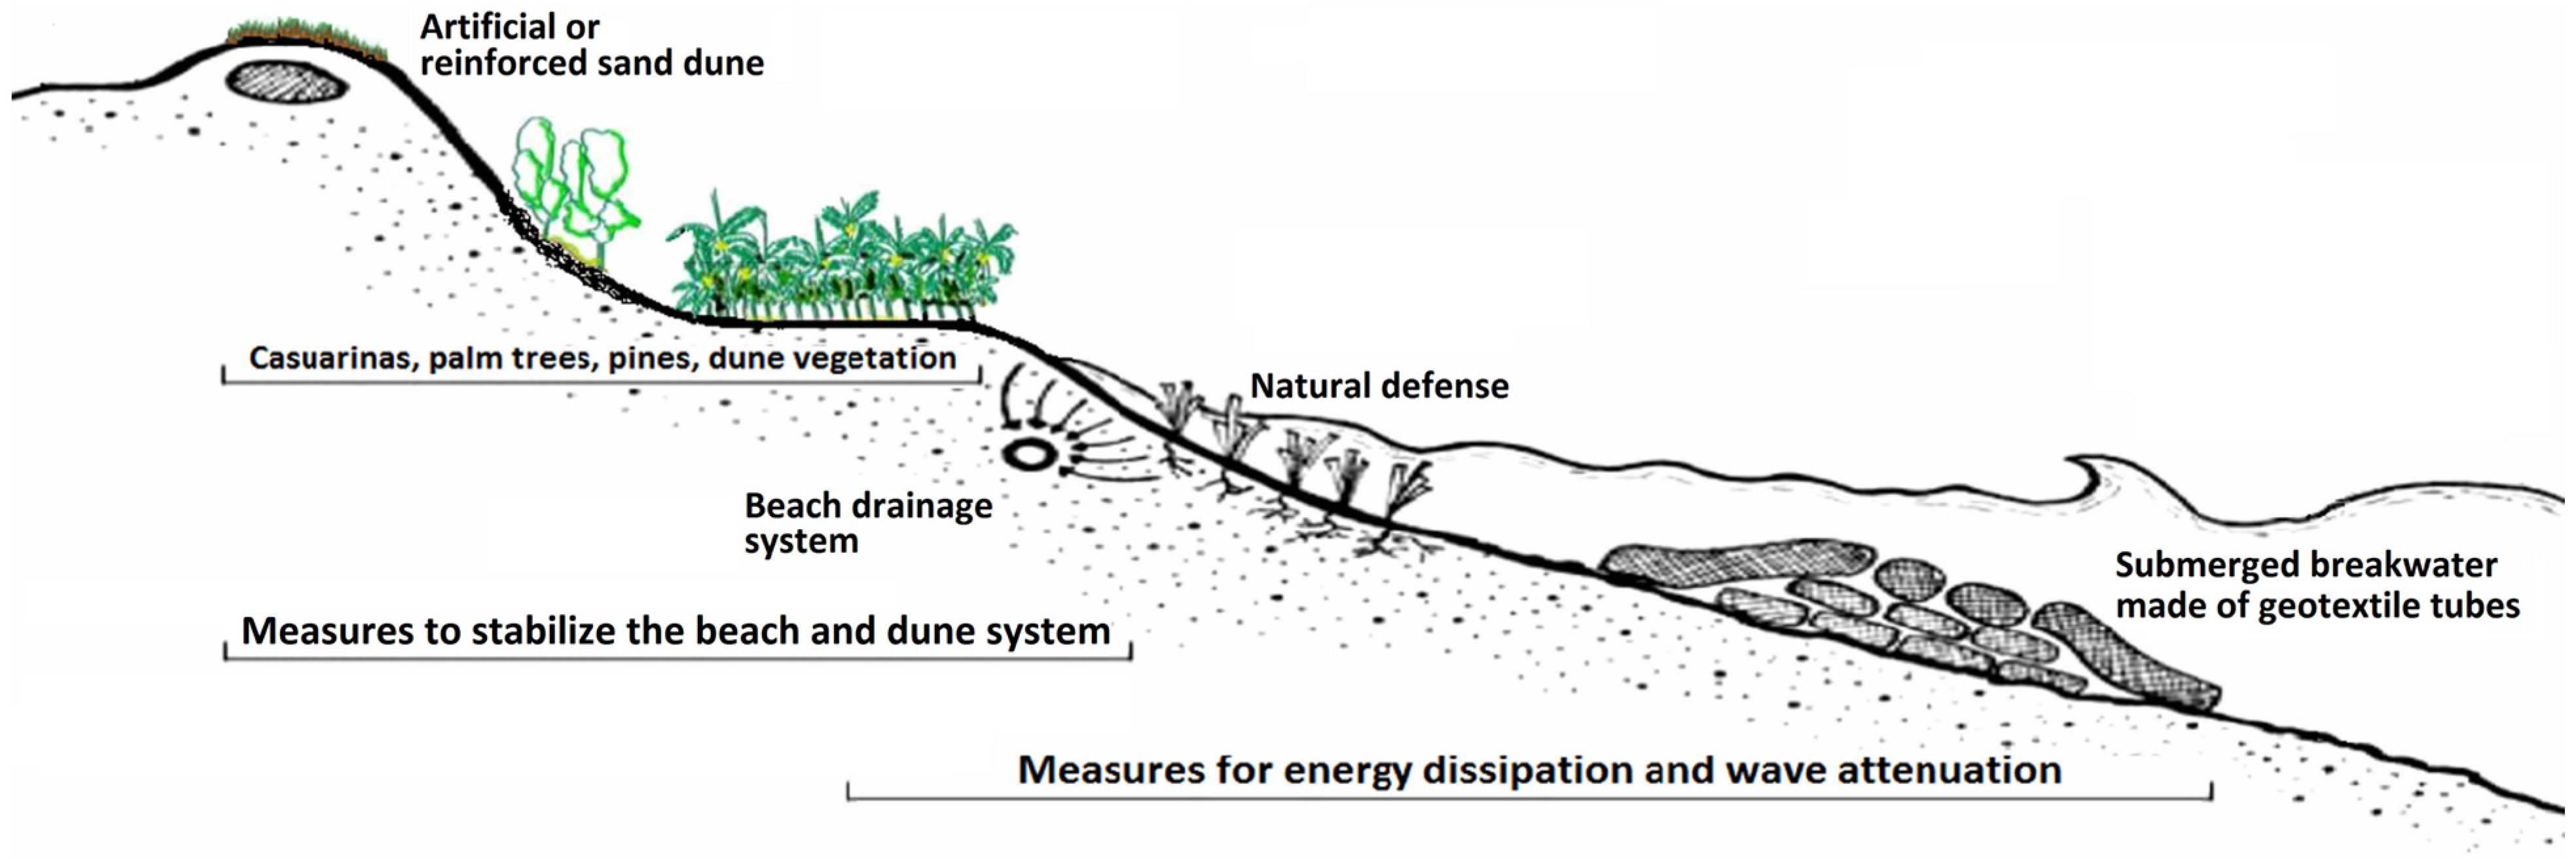
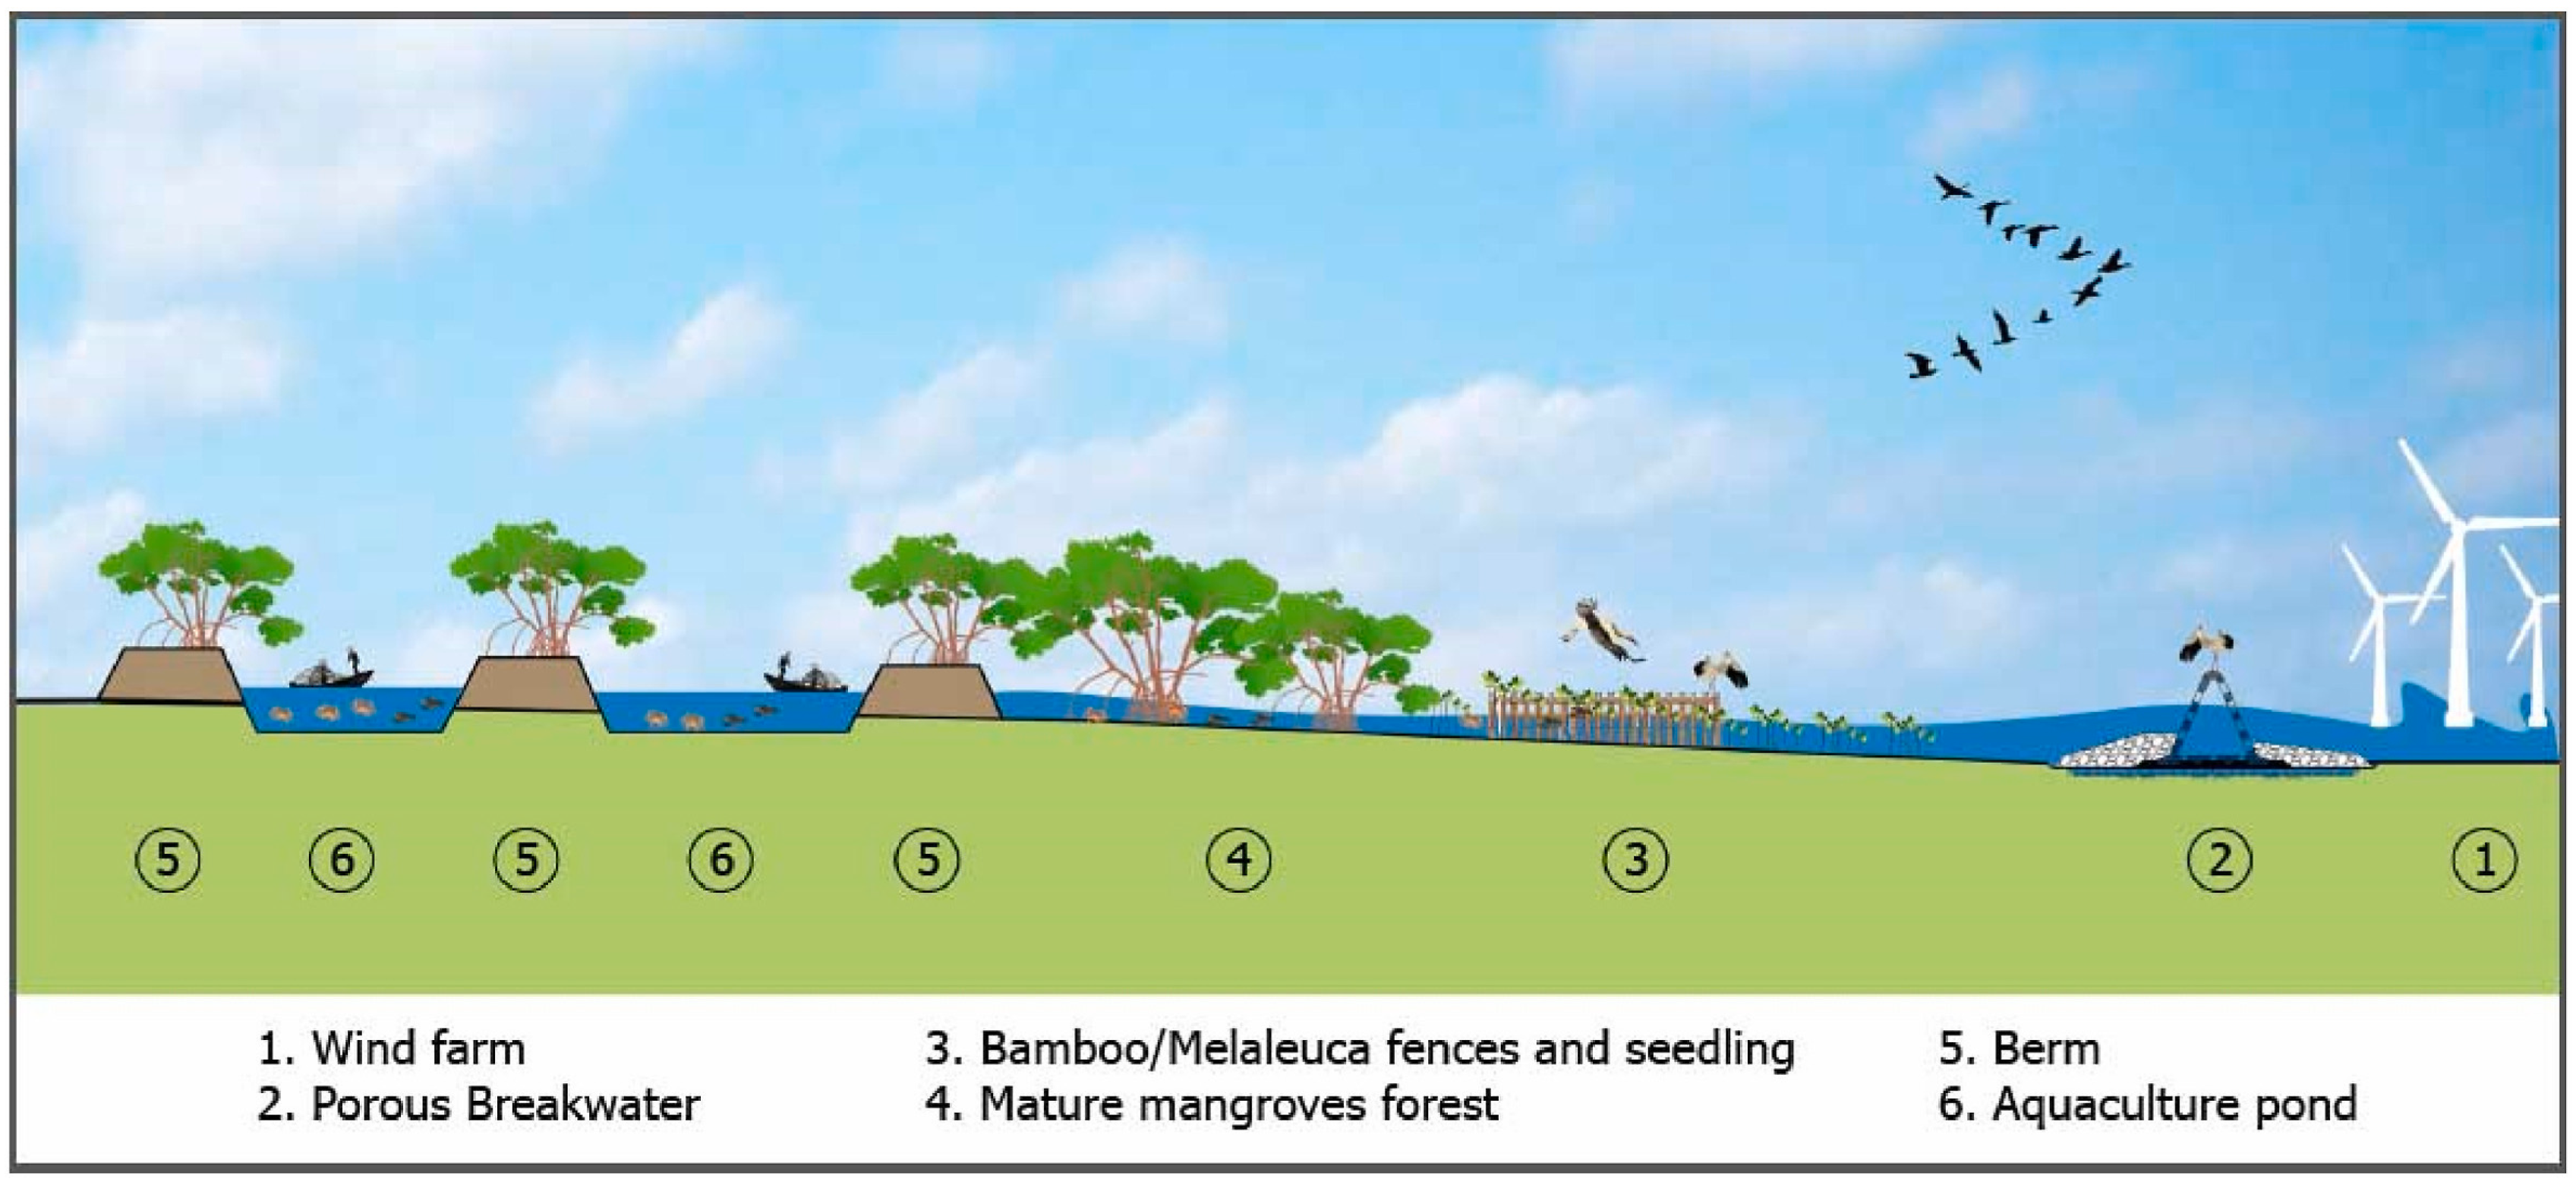
They are typically marketed as being characterized by lower environmental impacts, easier implementation, lower costs, and economic self-sustainability, and include natural or rehabilitated sand dunes (Figure 11), natural and man-made reefs (Figure 14 and Figure 15), hybrid solutions—buffer zones—multiple lines of defense (Figure 16), artificial dunes with wave attenuation and vegetation (Figure 17), wind farms with wave attenuation and aquaculture ponds (Figure 18), wind farms with wave attenuation (Figure 19).
Wave energy has the potential to alleviate the world’s reliance on depleting fossil energy resources. According to [92], one of the main problems associated with ocean wave energy is how to make energy generation economically viable.
One possible solution may consist of generating electricity from surface waves in the open sea, as it has a negligible environmental impact, minimizes the use of fossil fuels, and contributes to the reduction in wave energy on beach–dune systems.
Different approaches/systems have been successfully installed, some of which having the dual purpose of generating carbon-free energy and contributing to coastal erosion management [93,94]. This is the case of wave farms, such as inFigure 19.
Figure 19. Innovative approach, combined to maximize energy dissipation and wave attenuation, with the goal of producing energy and stabilizing the beach (adapted from Abanades et al. [93]).
Jmse 11 02113 g019
However, further studies are needed to determine the feasibility of such projects in specific areas, not only considering the effectiveness of the wave farm in mitigating coastal erosion, but also any other effects. As [92,93] also point out, it is important to evaluate potential negative effects, as may be the case in a popular coastal area with great potential for surfing. Reducing wave power and, consequently, wave height near the coast can have a negative impact on tourism and the region’s economy.

5. Discussion—Suitable Future Management for Decision Making

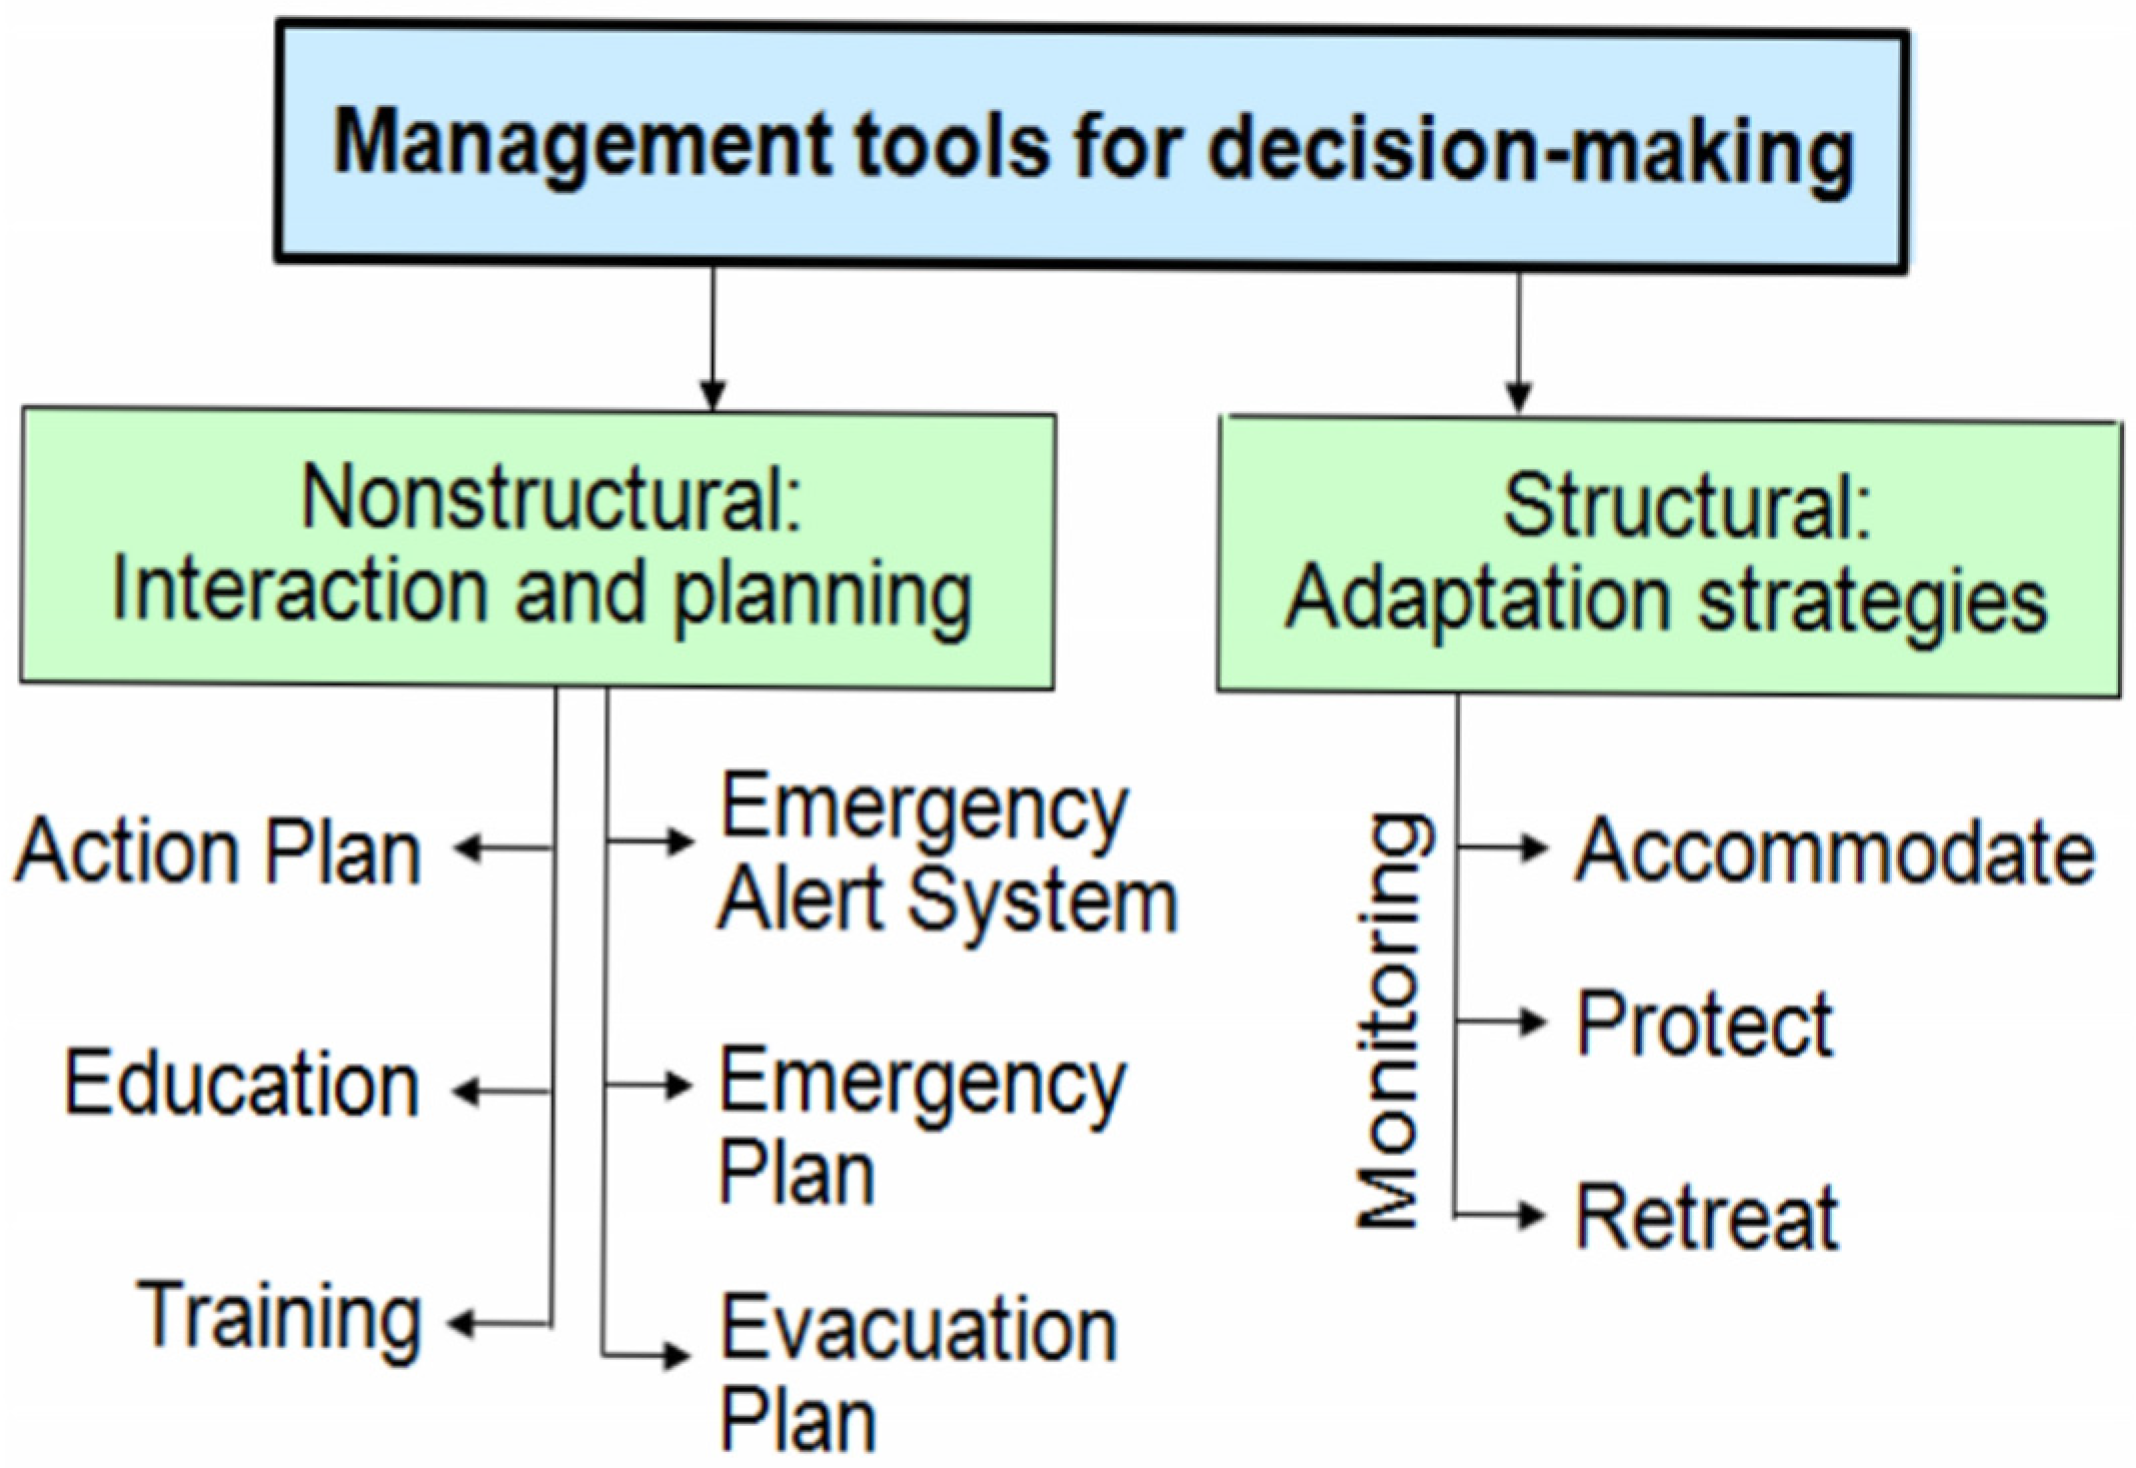
As reported in [3], appropriate management tools must be prepared and made available for decision making in any action that takes place in the coastal zone. Such tools are of various types and have different priority levels, which are summarized in Figure 20. There are nonstructural and structural options for adapting to sea level rise.
Nonstructural measures occur essentially at the level of education, training, and planning. These measures do not have a concrete physical form; rather, they require a good understanding of vulnerabilities and risks and knowledge of the actions to be taken. As shown in Figure 20, nonstructural measures are also understood as appropriate action plans, warning systems, and emergency and evacuation plans [3].
Structural measures have physical forms and are used to protect, accommodate, or transfer people and goods from current or future potentially dangerous conditions to safer locations. These adaptation measures must therefore be kept operational and consequently monitored throughout the lifetime for which they are designed.
Decision making concerning the implementation of the best adaptation option must be a function of the ability to respond to issues that arise for each of them, namely:
  • Accommodation accepting risk:
    • What is the risk?
    • Is the risk acceptable?
  • Protection at any cost:
    • What are the consequences?
    • Is soft protection enough?
    • How long is it safe?
  • Retreat to a safer place:
    • How long is it safer?
    • Are the costs acceptable and available?

6. Conclusions

Among the main conclusions, it is important to highlight the need for coastal managers to remain aware that the impact of global warming will create the need for other forms of adaptation and accommodation in coastal areas.
The development of ecofriendly solutions to preserve ecosystems and to address coastal processes as an alternative to traditional passive coastal protection structures (seawalls, groins, jetties, and breakwaters) is becoming increasingly important.
Likewise, to be successful, coastal managers must consider physical processes and a range of economic interests with relevance to citizens, local communities, and stakeholders in planning processes, and coastal protection and development projects.
We must keep in mind that human livelihoods will be affected by the chain effects of climate change, which will inevitably lead to irreversible conditions of unsustainability, especially in the second half of the current century. These effects will be felt with great intensity in coastal areas and will be caused mainly by processes that develop in the oceans and, to a large extent, are intensified by human action. Three challenges facing our understanding of natural hazards, comprising marine, coastal, and socioeconomic hazards, are underlined as follows:
Marine hazards—Oxygen is essential for life, and the oceans are a major contributor of oxygen to the earth’s atmosphere. A decline in the health of the seas and oceans due to pollution, overexploitation, and climate change impacts undermine the services they provide. The need to invest in effective monitoring and control procedures is increasingly urgent.
Coastal hazards—As long as sea levels continue to rise in response to global warming, increasing the height and strength of hard coastal defenses will not guarantee the protection of urban areas and territory for many years to come. Eco-friendly solutions to preserve ecosystems and to address coastal processes as an alternative to traditional coastal protection structures are becoming increasingly important.
Socioeconomic hazards—Human livelihoods will be affected by the chain effects of climate change, which will inevitably lead to irreversible conditions of unsustainability, especially in the second half of this century. Therefore, it is of utmost importance to act proactively, foreseeing, planning, and reducing the risks of disasters, in order to more effectively protect cultural heritage, socioeconomic assets, ecosystems, people’s health and livelihoods, and thus strengthen their resilience.
Three broad steps or changes needed to address natural hazards and achieve sustainable development goals are:
Education—it is imperative to warn, raise awareness, and incorporate knowledge about environmental sustainability, vulnerabilities and risks, and appropriate preventive measures into civic education campaigns and in training programs at different levels of education and vocational training.
Integration—the prevention of and reduction in exposure to hazards and vulnerability to disasters, as well as an increase in readiness for response and recovery, are achieved through the implementation of appropriate procedures and processes, harmoniously integrating the relevant economic, environmental, technological, social, cultural, political, and institutional measures.
Adaptation—Development measures that address the urgent need to transform human behavior into sustainable practices and take action to preserve coastal ecosystems and resilient seas and oceans should be implemented.
As a final recommendation, we suggest the use of new emerging materials and their arrangement in different solutions (hybrid, multiple layers, etc.) in order to produce ecosystems with ecological value and high efficiency in terms of coastal protection, among other possible aims. Such guidelines should make it possible to achieve the goals of increasing ecological, economic, tourist, and social gains. The need for science and solutions is more urgent than ever.

Funding

This research received no external funding.

Institutional Review Board Statement

Not applicable.

Informed Consent Statement

Not applicable.

Data Availability Statement

Not applicable.

Conflicts of Interest

The author declares no conflict of interest.

References

  1. EPA–United States Environmental Protection Agency. Climate Impacts on Coastal Areas 2017. Available online: https://19january2017snapshot.epa.gov/climate-impacts/climate-impacts-coastal-areas_.html (accessed on 21 August 2023).
  2. Antunes do Carmo, J.S. The changing paradigm of coastal management: The Portuguese case. Sci. Total Environ. 2019, 695, 133807. [Google Scholar] [CrossRef] [PubMed]
  3. Carmo, J.S.A.D. Climate Change, Adaptation Measures, and Integrated Coastal Zone Management: The New Protection Paradigm for the Portuguese Coastal Zone. J. Coast. Res. 2018, 34, 687–703. [Google Scholar] [CrossRef]
  4. Gibbs, M.T. Pitfalls in developing coastal climate adaptation responses. Clim. Risk Manag. 2015, 8, 1–8. [Google Scholar] [CrossRef]
  5. Seitz, R.D.; Wennhage, H.; Bergstrom, U.; Lipcius, R.N.; Ysebaert, T. Ecological value of coastal habitats for commercially and ecologically important species. ICES J. Mar. Sci. 2014, 71, 648–665. [Google Scholar] [CrossRef]
  6. Saengsupavanich, C.; Ratnayake, A.S.; Yun, L.S.; Ariffin, E.H. Current challenges in coastal erosion management for southern Asian regions: Examples from Thailand, Malaysia, and Sri Lanka. Anthr. Coasts 2023, 6, 15. [Google Scholar] [CrossRef]
  7. Cunha, J.; Cardona, F.S.; Bio, A.; Ramos, S. Importance of Protection Service Against Erosion and Storm Events Provided by Coastal Ecosystems Under Climate Change Scenarios. Front. Mar. Sci. 2021, 8, 726145. [Google Scholar] [CrossRef]
  8. Perricone, V.; Mutalipassi, M.; Mele, A.; Buono, M.; Vicinanza, D.; Contestabile, P. Nature-based and bioinspired solutions for coastal protection: An overview among key ecosystems and a promising pathway for new functional and sustainable designs. ICES J. Mar. Sci. 2023, 80, 1218–1239. [Google Scholar] [CrossRef]
  9. Airoldi, L.; Beck, M.W. Loss, Status and Trends for Coastal Marine Habitats of Europe. Oceanogr. Mar. Biol. Annu. Rev. 2007, 45, 345–405. [Google Scholar] [CrossRef]
  10. Pörtner, H.-O.; Roberts, D.C.; Masson-Delmotte, V.; Zhai, P.; Tignor, M.; Poloczanska, E.; Mintenbeck, K.; Alegría, A.; Nicolai, M.; Okem, A.; et al. (Eds.) IPCC: Summary for Policymakers. In IPCC Special Report on the Ocean and Cryosphere in a Changing Climate; Cambridge University Press: Cambridge, UK; New York, NY, USA, 2019; pp. 3–35. [Google Scholar] [CrossRef]
  11. Manno, G.; Anfuso, G.; Messina, E.; Williams, A.T.; Suffo, M.; Liguori, V. Decadal evolution of coastline armouring along the Mediterranean Andalusia littoral (South of Spain). Ocean Coast. Manag. 2016, 124, 84–99. [Google Scholar] [CrossRef]
  12. Sinay, L.; Carter, R.W. Climate Change Adaptation Options for Coastal Communities and Local Governments. Climate 2020, 8, 7. [Google Scholar] [CrossRef]
  13. Fagariba, C.J.; Song, S.; Baoro, S.K.G.S. Climate Change Adaptation Strategies and Constraints in Northern Ghana: Evidence of Farmers in Sissala West District. Sustainability 2018, 10, 1484. [Google Scholar] [CrossRef]
  14. Griggs, G.; Reguero, B.G. Coastal Adaptation to Climate Change and Sea-Level Rise. Water 2021, 13, 2151. [Google Scholar] [CrossRef]
  15. Cabana, D.; Röfer, L.; Evadzi, P.; Celliers, L. Enabling Climate Change Adaptation in Coastal Systems: A Systematic Literature Review. Earth’s Future 2023, 11, e2023EF003713. [Google Scholar] [CrossRef]
  16. Cochrane, K.L.; Rakotondrazafy, H.; Aswani, S.; Chaigneau, T.; Downey-Breedt, N. Tools to Enrich Vulnerability Assessment and Adaptation Planning for Coastal Communities in Data-Poor Regions: Application to a Case Study in Madagascar. Front. Mar. Sci. 2019, 5, 505. [Google Scholar] [CrossRef]
  17. Magnan, A.K.; Oppenheimer, M.; Garschagen, M.; Buchanan, M.K.; Duvat, V.K.E.; Forbes, D.L.; Ford, J.D.; Lambert, E.; Petzold, J.; Renaud, F.G.; et al. Sea level rise risks and societa adaptation benefts in low-lying coastal areas. Sci. Rep. 2022, 12, 10677. [Google Scholar] [CrossRef]
  18. Mehvar, S.; Filatova, T.; Dastgheib, A.; van Steveninck, E.R.; Ranasinghe, R. Quantifying Economic Value of Coastal Ecosystem Services: A Review. J. Mar. Sci. Eng. 2018, 6, 5. [Google Scholar] [CrossRef]
  19. EEA—European Environment Agency. What We Do. Available online: https://www.eea.europa.eu/en (accessed on 22 August 2023).
  20. USA TODAY. Available online: https://eu.usatoday.com/story/news/nation/2020/07/30/climate-change-coastal-flooding-cost-14-trillion-worldwide/5545712002/ (accessed on 23 August 2023).
  21. Gomes, M.P.; Pinho, J.L.; Carmo, J.S.A.D.; Santos, L. Hazard assessment of storm events for The Battery, New York. Ocean Coast. Manag. 2015, 118, 22–31. [Google Scholar] [CrossRef]
  22. Tamarin, T.; Kaspi, Y. The poleward shift of storm tracks under global warming: A Lagrangian perspective. Geophys. Res. Lett. 2017, 44, 10666–10674. [Google Scholar] [CrossRef]
  23. Liberato, M.L. The 19 January 2013 windstorm over the North Atlantic: Large-scale dynamics and impacts on Iberia. Weather Clim. Extrem. 2014, 5–6, 16–28. [Google Scholar] [CrossRef]
  24. Masselink, G.; Castelle, B.; Scott, T.; Dodet, G.; Suanez, S.; Jackson, D.; Floc’h, F. Extreme wave activity during 2013/2014 winter and morphological impacts along the Atlantic coast of Europe. Geophys. Res. Lett. 2016, 43, 2135–2143. [Google Scholar] [CrossRef]
  25. Lebbe, T.B.; Rey-Valette, H.; Chaumillon, E.; Camus, G.; Almar, R. Designing coastal adaptation strategies to tackle sea level rise. Front. Mar. Sci. 2021, 8, 740602. [Google Scholar] [CrossRef]
  26. Sutton-Grier, A.S.; Wowk, K.; Bamford, H. Future of our coasts: The potential for natural and hybrid infrastructure to enhance the resilience of our coastal communities, economies and ecosystems. Environ. Sci. Policy 2015, 51, 137–148. [Google Scholar] [CrossRef]
  27. Kim, T.; Baek, S.; Kwon, Y.; Lee, J.; Cha, S.M.; Kwon, S. Improved Coastal Erosion Prevention Using a Hybrid Method with an Artificial Coral Reef: Large-Scale 3D Hydraulic Experiment. Water 2020, 12, 2801. [Google Scholar] [CrossRef]
  28. Palinkas, C.M.; Orton, P.; Hummel, M.A.; Nardin, W.; Sutton-Grier, A.E. Innovations in Coastline Management With Natural and Nature-Based Features (NNBF): Lessons Learned From Three Case Studies. Front. Built. Environ. 2022, 8, 814180. [Google Scholar] [CrossRef]
  29. Mölter, T.; Schindler, D.; Albrecht, A.T.; Kohnle, U. Review on the Projections of Future Storminess over the North Atlantic European Region. Atmosphere 2016, 7, 60. [Google Scholar] [CrossRef]
  30. IPCC—Intergovernmental Panel on Climate Change. Special Report Emissions Scenarios 2000. Available online: https://www.ipcc.ch/site/assets/uploads/2018/03/sres-en.pdf (accessed on 24 August 2023).
  31. Lee, J.-Y.; Marotzke, J.; Bala, G.; Cao, L.; Corti, S.; Dunne, J.P.; Engelbrecht, F.; Fischer, E.; Fyfe, J.C.; Jones, C.; et al. Future Global Climate: Scenario-Based Projections and Near-Term Information. In Climate Change 2021: The Physical Science Basis. Contribution of Working Group I to the Sixth Assessment Report of the Intergovernmental Panel on Climate Change; Masson-Delmotte, V., Zhai, P., Pirani, A., Connors, S.L., Péan, C., Berger, S., Caud, N., Chen, Y., Goldfarb, L., Gomis, M., et al., Eds.; Cambridge University Press: Cambridge, UK; New York, NY, USA, 2021; pp. 553–672. [Google Scholar] [CrossRef]
  32. IPCC—Intergovernmental Panel on Climate Change. Climate Change 2023: Synthesis Report 2023. Summary for Policymakers. Available online: https://biodiv.mnhn.fr/news/2023-ipcc-synthesis-report-summary-policymakers (accessed on 22 August 2023).
  33. IPCC—Intergovernmental Panel on Climate Change. AR6 Synthesis Report: Climate Change 2023. Available online: https://www.ipcc.ch/report/ar6/syr/ (accessed on 22 August 2023).
  34. Simmons, A.J. Trends in the tropospheric general circulation from 1979 to 2022. Weather Clim. Dyn. 2022, 3, 777–809. [Google Scholar] [CrossRef]
  35. ESA—The European Space Agency. ESA Climate Office. Sea Level. Available online: https://climate.esa.int/en/projects/sea-level/ (accessed on 24 August 2023).
  36. The Royal Society. Climate Change Evidence & Causes. An Overview from the Royal Society and the US National Academy of Sciences, Update 2020. Available online: https://royalsociety.org/~/media/Royal_Society_Content/policy/projects/climate-evidence-causes/climate-change-evidence-causes.pdf (accessed on 24 August 2023).
  37. Sterr, H.; Klein, R.; Reese, S. Climate Change and Coastal Zones: An Overview of the State-of-the-Art on Regional and Local Vulnerability Assessment, Nota di Lavoro No. 38. 2000. Fondazione Eni Enrico Mattei (FEEM), Milan. Available online: https://www.econstor.eu/bitstream/10419/155092/1/NDL2000-038.pdf (accessed on 24 August 2023).
  38. Nicholls, R.J. Case Study on Sea-Level Rise Impacts. OECD Workshop on the Benefits of Climate Policy: Improving Information for Policy Makers 2003. Available online: https://www.oecd.org/env/cc/2483213.pdf (accessed on 25 August 2023).
  39. Lloyd-Smith, M.; Immig, J. Ocean Pollutants Guide: Toxic Threats to Human Health and Marine Life 2018. IPEN for a Toxics-Free Future. Available online: https://ipen.org/sites/default/files/documents/ipen-ocean-pollutants-v2_1-en-web.pdf (accessed on 25 August 2023).
  40. UNESCO—United Nations Educational, Scientific and Cultural Organization. Ocean Plastic Pollution an Overview: Data and Statistics. Available online: https://oceanliteracy.unesco.org/plastic-pollution-ocean/ (accessed on 24 August 2023).
  41. EIA—U.S. Energy Information and Administration. Trends in U.S. Oil and Natural Gas Upstream Costs. 2016. Available online: https://www.eia.gov/analysis/studies/drilling/pdf/upstream.pdf (accessed on 24 August 2023).
  42. Amaechi, C.V.; Reda, A.; Butler, H.O.; Ja’e, I.A.; An, C. Review on Fixed and Floating Offshore Structures. Part I: Types of Platforms with Some Applications. J. Mar. Sci. Eng. 2022, 10, 1074. [Google Scholar] [CrossRef]
  43. NOAA—National Oceanic Atmospheric Administration. Oil Spills. Available online: https://www.noaa.gov/education/resource-collections/ocean-coasts/oil-spills (accessed on 25 August 2023).
  44. Antunes do Carmo, J.S.; Pinho, J.S.; Vieira, J.P. Oil spills in coastal zones: Environmental impacts and practical mitigating solutions. In Proceedings of the 12th International Congress of the International Maritime Association of the Mediterranean, IMAM 2005—Maritime Transportation and Exploitation of Ocean and Coastal Resources, Lisboa, Portugal, 26–30 September 2005; Volume 2, pp. 1689–1696. [Google Scholar]
  45. ITOFT—International Tanker Owners Pollution Federation. Oil Tanker Spill Statistics 2022. Available online: https://www.itopf.org/knowledge-resources/data-statistics/statistics/ (accessed on 25 August 2023).
  46. NOAA—How Oil Harms Animals and Plants in Marine Environments. Available online: https://response.restoration.noaa.gov/oil-and-chemical-spills/oil-spills/how-oil-harms-animals-and-plants-marine-environments.html (accessed on 25 August 2023).
  47. Chen, X.; Bi, H.; Yue, R.; Chen, Z.; An, C. Effects of oil characteristics on the performance of shoreline response operations: A review. Front. Environ. Sci. 2022, 10, 1033909. [Google Scholar] [CrossRef]
  48. Haustein, K.; Allen, M.R.; Forster, P.M.; Otto, F.E.L.; Mitchell, D.M.; Matthews, H.D.; Frame, D.J. A real-time Global Warming Index. Sci. Rep. 2017, 7, 15417. [Google Scholar] [CrossRef]
  49. Hasselmann, K. Multi-pattern fingerprint method for detection and attribution of climate change. Clim. Dyn. 1997, 13, 601–611. [Google Scholar] [CrossRef]
  50. CCPI: Climate Change Performance Index. CCPI 2023: Ranking and Results. Available online: https://www.ccpi.org (accessed on 27 August 2023).
  51. Burck, J.; Uhlich, T.; Bals, C.; Hohne, N.; Nascimento, L.; Tavares, M.; Strietzel, E. Climate Change Performance Index 2023. Available online: https://ccpi.org/download/climate-change-performance-index-2023/ (accessed on 27 August 2023).
  52. EPA—United States Environmental Protection Agency. Climate Change Science. Future of Climate Change. Available online: https://climatechange.chicago.gov/climate-change-science/future-climate-change#Temperature (accessed on 26 August 2023).
  53. UCAR—University Corporation for Atmospheric Research. Predictions of Future Global Climate. Available online: https://scied.ucar.edu/learning-zone/climate-change-impacts/predictions-future-global-climate (accessed on 28 August 2023).
  54. Zhu, Q.; Zhang, Y.; Li, Z.; Yan, X.; Guan, Q.; Zhong, Y.; Zhang, L.; Li, D. Oil Spill Contextual and Boundary-Supervised Detection Network Based on Marine SAR Images. IEEE Trans. Geosci. Remote Sens. 2022, 60, 5213910. [Google Scholar] [CrossRef]
  55. Wang, D.; Wan, J.; Liu, S.; Chen, Y.; Yasir, M.; Xu, M.; Ren, P. BO-DRNet: An Improved Deep Learning Model for Oil Spill Detection by Polarimetric Features from SAR Images. Remote Sens. 2022, 14, 264. [Google Scholar] [CrossRef]
  56. Ma, X.; Xu, J.; Wu, P.; Kong, P. Oil Spill Detection Based on Deep Convolutional Neural Networks Using Polarimetric Scattering Information From Sentinel-1 SAR Images. IEEE Trans. Geosci. Remote Sens. 2022, 60, 1–13. [Google Scholar] [CrossRef]
  57. Dong, X.; Li, J.; Li, B.; Jin, Y.; Miao, S. Marine Oil Spill Detection from Low-Quality SAR Remote Sensing Images. J. Mar. Sci. Eng. 2023, 11, 1552. [Google Scholar] [CrossRef]
  58. Zafirakou, A.; Palantzas, G.; Samaras, A.; Koutitas, C. Oil Spill Modeling Aiming at the Protection of Ports and Coastal Areas. Environ. Process. 2015, 2 (Suppl. S1), S41–S53. [Google Scholar] [CrossRef]
  59. Inan, A. Modeling of Oil Pollution in Derince Harbor. J. Coast. Res. 2011, 64, 894–898. Available online: https://www.jstor.org/stable/26482302 (accessed on 27 August 2023).
  60. Cho, Y.-S.; Kim, T.-K.; Jeong, W.; Ha, T. Numerical Simulation of Oil Spill in Ocean. J. Appl. Math. 2012, 2012, e681585. [Google Scholar] [CrossRef]
  61. Wang, S.-D.; Shen, Y.-M.; Guo, Y.-K.; Tang, J. Three-dimensional numerical simulation for transport of oil spills in seas. Ocean Eng. 2008, 35, 503–510. [Google Scholar] [CrossRef]
  62. Iouzzi, N.; Ben Meftah, M.; Haffane, M.; Mouakkir, L.; Chagdali, M.; Mossa, M. Modeling of the Fate and Behaviors of an Oil Spill in the Azemmour River Estuary in Morocco. Water 2023, 15, 1776. [Google Scholar] [CrossRef]
  63. WEO—World Energy Outlook Special Report 2018. Available online: https://www.iea.org/reports/offshore-energy-outlook-2018 (accessed on 27 August 2023).
  64. Marine Insight. Understanding Oil Spill at Sea: Drills, Prevention and Methods of Cleanup. Available online: https://www.marineinsight.com/environment/what-is-an-oil-spill-at-sea/ (accessed on 29 August 2023).
  65. Kraus, N.C.; Dougal, W.G. The Effects of Seawalls on the Beach: Part I, An Updated Literature Review. J. Coast. Res. 1996, 12, 691–701. [Google Scholar]
  66. Dean, R.G.; Chen, R.; Browder, A.E. Full scale monitoring study of a submerged breakwater, Palm Beach, Florida, USA. Coast. Eng. 1997, 29, 291–315. [Google Scholar] [CrossRef]
  67. Granja, H.M.; Carvalho, G.S. Is the Coastline "Protection" of Portugal by Hard Engineering Structures Effective? J. Coast. Res. 2009, 11, 1229–1241. Available online: https://www.jstor.org/stable/4298426 (accessed on 27 August 2023).
  68. Schoonees, T.; Mancheño, A.G.; Scheres, B.; Bouma, T.J.; Silva, R.; Schlurmann, T.; Schüttrumpf, H. Hard Structures for Coastal Protection, Towards Greener Designs. Estuaries Coasts 2019, 42, 1709–1729. Available online: https://www.jstor.org/stable/48703231 (accessed on 27 August 2023). [CrossRef]
  69. DELOS. Environment Design of Low Crested Defence Structures. EU Fifth Framework Programme 1998–2002. Energy, Environment and Sustainable Development 2004. Available online: www.delos.unibo.it (accessed on 27 August 2023).
  70. Antunes do Carmo, J.S. Coastal Defenses and Engineering Works. In Encyclopedia of the UN Sustainable Development Goals; Springer: Cham, Switzerland, 2020. [Google Scholar] [CrossRef]
  71. Williams, B.K.; Szaro, R.C.; Shapiro, C.D. Adaptive Management. The U.S. Department of the Interior Technical Guide 2009 Edition. Available online: https://www.doi.gov/sites/doi.gov/files/uploads/TechGuide-WebOptimized-2.pdf (accessed on 29 August 2023).
  72. Williams, B.K.; Brown, E.D. Double-Loop Learning in Adaptive Management: The Need, the Challenge, and the Opportunity. Environ. Manag. 2018, 62, 995–1006. [Google Scholar] [CrossRef] [PubMed]
  73. Van Arsdale. Online Textbook, Chapter 10, Coral Reefs 2020. Available online: https://mrvanarsdale.com/marine-science/online-textbook/chapter-10-coral-reefs/ (accessed on 29 August 2023).
  74. Reguero, B.G.; Storlazzi, C.D.; Gibbs, A.E.; Shope, J.B.; Cole, A.D.; Cumming, K.A.; Beck, M.W. The value of US coral reefs for flood risk reduction. Nat. Sustain. 2021, 4, 688–698. [Google Scholar] [CrossRef]
  75. New Heaven. Artificial Reefs: What Works and What Doesn’t. Available online: https://newheavenreefconservation.org/marine-blog/147-artificial-reefs-what-works-and-what-doesn-t (accessed on 29 August 2023).
  76. Armono, H.D.; Hall, K.R. Wave transmission on submerged breakwaters made of hollow hemispherical shape artificial reefs. In Proceedings of the Annual Conference—Canadian Society for Civil Engineering, Moncton, NB, Canada, 4 June 2003; pp. 313–322. [Google Scholar]
  77. Buccino, M.; Del Vita, I.; Calabrese, M. Predicting wave transmission past Reef Ballsubmerged breakwaters. J. Coast. Res. 2013, 65, 171–176. [Google Scholar] [CrossRef]
  78. Srisuwan, C.; Rattanamanee, P. Modeling of Seadome as artificial reefs for coastal wave attenuation. Ocean Eng. 2015, 103, 198–210. [Google Scholar] [CrossRef]
  79. van Gent, M.R.; Buis, L.; Bos, J.P.V.D.; Wüthrich, D. Wave transmission at submerged coastal structures and artificial reefs. Coast. Eng. 2023, 184, 104344. [Google Scholar] [CrossRef]
  80. Reguero, B.G.; Beck, M.W.; Agostini, V.N.; Kramer, P.; Hancock, B. Coral reefs for coastal protection: A new methodological approach and engineering case study in Grenada. J. Environ. Manag. 2018, 210, 146–161. [Google Scholar] [CrossRef]
  81. Gomes, A.; Pinho, J.L.S.; Valente, T.; do Carmo, J.S.A.; Hegde, A. Performance Assessment of a Semi-Circular Breakwater through CFD Modelling. J. Mar. Sci. Eng. 2020, 8, 226. [Google Scholar] [CrossRef]
  82. Shu, A.; Qin, J.; Rubinato, M.; Sun, T.; Wang, M.; Wang, S.; Wang, L.; Zhu, J.; Zhu, F. An Experimental Investigation of Turbulence Features Induced by Typical Artificial M-Shaped Unit Reefs. Appl. Sci. 2021, 11, 1393. [Google Scholar] [CrossRef]
  83. Harris, L.E. Artificial Reefs for Ecosystem Restoration and Coastal Erosion Protection with Aquaculture and Recreational Amenities. Reef J. 2009, 1, 235–246. Available online: https://www.thereefjournal.com/files/18._Harris.pdf (accessed on 30 August 2023).
  84. Hoegh-Guldberg, O.; Poloczanska, E.S.; Skirving, W.; Dove, S. Coral Reef Ecosystems under Climate Change and Ocean Acidification. Front. Mar. Sci. 2017, 4, 158. [Google Scholar] [CrossRef]
  85. Yip, M. An Overview of Artificial Reefs, Advantages and Disadvantages of Artificial Reefs Design, Material and Concepts of Realization around the Globe 1998. Available online: https://biophysics.sbg.ac.at/ar/reef.htm (accessed on 30 August 2023).
  86. Voorde, M.T.; Carmo, J.S.A.D.; Neves, M.G. Designing a Preliminary Multifunctional Artificial Reef to Protect the Portuguese Coast. J. Coast. Res. 2009, 25, 69–79. [Google Scholar] [CrossRef]
  87. López, I.; Tinoco, H.; Aragonés, L.; García-Barba, J. The multifunctional artificial reef and its role in the defence of the Mediterranean coast. Sci. Total Environ. 2016, 550, 910–923. [Google Scholar] [CrossRef]
  88. Mendonça, A.; Fortes, C.J.; Capitão, R.; Neves, M.d.G.; Moura, T.; Carmo, J.S.A.D. Wave hydrodynamics around a multi-functional artificial reef at Leirosa. J. Coast. Conserv. 2012, 16, 543–553. [Google Scholar] [CrossRef]
  89. Carmo, J.A.D.; Reis, C.S.; Freitas, H. Working with Nature by Protecting Sand Dunes: Lessons Learned. J. Coast. Res. 2010, 26, 1068–1078. [Google Scholar] [CrossRef]
  90. Cummings, P.; Gordon, A.; Lord, D.; Mariani, A.; Nielsen, L.; Panayotou, K.; Rogers, M.; Tomlinson, R. Climate change adaptation guidelines in coastal management and planning. In The National Committee on Coastal and Ocean Engineering 2012; Engineers Australia: Crows Nest, Australia; ISBN 9780858259591. (ebook:pdf).
  91. Le Xuan, T.; Ba, H.T.; Thanh, V.Q.; Wright, D.P.; Tanim, A.H.; Anh, D.T. Evaluation of coastal protection strategies and proposing multiple lines of defense under climate change in the Mekong Delta for sustainable shoreline protection. Ocean Coast. Manag. 2022, 228, 106301. [Google Scholar] [CrossRef]
  92. Blackledge, J.; Coyle, E.; Kearney, E.; McGuirk, D.; Norton, B. Estimation of wave energy from wind velocity. IAENG Eng. Lett. 2013, 4, 158–170. [Google Scholar] [CrossRef]
  93. Abanades, J.; Flor-Blanco, G.; Flor, G.; Iglesias, G. Dual wave farms for energy production and coastal protection. Ocean Coast. Manag. 2018, 160, 18–29. [Google Scholar] [CrossRef]
  94. Rodriguez-Delgado, C.; Bergillos, R.J.; Ortega-Sánchez, M.; Iglesias, G. Wave farm effects on the coast: The alongshore position. Sci. Total Environ. 2018, 640–641, 1176–1186. [Google Scholar] [CrossRef] [PubMed]
Figure 1. On climate change—coastal flooding—Hurricane Sandy flooded the New Jersey shoreline in 2012 [20] (accessed 23 August 2023).
Jmse 11 02113 g001
Figure 2. Storms in the Atlantic North—number of named storms and hurricanes in the Atlantic Ocean per year between 1851 and 2010 (adapted from [3]). The blue line clearly reflects the significant increase in the number of storms that have occurred since the mid-1990s.
Jmse 11 02113 g002
Figure 3. Global surface temperature change increase, relative to present day (1995–2014) and the approximation to pre-industrial (1850–1900) (adapted from Lee et al. [31]).
Jmse 11 02113 g003
Figure 4. Global mean sea level change relative to 1900 under scenarios SSP1-1.9 and SSP5-8.5 (adapted from IPCC [33]).
Jmse 11 02113 g004
Figure 5. Photo of a Galician beach (Spain) after the Prestige tanker accident on 13 November 2002 [44].
Jmse 11 02113 g005
Figure 6. Global warming index (GWI) from January 1950 to May 2017. The orange color shows the human-induced contribution and the blue color represents the solar and volcanic contributions. The light red line shows the combined temperature change caused by external factors and the dark red line represents the evolution of the global warming index when using only temperature data and past human-caused data (adapted from [48]).
Jmse 11 02113 g006
Figure 7. Main components of the information system (adapted from [44]).
Jmse 11 02113 g007
Figure 8. Lagrangian versus Eulerian mathematical descriptions. Fuel oil mass evolution on the sea surface after the N/T Prestige accident on 22, 24, and 26 November 2002.
Jmse 11 02113 g008
Figure 9. Oil Boom oil spill—composed of three parts: freeboard, skirt, and cable or chain [64]. Surface-controlled net for collecting the crude and oil adsorbing elements.
Jmse 11 02113 g009
Figure 10. Types of seawalls and a groin used to protect the urban front of Esmoriz and Cortegaça (Portugal).
Jmse 11 02113 g010
Figure 11. Leirosa sand dune system: artificial reconstruction of the sand dunes followed by re-vegetation with Ammophila arenaria [70].
Jmse 11 02113 g011
Figure 12. Adaptive management process (adapted from [71,72]).
Jmse 11 02113 g012
Figure 13. Three key dimensions for the success of integrated coastal zone management (adapted from [3]).
Jmse 11 02113 g013
Figure 14. Types of artificial coral reefs (adapted from New Heaven [75]).
Jmse 11 02113 g014
Figure 15. Submerged protection. Innovative approach, combined to maximize energy dissipation and wave attenuation, with the goal of stabilizing the beach, generate surfing waves, diving, sport fishing, and bathing [2]. Wave heights and wave breaking line around the reef area (reef angle = 45°; wave height H = 1.5 m; period T = 9.0 s) (adapted from [2,70,87,88]).
Jmse 11 02113 g015
Figure 16. Emerging protection. Buffer zones with increased efficiency by building layers with different goals (adapted from Google—anonymous).
Jmse 11 02113 g016
Figure 17. Hybrid protection. Innovative approach, combined to maximize energy dissipation and wave attenuation, with the goal of stabilizing the beach and the dune system (adapted from [70,90]).
Jmse 11 02113 g017
Figure 18. Innovative approach, combined to maximize energy dissipation and wave attenuation, with a goal for aquaculture and fisheries (adapted from Xuan et al. [91]).
Jmse 11 02113 g018
Figure 20. Nonstructural and structural measures that are currently used for decision making in coastal areas (adapted from [3]).
Jmse 11 02113 g020
Disclaimer/Publisher’s Note: The statements, opinions and data contained in all publications are solely those of the individual author(s) and contributor(s) and not of MDPI and/or the editor(s). MDPI and/or the editor(s) disclaim responsibility for any injury to people or property resulting from any ideas, methods, instructions or products referred to in the content.