Article

Evolution and Statistical Analysis of Internal Random Wave Fields within the Benjamin–Ono Equation

by
Marcelo V. Flamarion
1,*,† and
Efim Pelinovsky
2,3,†
1
Unidade Acadêmica do Cabo de Santo Agostinho, UFRPE/Rural Federal University of Pernambuco, BR 101 Sul, Cabo de Santo Agostinho 54503-900, PE, Brazil
2
Institute of Applied Physics, 46 Uljanov Str., 603155 Nizhny Novgorod, Russia
3
Faculty of Informatics, Mathematics and Computer Science, HSE University, 603155 Nizhny Novgorod, Russia
*
Author to whom correspondence should be addressed.
These authors contributed equally to this work.
J. Mar. Sci. Eng. 2023, 11(10), 1853; https://doi.org/10.3390/jmse11101853
Submission received: 4 August 2023 / Revised: 19 September 2023 / Accepted: 21 September 2023 / Published: 23 September 2023
(This article belongs to the Special Issue Nonlinear Hydrophysics and Forecasting of Natural Disasters)

Abstract

:
This study investigates the numerical evolution of an initially internal random wave field characterized by a Gaussian spectrum shape using the Benjamin–Ono (BO) equation. The research focuses on analyzing various properties associated with the random wave field, including the transition to a steady state of the spectra, statistical moments, and the distribution functions of wave amplitudes. Numerical simulations are conducted across different Ursell parameters, revealing intriguing findings. Notably, it is observed that the spectra of the wave field converge to a stationary state in a statistical sense, while exhibiting statistical characteristics that deviate from a Gaussian distribution. Moreover, as the Ursell parameter increases, the positive skewness of the wave field intensifies, and the kurtosis increases. The investigation also involves the computation of the probability of rogue wave formation, revealing deviations from the Rayleigh distribution. Notably, the study uncovers distinct types of internal rogue waves, specifically referred to as the “two sisters” and “three sisters” phenomena.

1. Introduction

Ocean internal waves are fascinating phenomena characterized by underwater oscillations with amplitudes ranging from 50 to 100 m, and sometimes even more [1,2,3]. These waves are generated when there is a disturbance at the interface between water layers of varying densities. This disturbance can propagate over vast distances, causing the layers to oscillate in relation to their initial equilibrium state. One of the main causes of internal waves is the deterministic mechanism triggered by tidal flows interacting with bathymetric features like seamounts or continental shelves; other mechanisms may include instability of ocean currents in zones with strong shear flow (such as an ocean gulf), or directly by wind stress [4]. This phenomenon is commonly referred to as an internal tide. As the tides flow over these underwater obstacles, they create disturbances that propagate as internal waves throughout the ocean. In addition to deterministic mechanisms, internal waves can also be excited by random events such as tsunamis or severe ocean storms. These powerful and unpredictable phenomena have the ability to generate significant disturbances in the ocean, leading to the formation of large-scale internal waves.
Extensive research has been conducted to investigate weakly nonlinear models that depict the behavior of internal waves. Notably, the Korteweg–de Vries (KdV) equation and the Gardner equation have received significant attention in this regard [4,5,6]. The KdV and Gardner equations are applicable to shallow water scenarios, while the Intermediate Long Wave (ILW) equation is suitable for fluids of finite depth [7,8,9]. Additionally, the Benjamin–Ono (BO) equation pertains to deep water dynamics [7,10,11,12,13,14,15,16,17]. These well-established models exhibit intriguing features, such as the existence of periodic and solitary wave solutions that endure over time. However, it is crucial to acknowledge that these model equations have inherent limitations that constrain their applicability to more generalized problems.
The widely recognized Benjamin–Ono (BO) equation [7,11]
η τ + c 0 η y 3 c 0 2 h 1 η η y + c 0 h 1 2 ρ r H [ η y y ] = 0
is frequently employed to examine the behavior of a perturbed interface between two inviscid fluids. This interface is characterized by a flat rigid lid and infinite depth. In this equation, various parameters and functions play important roles. The thickness of the upper fluid layer with density ρ 1 is represented by h 1 , while ρ 2 denotes the density of the lower fluid. The ratio of densities between the lighter upper layer and the heavier lower layer is denoted as ρ r = ρ 1 / ρ 2 < 1 . The linear speed c 0 is [7,11]
c 0 2 = g h 1 1 ρ r 1 ,
where g is the acceleration of gravity. More details of the geometry of the problem are depicted in Figure 1. The elevation of the interface in the position y and time τ is denoted by η ( y , τ ) , and H denotes the Hilbert transform defined as [7,11]
H [ η ( y , τ ) ] = 1 π + η ( z , τ ) z y d z .
The BO equation is used to model several problems such as ship wakes, flow of water over rocks, the formation of storms in the ocean, and even atmospheric problems such as atmospheric flows encountering obstacles [18,19]. These problems are typically approached as deterministic, where the initial state of the perturbed interface is precisely known, and the evolution of the phenomenon over time can be computed using the BO equations. However, in many cases, the scarcity of data for initializing deterministic models presents a challenge. In such instances, assuming random initial states becomes preferable, allowing for the study and formulation of statistically reliable predictions [20,21,22,23,24]. Analogously, the medium in which a wave propagates can also be considered random [25,26,27,28]. This approach is commonly employed to investigate rogue waves, which are characterized as large waves that abruptly emerge within the wave field. Rogue waves are characterized by their exceptionally high wave heights and their abrupt appearance. The physical mechanisms behind their formation can be attributed to two primary factors: dispersion compression and geometric focusing. Dispersion compression arises due to the varying propagation speeds of waves with different wavelengths. In essence, waves of different lengths move at different speeds, causing them to temporarily converge and create a rogue wave. Geometric focusing, on the other hand, occurs when multiple wave systems converge from different directions, amplifying their combined effect and giving rise to rogue waves. Additionally, changes in environmental conditions, such as variable water depth and strong, non-uniform currents, can contribute to the concentration of energy within surface waves [29,30,31]. Rogue waves have been extensively catalogued, and they have been shown to pose a significant threat to coastal areas, often causing substantial damage. To ensure the safety of both small boats navigating in shallow waters and people on the shoreline, in-depth investigations into rogue wave phenomena, including the study of their lifetimes (as indicated by Didenkulova and Pelinovsky [32]), are essential. Rogue waves have been part of maritime folklore for centuries, but their systematic measurement only began in the mid-20th century. This measurement process involves recording the displacement of the water–air interface at specific measurement points, utilizing various equipment such as floating moored buoys, laser altimeters mounted on platforms, or overpressure sensors located on the seabed. The first digitally documented instance of a rogue wave, famously known as the ”Draupner wave,” was recorded on 1 January 1995, at the Draupner platform in the North Sea. This rogue wave reached an astounding maximum wave height of 25.6 m and caused minor damage to the platform, which was situated high above sea level. Understanding the dynamics of rogue waves is crucial for enhancing maritime safety and improving the design of marine platforms. Although rogue waves are typically associated with large surface waves, they can also manifest within internal waves [5]. However, detecting these internal rogue waves with the naked eye can be challenging, and they occasionally induce distinct surface responses. In general, internal waves exhibit higher amplitudes compared to surface waves. A rogue internal wave can unexpectedly displace less dense water beneath a neutrally buoyant submarine, causing it to descend to depths beyond the hull’s pressure capacity. These waves maintain well-defined patterns as they propagate along the interface, in contrast to the more chaotic nature of turbulence.
In the context of surface waves, the study conducted by Pelinovsky and Sergeeva [22] focused on numerically examining the evolution of an initially random wave field with a Gaussian spectrum shape using the KdV equation. Their findings revealed that the irregular wave field, resulting from the wave evolution within the KdV model, does not adhere to Gaussian statistics. Instead, its statistical properties are influenced by the Ursell parameter, which represents the ratio of nonlinear effects to dispersion. Consequently, the wave field becomes asymmetric, exhibiting sharper crests and leading to a positive third moment. Importantly, the study demonstrates the existence of a steady state for statistical characteristics, including skewness, kurtosis, distribution functions, and spectral density. Through computations, it was observed that both statistical moments and distribution functions evolve until they reach a certain bound level. A similar effect is observed in the evolution of a random wave spectrum. In a related study, Didenkulova et al. [20] conducted direct numerical simulations of nonlinear wave evolution within the framework of the KdV equation for cases involving bimodal wave spectra models. They investigated the coexistence effect of an additional wave system on the evolution of wave statistical characteristics, spectral shapes, and the resulting equilibrium state. Furthermore, the study demonstrated that the presence of a low-frequency spectral component leads to more asymmetric waves with more extreme statistical properties.
The objective of this study is to investigate the behaviour of the evolution of a random internal wave field through the BO equation. As our model is deterministic, we conduct numerous simulations with randomly generated initial conditions with identical statistical characteristics. More precisely, our approach involves assuming that the initial conditions possess a power spectrum that adheres to a Gaussian distribution. This assumption serves as our initial step in unraveling the intricate nature of nonlinear dynamics, laying the foundation for the analysis of internal wave turbulence. Notably, in cases of more complex stratification, the Garrett–Munk spectrum typically constitutes the fundamental spectrum for internal waves. However, in scenarios featuring a two-layer stratification, our selected spectrum becomes a more suitable choice due to its relevance and appropriateness. For the mechanism of turbulence on internal waves, the readers are referred to [33,34,35,36]. Our approach is related with a case of integrable turbulence of internal waves because the BO equation is an integrable model. Through a series of numerical simulations, we investigate spectrum evolution and stabilization, the third and the fourth statistical moments of the random wave field, and the distribution function for the crest amplitudes. In addition, we pay special attention to the formation of ”rogue internal waves”, finding the so-called “three sister” and other extensions.
For reference, this article is organized as follows: The BO equation is presented in Section 2. In Section 3, we describe the numerical methods, and the results are presented in Section 4. The final considerations are presented in Section 5.

2. The Benjamin–Ono Equation

Our study aims to investigate the underlying cause of the dominant dynamic, focusing on the nonlinearity of dispersion. To achieve this, it is convenient to utilize dimensionless variables by introducing the BO equation. Equation (1) is typically initialized with [22]
η ( y , 0 ) = A s F ( K k 0 y ) sin ( k 0 y ) .
Here, A s represents a standard wave amplitude, F denotes the wave envelope with spectrum width K, and k 0 corresponds to the carrier wave number. Thus, we introduce dimensionless variables
x = k 0 ( y c 0 t ) , t = 3 c 0 k 0 A s 2 h 1 τ ,   and   η ( y , τ ) = A s u ( x , t ) .
Notice that with these choices, the crests of the wave field represented by η align with the troughs of the wave field denoted by u and vice versa. Substituting the dimensionless variables (5) into Equation (1), we derive the dimensionless BO equation
u t + u u x + 1 U r H [ u x x ] = 0 ,
where U r represents the Ursell parameter, given by U r = A s ρ r / h 1 k 0 . This parameter governs the nonlinearity of the BO equation, with higher values of U r indicating predominantly nonlinear dynamics, while lower values of U r suggest predominantly linear dynamics. Additionally, the Ursell parameter depends on the thickness of upper layer: hence, variations on the thickness of the upper layer may change the wave regime significantly.
To incorporate randomness into the problem, we introduce a zero-mean random state modeled as a Fourier series with M harmonics. The initial condition is given by
u ( x , 0 ) = i = 1 M 2 S ( k i ) Δ k cos ( k i x + φ i ) ,
Here, S ( k ) represents the initial power spectrum, k i = i Δ k , with Δ k being the sampling wave number, and φ i denotes a random variable uniformly distributed in the interval ( 0 , 2 π ) . The length of the initial realization is L = 2 π / Δ k . We assume that the initial power spectrum follows a Gaussian distribution:
S ( k ) = Q exp 1 2 ( k k 0 ) 2 2 K 2 , k > 0 .
The wave characteristics are determined by several parameters: the dimensionless peak wave number is k 0 = 1 , the spectral width is denoted as K = 0.18 , and the relative energy is indicated by the values of Q. All scenarios share the same total energy of the waves, which is defined by the variance σ 2 = 0.25
σ 2 = 1 L 0 L u 2 ( x , t ) d x .
Within the framework of the integrable Benjamin–Ono (BO) equation, an intriguing characteristic emerges: the variance remains constant throughout the motion, offering a stable reference point for analyzing its behavior. In our spectral domain, we opt for a dimension featuring 256 harmonics. This choice accommodates a gradual spectrum decay in the higher wave number (k) region, allowing us to capture a more realistic representation of the wave dynamics. It is worth noting that these specific parameter selections closely align with those employed by Pelinovsky and Sergeeva [22] as well as Didenkulova et al. [20] in their respective studies. By adopting these consistent parameters, we facilitate a robust basis for comparing our research findings with the results presented in the subsequent sections, thus enhancing the overall comprehensibility and validity of our analysis.

3. Numerical Methods

In this section, we present the numerical method used to compute solutions of the BO Equation (6). Equation (6) is solved numerically by employing a Fourier pseudospectral method that incorporates an integrating factor, a technique akin to the one presented by Trefethen in [37]. This integrating factor effectively resolves the linear component of Equation (6), thereby circumventing numerical instabilities stemming from the dispersive term. It is worth noting that for a given function f ( ξ ) , we can compute the nonlocal operator H using the formula
H [ f ( ξ ) ] = F 1 [ i sign ( k ) f ^ ( k ) ] ,
where F 1 denotes the Fourier inverse transform.
Rewriting Equation (6) in the Fourier frequency space, it takes the form
u ^ t + 1 2 x u 2 ^ + i k 2 U r sign ( k ) u ^ = 0 .
The integrating factor is defined as
E ( k , t ) = exp i k 2 U r sign ( k ) t .
Defining U ^ ( k , t ) = E ( k , t ) u ^ ( k , t ) and replacing it in Equation (10), we obtain the equation
U ^ t + 1 2 E F x F 1 E 1 U ^ 2 = 0 ,
where F denotes the Fourier transform, and F 1 is its inverse. It is important to note that once we have computed U ^ ( k , t ) , we can recover the original function u as
u ( x , t ) = F 1 E 1 U ^ ( k , t ) .
The solution of Equation (11) is performed within a periodic computational domain [ 0 , L ] using a uniform grid consisting of an even number of points denoted as N. The spatial points are discretized as
x j = ( j 1 ) Δ x ,   j = 1 , 2 , , N ,   where   Δ x = L / N ,
and the frequencies are discretized as
( k 1 , k 2 , , k N ) = π L ( 0 , 1 , , N / 2 1 , 0 , N / 2 + 1 , , 1 ) .
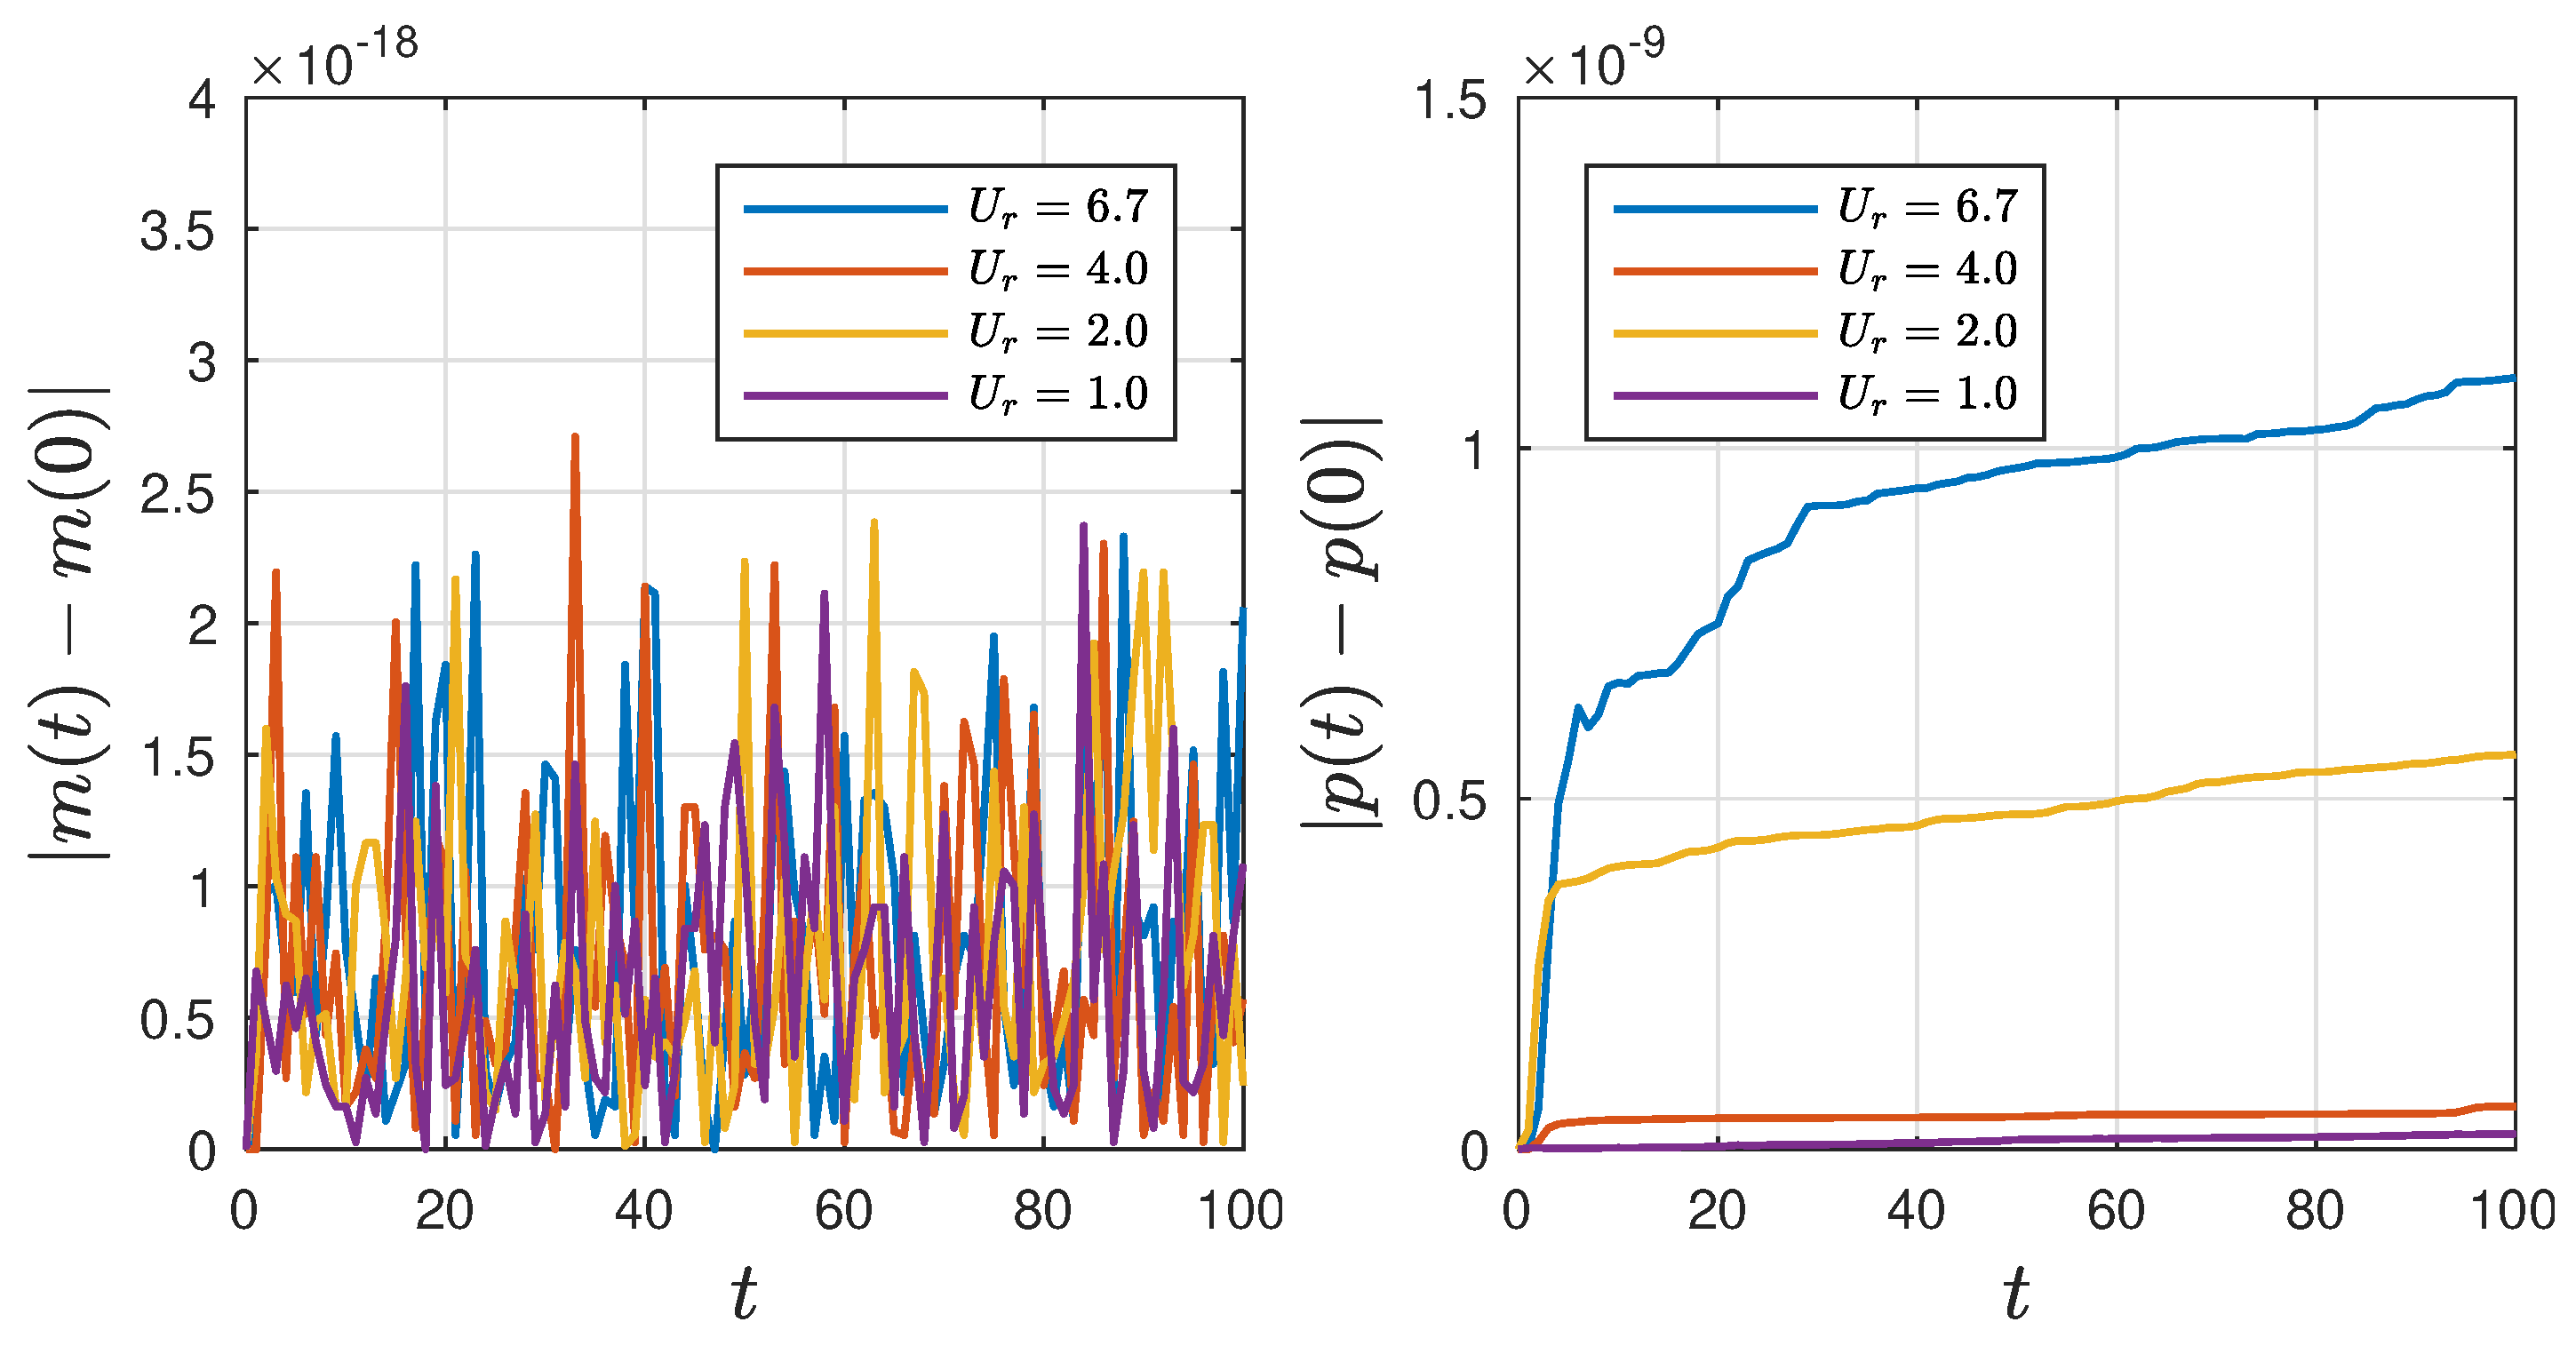
Fourier transforms and the Hilbert operator are computed using the Fast Fourier Transform (FFT), while spatial derivatives are evaluated spectrally following the methods outlined by Trefethen in [37]. The time advance is computed using the Runge–Kutta fourth-order method (RK4) with time step Δ t . The parameters used in the following simulations are L = 2 π / Δ k , where Δ k = 0.023 , and there is a uniform grid containing N = 2 12 points. For the time evolution of the equation, we utilize the classical fourth-order Runge–Kutta method with discrete time steps of size Δ t = 0.005 . For a more detailed resolution study and comprehensive understanding of a similar numerical method, readers are referred to the work of Flamarion et al. [38]. Furthermore, it is noteworthy that the reliability of the identical numerical method has been confirmed in a recent study by Flamarion and Pelinovsky [39]. In this context, we use the fact that the BO Equation (6) conserves both the total mass ( m ( t ) ) and the momentum ( p ( t ) ) to verify the accuracy of the chosen numerical method. The total mass is defined as
d m d t = 0 , where m ( t ) = 1 L 0 L u ( x , t ) d x ,
and the momentum is defined as
d p d t = 0 , where p ( t ) = 1 L 0 L u 2 ( x , t ) d x .
Numerical simulations are controlled by retaining of the first and second moments with precision of machine and 10 9 , respectively. Figure 2 illustrates the conservation of mass and momentum over time for different simulations. As observed, both quantities remain conserved throughout the simulations. Notice that for the mass conservation, we have machine precision.

4. Results

4.1. Wave Field

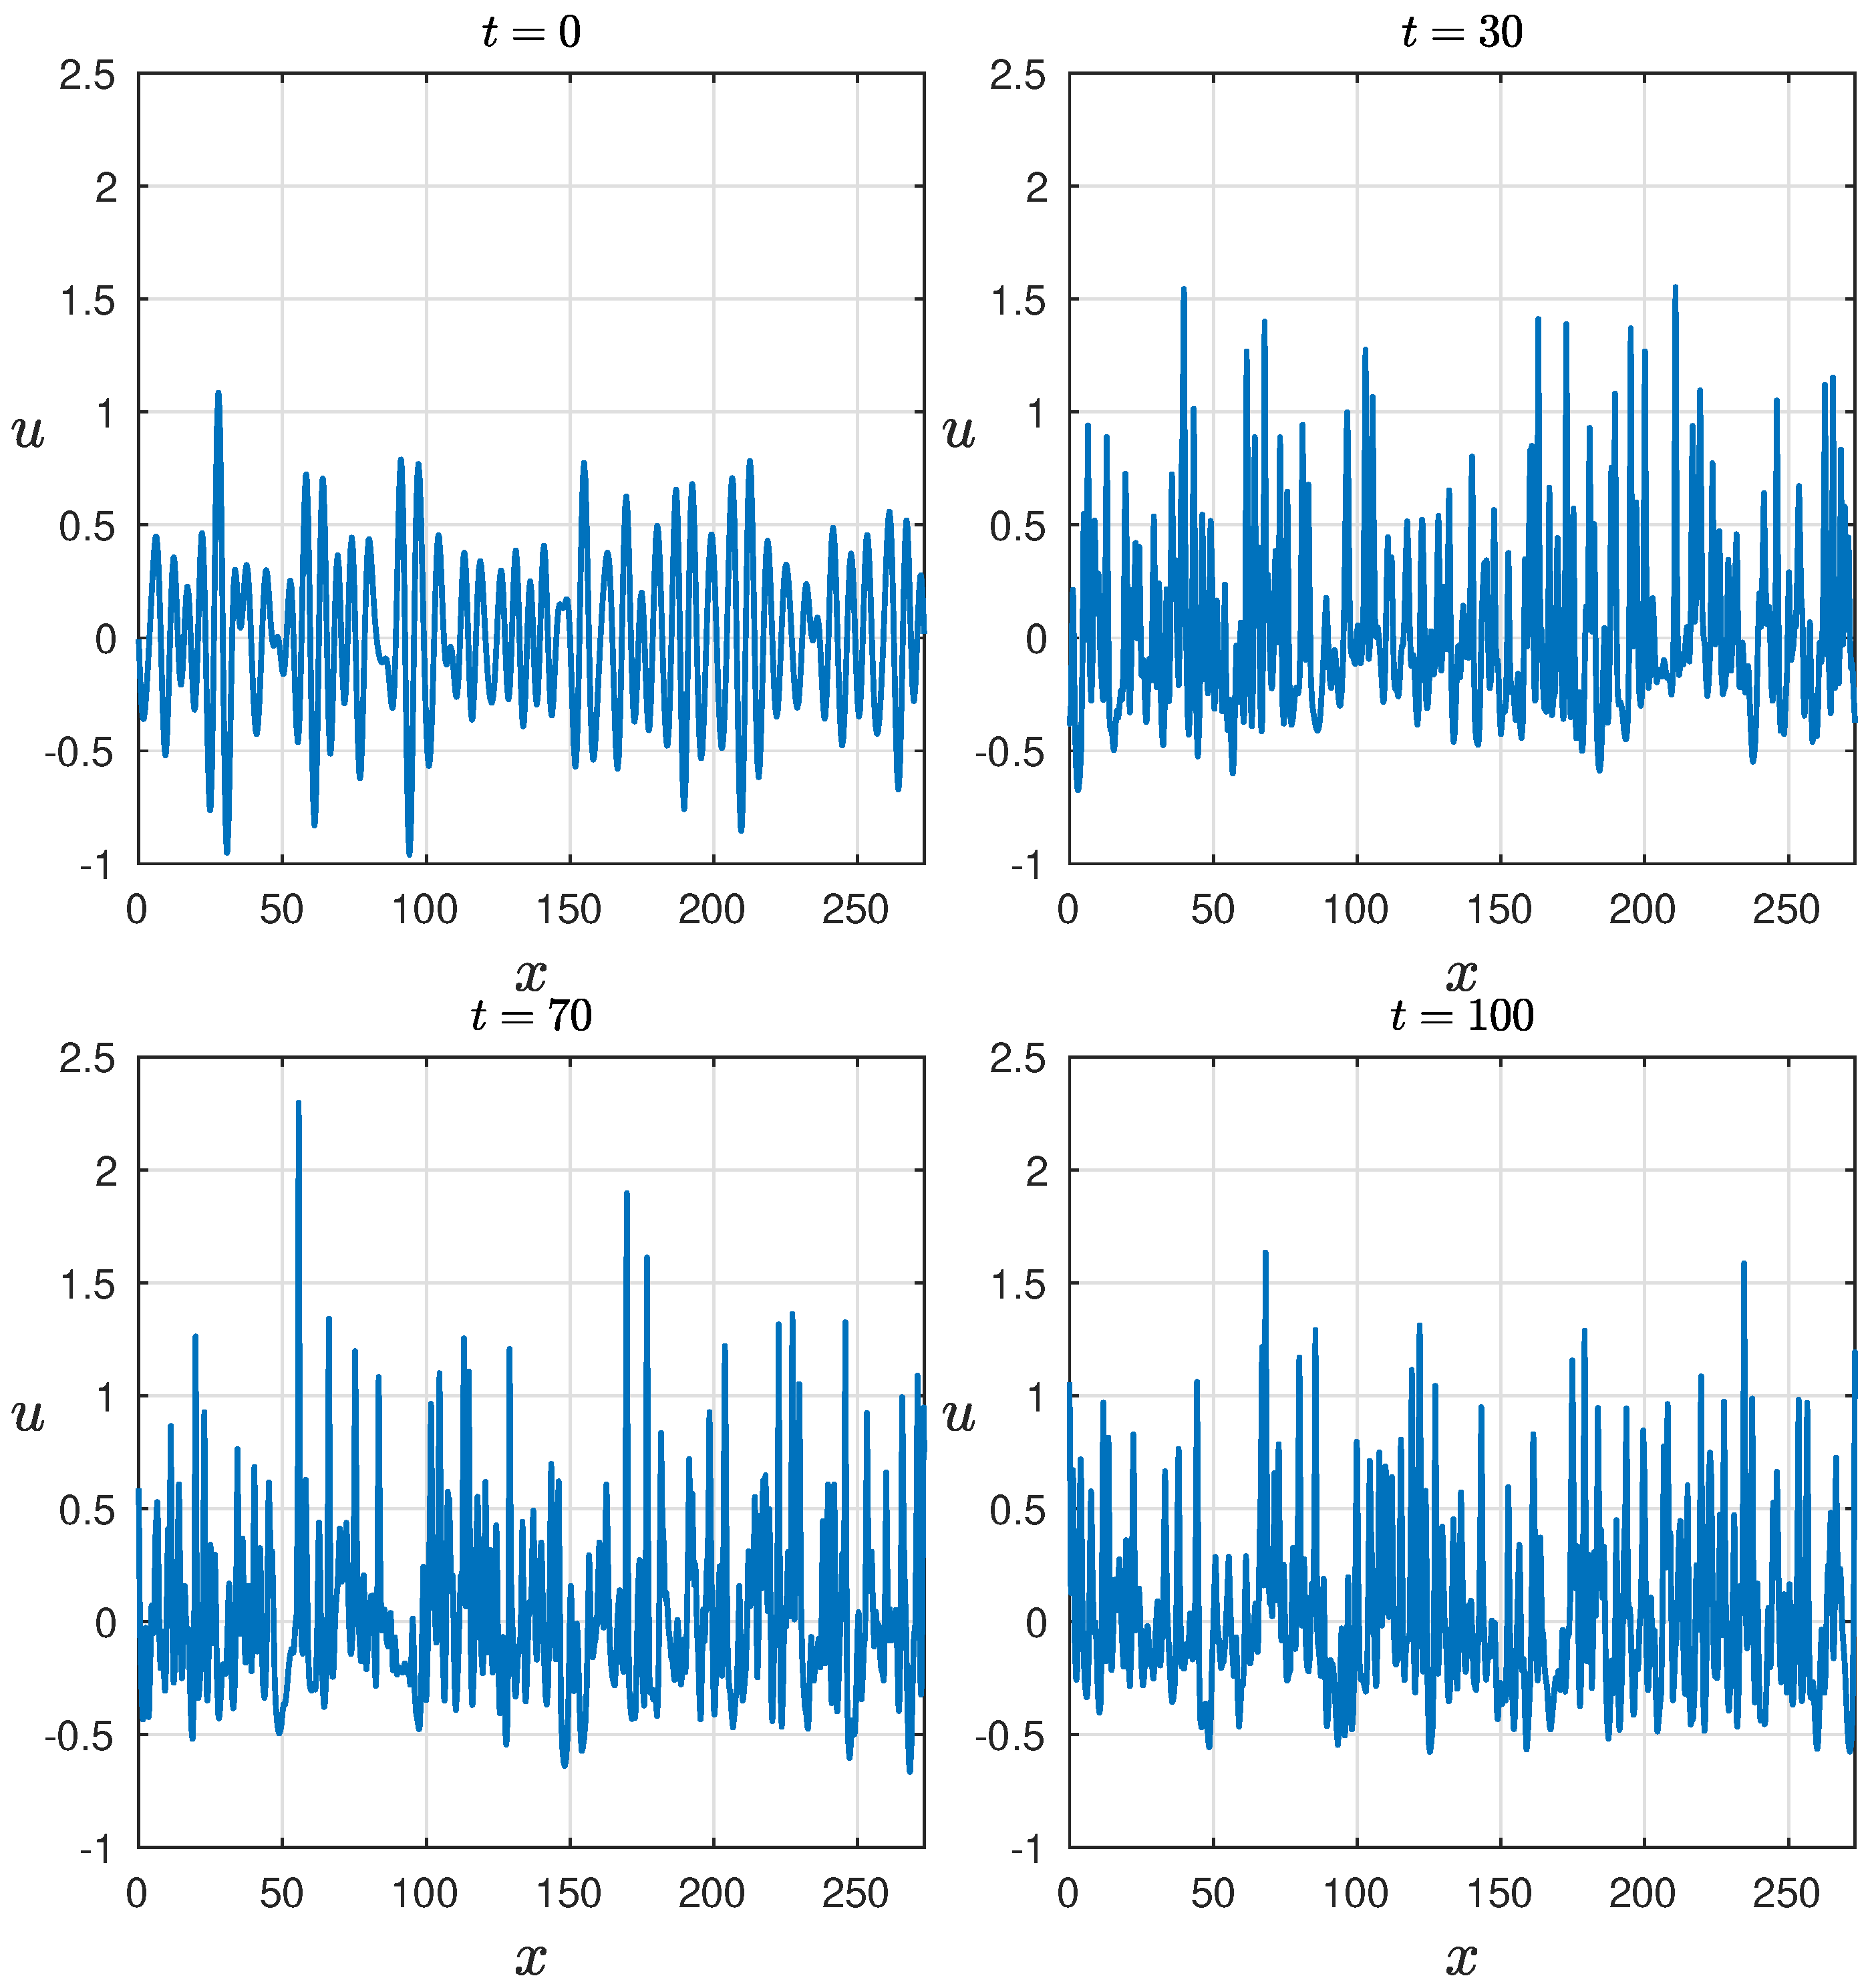
The evolution of the wave record is depicted in Figure 3 at various time instances. Initially, the wave field exhibits a relatively narrow spectrum, resulting in smooth group structures of the waves. However, as time progresses, the wave profile becomes asymmetric, transitioning from smooth crests to sharp ones. This signifies an increase in the skewness of the wave field beyond its initial value, indicating a departure from a symmetric distribution, which will be discussed later. Moreover, the chosen parameter U r = 6.7 corresponds to a significant nonlinearity, leading to the emergence of large-amplitude waves during the interaction.
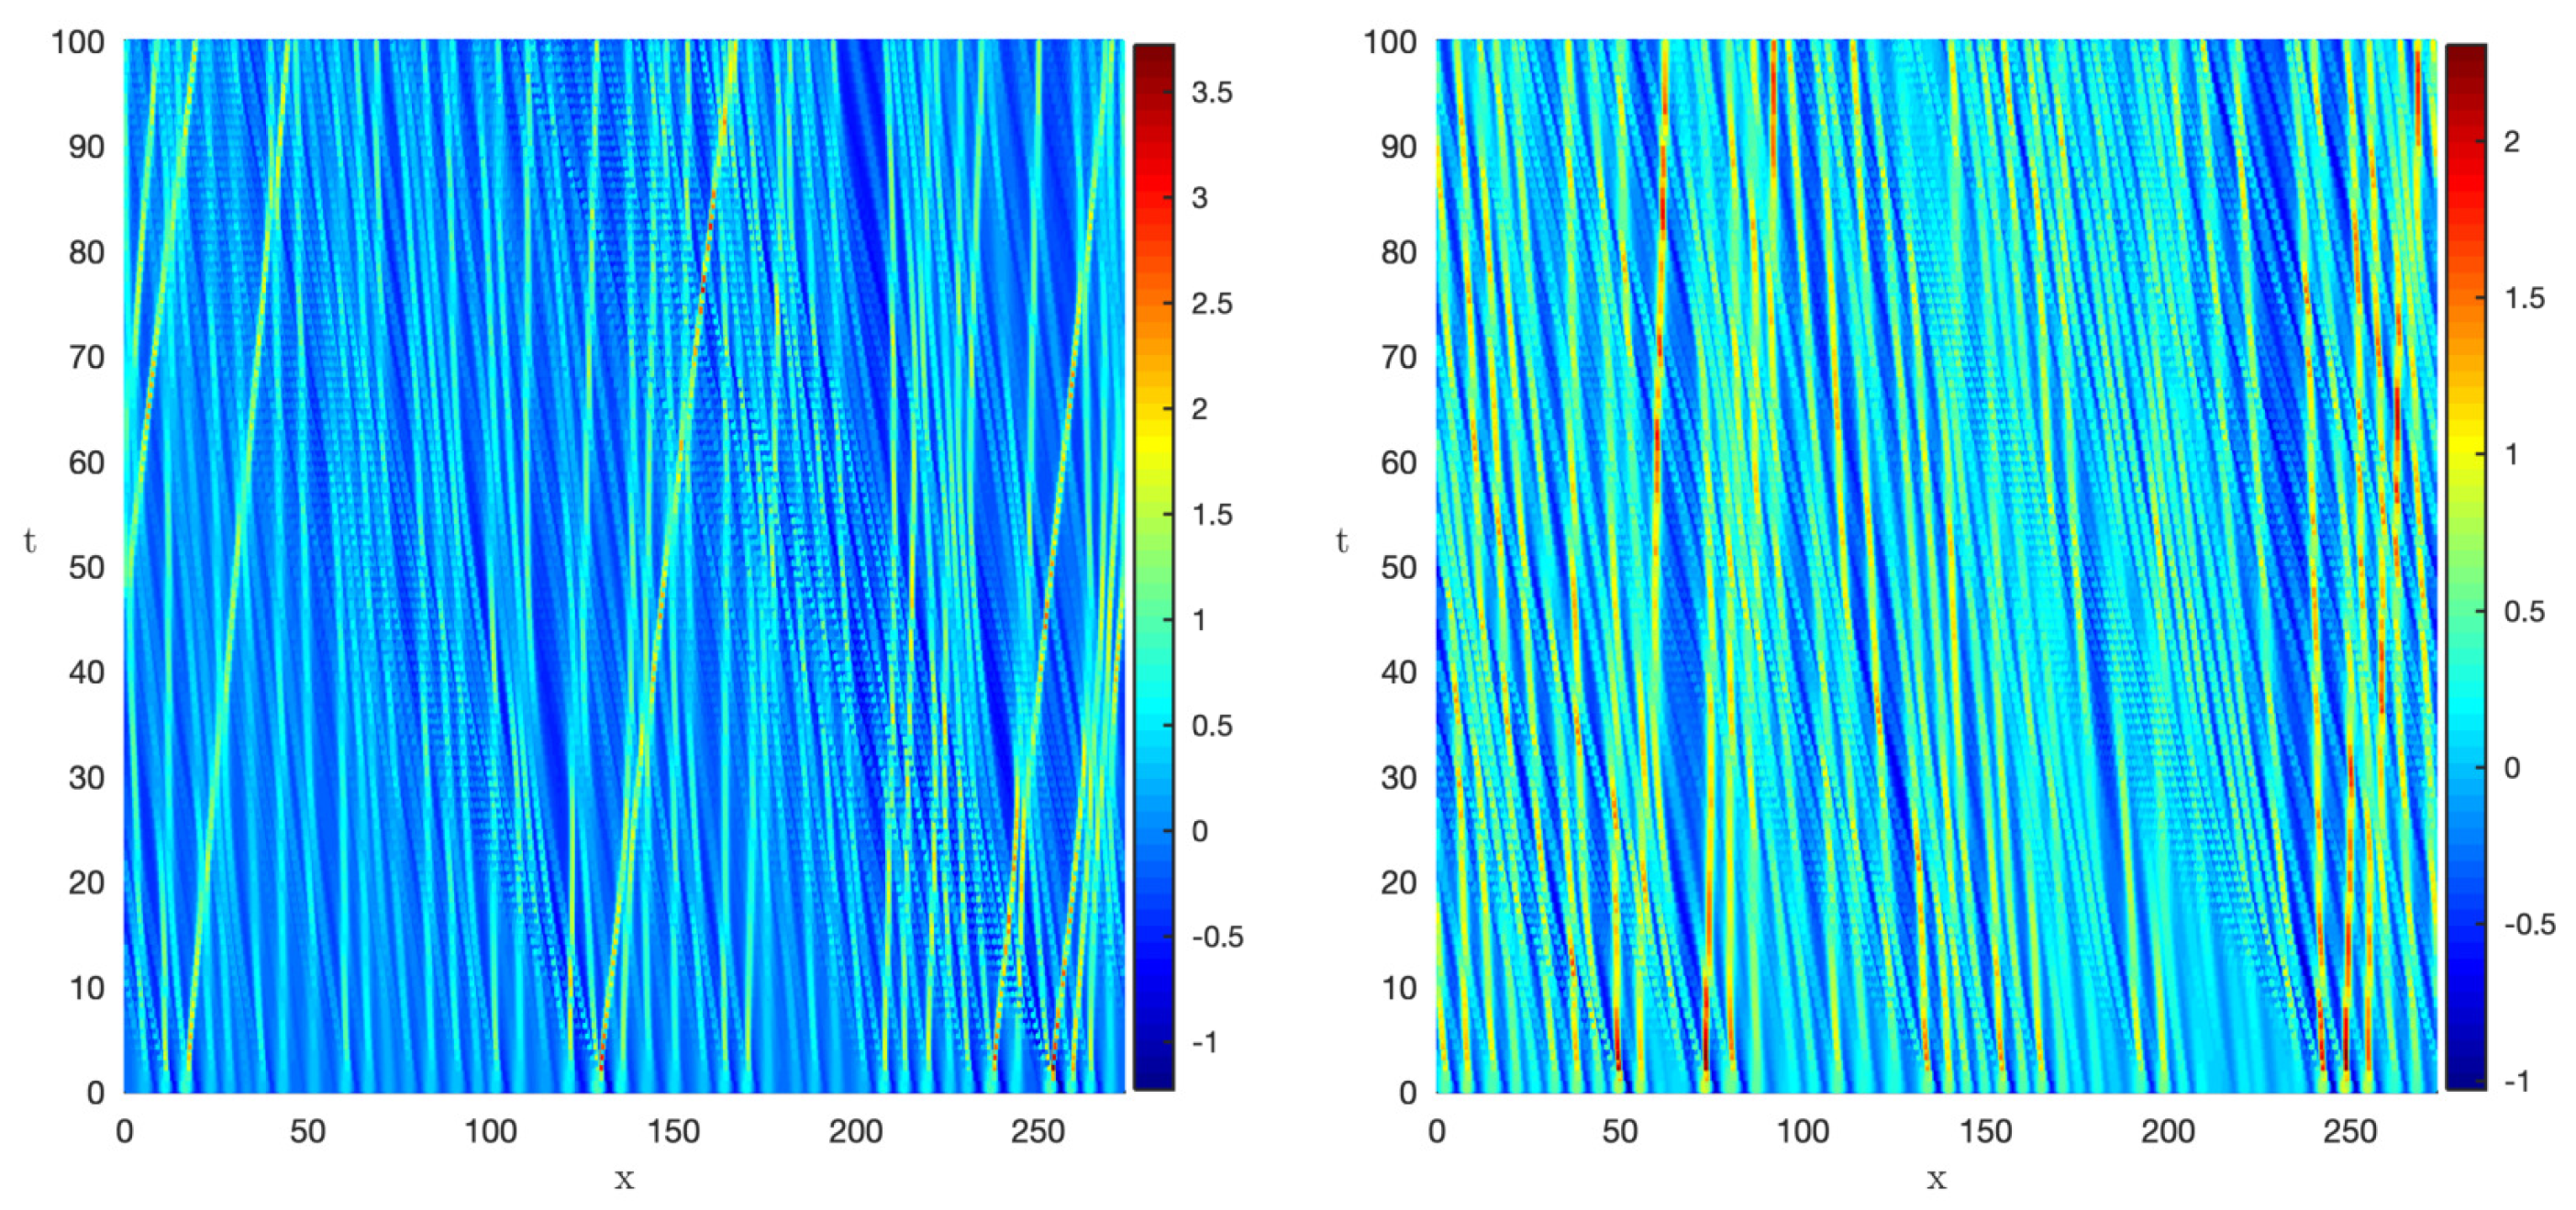
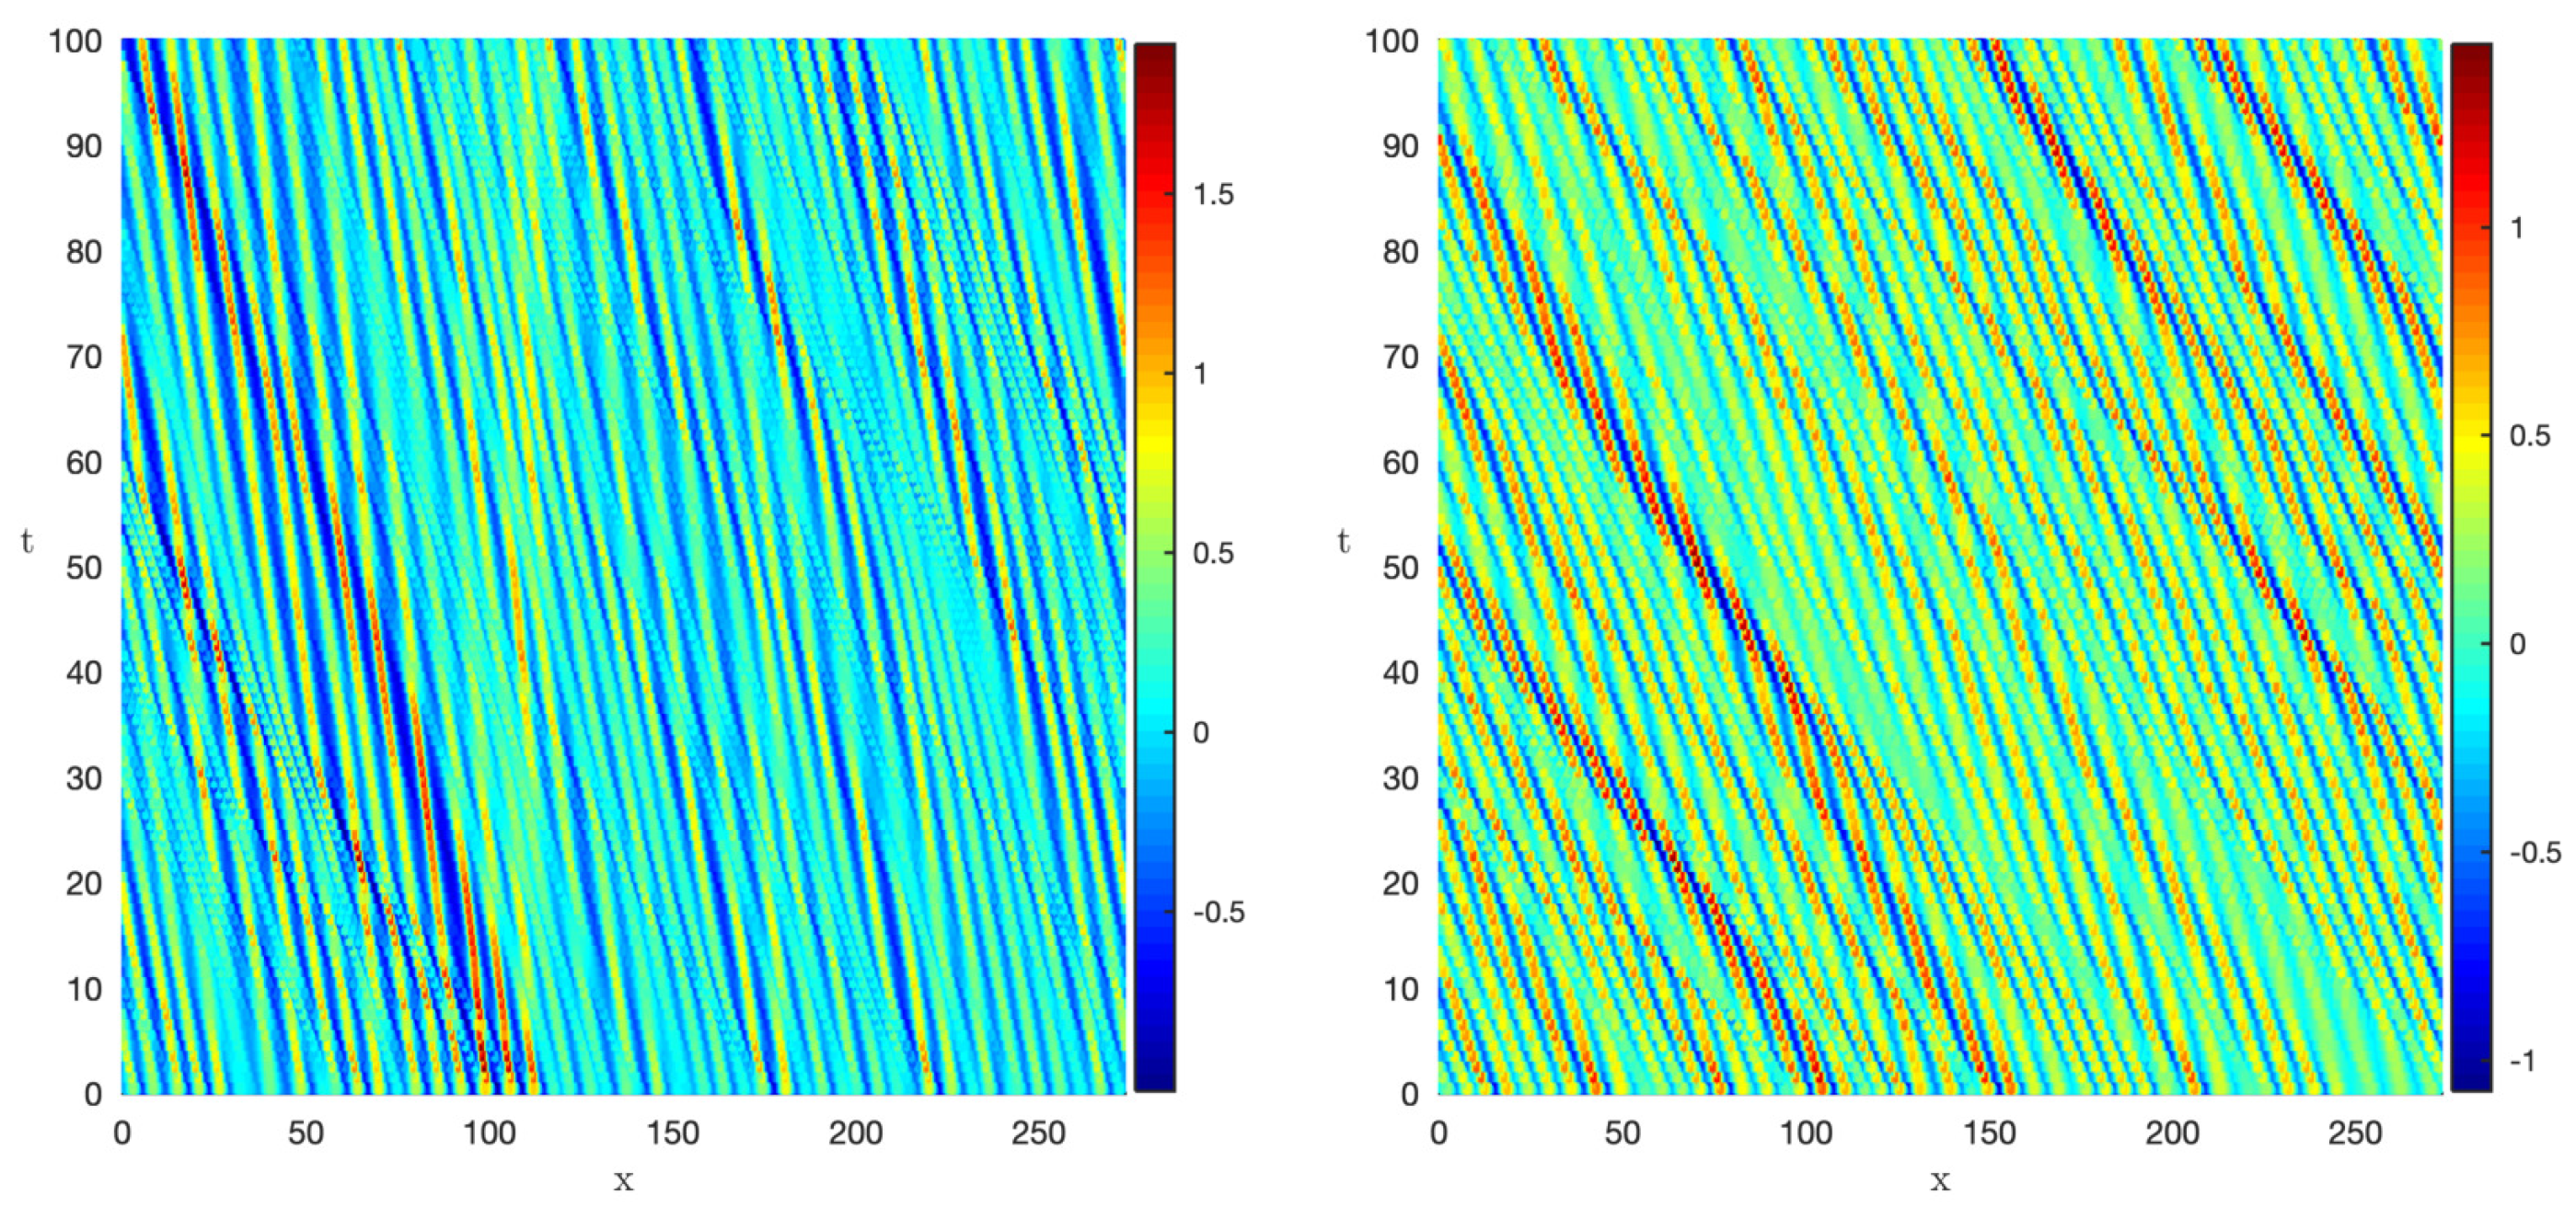
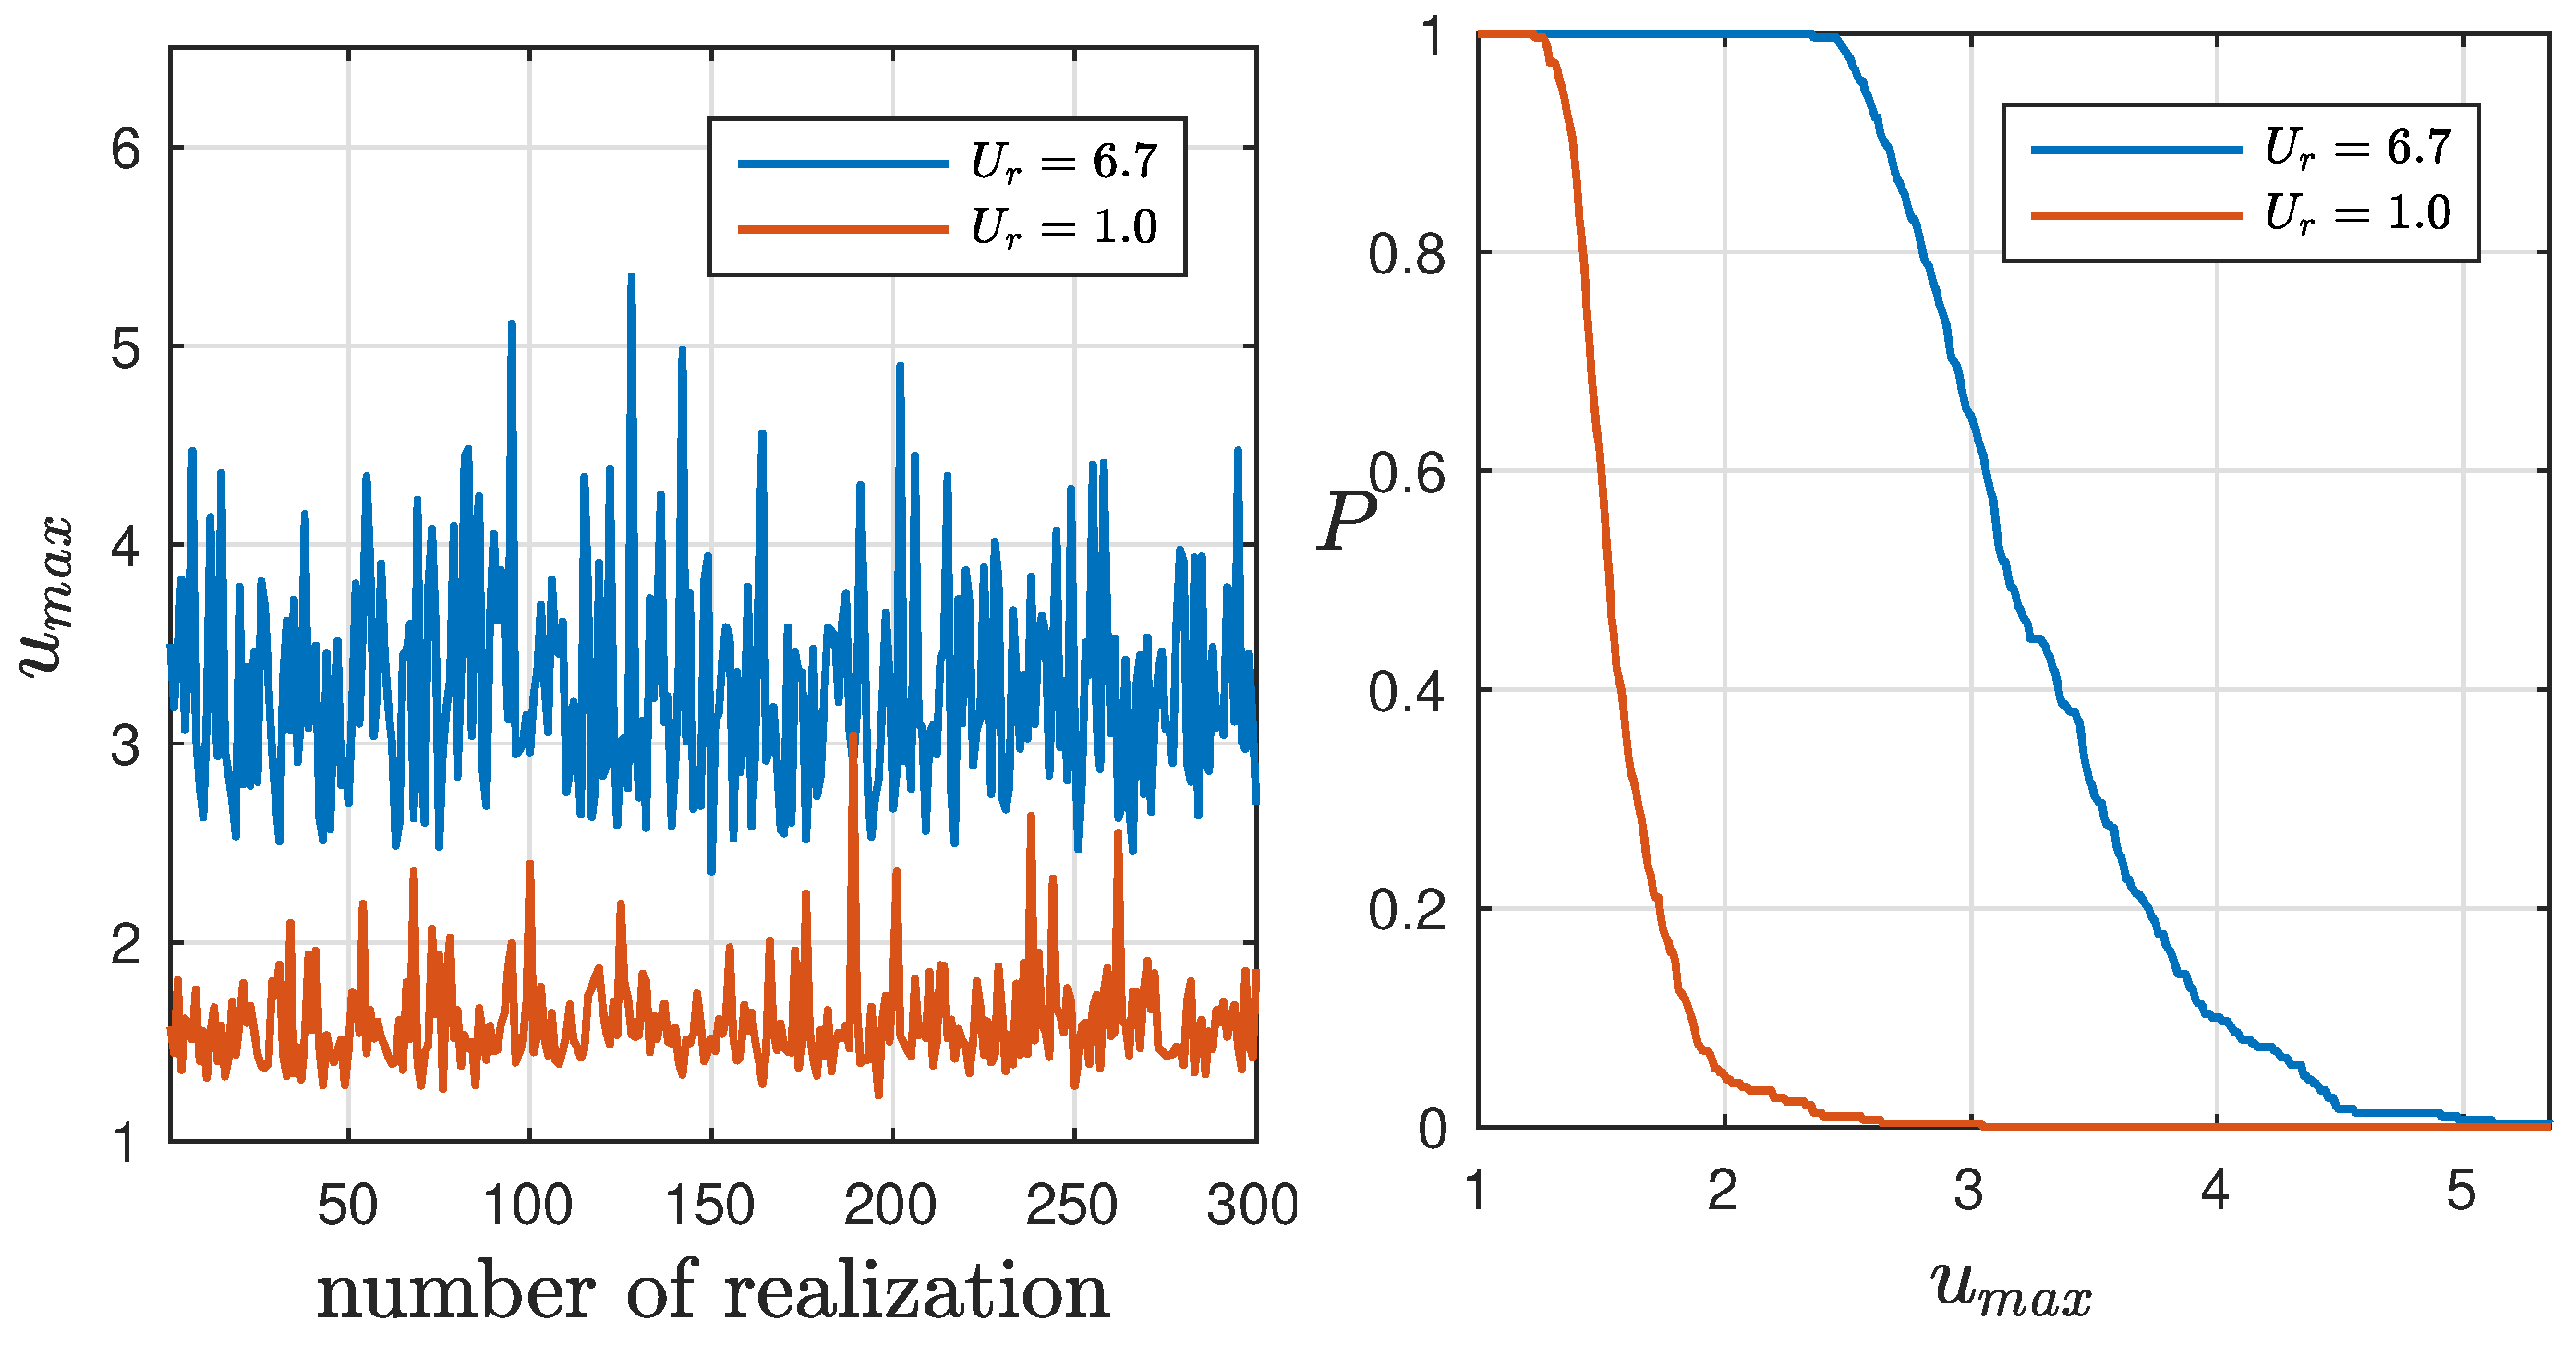
To comprehend the role of the Ursell parameter in the dynamics, we analyze the trajectory patterns displayed in Figure 4. On the time–space plane, we observe that for higher values of U r , the wave propagation results in the formation of prominent peak amplitudes, as indicated in Figure 4. The distribution of crest amplitudes presented in Figure 5 shows that nonlinearity is essential for the existence of waves with large amplitudes: in particular, in the formation of rogue waves, which will be discussed below.
In recent years, there has been a growing fascination with rogue waves, an intriguing type of nonlinear wave also known as freak waves. These waves have captured the attention of researchers from various scientific disciplines due to their unique characteristics. Initially observed in the deep ocean, rogue waves exhibit abnormal behavior, with amplitudes two to three times higher than the surrounding waves. What makes them particularly captivating is their sudden formation, seemingly appearing out of nowhere.
Rogue waves, characterized by their sudden and exceptionally high amplitudes, have emerged as a compelling subject of extensive investigation across diverse scientific disciplines. They have piqued the interest of researchers in fields such as oceanography [29,30], where understanding their behavior is critical for maritime safety and coastal protection. Furthermore, rogue waves have made their presence felt in areas as diverse as optical fibers [40,41,42], impacting the reliability of communication networks and signal transmission. In the realm of quantum physics, rogue waves have found relevance in Bose–Einstein condensates [43,44,45], offering insights into the behavior of ultracold atomic systems. Even financial markets have not remained untouched, with rogue-wave-like events manifesting themselves in market fluctuations and risk assessment [46]. These broad-ranging applications underscore the pervasive influence of rogue wave phenomena in both natural and man-made systems. Mathematically, the criterion for the occurrence of freak waves can be described by the equation [30]
A f r > 2 H s ,
where A f r represents the height of the freak wave, and H s represents the height of the ”significant" wave field. The value of H s is determined by averaging one-third of the largest waves observed in the given context, such as in the field of oceanology.
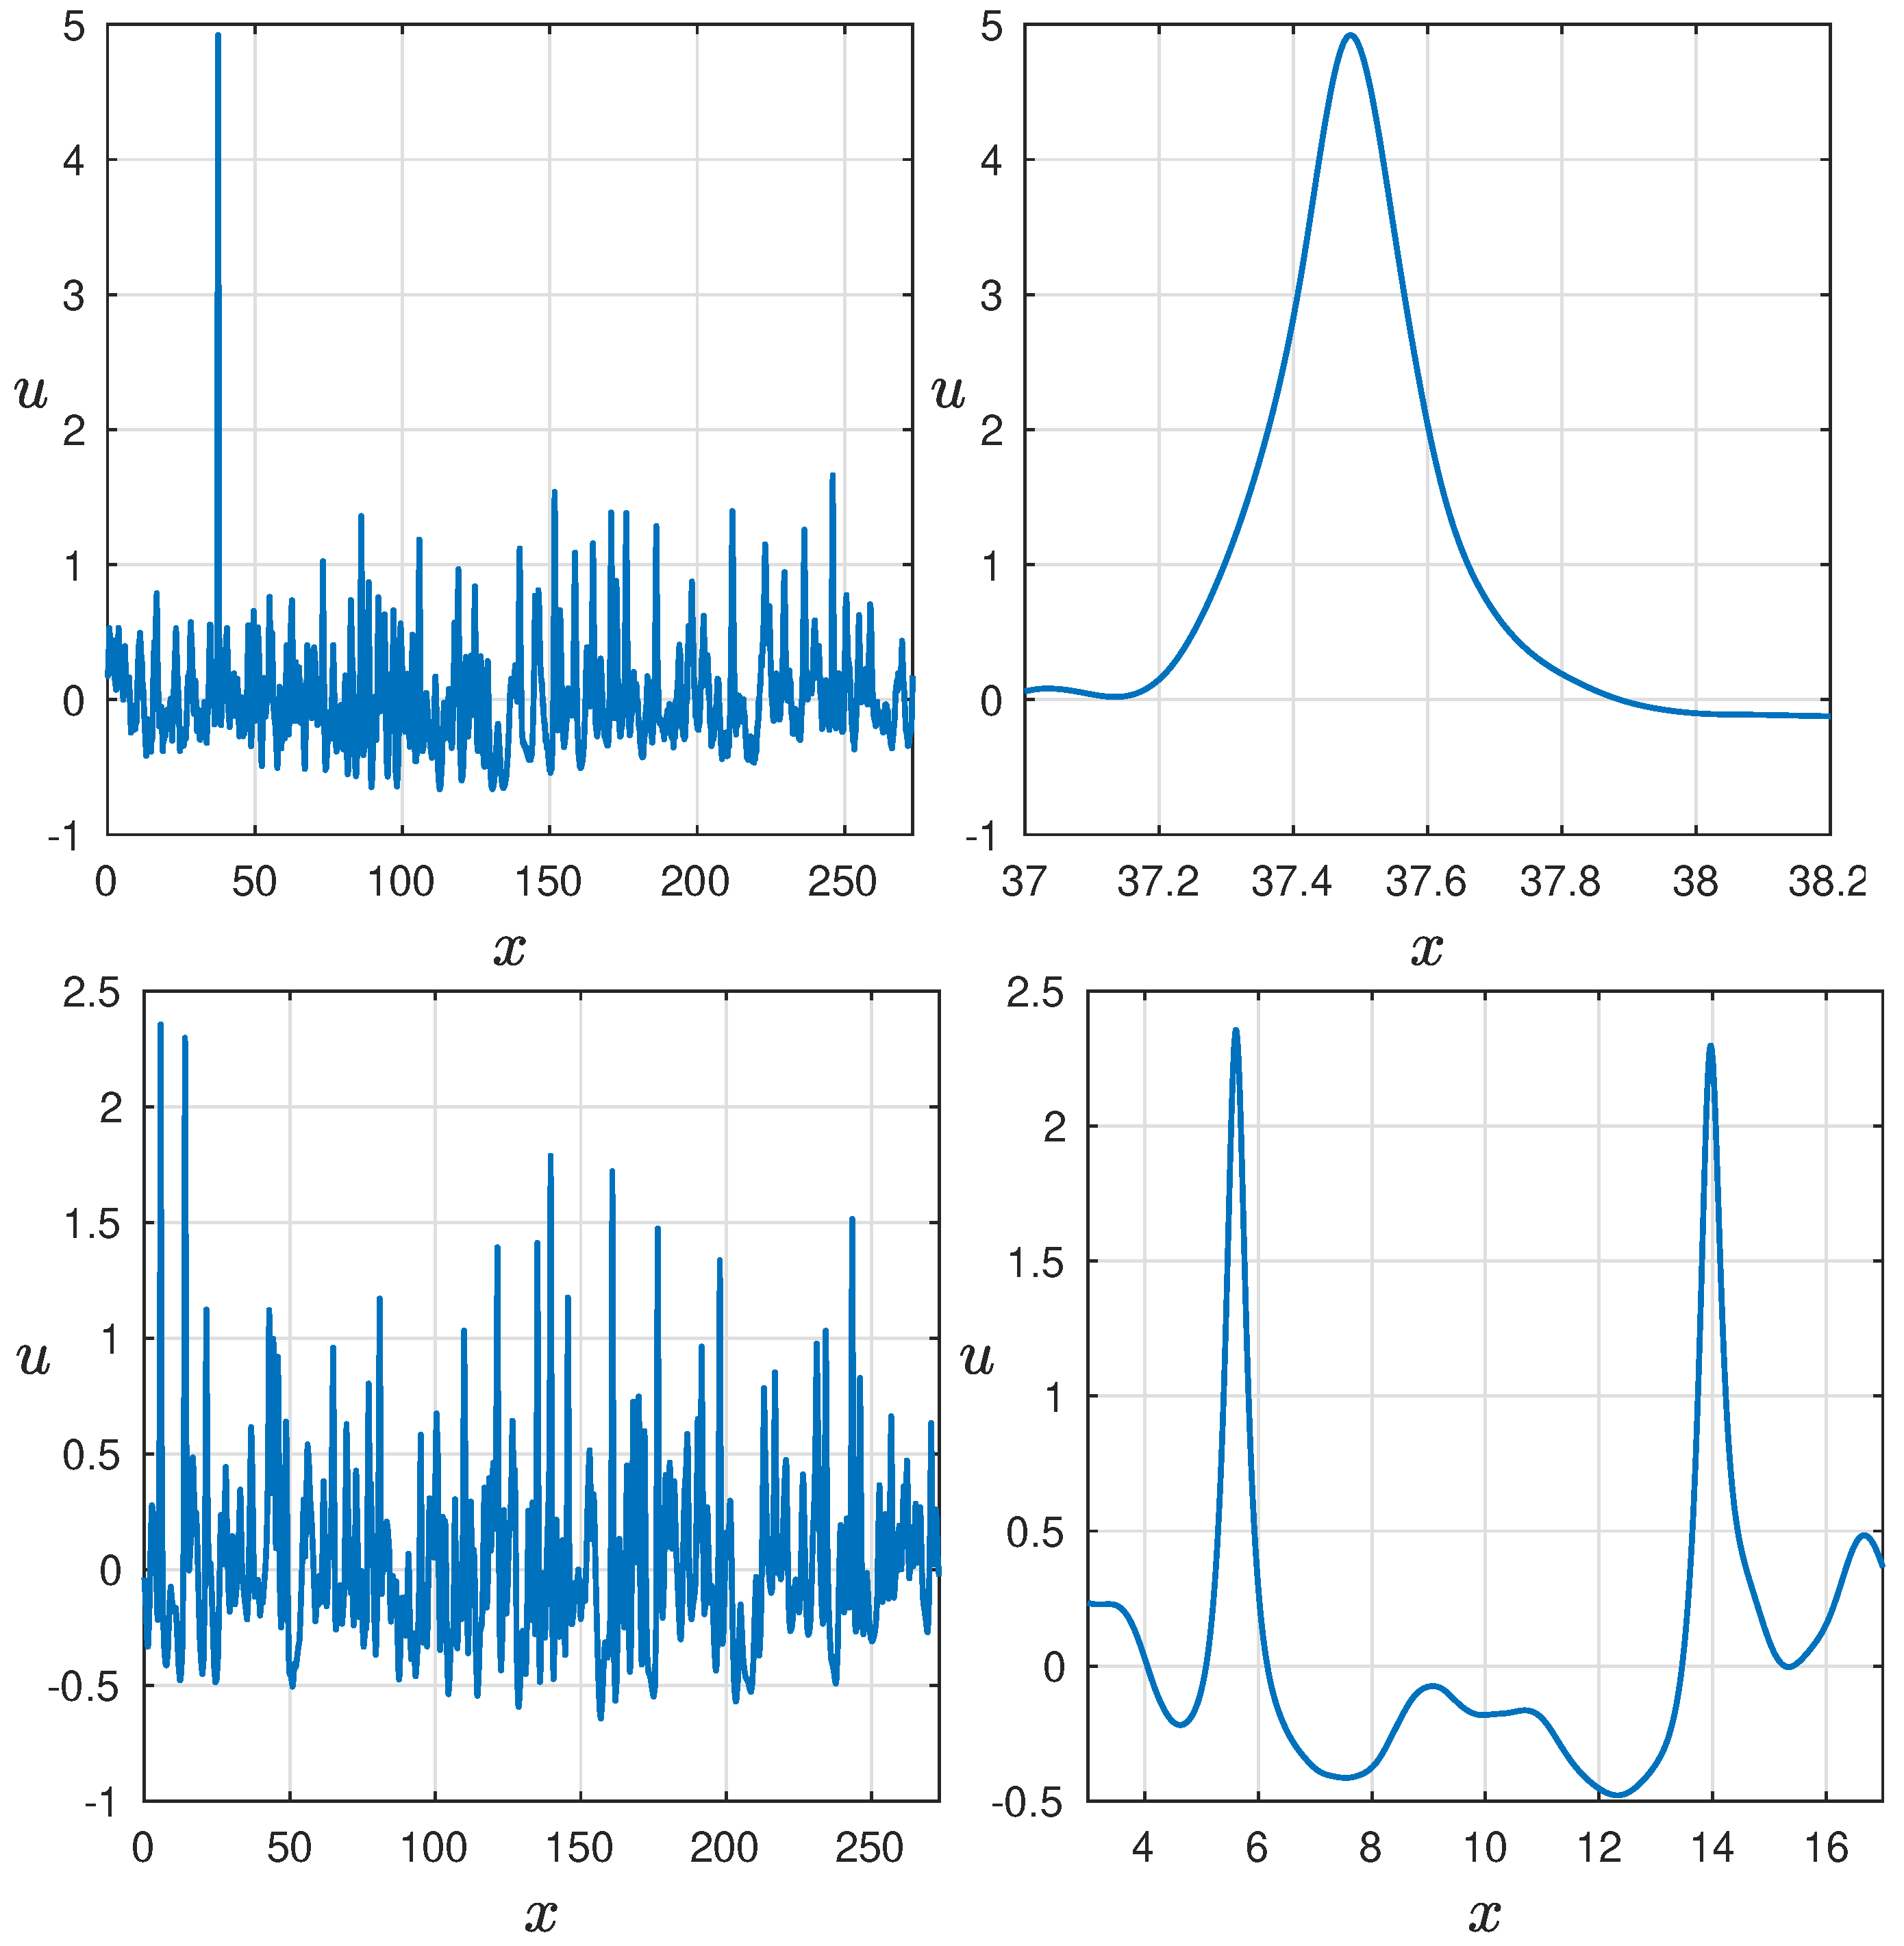
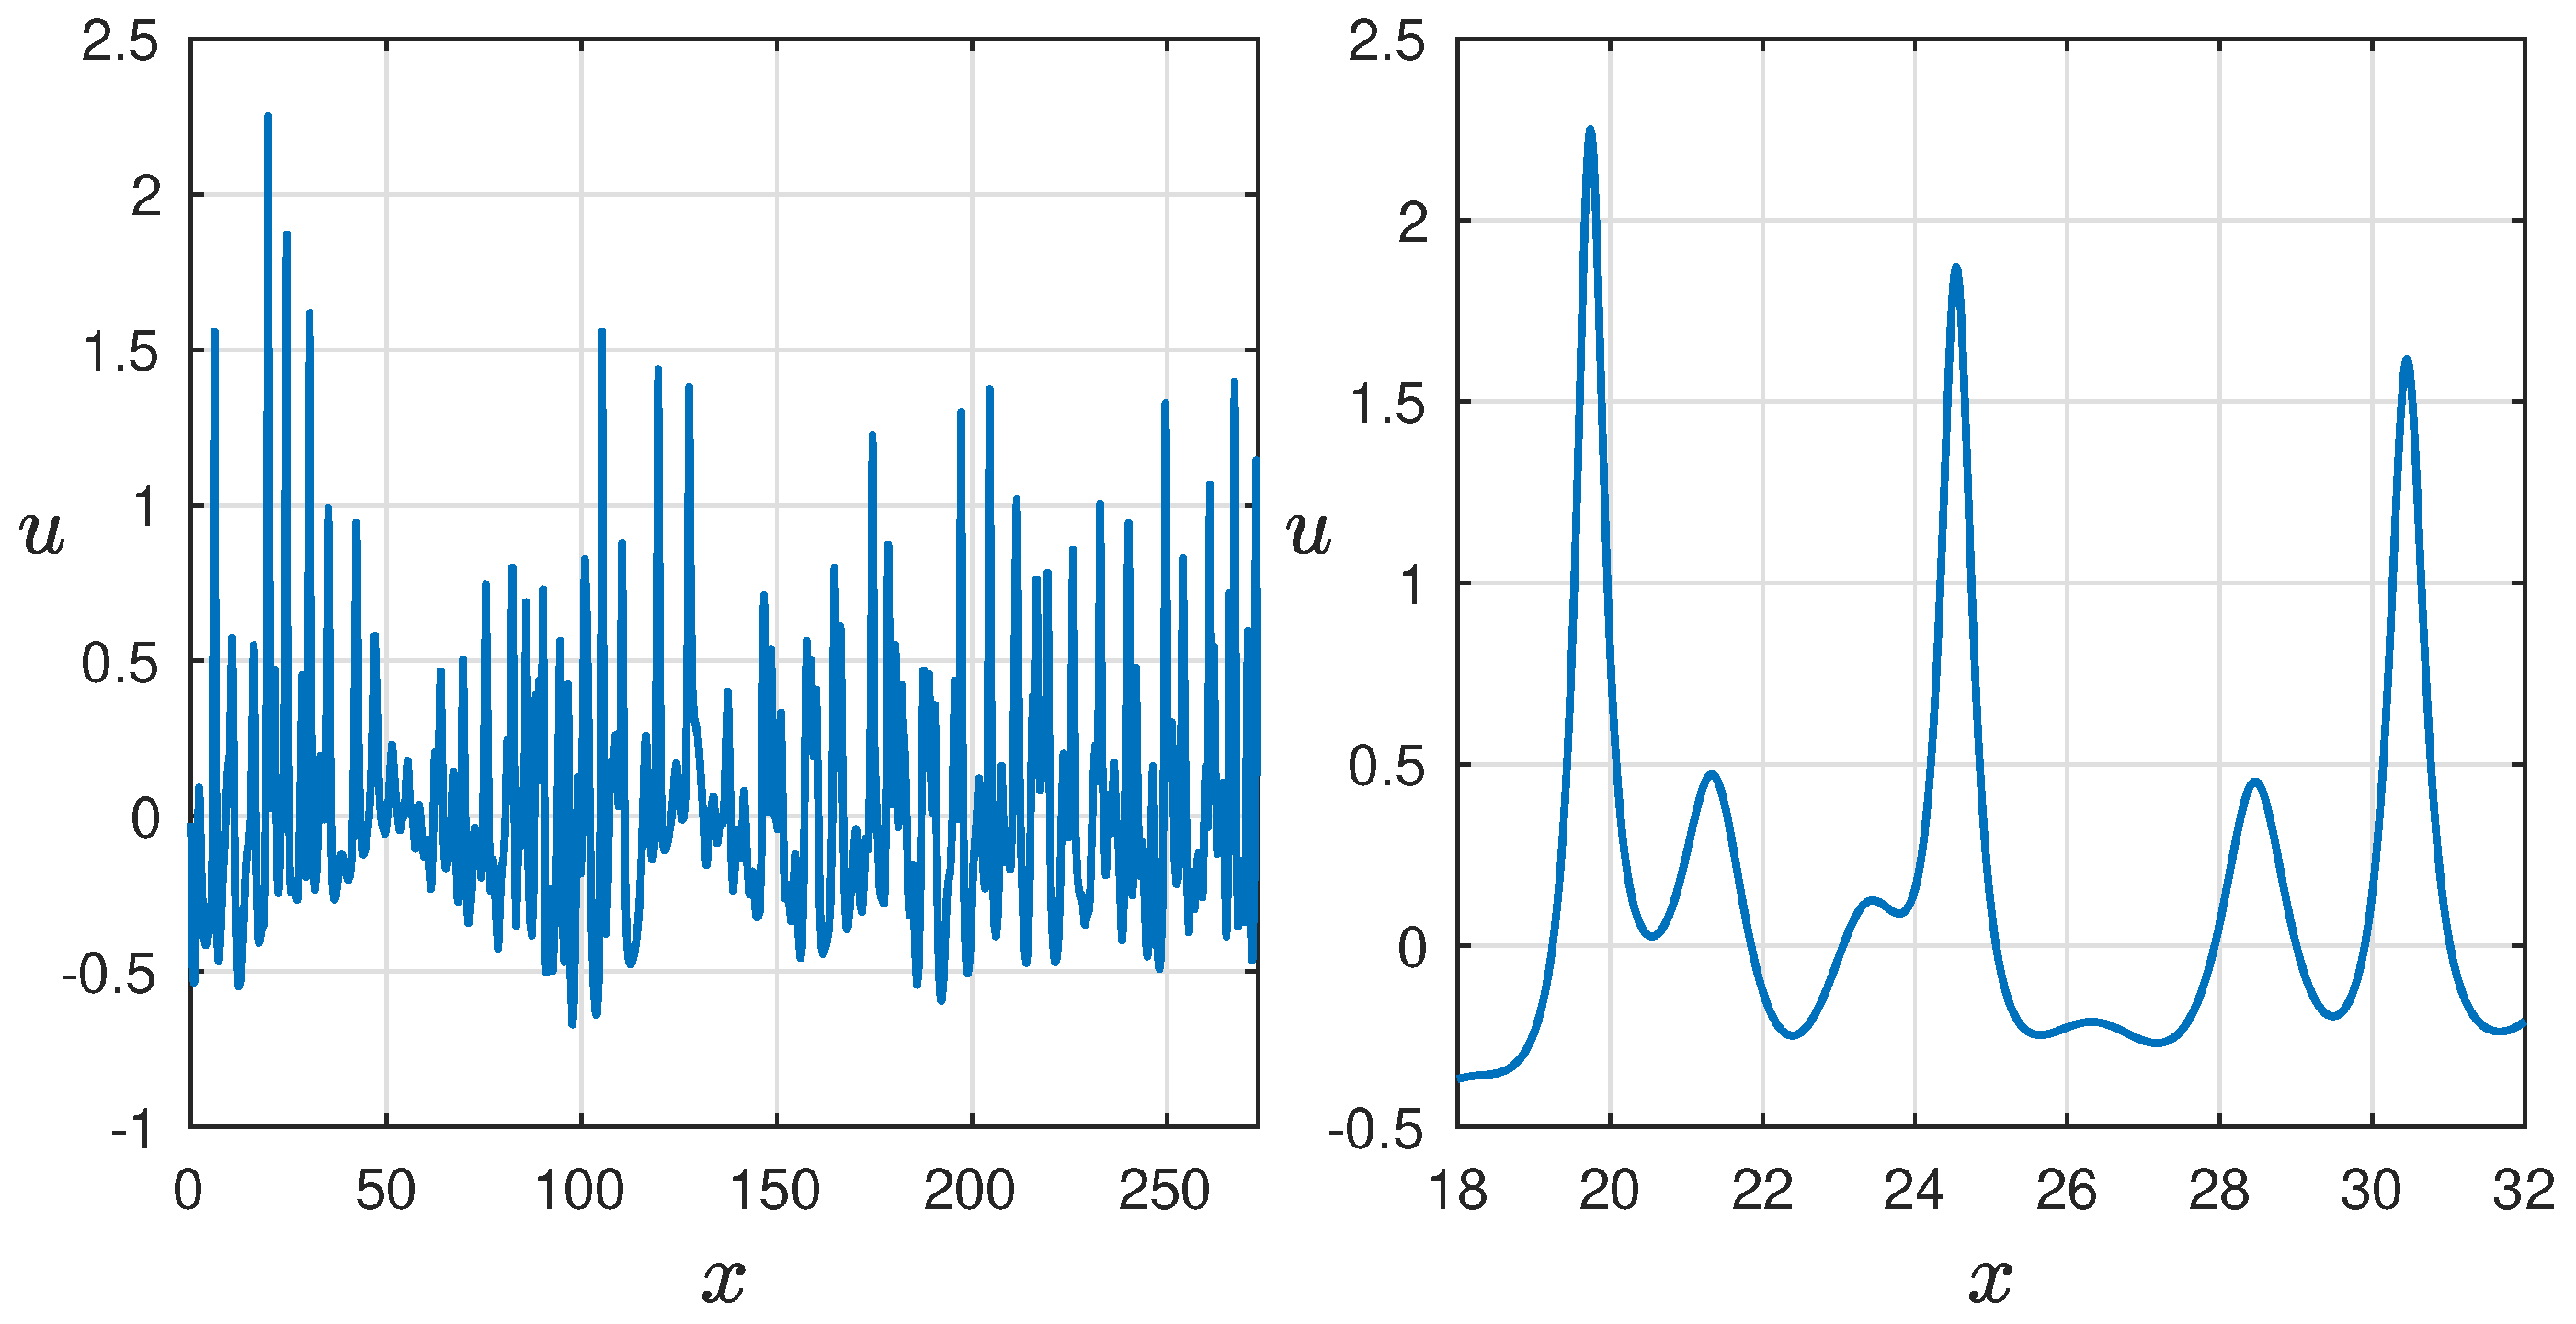
Figure 6 (left) displays different simulated wave fields at different time records, where prominent peaks significantly surpass the surrounding waves, representing various types of freak waves. Zooming in on the left panels, Figure 6 (right) provides a closer look at their distinctive appearance. For instance, the top-right image showcases a freak wave of substantial amplitude known as the “two sisters" and “three sisters". The available data, along with theoretical studies, provide ample evidence for the existence of rogue waves in diverse shapes. For example, these types of waves were also documented and their lifetimes estimated in a recent study by Didenkulova and Pelinovsky [32], where they were examined within the context of wind waves utilizing the KdV equation. It is worth mentioning that series of big waves with more than four peaks were also observed. The occurrence of freak waves is strongly influenced by the parameter U r , with a higher frequency expected in wave fields characterized by stronger nonlinearity and smaller values of U r .
By studying and understanding the characteristics and behavior of these rogue waves, researchers aim to shed light on their formation mechanisms and develop methods to predict and mitigate their potentially hazardous effects.

4.2. Spectra

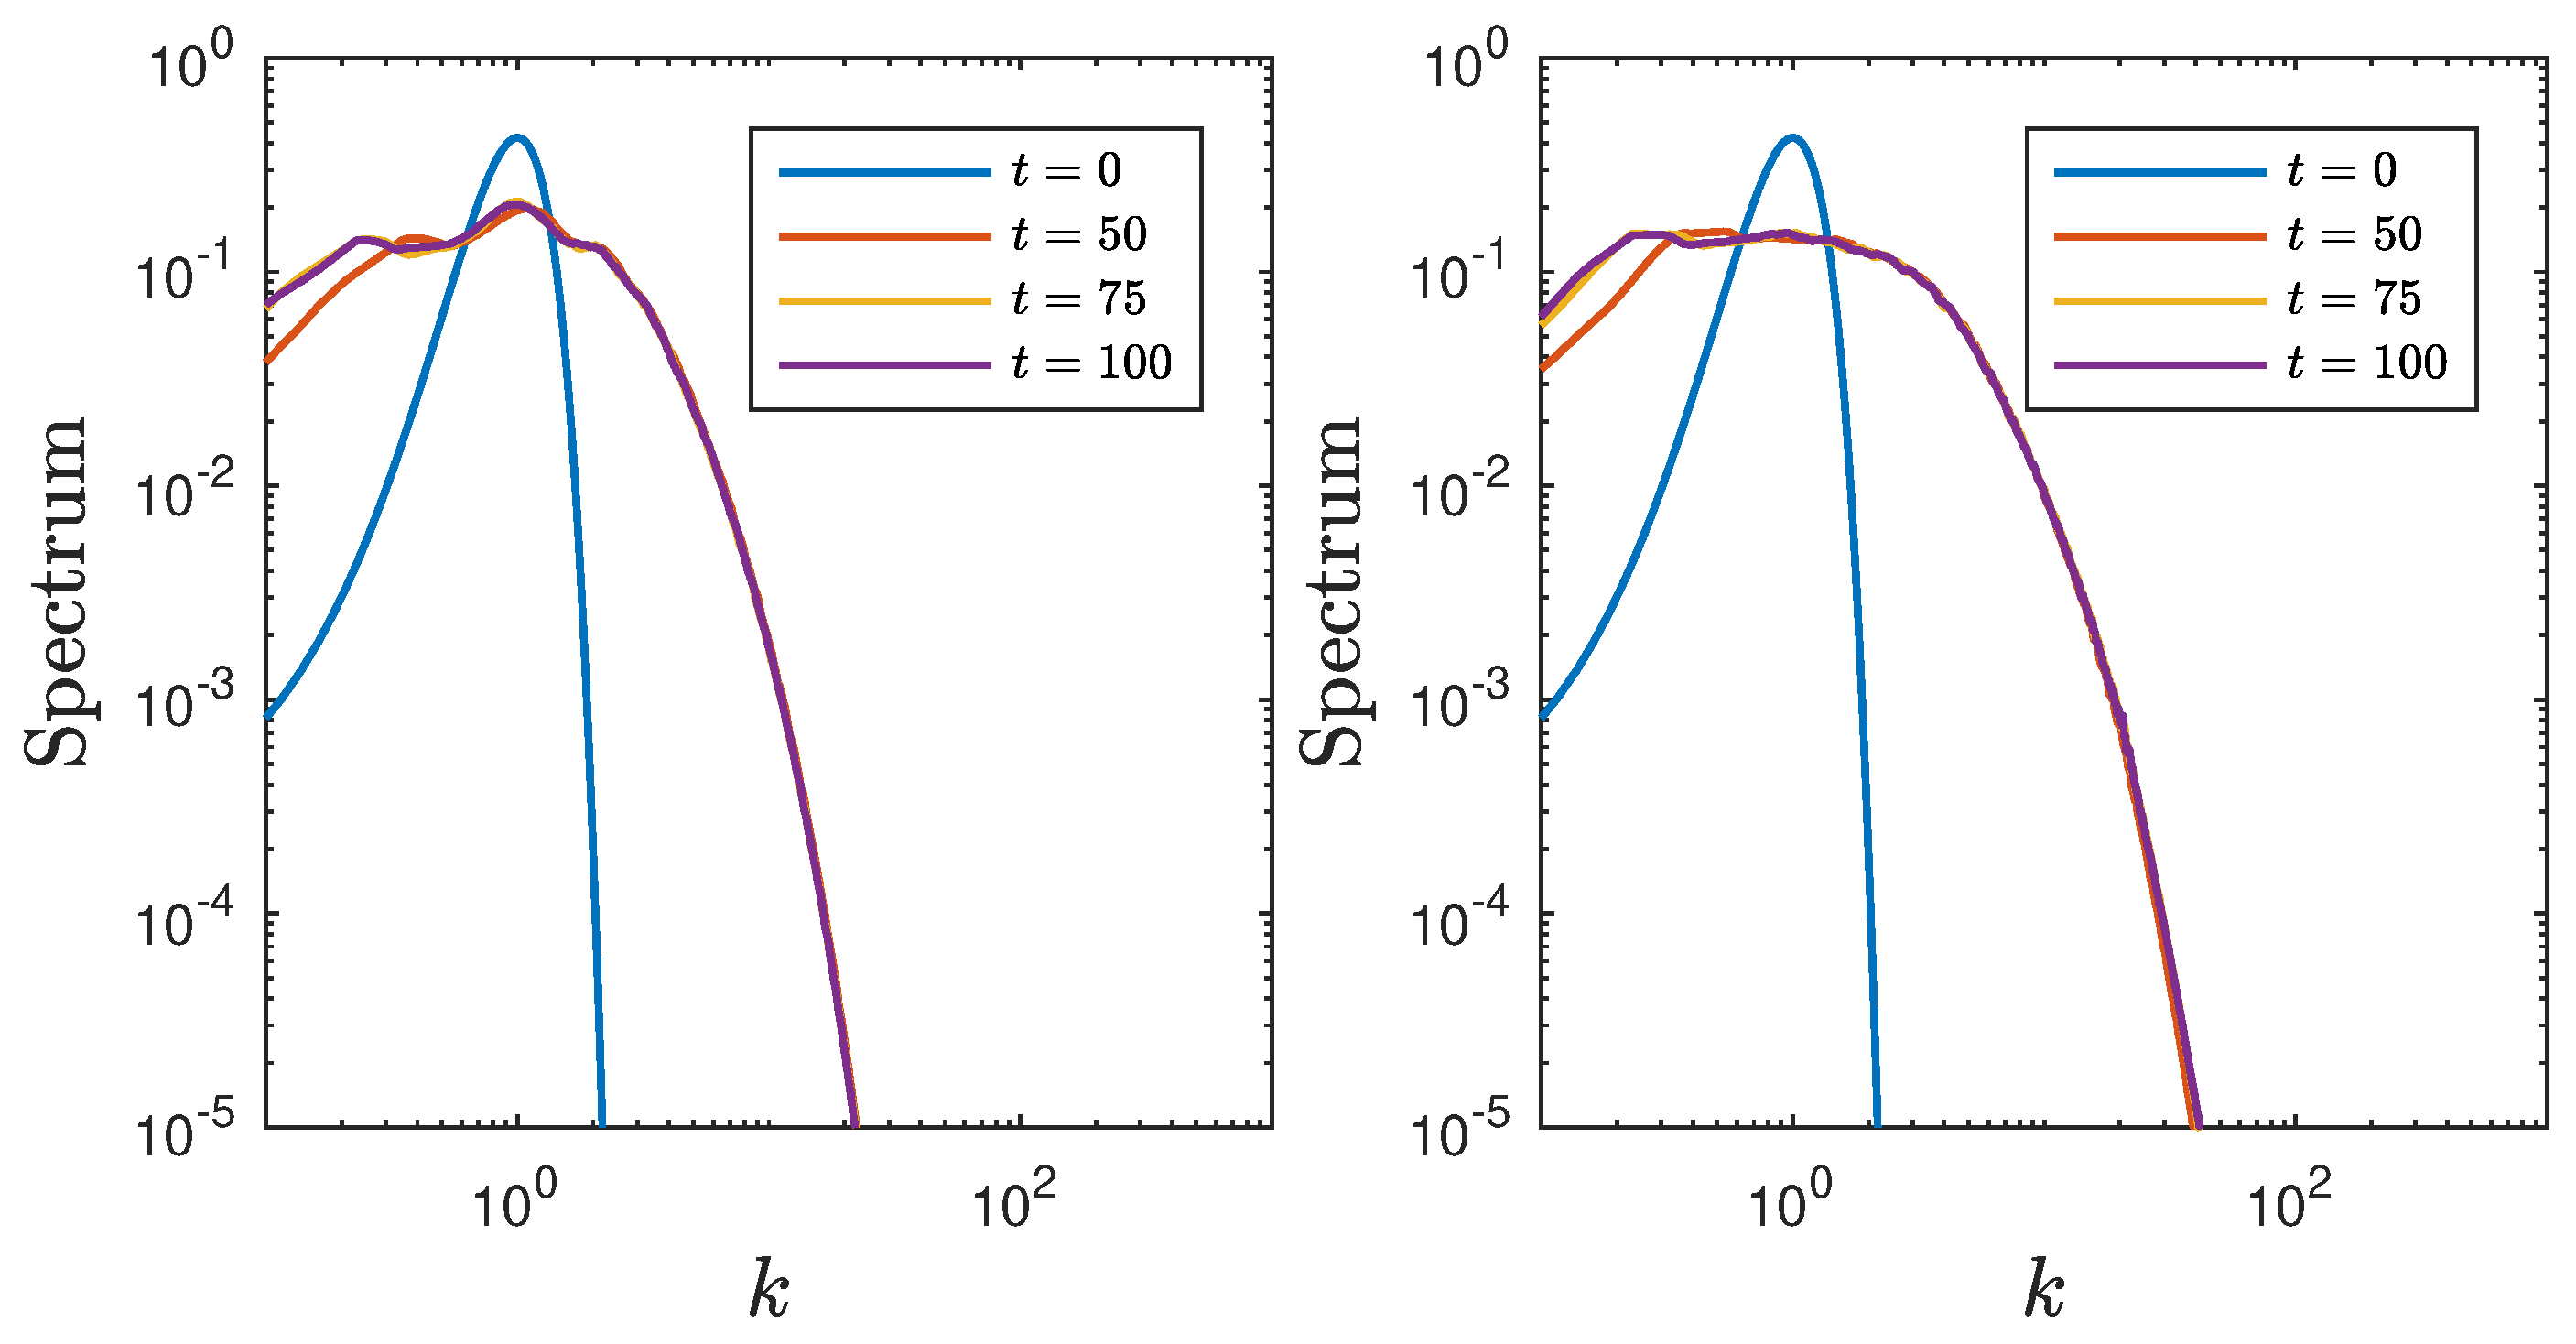
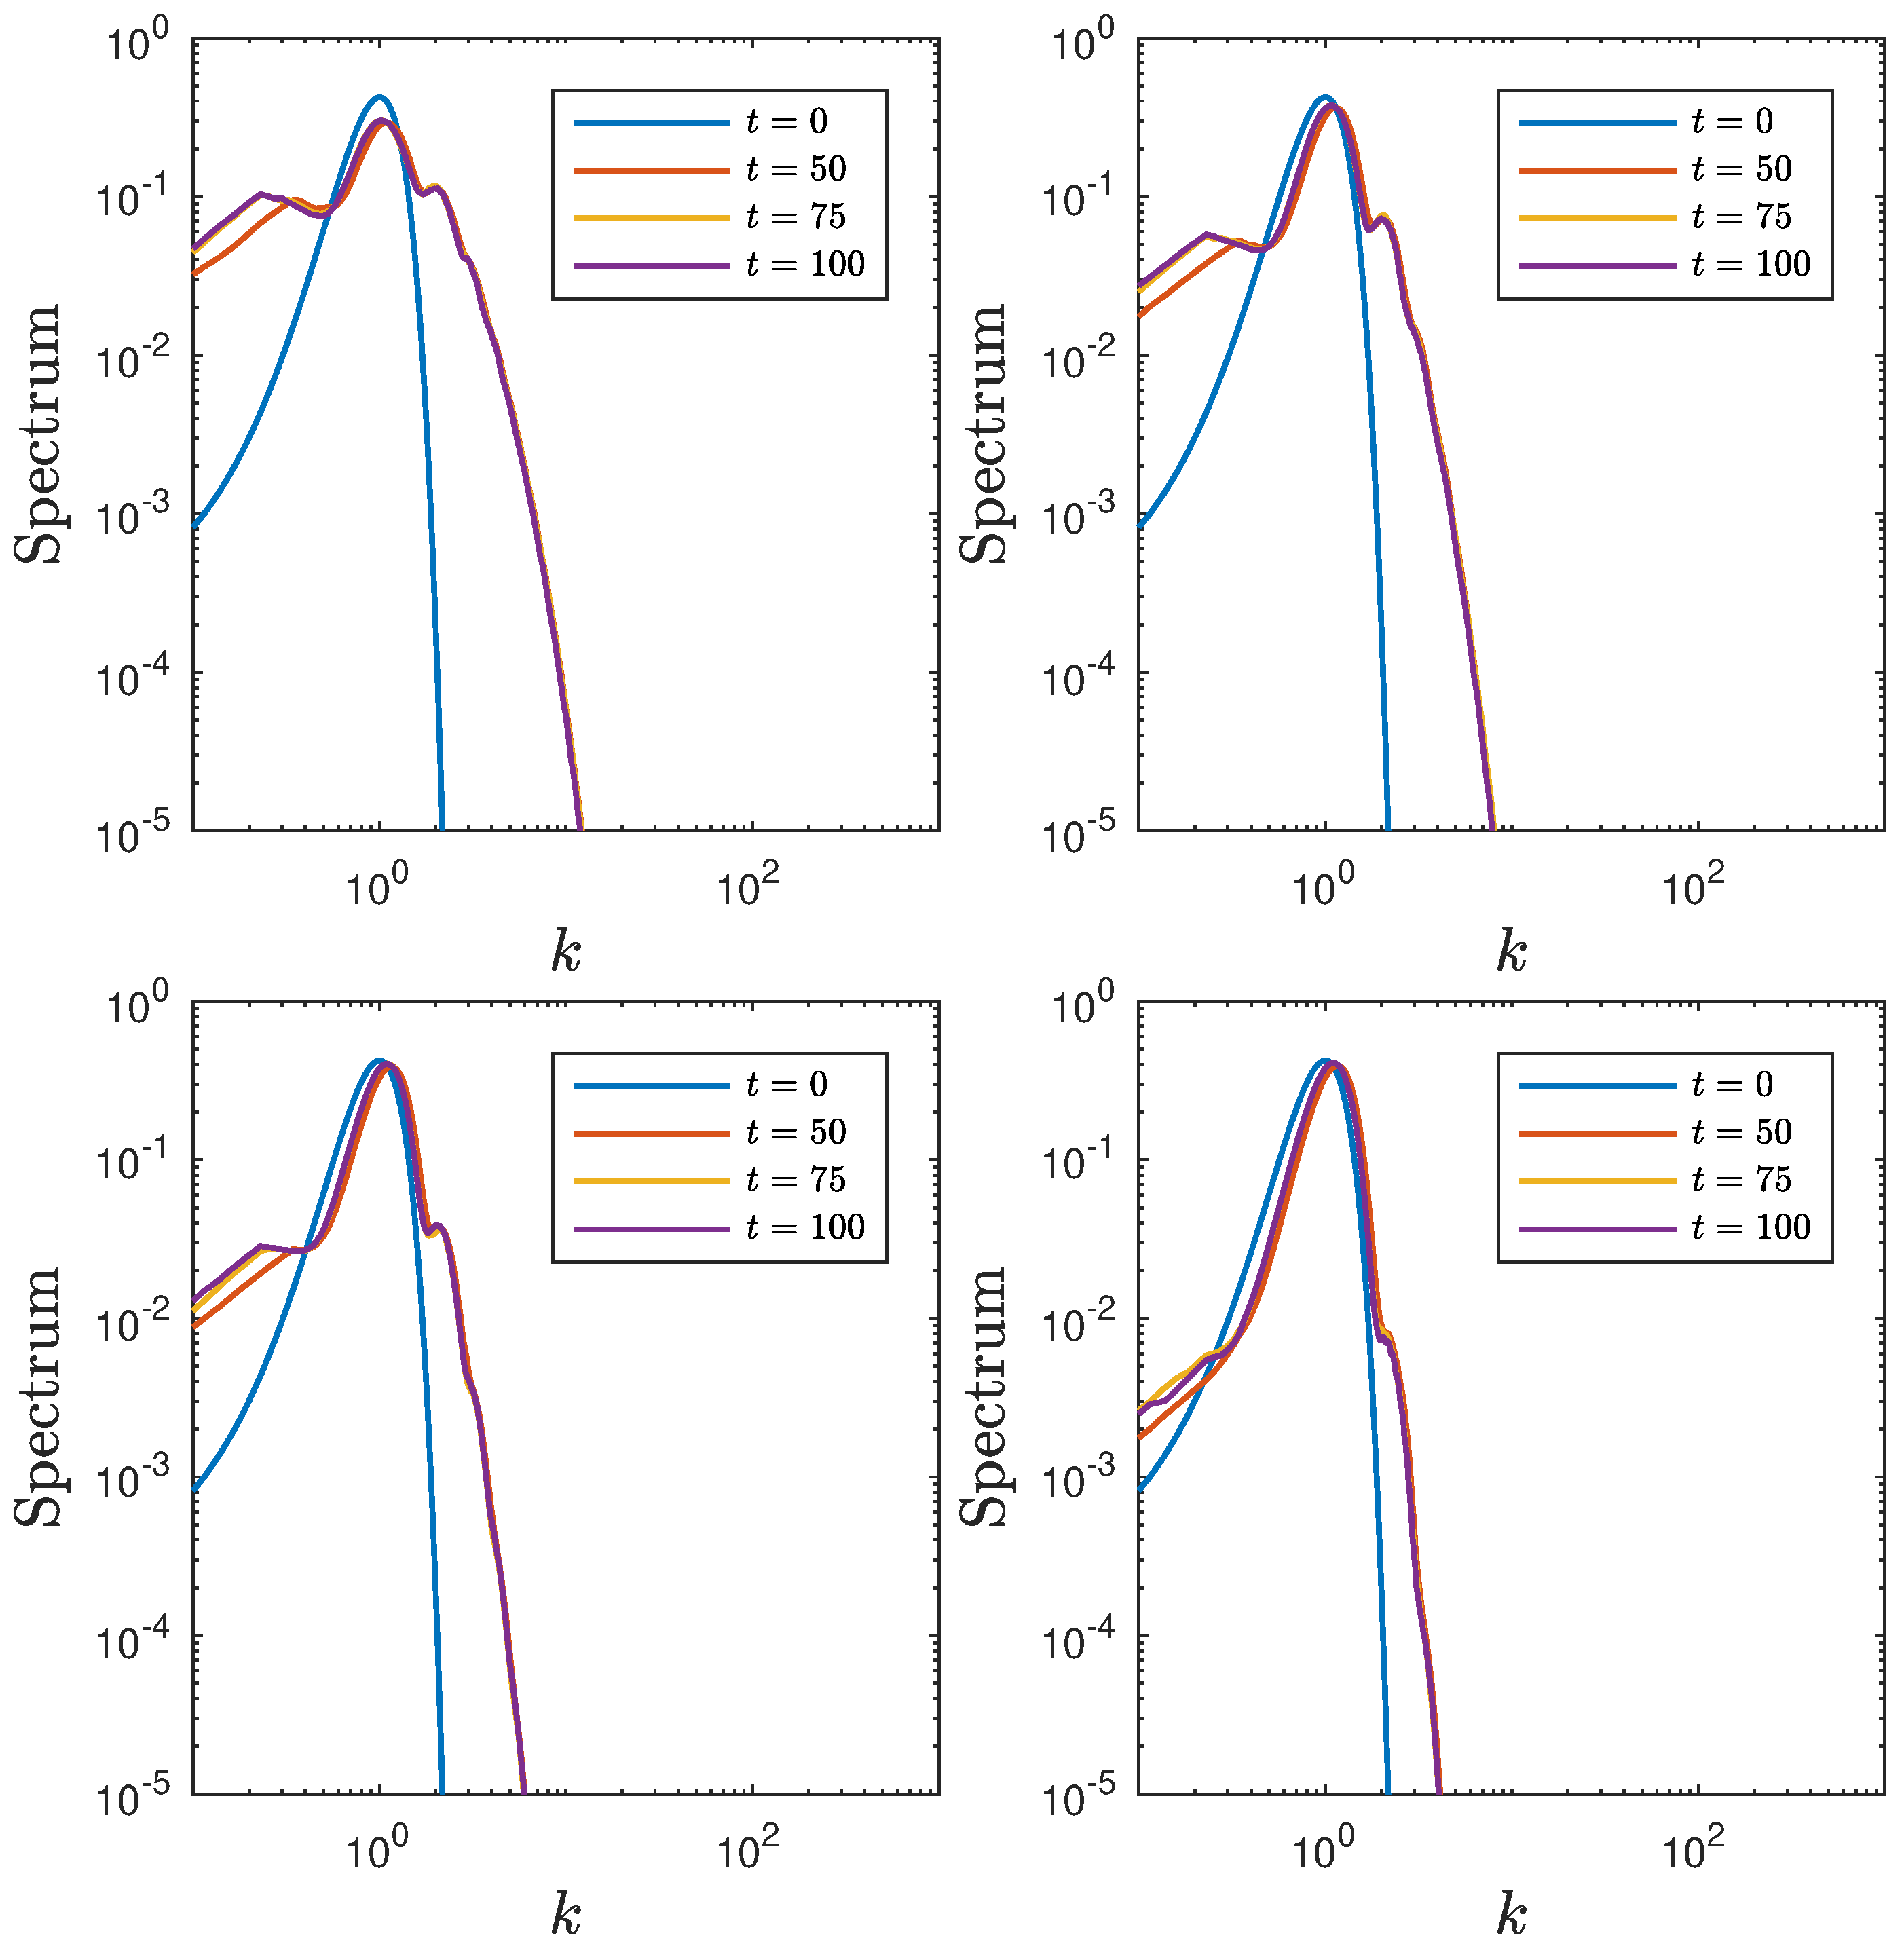
The evolution of the spectrum is studied across various U r values, ranging from 0.1 (representing nearly linear progression) to 6.7 (indicating a highly nonlinear wave behavior). To ensure reliable statistical outcomes, 300 realizations are averaged over different time periods. As anticipated, the presence of nonlinearity triggers a transformation in the spectrum, leading to its widening and eventual convergence into a stable state (refer to Figure 7). The nature of this stable state, determined by the Ursell parameter, displays an asymmetrical shape with a noticeable shift of energy towards lower frequencies, commonly known as the spectrum downshift effect. In cases of larger Ursell parameter values (as illustrated in (refer to Figure 7) (top)), the spectral density becomes more evenly distributed across smaller wave numbers (k-values). The prominence of spectrum flatness intensifies under strong nonlinearity ( U r = 6.7 ), indicating a higher energy level in the wave field and an increased significance of nonlinear effects. Consequently, a broader range of frequencies is necessary to accurately represent the wave spectrum. This inclination towards spectrum flatness aligns with the concept of statistical equilibrium in the absence of external inputs or outputs. These findings corroborate and strengthen the outcomes reported by Pelinovsky and Sergeeva [22] within the framework of the KdV equation.

4.3. Statistical Moments

To gain a deeper understanding of the wave fields interactions described in the previous subsection, we focus on examining four specific integrals, corresponding to four statistical moments
μ n ( t ) = 1 L 0 L u n ( x , t ) d x ,   where   n = 1 , 2 , 3 , 4 .
More precisely, we focus on two statistical quantities that characterize the wave spectrum. The kurtosis excess ( κ ) and the skewness ( ς ) are defined as
κ ( t ) = μ 4 μ 2 2 3   and   ς ( t ) = μ 3 μ 2 3 / 2 .
The kurtosis is a measure that indicates the tail heaviness of the spectrum. In simpler terms, it quantifies the degree of peakedness in the distribution and characterizes the influence of large waves on the overall distribution. A positive kurtosis implies a substantial contribution from large waves. Skewness, on the other hand, measures the asymmetry of the spectrum relative to the mean. Specifically, it represents the statistical measure of vertical asymmetry in the wave field, with its sign indicating the ratio of crests to troughs. A positive skewness signifies that crests are larger than troughs.
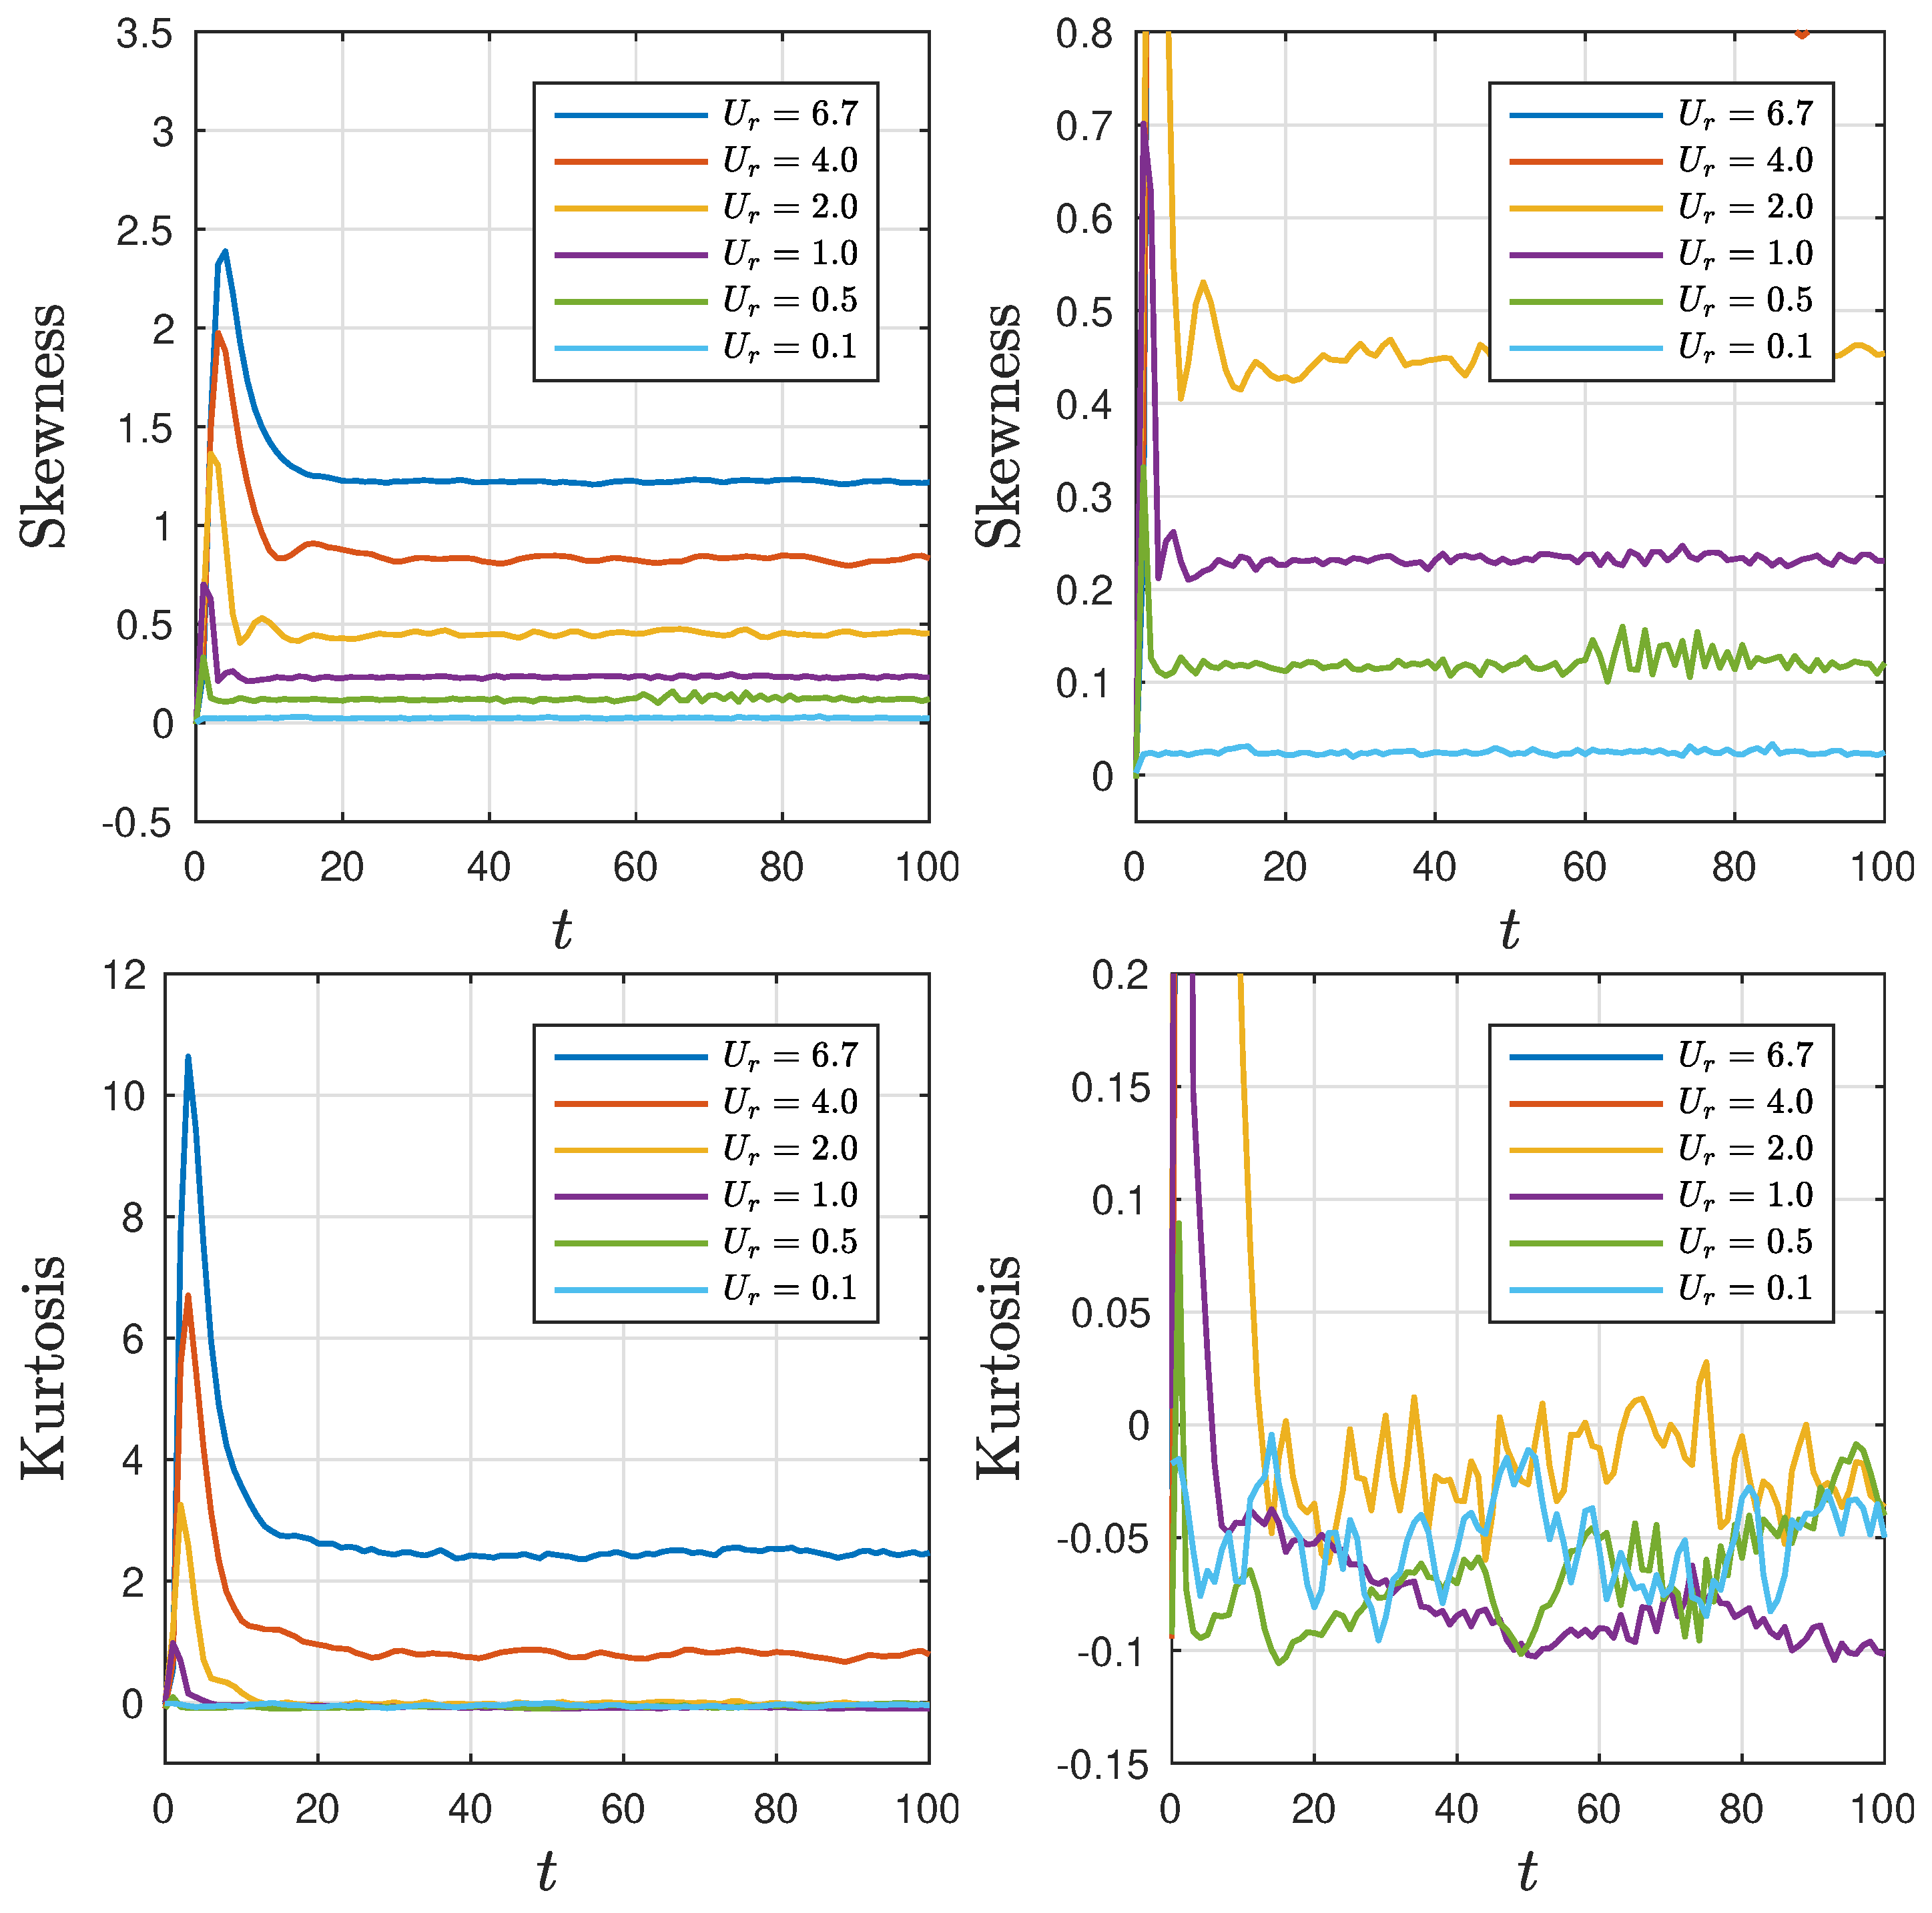
The behavior of statistical moments provides insights into the presence of a stationary state and its evolution over time. During a transition period of approximately 10 to 20 nonlinear time units, both moments of the wave field converge towards nearly constant values (see Figure 8). Regardless of the conditions, the skewness of the wave field remains positive, indicating that positive waves (crests) have larger amplitudes compared to negative waves (troughs). Furthermore, the asymptotic value of skewness increases as the Ursell parameter rises.
When the Ursell number is 2, the kurtosis shows oscillatory patterns centered around zero. This scenario resembles the findings reported by Onorato et al. [47] and Tanaka [48] in the context of deep water and the findings of Dutykh [21] for different depths using the Euler equations. In their studies, it was demonstrated that in deep water, the calculated kurtosis values exhibit oscillations around zero. For highly nonlinear random wave processes, some values surpass zero, indicating an increased likelihood of encountering large-amplitude waves, including freak waves. On the other hand, for smaller values, the kurtosis becomes negative, suggesting a lower probability of encountering such extreme events compared to what is expected for Gaussian processes. Conversely, under strong nonlinearity, the asymptotic value of kurtosis exceeds zero, indicating a higher probability of encountering large waves, with significant contributions from smaller waves within the wave field.

4.4. Crest Distribution

In this section, we compare the exceedance probability distributions of wave crests for different U r values with the Rayleigh distribution of amplitudes for a narrow-band Gaussian process
P ( u m a x ) = exp u m a x 2 2 σ 2 .
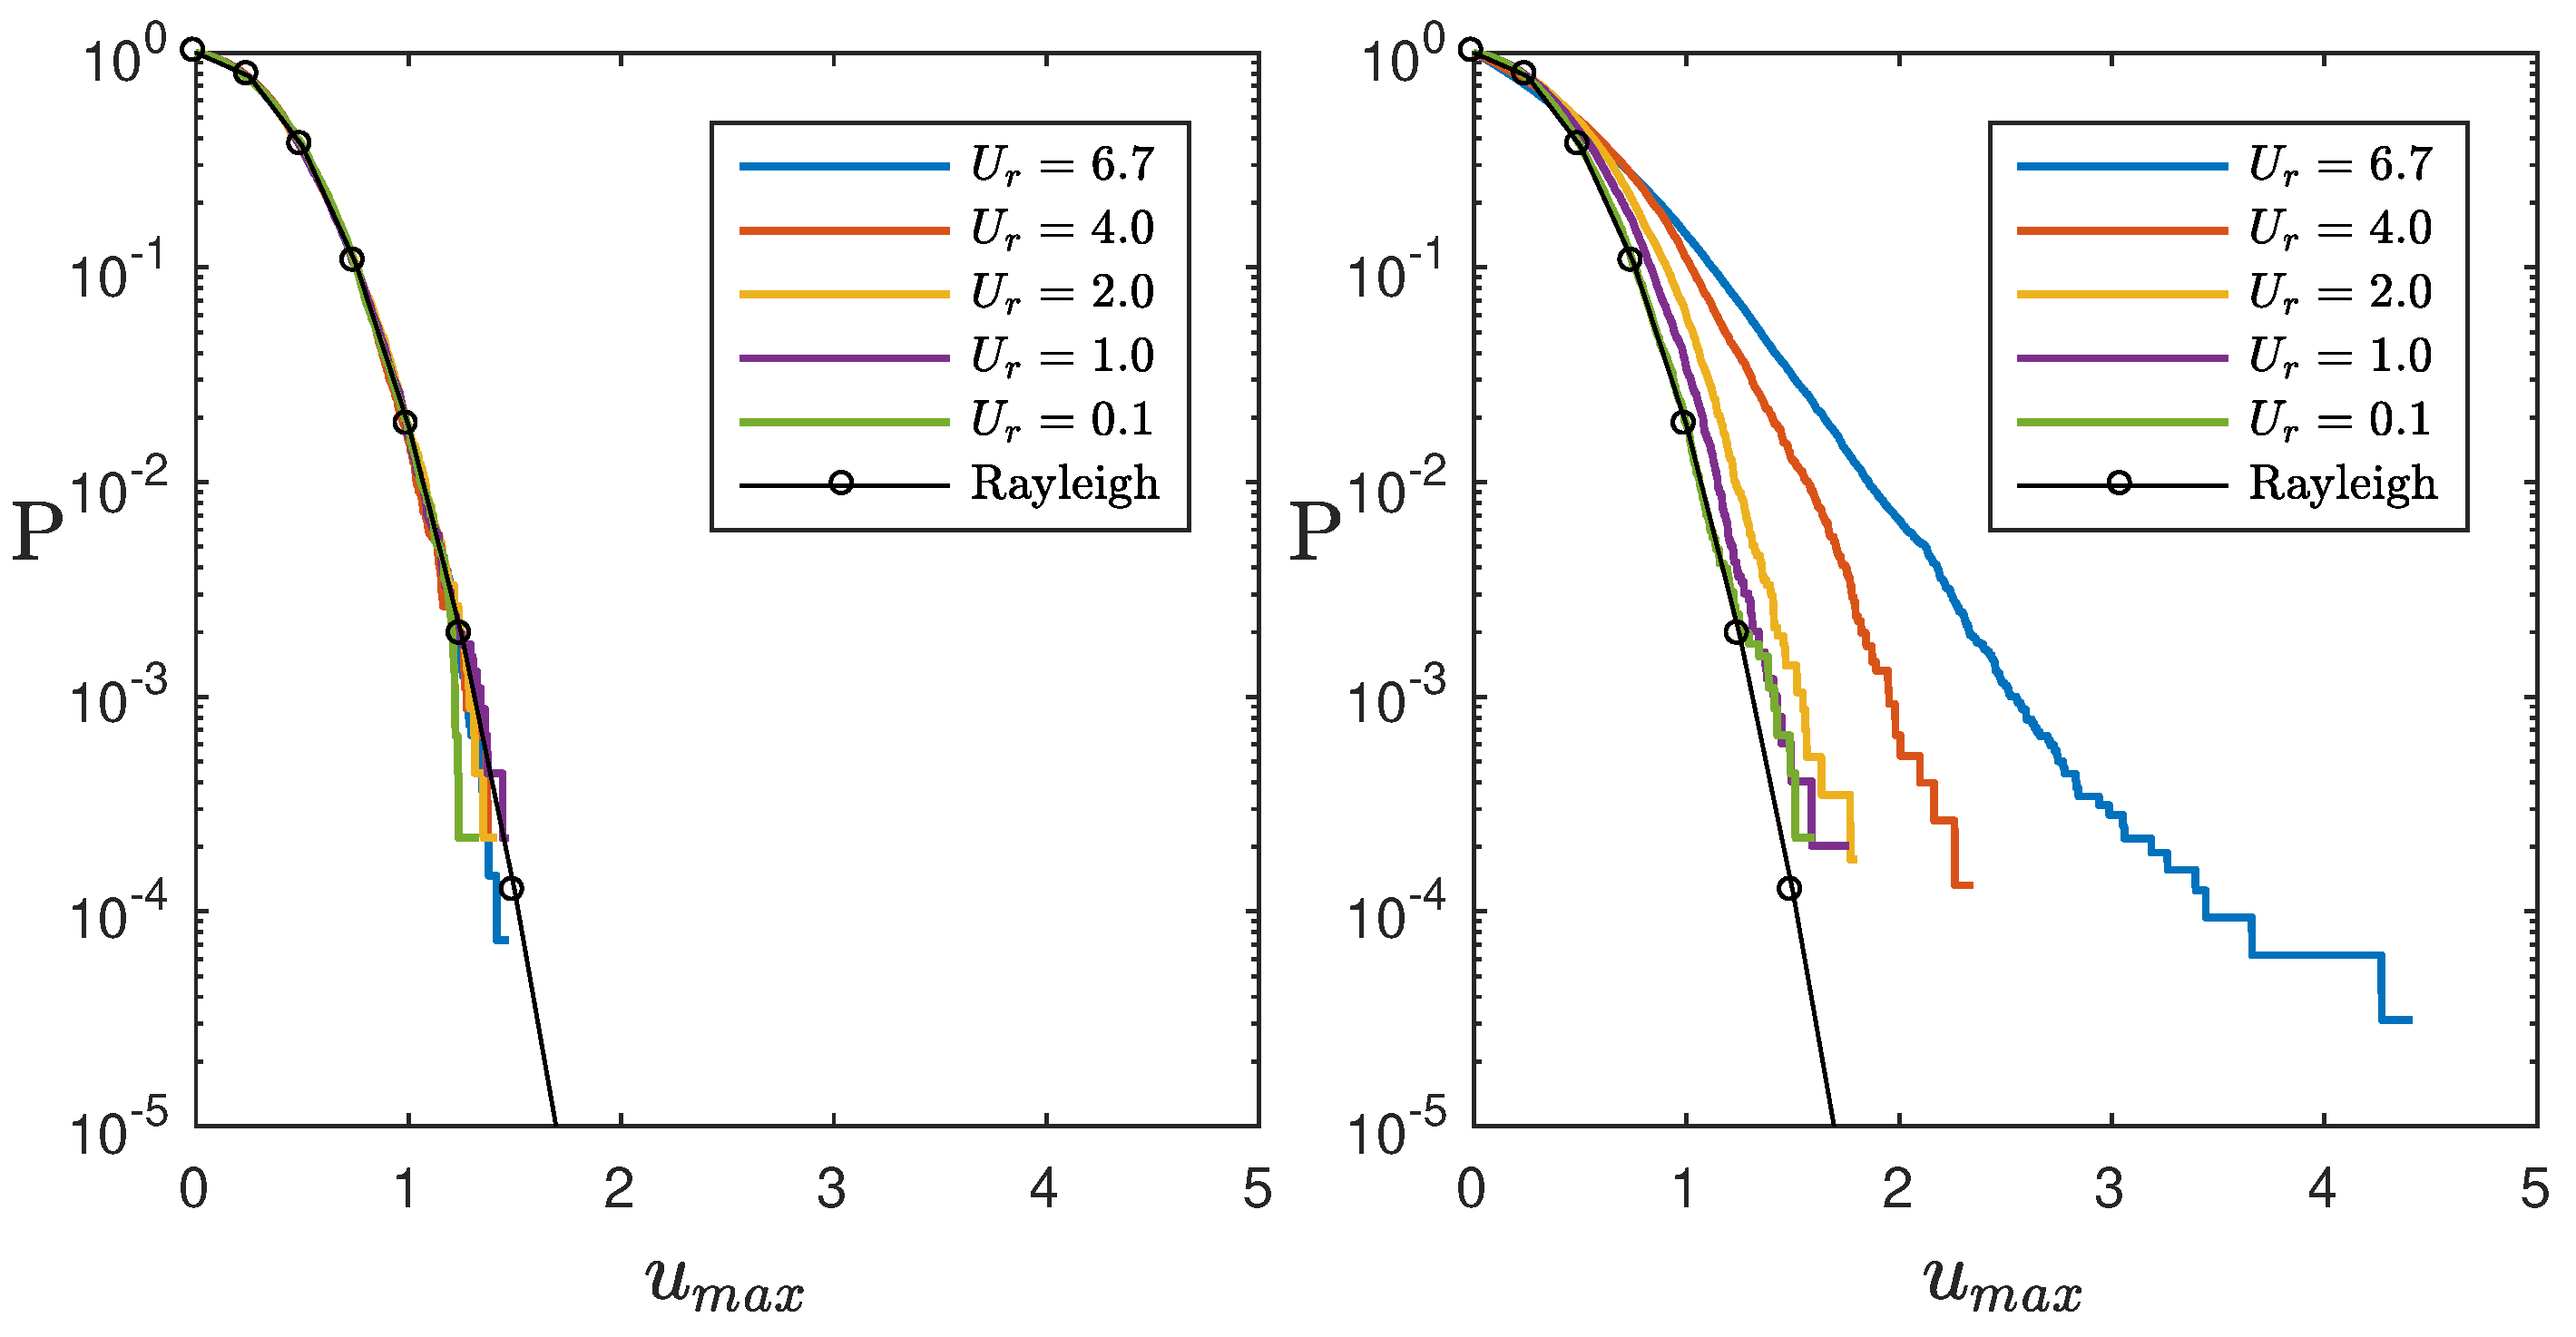
The instant distributions of wave crests, denoted as u m a x (representing local maxima of u between consecutive zero-crossing points), are computed for a dataset comprising approximately 150,000 waves. Initially, the wave phases are randomly distributed, and the crest distributions, denoted as P ( u m a x ) , exhibit a reasonable agreement with the Rayleigh law for narrow-banded waves (refer to Figure 9 (left)).
The probability distributions evolve over time. In the quasi-equilibrium stage (Figure 9 (right)), the wave crest distributions are compared with the theoretical predictions provided by Equation (19). Across all five cases, the distributions exhibit qualitatively similar behavior in relation to the reference Rayleigh curve for small amplitude waves. The asymptotic distribution surpasses the Rayleigh distribution, indicating an increased probability of encountering higher wave crests. Qualitatively, the shape of the amplitude distribution function aligns with the behavior of skewness and kurtosis depicted in Figure 8. The positive waves exhibit larger amplitudes than the negative waves, as indicated by the skewness, while the kurtosis highlights the significant contribution of small waves to the overall distribution.

5. Conclusions

In this work, we have explored the statistical properties of a random internal wave field with initially identical statistical properties. Based on the numerical simulations, our findings indicate that under strong nonlinearity, different types of freak waves might exist, including the intriguing three sisters phenomenon. We have observed that the spectral evolution of the wave field reaches a steady state across all Ursell parameters, but with increased nonlinearity, the spectral density becomes more uniformly distributed. This outcome aligns with previous research conducted by Pelinovsky and Sergeeva [22]. Furthermore, we have computed the kurtosis and skewness of the wave field. The positive skewness values indicate the asymmetry of the wave field, with sharper crests. As for the kurtosis, strong nonlinearity (large Ursell parameter values) demonstrates a significant contribution from larger waves in the wave dynamics. In contrast, strong dispersion (small Ursell parameter values) leads to kurtosis oscillating around zero or becoming negative. Additionally, we have examined the wave crest distribution for various Ursell parameter values, comparing it with the Rayleigh distribution. Our analysis reveals that as the Ursell number increases, the probability distribution function deviates slightly from the theoretical Rayleigh distribution, indicating differences in the distributions.

Author Contributions

Conceptualization, E.P. and M.V.F.; methodology and analysis, E.P. and M.V.F.; writing M.V.F.; All authors have read and agreed to the published version of the manuscript.

Funding

E.P. is supported by support by the Russian Science Foundation, grant 22-17-00153.

Institutional Review Board Statement

Not applicable.

Informed Consent Statement

Informed consent was obtained from all subjects involved in the study.

Data Availability Statement

Not applicable.

Acknowledgments

M.V.F is grateful to IMPA for hosting him as a visitor during the 2023 Post-Doctoral Summer Program.

Conflicts of Interest

The authors declare no conflict of interest.

References

  1. Apel, J.R.; Ostrovsky, L.A.; Stepanyants, Y.A.; Lynch, J.F. Internal solitons in the ocean and their effect on underwater sound. J. Acoust. Soc. Am. 2007, 121, 695. [Google Scholar] [CrossRef] [PubMed]
  2. Duda, T.F.; Lynch, J.F.; Irish, J.D.; Beardsley, R.C.; Ramp, S.R.; Chiu, C.-S.; Tang, T.Y.; Yang, Y.-J. Internal tide and nonlinear internal wave behavior at the continental slope in the northern South China Sea. IEEE J. Ocean Eng. 2004, 29, 110531. [Google Scholar] [CrossRef]
  3. Orr, M.H.; Mignerey, P.C. Nonlinear internal waves in the South China Sea: Observation of the conversion of depression internal waves to elevation internal waves. J. Geophys. Res. 2003, 108, 3064. [Google Scholar] [CrossRef]
  4. Grimshaw, R.; Pelinovsky, E.; Talipova, T.; Sergeeva, A. Rogue internal waves in the ocean: Long wave model. Eur. Phys. J. Spec. Top. 2010, 185, 195–208. [Google Scholar] [CrossRef]
  5. Bokaeeyan, M.; Ankiewicz, A.; Akhmediev, N. Bright and dark rogue internal waves: The Gardner equation approach. Phys. Rev. E 2019, 99, 062224. [Google Scholar] [CrossRef]
  6. Grimshaw, R.; Pelinovsky, E.; Talipova, T.; Kurkina, O. Internal solitary waves: Propagation, deformation and disintegration. Nonlinear Process. Geophys. 2010, 17, 633–649. [Google Scholar] [CrossRef]
  7. Choi, W.; Camassa, R. Weakly nonlinear internal waves in a two-fluid system. J. Fluid. Mech. 1996, 313, 83–103. [Google Scholar] [CrossRef]
  8. Matsuno, Y. A unified theory of nonlinear wave propagation in two-layer fluid systems. Phys. Soc. Japan 1993, 62, 1902–1916. [Google Scholar] [CrossRef]
  9. Matsuno, Y. Nonlinear evolution of surface gravity waves over an uneven bottom. J. Fluid Mech. 1993, 249, 121–133. [Google Scholar] [CrossRef]
  10. Alquran, M.; Ali, M.; Jadallah, H. New topological and non-topological unidirectional-wave solutions for the modified- mixed KdV equation and bidirectional-waves solutions for the Benjamin Ono equation using recent techniques. J. Ocean Eng. Sci. 2022, 7, 163–169. [Google Scholar] [CrossRef]
  11. Benjamin, T.B. Internal waves of permanent form of great depth. J. Fluid Mech. 1967, 295, 381–394. [Google Scholar] [CrossRef]
  12. Compelli, A.C.; Ivanov, R.I. Benjamin-Ono model of an internal wave under a flat surface. arXiv 2018, arXiv:1811.01446. [Google Scholar] [CrossRef]
  13. Davis, R.E.; Acrivos, A. Solitary internal waves in deep water. J. Fluid. Mech. 1967, 295, 593–607. [Google Scholar] [CrossRef]
  14. Kubota, T.; Ko, D.R.S.; Dobbs, L.D. Propagation of weakly nonlinear internal waves in a stratified fluid of finite depth. AZAA J. Hydrodyn. 1978, 12, 157–165. [Google Scholar]
  15. Meng, X. The solitary waves solutions of the internal wave Benjamin-Ono equation. J. Appl. Math. Phys. 2014, 2, 807. [Google Scholar] [CrossRef]
  16. Ono, H. Algebraic solitary waves in stratified fluids. J. Phys. Soc. Japan 1975, 39, 1082–1091. [Google Scholar] [CrossRef]
  17. Passaggia, P.Y.; Chalamalla, V.K.; Hurley, M.W.; Scotti, A.; Santilli, E. Estimating pressure and internal-wave flux from laboratory experiments in focusing internal waves. Exp. Fluids 2020, 61, 1–29. [Google Scholar] [CrossRef]
  18. Baines, S. Topographic Effects in Stratified Flows; Cambridge University Press: Cambridge, UK, 1995. [Google Scholar]
  19. Johnson, R.S. Models for the formation of a critical layer in water wave propagation. Philos. Trans. R. Soc. 2012, 370, 1638–1660. [Google Scholar] [CrossRef]
  20. Didenkulova, E.G.; Slunyaev, A.V.; Pelinovsky, E.N. Numerical simulation of random bimodal wave systems in the KdV framework. Eur. J. Mech. B. Fluids 2019, 78, 21–31. [Google Scholar] [CrossRef]
  21. Dutykh, D. Evolution of random wave fields in the water of finite depth. Procedia Iutam 2014, 11, 34–43. [Google Scholar] [CrossRef]
  22. Pelinovsky, E.; Sergeeva, A. Numerical modeling of the KdV random wave field. Eur. J. Mech. B Fluids 2002, 15, 66–77. [Google Scholar] [CrossRef]
  23. Pelinovsky, E.; Shurgalina, E. Nonlinear dynamics of a soliton gas: Modified Korteweg-de Vries equation framework. Phys. Lett. A 2006, 380, 2049–2053. [Google Scholar]
  24. Viotti, C.; Dutykh, D.; Dudley, J.M.; Dias, F. Emergence of coherent wave groups in deep-water random sea. Phys. Rev. E 2013, 87, 063001. [Google Scholar] [CrossRef]
  25. Alfaro-Vigo, D.; Fouque, J.; Garnier, J.; Nachbin, A. Robustness of time reversal for waves in time-dependent random media. Stoch. Process. Their Appl. 2004, 113, 289–313. [Google Scholar] [CrossRef]
  26. Fouque, J.; Garnier, J.; Nachbin, A. Time reversal for dispersive waves in random media. SIAM J. Appl. Math. 2004, 64, 1819–1836. [Google Scholar]
  27. Fouque, J.; Garnier, J.; Nachbin, A.; Solna, K. Time reversal refocusing for point source in randomly layered media. Wave Motion. 2005, 42, 238–260. [Google Scholar] [CrossRef]
  28. Nachin, A.; Solna, K. Apparent diffusion due to topographic microstructure in shallow waters. Phys. Fluids 2017, 2, 034801. [Google Scholar]
  29. Dudley, J.M.; Genty, G.; Mussot, A.; Chabchoub, A.; Dias, F. Rogue waves and analogies in optics and oceanography. Nat. Rev. Phys. 2019, 1, 675–689. [Google Scholar] [CrossRef]
  30. Kharif, C.; Pelinovsky, E.; Slunyaev, A. Rogue Waves in the Ocean (Book Series: Advances in Geophysical and Environmental Mechanics and Mathematics); Springer: Berlin/Heidelberg, Germany, 2009. [Google Scholar]
  31. Onorato, M.; Residori, S.; Bortolozzo, U.; Montina, S.; Arecchi, F. Rogue waves and their generating mechanisms in different physical contexts. Phys. Rep. 2013, 528, 47–89. [Google Scholar] [CrossRef]
  32. Didenkulova, E.G.; Pelinovsky, E. Estimation of a freak wave lifetime in the shallow sea. J. Mar. Sci. Eng. 2023, 11, 482. [Google Scholar] [CrossRef]
  33. Lvov, Y.V.; Tabak, E.G. Hamiltonian formalism and the Garrett-Munk spectrum of internal waves in the ocean. Phys. Rev. Lett. 2001, 87, 168501. [Google Scholar] [CrossRef]
  34. Lvov, Y.V.; Nazarenko, S. Noisy spectra, long correlations, and intermittency in wave turbulence. Phys. Rev. E 2004, 69, 066608. [Google Scholar] [CrossRef] [PubMed]
  35. Lvov, Y.V.; Tabak, E.G. A Hamiltonian Formulation for Long Internal Waves. Phys. D 2004, 195, 106. [Google Scholar] [CrossRef]
  36. Lvov, Y.V.; Yokoyama, N. Energy spectra of internal waves in stratified fluid: Direct numerical simulations. Phys. D 2009, 238, 803–815. [Google Scholar] [CrossRef]
  37. Trefethen, L.N. Spectral Methods in MATLAB; SIAM: Philadelphia, PA, USA, 2001. [Google Scholar]
  38. Flamarion, M.V.; Milewski, P.A.; Nachbin, A. Rotational waves generated by current-topography interaction. Stud. Appl. Math. 2019, 142, 433–464. [Google Scholar] [CrossRef]
  39. Flamarion, M.V.; Pelinovsky, E. Interaction of interfacial waves with an external force: The Benjamin-Ono equation framework. Symmetry 2023, 15, 1478. [Google Scholar] [CrossRef]
  40. Akhmediev, N.; Soto-Crespo, J.M.; Ankiewicz, A. How to excite a rogue wave. Phys. Rev. A 2007, 80, 043818. [Google Scholar] [CrossRef]
  41. Solli, D.R.; Ropers, C.; Koonath, P.; Jalali, B. Optical rogue waves. Nature 2009, 450, 1054–1057. [Google Scholar] [CrossRef] [PubMed]
  42. Yeom, D.-L.; Eggleton, B.J. Rogue waves surface in light. Nature 2007, 450, 953–954. [Google Scholar] [CrossRef]
  43. Bai, X.; Zhang, D. Search for rogue waves in Bose-Einstein condensates via a theory-guided neural network. Phys. Rev. E 2022, 106, 025305. [Google Scholar] [CrossRef]
  44. Manikandan, K.; Senthilvelan, M.; Kraenkel, R.A. Amplification of matter rogue waves and breathers in quasi-two-dimensional Bose-Einstein condensates. Eur. Phys. J. B 2016, 89, 30. [Google Scholar] [CrossRef]
  45. Tan, Y.; Bai, X.; Tiantian, L. Super rogue waves: Collision of rogue waves in Bose-Einstein condensate. Phys. Rev. E 2022, 106, 014208. [Google Scholar] [CrossRef]
  46. Yan, Z.Y. Financial Rogue Waves. Commun. Theor. Phys. 2010, 54, 947. [Google Scholar] [CrossRef]
  47. Onorato, M.; Osborne, A.R.; Serio, M.; Bertone, S. Freak wave in random oceanic sea states. Phys. Rev. Lett. 2001, 86, 5831–5834. [Google Scholar] [CrossRef] [PubMed]
  48. Tanaka, M. A method of studying of nonlinear random fields. Fluid Dynam. Res. 2001, 86, 41–60. [Google Scholar] [CrossRef]
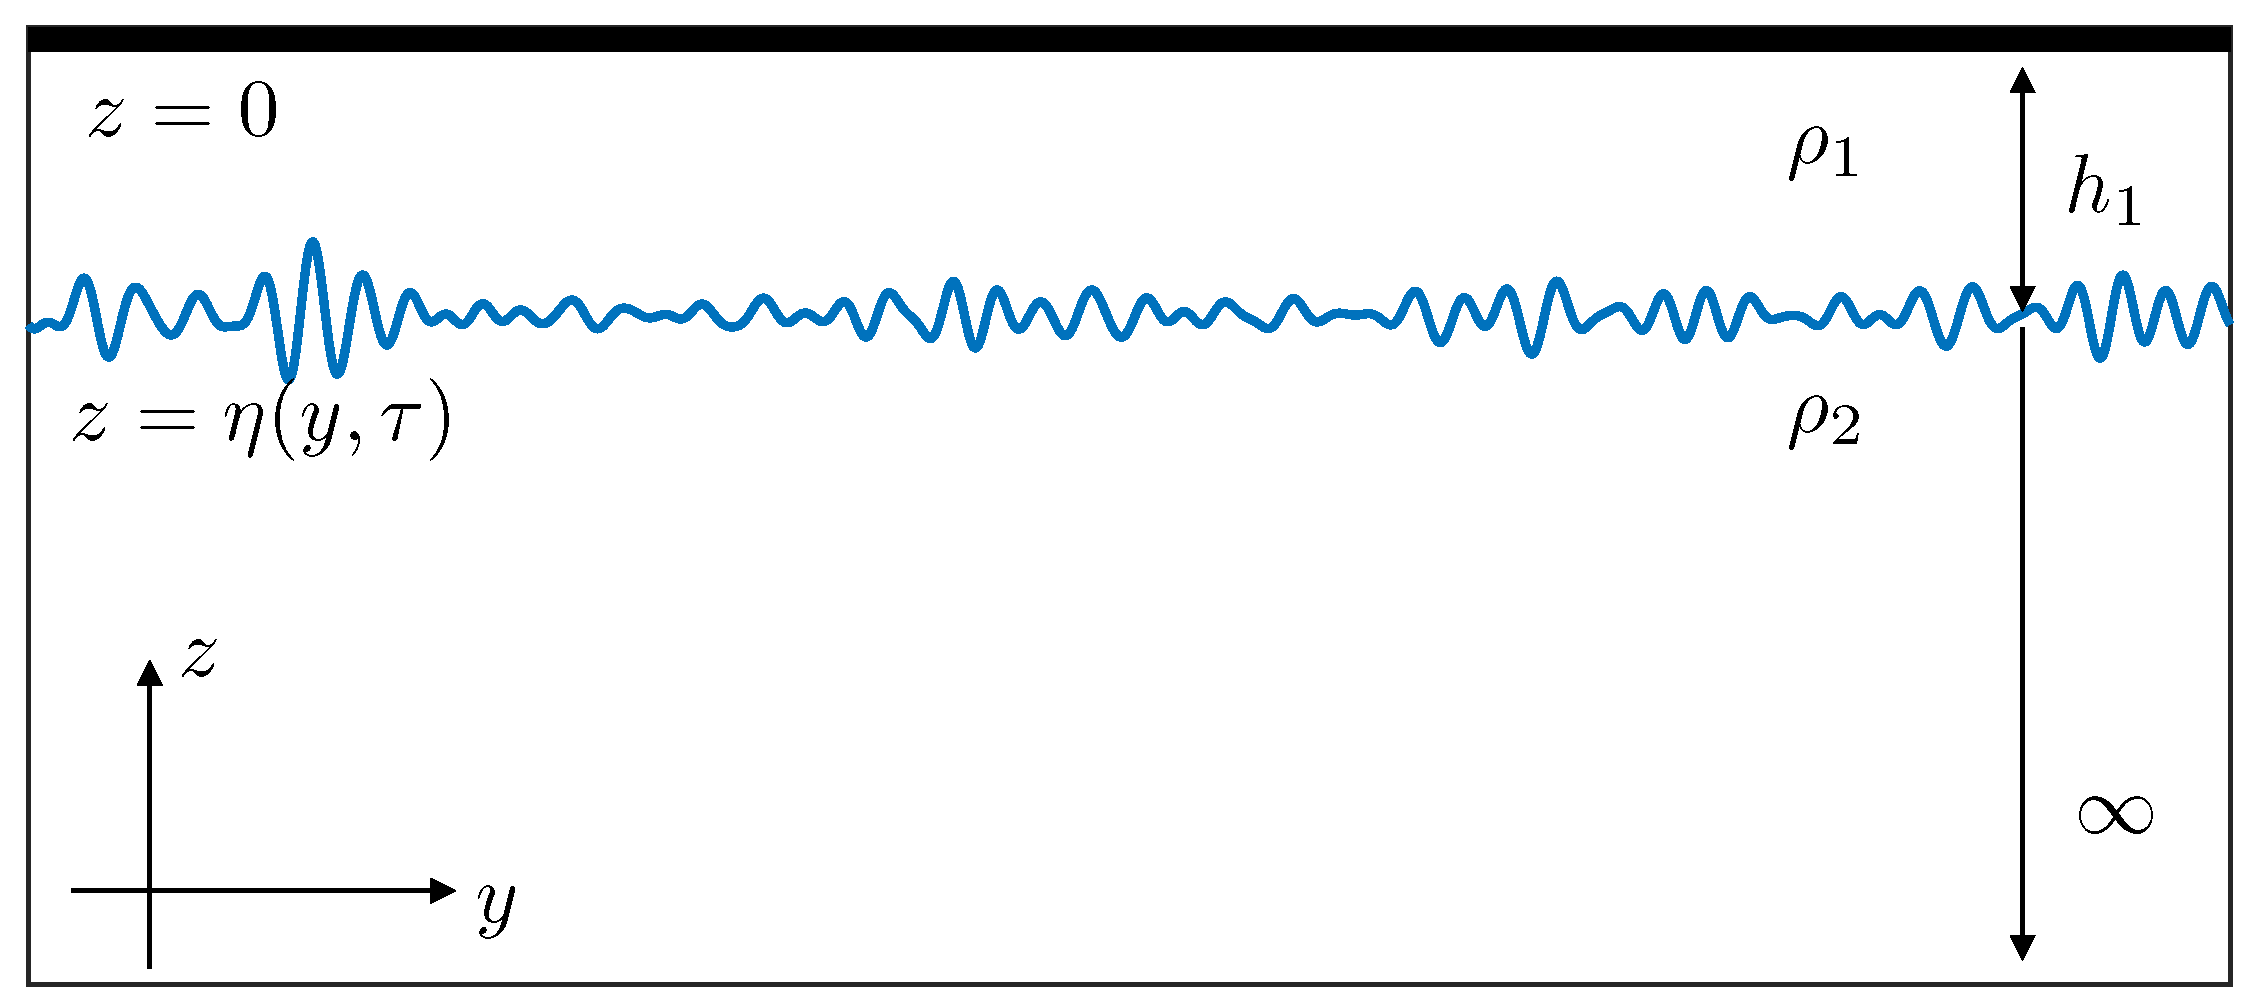
Figure 1. Sketch of the BO model.
Jmse 11 01853 g001
Figure 2. The conserved quantities of BO equation for different simulations. On the left is the mass conservation and on the right is the momentum.
Jmse 11 01853 g002
Figure 3. The evolution of the wave field at different times with U r = 6.7 .
Jmse 11 01853 g003
Figure 4. The evolution of the wave field for different values of the parameter U r . From (top) to (bottom) and (left) to (right) U r = 6.7 , U r = 4.0 , U r = 2.0 and U r = 1.0 .
Jmse 11 01853 g004aJmse 11 01853 g004b
Figure 5. (Left): Maximum of wave amplitudes over time. (Right): Distribution of maximum crest amplitudes over 300 realizations for different values of U r .
Jmse 11 01853 g005
Figure 6. (Left): The occurrence of a freak wave, “two sisters” and “three sisters” at simulation number 142, time t = 99 , number 4, time t = 99 and number 84 and time t = 20 , respectively, for U r = 6.7 . (Right): Zoom of the freak wave.
Jmse 11 01853 g006aJmse 11 01853 g006b
Figure 7. Averaged evolution of spectra of the wave fields at different times. From (top) to (bottom) and (left) to (right) U r = 6.7 , U r = 4.0 , U r = 2.0 , U r = 1.0 , U r = 0.5 and U r = 0.1 .
Jmse 11 01853 g007aJmse 11 01853 g007b
Figure 8. Temporal evolution of the skewness and kurtosis for different values of the parameter U r averaged over 300 realizations. On the right, the zooming of the figures on the left.
Jmse 11 01853 g008
Figure 9. The exceedance probability distributions for wave crests at the initial moment ( t = 0 ) and the asymtotic distribution ( t = 100 ) (right) for different Ursell numbers over 300 realizations. The black solid line with circles corresponds to the Rayleigh distribution of the narrow-band Gaussian process.
Jmse 11 01853 g009
Disclaimer/Publisher’s Note: The statements, opinions and data contained in all publications are solely those of the individual author(s) and contributor(s) and not of MDPI and/or the editor(s). MDPI and/or the editor(s) disclaim responsibility for any injury to people or property resulting from any ideas, methods, instructions or products referred to in the content.