1. Introduction
On planet Earth, in all its geospheres, various catastrophic processes regularly occur, causing significant economic damage every year. Pacific tropical cyclones, also called typhoons, are one of such processes developing in the atmosphere. Typhoons originate near warm equatorial waters and move to the northern part of the globe, covering, depending on the trajectory of their movement, various inhabited islands and mainland territories. Studies of multi-scale processes resulting from the interaction of powerful cyclonic vortices with the Earth’s surface are associated with the need to reduce the potential impact of typhoons by researching the physical processes generated in the geosphere as a result of various interactions.
During strong wind interaction with the sea surface, powerful infrasonic oscillations occur in the atmosphere in the frequency range below the hearing threshold of 20 Hz. Atmospheric oscillations were discovered on a ship working in a stormy sea in the 1930s, and the discovery had an incidental nature [
1]. These processes of infrasonic generation were called the “voice of the sea”, and in publications in English, this phenomenon and all the others with lower frequencies were called microbaroms [
2]. Oscillations are generated as a result of nonlinear interaction of surface sea waves. Studies of microbarom generation are carried out using single microbarographs, or their spatially distributed complex, the units of which measure signals propagating in the atmosphere [
3,
4].
In 2016, powerful microseismic infrasonic oscillations were registered in the frequency range of 7–9 Hz [
5]. The signals were recorded by the system of coastal laser strainmeters and identified in 2018 during a study of archival data on variations in microdeformations of the Earth’s crust. These microseismic oscillations were registered during the movement of Typhoon Lionrock in the northern and northeastern parts of the Sea of Japan. Researching various scientific sources of information, only a few studies of such signals were found. Investigations of the processes of the generation of the “voice of the sea” infrasonic signal were mainly of a theoretical nature. The theory of “voice of the sea” signal generation [
6,
7] included a number of different mechanisms of its origin. These theories describe several different processes of generating infrasonic oscillations. Their generation can occur as a result of interaction of the wind flow with the moving crests of sea waves; appearance of wind waves of various directions in the area of action of the cyclonic vortex; and the appearance of the standing waves area. One of the earlier studies showed that the area of generation of infrasonic oscillations should belong mainly to the rear part of a cyclone and is not related to its central area [
8]. When processing archival data of microdeformations in the Earth’s crust, obtained by laser strainmeters over the past decade, this fact was confirmed [
9]. Also, based on the results of processing numerous archival data obtained from laser strainmeters, it was found that the frequency range in which these infrasonic oscillations appear can be fairly wide, occupying a band from 6 to 12 Hz. Studying such areas by contact methods is practically impossible, since they are generated by high-energy cyclonic vortices moving in the open sea. The experimental remote method of registering the infrasonic signals by multidirectional devices measuring various seismic oscillations has received good confirmation. Hence, the no-contact ground-based remote sensing method with the use of laser strainmeters is an additional source of knowledge about infrasonic processes.
Upon finding microseismic oscillations of the “voice of the sea” in the records of in situ observations of microdeformations of the Earth’s crust, we assumed that such infrasonic signals can be generated also during periods of the passage of other typhoons over the Sea of Japan. In the study of the extensive database of microdeformations of the Earth’s crust in the south of the Primorsky Territory covering the past 20 years, we analyzed the presence of infrasonic signals during the passage of tropical cyclones of varying power over the Sea of Japan, the area of influence of which either directly extended to the region of the Primorsky Territory or caused an indirect impact when moving near the Far East coast of the Russian Federation. We determined that during periods of typhoon movement over the Sea of Japan, coastal laser strainmeters register microseisms of infrasonic oscillations in the frequency range, in different cases, from 6 to 12 Hz and have different signal bandwidths and different amplitude frequency characteristics. Using a detailed analysis of the periods of “voice of the sea” infrasonic oscillation registration (in some cases lasting more than 48 h) by means of a two-coordinate coastal laser strainmeter, we were able to identify the dependence of the change in direction on the signal arrival source and to study the movement of the region of generation relative to the measuring complex. Also, the possibility of identifying the zones of “voice of the sea” microseism generation in the Sea of Japan was shown [
10]. These studies have shown that the zones of generation of these microseisms are located in the regions of primary microseism generation, located near the surf zone at a distance of more than 300 km from the place of registration.
One of the objectives of this article is to show the dangers of a too-early termination of warning of dangerous atmospheric processes, at the time when they still retain their structure and destructive power. In most cases, typhoons moving across the Sea of Japan generate powerful microseismic “voice of the sea” oscillations, the features and dynamics of which will be present in the article.
2. Laser-Interference Measuring Complex
In the Primorsky Territory of the Russian Federation, a unique laser-interference complex has been continuously operating for several decades, performing high-precision measurements of atmospheric pressure variations and geophysical deformation processes [
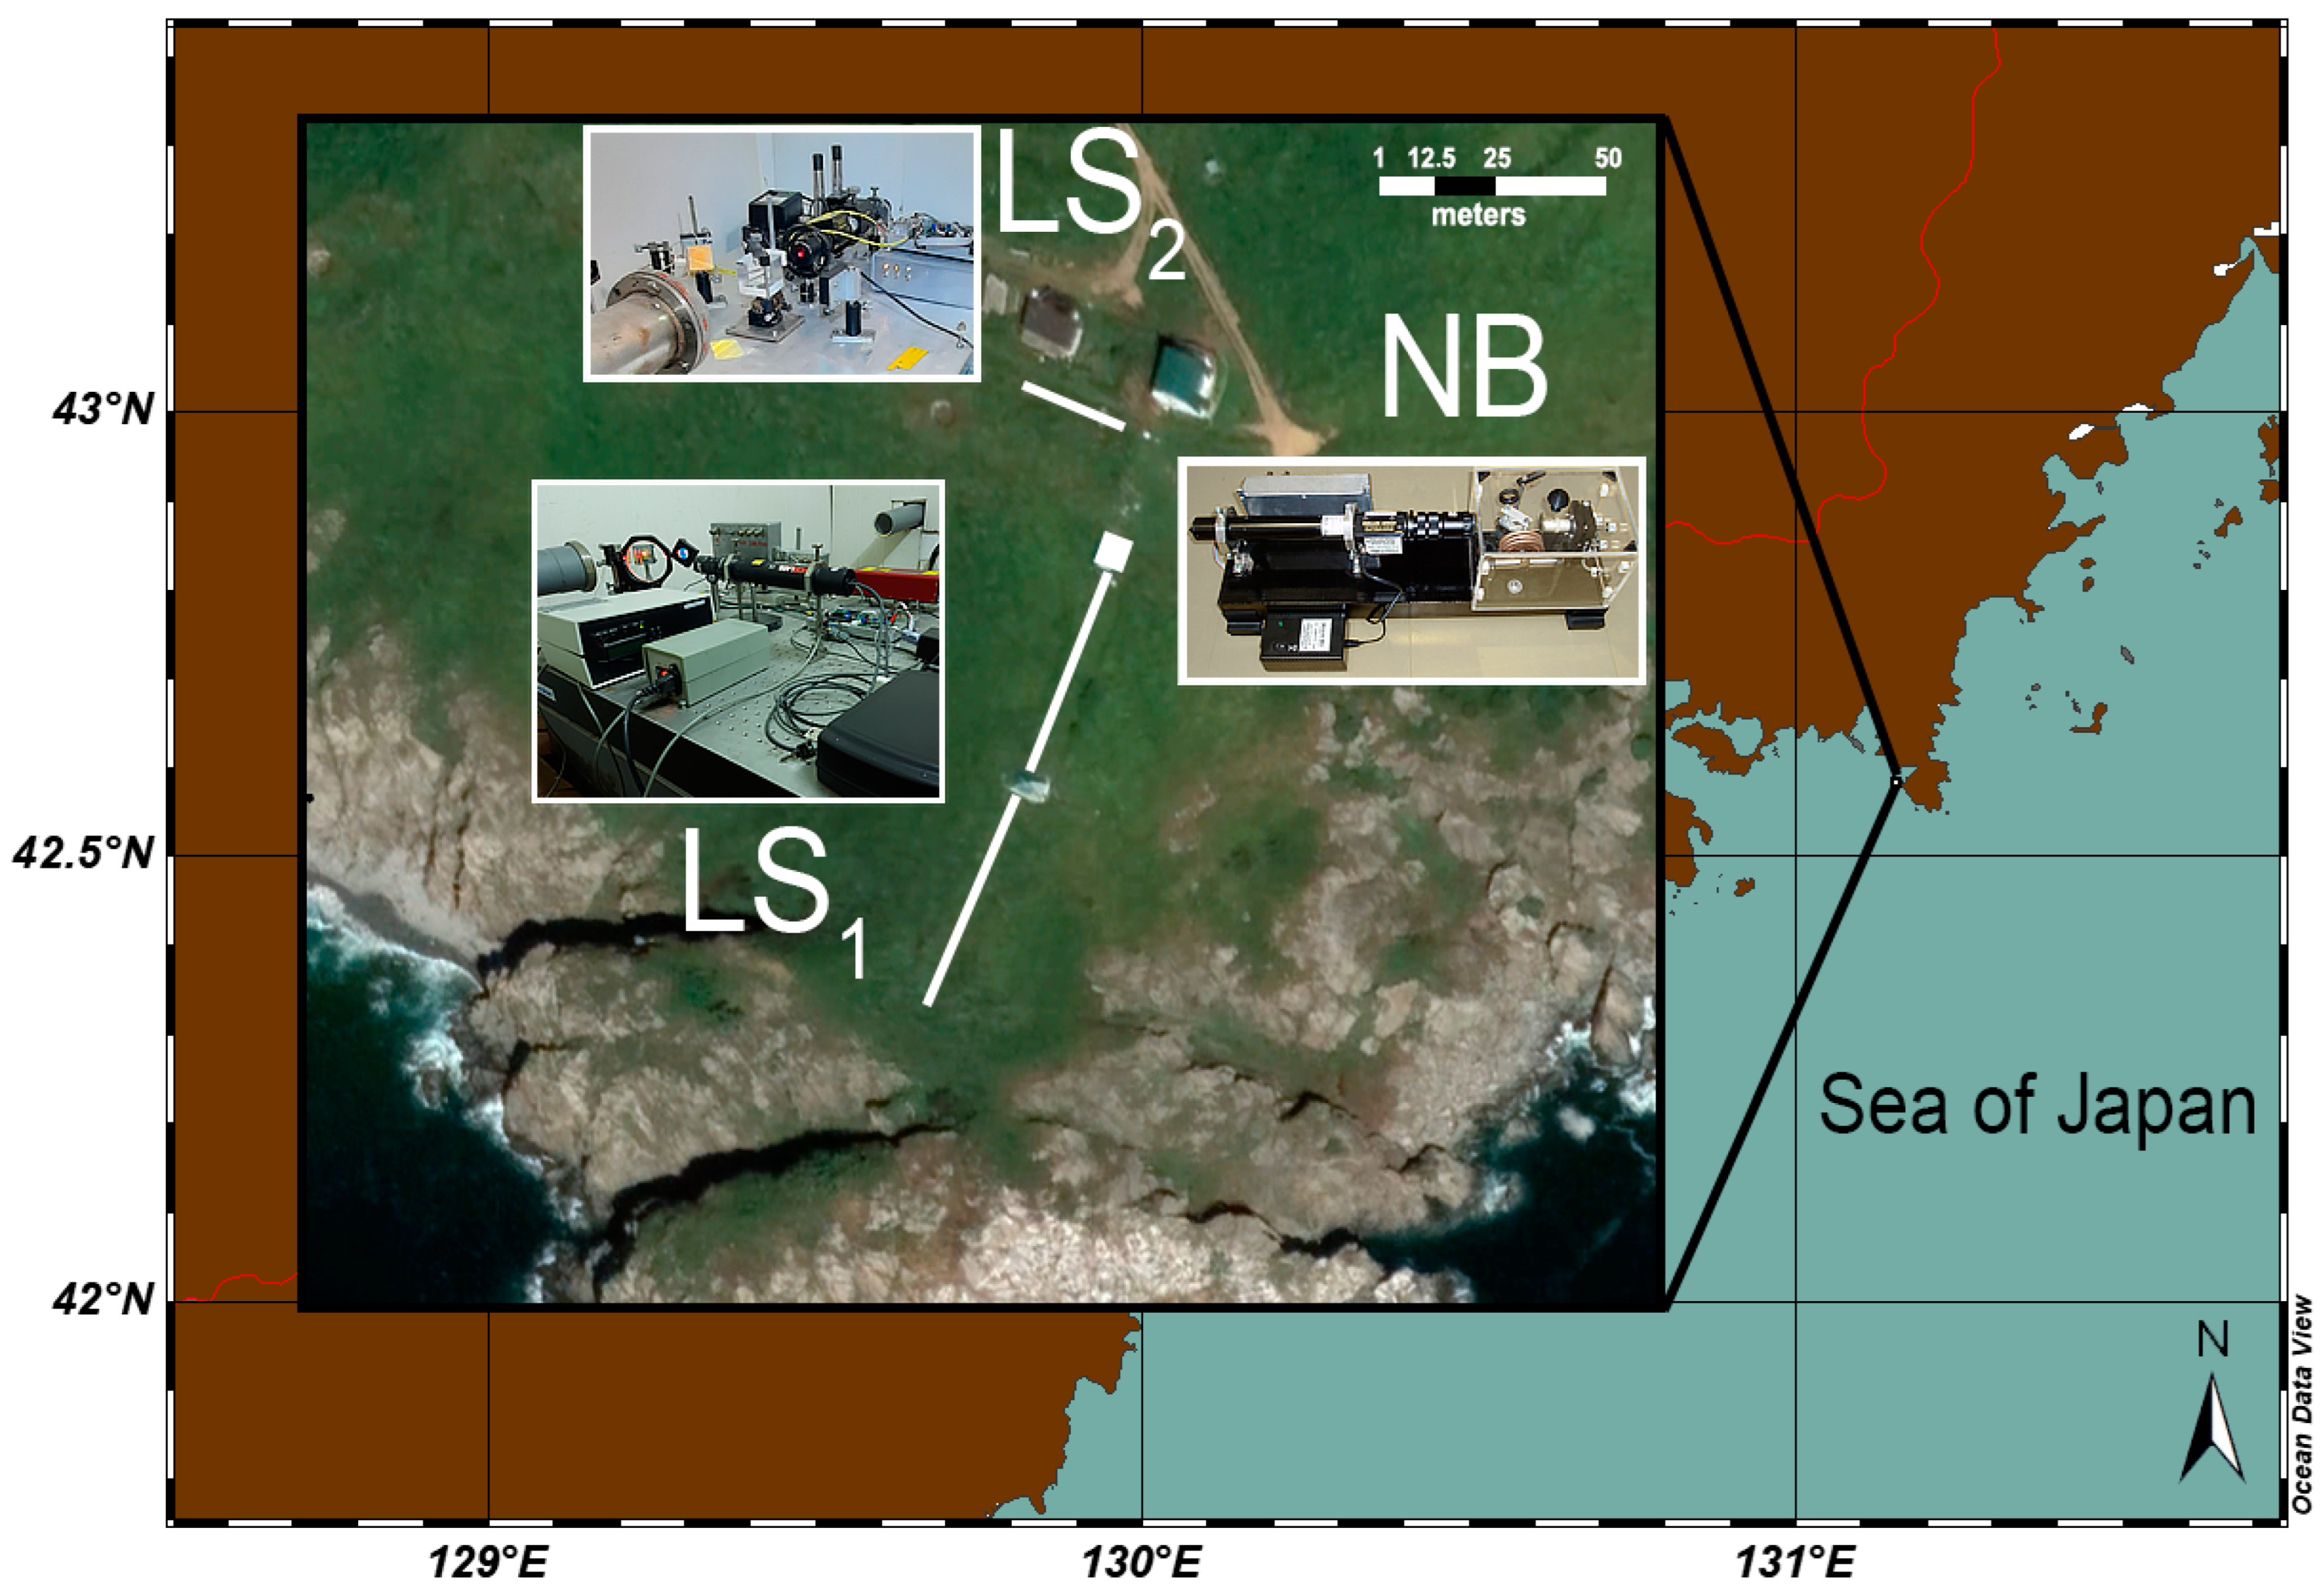
11]. The complex is located on the measuring site of the Sea Experimental Station (SES) Shults Cape. The measuring complex includes a laser nanobarograph and a two-coordinate coastal laser strainmeter. The synchronous operation of measuring systems that record oscillatory processes in neighboring geospheres in the frequency range conditionally from 0 Hz and above allows one to find and determine the sources of excitation of these processes. The measuring complex is located compactly on the Gamov Peninsula in the Primorsky Territory of the Russian Federation with the center in the point with coordinates 42.58 °N/131.15 °E. The layout of the complex is shown in
Figure 1.
The diagram shows the location of the three instruments using laser-interference measuring methods. The tabs of the diagram show images of operating interferometers, where NB is the laser nanobarograph, LS1 is the laser strainmeter with a measuring arm of 52.5 m and located at an angle of 18° to the meridian, and LS2 is the laser strainmeter with a measuring arm three times smaller and having an orthogonal position to the axis of the strainmeter LS1.
The laser nanobarograph was created to study the relationship between the processes occurring in the atmosphere, where the instrument directly takes measurements, and processes developing in the lithosphere and hydrosphere. A block of aneroid boxes acts as a sensor measuring atmospheric pressure, which is used in conventional pointer barometric instruments. However, to register movement of the loose end of the block, in order to increase sensitivity, laser-interference methods are used.
The accuracy of atmospheric pressure variation measurements is approximately equal to 50 µPa. Background seismoacoustic noises do not affect the parameters of atmospheric pressure variations measured by the laser-interference nanobarograph. Synchronous measurements of the nanobarograph allow one to exclude the processes of baro-deformation interaction during processing of the laser strainmeter data.
The two-coordinate laser strainmeter is the main seismic measuring instrument of the complex for studying the processes of microdeformations of the Earth’s crust. The device can register in any frequency range oscillatory processes propagating in the upper layer of the Earth’s crust due to its unlimited dynamic range. The two-coordinate laser strainmeter, in turn, consists of two measuring components with measuring arm lengths of 52.5 m and 17.5 m. The constituent measuring components are installed in underground rooms isolated from atmospheric influence as much as possible. They have a practically orthogonal mutual arrangement relative to each other and, in certain cases, allow those using them to study the region of arrival of a useful signal by the method of amplitude modulation of this signal on the laser strainmeter components with different directions.
Variations in meteorological parameters in the area of the measuring site at different times are provided by modern meteorological stations. In 2015, an automatic hydrometeorological station AWS 2700 was used to obtain weather data, using classical wind measurement methods in the form of an anemometer. Currently, the meteorological parameters at SES “Shults Cape” are registered by the more modern automatic weather station MAXIMET GMX 500, which has an ultrasonic anemometer as a wind sensor [
12].
3. Registration and Analysis of “Voice of the Sea” Microseismic Oscillations
Trajectories of typhoons never repeat themselves exactly, but they often have similar branches of propagation. According to their movement trajectory, typhoons are divided into two groups. Typhoons of the first group go to the mainland, fill up over it, and cease to exist. The majority of tropical cyclones belong to the second group of typhoons, which originate in the Pacific Ocean and have a reverse movement branch with parabolic characteristics. A small part of typhoons seeking to enter the mainland and entering its territory do not fill up, but begin to move in the northeasterly direction, moving further to the coast of Japan or crossing the Korean Peninsula. With this variant of the cyclonic vortex movement, the cyclone actively affects the water area of the Sea of Japan. After the cyclonic vortices cross a long stretch of land, e.g., the mainland of China during the movement of Typhoon Chaba in June–July 2022 or the territory of the Korean Peninsula (Typhoons Chang-Hom, 2015 and Danas, 2019), the tropical cyclone that lost its strength gains it again as a result of replenishment from the surfaces of the seas of the northwestern part of the Pacific Ocean, which warm up significantly in summer. In this way, the leading meteorological agencies cease to rank a tropical cyclone as a typhoon, transferring it to the category of a tropical cyclone of up to hurricane strength and not taking into account its increasing power even if for a short period of time.
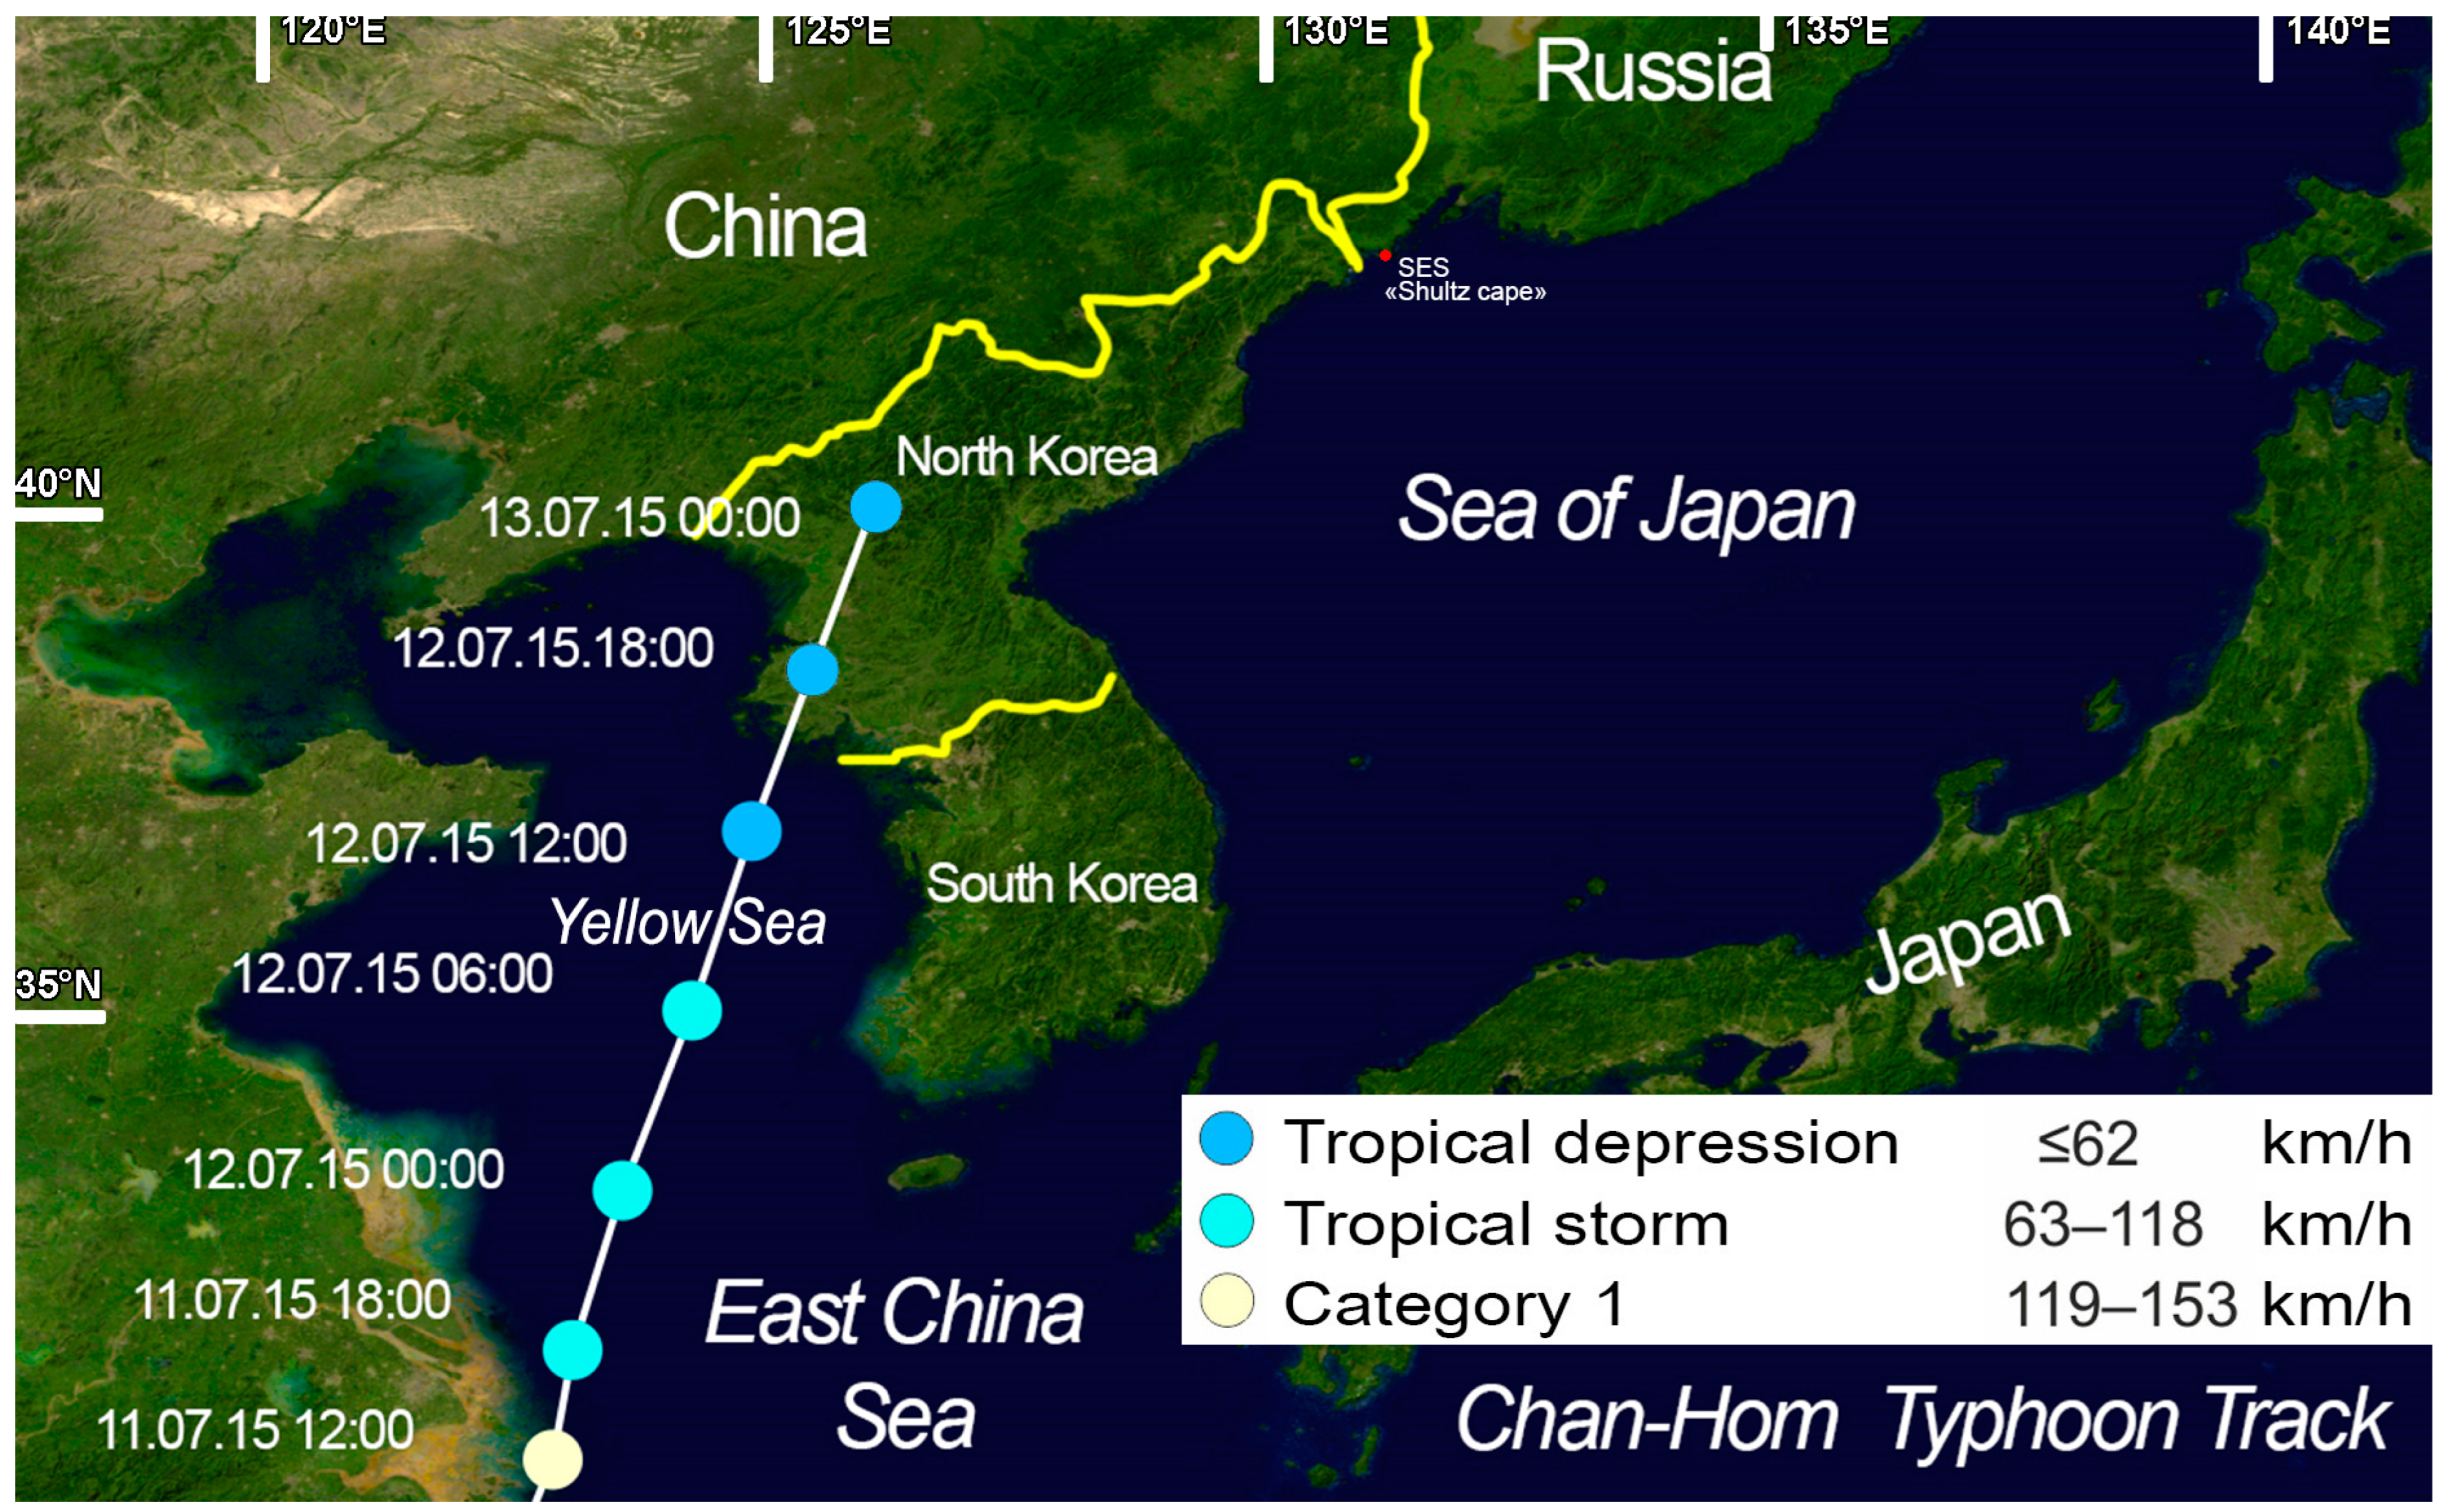
Let us show this in the example of Typhoon Chang-Hom’s passage in the period from 13 July 2015. Meteorological agencies stopped tracking Typhoon Chang-Hom at 00:00 on 13 July 2015, transferring it to the category of an extratropical cyclone.
Figure 2 shows the trajectory of Typhoon Chang-Hom before it became a tropical depression. The diagram shows the last section of the typhoon’s center trajectory, based on data from the NOAA Joint Typhoon Warning Center, plotted using the Saffir–Simpson scale.
Although Typhoon Chang-Hom began to lose energy when moving from the Yellow Sea to the Korean Peninsula, nevertheless, while still going over the Yellow Sea, the first influence of its eastern wing on the Sea of Japan had already appeared. Based on the meteorological databases GFS and WAVEWATCH III of the global weather forecasting systems, we can reconstruct the movement of the cyclone area in the Sea of Japan in order to track the changes in the infrasonic signal registered by the laser strainmeter and associated with this movement.
Developing the topic of terminating tracking of the cyclonic vortex by meteorological agencies, shown in
Figure 2, we will show that despite the collapse of the typhoon vortex cloud system structure, the movement of air masses in the atmosphere in the direction of the area of low atmospheric pressure in the near-surface layer does not cease.
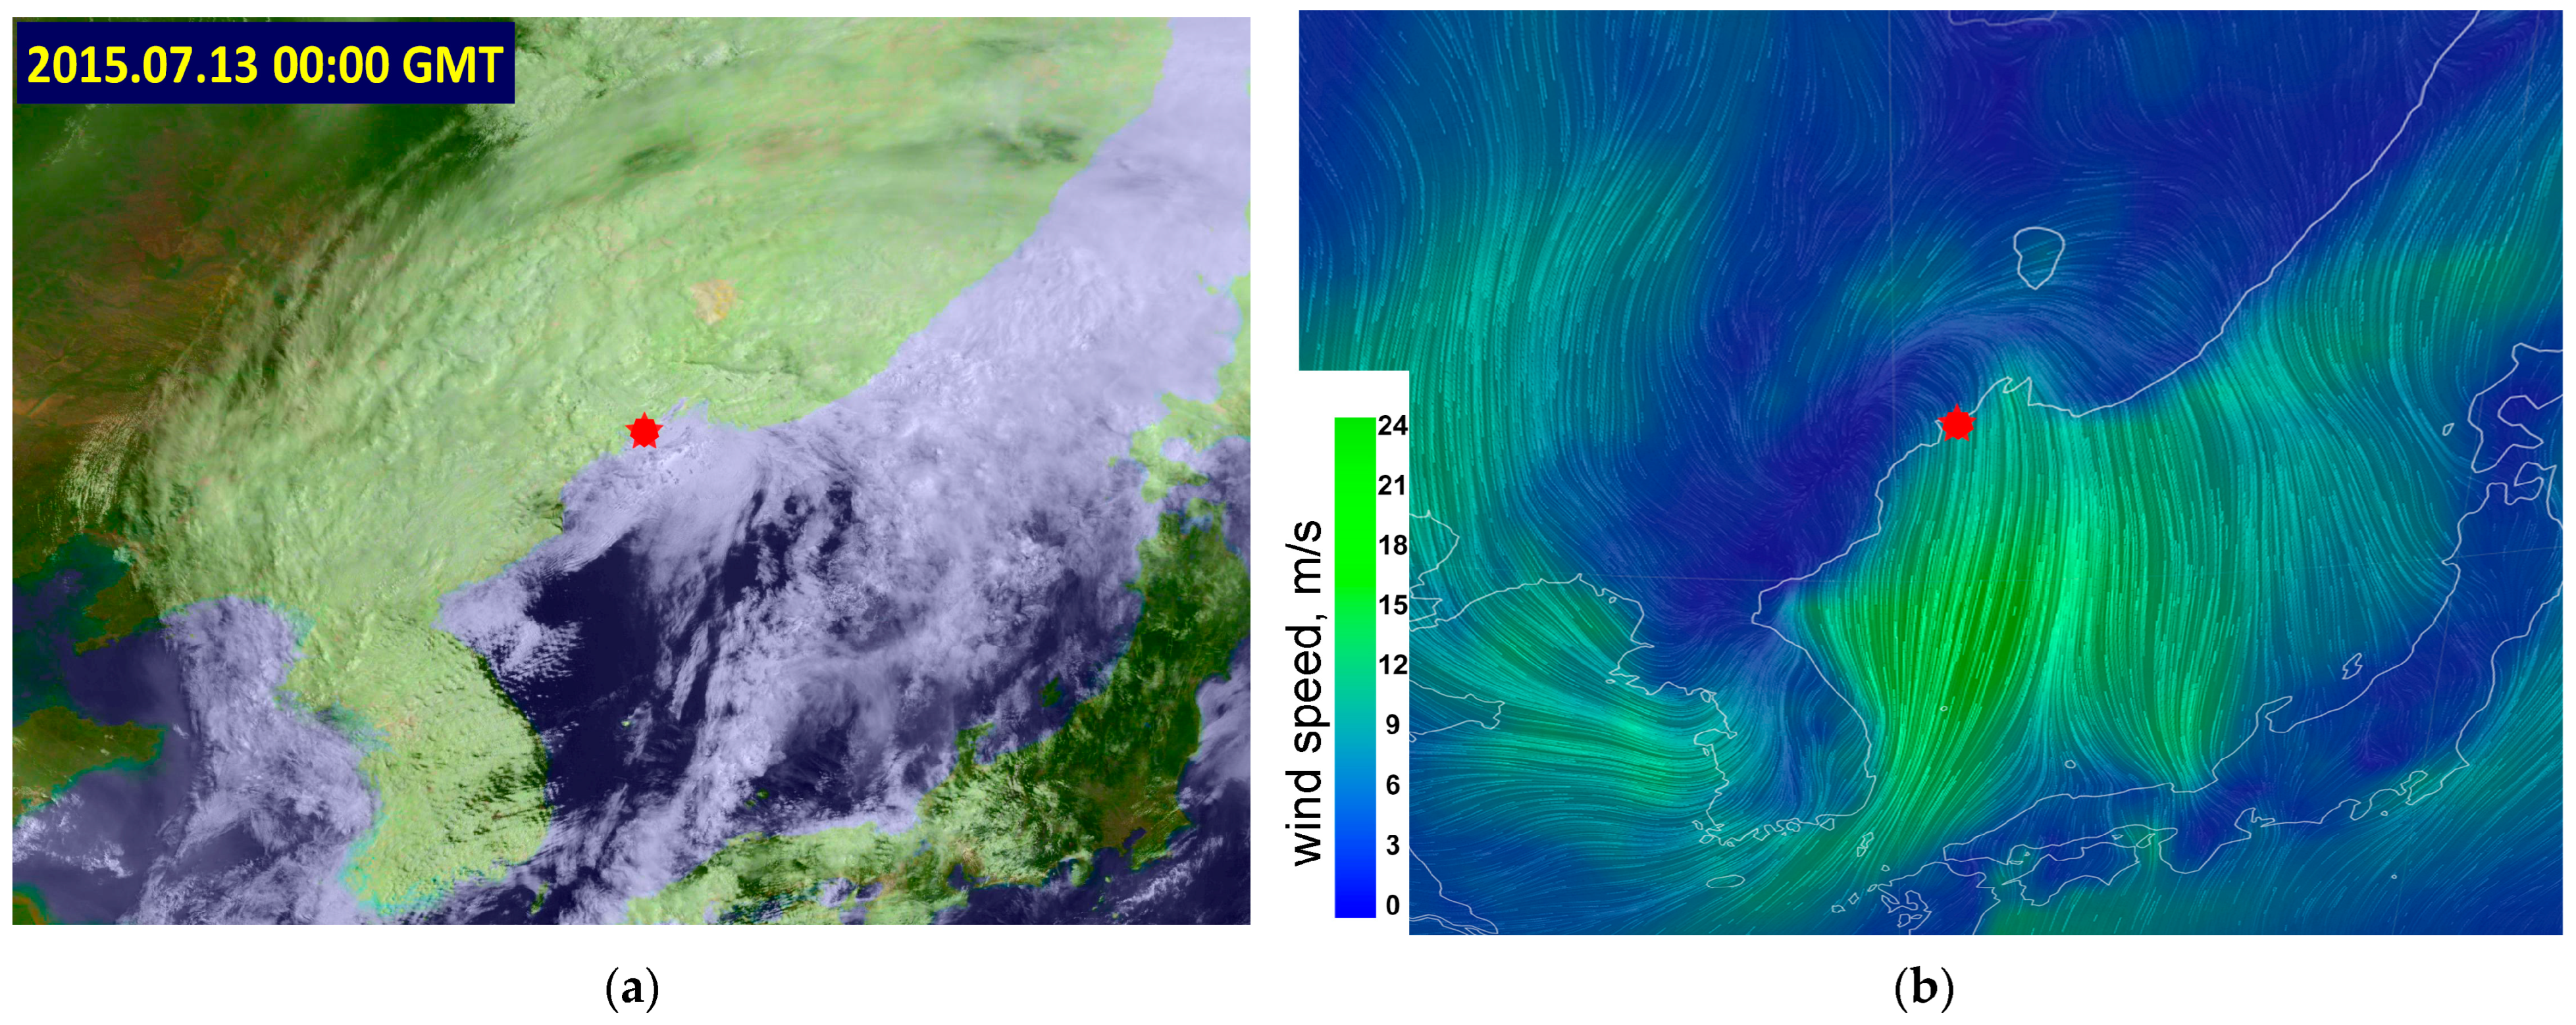
Figure 3a shows a Himawari-8 satellite image [
13] of Typhoon Chang-Hom during the time period when its rank was downgraded to a tropical depression. The vortex structure of the cyclone is clearly visible on the satellite image, while the cloudiness in the southern part of the cyclone has partially dissipated.
Figure 3b, constructed on the meteorological databases of the Global Forecast System and WAVEWATCH III [
14], demonstrates a strong wind zone in the near-surface area of the western and central parts of the Sea of Japan, extending up to the southern coast of the Primorsky Territory. A red polygon indicates the location of the laser-interference measuring complex.
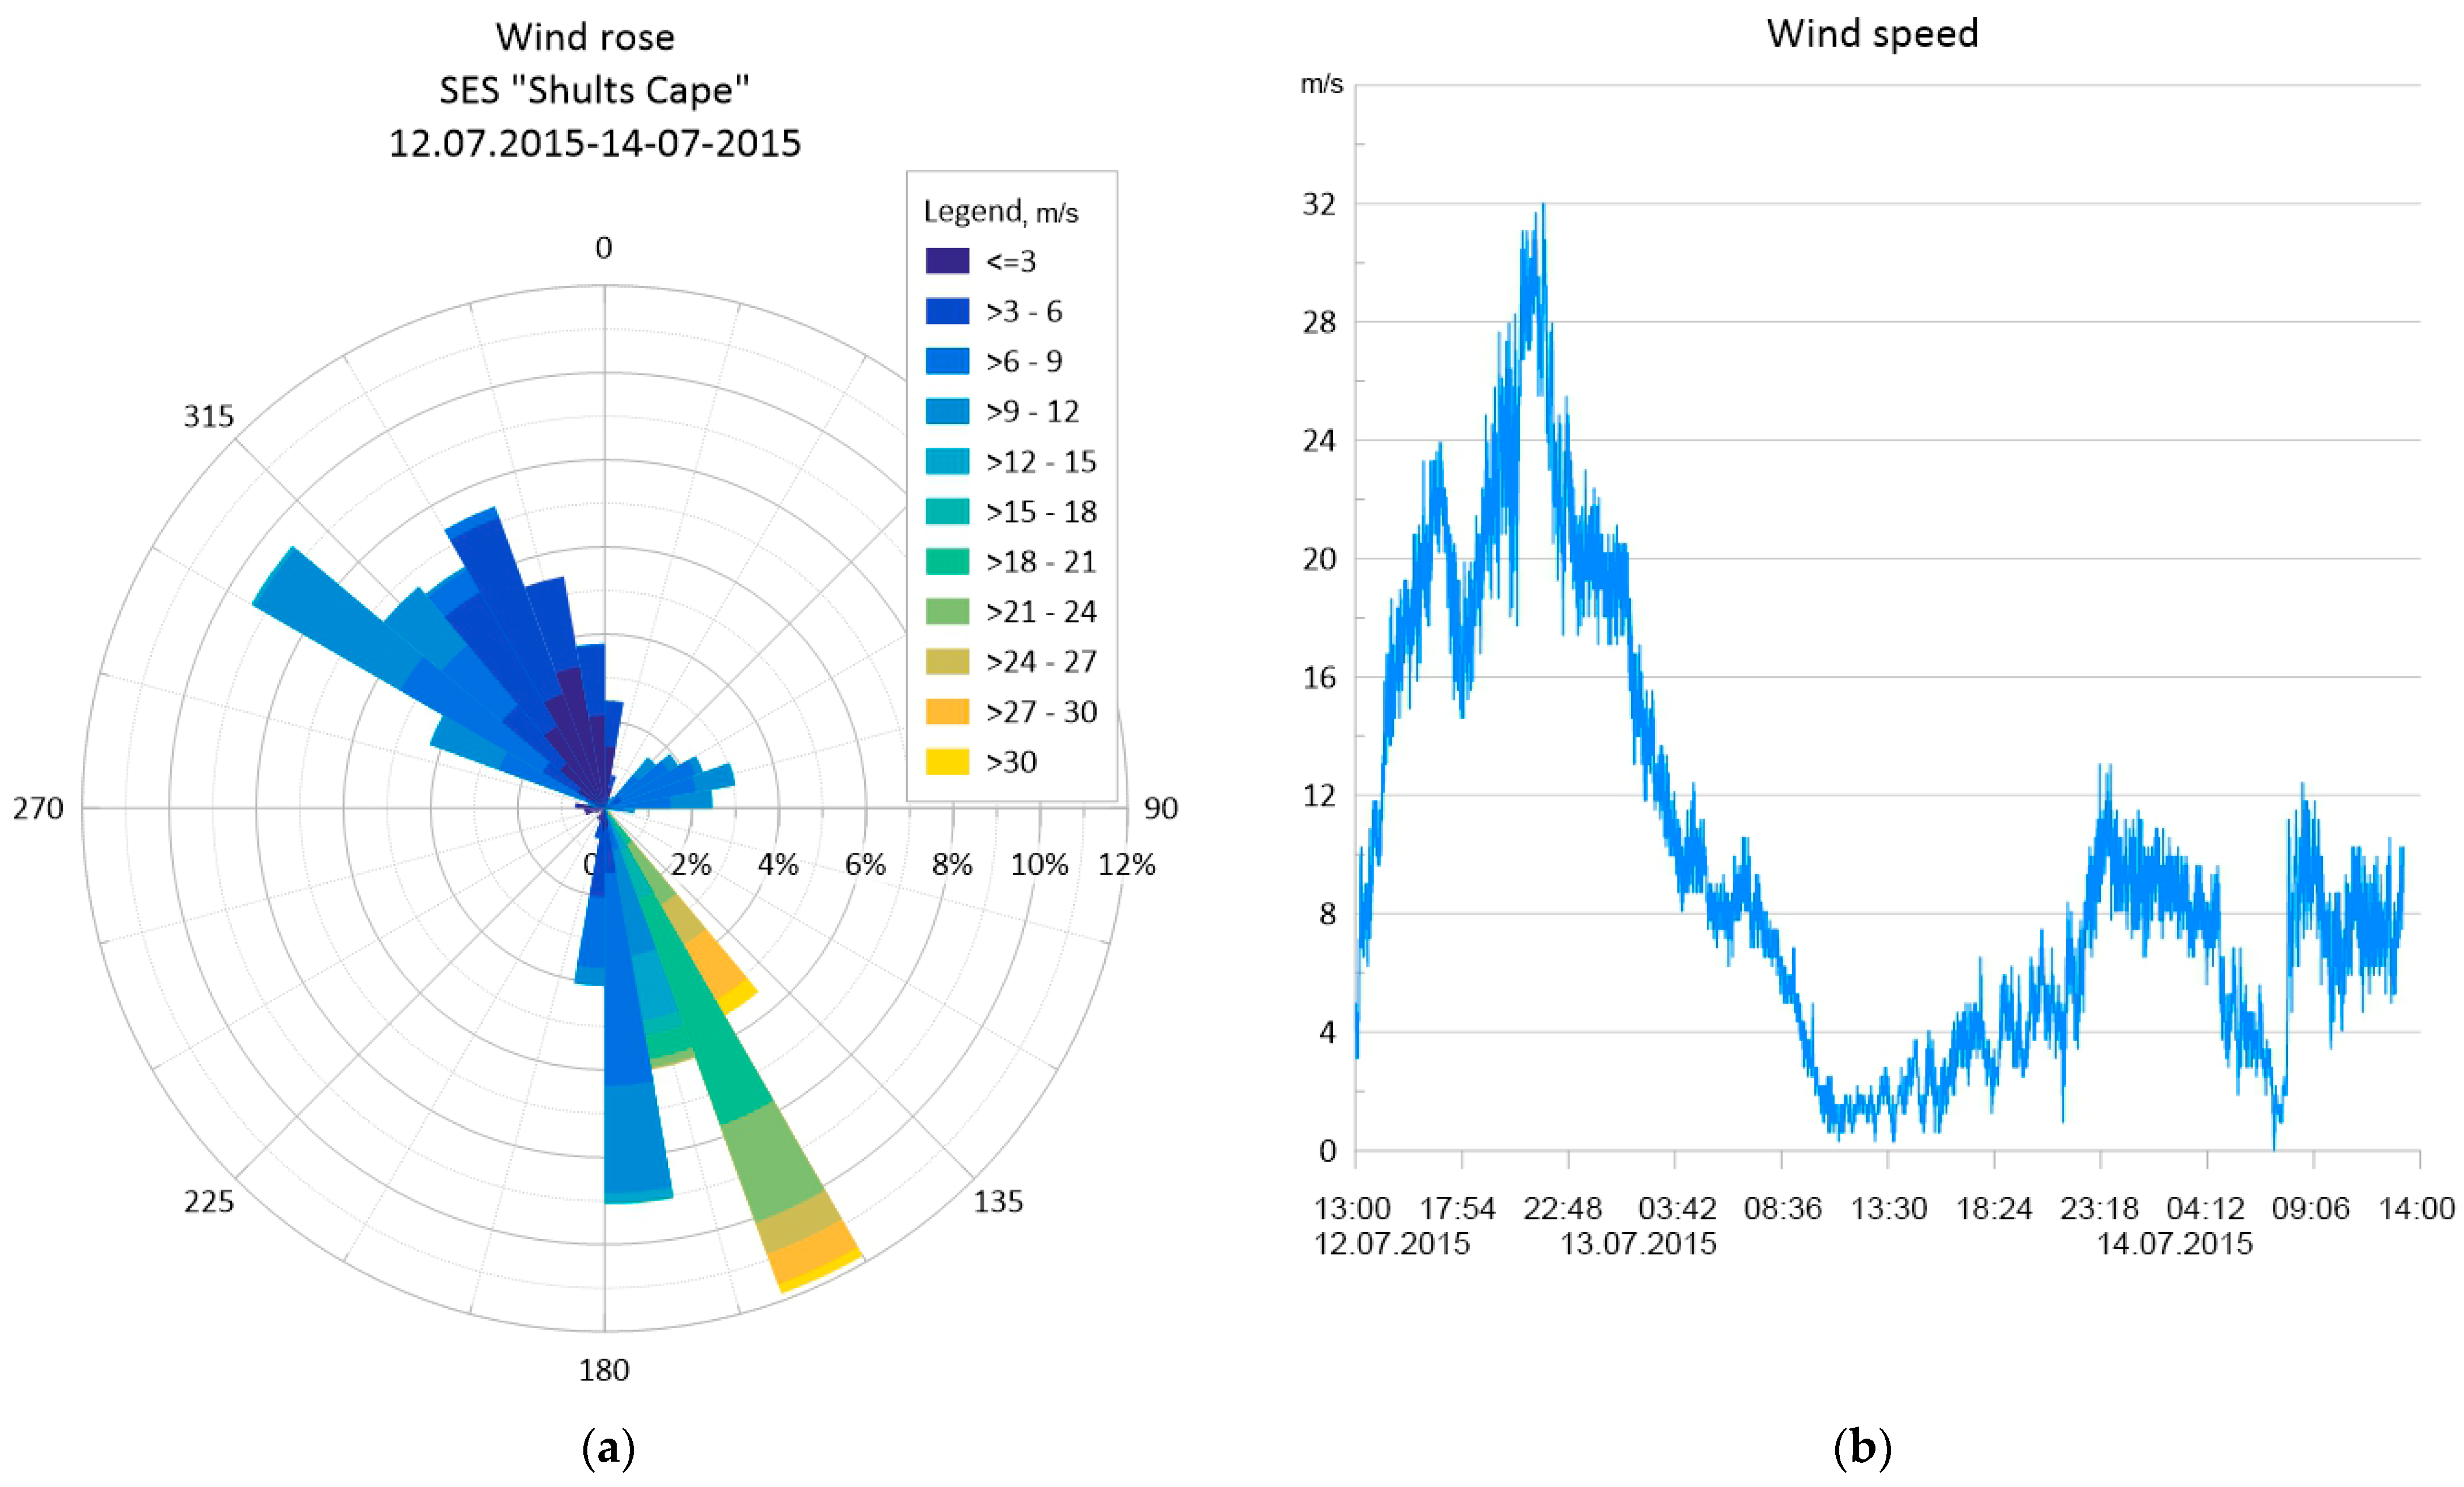
Using the data of the automatic weather station continuously operating at SES “Shults Cape”, indicated in the figures by a red polygon, we will show the change in wind speed and direction in the point of meteorological observations (
Figure 4).
Figure 4a shows the influence of winds of different directions on the area of the measuring site during two days and characterizes the passage of the cyclonic vortex through the measurement point. At the same time, about one third of this period, the southeasterly wind prevailed at the speed of more than 30 m/s. Analyzing
Figure 4b, we conclude that in the period from 17:00 on 12 July 2015 to 02:00 on 13 July 2015 the Chang-Hom tropical cyclone corresponded to the tropical storm category on the hurricane wind scale, reaching practically a Category 1 hurricane at its peak impact at 22:46 on 7 December 2015.
When the area of low pressure of the typhoon moved in the northeast direction along the coast of the Primorsky Territory, accordingly, the strong wind area shifted in the same direction as was registered in the study of possibility to determine the location of the “voice of the sea” microseismic signal generation area [
14].
Using the example of the same typhoon, we present the sequence of manifestation of the microseismic signal under study when the cyclonic vortex was moving along the coast of the Primorsky Territory of the Russian Federation.
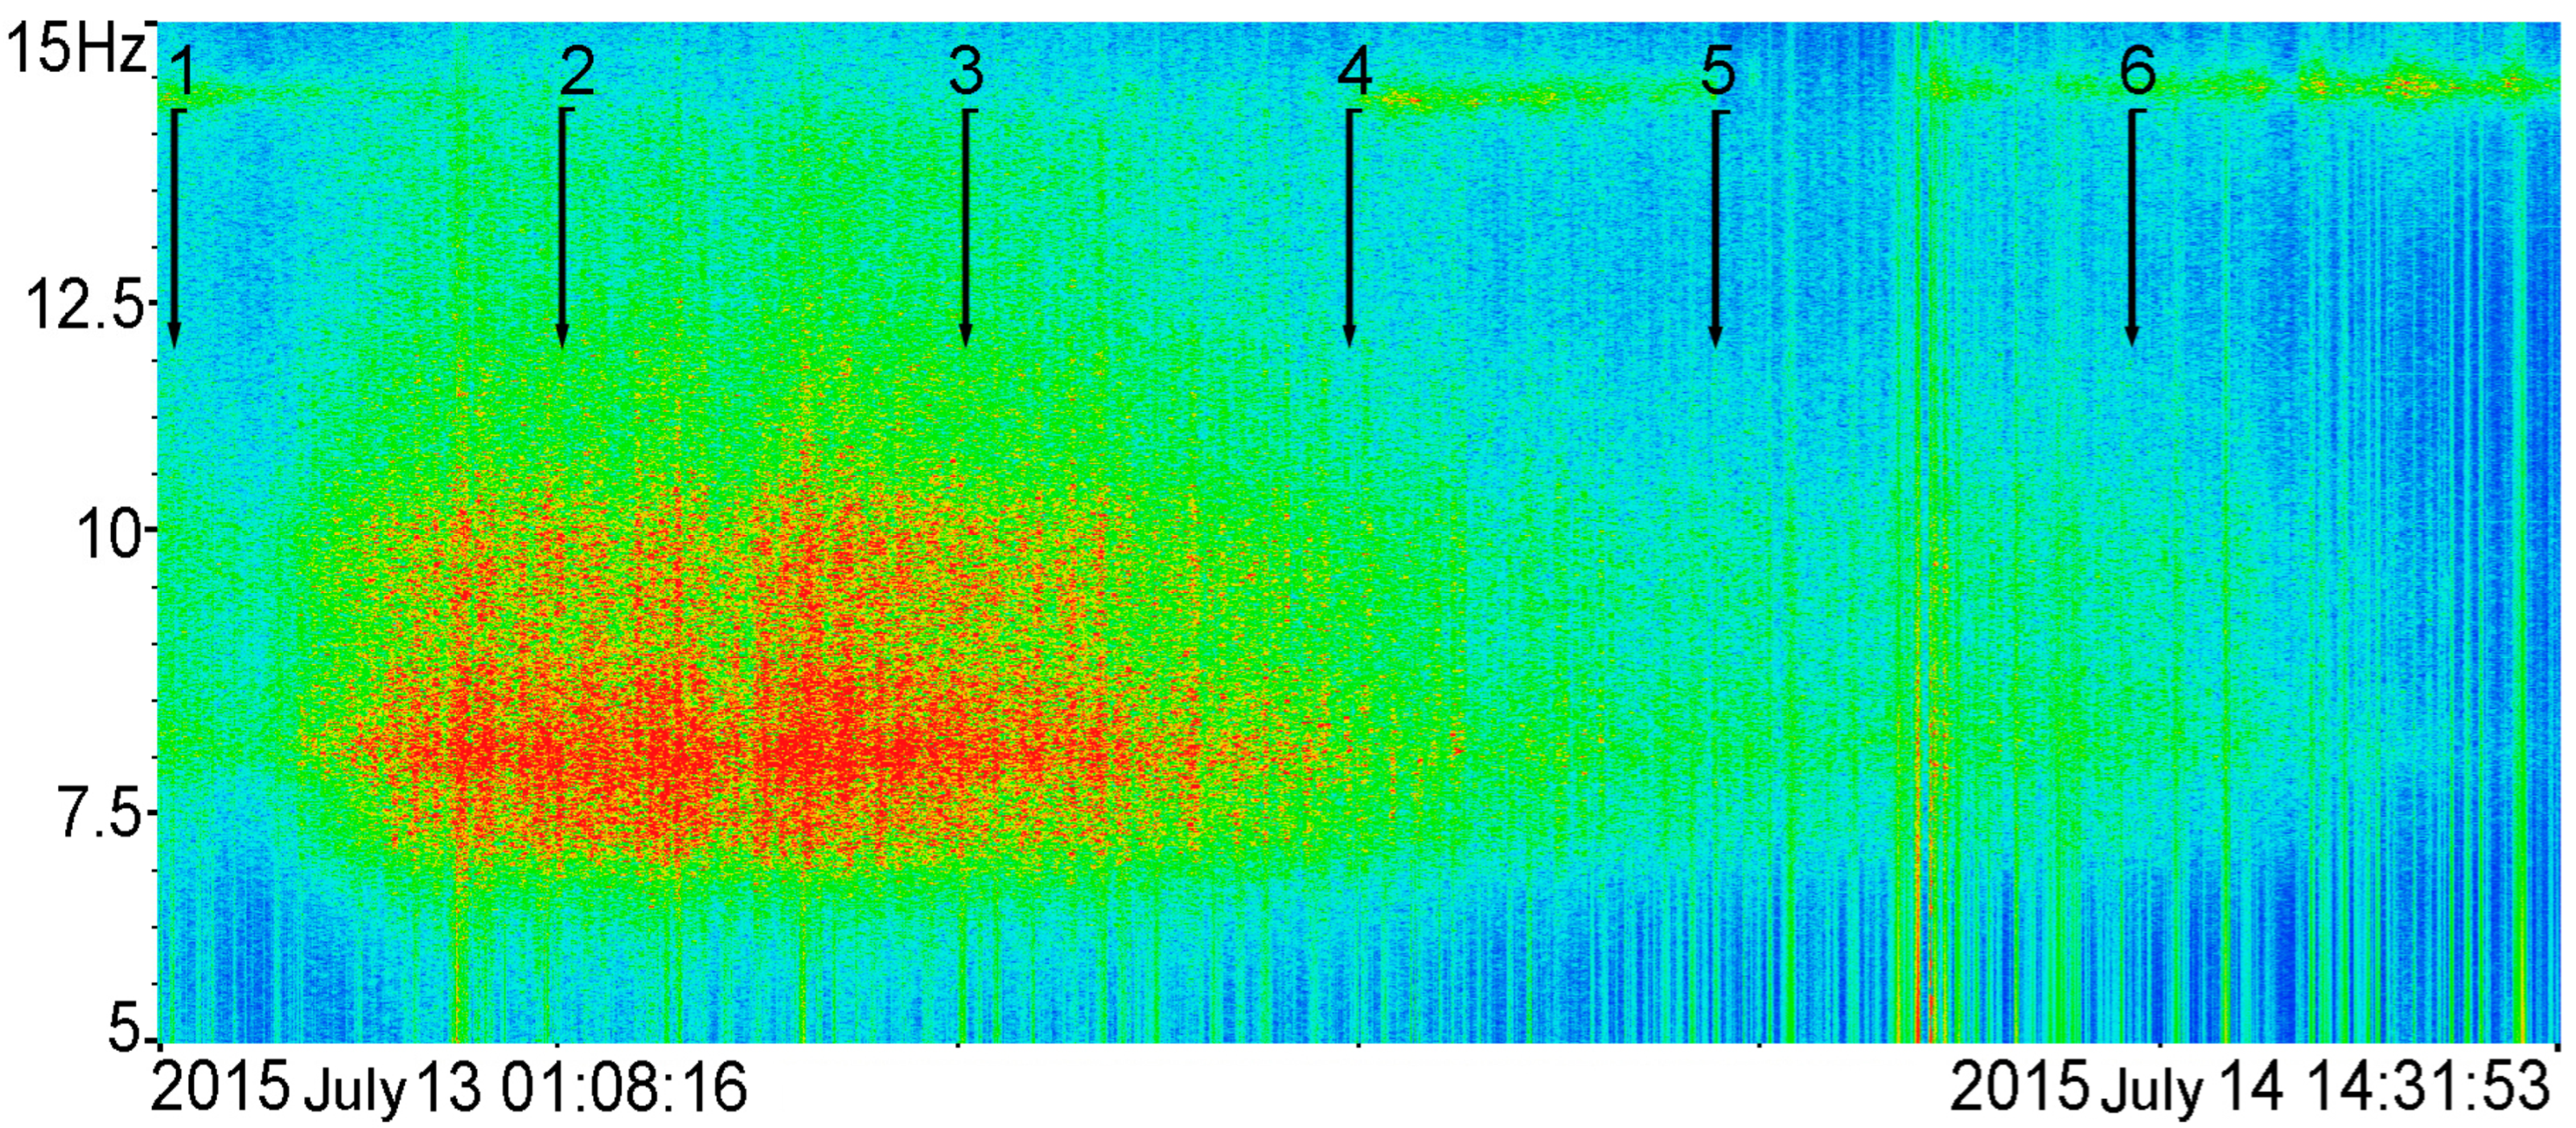
Figure 5 shows the dynamic spectrogram of the “voice of the sea” microseismic signal being registered by the coastal laser strainmeter for more than 37 h. In the figure, the numbered arrows show the signal marks where the maximum amplitudes of the spectral components were singled out.
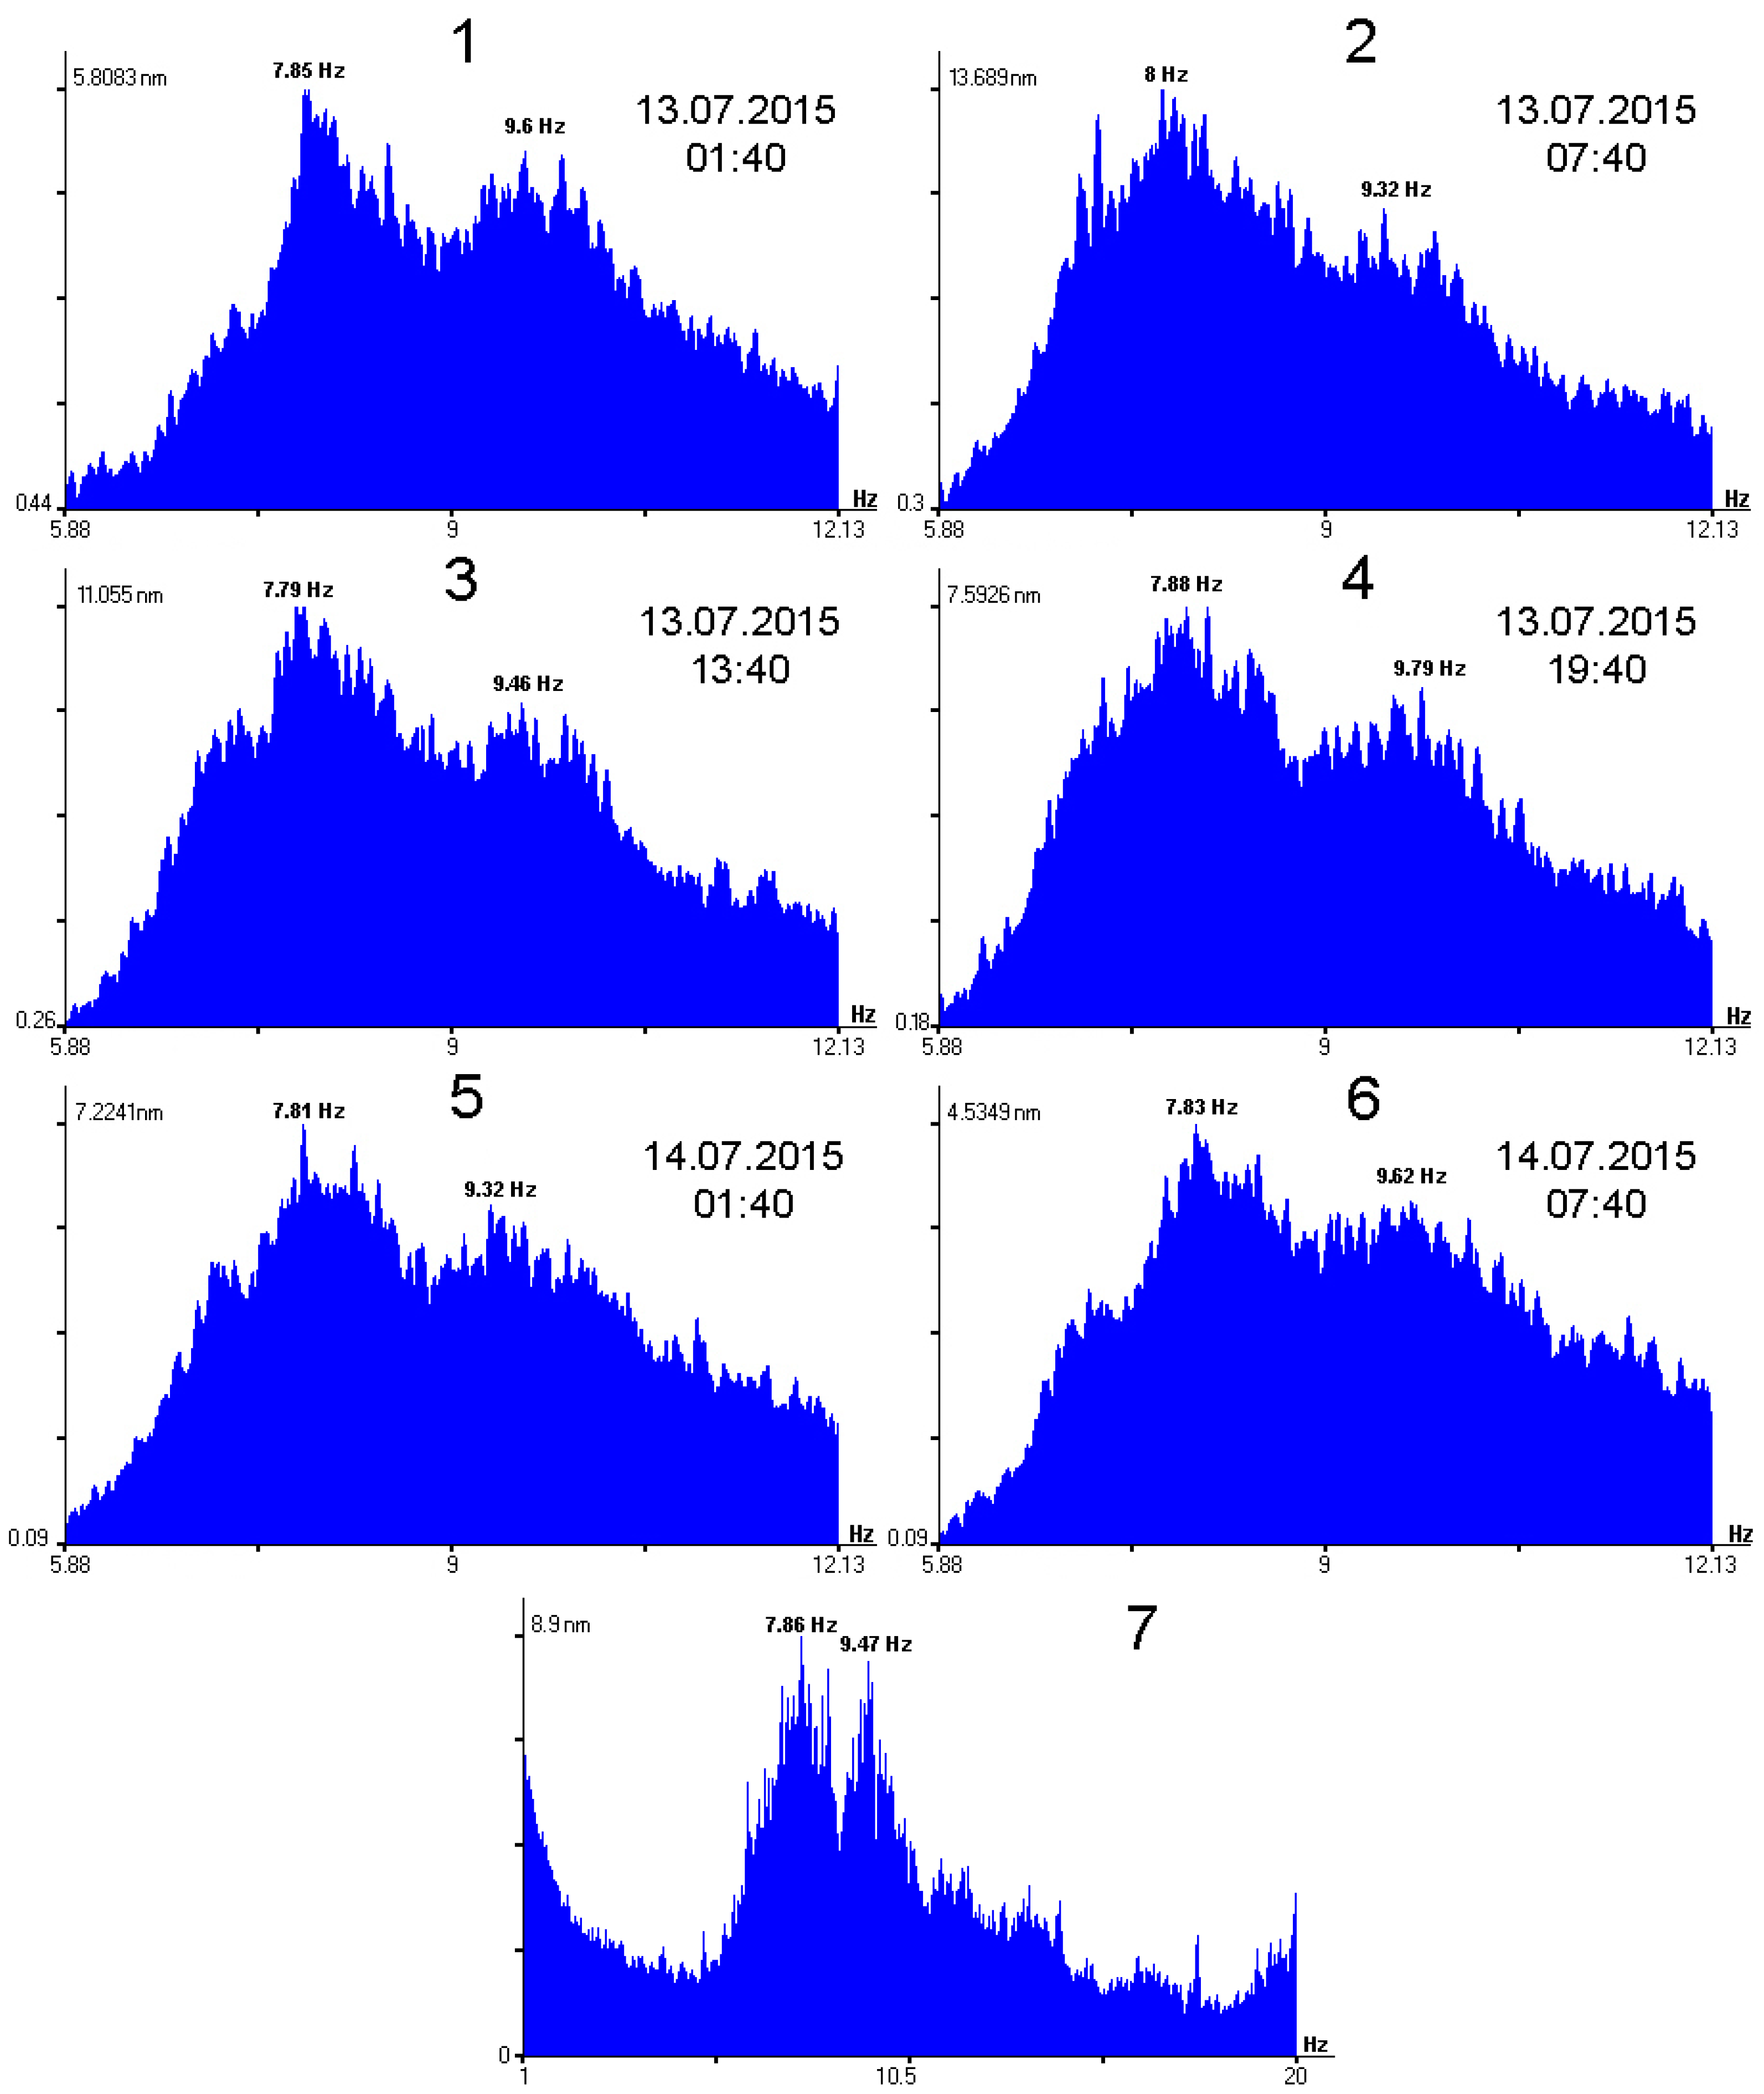
The images shown in
Figure 6, with an interval of 6 h, present the sequence of spectra of the microseismic signal generated during the tropical cyclone Chang-Hom’s movement in the Sea of Japan. The signal was decomposed into spectra with an accumulation time of 200 s. The digital designation of each spectrum pattern (1–6) corresponds to the position on the dynamic spectrogram in
Figure 5. Before constructing the signal spectra, the file of primary information recording is preliminarily subjected to a processing procedure, which includes checking the integrity of the data series, filtering with a low-pass filter using the Hamming window function to reduce the irregularity in the signal bandwidth. The final signal processing procedure is a reduction of the signal sampling rate by decimating its samples, which makes it possible to reduce the total file size, initially several days long with a primary sampling rate of 1000 Hz.
Analyzing the sequence of spectra in
Figure 6, we can conclude that the registered signal is in the range of 6.5 to 11 Hz. In this case, the spectrum contains two regions with maximum amplitude, which are especially well identified during the periods of signal development and attenuation. One region of the signal with the maximum amplitude is in the range of 7.5–8.5 Hz, and the second region, which has a lower amplitude, is in the range of 9–10 Hz. The maximum signal amplitude during the period of its registration was slightly lower than 14 nm, with the maximum at the frequency of 7.8 Hz. During this period, the center of the cyclone had already crossed the latitude of the measuring complex location and was moving in the eastern part of Peter the Great Bay. Inset 7 in
Figure 6 illustrates the spectrum comparing the recorded “voice of the sea” microseismic signal with noise.
As studies of data from 2012 to 2022 showed, during the movement of a number of typhoons in the Sea of Japan, laser strainmeters regularly registered “voice of the sea” microseisms. In this case, the microseismic signal manifested itself in a fairly wide frequency band and was characterized by different frequencies, with a maximum amplitude depending on the wind speed in the tropical cyclone vortex and on its trajectory.
Thus, in [
15], it is shown that the spectrum wight of registered “voice of the sea” microseismic oscillations can be from 1.5 to 4.5 Hz. In this way, some typhoons moving in the Yellow Sea along the western coast of the Korean Peninsula enter with their center onto the mainland (2012, 2015). Such cyclones, it would seem, begin to fill up and should not pose a significant threat, but as shown above, a strong southerly wind emerges over the sea surface, directed to the area of low pressure already located in the continental zone. Such tropical vortices that affect the water area of the Sea of Japan with their eastern area cause microseismic oscillations with a maximum signal amplitude of around 7.8 Hz. Typhoons crossing the Korean Peninsula in its southern and central parts go completely into the waters of the Sea of Japan. In such cases, the center of a tropical cyclone moves along the Sea of Japan. Such typhoons completely affect the northwestern part of the Sea of Japan with their vortex structure and move along the coast of the Primorsky Territory in the northeasterly direction (2018, 2019). Microseismic oscillations registered during the passage of such typhoons have had maximum amplitudes of microseismic oscillations at the frequency of about 8.3 Hz. Typhoon Sanba (2012) can also be distinguished in this series of typhoons; it deviated from the northeast direction and entered the area of Vladivostok with its center, subsequently filling up in the mainland part of the Primorsky Territory. In this case, during the period of this typhoon influence on the water area of the Sea of Japan, microseismic oscillations were registered with a maximum amplitude at a frequency of about 8.4 Hz.
The movement of Typhoon Talim (2017) was noted separately, and its trajectory differed from the group of typhoons mentioned above. The typhoon made an abrupt turn in the waters of the East China Sea and moved with its center along the eastern coast of the Japanese archipelago. Then a microseismic signal with a spectral width of about 3 Hz and a maximum amplitude at the frequency of 8.8 Hz was registered at the laser-interference measuring site.
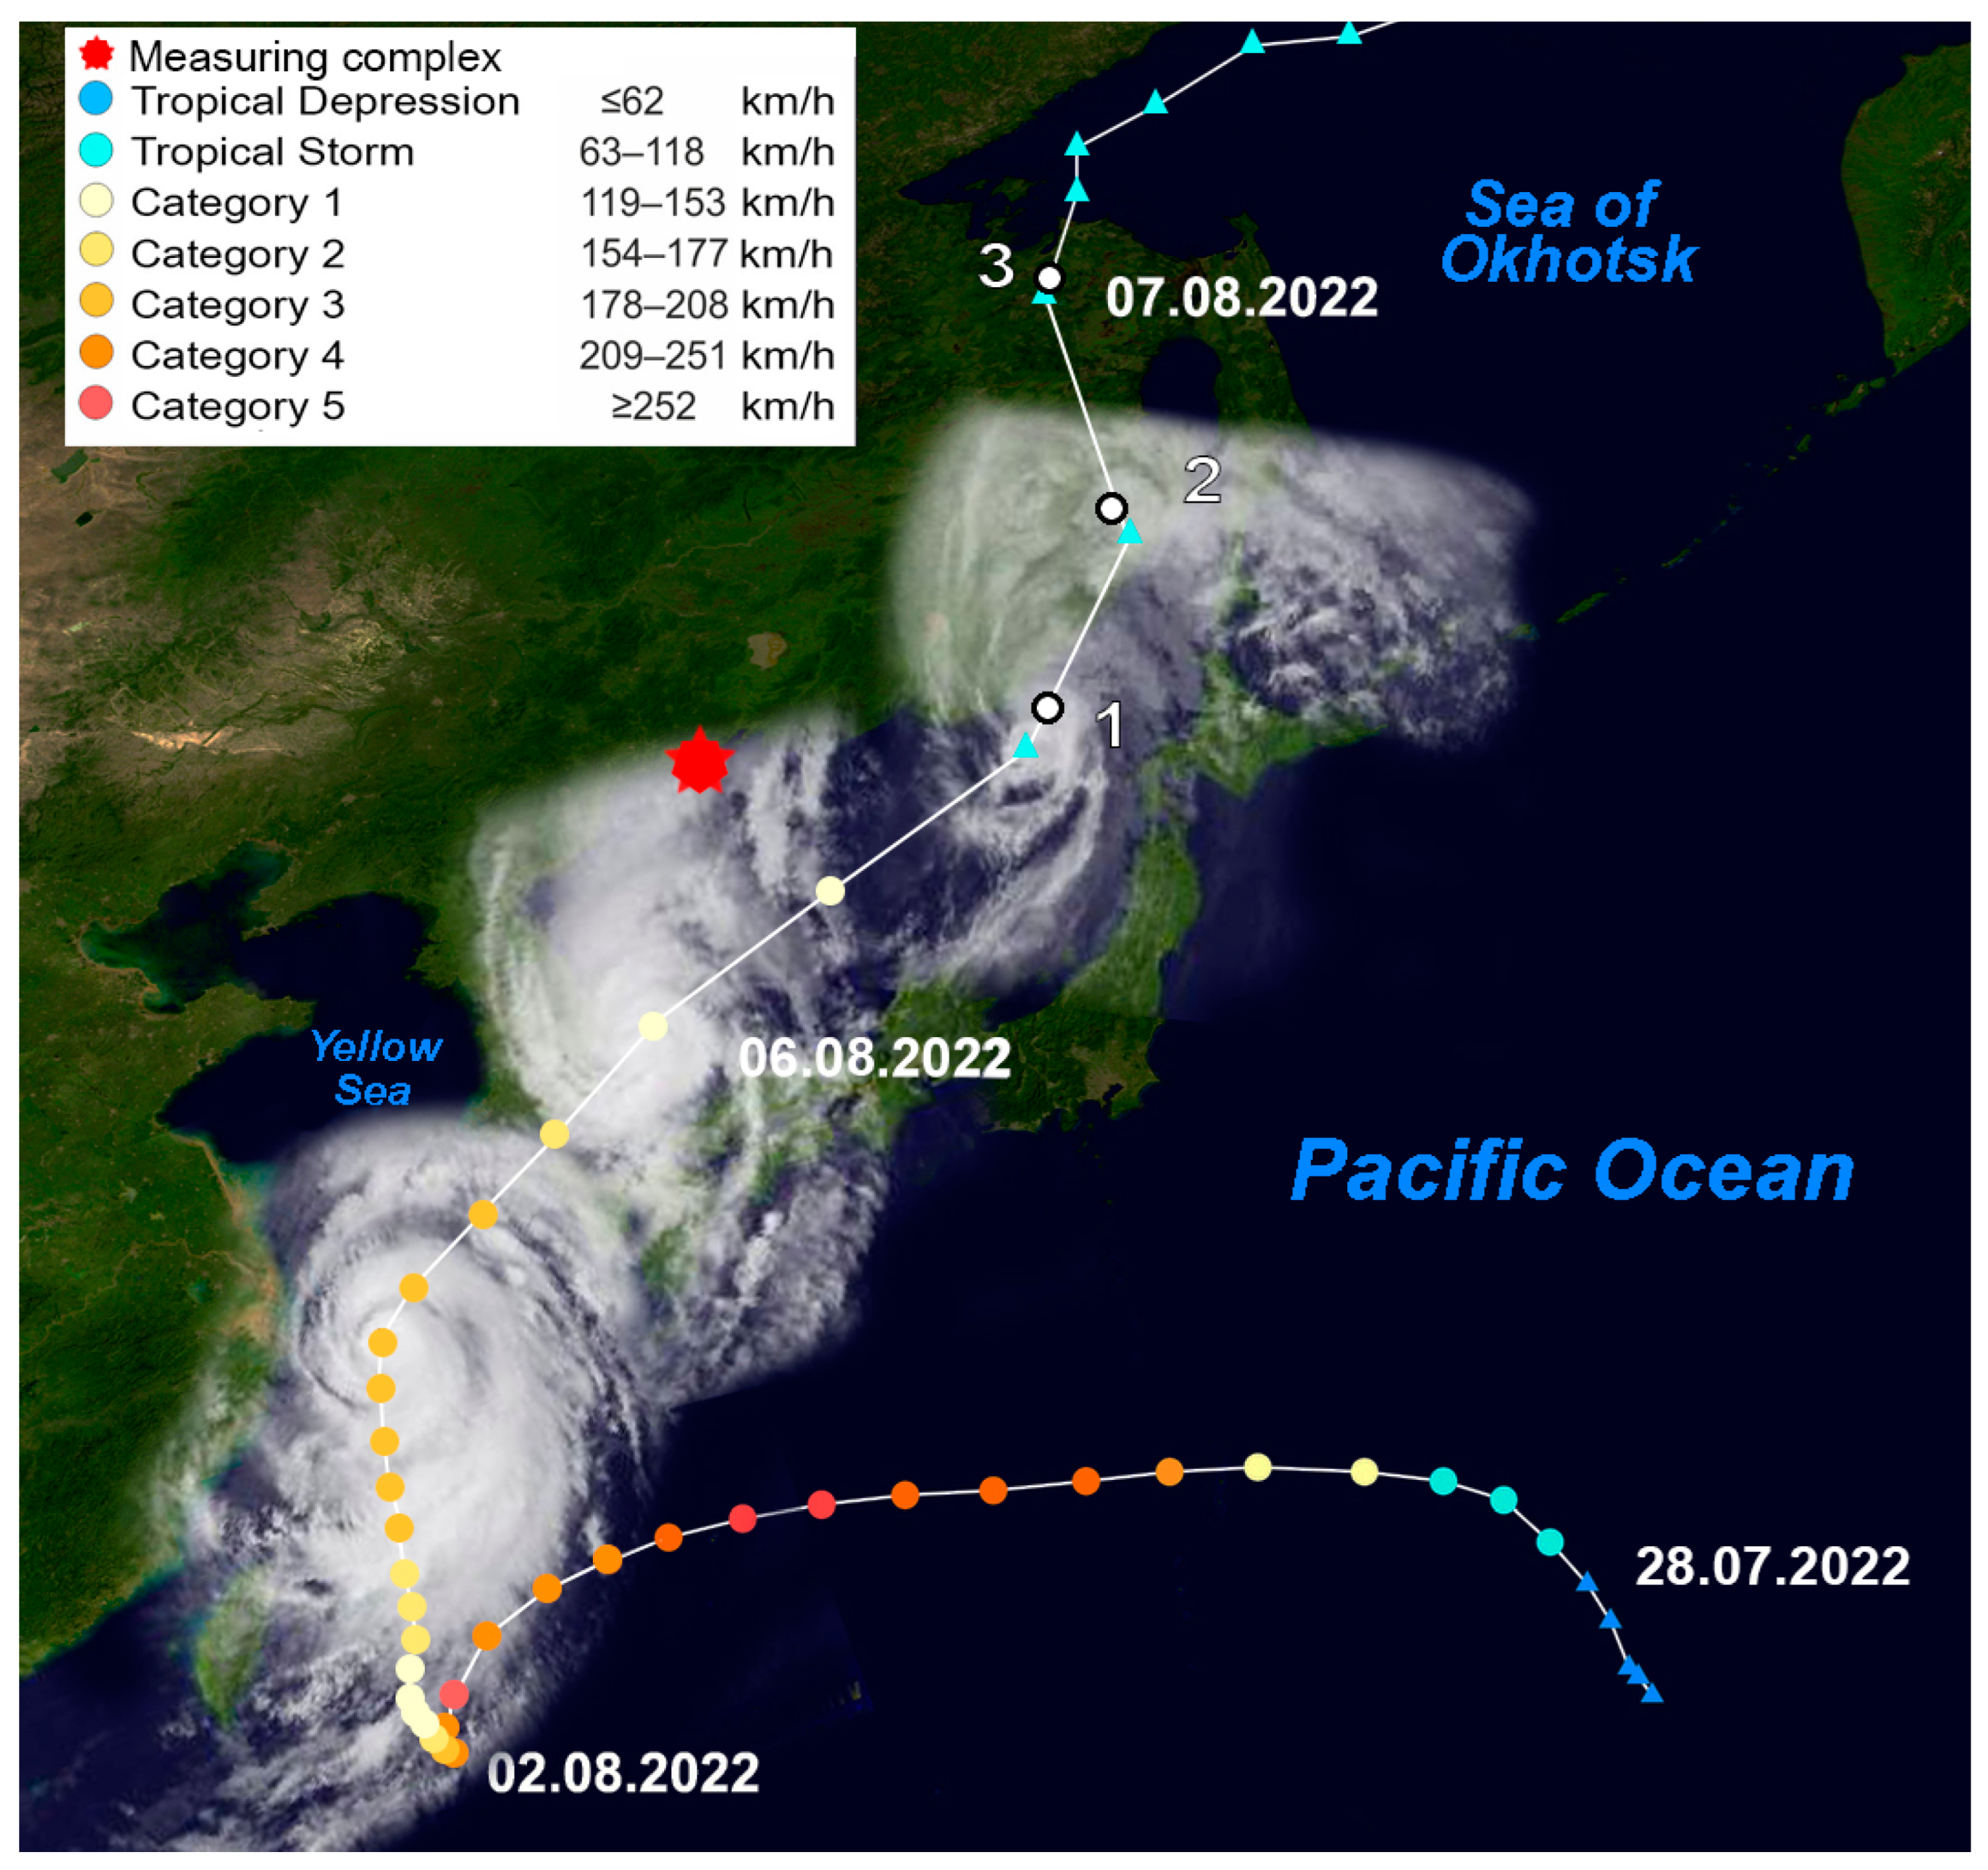
In 2022, Typhoon Hinnamnor actively affected the Primorsky Territory. This typhoon was the first Category 5 tropical cyclone that year. It was impossible to predict the trajectory of its movement for a long time due to its instability.
Figure 7 shows the trajectory of Typhoon Hinnamnor superposed with satellite images in the visible range made by the Himawari-8 meteorological satellite [
13].
In accordance with the available data, the trajectory of the tropical storm Hinnamnor center passed over the southeastern part of the Korean Peninsula with access to the central part of the Sea of Japan. When moving in the northeasterly direction across the Sea of Japan, in less than a day, it reached the eastern coast of the Primorsky Territory, causing great economic damage to the eastern part of the Far Eastern region of Russia. At the same time, the typhoon had practically no active influence on the place of the measuring complex location.
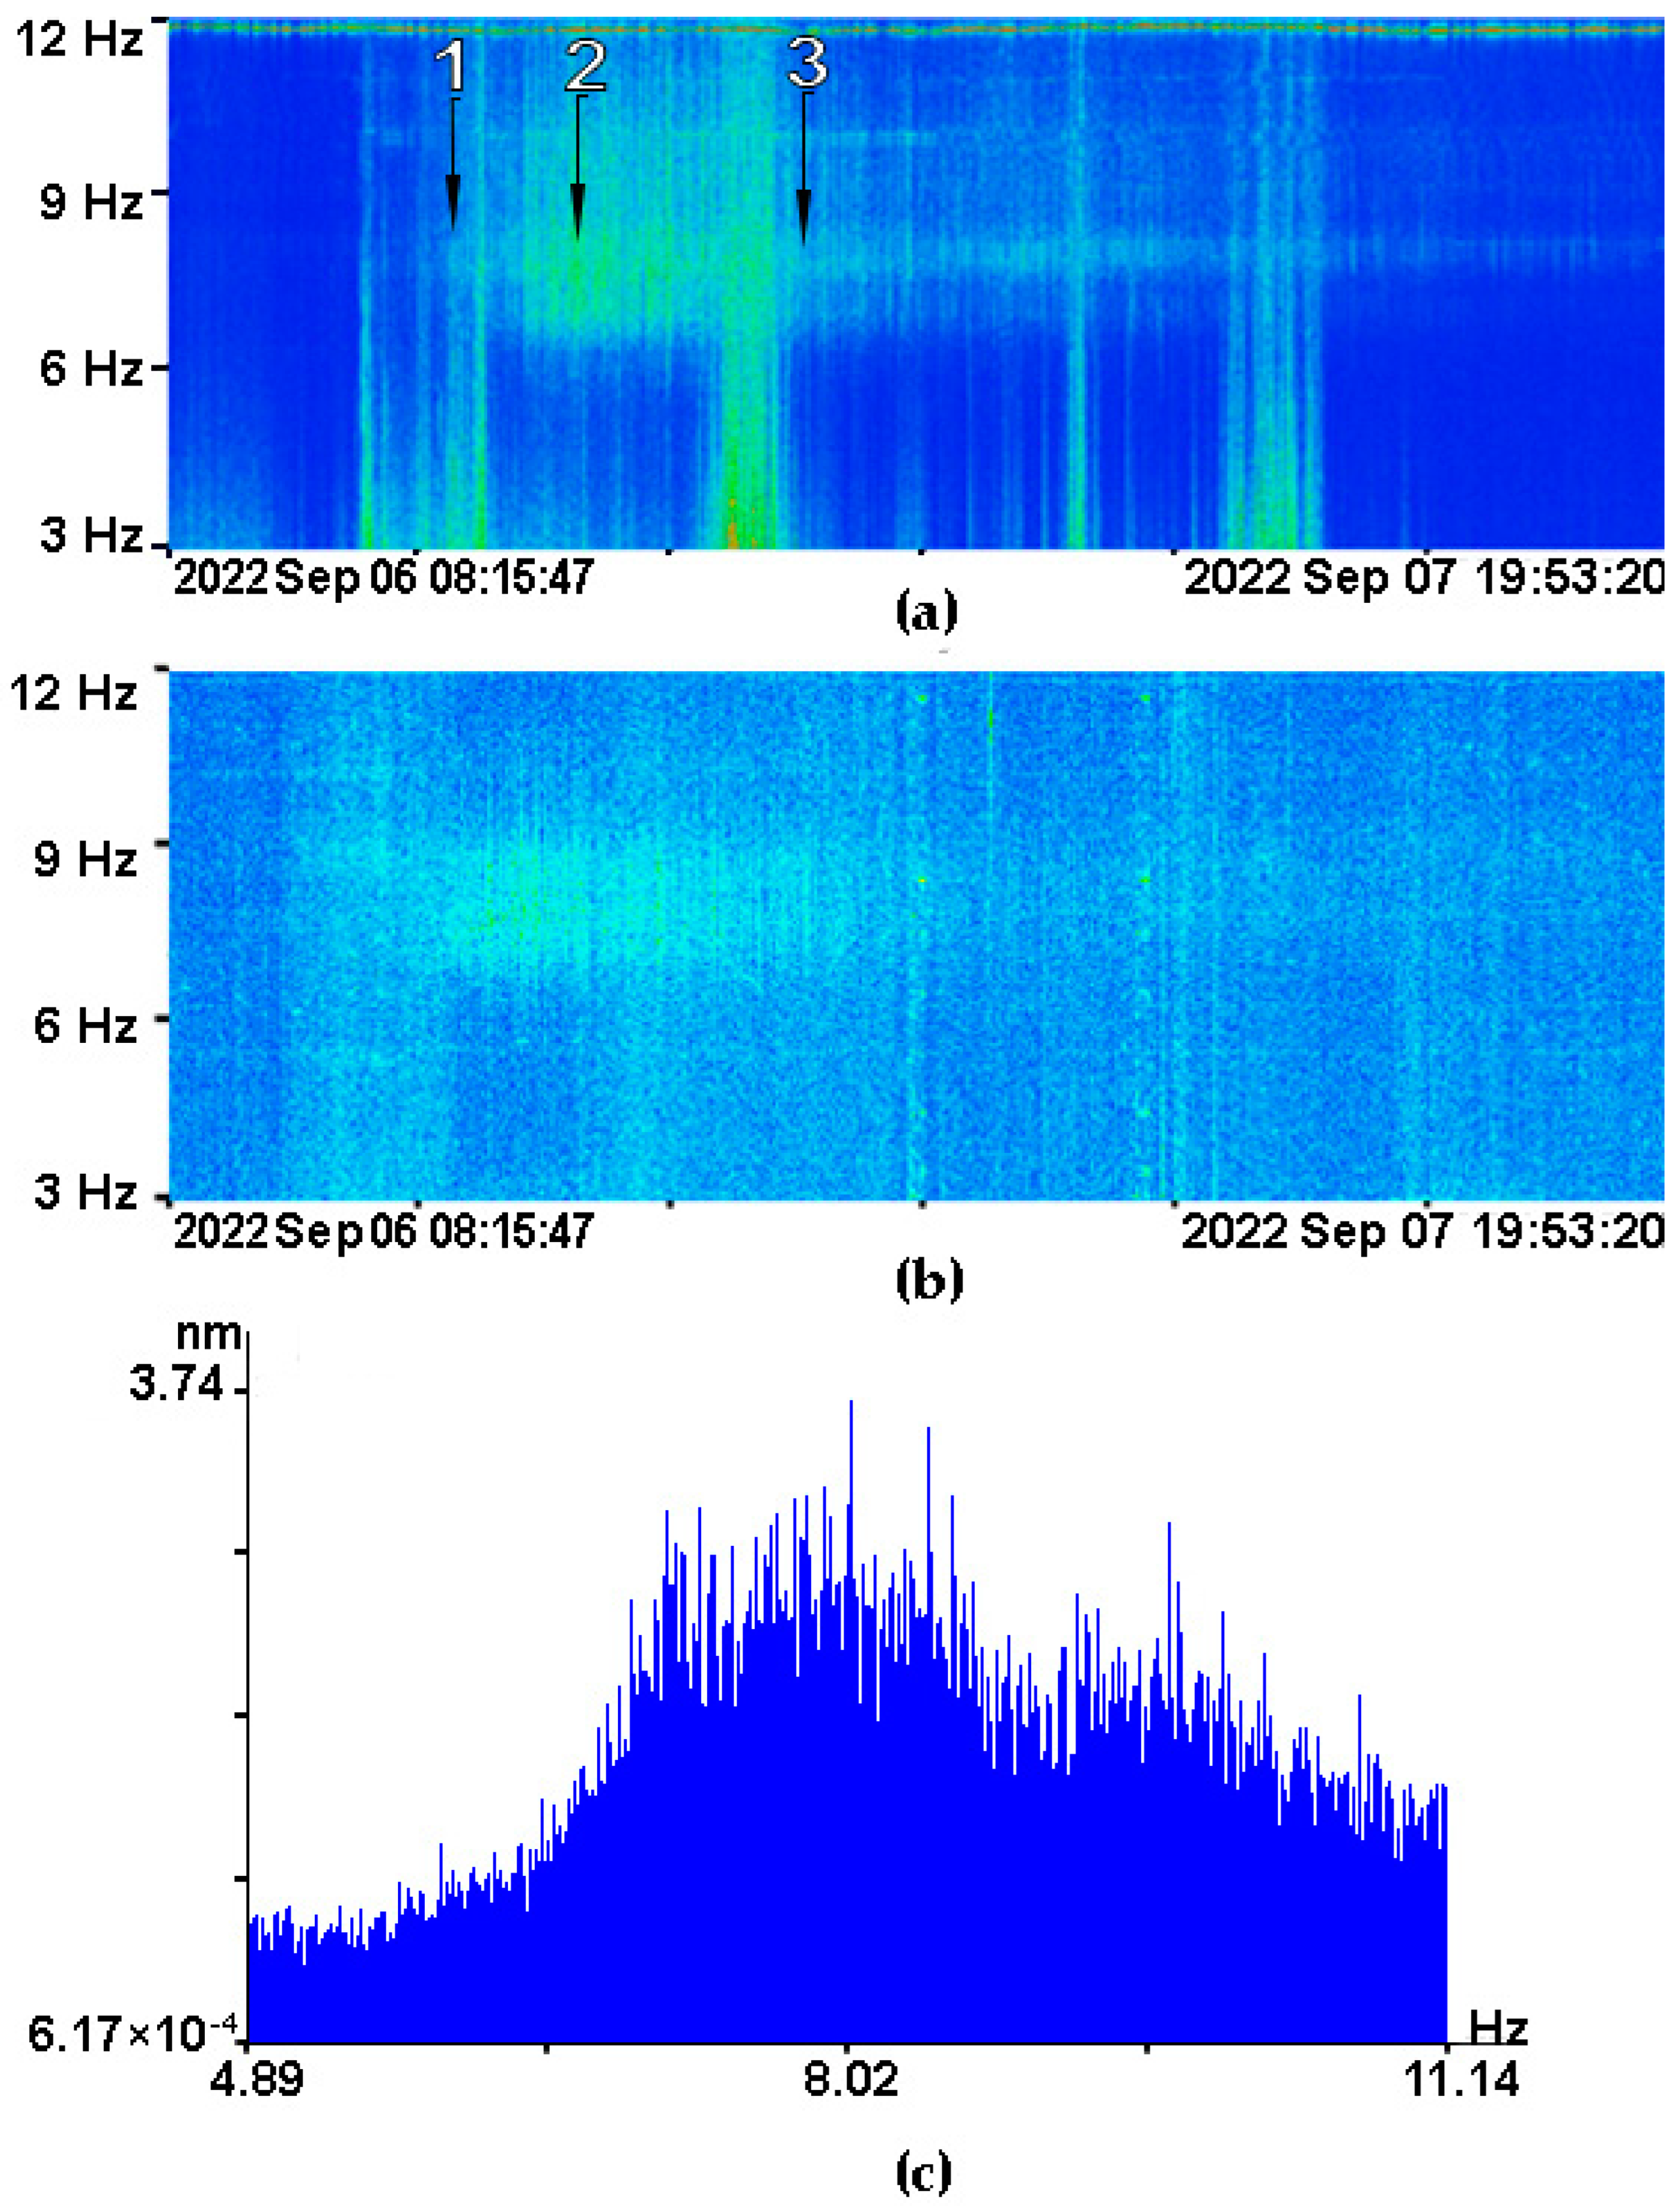
Figure 8 shows dynamic spectrograms obtained by processing data from the two-coordinate laser strainmeter. Numbers 1–3 in
Figure 7 and
Figure 8 indicate the time marks of the atmospheric center of the vortex presence during generation of the “voice of the sea” signal. In accordance with these notations, it is possible to trace the dynamics of the registered signal at the stage of its development and attenuation.
The dynamics of frequency changes in the spectrum with maximum amplitude as Typhoon Hinnamnor moved through the Sea of Japan are given in
Table 2.
In the beginning of the signal development around 15:00 on 6 September 2022, its peak frequency was 8.19 Hz. At this time, the typhoon was already moving across the Sea of Japan with its center at the distance of 250 km from the measuring site. The signal amplitude reached its maximum value in two hours. At 19:00, laser strainmeters registered a signal with a peak frequency of 8.02 Hz. The period from 00:00 to 01:00 on September 07 can be considered the time of signal attenuation; before this time, the signal amplitude gradually decreased. The peak amplitude of the signal was observed at a frequency of 7.9 Hz. The maximum amplitude level of the registered microseismic signal was up to 3 nm. The maximum recorded amplitude level of the “voice of the sea” microseismic signal according to the results of the first observation was 16 nm in 2016.
The combined analysis of the figures shows that the “voice of the sea” microseismic signal was recorded by the laser strainmeter when the typhoon was completely over the Sea of Japan and had already begun to actively influence the eastern part of the Primorsky Territory. At the same time, a field of swell waves was forming in the rear part of the atmospheric vortex; its interaction with the changing direction of the wind of the active rear part of the typhoon generated the microseismic signal under study.
As studies have shown, the background of “voice of the sea” microseismic oscillations under the influence of typhoons on the water area of the Sea of Japan can have different characteristics of frequencies and signal amplitudes with different total durations.
4. Conclusions
In the course of long-term in situ measurements using the coastal laser-interference measuring complex, we obtained unique data on microseismic oscillations in the frequency range from 6 to 12 Hz, resulting from the influence of powerful tropical cyclones on the Sea of Japan. Using the methods of processing satellite data and prognostic modeling, with help of the seismoacoustic method, it is possible to study variations in the characteristics of “voice of the sea” microseismic signals and the movement of their generation areas by changes in the amplitude of signals from multidirectional laser strainmeters.
We showed that the downgrading of a tropical cyclone hazard category, which is given in official sources of information, is often carried out much earlier than it actually decreases. This may be due to dangerous cyclonic processes leaving the area of observation responsibility of those meteorological agencies that provide information to international databases.
For a comparison with previously obtained data on the diversity of characteristics of “voice of the sea” microseismic signals having different signal bandwidths and different frequency maxima depending on the trajectory of cyclone propagation, we showed the result of the registration of microseismic infrasonic signals under the influence of Typhoon Hinnamnor on the region.
Numerical data of the dynamic change of frequencies with maximum amplitude are given. At direct influence of the cyclonic vortex in the water area close to the measuring complex, the value of the amplitudes of “voice of the sea” oscillations is higher by an order of magnitude. Also, in such a case the time of registration of infrasonic waves of the upper frequency range increases.
As a result of studying the characteristics of microseismic oscillations, it was determined that “voice of the sea” microseismic oscillations can be generated in different frequency bands, which can also have different widths and different frequencies with the maximum amplitude. Variations in these parameters depend on the trajectories of tropical cyclones and the duration of their impact on the Sea of Japan.


