Article

Automated Guided Vehicle (AGV) Scheduling in Automated Container Terminals (ACTs) Focusing on Battery Swapping and Speed Control

1
Institute of Logistics Science & Engineering, Shanghai Maritime University, Shanghai 201306, China
2
School of Logistics Engineering, Shanghai Maritime University, Shanghai 201306, China
*
Author to whom correspondence should be addressed.
J. Mar. Sci. Eng. 2023, 11(10), 1852; https://doi.org/10.3390/jmse11101852
Submission received: 22 August 2023 / Revised: 18 September 2023 / Accepted: 20 September 2023 / Published: 23 September 2023
(This article belongs to the Section Ocean Engineering)

Abstract

:
Because they are environmentally friendly and safe, automated guided vehicles (AGVs) are increasingly used in newly constructed automated container terminals. However, their scheduling strategy is constrained by their limited battery capacity. When batteries reach their charging threshold, the AGVs need to be returned to battery-swapping stations. Moreover, the movement speed of AGVs has a significant impact on their energy consumption and operating times. Therefore, in this paper, a speed control strategy that considers the traffic environment of the terminal is proposed from the perspective of energy conservation and emission reduction. In addition, the charging capacity of the terminal is discretized to model its limited handling capacity to avoid congestion in the battery-swapping stations. To minimize the costs of delays and carbon emissions of AGV operations, a mixed integer programming model is established. It optimizes the efficiency and carbon emissions of the operations by assigning and prioritizing container transportation and AGV battery-swapping tasks. An improved genetic algorithm-based approach is designed where a better initial solution is obtained through a greedy strategy, while simulated annealing is adopted for population selection to prevent the algorithm from falling into local optima. Furthermore, an adaptive adjustment strategy for crossover and mutation probabilities is adopted to improve the algorithm’s convergence. Finally, a series of numerical experiments is conducted to verify the efficiency of the proposed method. The experimental results indicate that considering the variability of AGV speed can more accurately characterize their energy consumption, and increasing the number of AGVs and enhancing the battery-swapping capacity can effectively reduce the costs of delays and carbon emissions.

1. Introduction

As critical nodes in the global supply chain, container terminals play a significant role in international trade. As technology advances and operational equipment is upgraded, ports are gradually transitioning toward constructing automated or semiautomated container terminals (ACTs). Horizontal transportation equipment used for the delivery of containers between the seaside and the landside is a key component in the operation of container terminals. Among these, automated guided vehicles (AGVs) constitute the transportation equipment with the largest market share in the global container port business.
In recent years, to achieve high throughput and storage density in ACTs, yards equipped with unilateral cantilever rail-mounted gantry cranes combine the advantages of conventional and general automated container yards and have been adopted in newly constructed automated terminals, such as the Tuas Port in Singapore and the Haifa Port in Israel. In this new yard layout, AGVs can enter the interior of blocks arranged perpendicularly to the shoreline for interaction with the yard cranes (YCs). This approach has resulted in the development of long-range AGVs operating in more complex environments, requiring more maneuvering and under more complex scheduling requirements.
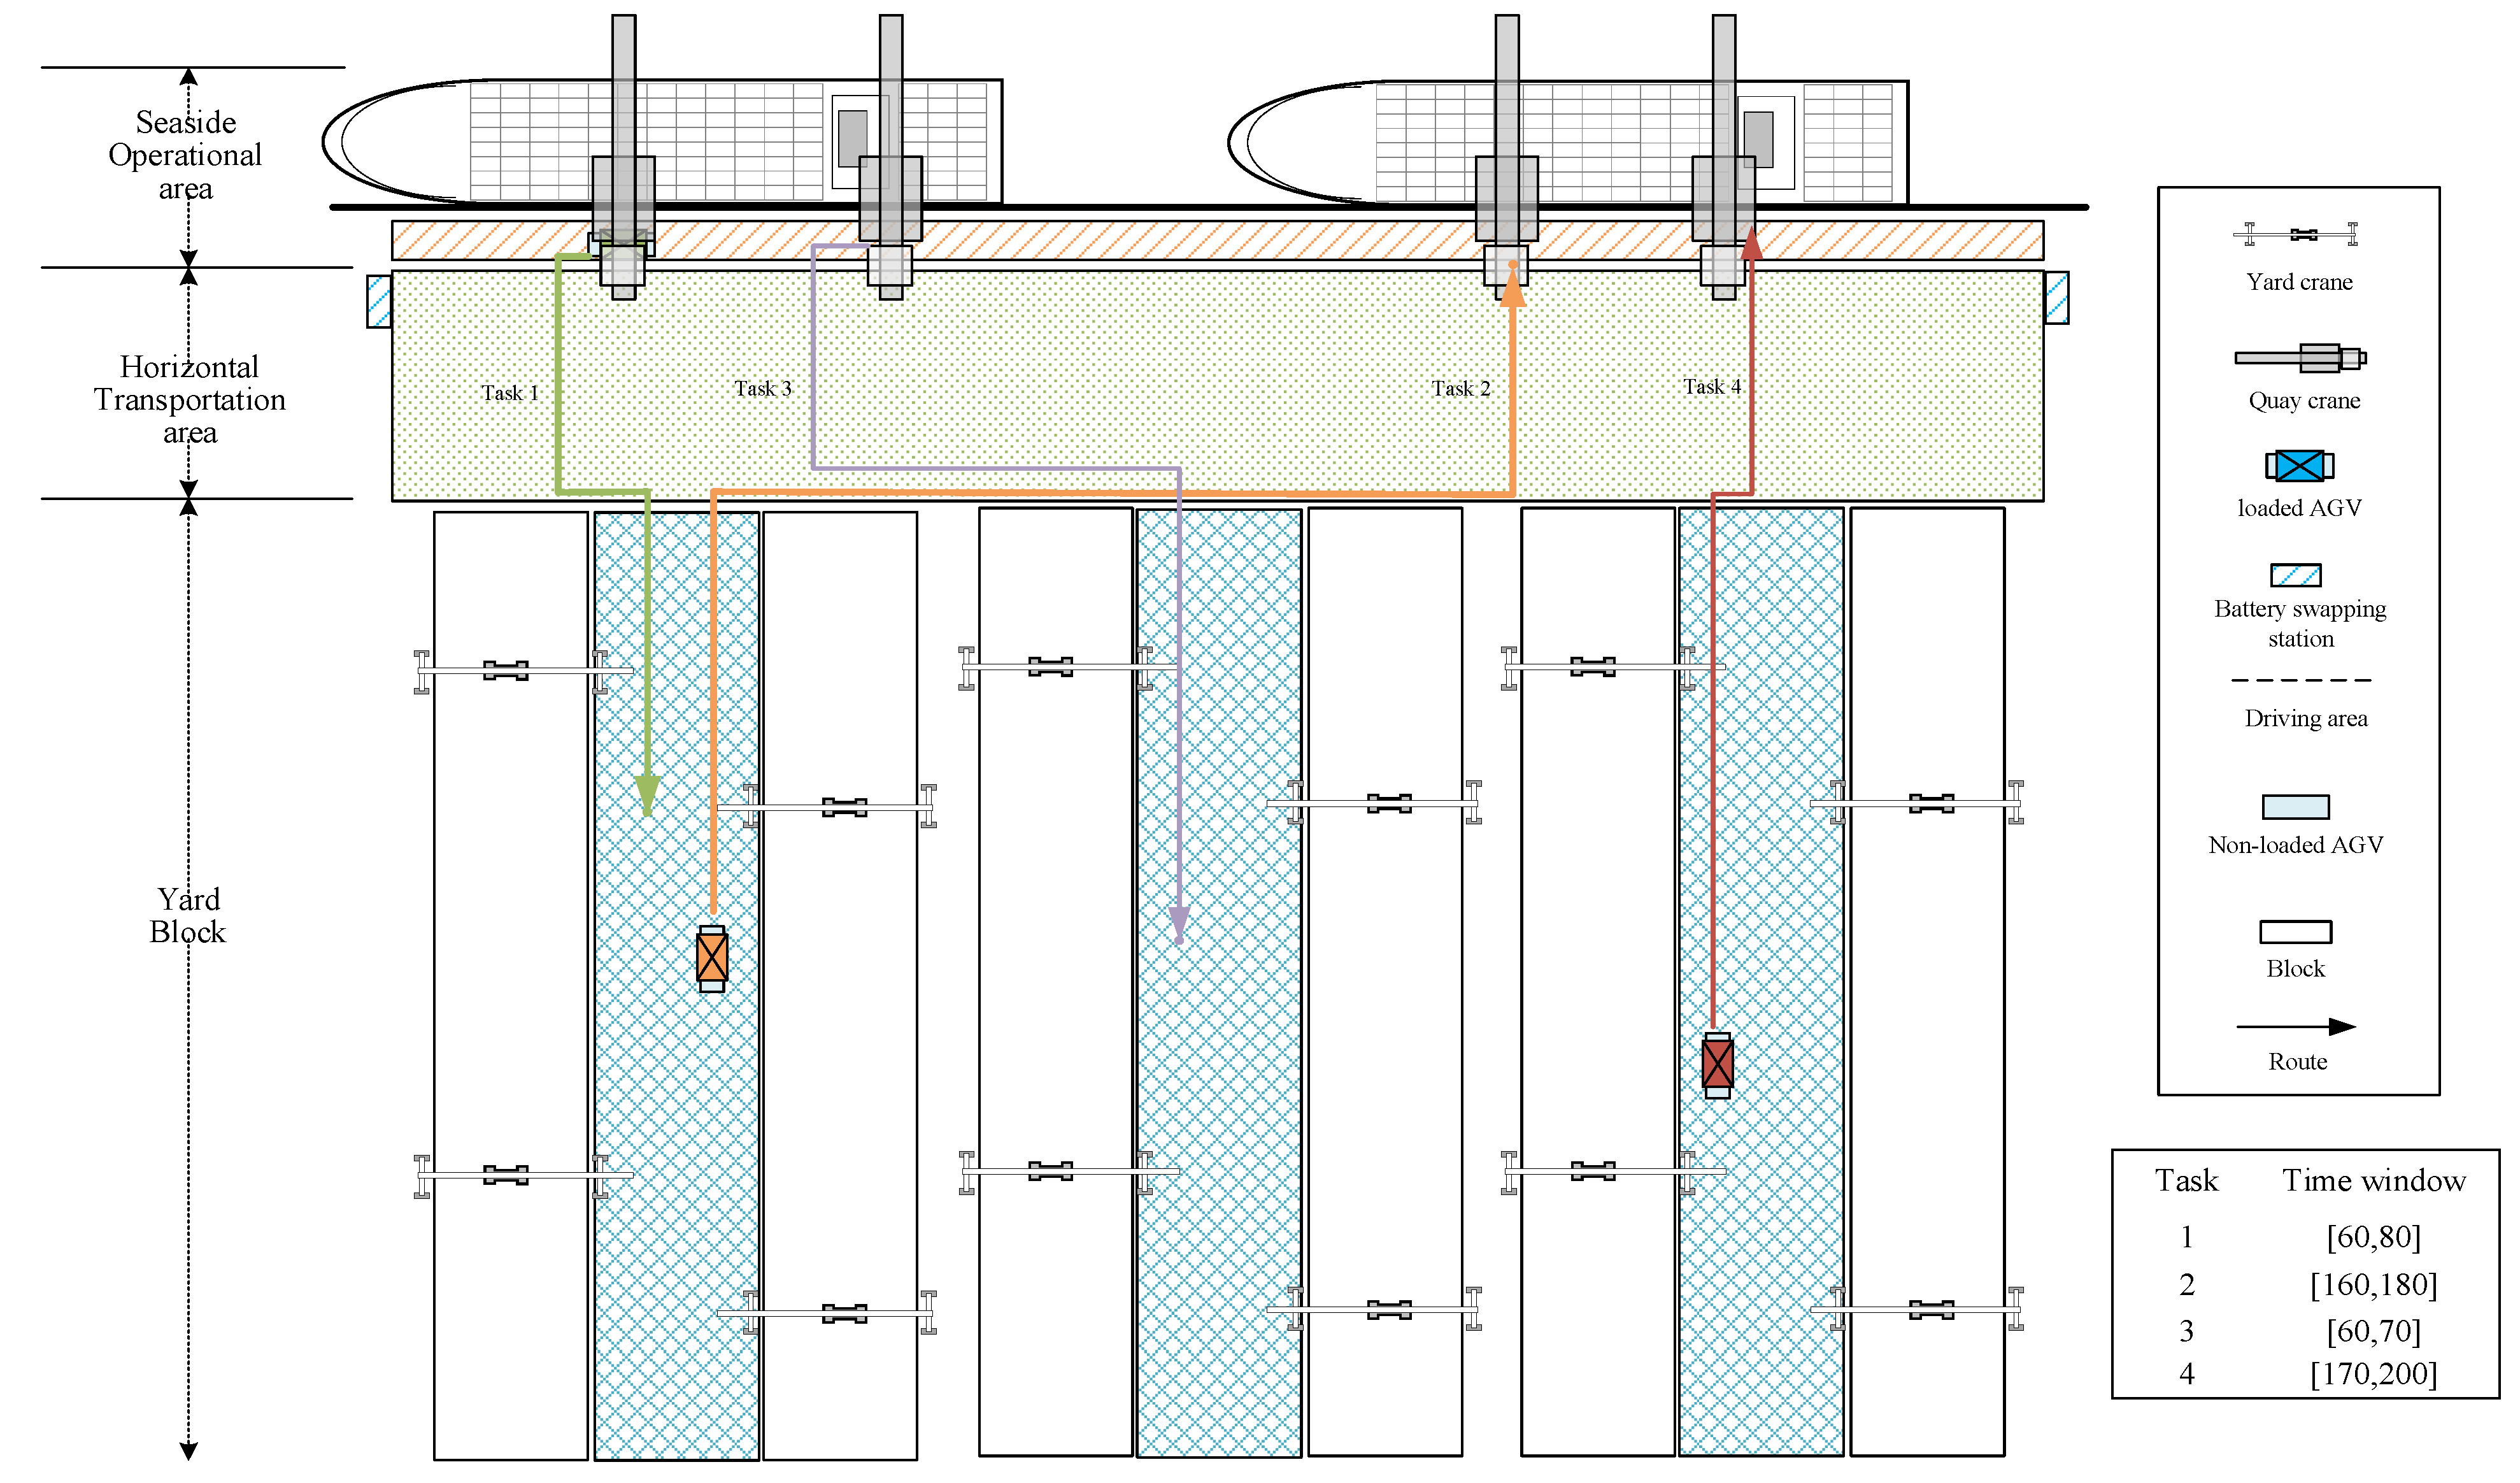
Figure 1 shows a typical layout of a new ACT. The terminal is divided into three parts: the seaside operation area, the horizontal transportation area, and the yard blocks. In addition, a battery-swapping station providing battery recovery for AGVs is arranged within the horizontal transportation area. In addition, the AGV-drivable area is divided into three parts: the apron area, the horizontal transportation area, and the block area. Among them, AGVs in the apron area need to handle containers in cooperation with quay cranes (QCs), while in the block area of the yard, AGVs need to interact with YCs to handle containers. Because of the lack of space allowing wide movement, as in the horizontal transportation area, interaction with YCs is more challenging. The roads inside the yard block are narrow and crowded, the traffic environment is more complex, and the speed control requirements are high.
In the conventional container terminal truck scheduling, vehicles are often controlled by drivers. With the advancement of Industry 4.0, the terminal’s transportation system has been updated to automation and digital intelligent technology, posing additional operational challenges. Unoccupied vehicles have to rely on control systems for scheduling. In addition to completing container transportation tasks, it is also necessary to control the vehicle’s driving speed and monitor the vehicle’s electricity level. Because of the limited capacity of their battery packs, AGVs often need to return to the battery stations for battery swapping during the yard operations. However, the handling capacity of the battery-swapping stations is limited, and too many AGVs entering at the same time may cause congestion. In addition, the traffic environment in different areas of the terminal can also have an impact on the movement speed of AGVs, thereby affecting their energy consumption and, by extension, the CO2 emissions associated with replenishing the batteries.
Unlike the conventional AGV scheduling [1,2,3,4,5], when studying the AGV scheduling problem in a new type of automated container terminal, it is necessary to pay attention to its battery consumption, ensuring that the depleted AGVs can be restored in a timely manner while completing their task, thereby ensuring the smooth completion of container transportation. At the same time, it is necessary to consider the charging capacity of the terminal to avoid congestion of AGVs with depleted batteries at the battery-swapping station and consider factors that affect the energy consumption of AGVs, such as their driving speed, often influenced by the traffic environment in different areas of the terminal. Therefore, this paper schedules AGV operations to determine the task and sequence of AGV operations while also exploring the impact of AGV speed variability on carbon emissions and task completion.
With the construction of smart terminals, intelligent equipment and technologies have also been widely applied, and low-carbon environmental protection is receiving increasing attention. Therefore, this paper studies the scheduling problem of AGVs in new terminals from the perspective of energy conservation and emission reduction, ensuring that AGVs complete their tasks while reducing carbon emissions. It also provides an academic reference for the operation of smart terminals and the intelligent upgrading of traditional ones.
This paper studies the AGV scheduling problem in a new type of automated container terminal, taking into account the battery swapping and speed control of AGVs and optimizing their task assignment and operation sequence while avoiding congestion at the battery-swapping station, thereby minimizing the operation delay and carbon emission costs of AGVs. The contributions of this paper mainly lie in the consideration of the following:
(1)
A speed control strategy considering the traffic environment of new ACTs is proposed, and a mixed integer programming (MIP) model is established with the goal of minimizing CO2 emissions and delays due to AGV operations. The new model takes into account the battery recovery of AGVs and the impact of traffic conditions on speed in different areas of new ACTs;
(2)
Because of the complexity of the proposed model, an improved genetic algorithm (GA)-based solution is developed. A greedy strategy is used to generate a better initial solution. A simulated annealing (SA)-based population selection approach and an adaptive crossover and mutation probability calculation prevent the algorithm from falling into local optima while increasing the rate of convergence, thus improving the solution efficiency.
In the rest of this paper, Section 2 offers a brief review of the AGV scheduling problem. This problem in new ACTs is defined in Section 3, and a MIP model is established. The proposed approach is introduced in Section 4. The results of simulation experiments are presented in Section 5. Finally, the study’s conclusion is discussed, and future directions for this field are put forward in Section 6.

2. Literature Review

In this section, the relevant literature on the AGV scheduling problem is reviewed, and the following aspects are considered: AGV scheduling in ACTs, AGV scheduling considering battery recovery, and AGV scheduling considering speed control.
Scholars have conducted extensive research on the AGV scheduling problem in ACTs. Sun et al. (2022) provided a comprehensive review of AGV-based transportation systems of ACTs and summarized the literature presented in the past 25 years from different research perspectives [6]. Grunow et al. (2005) studied the multi-load AGV dispatching problem. On this foundation [1], Grunow et al. (2006) further considered the uncertain handling time of cranes and release times of orders [7]. Yang et al. (2018) established a bi-level programming model to study AGV scheduling in ACTs and proposed an improved GA to solve the proposed model [2]. Zhong et al. (2020) integrated the AGV scheduling problem and AGV conflict-free path-planning problem into a hybrid genetic algorithm-particle swarm optimization designed to solve the proposed mixed integer programming model [3]. Wang et al. (2022) investigated the AGV scheduling problem considering bidirectional paths in ACTs and designed a branch-and-bound algorithm to generate conflict-free routes and minimize the total completion time [4]. Duan et al. (2023) studied the AGV scheduling problem considering the interaction with QC, and a mixed integrated programming model was established with the goal of minimizing the completion time of ships and the idle time of AGVs [5]. Yang et al. (2023) studied the AGV scheduling problem under the sea rail intermodal transportation model and established a mixed integer programming model to minimize equipment energy consumption [8]. Hu et al. (2023) investigated AGV path planning in conflict situations, and the multiagent deep deterministic policy gradient (MADDPG) method was proposed to obtain the shortest path [9].
There is also relevant research on yard vehicle assignment and scheduling. Dotoli et al. (2014) developed a Petri nets-based framework for intermodal freight transport terminals that can evaluate the operational performance of transportation systems and the terminals’ efficiency [10]. Subsequently, Cavone et al. (2016a) proposed two further control policies to optimize the terminal performance [11], and Cavone et al. (2016b) used timed Petri nets to solve the strategic planning and the capacity/frequency of the transportation equipment [12]. Iris et al. (2018) integrated the management of loading operations, planning, and scheduling of the transport vehicles and established a mixed integer programming model to minimize tardiness and vessel service time [13].
With the construction of green ports, electric vehicle scheduling has gradually attracted the attention of several scholars. Iris and Lam (2019) and Zhou et al. (2022) provided a comprehensive review of energy efficiency and application of AGV in green ports, respectively [14,15]. Schmidt et al. (2015) evaluated the cost efficiency of electric AGVs in ACTs from a revenue perspective and proposed strategies to further enhance their profitability [16]. Ma et al. (2020) studied the planning of charging station facilities and operational strategies of electric AGVs in ACTs and proposed two layout designs and two charging strategies for deploying charging stations and controlling electric AGV charging [17].
In addition, scholars have conducted in-depth research on the issue of battery power in AGV scheduling. Xiang et al. (2021) established an ACT-nested semi-open queuing network model, which evaluates the ACT performance under different plug-in charging and battery-swapping strategies [18]. Singh et al. (2022) studied AGV scheduling in ACTs considering battery charging to minimize the tardiness and travel costs of AGVs and developed an adaptive large-neighborhood search algorithm to solve the proposed MIP model [19]. Sun et al. (2023) investigated AGV scheduling focusing on battery charging and established a collaborative scheduling optimization model that trades off terminal operational efficiency and energy savings [20].
Other scholars have studied the energy recovery of electric vehicles in other application scenarios. Keskin et al. (2019) studied electric vehicle routing with time windows, taking into account the queuing time of vehicles at charging stations [21]. Hosseini et al. (2020) proposed a novel, fully distributed control strategy for large-scale electric vehicles, minimizing total charging costs and battery degradation while achieving optimal charging [22]. Dang et al. (2021) studied the scheduling problem of heterogeneous AGVs in factories, considering limited battery capacities and partial charging at critical battery thresholds [23]. Jamshidi et al. (2021) studied the scheduling problem of electric taxis and developed a charging algorithm that considers movement distance, charging facility capacity, and charging time [24]. In order to explore the relationship between AGV scheduling, charging threshold, and power consumption, Li et al. (2022) studied AGV scheduling in a manufacturing factory [25]. Lam et al. (2022) studied electric vehicle routing considering time windows and charging constraints, but in this case, the energy recovery was modeled as a piecewise linear function of charging time [26]. Boccia et al. (2023) studied AGV scheduling with battery constraints in manufacturing workshops and determined the optimal scheduling of transportation and charging operations for AGV fleets [27].
Some scholars’ focus on AGV speed control in AGV scheduling is also worth noting. Nishi et al. (2014) studied the optimization of collision-free paths for AGVs with acceleration and deceleration. By discretizing the transportation area into several regions, a continuous time model was established to represent the dynamic changes in the vehicle’s state [28]. Adamo et al. (2018) determined the AGV path and speed on each arc to prevent conflicts, focusing on time windows and minimizing the total energy consumption [29]. Chen et al. (2021) studied automatic truck scheduling and established a mixed integer second-order cone programming model based on fuel consumption functions related to movement speed and fleet formation to minimize the total operating costs [30]. Considering the impact of speed on AGV travel time and energy consumption, Xing et al. (2023) studied AGV scheduling in ACTs and established an MIP model to minimize the total operation time of cranes and the energy consumption of the AGVs [31].
The literature related to automated vehicle scheduling is classified in Table 1 on the basis of the following six main consideration parameters: (1) charging demand, (2) limited charging capacity, (3) speed, (4) types of constraints, (5) types of models, and (6) solution approach. Overall, only a few papers have considered a speed factor in vehicle scheduling problems. Additionally, only a few works have considered both AGV speed control and energy consumption in ACT settings. Moreover, these studies did not simultaneously consider the charging demand of AGVs. In the AGV scheduling of urban roads and factory workshops, only a few scholars have considered the charging demand while addressing the limited charging capacity.
Therefore, from the perspective of green port construction, in this paper, AGV scheduling is studied in the context of container transportation operations in ACTs, taking into account the charging demands of AGVs and the limited charging capacity of the terminal. The traffic environment in different areas is also analyzed to determine the optimal AGV speed and the CO2 emissions incurred during AGV transportation.

3. Problem Description

3.1. Automated Guided Vehicle Scheduling in Automated Container Terminals

3.1.1. Decision Problem

In this paper, the container transportation process is regarded as a container task, and the handling capacity of the charging station is discretized into several battery-swapping tasks. A container-loading task requires the AGV to reach the starting position of the task and transport the container to its destination. A battery-swapping task requires the AGV to travel to the battery-swapping station and remain there for the period of time required by the swapping robot to load and unload a battery pack.
The number of unloaded AGV transitions needs to be decreased effectively by optimizing AGV scheduling and altering the order of AGV operations. Simultaneously, the optimization of AGV speed can reduce AGV energy consumption. When the cumulative energy consumption of the AGV reaches a charging threshold Emax, the AGV needs to return to the battery-swapping station to prevent its battery from depleting completely and stalling, which would compromise the overall terminal’s operation. Furthermore, because of the limited handling capacity of the battery-swapping station, the AGV charging sequence should also be considered to avoid congestion in the battery-swapping station. As a result, the research focus of this paper is on the scheduling of AGV container tasks and battery-swapping tasks, the adjustment of operational sequences and movement speeds, and the replacement of depleted AGV batteries to ensure that all container transportation tasks are completed within a specific allocated time period while minimizing the CO2 emissions generated by AGV charging.

3.1.2. Impact of Speed Variability

AGVs are commonly considered pollution-free vehicles because they consume electrical energy. However, in many countries, electricity is generated through fuel combustion, which results in the release of a large amount of greenhouse gases. Therefore, drawing inspiration from Zhang et al.’s research on carbon emissions from electric vehicles (2018) [32], in this paper, the carbon dioxide (CO2) emissions caused by the operation of AGVs are calculated through the AGVs’ energy consumption.
In order to calculate the total CO2 emissions from AGV operation, it is necessary to calculate the energy consumed as an AGV moves between any two points in the terminal. Assuming, as in Equation (1), that i and j are the starting and ending points that define an arc, the energy required by an AGV moving along arc (i, j) is η i j , effm is the motor efficiency, effd is the electrical energy efficiency, α is an arc-specific coefficient, β is a vehicle-specific coefficient, g is the weight of the AGV, Loadij is the weight of the container transported by the AGV, dij is the length of arc (i, j), and the velocity of AGV along arc (i, j) is vij, then
η i j = e f f d e f f m α g + L o a d i j d i j + β v i j 2 d i j
The energy consumption of an AGV on the arc (i, j) is related to its load, its speed, and the arc’s length. Given the container task, the energy consumption of AGV is only related to its speed. Therefore, the speed of the AGV affects not only the task start and completion times but also the energy consumption of the AGV, thereby affecting its CO2 emissions C E i j during operation. This is shown in Equation (2)
C E i j = e f f p r η i j = e f f p r e f f d e f f m α g + L o a d i j d i j + β v i j 2 d i j
where effp is the charging efficiency, and r is the rate of electric energy conversion into emissions based on the country’s energy mix. Considering the different conditions in each ACT area, dividing the route of AGV into smaller segments allows for a more accurate representation of the variability of the AGV’s speed on a given route. At the same time, traffic speed can be defined for each segment from on the traffic conditions of each area. To further illustrate the speed changes in AGVs in different areas, Figure 2 shows the route of an AGV as it performs a container-unloading task in a layout such as the one shown in Figure 1. The container-unloading task requires the AGV to pick up the container from the QC, then move through the horizontal transportation area, enter the corresponding yard block, and finally stop next to the designated bay to deliver the container to the YC. Because the allocated storage location of the container has already been determined at a higher decision-making level, the distance traveled by the AGV to complete the task is known.
Assuming that the distance traveled by the AGV to complete the unloading operation Task 1 is 270 m, if the traffic environment is not taken into account, it is assumed that the movement speed of the AGV is 5 m/s. Considering that AGVs operate in different areas, the transportation route can be divided into three segments of 20 m, 100 m, and 150 m lengths, as shown in Figure 2. According to the traffic rules and safety regulations of the terminal, combined with the actual production environment, we have limited the maximum speed of AGV driving in each area to control their speed. We assumed that information on the traffic environment in different areas could be obtained and that the AGV movement speeds in the three segments are specified as 5 m/s, 6 m/s, and 4 m/s, respectively. If an AGV completes the container task moving with a speed of 5 m/s, assuming that the traffic speed is constant along the entire route, the CO2 emitted by the energy consumed to perform Task 1 is 4.73 g. However, if the traffic environments of the AGVs in different areas of the terminal are considered, and the AGVs travel at the specified speeds on each segment, the CO2 emissions generated are 4.56 g. Compared with the constant speed movement, a variable AGV movement speed will result in CO2 emissions reduced by 3.73%. Therefore, considering the speeds in different transportation areas will make the calculation of AGV CO2 emissions more accurate.

3.2. Assumptions

Based on the preceding discussion, the following assumptions are stated;
(1)
Each AGV has the same battery capacity;
(2)
An AGV only transports a single container at a time;
(3)
The initial energy consumption of AGVs obeys a uniform distribution;
(4)
The start and end times of each task can be calculated from the known container-loading and -unloading sequences of automated QCs and YCs and are available prior to investigating the AGV scheduling;
(5)
The acceleration and deceleration of AGVs are instantaneous.

3.3. Mathematical Model

The mathematical model can be established following the objections and constraints expressed by Equations (3)–(27):
min i I l L ¯ i k K f c f e d ¯ i l δ ¯ i l k 2 + i I j I l L i j k K f c f e d i j l δ i j l k 2 + i A f p μ i s . t .
k K α i k = 1 i A
k K α i k 1 i T
i I β 0 i k = 1 k K
i I β 0 i k = i I β i 0 k k K
j I 0 β i j k = α i k i I , k K
j I 0 β j i k = α i k i I , k K
a i α i k ρ i k b i α i k + μ i i A , k K
a i α i k ρ i k b i α i k i T , k K
ρ i k ρ j k + l L ¯ i d ¯ i l / δ ¯ i l k + l L i j d i j l / δ i j l k M ( 1 β i j k ) i A 0 , j I , i j , l L i j , k K
ρ i k ρ j k + c i + l L i j d i j l / δ i j l k M ( 1 β i j k ) i T , j A 0 , l L i j , k K
η j k ( η i k + q l L ¯ j d ¯ j l δ ¯ j l k 2 + q i L i j d i j l δ i j l k 2 ) M ( 1 β i j k ) i I 0 , j A , i j , l L i j , k K
η j k ( η i k + q l L ¯ j d ¯ j l δ ¯ j l k 2 + q i L i j d i j l δ i j l k 2 ) M ( β i j k 1 ) i I 0 , j A , i j , l L i j , k K
η i k = 0 i T , k K
E max ( η i k + q i L i j d i j l δ i j l k 2 ) M ( β i j k 1 ) i I 0 , j T , k K
E max ( η i k + q i L i j d i j l δ i j l k 2 ) M ( β i 0 k 1 ) i A , j T , k K
δ i j l k u i j l i I 0 , j I 0 , i j , l L i j , k K
δ ¯ i l k u ¯ i l i A , l L i , k K
α i k 0 , 1 i I 0 , k K
β i j k 0 , 1 i I 0 , j I 0 , k K
η i k 0 i A , k K
ρ i k 0 i I 0 , j I 0 , k K
μ i 0 i A
v l b δ i j l k v u b i I 0 , j I 0 , i j , l L i j , k K
v l b δ ¯ i l k v u b i I 0 , l L i , k K
Objective (3) aims to minimize the CO2 emission cost and penalty costs caused by operational delays. The CO2 emission costs include those incurred during complete tasks and those incurred during no-load operations. Constraints (4) and (5) state that each container and battery-swapping task, respectively, can be completed at most once. Constraints (6) and (7) state that all AGVs must depart and ultimately return to dummy nodes. Constraints (8) and (9) guarantee that each node has only one immediately preceding and one immediately following node. Constraints (10) and (11) limit the starting time of the container and battery-swapping task nodes within specified ranges. Constraint (12) limits the start time of the ensuing tasks after the AGV has completed a container task; that is, the start time of an ensuing task must be later than the start time of the preceding container task plus its operational time and the no-load traveling time between the two task nodes. Constraint (13) restricts the start time of an ensuing container task after the AGV has completed a battery-swapping task, which means that the start time of the ensuing task must be later than the start time of the preceding swapping task plus the duration of stay at the battery-swapping station and the no-load traveling time between the two task nodes. Constraints (14) and (15) pertain to the cumulative energy consumption associated with completing each container task. Constraint (16) ensures that the cumulative energy consumption of the AGV after completing a battery-swapping task is reset to zero. Constraints (17) and (18) ensure that the AGV has sufficient power to travel to the battery-swapping station. Constraints (19) and (22) restrict the speed of each segment to the maximum speed allowed by the traffic environment. Constraints (21)–(27) are the value ranges of the decision variables.

3.4. Model Linearization

The objective function of the model and the constraints applied include speed decision variables related to nonlinear terms. Therefore, linearization of the model is required. In this paper, the same strategy used by Nasri et al. (2018) is adopted [33]; thus, the speed variable is discretized, i.e., the velocity is represented using a set of discrete values R = { 1 , , r , } . At the same time, two binary decision variables λ i j l k r and λ ¯ i l k r are introduced to designate the speed selection in different segments. The exact linearization process is shown below:
Sets
R the   set   of   speed   v 1 = v l b   and   v | R | = v u b
Decision variables
λ i j l k r binary variable λ i j l k r = 1 , if AGV k moves at speed level r on segment l of the arc (i, j); otherwise λ i j l k r = 0 ;
λ ¯ i l k r binary variable λ ¯ i l k r = 1 , if AGV k moves at level r on segment l of the node i; otherwise λ i j l k r = 0 .
min i A l L ¯ i k K f c f e d ¯ i l r R λ ¯ i l k r v r 2 + i I j I l L i j k K f c f e d i j l r R λ i j l k r v r 2 + i A f p μ i
s.t.
(4)–(11), (16), (21)–(25)
ρ i k ρ j k + l L ¯ i d ¯ i l r R λ ¯ i l k r / v r + l L i j d i j l r R λ i j l k r / v r M ( 1 β i j k ) i A , j I 0 , i j , , k K
ρ i k ρ j k + c i + l L i j d i j l r R λ i j l k r / v r M ( 1 β i j k ) i T , j A 0 , k K
η j k ( η i k + q l L ¯ j d ¯ j l r R λ ¯ j l k r v r 2 + q i L i j d i j l r R λ i j l k r v r 2 ) M ( 1 β i j k ) i I 0 , j A , i j , k K
η j k ( η i k + q l L ¯ j d ¯ j l r R λ ¯ j l k r v r 2 + q i L i j d i j l r R λ i j l k r v r 2 ) M ( β i j k 1 ) i I 0 , j A , i j , k K
E max ( η i k + q i L i j d i j l r R λ i j l k r v r 2 ) M ( β i j k 1 ) i I 0 , j T , i j , k K  
E max ( η i k + q i L i j d i j l r R λ i j l k r v r 2 ) M ( β i 0 k 1 ) i A , j T , i j , k K
r R λ i j l k r v r u i j l i I 0 , j I 0 , i j , l L i j , k K
r R λ ¯ i l k r v r u ¯ i l i A , l L i , k K
r R λ i j l k r = β i j k i I 0 , j I 0 , i j , l L i j , k K
r R λ ¯ i l k r = α i k i A , l L i , k K
λ i j l k r 0 , 1 i I 0 , j I 0 , i j , l L i j , k K , r R
λ ¯ i l k r 0 , 1 i A , l L i , k K , r R
Constraints (29)–(36) play the same role as Constraints (12)–(15) and Constraints (17)–(20). Constraints (37) and (38) ensure that each AGV must move at only one speed on each segment. Constraints (39) and (40) are the value ranges of the decision variables.

4. Solution Approach

Owing to the complexity of the developed model, the solution space of the problem expands as the scale of the numerical experiments increases, and it is difficult to obtain the results within a reasonable time through the direct application of commercial solvers such as GUROBI. The main factors affecting the complexity of the proposed model come from the integer decision variables of task assignment and task sequence. The integer encoding rules of GA are very suitable for solving such decision variables [2,8,20]. Therefore, in this paper, a greedy and simulated annealing strategy-based adaptive genetic algorithm (GSAAGA) is proposed to improve the efficiency of the model solution. The randomness of the algorithm search is used to improve the global search capability and find the optimal solution among the combinations of task assignments that guarantee minimum battery power consumption.

4.1. Coding and Decoding

The MIP model proposed in this paper consists of eight decision variables, among which task assignment α i k and operation sequence β i j k are the main decision variables in the AGV scheduling problem. Due to the soft time window constraints of container operation tasks and the potential impact of delays in ACT transportation operations on the scheduling of equipment downstream, the delay costs account for a relatively high proportion of the objective function. Therefore, after determining the tasks assigned to the AGVs, the task sequence can be obtained by sorting the task time windows in ascending order.
The decision variables involved in the speed control of each road segment are not determined using algorithms due to their fine granularity, high similarity in decision content, and large decision space. Thus, the maximum speed is used in the algorithm for energy and cost calculations, and the GUROBI solver was invoked to obtain the speed of each road segment after determining the key decision variables.

4.1.1. Solution Coding

A solution is encoded as a vector z = { , z k , } , representing the assignment of container tasks, and its length is the total number of container tasks. The number at each position indicates which AGV performs the corresponding container task, and the number takes on a value ranging from zero to |K| − 1. The encoding method indicates which AGV performs which container transportation task. Figure 3 demonstrates a solution coding of the solution, in which z 2 = 1 , z 3 = 1 and z 6 = 1 indicate that Tasks 2, 3, and 6 are all performed by AGV 1.
The AGV battery-swapping operation tasks add additional waiting time and no-load travels, increasing delay and CO2 emission costs. Battery-swapping tasks need to be performed only when an AGV reaches the swapping threshold; that is, battery-swapping tasks depend on the operational tasks assigned to the AGV. Therefore, battery-swapping tasks are not explicitly assigned to AGVs during coding.

4.1.2. Decoding

The container tasks assigned to each AGV can be determined through the above chromosome coding, and the operational sequence of AGVs can be sorted based on the time window of each task. In addition, it is also necessary to know precisely which battery-swapping tasks are required and where these tasks have been planned in the task sequence. In this paper, simulations are used to determine the task sequence of each AGV and calculate the cost of that task sequence while decoding. The process of decoding is shown in Algorithm 1.
The decoded solution of the chromosomes in Figure 3 is shown in Figure 4. It can be seen that this decoding method can not only obtain the sequence in which AGVs complete the container tasks but also determine when they need to swap their batteries, thereby determining which battery-swapping tasks the AGVs will need to perform.
Algorithm 1. Solution decoding process. Decoding of AGV scheduling scheme based on time window and simulation
Inputload segment d ¯ i l ,   chromosome   c ,   load   segment   d ¯ i l , no-load segment dijl, earliest starting time ai, initial cumulative energy consumption ηok, energy consumption coefficient q, cost coefficient fc, fe, fp.
Output decision   variables   α i k ,   β i j k ,   f i t n e s s .
Foreach ( container   task   i , j I )
 Calculate the process time of task i  :  t i m e i = d ¯ i l / u ¯ i l , no-load travel time of arc ( i , j ):  t i m e i j = d i j l / u i j l , energy consumption of task i :   b a t i = q t i m e i , no-load energy consumption of arc ( i , j ):  b a t i j = q t i m e i j .
Create AGV task sequence list: taskk = [List1, …, Listk], and swapping state list of each AGV changedk.
Foreach   ( container   task   i A )
let v c [ i ] ,   l a s t AGV v last completed task
Foreach   ( container   task   i  taskk, AGV   k K )
 If ηlastk + batlasti + bati + batiT  Emax
  delay time of task i : d e l a y i M a x ( E n d _ t i m e l a s t + t i m e l a s t i b i , 0 )
   Add   f i t n e s s to taskv, update the cumulative energy consumption of AGV v ,   f i t n e s s + = emission cost of last task to task i +delay cost of task i +emission cost of task i
 Else If changedk ==false
  taskv add task t which satisf E n d _ t i m e l a s t + t i m e l a s t T b t 0 (If there is no swapping task that meets the conditions, it is considered that the chromosome is infeasible and the decoding algorithm is exited). Update the cumulative energy consumption of AGV v to 0, swapping state list: c h a n g e d k t r u e the delay time of task i : d e l a y i M a x ( E n d _ t i m e l a s t + t i m e l a s t T + c T + t i m e T i b i , 0 ) .
  Add fitness to taskv, update the cumulative energy consumption of AGV v , f i t n e s s + = delay cost of task i +emission cost of task i +emission cost of last task to BSS+ emission cost of BSS to task i
 Else
  The AGV requires a battery swapping to continue the task, but the battery has already been swapped, which means this chromosome is infeasible and the algorithm is exited.
 Let  α i k 1 , β l a s t i k 1
Output  α i k ,   β i j k , f i t n e s s

4.2. Standard Genetic Algorithm

This section describes the basic steps of a standard GA, including initial solution generation, crossover and mutation operation, and fitness calculation.

4.2.1. Initial Solution Generation

The algorithm randomly generates n chromosome encoding vectors constituting the initial chromosome population. For each chromosome, the availability of battery-swapping tasks of each AGV operation is determined. If the chromosome is determined to be infeasible, it is generated again randomly.

4.2.2. Fitness Function

Since the solution objective of the proposed model is to minimize CO2 emission and delay costs, the inverse of the objective function is chosen as the fitness function in the GA. The calculation is shown in Equation (41), where f ( x ) represents the objective function value of the model as
f i t n e s s = 1 f ( x )

4.2.3. Crossover Operator

Chromosomes are encoded using multiple gene points, and a single-point crossover strategy is adopted. A portion of the genes of two parent chromosomes is exchanged to create two offspring chromosomes. The crossover operation is performed to ensure the diversity of transportation task plans for AGVs, thus expanding the search range of task sequences in the solution space. The crossover operation is shown in Algorithm 2.
Algorithm 2. Crossover operation.
Input Parent chromosomes f1 and f2, fk(i) is the value in the ith gene on the chromosome, i { 1 , , | N | }
Output Offspring chromosomes c1 and c2, ck(i) is the value in the ith gene on the chromosome, i { 1 , , | N | }
Step 1
Randomly generates two numbers: s1 and s2, without loss of generality, let s1 s2.
Step 2
Set s1 as the starting point of the crossover operator, s2 as the ending point of the crossover operator, and obtain the gene length for the crossover based on s2–s1.
Step 3
According to the starting point s1 of the crossover operator, exchange the genes with length s2s1 for the parent chromosomes f1 and f2 to obtain the offspring chromosomes c1 and c2, let c1(i) f2(i), i { 1 , , | N | } , c2(i) f1(i), i { 1 , , | N | }
Step 4
Obtain offspring chromosomes

4.2.4. Mutation Operator

The mutation operator randomly changes some genes in the chromosome, resulting in a diverse population of chromosomes in the algorithm. This avoids falling into local optima in the solution space and allows the algorithm to optimize with good searchability. In this paper, a two-point mutation strategy is thus carried out according to the process shown in Algorithm 3, which results in new offspring chromosomes.
Algorithm 3. Mutation operation.
Input Parent chromosomes f, f(i) is the value in the ith gene on the chromosome, i { 1 , , | N | }
Output Offspring chromosomes c, c(i) is the value in the ith gene on the chromosome, i { 1 , , | N | }
Step 1
Randomly select two genes as mutation points on parent chromosome f
Step 2
Swap the positions of genes at two mutation points and copy them to the corresponding positions of the offspring chromosome c
Step 3
Copy all gene on the parent chromosome f except for mutation points to the corresponding positions on the offspring chromosome c, ensuring that the gene sequence is consistent with that on the f.

4.2.5. Termination Condition

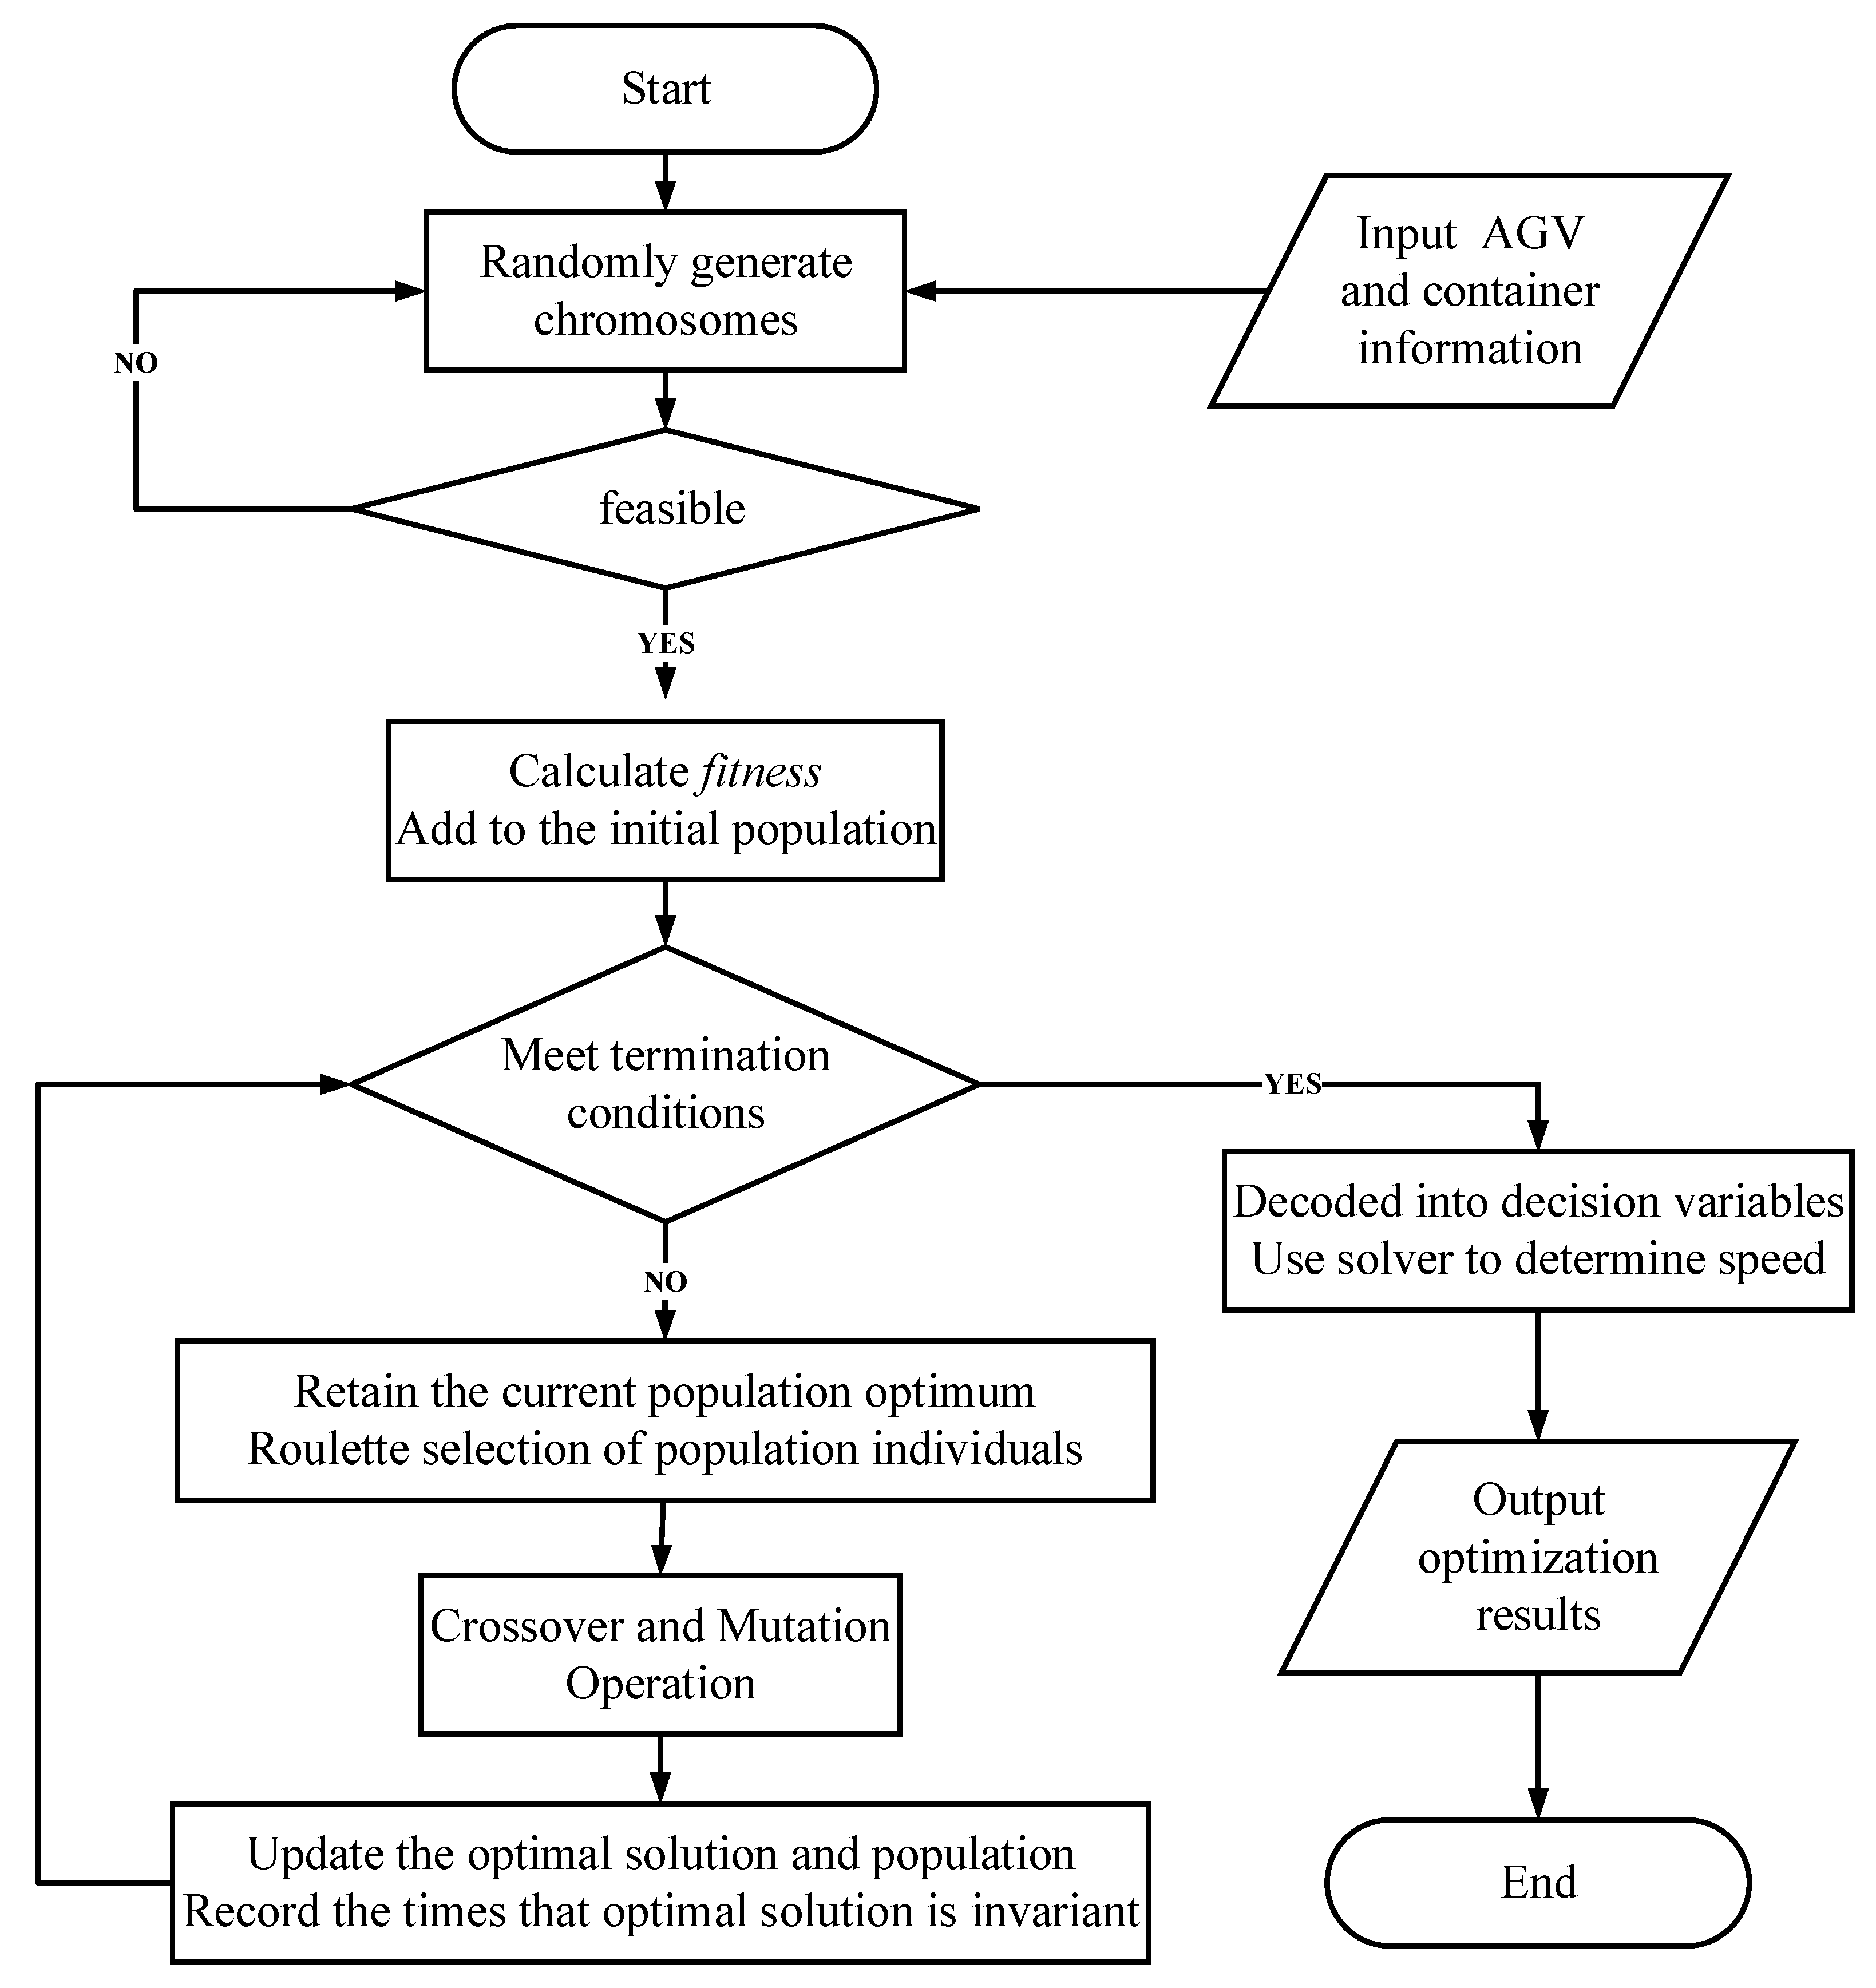
The GA termination conditions are: (1) when the optimal fitness value has not changed for 20 consecutive iterations or (2) when the maximum number of iterations has been reached.
The flowchart of the standard GA is shown in Figure 5.

4.3. Improved Genetic Algorithm

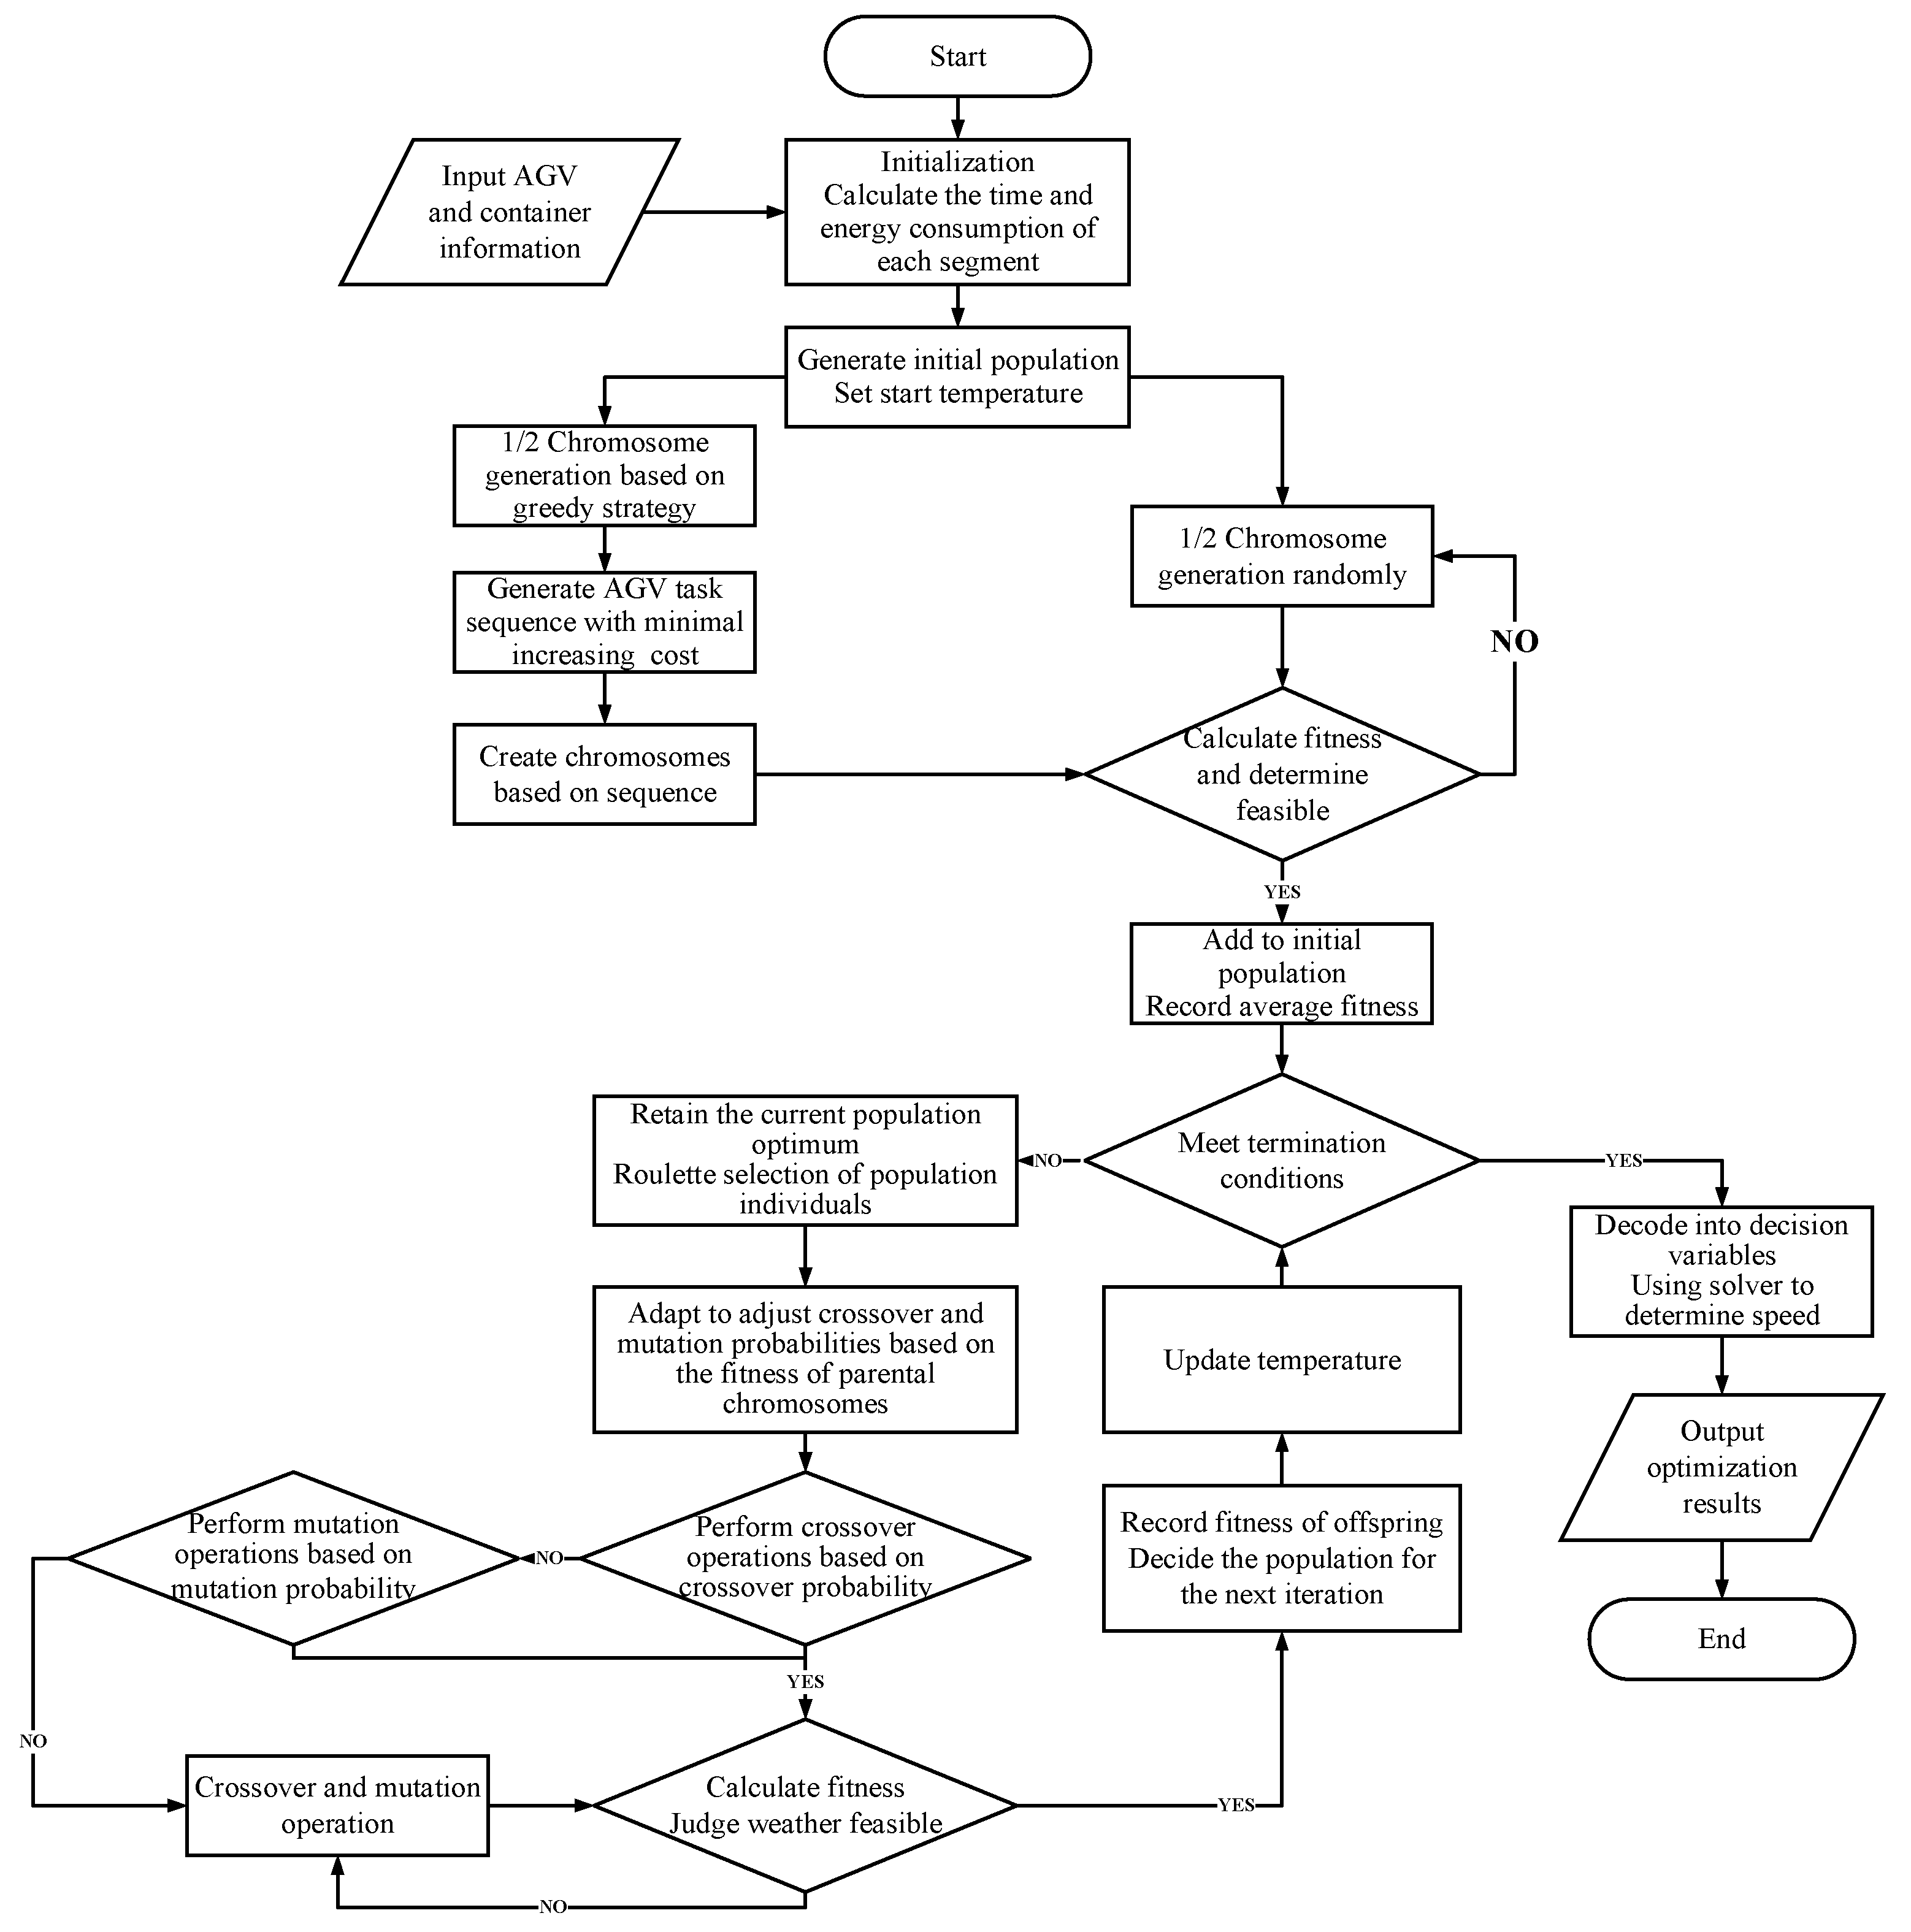
In order to improve the solution efficiency of GA, in this paper, some improvements are introduced to the algorithm. These are the generation of initial solutions using a greedy strategy, the selection of populations based on SA, and adaptive crossover and mutation probability. The flowchart of the improvement methodology in the proposed solution approach is shown in Figure 6.

4.3.1. Greedy Strategy-Based Initial Solution Generation

Because of the significant impact of randomly generated initial solutions on the results of the GA, in some cases, the algorithm converges after several tens of iterations, while in others, the optimal solution was not reached even when the maximum number of iterations had been performed. Therefore, it was necessary to generate initial solutions with high fitness to accelerate convergence. In this paper, an initial solution generation method based on a greedy strategy is introduced and used to generate half of the initial population.
The difference between the chromosomes generated using the greedy strategy lies in the different order of traversing AGVs when assigning container tasks and the different first tasks assigned to them. There are significant changes in subsequent task sequences due to the different initial energy levels of the AGV. When assigning container tasks, priority should be given to AGVs that can minimize the added costs of operations, which include the CO2 emission and delay costs generated during the no-load transitions between the previous task and the ensuing container task. On the basis of the relationship between the remaining energy of the AGV and the charging threshold, a battery-swapping task should be inserted to ensure the feasibility of AGV operations. The flowchart of the algorithm is shown in Figure 7.

4.3.2. Simulated Annealing-Based Population Selection

Because of the search process randomness of GA, it is impossible to guarantee that the crossover and mutation operations during each iteration will lead the population to search in a more optimal direction. Therefore, in this paper, the GA is improved by introducing the temperature acceptance criteria of SA. After the offspring population has been obtained, a potentially poor population may be used as a new parent for iteration based on the current annealing temperature through the difference between the offspring’s average fitness and that of the parent population. The process of the algorithm is as follows:
  • After generating the initial population using GA, the current temperature is set as T c u r = T 0 , where, T 0 is the preset starting temperature;
  • The fitness of each population is calculated, the average fitness of the current population is recorded as a v g ( f i t n e s s c u r ) and the average fitness of the offspring population is recorded as a v g ( f i t n e s s n e w ) ;
  • Based on the average fitness of two population generations, the Metropolis acceptance criterion (as shown in Equation (42)) is used to determine whether the original population will be used as the current population for selecting parents in the next iteration:
    Acceptance = 1 , a v g   f i t n e s s c u r < a v g   f i t n e s s n e w exp ( ( a v g   f i t n e s s c u r a v g   f i t n e s s n e w ) / T c u r ) , a v g   f i t n e s s c u r a v g   f i t n e s s n e w
    When the average fitness of the offspring is higher than that of the current population, the offspring is directly accepted as the new current population. At high annealing temperatures, it is easier to accept new populations with larger fitness differences, while at low annealing temperatures, only new populations with smaller fitness differences will be accepted;
  • The temperature current after one iteration is updated as T c u r = T c u r r a t e c o o l , where r a t e c o o l represents the cooling coefficient.

4.3.3. Adaptive Crossover and Mutation Probability Design

The mutation and crossover probabilities P v and P c will directly affect the GA solution results. Therefore, in this section, an adaptive strategy is introduced to ensure the convergence of the algorithm, which automatically changes P v and P c depending on the fitness value.
The maximum and average fitness values of the population are represented as g max and g a , respectively; the larger fitness value of two chromosomes that need to cross is represented as g m , and the fitness value of the chromosome that needs to mutate is represented as g v . The constant is represented as n ( n [ 0 , 1 ] ), and the four constants are represented as n 1 , n 2 , n 3 , n 4 , respectively. P v and P c will be adjusted according to Equations (43) and (44).
P v = n 1 ( g max g v ) g max g a , g v g a n 2 , g v < g a
P c = n 3 ( g max g m ) g max g a , g m g a n 4 , g m < g a
Although traditional adaptive genetic strategies can obtain and retain relatively optimal solutions effectively and can find global optimal solutions by changing fitness values around local optimal solutions, the results of these methods in the early stages of evolution may not be ideal. In the early stages, the probability of obtaining a relatively optimal solution is minimal, resulting in the optimal solution remaining approximately unchanged. As a result, when entering the later stages, the evolution results are prone to falling into local optima, ultimately slowing down the search speed of the GA and even causing the search to halt.
An improved adaptive strategy is proposed by introducing three weighted parameter probability values P v ( c ) max , P v ( c ) mid , P v ( c ) min . These place certain constraints between different fitness values and continuously adjust the crossover and mutation probabilities according to the evolution of the population. In the early evolutionary stages, by adjusting the parameter operations, the probability values of crossover and mutation are increased, thereby improving the global search ability, avoiding premature convergence to local optima, and ensuring individual diversity in the chromosome population. In the later stages, the fitness value of individual chromosomes is relatively high. At this time, if the search strategy of the algorithm is relatively random, this could lead to a convergence speed that is too slow. In order to improve the speed of convergence, the crossover and mutation probability can be reduced by adjusting the weighted parameter values. The improved adaptive crossover and mutation probabilities are adjusted as shown in Equations (45) and (46)
P v = P v min + ( P v mid P v min ) ( g max g v ) g a g max , g v g a P v max ( P v max P v mid ) ( g v g max ) g a g min , g v < g a
P c = P c min + ( P c mid P c min ) ( g max g v ) g max g a , g v g a P c max ( P c max P c mid ) ( g v g min ) g a g min , g v < g a
The maximum and minimum values of the crossover and mutation probabilities are represented as P c max and P c min , and P v max and P v min , respectively, while P v ( c ) mid is the median of P v ( c ) min and P v ( c ) max .

4.3.4. Proposed Solution Method

The flowchart of the proposed solution approach is shown in Figure 8. Half of the chromosomes in the initial population are generated using the greedy strategy, and the crossover and mutation probabilities are adjusted adaptively on the basis of the fitness of the parental chromosomes. In addition, the SA is integrated into the GA to enhance the latter’s global search ability.

5. Numerical Experiments

This section presents a series of experiments to verify the effectiveness and efficiency of the proposed MIP model and solution method. The proposed mathematical model was implemented and solved using the popular commercial solver GUROBI. The proposed solution method was implemented in C#, and the model was solved using GUROBI 10.0. All experiments were conducted on a computer with a 3.80 GHz CPU and 64 GB RAM.

5.1. Parameter Settings

The planning horizon in this paper is one hour, and the QC and YC operation time and sequence of each container are assumed to have been determined at a higher level of planning, which is beyond the scope of this paper. The processing time of the QC and the YC follow a uniform distribution of U (40, 200) s, and the initial cumulative power consumption of the AGVs follows a uniform distribution of U (0, 100) kw/h.
The length of the shoreline was assumed to be 2350 m, and the width of the horizontal transportation area was set to 120 m. The battery-swapping station was assumed to be equipped with three swapping robots, and the AGV stay time at the battery-swapping station was set to 5 min. The maximum speed of the AGVs was set to 6 m/s, which led to a discrete set of velocities R = { 1 , 2 , 3 , 4 , 5 , 6 } . Considering the environmental traffic limitations in different areas of the yard, the maximum speed in different segments was set as u i j l = { 5 , 6 , 5 } when the AGVs were in a no-load state, and the maximum speeds in different segments were set as u ¯ i l = { 3 , 4 , 3 } when the AGVs were loaded. The settings of the other parameters are shown in Table 2.
The feasibility and effectiveness of the model and algorithm were verified in small, medium, and large-scale cases. Detailed information on all cases is shown in Table 3.

5.2. Numerical Experiment Results

5.2.1. Analysis of Results for Different Scale Cases

This section presents the results of numerical experiments to evaluate the effectiveness of the proposed model and solution approach. The results of the standard GA, a GA based on SA (SAGA), an adaptive genetic algorithm based on SA (SAAGA), a greedy algorithm (Greedy), and the proposed GSAAGA were compared with the results of the GUROBI solver. Because of the randomness of the heuristic algorithms (HAs), each case was run 10 times, and the average values are reported as the results. The numerical experimental results of all cases are shown in Table 4.
Because of the complexity of the problem, GUROBI could only solve the small-scale cases within the specified time. For those, GUROBI obtained the optimal solution in most cases, and the GAP (defined as GAP (%) = (OBJheuristics − OBJ)/OBJ ⋅ 100%) between the HA-based solution methods and the optimal solution was 0, verifying the effectiveness of the HA-based solution methods. In addition, all HA-based solution methods obtained the optimal solution within about 1 s on average, while GUROBI’s solution time was, on average, more than 30 times slower.
It is worth noting that for cases S3 and S5, GUROBI could not find the optimal solution within the specified time, while the GAP between the solution obtained using the HA-based method and the approximate solution was about 15% and 45%, respectively, further verifying the effectiveness of the HA-based solution methods. In addition, although the greedy algorithm-based methods could obtain a solution in a short time, the quality of the solution was not guaranteed because of the limited number of iterations allowed. In cases S5 and S6, the greedy algorithm-based methods obtained the worst solution.

5.2.2. Comparison of Algorithm Convergence

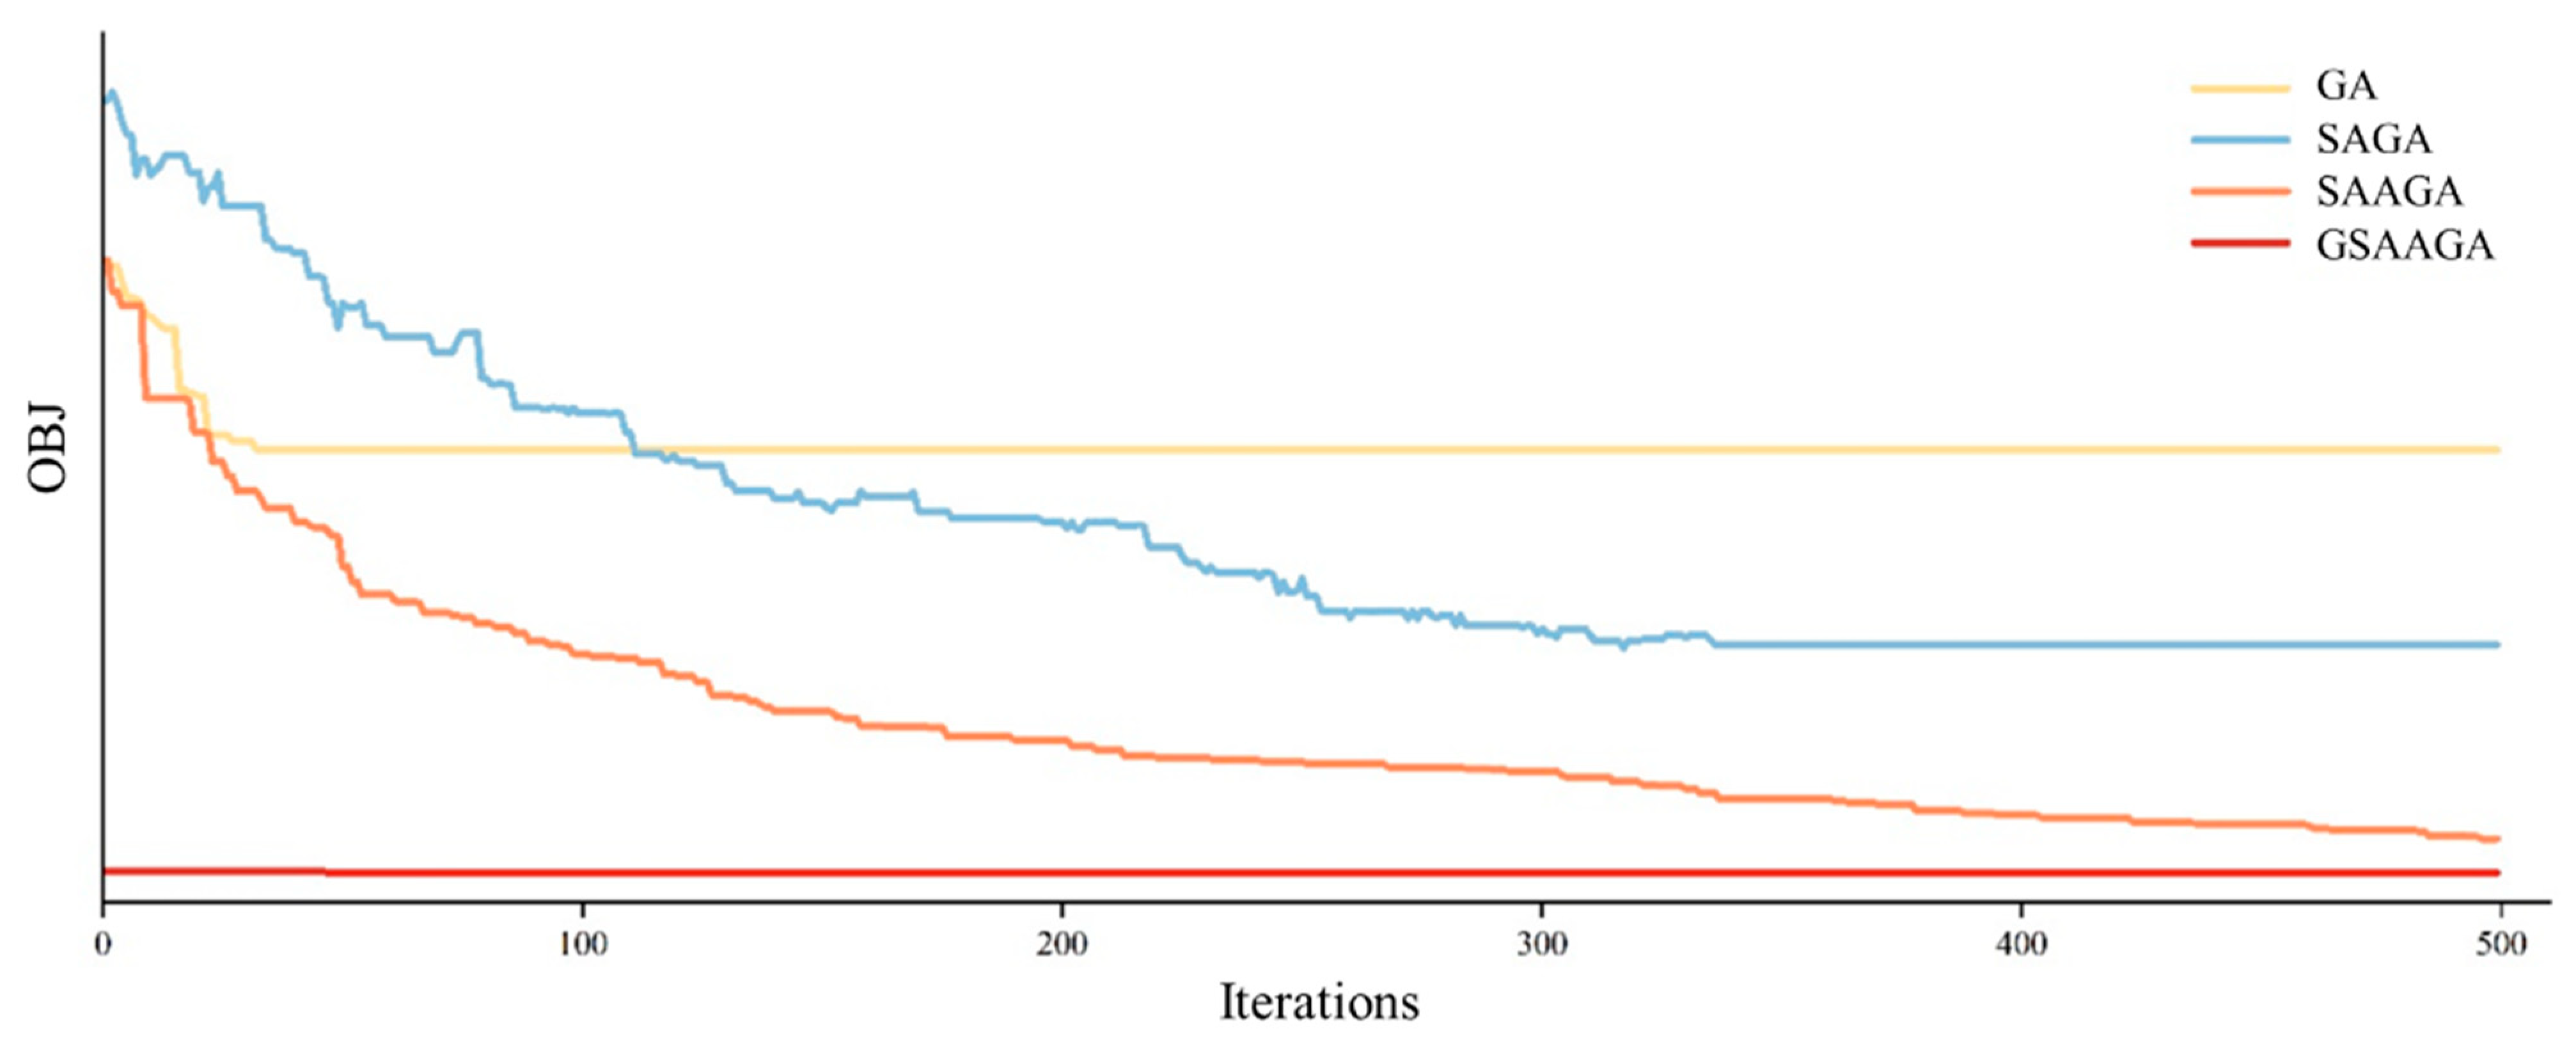
To further demonstrate the advantages of the solution approach proposed in this paper, the convergence of GA, SAGA, SAAGA, and GSAAGA in solving case L7 is shown in Figure 9. The population of the algorithm was set to 50, and the number of iterations was 500. The termination criterion was the absence of improvement in 20 generations. It can be seen from Figure 9 that the GA was easily trapped in local optima, and the population selection strategy based on SA helped the algorithm overcome these local optima effectively. The rate of convergence of SAAGA was faster than that of SAGA; that is, the adaptive crossover and mutation probabilities accelerated the rate of convergence of the algorithm. It is worth noting that half of the initial population in GAASGA adopts the greedy algorithm, which has a good initial solution from the beginning, allowing for a significant improvement in the quality of the solution.

5.2.3. Scheduling Scheme

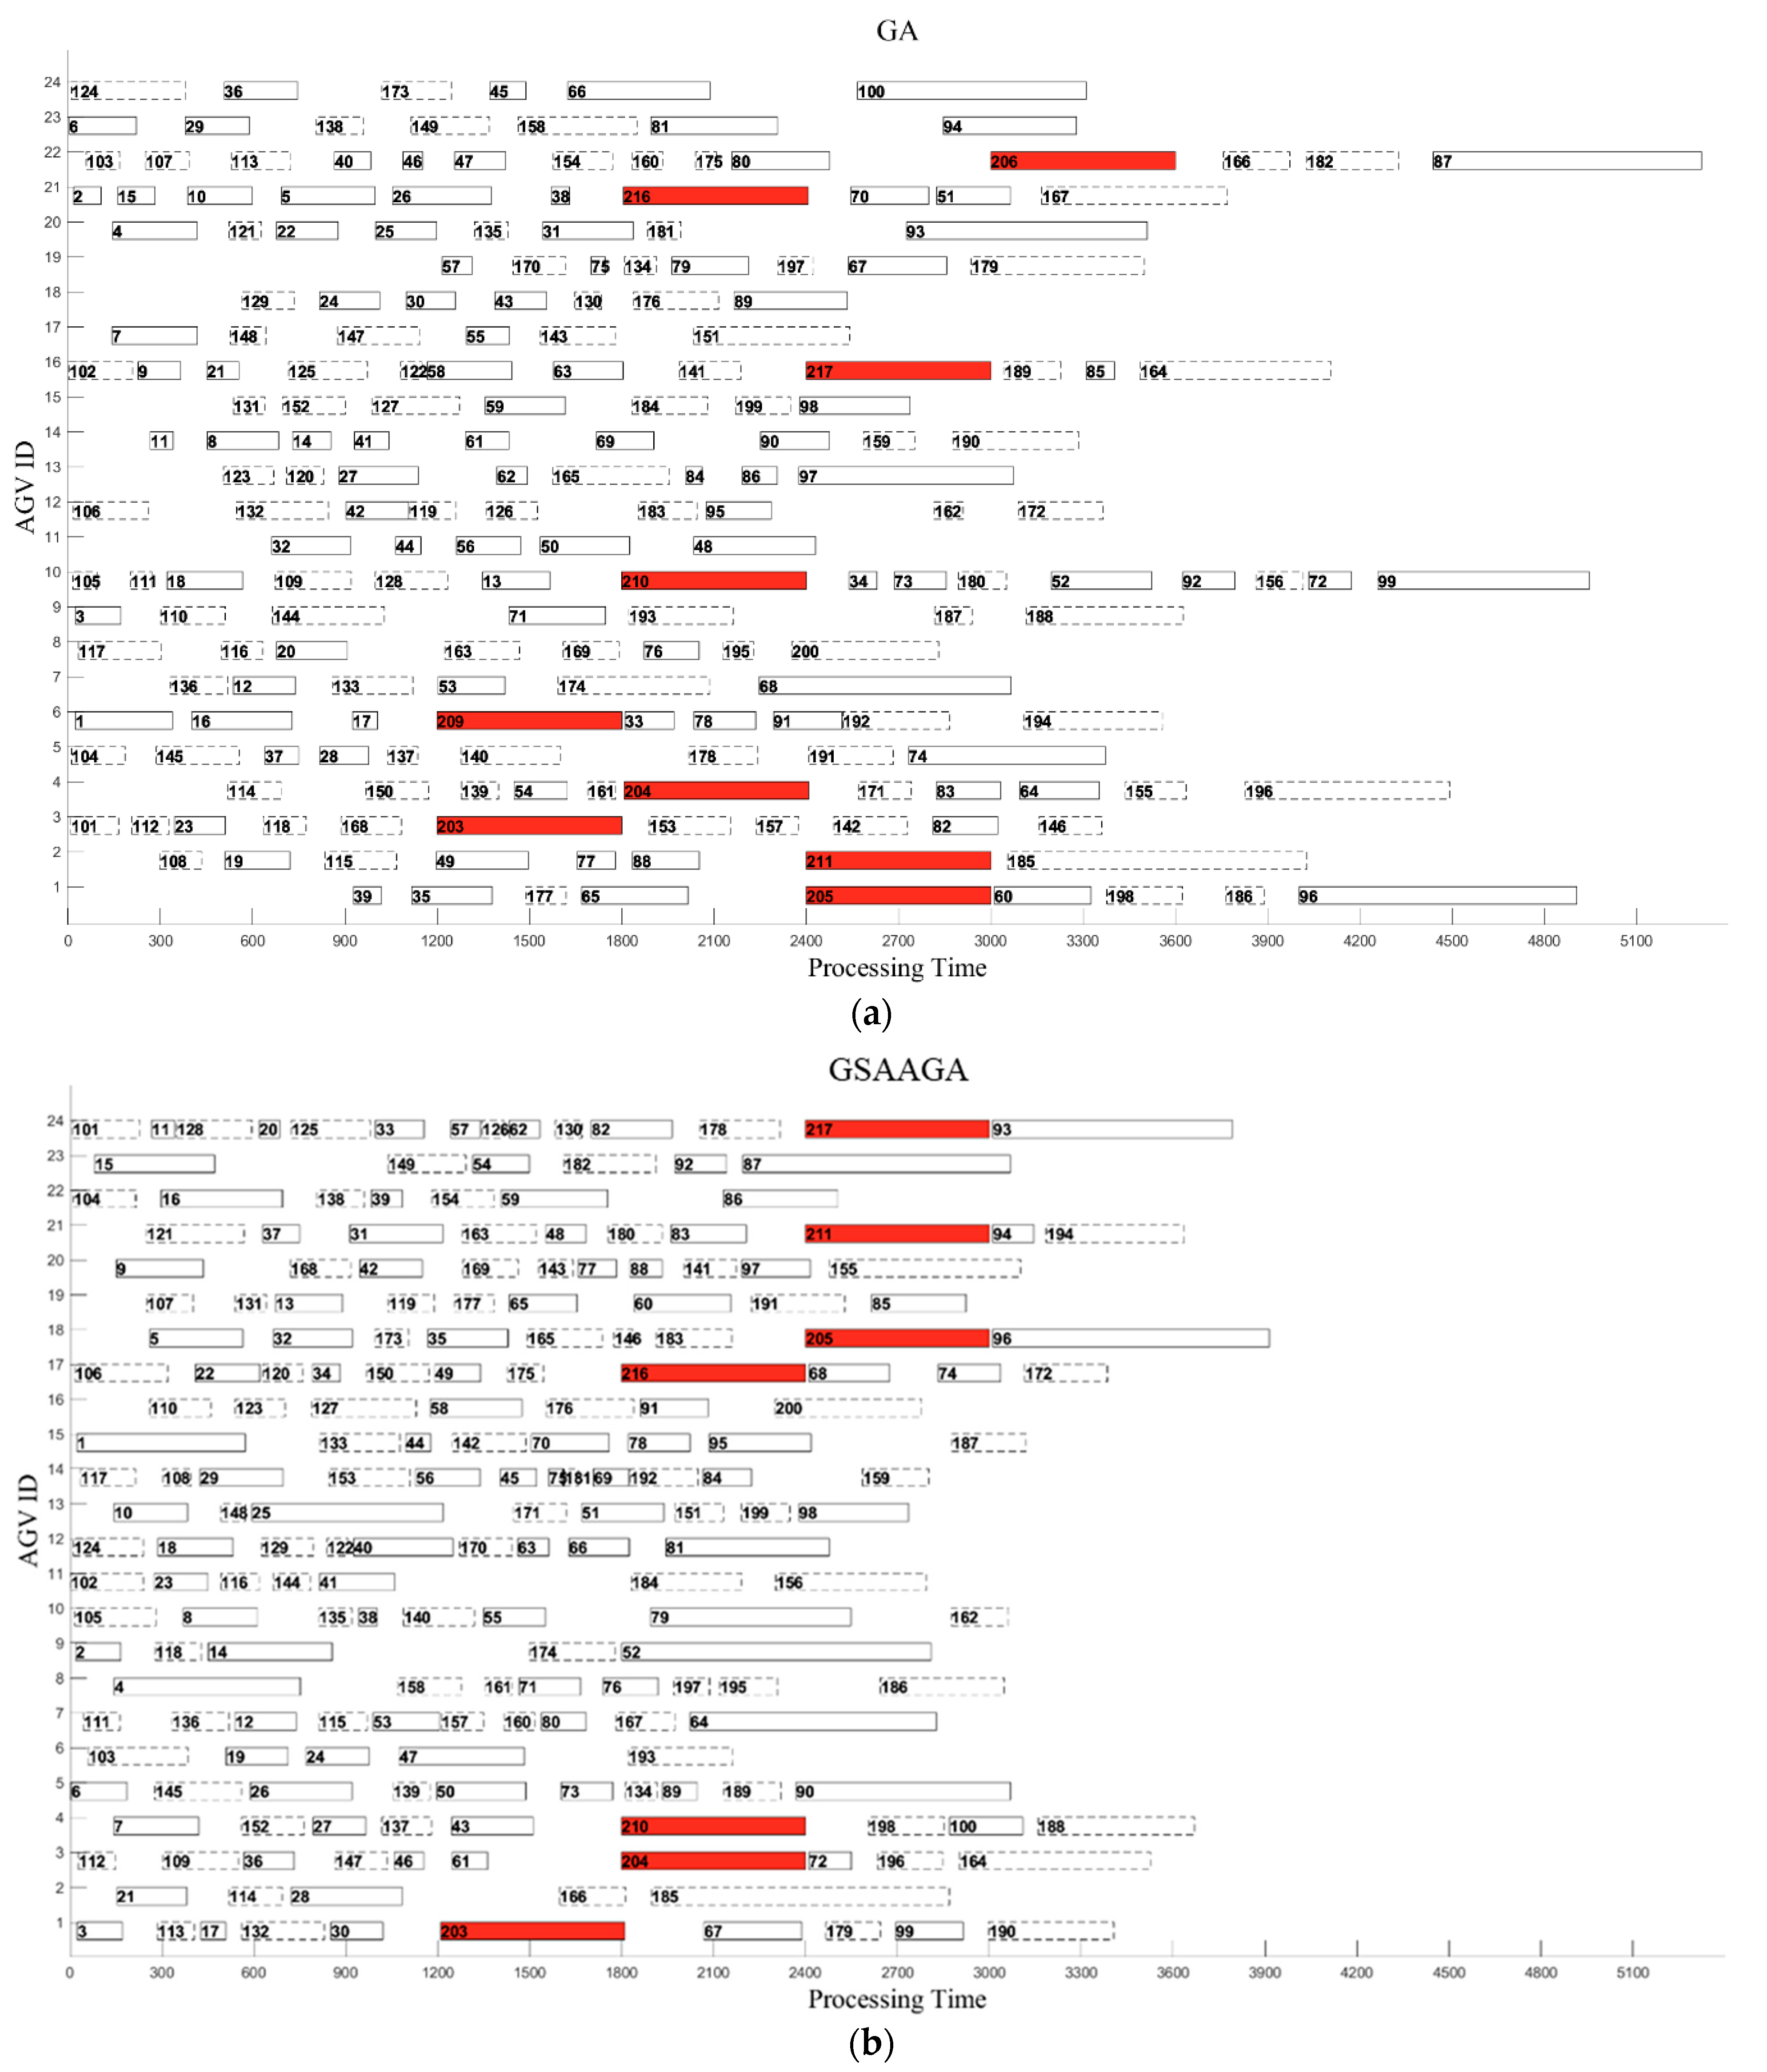
The scheduling results of the L7 large-scale case are shown in Figure 10. This case included 200 container tasks and 24 AGVs. The rectangles in the figure represent container and battery-swapping tasks for the AGVs. Solid rectangles represent inbound container tasks, dashed rectangles represent outbound container tasks, and red rectangles represent the battery-swapping tasks. The width of each rectangle represents the duration of the task, and the number in the rectangle represents the task number.
The scheduling scheme of the GA-based solution approach is shown in Figure 10a, while the scheduling scheme of GSAAGA is shown in Figure 10b. It can be seen that in the scheduling plan obtained using the GA-based solution approach, 9 AGVs had their batteries swapped, while in the case of GSAAGA, only 7 AGVs required battery swapping, which resulted in reduced cost of CO2 emission generated through idle movement. It is worth noting that the GSAAGA-based solution approach resulted in the faster completion of container tasks and the effective reduction in the delay cost.

5.3. Sensitivity Analysis

This section presents a sensitivity analysis conducted using different numbers of AGVs and battery-swapping station capacities to analyze these parameters’ impact on scheduling results, CO2 emission cost, and delay costs.

5.3.1. Sensitivity Analysis on the Number of Automated Guided Vehicles

In order to observe the impact of the number of AGVs on CO2 emission cost and delay costs, a sensitivity analysis was conducted for ACT configurations with different numbers of AGVs. The number of container tasks was set to 20, 80, and 160, and the number of AGVs varied from 2 to 21. The specific settings and experimental results are shown in Table 5.
In order to demonstrate the impact of the number of AGVs on cost, for this experiment, Constraint (6) was relaxed, so not all AGVs were required to complete the tasks. Constraint (6) in the original model was replaced with Constraint (47)
i I β 0 i k 1 k K
The experimental results indicate that energy consumption decreased as the number of AGVs increased. This is because an increase in the number of AGVs will lower the average number of tasks performed by each AGV, reducing the demand that AGVs return to the battery-swapping stations for energy recovery, thereby reducing the overall CO2 emission cost of the operation. In addition, when the number of container tasks is small, adding AGVs can bring more significant cost reductions. As the scale of container tasks expands, the cost improvement brought about through an increased investment in AGVs will gradually decrease.

5.3.2. Sensitivity Analysis on the Capacity of Battery-Swapping Stations

In this section, a sensitivity analysis is presented on the handling capacity of the battery-swapping stations, which was conducted by changing the number of swapping robots. The number of container tasks was set to 160, and three scenarios with different AGV numbers were considered, while the number of battery-swapping robots ranged from 1 to 5. The specific settings and experimental results are shown in Table 6.
When the handling capacity of the battery-swapping station was low, some tasks could not be completed, resulting in the inability to honor the schedule. The experimental results indicate that when the handling capacity of the battery-swapping station is low, the total costs will gradually decrease as the number of battery-swapping robots increases because AGVs that require battery swapping have more options. In contrast, when the handling capacity of the battery-swapping stations is already sufficient, the overall cost reduction will decrease as the number of robots further increases. At that point, AGVs do not require additional swapping tasks. In addition, when the number of AGVs has already met the operational requirements of the container tasks, meaning there are no delay costs, a further increase in the number of robots will not result in a cost reduction. It is worth noting that increasing the number of robots leads to a significant improvement in delay costs, while its impact on CO2 emission is relatively small.

5.3.3. Sensitivity Analysis on Speed Variability

To reflect the impact of speed on carbon emission costs, sensitivity analysis was conducted by changing the deriving speed of AGVs. Considering that the fixed driving speeds of AGV were 3, 4, 5, and 6, respectively, and the number of container tasks was set to 20, 80, and 160, the various costs were compared between fixed speed and variable speed strategies. The specific settings and experimental results are shown in Table 7.
It can be seen that compared with the fixed speed strategy, the variable speed has a greater impact on the calculation results. There is a 43.31% difference in the calculation results in small-scale cases, and this difference gradually increases as the scale of the cases increases. Therefore, considering the speed variability significantly impacts the calculation of carbon emissions and time for AGV operations.
In most cases, compared with a fixed speed, the total cost of variable speed was greater. However, the increase in total costs and the decrease in carbon emission costs were not necessarily related. Indeed, an increase in total costs did not necessarily mean an increase in carbon emission costs. The total cost included carbon emission and delay costs, which were conflicting, with the latter playing a more important role in reducing the total cost. In addition, considering the traffic conditions of different driving environments in the actual operation of the terminal, the variable speed could more accurately depict the carbon emissions and B-AGV operation time.

5.4. Discussion

In terms of solving efficiency, comparing different solution methods shows that the greedy strategy has advantages in generating initial solutions but also has limitations as it is very unstable in solving results. In addition, the SA strategy and adaptive cross-mutation strategy can effectively address the drawbacks of GA being prone to local optima and slow convergence speed [20]. Therefore, compared with the standard GA-based method, the proposed method has significantly better solution and scheduling results. This means reducing the carbon emissions of AGVs while reducing task delays.
Moreover, as an important factor affecting the completion time and energy consumption of AGV tasks, speed has a significant impact on the actual operation of AGV. The experimental results also demonstrate the importance of variable speed considering the actual production environment of the terminal, which will more accurately depict the actual operation process of AGV.
In addition, to reduce the delay and carbon emission costs of AGVs in the actual operation of the terminal, terminal operators could increase the number of AGVs used while also increasing the difficulty of system scheduling. In addition, further improvements can be made to the infrastructure of the terminal, thereby enhancing its battery-swapping capacity.

6. Conclusions

In this paper, ACTs with limited charging capacity are analyzed using a model that considers a discrete handling capacity of battery-swapping stations. To reduce the CO2 emission cost of horizontal transportation, an AGV scheduling plan based on speed control is proposed. In addition, an MIP model considering the charging demand and speed control is established to ensure that AGVs complete their tasks while the CO2 emissions generated by transportation are minimized.
Because of the complexity of the problem, an improved GA-based solution approach is proposed to solve the established model effectively. The feasibility and effectiveness of the model and algorithm are verified through a series of numerical experiments. A greedy strategy is adopted to obtain a better initial solution for the algorithm in solving large-scale cases, while adaptive and SA strategies are used to improve the quality of the solution in small-scale and medium-scale cases.
At the same time, the impact of the number of AGVs and the handling capacity of battery-swapping stations on CO2 emission cost and delay costs are analyzed. The experimental results indicate that although an increase in the number of AGVs can lead to reduced CO2 emission cost and delay costs, this improvement will be less pronounced once the number of AGVs exceeds a certain point. Therefore, a reasonable number of AGVs can reduce CO2 emission and delay costs effectively.
Moreover, the number of battery-swapping robots also has a significant impact on CO2 emission cost and delay costs. A shortage of battery-swapping robots can lead to the inability to complete tasks, while more swapping robots can help reduce CO2 emission costs and delay costs during AGV operations. Therefore, equipping a reasonable number of battery-swapping robots can ensure the smooth operation of the terminal.
With respect to the charging demand and speed control, the AGV scheduling model established in this paper applies not only to newly constructed automated terminals but also to traditional terminals undergoing automation upgrades. The research results not only expand the theoretical research on port resource scheduling but also provide terminal managers with references for decision making and the operation of green ports.
This paper only focuses on the short-term scheduling problem of AGV. In the future, scholars can further consider the conflict and congestion issues during AGV operation. In addition, with continuous equipment upgrading, different energy recovery methods have emerged at container terminals [15]. In addition to the widely used overall battery-swapping method, they also include plug-in charging methods. Researchers can further consider the AGV scheduling problem of combining different charging methods.
Author Contributions

Conceptualization, H.H.; Methodology, X.Y.; Software, C.C.; Formal analysis, C.C. and Y.W.; Investigation, X.Y.; Writing—original draft, X.Y.; Visualization, Y.W.; Funding acquisition, H.H. All authors have read and agreed to the published version of the manuscript.

Funding

This research was supported by the National Natural Science Foundation of China [grant numbers 72271156, 71771143]; the Shanghai Shuguang Scholar Project, China [grant number 20SG46]; the Shanghai Frontiers Science Center of “Full penetration” far-reaching offshore Ocean energy and power, China; the Container Supply Chain Technology Engineering Research Center of the Ministry of Education, China.

Conflicts of Interest

The authors declare no conflict of interest.

Nomenclature

Indices
i, jnode indices
kAGV index
lsegment index
Sets
Athe set of container task nodes; 1 , 2 , 3 , , A A
0dummy node
A0 A 0 = A 0
Tthe set of available battery-swapping task nodes,  { A + 1 , A + 2 , A + 3 , , A + T } T
Ithe set of all nodes, including container task nodes and battery-swapping nodes;  { 1 , 2 , 3 , , A , , A + T } I ,   I = A T
I0 I 0 = I 0
Kthe set of AGVs;  1 , 2 , 3 , , K K
L i j the set of segments on arc (i, j)
L ¯ i the set of segments in node i
Parameters
d i j l the distance of segment l in arc (i, j),  l L i j
d ¯ i l the distance of segment l in node i. l L i
u i j l the maximum travel speed in segment l l L i j
u ¯ i l the maximum travel speed in segment l l L i
a i the earliest start time of node i
b i the latest start time of node i
c i the processing time of battery-swapping node i i T
E max the battery-swapping threshold
η 0 k the initial cumulative battery consumption of AGV k
qthe coefficient of energy consumption, q = e f f d e f f m β
f c the AGV CO2 emission cost
f e AGV CO2 emission coefficient, f e = e f f d e f f m β e f f p r
f p the delay penalty
M a large positive integer
Decision variables
α i k binary variable  α i k = 1 , if node i is assigned to AGV k; otherwise  α i k = 0
β i j k binary variable  β i j k = 1 , if node i is consecutively processed by AGV k before node j; otherwise  β i j k = 0
η i k cumulative energy consumption of AGV k during the completion of task node i
ρ i k the starting time of AGV k to process node i
μ i the delay time during the processing of node i
δ i j l k the travel speed of AGV k on segment l, l L i j
δ ¯ i l k the travel speed of AGV k on segment l, l L i

References

  1. Grunow, M.; Günther, H.O.; Lehmann, M. Dispatching multi-load AGVs in highly automated seaport container terminals. In Container Terminals and Automated Transport Systems; Günther, H.O., Kim, K.H., Eds.; Springer: Berlin/Heidelberg, Germany, 2005. [Google Scholar]
  2. Yang, Y.; Zhong, M.; Dessouky, Y.; Postolache, O. An Integrated Scheduling Method for AGV Routing in Automated Container Terminals. Comput. Ind. Eng. 2018, 126, 482–493. [Google Scholar] [CrossRef]
  3. Zhong, M.; Yang, Y.; Dessouky, Y.; Postolache, O. Multi-AGV scheduling for conflict-free path planning in automated container terminals. Comput. Ind. Eng. 2020, 142, 106371. [Google Scholar] [CrossRef]
  4. Wang, Z.; Zeng, Q. A branch-and-bound approach for AGV dispatching and routing problems in automated container terminals. Comput. Ind. Eng. 2022, 166, 107968. [Google Scholar] [CrossRef]
  5. Duan, Y.; Ren, H.; Xu, F.; Yang, X.; Meng, Y. Bi-Objective Integrated Scheduling of Quay Cranes and Automated Guided Vehicles. J. Mar. Sci. Eng. 2023, 11, 1492. [Google Scholar] [CrossRef]
  6. Sun, P.Z.H.; You, J.P.; Qiu, S.Q.; Wu, E.Q.; Xiong, P.W.; Song, A.G.; Zhang, H.Z.; Lu, T. AGV-based vehicle transportation in automated container terminals: A survey. IEEE Trans. Intell. Transp. Syst. 2023, 24, 341–356. [Google Scholar] [CrossRef]
  7. Grunow, M.; Günther, H.O.; Lehmann, M. Strategies for dispatching AGVs at automated seaport container terminals. OR Spectr. 2007, 28, 587–610. [Google Scholar] [CrossRef]
  8. Yang, Y.; He, S.; Sun, S. Research on the Cooperative Scheduling of ARMGs and AGVs in a Sea–Rail Automated Container Terminal under the Rail-in-Port Model. J. Mar. Sci. Eng. 2023, 11, 557. [Google Scholar] [CrossRef]
  9. Hu, H.; Yang, X.; Xiao, S.; Wang, F. Anti-conflict AGV path planning in automated container terminals based on multi-agent reinforcement learning. Int. J. Prod. Res. 2023, 61, 65–80. [Google Scholar] [CrossRef]
  10. Dotoli, M.; Epicoco, N.; Falagario, M.; Cavone, G. A timed Petri nets model for intermodal freight transport terminals. IFAC Proc. Vol. 2014, 47, 176–181. [Google Scholar] [CrossRef]
  11. Cavone, G.; Dotoli, M.; Seatzu, C. Management of intermodal freight terminals by first-order hybrid Petri nets. IEEE Robot. Autom. Lett. 2016, 1, 2–9. [Google Scholar] [CrossRef]
  12. Cavone, G.; Dotoli, M.; Seatzu, C. Resource planning of intermodal terminals using timed Petri nets. In Proceedings of the 2016 13th International Workshop on Discrete Event Systems, Xi’an, China, 30 May–1 June 2016; pp. 44–50. [Google Scholar]
  13. Iris, Ç.; Christensen, J.; Pacino, D.; Ropke, S. Flexible ship loading problem with transfer vehicle assignment and scheduling. Transp. Res. Part B Methodol. 2018, 111, 113–134. [Google Scholar] [CrossRef]
  14. Iris, Ç.; Lam, J.S.L. A review of energy efficiency in ports: Operational strategies, technologies and energy management systems. Renew. Sustain. Energy Rev. 2019, 112, 170–182. [Google Scholar] [CrossRef]
  15. Zhou, C.; Zhu, S.; Bell, M.G.; Lee, L.H.; Chew, E.P. Emerging technology and management research in the container terminals: Trends and the COVID-19 pandemic impacts. Ocean. Coast. Manag. 2022, 230, 106318. [Google Scholar] [CrossRef] [PubMed]
  16. Schmidt, J.; Meyer-Barlag, C.; Eisel, M.; Kolbe, L.M.; Appelrath, H.J. Using battery-electric AGVs in container terminals-Assessing the potential and optimizing the economic viability. Res. Transp. Bus. Manag. 2015, 17, 99–111. [Google Scholar] [CrossRef]
  17. Ma, N.; Zhou, C.; Stephen, A. Simulation model and performance evaluation of battery-powered AGV systems in automated container terminals. Simul. Model. Pract. Theory 2020, 106, 102146. [Google Scholar] [CrossRef]
  18. Xiang, X.; Liu, C. Modeling and analysis for an automated container terminal considering battery management. Comput. Ind. Eng. 2021, 156, 107258. [Google Scholar] [CrossRef]
  19. Singh, N.; Dang, Q.V.; Akcay, A.; Adan, I.; Martagan, T. A matheuristic for AGV scheduling with battery constraints. Eur. J. Oper. Res. 2022, 298, 855–873. [Google Scholar] [CrossRef]
  20. Sun, B.; Zhai, G.; Li, S.; Pei, B. Multi-resource collaborative scheduling problem of automated terminal considering the AGV charging effect under COVID-19. Ocean Coast. Manag. 2023, 232, 106422. [Google Scholar] [CrossRef]
  21. Keskin, M.; Laporte, G.; Catay, B. Electric vehicle routing problem with time-dependent waiting times at recharging stations. Comput. Oper. Res. 2019, 107, 77–94. [Google Scholar] [CrossRef]
  22. Hosseini, S.M.; Carli, R.; Cavone, G.; Dotoli, M. Distributed control of electric vehicle fleets considering grid congestion and battery degradation. Internet Technol. Lett. 2020, 3, 161. [Google Scholar] [CrossRef]
  23. Dang, Q.V.; Singh, N.; Adan, I.; Martagan, T.; Sande, D. Scheduling heterogeneous multi-load AGVs with battery constraints. Comput. Oper. Res. 2021, 136, 105517. [Google Scholar] [CrossRef]
  24. Jamshidi, H.; Correia, G.; Essen, T.V.; Nkel, K. Dynamic planning for simultaneous recharging and relocation of shared electric taxies: A sequential MILP approach. Transp. Res. Part C-Emerg. Technol. 2021, 125, 102933. [Google Scholar] [CrossRef]
  25. Li, L.; Li, Y.; Liu, R.; Zhou, Y.; Pan, E. A Two-stage Stochastic Programming for AGV scheduling with random tasks and battery swapping in automated container terminals. Transp. Res. Part E-Logist. Transp. Rev. 2023, 174, 103110. [Google Scholar] [CrossRef]
  26. Lam, E.; Desaulniers, G.; Stuckey, P.J. Branch-and-cut-and-price for the electric vehicle routing problem with time windows, piecewise-linear recharging and capacitated recharging stations. Comput. Oper. Res. 2022, 145, 105870. [Google Scholar] [CrossRef]
  27. Boccia, M.; Masone, A.; Sterle, C.; Murino, T. The parallel AGV scheduling problem with battery constraints: A new formulation and a matheuristic approach. Eur. J. Oper. Res. 2023, 307, 590–603. [Google Scholar] [CrossRef]
  28. Nishi, T.; Matsushita, S.; Hisano, T. A practical model of routing problems for automated guided vehicles with acceleration and deceleration. J. Adv. Mech. Des. Syst. Manuf. 2014, 8, JAMDSM0067. [Google Scholar] [CrossRef]
  29. Adamo, T.; Bekta, T.; Ghiani, G. Path and speed optimization for conflict-free pickup and delivery under time windows. Transp. Sci. 2018, 52, 739–755. [Google Scholar] [CrossRef]
  30. Chen, S.; Wang, H.; Meng, Q. Autonomous truck scheduling for container transshipment between two seaport terminals considering platooning and speed optimization. Transp. Res. Part B-Methodol. 2021, 154, 289–315. [Google Scholar] [CrossRef]
  31. Xing, Z.; Liu, H.T.; Wang, T.S.; Chew, E.P.; Lee, L.H.; Tan, K.C. Integrated automated guided vehicle dispatching and equipment scheduling with speed optimization. Transp. Res. Part E-Logist. Transp. Rev. 2023, 169, 102993. [Google Scholar] [CrossRef]
  32. Zhang, S.; Gajpal, Y.; Appadoo, S.S.; Abdulkader, M.M.S. Electric vehicle routing problem with recharging stations for minimizing energy consumption. Int. J. Prod. Econ. 2018, 203, 404–413. [Google Scholar] [CrossRef]
  33. Nasri, M.I.; Bektas, T.; Laporte, G. Route and speed optimization for autonomous trucks. Comput. Oper. Res. 2018, 100, 89–101. [Google Scholar] [CrossRef]
Figure 1. Automated container terminal (ACT) layout.
Jmse 11 01852 g001
Figure 2. AGV speed variability.
Jmse 11 01852 g002
Figure 3. Solution coding.
Jmse 11 01852 g003
Figure 4. Example of solution decoding.
Jmse 11 01852 g004
Figure 5. Standard GA flowchart.
Jmse 11 01852 g005
Figure 6. The improvement methodology in the proposed solution approach.
Jmse 11 01852 g006
Figure 7. Flowchart of greedy strategy-based initial solution generation.
Jmse 11 01852 g007
Figure 8. Flowchart of the proposed solution approach.
Jmse 11 01852 g008
Figure 9. Comparison of algorithm convergence under different strategies.
Jmse 11 01852 g009
Figure 10. Scheduling results of case M7. (a) Scheduling scheme of GA-based solution approach; (b) Scheduling scheme of GSAAGA-based solution approach.
Jmse 11 01852 g010
Table 1. Literature on automated vehicle scheduling.
LiteratureCharging DemandLimited Charging CapacitySpeedConstraintsModel TypeSolution Approach
Adamo et al. (2018) [29] Time windows-BP
Boccia et al. (2023) [27] Battery capacity; job sequenceMIPHeuristic
Chen et al. (2021) [30] Fuel consumption; time windowsMISOCPHeuristic
Dang et al. (2021) [23] AGV capacity; time windowsMIPALNS
Duan et al. (2021) [5] Job sequence; time windowsMIPMOPSO
Jamshidi et al. (2023) [24] Battery capacityMILPCG
Keskin et al. (2019) [21] Job sequence; time windows; battery capacityMIPALNS
Lam et al. (2022) [26] Number of routes; time windowsMIPBCP
Li et al. (2023) [25] Job sequence; time windows; battery capacitystochastic programming modelS-ACO
Ma et al. (2020) [17] Time windowsSimulation modelCPLEX
Nishi et al. (2014) [28] Vehicle acceleration and decelerationMIPCG
Schmidt et al. (2015) [16] Charging time window-Simulation
Singh et al. (2022) [19] Charging sequence; battery capacity; time windowsMIPALNS
Sun et al. (2023) [20] Battery capacity; job sequence; time WindowsMIPSA-GA
Wang et al. (2022) [4] Job sequence; time windows; path conflictMIPBB
Xiang et al. (2021) [18] Number of AGV; battery capacityqueueing modelApproximation
Xing et al. (2023) [31] Job sequence; time windowsMIPHeuristic
Yang et al. (2018) [2] Job sequence; time windowsMIPCPR-BGA
Yang et al. (2023) [8] Time windows; number of AGVMIPSCGA
Zhong et al. (2020) [3] Job sequence; time windowsMIPHGA-PSO
Iris et al. (2018) [13] Time windowsMIPHeuristic
Cavone et al. (2016b) [12] Time windows-Timed PN
Hosseini et al. (2020) [22] Time windows; battery capacityCQPDWA
Grunow et al. (2006) [7] Time windows-PN
Note: BP—branch and price algorithm; (ALNS)—adaptive large neighborhood search; BCP— branch-and-cut-and-price algorithm; CG—column generation; S-ACO—simulation-based ant colony optimization algorithm; BB—branch and bound; SCGA—self-adaptive chaos genetic algorithm; HGA-PSO—hybrid genetic algorithm-particle swarm optimization; CPR-BGA—congestion prevention rule-based bi-level genetic algorithm; PN—petri nets; DWA—distributed water filling approach; POH—pattern-based off-line heuristic; MISOCP—mixed-integer second-order cone programming; MIP—mixed integer programming; CQP—Convex Quadratic Programming.
Table 2. Parameter settings.
ParameterValueParameterValue
effd1.11effm1.25
effp1.25r0.69 kg/kWh
α 0.098g2.5 t
β 5fe30 CNY/ton
Li25tfp7.2 CNY/h
Table 3. Cases setting.
Case IDNo. of TasksNo. of AGVsNo. of QCsNo. of Blocks
Small scale casesS18224
S28324
S312224
S412324
S516324
S616424
S720424
Medium scale casesM160636
M260848
M3801248
M410015510
M510016510
M612016612
M712017612
Large
scale cases
L114017612
L214018612
L316018714
L416019714
L518019816
L618020816
L7200241020
Table 4. Results of numerical experiments.
GSAAGAGreedySAAGASAGAGAGUROBITmaxCase ID
Time5OBJ5Time4OBJ4Time3OBJ3Time2OBJ2Time1OBJ1TimeOBJ
0.230.3570.260.3570.280.3570.280.3570.230.3578.170.35720S1Small
0.450.6270.330.6270.350.6270.390.6270.360.62712.980.62720S2
0.361.8730.321.9380.371.8730.391.8730.291.87340.002.21140S3
0.620.8010.500.8010.590.8010.580.8010.500.80125.270.80140S4
0.811.5050.675.2940.901.5310.721.6210.711.63660.003.02960S5
0.871.6810.941.9761.061.6810.941.6810.921.68146.111.68160S6
1.142.0741.142.0741.242.0741.242.0741.042.07455.872.07460S7
0.641.2740.601.8670.691.2800.651.2910.581.29335.491.540Avg.
7.347.5187.297.5187.397.5187.267.5457.077.819100-100M1Medium
9.617.1519.477.1529.757.15110.167.2439.417.268100-100M2
22.2713.61923.9813.61923.9713.61723.4013.61822.9013.651100-100M3
41.7015.14442.3615.66642.9115.14443.4015.25341.1815.862140-140M4
45.3914.71944.7815.50644.6514.71945.6914.72445.1314.779140-140M5
61.1413.99563.5014.25663.3513.99763.8316.29061.0116.402140-140M6
66.0311.09765.8912.11468.1211.09566.5812.38465.8812.507140-140M7
36.2111.89236.7512.26237.1611.89137.1912.436736.0812.613 -Avg.
90.2318.03592.7118.03595.2118.05193.1318.2491.3018.64300-300L1Large
94.0716.41997.6016.42198.7116.42098.8617.33995.6817.791300-300L2
118.1717.632120.2917.636127.7717.639128.6419.096122.8319.55300-300L3
128.6317.653128.4817.653135.6817.658124.7218.378129.3118.797300-300L4
157.3911.366166.5211.367174.0512.253164.4519.145155.0821.777500-500L5
169.7614.242173.8514.242172.9114.485172.3316.727163.7020.404500-500L6
251.0517.899246.2817.899251.6218.738252.6624.910241.8929.491500-500L7
144.1816.178146.5316.179150.8516.463147.8319.119142.8320.921 -Avg.
Table 5. Sensitivity analysis results of the number of AGVs.
Case IDNo. of AGVsNo. of QCsNo. of BlocksOBJImp. (%)
20A12243.3582770.085
A23241.5161195.726
A34240.881652.991
A45240.1202.564
A56240.1191.709
A67240.1180.855
A78240.117-
80B17480.5812.718
B28480.5731.213
B39480.5721.093
B410480.5710.872
B511480.5680.354
B612480.5670.246
B713480.566-
160C1157141.4270.364
C2167141.4250.257
C3177141.4250.252
C4187141.4250.216
C5197141.4230.091
C6207141.4220.059
C7217141.421-
Note: Imp. (%) = (OBJ − min OBJ)/min OBJ ⋅ 100.
Table 6. Sensitivity analysis results of the number of battery-swapping robots.
AGVsRobotsOperation CostNo-Load CostDelay CostTotal Cost
81----
21.3560.08978.07179.516
31.3560.08564.33665.778
41.3560.08755.83657.280
51.3560.08854.91856.362
101----
21.3560.0737.3648.793
31.3560.0756.1877.618
41.3560.0775.5116.943
51.3560.0744.7676.197
121----
21.3550.0580.0001.413
31.3550.0570.0001.413
41.3550.0570.0001.413
51.3550.0580.0001.413
Table 7. Sensitivity analysis results of the different travel speeds of AGV.
Speed2080160
OBJ|Diff.| (%)OBJ|Diff.| (%)OBJ|Diff.| (%)
34.78310.267.711155.5033.468339.33
42.62950.680.87271.116.22918.24
51.62069.610.62279.392.54566.59
60.74785.980.61179.751.47080.70
variable5.3300.003.0180.007.6180.00
Avg. 43.31 77.15 100.97
Note: |Diff.| (%) = |OBJ (speed) – OBJ (variable)|/OBJ (variable) ⋅ 100.
Disclaimer/Publisher’s Note: The statements, opinions and data contained in all publications are solely those of the individual author(s) and contributor(s) and not of MDPI and/or the editor(s). MDPI and/or the editor(s) disclaim responsibility for any injury to people or property resulting from any ideas, methods, instructions or products referred to in the content.