
Hydrodynamic Loads on a Group of Six Structures of Different Cross-Sections in Uniform and Sheared Flow


Abstract
:1. Introduction
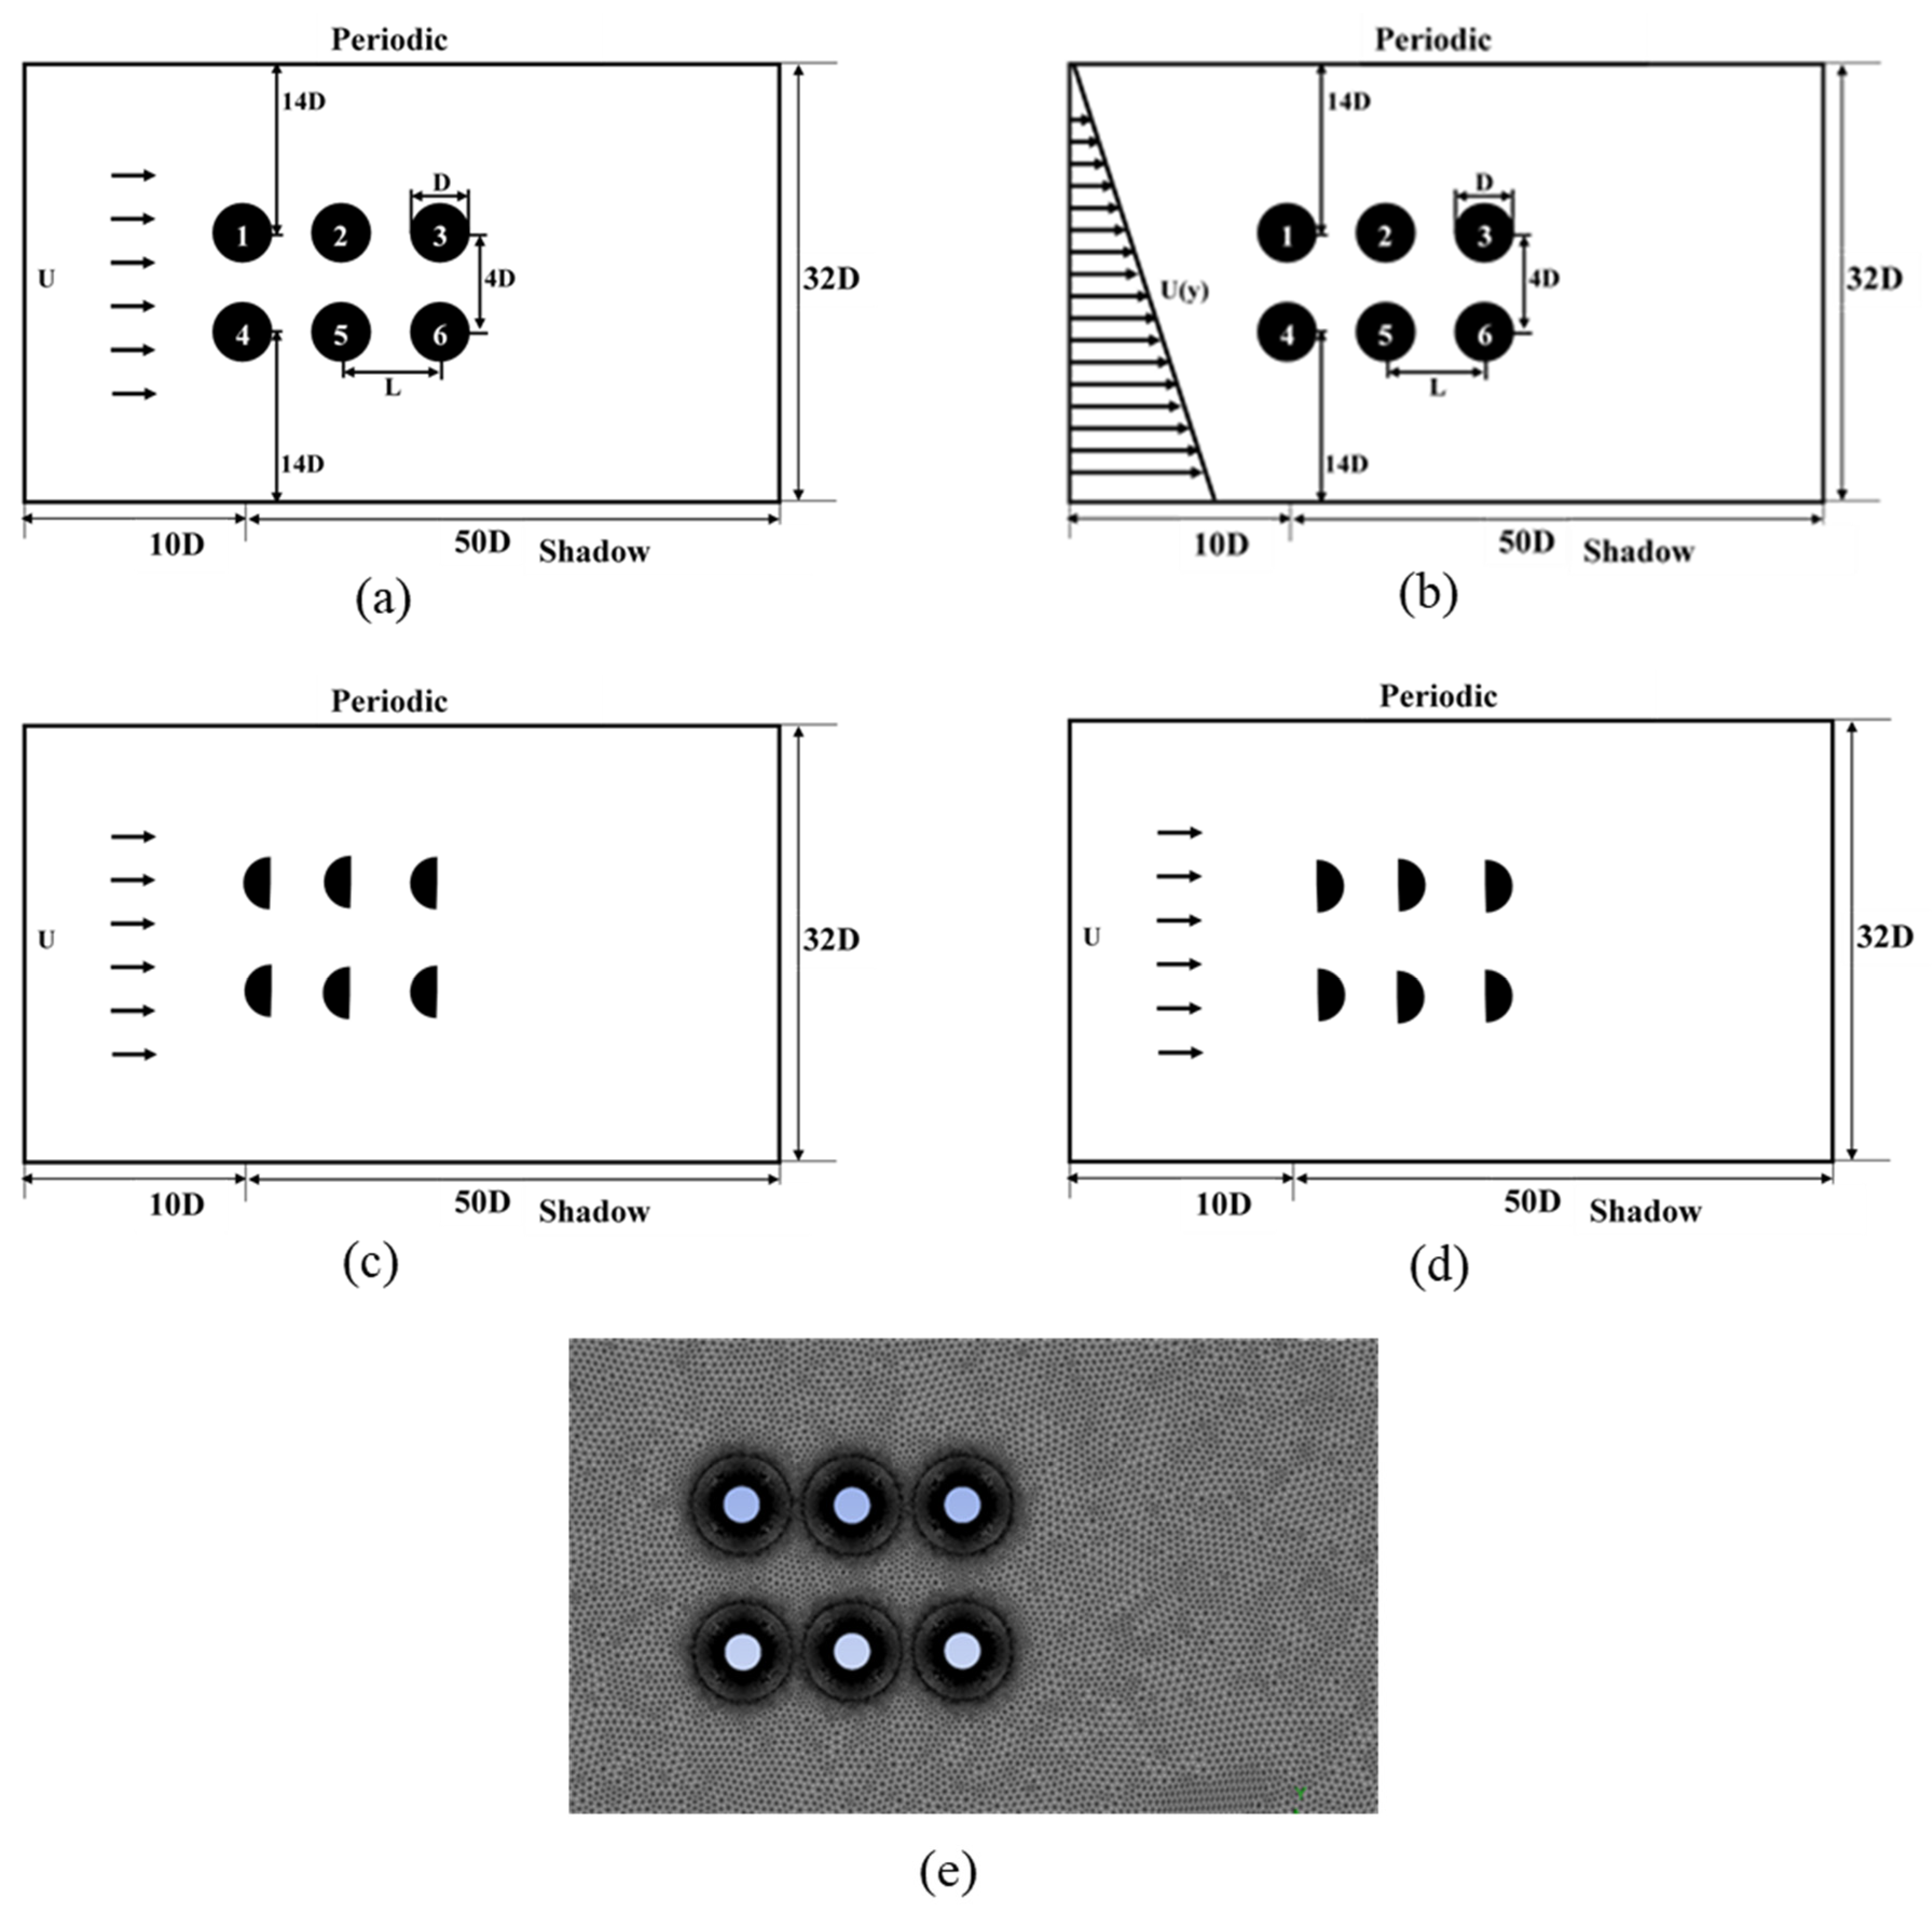
2. Numerical Model
3. Results and Discussion
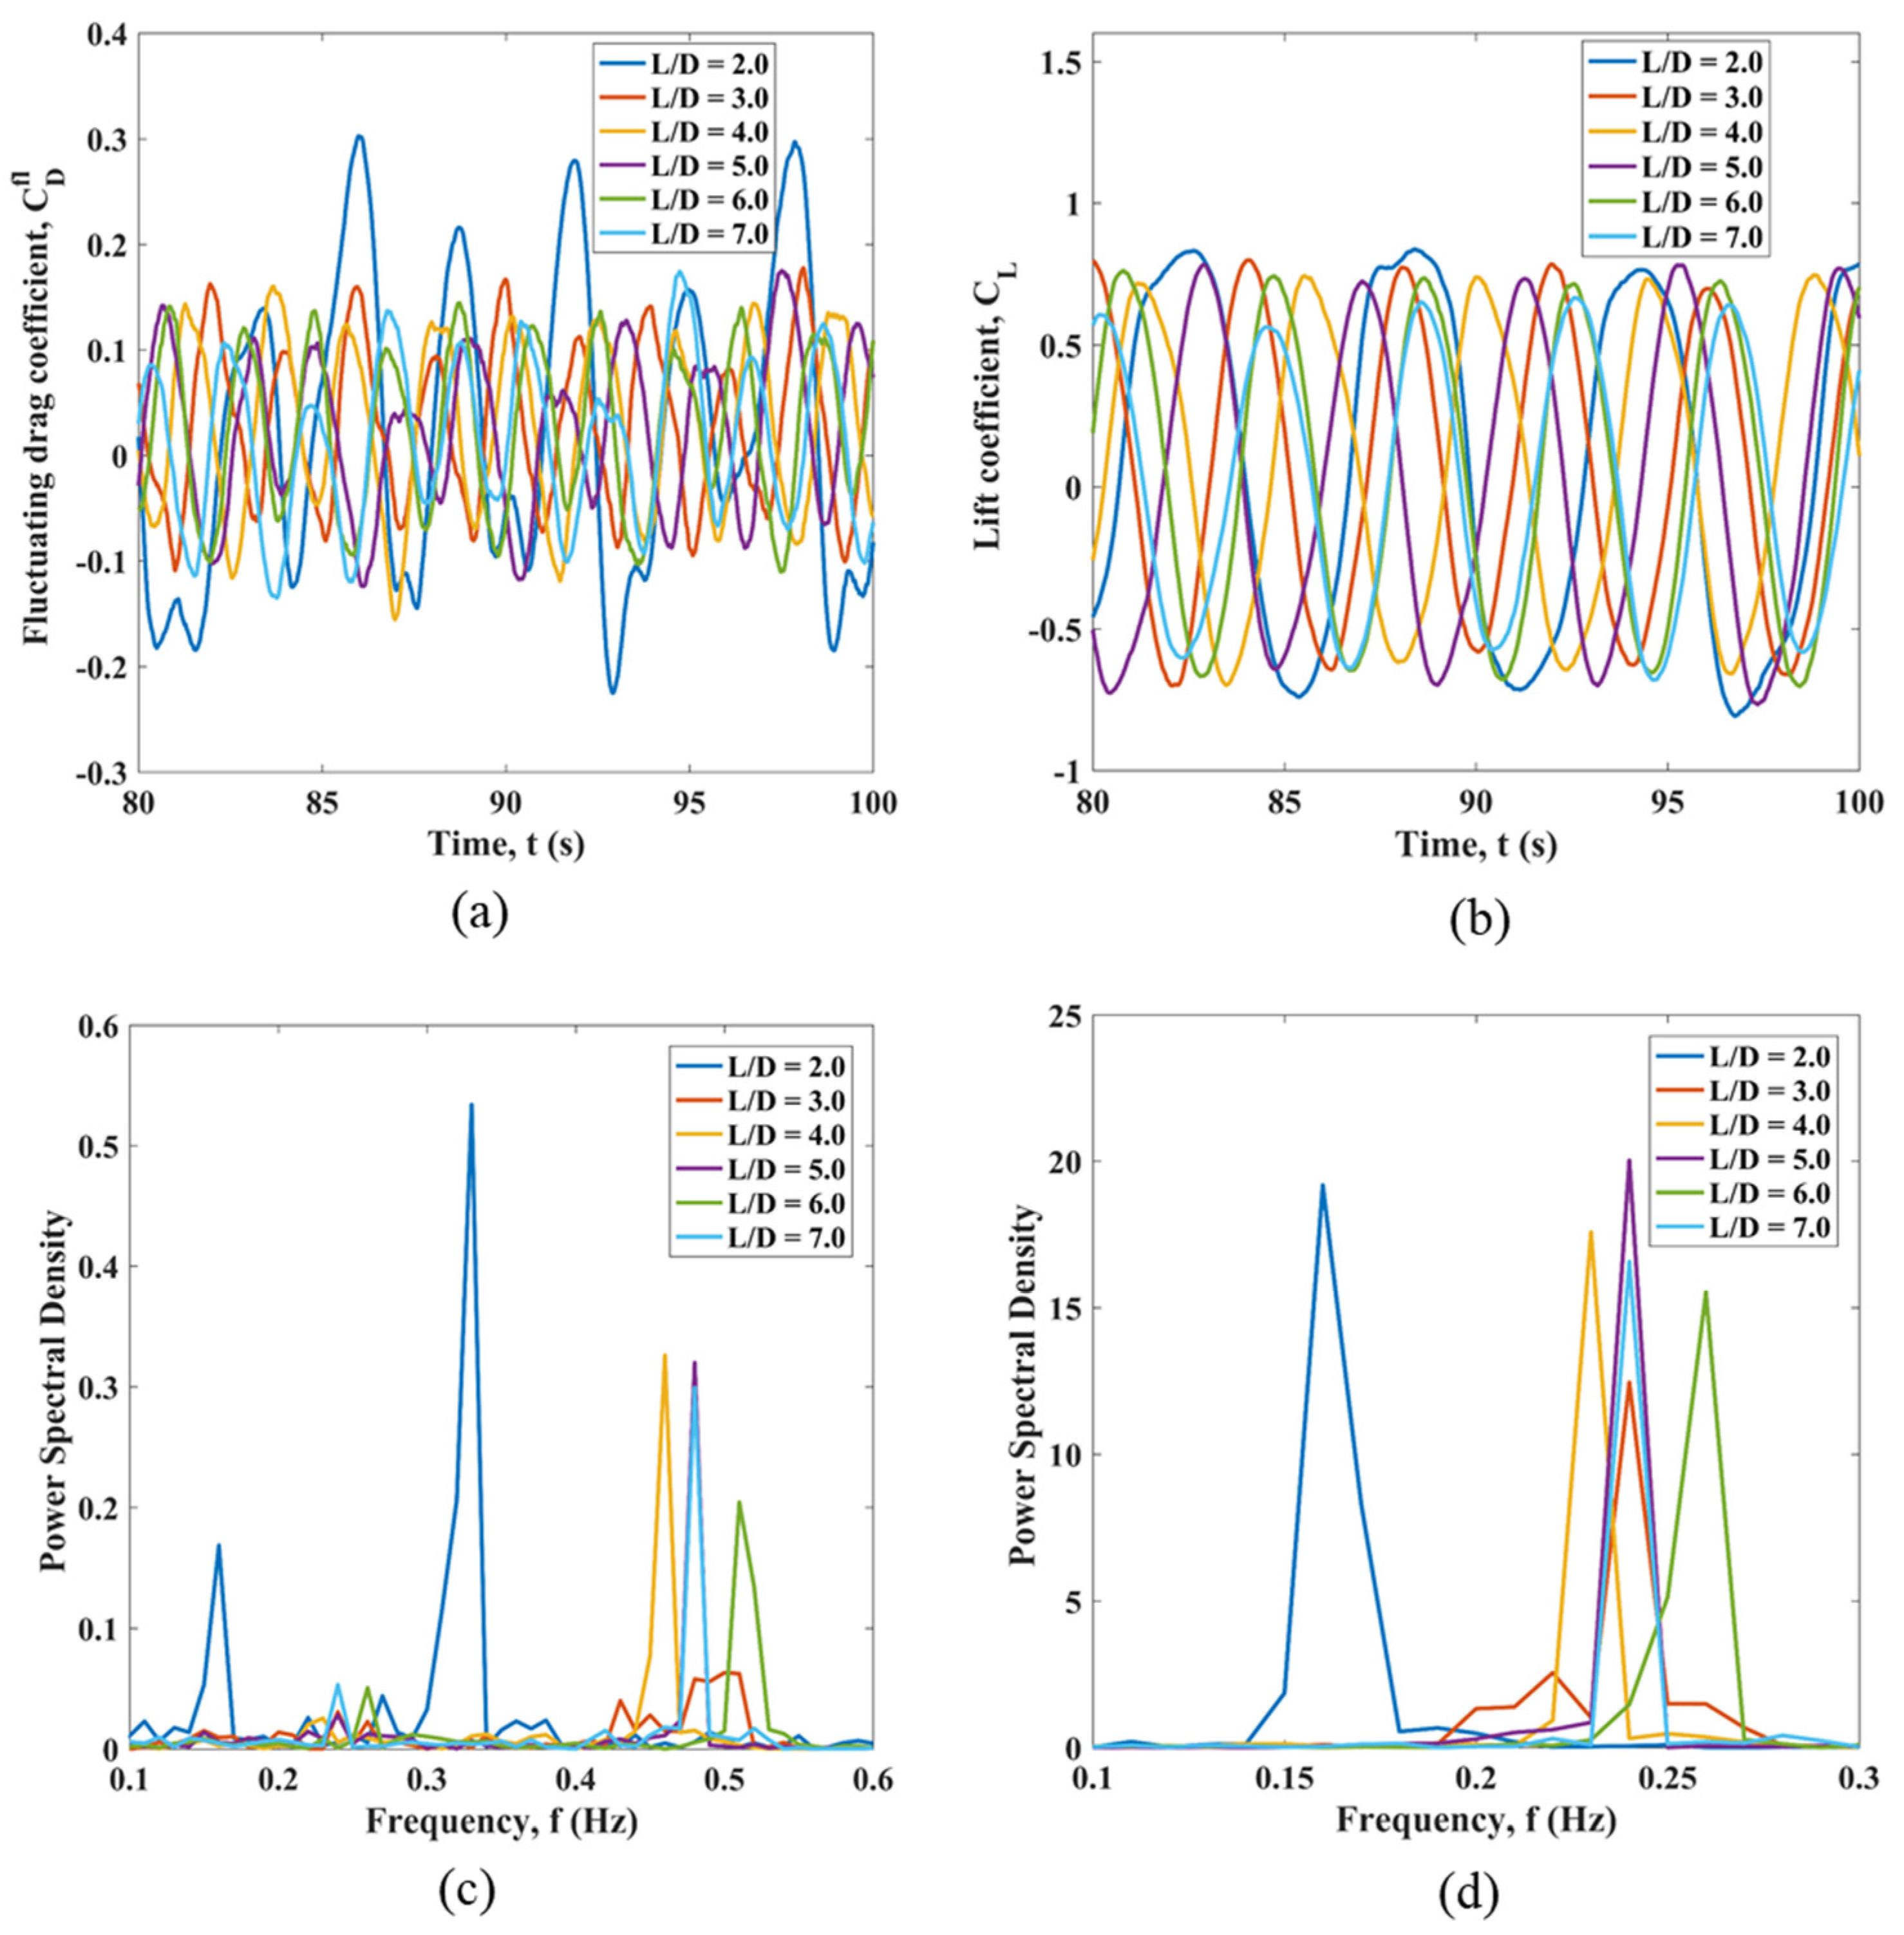
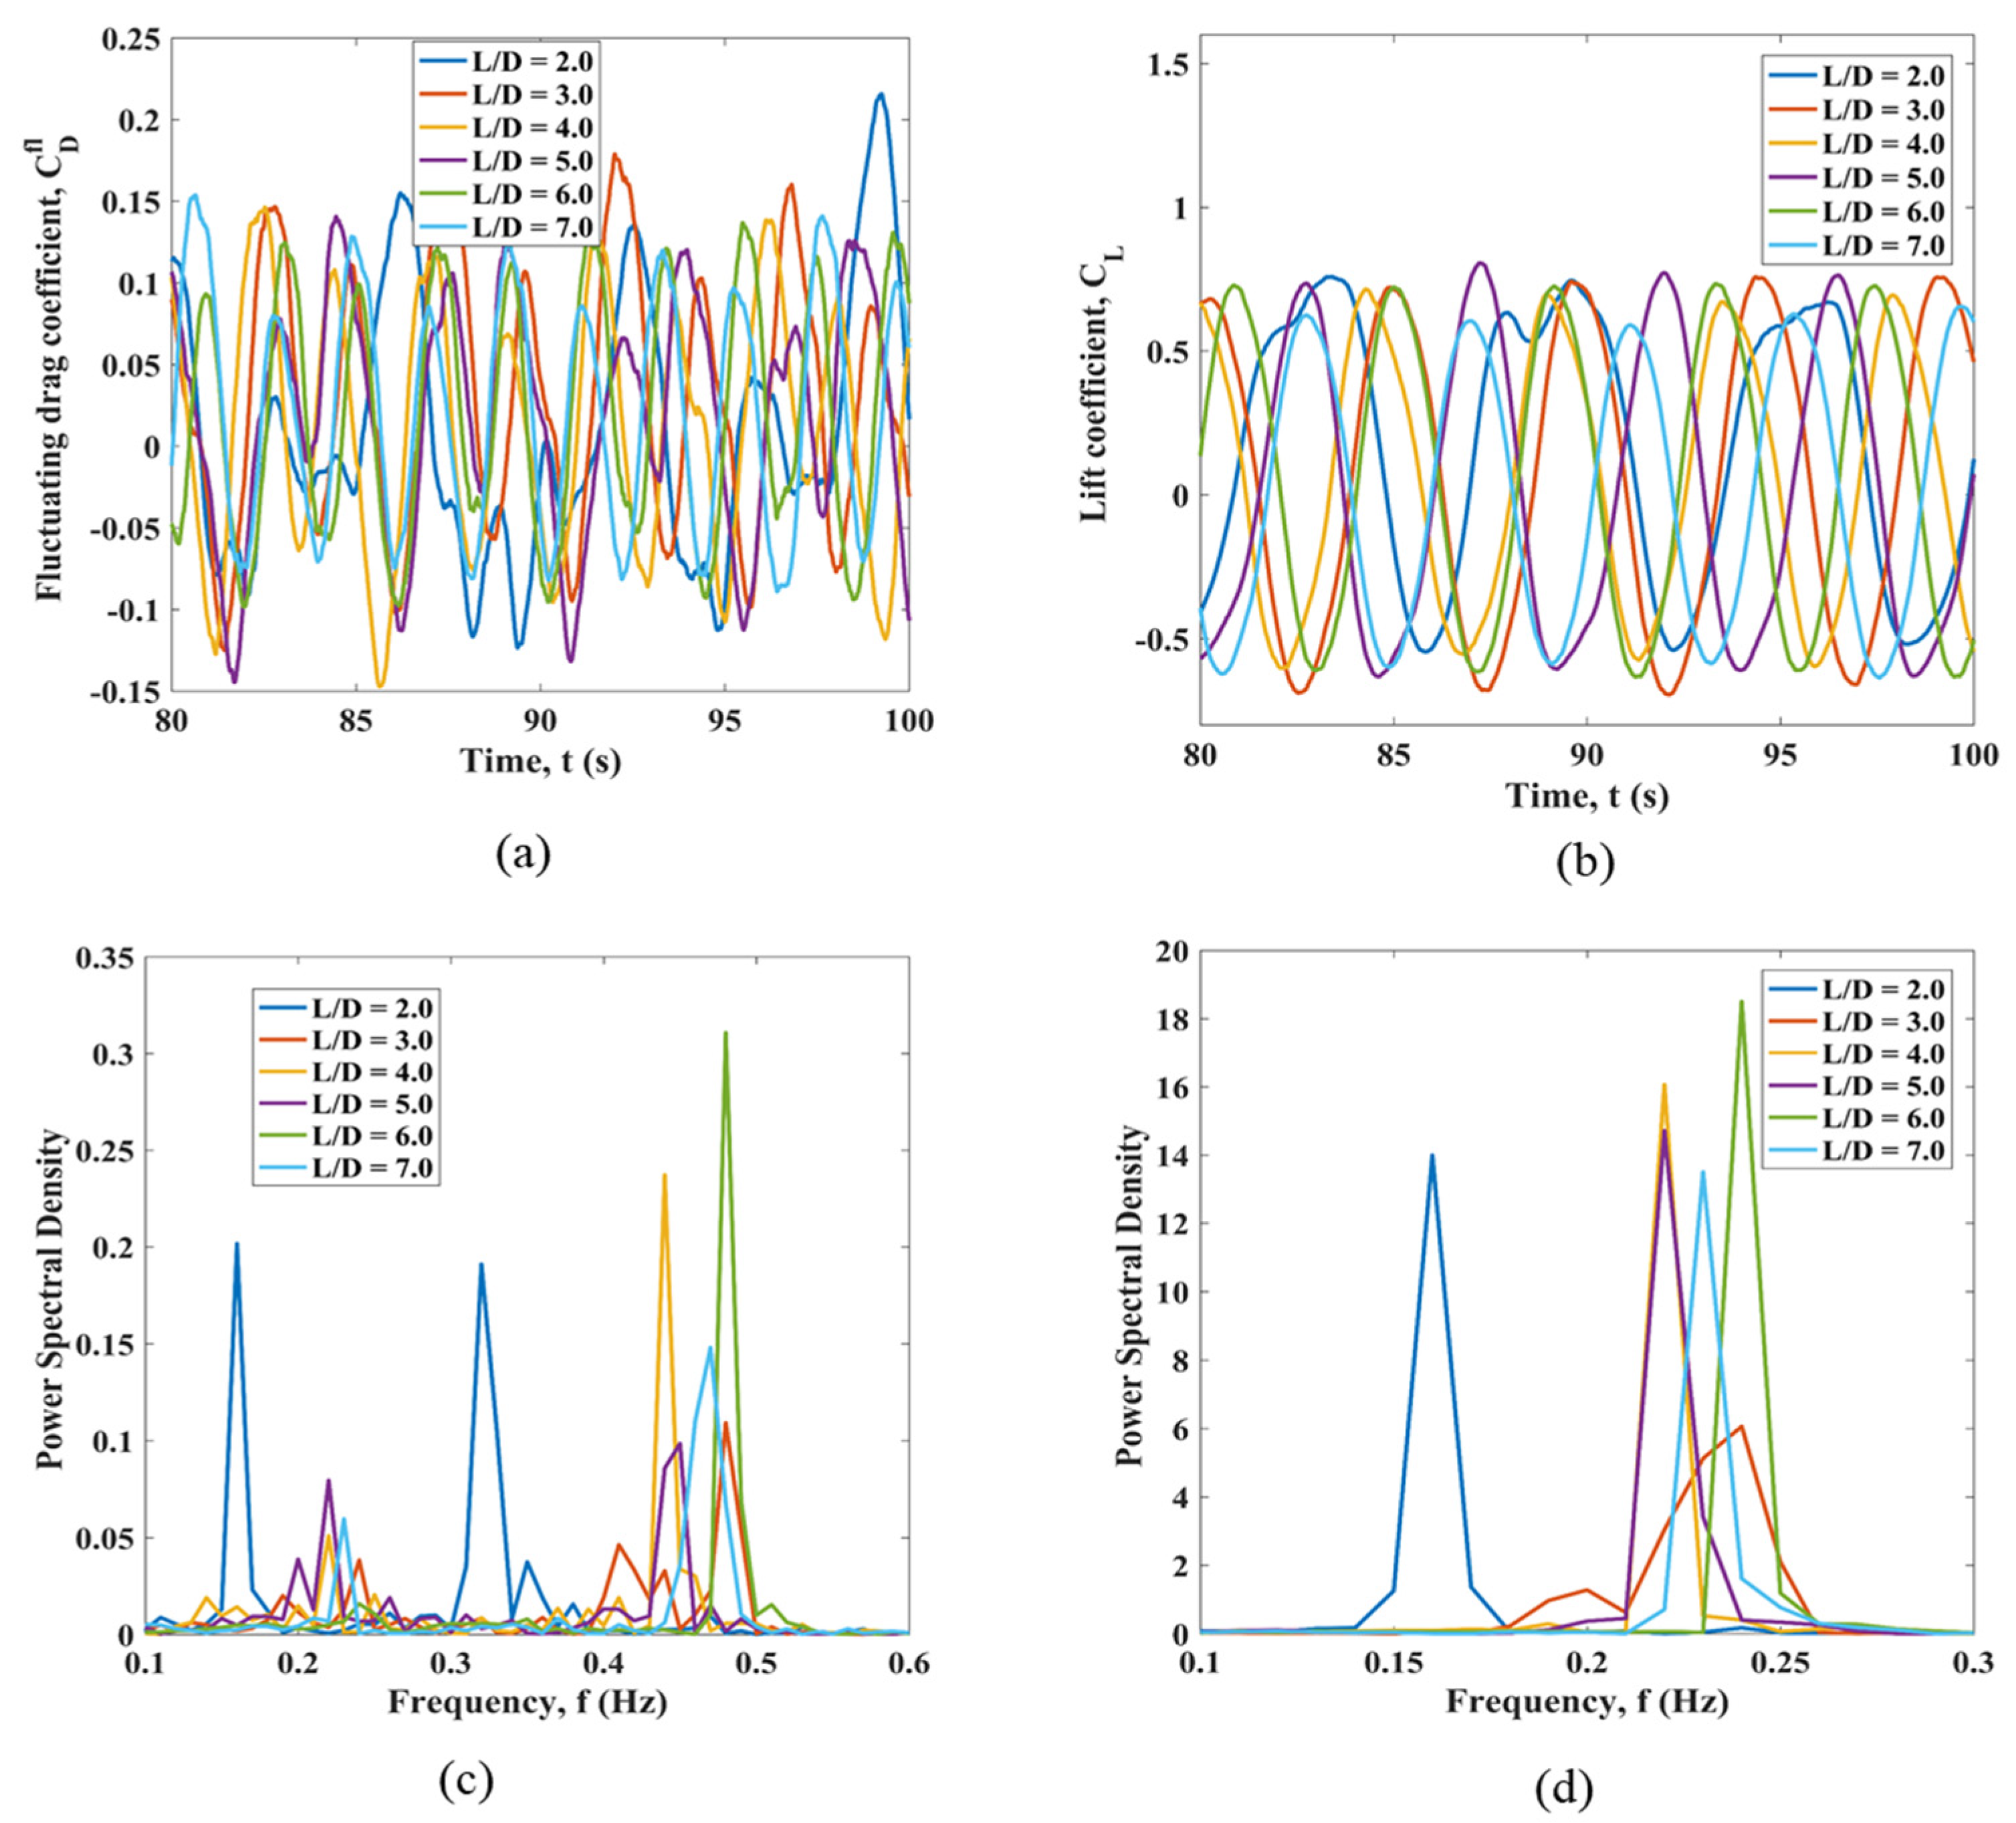
3.1. Variation of Distances among Circular Cylinders in Uniform and Sheared Flows
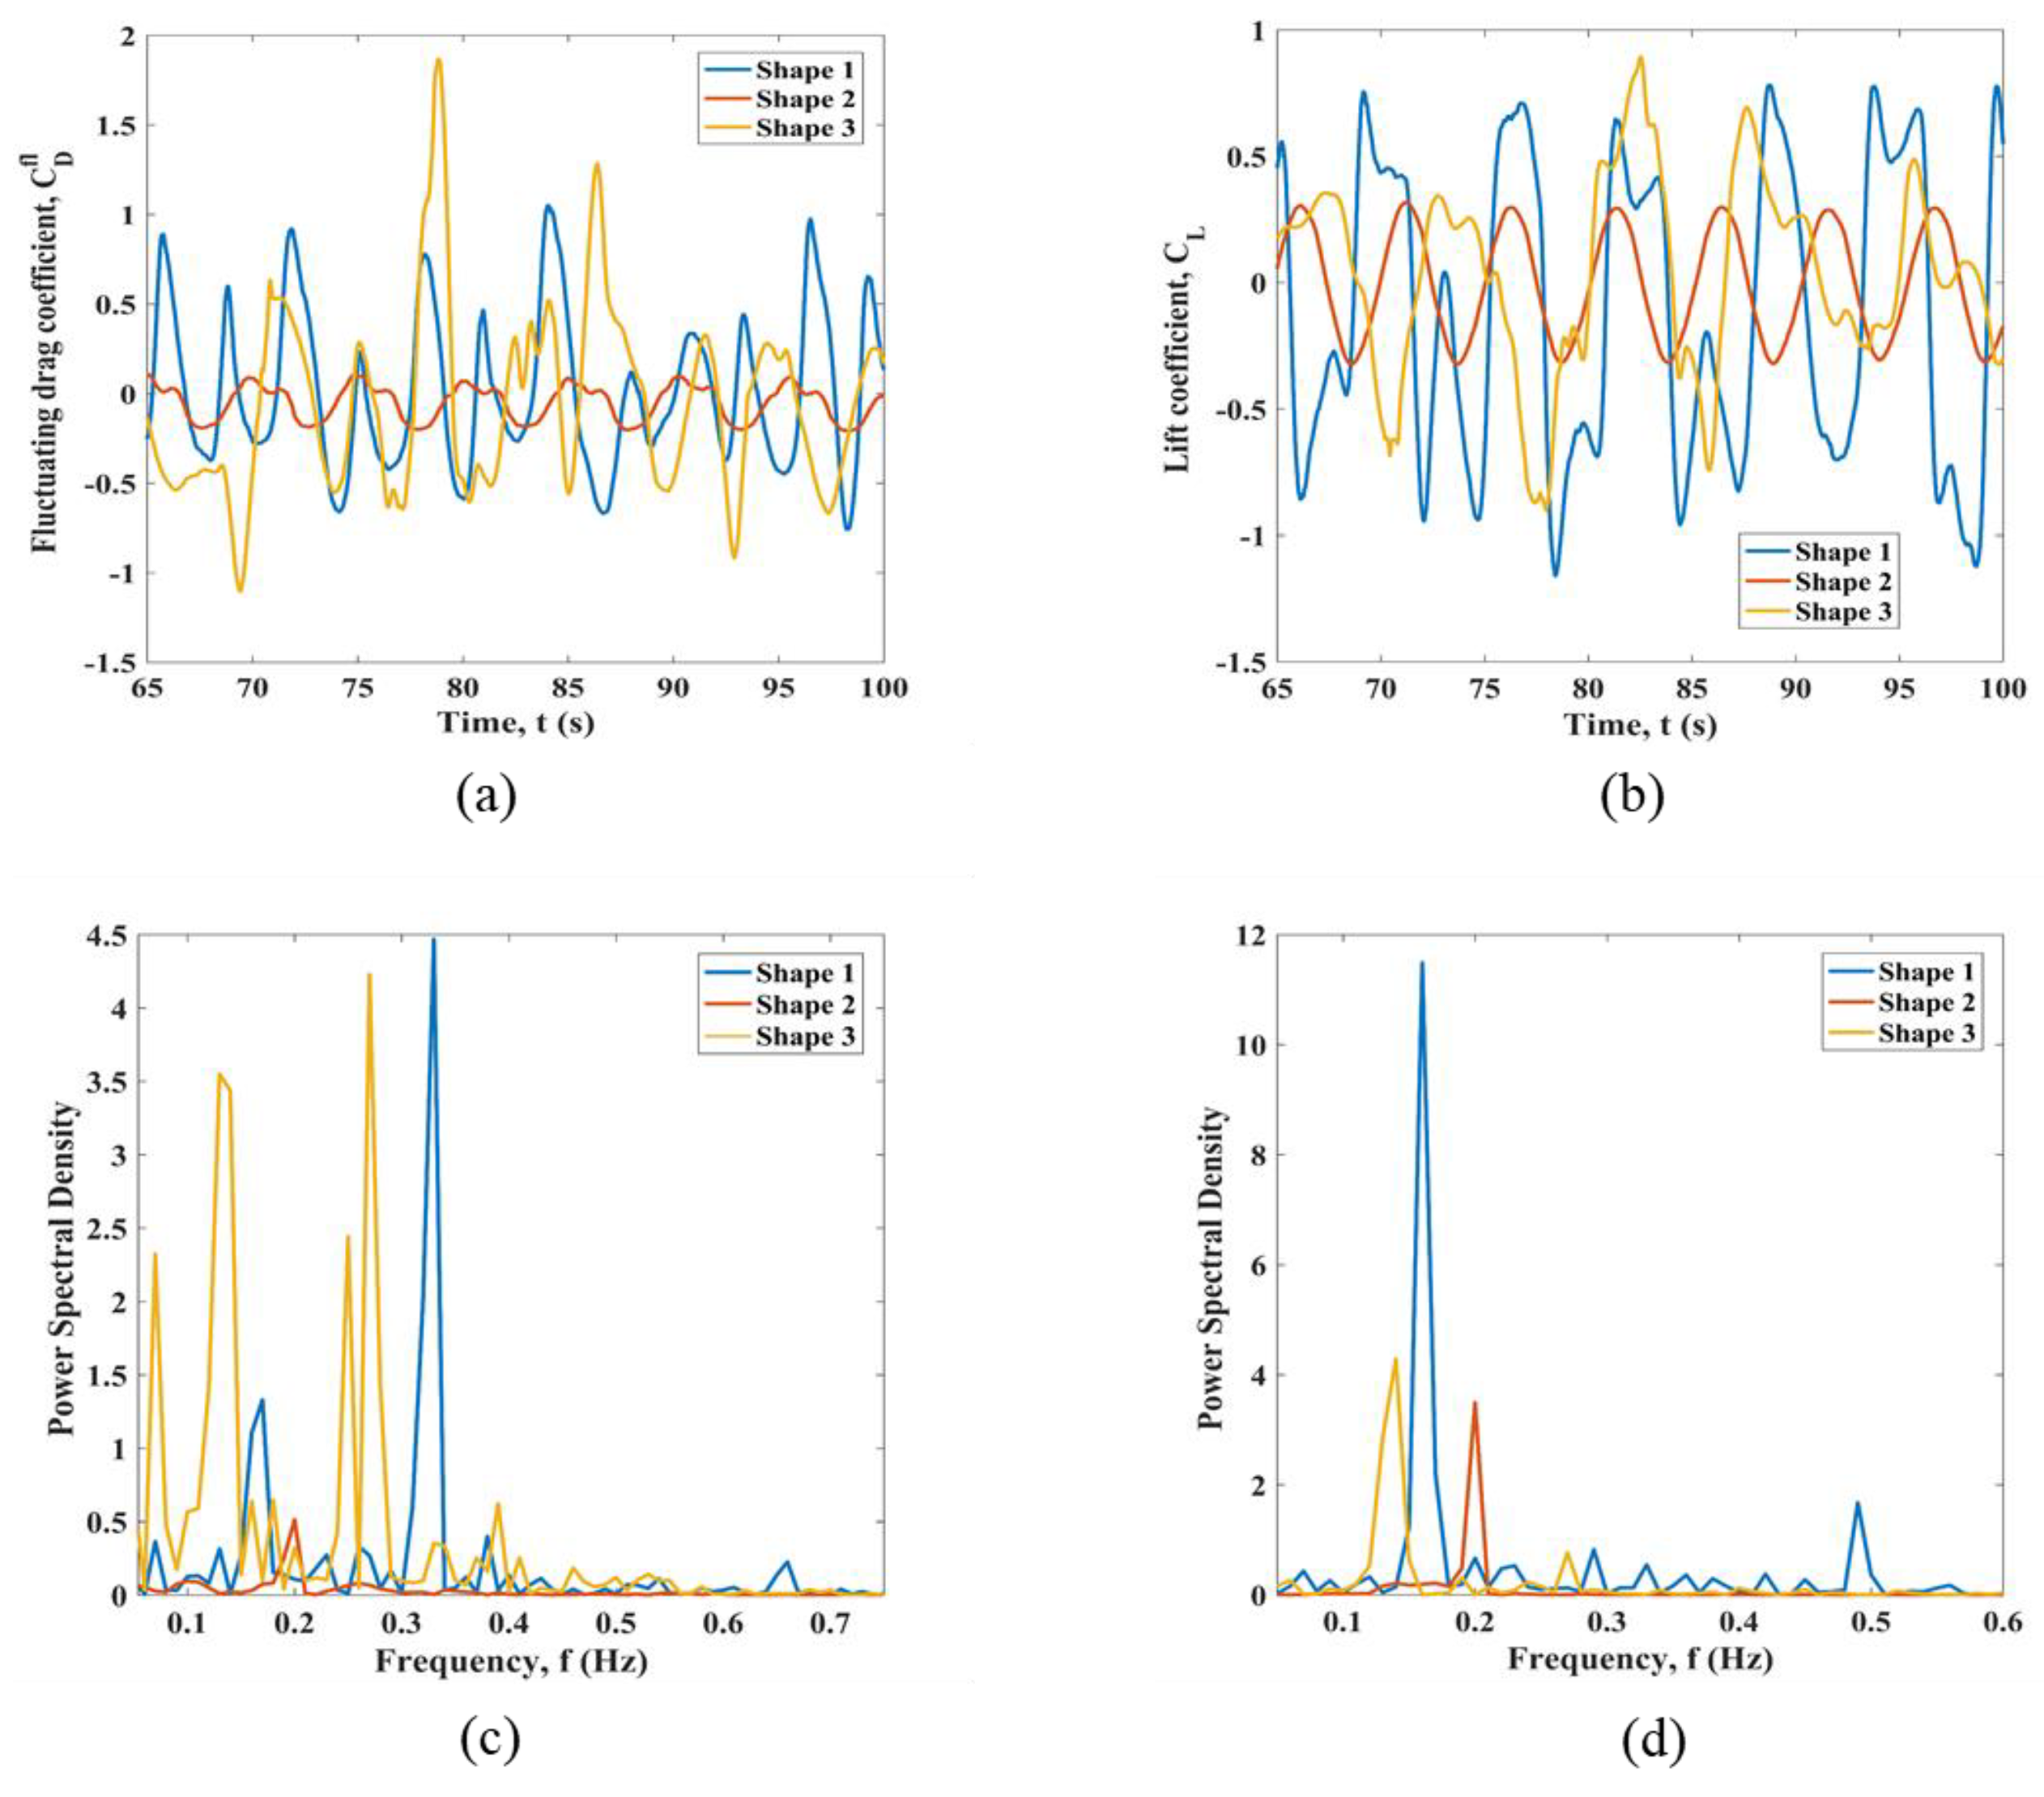
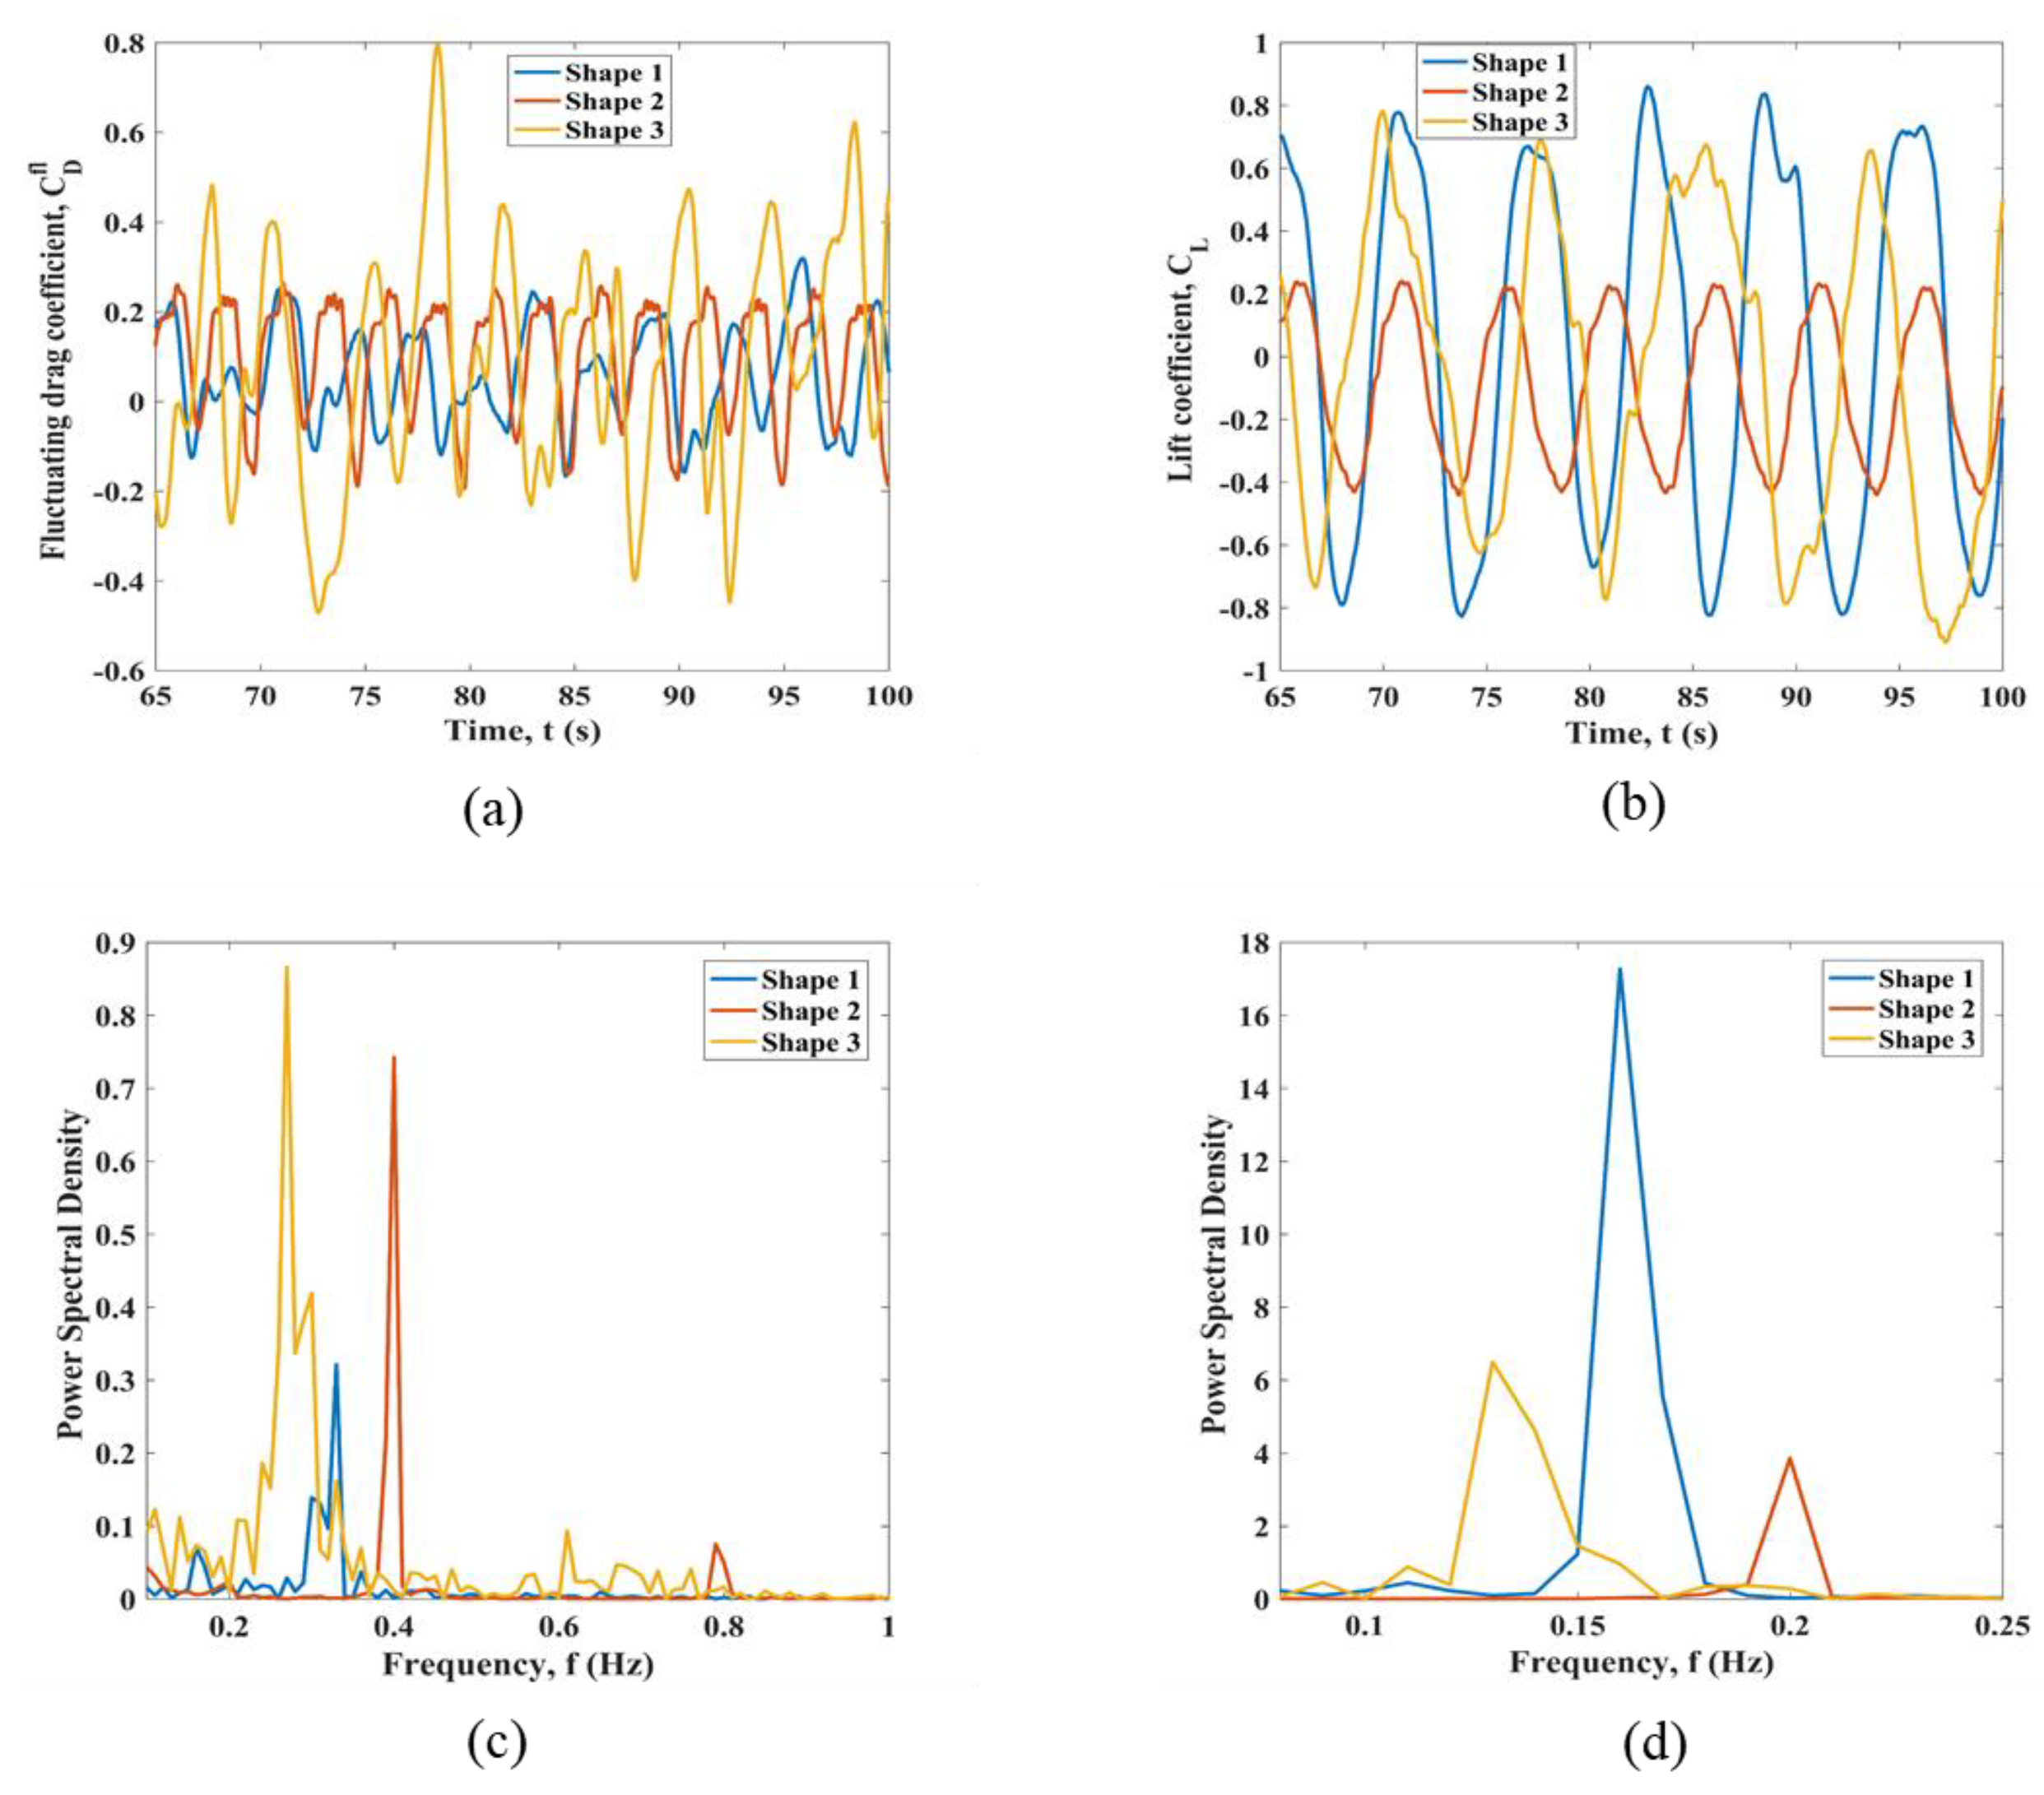
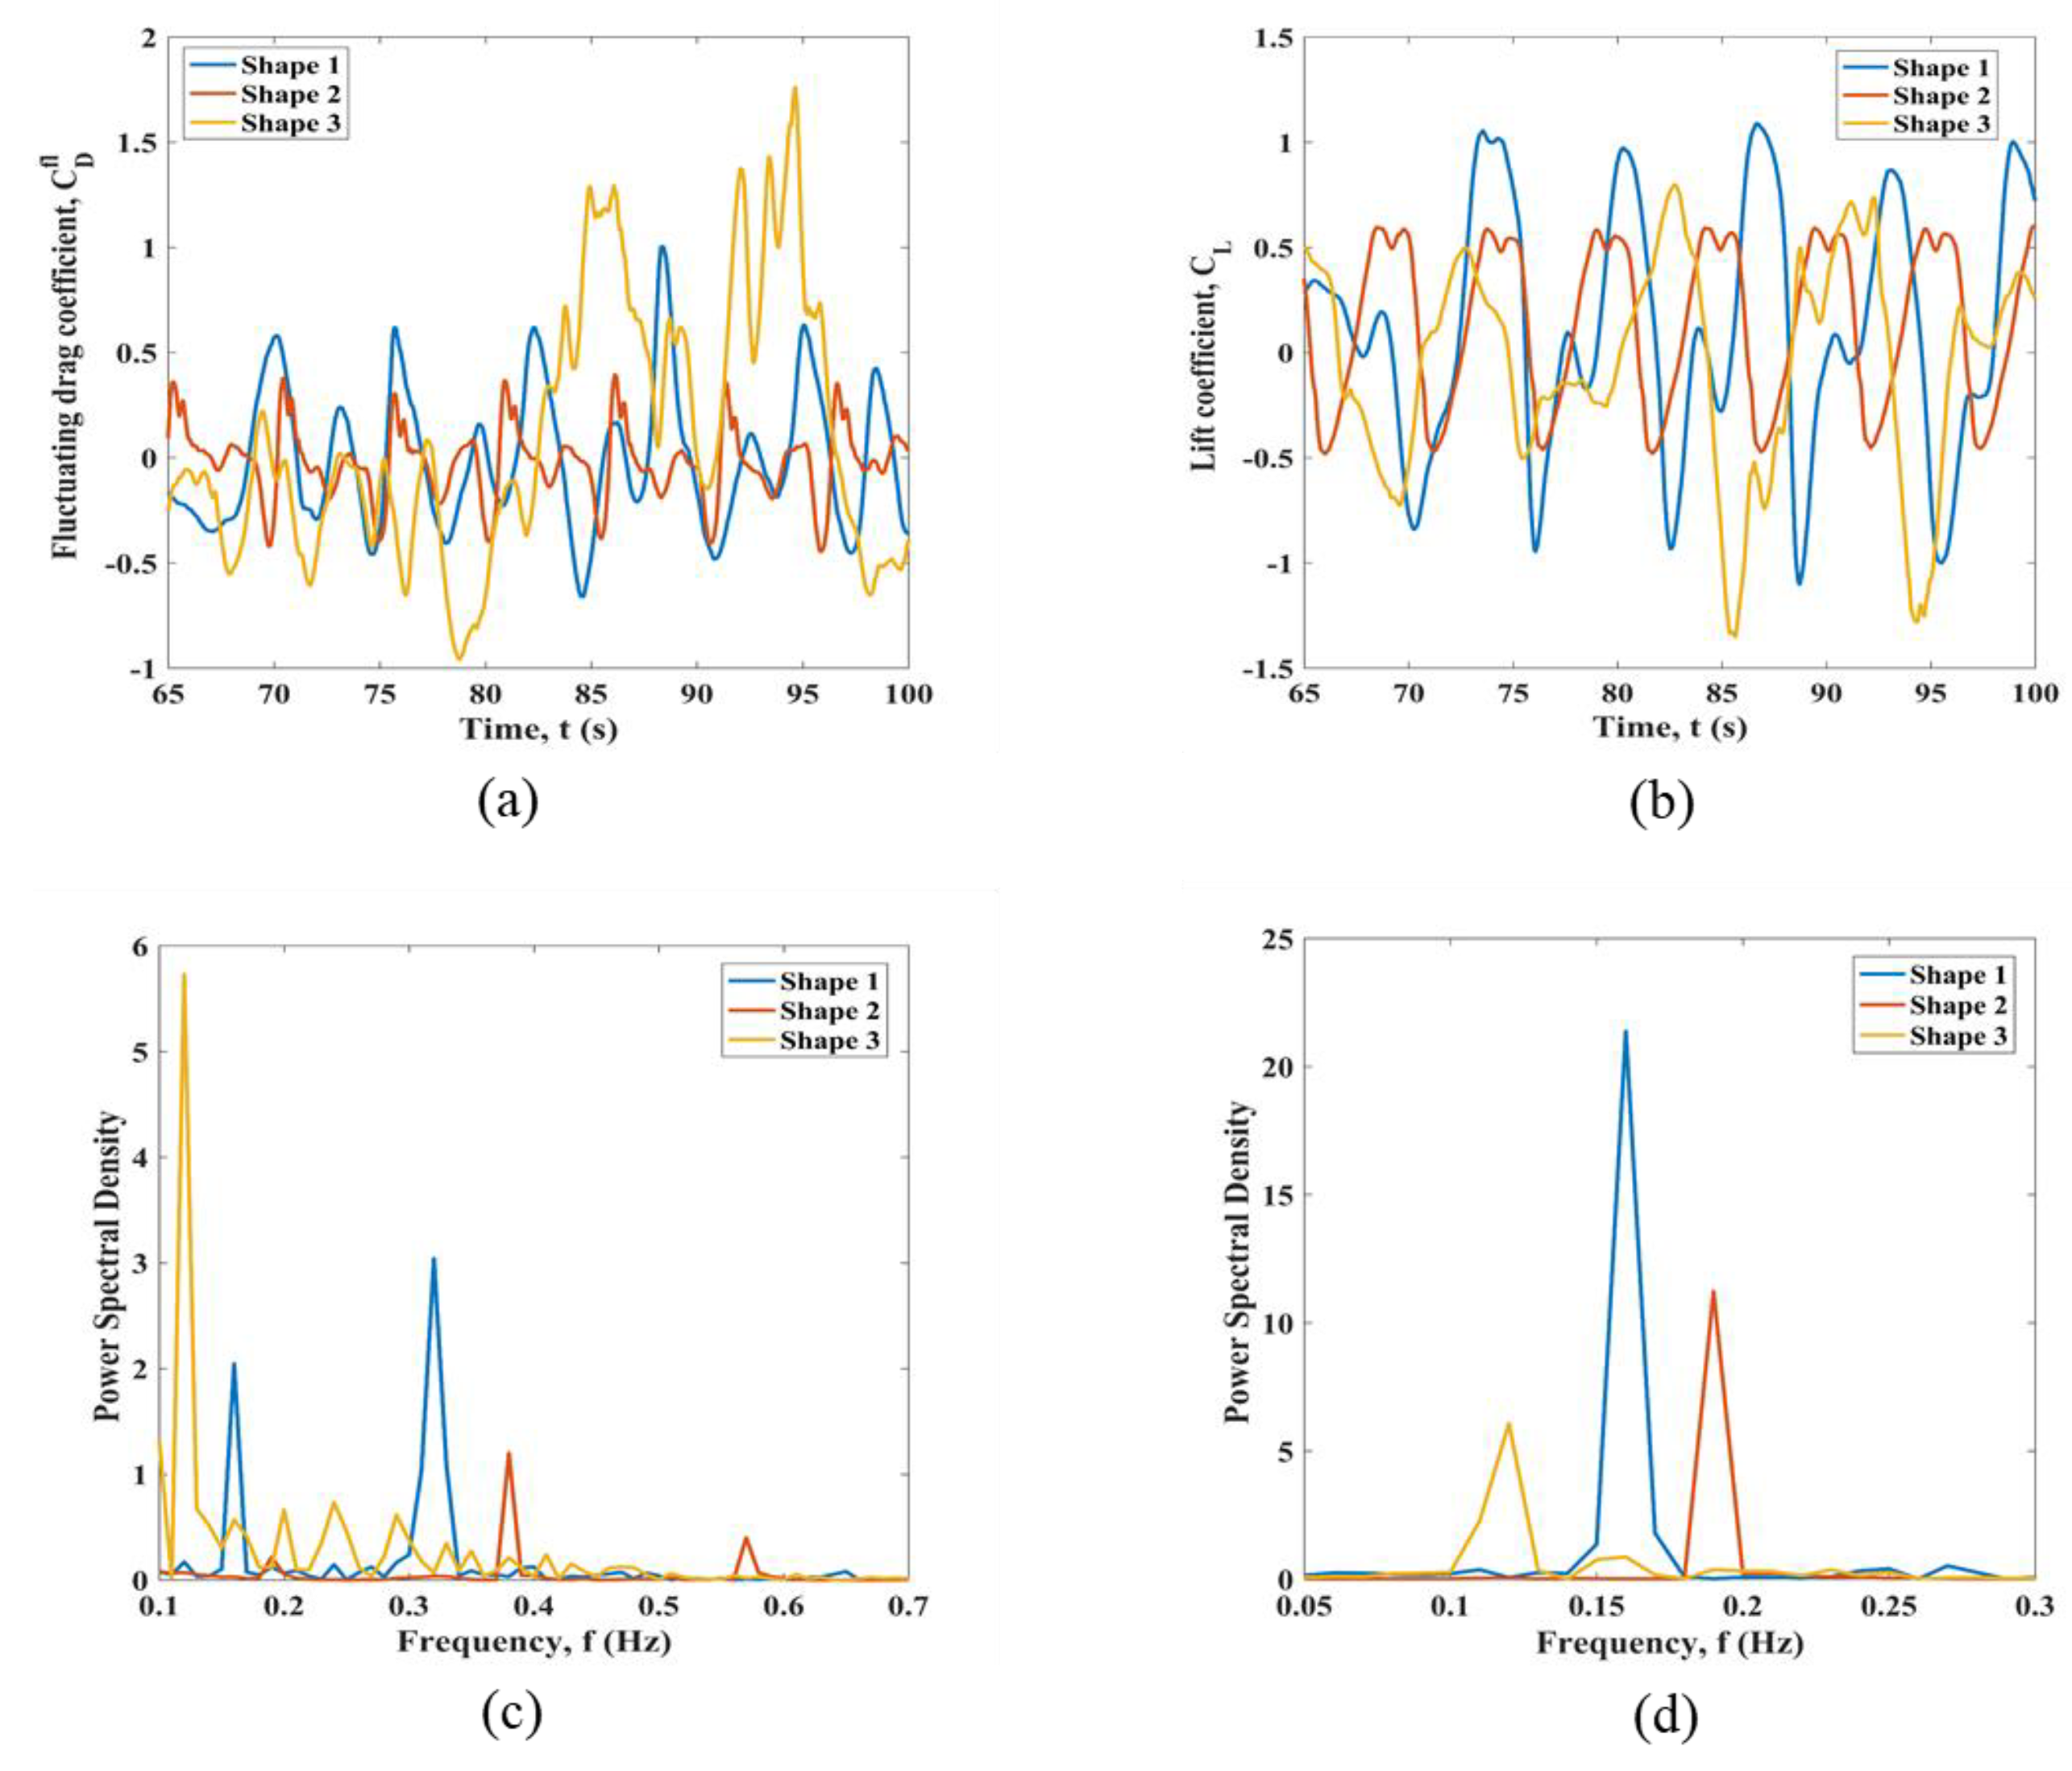
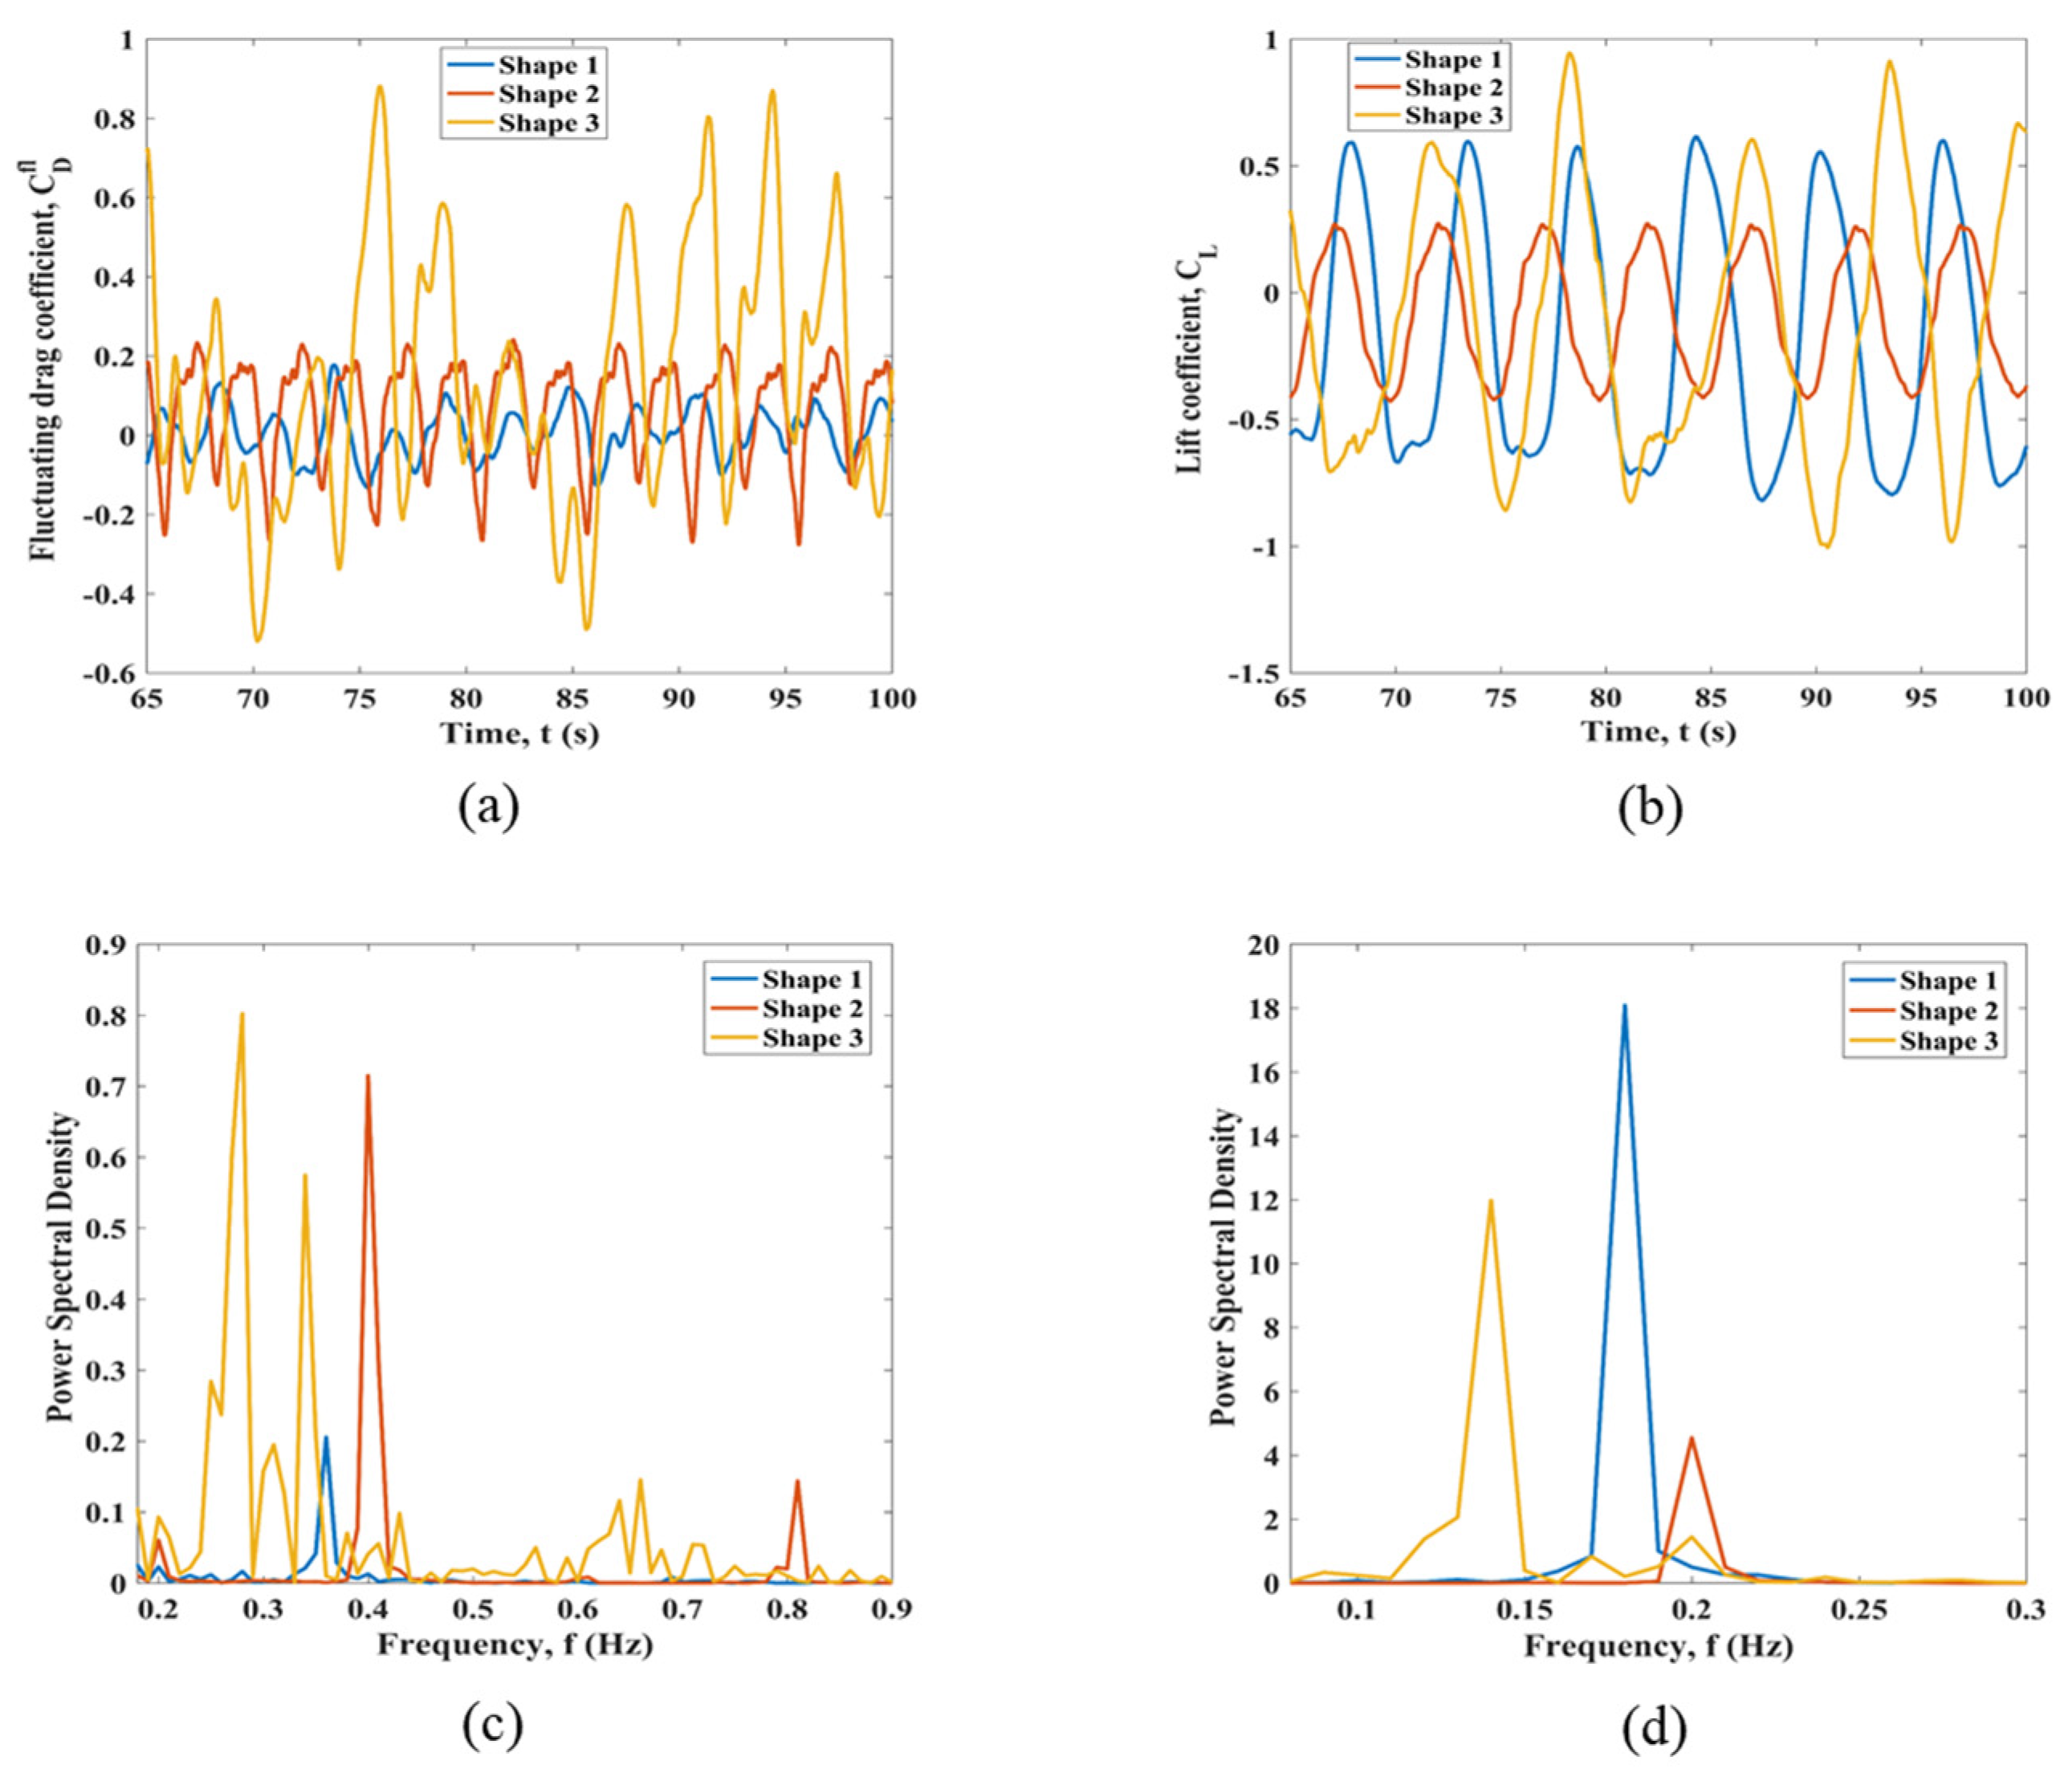
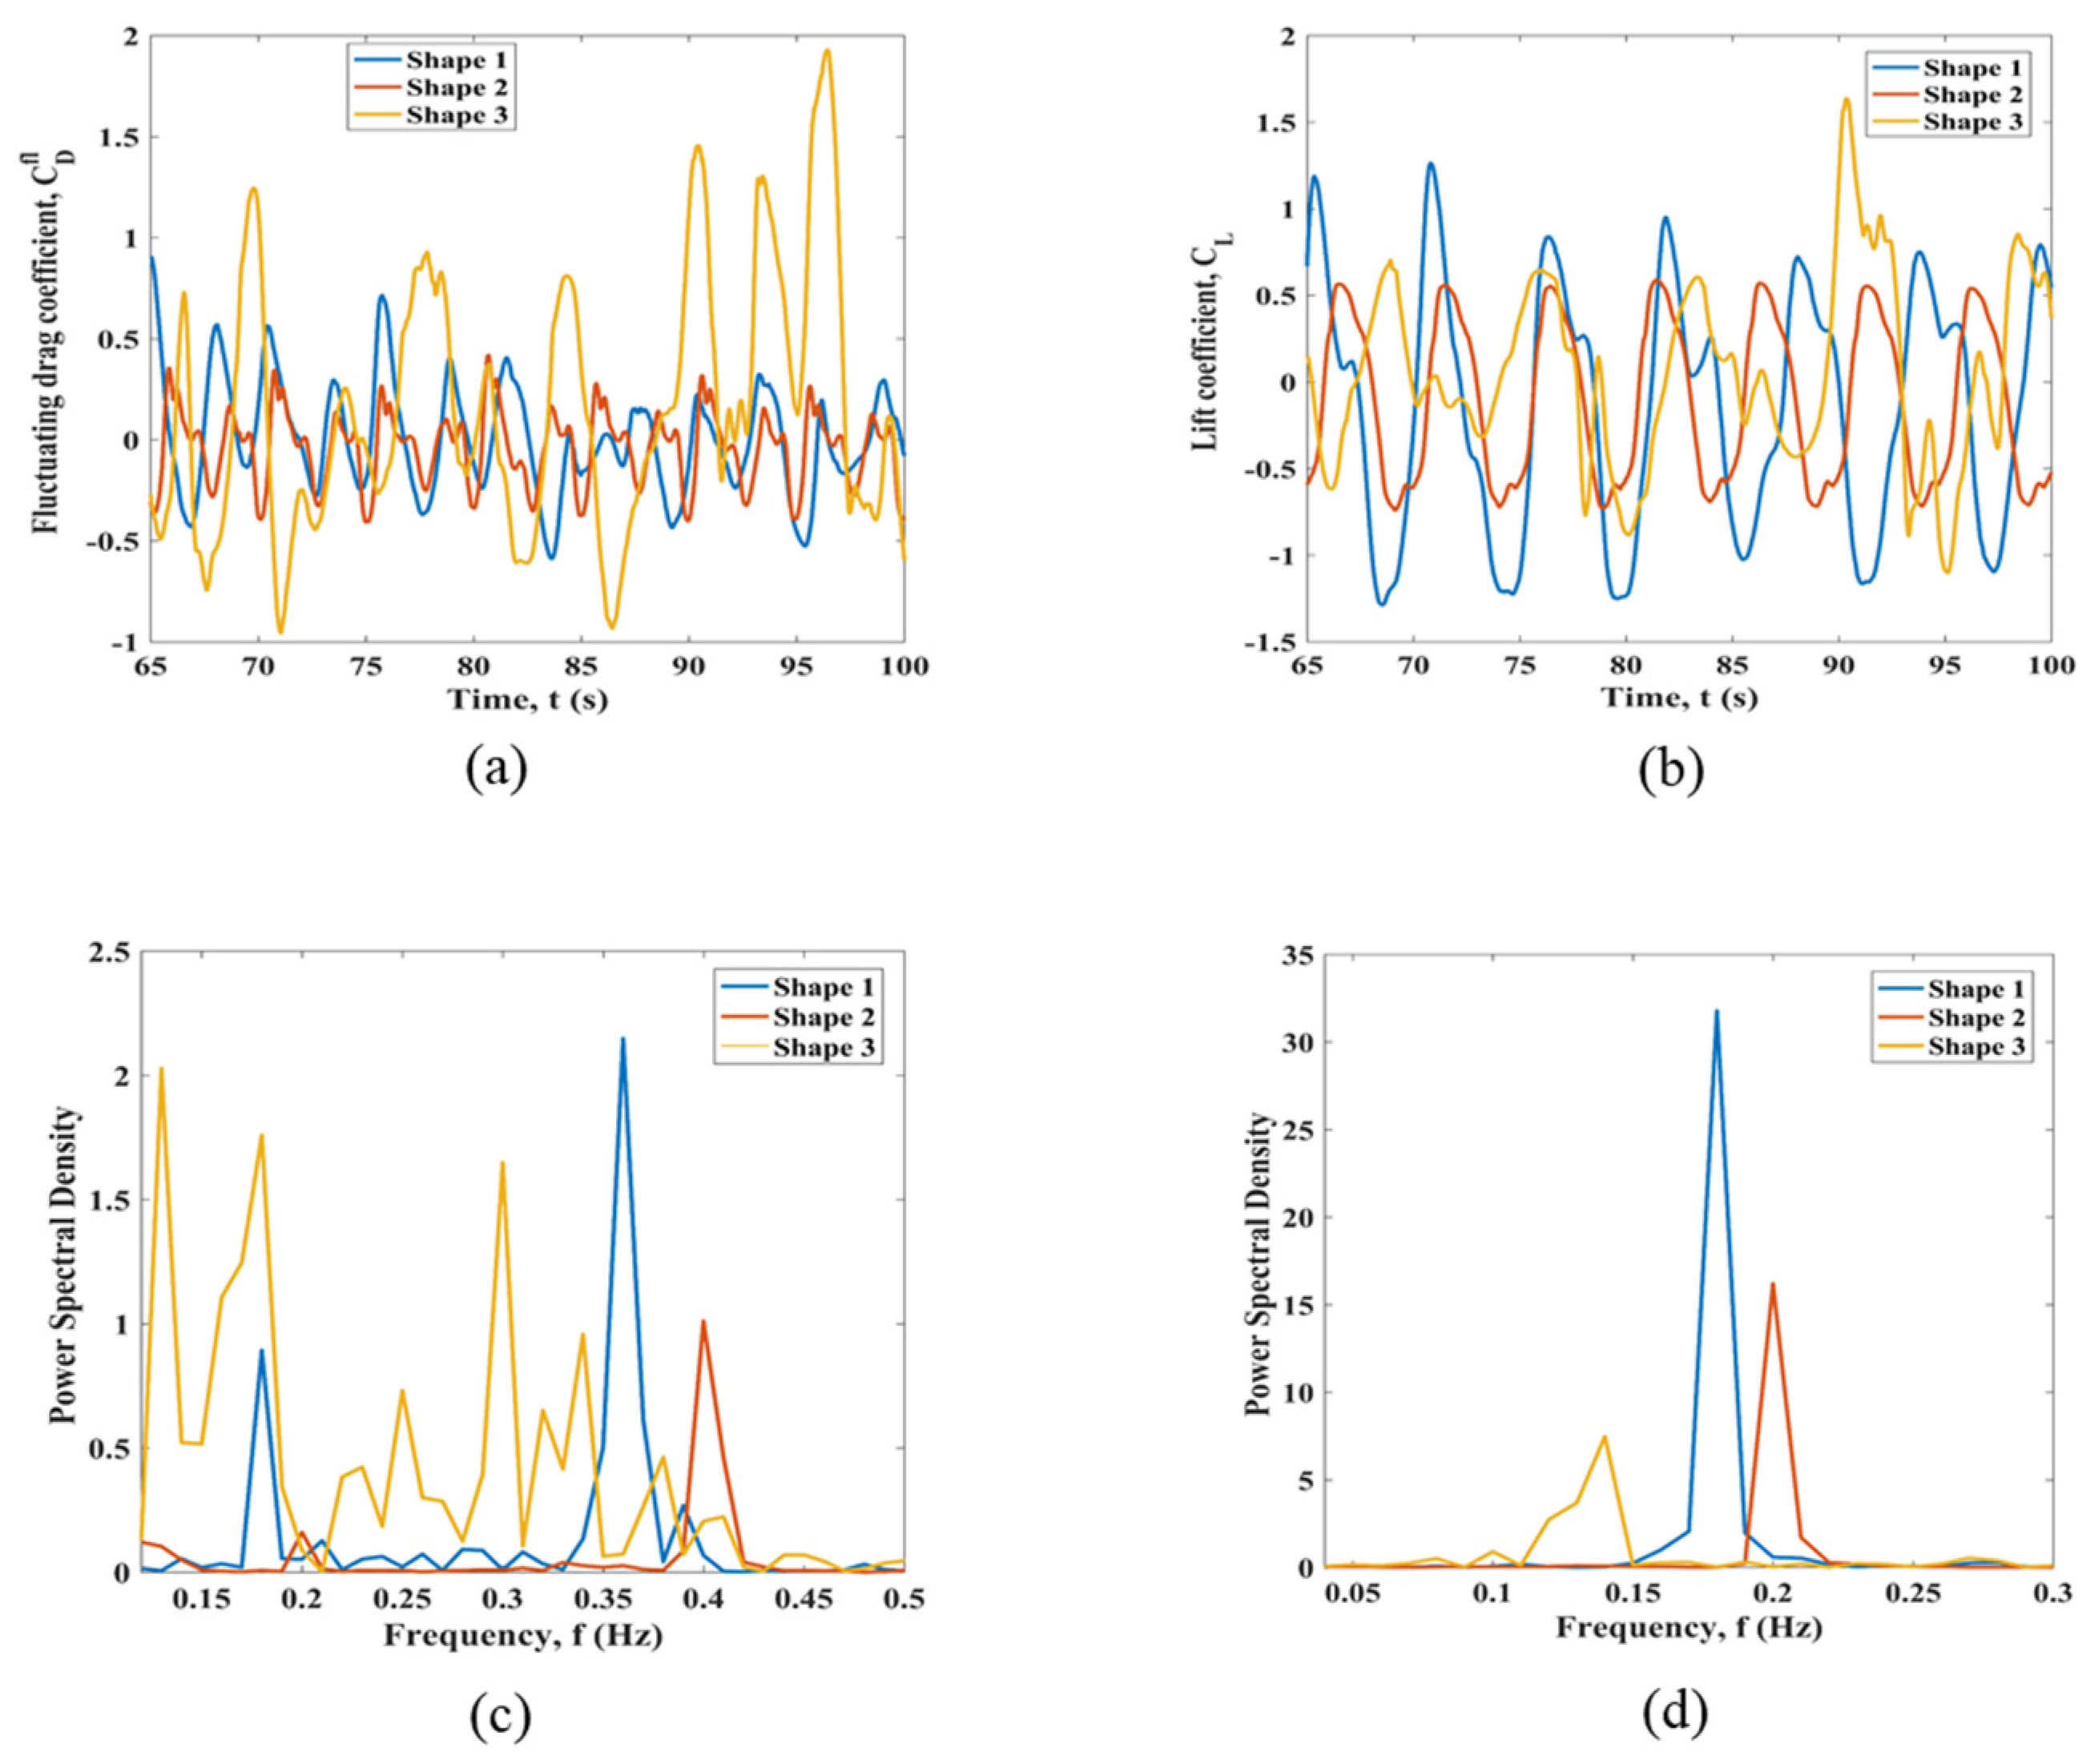
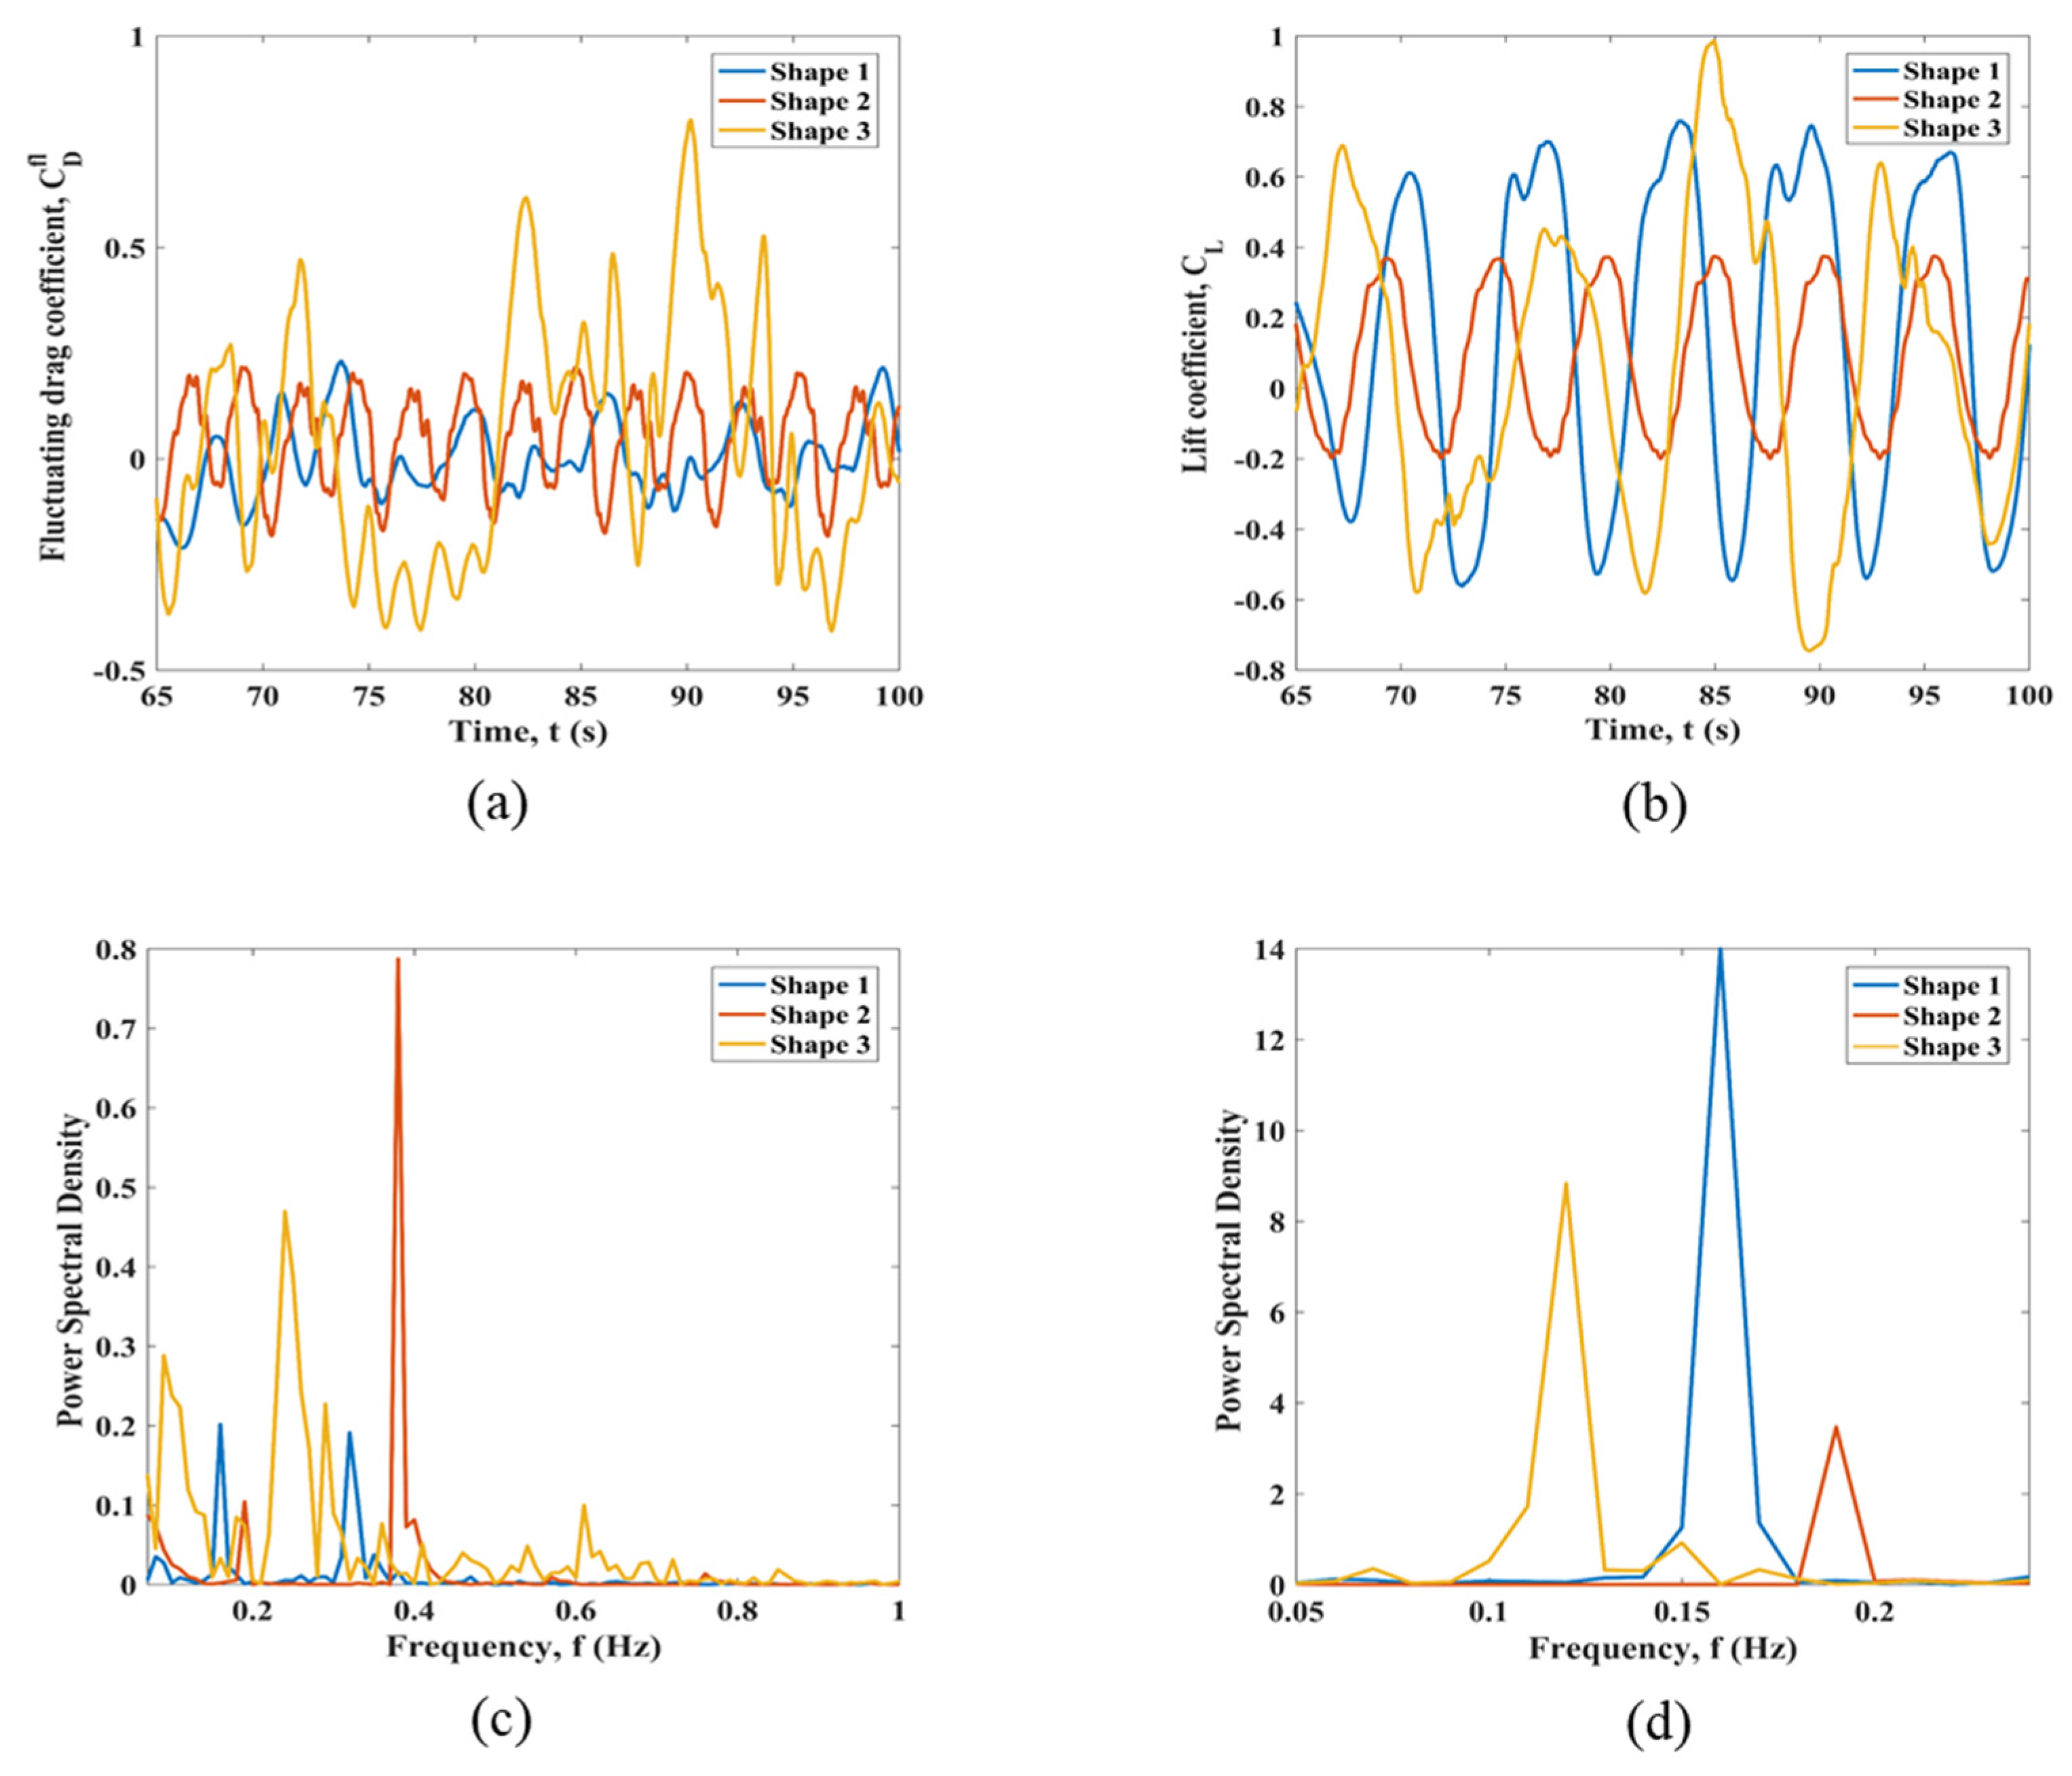
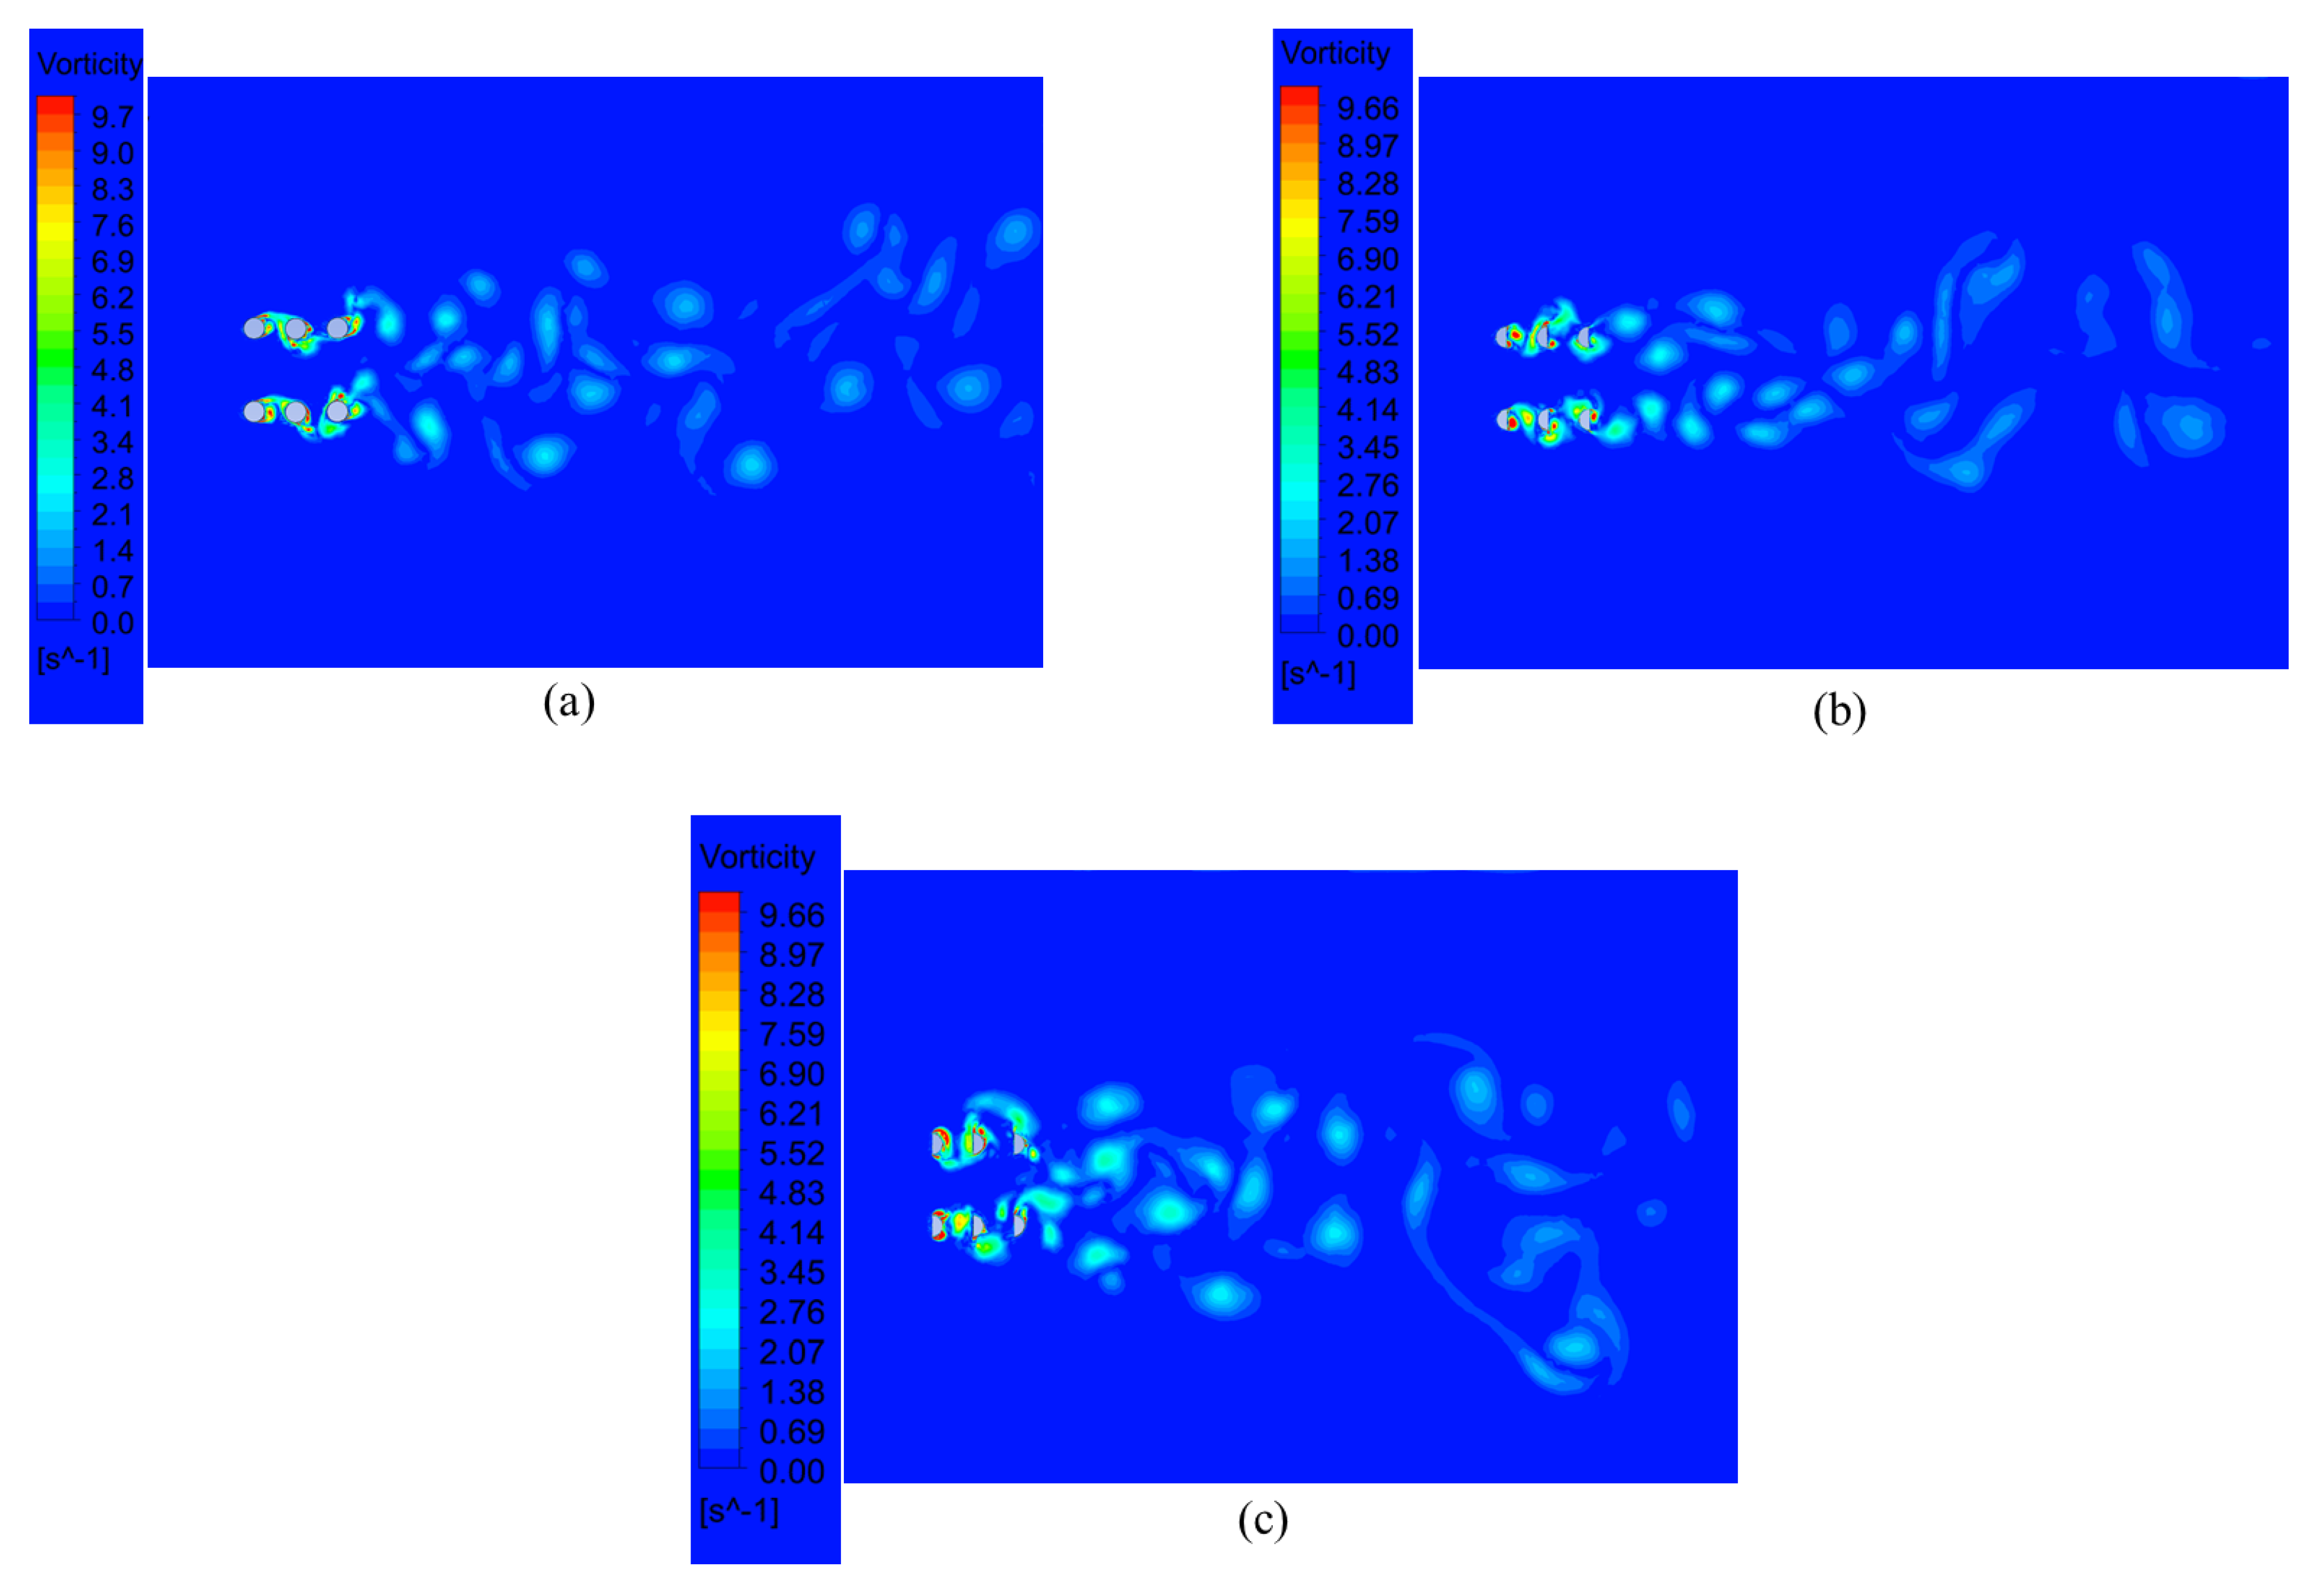
3.2. Effect of the Cross-Sectional Shape on Hydrodynamic Loads
4. Conclusions
Author Contributions
Funding
Institutional Review Board Statement
Informed Consent Statement
Data Availability Statement
Conflicts of Interest
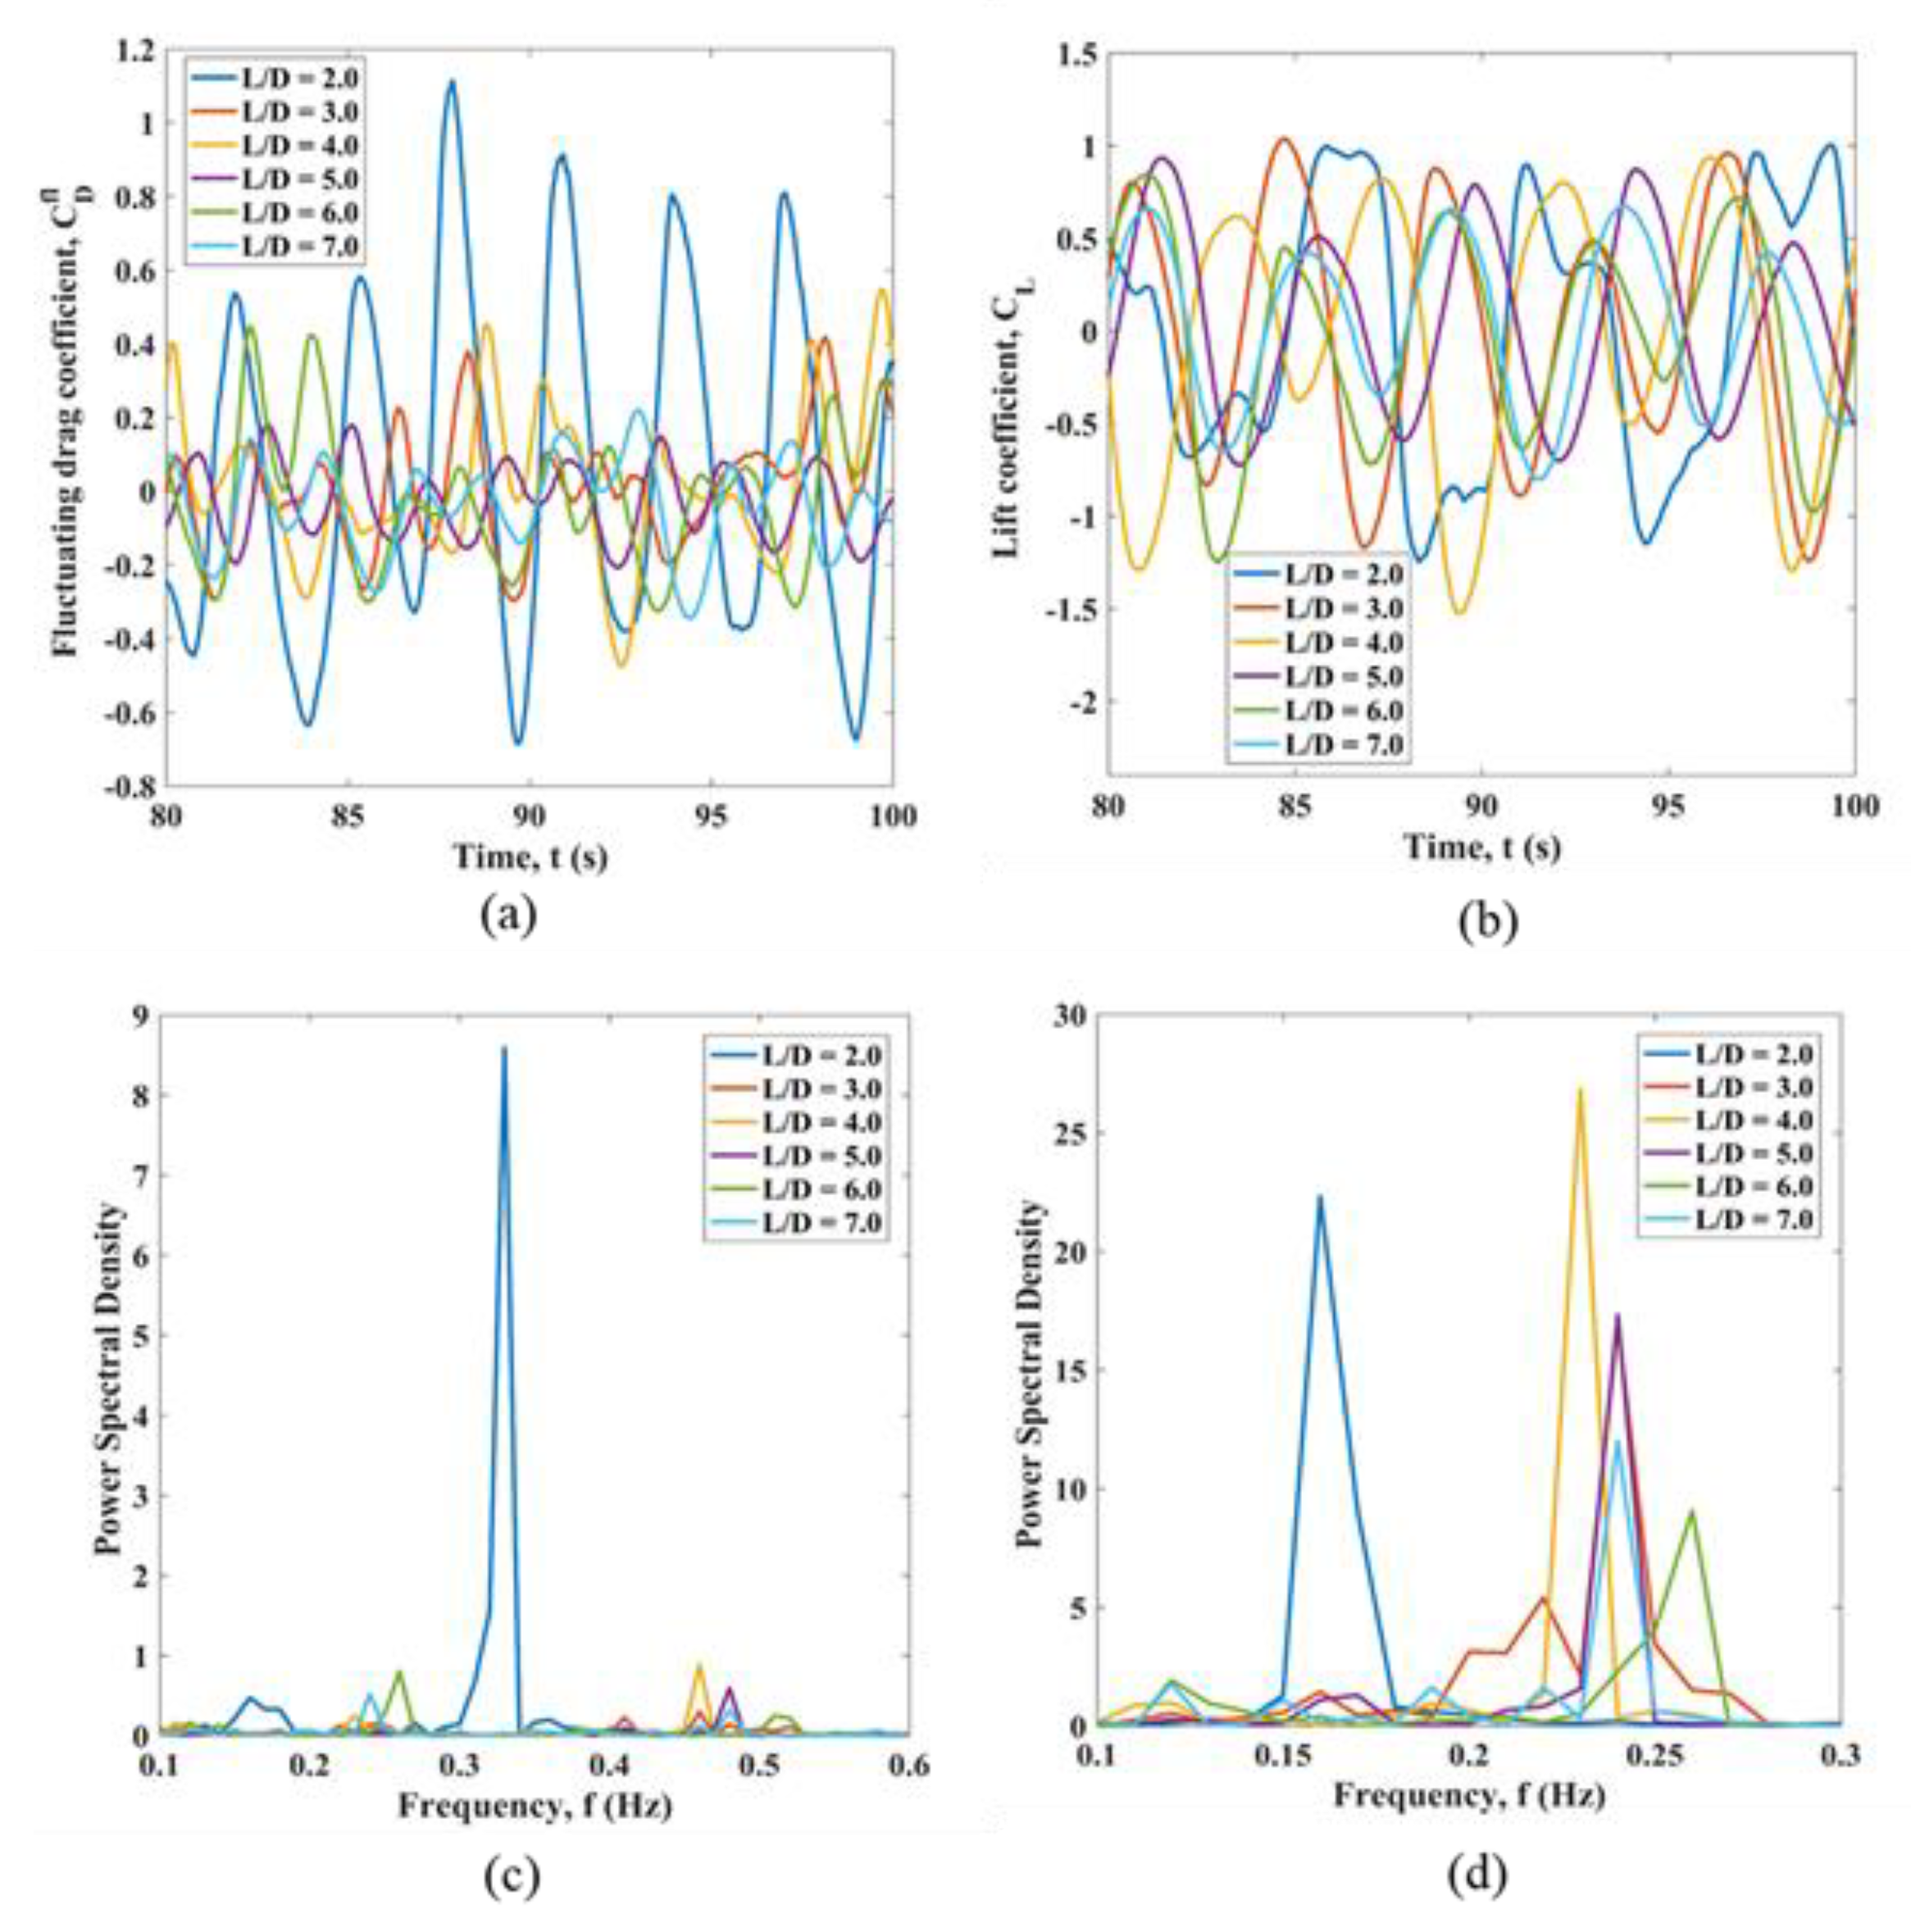
Appendix A. Parametric Study for the L/D Variation for Circular Cylinders in Uniform Flow
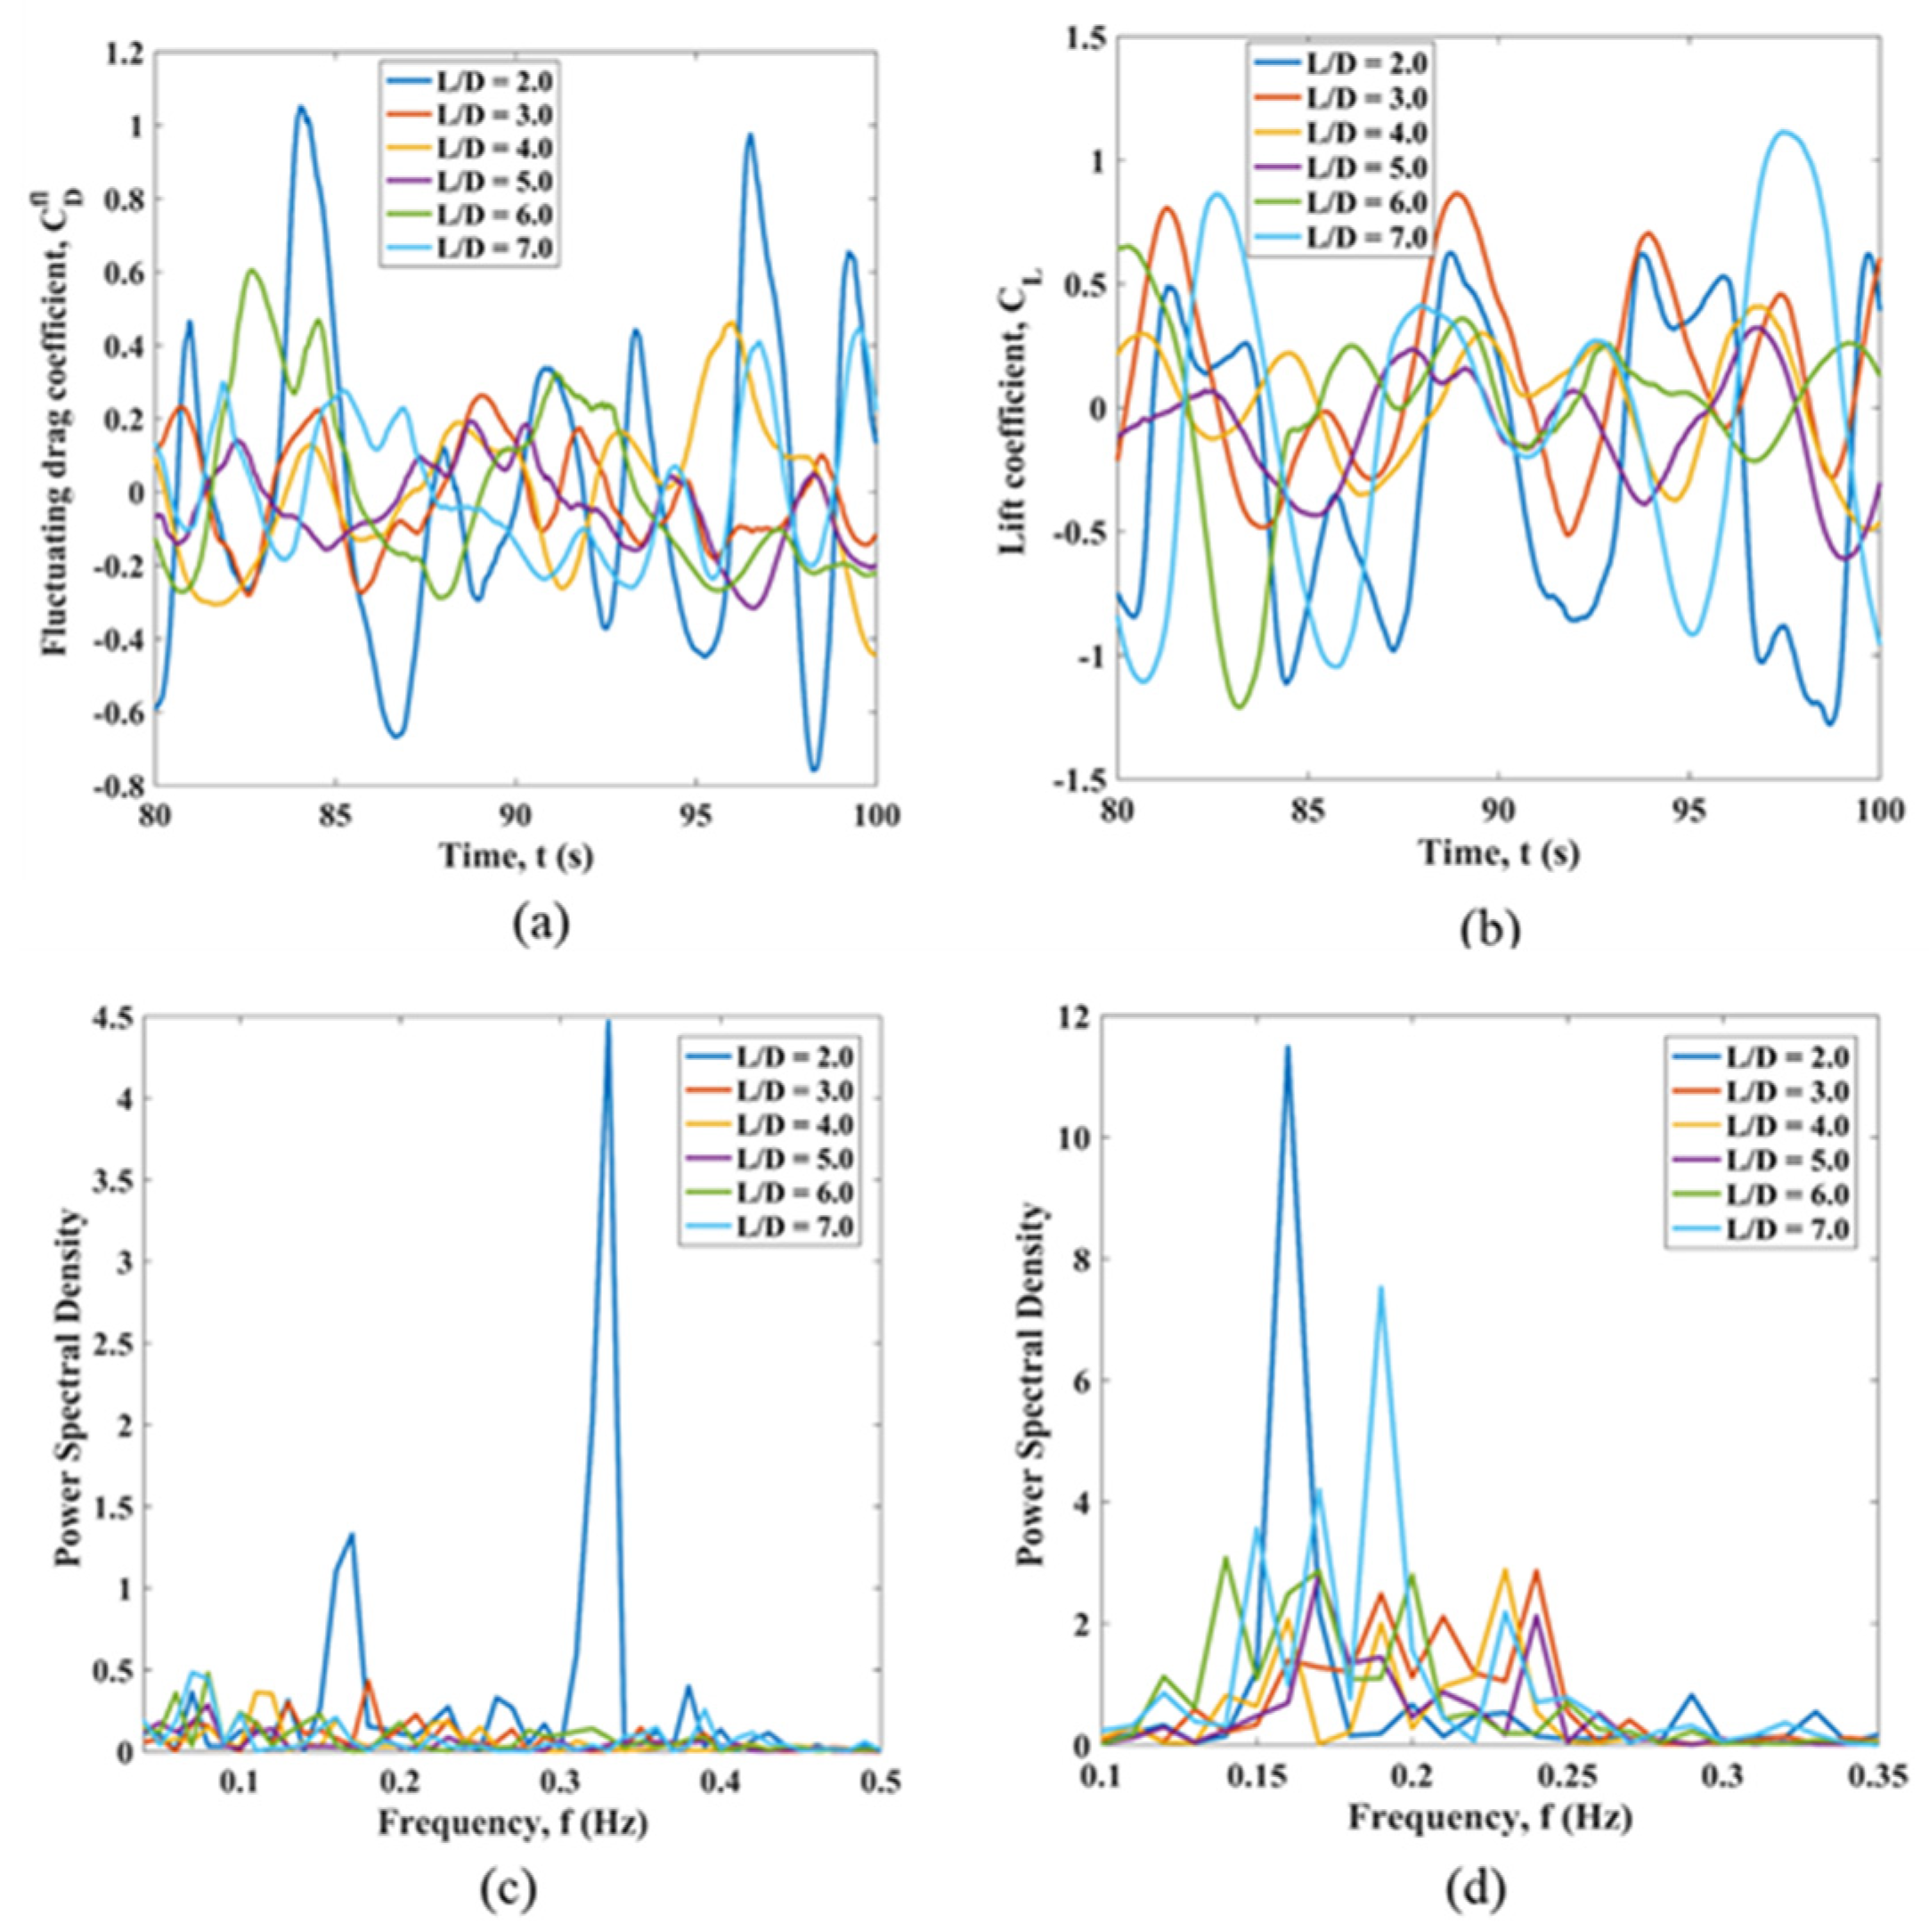

Appendix B. Parametric Study for the L/D Variation for Circular Cylinders in Planar Sheared Flow

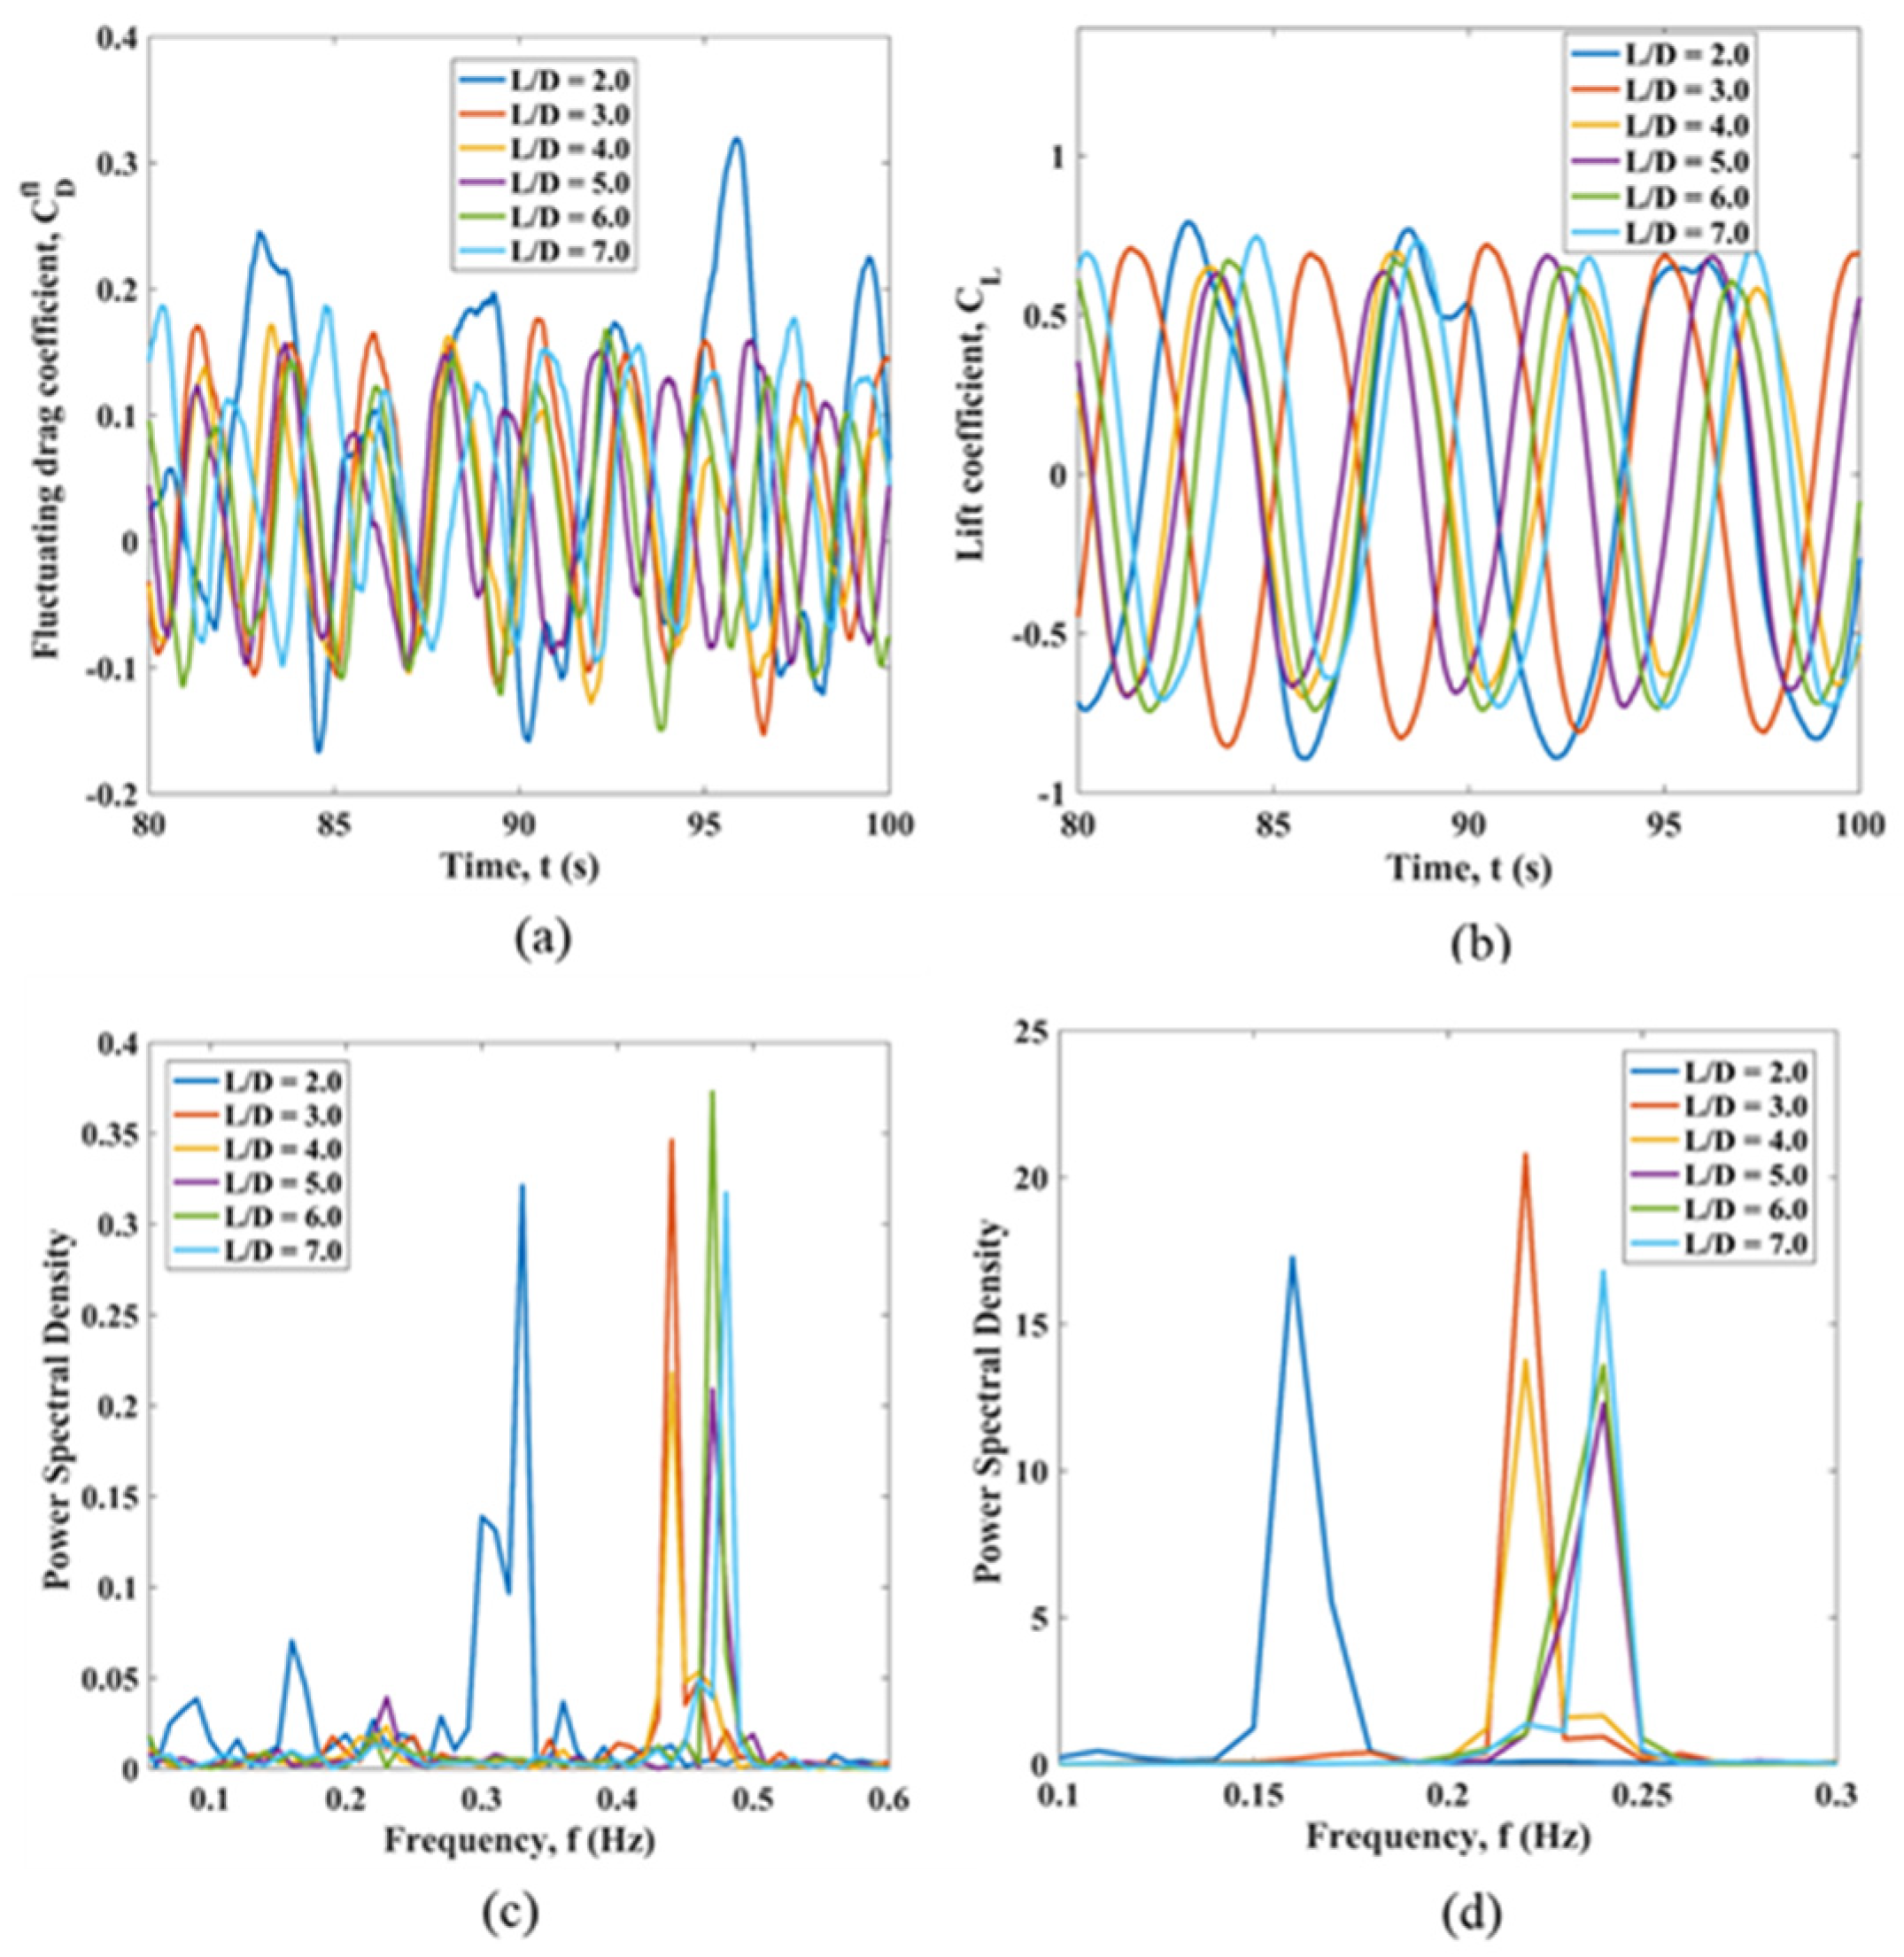
Appendix C. Parametric Study for the Variation of the Cross-Sectional Shape of Cylinders in the Uniform Flow


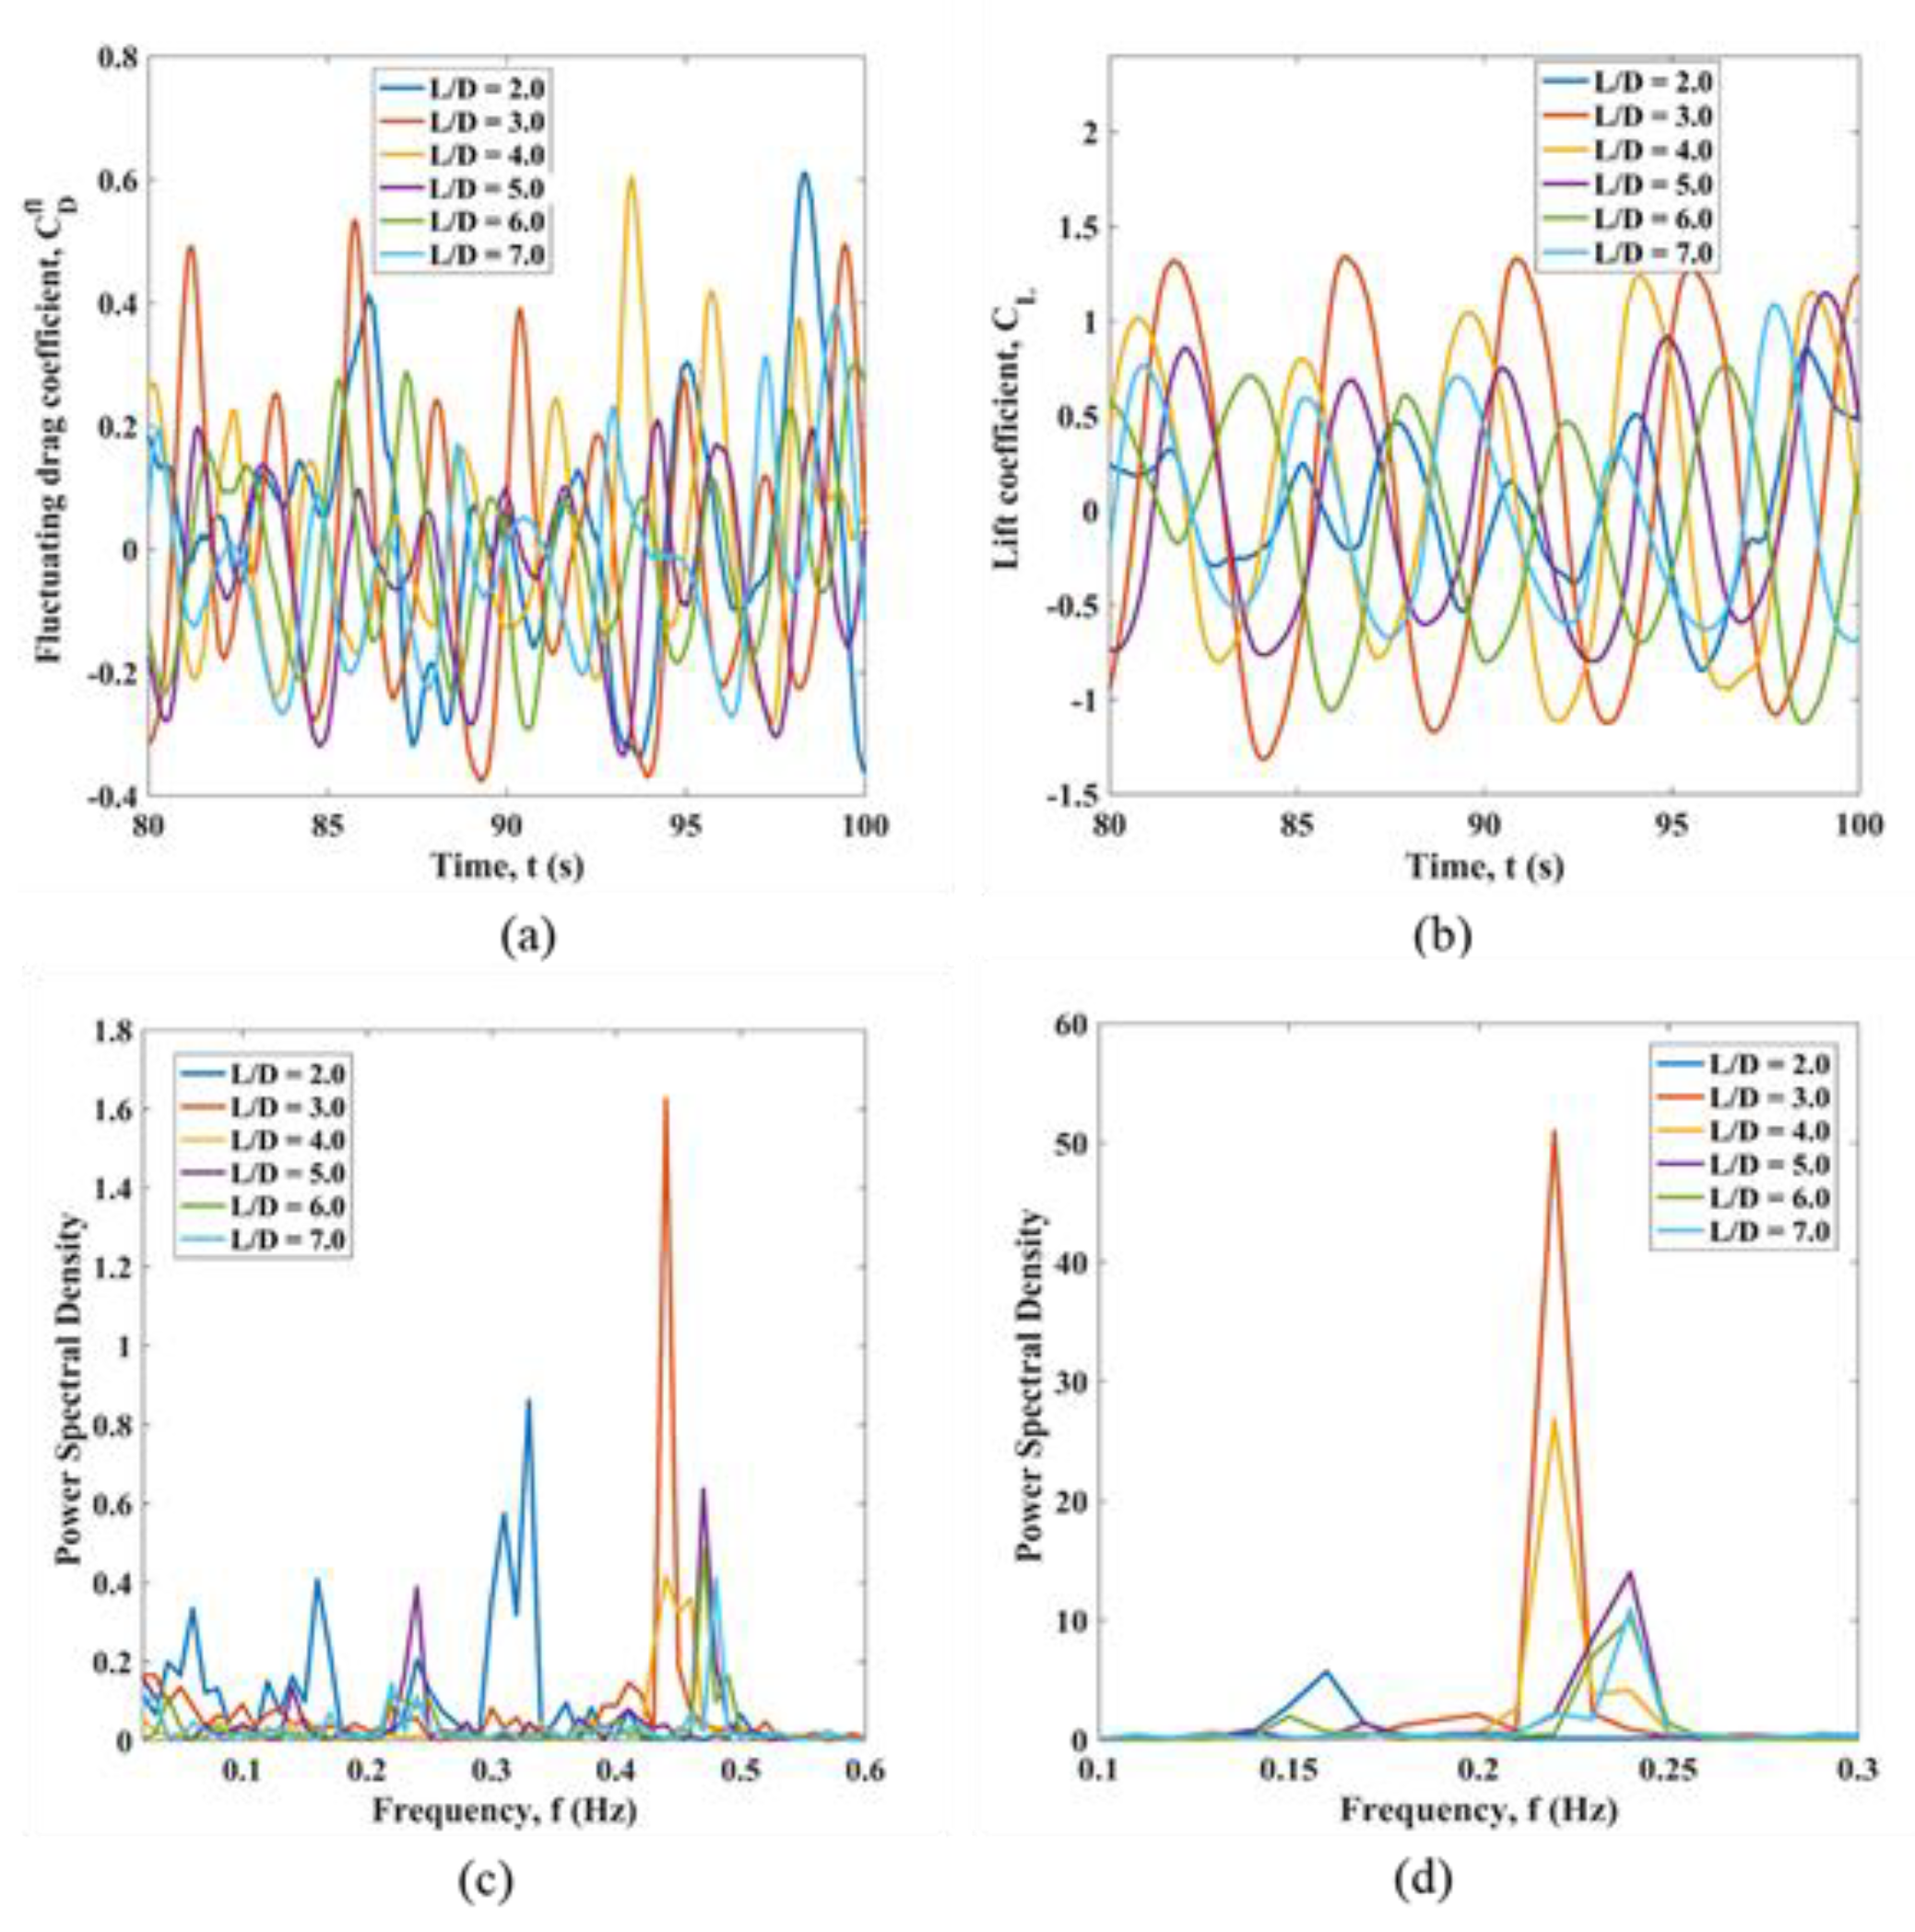
Appendix D. Parametric Study for the Variation of the Cross-Sectional Shape of Cylinders in the Planar Sheared Flow


References
- Zdravkovich, M.M. The effects of interference between circular cylinders in cross flow. J. Fluids Struct. 1987, 1, 239–261. [Google Scholar] [CrossRef]
- Assi, G.R. Mechanisms for Flow-Induced Vibration of Interfering Bluff Bodies. Ph.D. Thesis, Department of Aeronautics, Imperial College London, London, UK, 2009. [Google Scholar]
- Assi, G.R.; Bearman, P.W.; Meneghini, J.R. On the wake-induced vibration of tandem circular cylinders: The vortex interaction excitation mechanism. J. Fluid Mech. 2010, 661, 365–401. [Google Scholar] [CrossRef]
- Xu, W.; Haokai, W.; Kun, J.; Enhao, W. Numerical investigation into the effect of spacing on the flow-induced vibrations of two tandem circular cylinders at subcritical Reynolds numbers. Ocean Eng. 2021, 23, 109521. [Google Scholar] [CrossRef]
- Assi, G.D.S.; Bearman, P.W.; Carmo, B.S.; Meneghini, J.R.; Sherwin, S.J.; Willden, R.H.J. The role of wake stiffness on the wake-induced vibration of the downstream cylinder of a tandem pair. J. Fluid Mech. 2013, 718, 210–245. [Google Scholar] [CrossRef]
- Sumner, D.; Richards, M.D.; Akosile, O.O. Two staggered circular cylinders of equal diameter in cross-flow. J. Fluid. Struct. 2005, 20, 255–276. [Google Scholar] [CrossRef]
- Bearman, P.W.; Wadcock, A.J. The interaction between a pair of circular cylinders normal to a stream. J. Fluid Mech. 1973, 61, 499–511. [Google Scholar] [CrossRef]
- Zhang, H.; Melbourne, W.H. Interference between two circular cylinders in tandem in turbulent flow. J. Wind Eng. Ind. Hydrodyn. 1992, 41, 589–600. [Google Scholar] [CrossRef]
- Kitagawa, T.; Ohta, H. Numerical investigation on flow around circular cylinders in tandem arrangement at a subcritical Reynolds number. J. Fluid. Struct. 2008, 24, 680–699. [Google Scholar] [CrossRef]
- Schewe, G.; Jacobs, M. Experiments on the Flow around two tandem circular cylinders from sub-up to trans critical Reynolds numbers. J. Fluid. Struct. 2021, 88, 148–166. [Google Scholar] [CrossRef]
- Annapeh, H.F.; Kurushina, V. Numerical Simulation of Flow-Induced Forces on Subsea Structures in a Group Under Uniform and Sheared Flow. In International Conference on Wave Mechanics and Vibrations; Springer Nature: Lisboa, Portugal, 2023; pp. 512–522. [Google Scholar]
- Wang, E.; Xu, W.; Yu, Y.; Zhou, L.; Incecik, A. Flow-induced vibrations of three and four long flexible cylinders in tandem arrangement: An experimental study. Ocean Eng. 2019, 178, 170–184. [Google Scholar] [CrossRef]
- Yuhang, Z.; Rui, W.; Yaoran, C.; Yan, B.; Zhaolong, H.; Dai, Z.; Huan, P.; Shixiao, F.; Yongsheng, Z. Three-dimensional wake transition in the flow over four square cylinders at low Reynolds numbers. AIP Adv. 2020, 10, 015142. [Google Scholar]
- Xu, W.; Zhang, S.; Ma, Y.; Liu, B. Fluid forces acting on three and four long side-by-side flexible cylinders undergoing flow-induced vibration (FIV). Mar. Struct. 2021, 75, 102877. [Google Scholar] [CrossRef]
- Gao, Y.; Zhang, Y.; Zhao, M.; Wang, L. Numerical investigation on two degree-of-freedom flow-induced vibration of three tandem cylinders. Ocean Eng. 2020, 201, 107059. [Google Scholar] [CrossRef]
- Zhao, M.; Cheng, L. Numerical simulation of vortex-induced vibration of four circular cylinders in a square configuration. J. Fluid. Struct. 2012, 31, 125–140. [Google Scholar] [CrossRef]
- Han, Z.; Zhou, D.; He, T.; Tu, J.; Li, C.; Kwok, K.C.; Fang, C. Flow-induced vibrations of four circular cylinders with square arrangement at low Reynolds numbers. Ocean Eng. 2015, 96, 21–33. [Google Scholar] [CrossRef]
- Gao, Y.; Yang, K.; Zhang, B.; Cheng, K.; Chen, X. Numerical investigation on vortex-induced vibrations of four circular cylinders in a square configuration. Ocean Eng. 2019, 175, 223–240. [Google Scholar] [CrossRef]
- Gómez, H.A.; Narváez, G.F.; Schettini, E.B. Vortex induced vibration of four cylinders configurations at critical spacing in 0° and 45° flow incidence angle. Ocean Eng. 2022, 252, 111134. [Google Scholar] [CrossRef]
- Ma, Y.; Xu, W.; Liu, B. Dynamic response of three long flexible cylinders subjected to flow-induced vibration (FIV) in an equilateral-triangular configuration. Ocean Eng. 2019, 183, 187–207. [Google Scholar] [CrossRef]
- Liu, Y.; Li, P.; Wang, Y.; Chen, X.; Ren, X.; Lou, M. Dynamic response of five-riser group subjected to vortex-induced vibration in a cylindrical arrangement configuration. Ocean Eng. 2022, 254, 111271. [Google Scholar] [CrossRef]
- Silva-Ortega, M.; Assi, G.R.S. Flow-induced vibration of a circular cylinder surrounded by two, four and eight wake-control cylinders. Exp. Therm. Fluid Sci. 2017, 85, 354–362. [Google Scholar] [CrossRef]
- Assi, G.R.D.S.; Orselli, R.M.; Silva-Ortega, M. Control of vortex shedding from a circular cylinder surrounded by eight rotating wake-control cylinders at Re = 100. J. Fluid. Struct. 2019, 89, 13–24. [Google Scholar] [CrossRef]
- Cicolin, M.M.; Assi, G.R.D.S. Experiments with flexible shrouds to reduce the vortex-induced vibration of a cylinder with low mass and damping. Appl. Ocean Res. 2017, 65, 290–301. [Google Scholar] [CrossRef]
- Assi, G.R.; Crespi, T.; Gharib, M. Novel geometries of serrated helical strakes to suppress vortex-induced vibrations and reduce drag. Appl. Ocean Res. 2022, 120, 103034. [Google Scholar] [CrossRef]
- Gao, Y.; Chen, W.; Wang, B. Numerical simulation of the flow past six-circular cylinders in rectangular configurations. J. Mar. Sci. Technol. 2020, 25, 718–742. [Google Scholar] [CrossRef]
- Arionfard, H.; Mohammadi, S. Numerical Investigation of the Geometrical Effect on Flow-Induced Vibration Performance of Pivoted Bodies. Energies 2021, 14, 1128. [Google Scholar] [CrossRef]
- Wang, Y.-T.; Zhong-min, W.Y.; Hui-min, W. Numerical simulation of low-Reynolds number flows past two tandem cylinders of different diameters. Water Sci. Eng. 2013, 6, 433–445. [Google Scholar]
- Assi, G.R. Wake-induced vibration of tandem cylinders of different diameters. J. Fluid. Struct. 2014, 50, 329–339. [Google Scholar] [CrossRef]
- Zhao, J.; Thompson, M.C.; Hourigan, K. Flow-induced vibration of a D-shape cylinder. In Proceedings of the European Nonlinear Dynamics Conference, Budapest, Hungary, 25–30 June 2017. [Google Scholar]
- Assi, G.R.; Bearman, P.W. Vortex-induced vibration of a wavy elliptic cylinder. J. Fluid. Struct. 2018, 80, 1–21. [Google Scholar] [CrossRef]
- Srinil, N. Analysis and prediction of vortex-induced vibrations of variable-tension vertical risers in linearly sheared currents. Appl. Ocean Res. 2022, 33, 41–53. [Google Scholar] [CrossRef]
- Lei, C.; Cheng, L.; Kavanagh, K. A finite difference solution of the shear flow over a circular cylinder. Ocean Eng. 2000, 27, 271–290. [Google Scholar] [CrossRef]
- Wu, T.; Chen, C.-F. Laminar boundary-layer separation over a circular cylinder in uniform shear flow. Acta Mech. 2000, 144, 71–82. [Google Scholar] [CrossRef]
- Sumner, D.; Akosile, O.O. On uniform planar shear flow around a circular cylinder at subcritical Reynolds number. J Fluid. Struct. 2003, 18, 441–454. [Google Scholar] [CrossRef]
- Kang, S. Uniform-shear flow over a circular cylinder at low Reynolds numbers. J. Fluid. Struct. 2006, 22, 541–555. [Google Scholar] [CrossRef]
- Shuyang, C.; Shigehira, O.; Yukio, T.; Yaojun, G.; Hironori, K. Numerical simulation of Reynolds number effects on velocity shear flow around a circular cylinder. J. Fluid. Struct. 2010, 26, 685–702. [Google Scholar]
- Postnikov, A.; Pavlovskaia, E.; Wiercigroch, M. 2DOF CFD calibrated wake oscillator model to investigate vortex-induced vibrations. Int. J. Mech. Sci. 2017, 127, 176–190. [Google Scholar] [CrossRef]
- Nisham, A.; Terziev, M.; Tezdogan, T.; Beard, T.; Incecik, A. Prediction of the aerodynamic behaviour of a full-scale naval ship in head waves using Detached Eddy Simulation. Ocean Eng. 2021, 222, 108583. [Google Scholar] [CrossRef]
- Lehmkuhl, O.; Rodriguez, I.; Borrell, R.; Chiva, J.; Oliva, A. Unsteady forces on a circular cylinder at critical Reynolds number. Phys. Fluids 2014, 12, 125110. [Google Scholar] [CrossRef]
- Achenbach, E.; Heinecke, E. On vortex shedding from smooth and rough cylinders in 33 Forces on a circular cylinder at critical Reynolds. J. Fluid Mech. 1981, 109, 239–251. [Google Scholar] [CrossRef]
- Schewe, G. On the force fluctuations acting on a circular cylinder in cross-flow from subcritical up to transcritical Reynolds numbers. J. Fluid Mech. 1983, 133, 265–285. [Google Scholar] [CrossRef]
- Porteous, A.; Habbit, R.; Colmenares, J.; Poroseva, S.; Murman, S.M. Simulations of incompressible separated turbulent flows around two-dimensional bodies with URANS models in OpenFOAM. In Proceedings of the 22nd AIAA Computational Fluid Dynamics Conference 2015, Dallas, TX, USA, 22–26 June 2015. [Google Scholar]
- Nazvanova, A.; Yin, G.; Ong, M.C. Numerical Investigation of Flow around Two Tandem Cylinders in the Upper Transition Reynolds Number Regime Using Modal Analysis. J. Mar. Sci. Eng. 2022, 10, 1501. [Google Scholar] [CrossRef]


| Re = 2.5 × 10⁵ | |||
|---|---|---|---|
| Cases | CD0 | Number of Cells | Strouhal Number |
| Current Study | |||
| Mesh 1 | 0.99 | 60,133 | 0.24 |
| Mesh 2 | 1.09 | 85,227 | 0.24 |
| Mesh 3 | 1.09 | 122,091 | 0.24 |
| Published data | |||
| Lehmkuhl et al. (2014) (LES) [40] | 0.833 | - | 0.238 |
| Achenbach&Heinecke (1981) (Experiment) [41] | 1.135 | - | 0.23 |
| Schewe (1983) (Experiment) [42] | 1.120 | - | 0.20 |
| Re = 100 | |||
| Current study | 1.41 | 85,227 | 0.183 |
| Gao et al. (2020) [26] | 1.375 | 28,100 | 0.166 |
| Re = 3.6 × 10⁶ | |||
| Current study | 0.45 | 85,227 | |
| Porteous et al. (2015) [43] | 0.4206 | - | |
| Nazvanova et al. (2022) [44] | 0.4657 | 74,496 | |
| L/D | C1 | C2 | C3 | C4 | C5 | C6 | ||||||||||||
|---|---|---|---|---|---|---|---|---|---|---|---|---|---|---|---|---|---|---|
| Uniform Flow | ||||||||||||||||||
| 2 | 0.7 | 0.31 | 0.90 | 0.28 | 1.12 | 1.2 | 0.41 | 1.29 | 1.5 | 0.64 | 0.32 | 0.89 | 0.21 | 0.89 | 1.1 | 0.41 | 1.14 | 1.2 |
| 3 | 0.51 | 0.18 | 0.84 | 0.14 | 0.71 | 1.5 | 0.17 | 0.56 | 1.1 | 0.51 | 0.20 | 0.84 | 0.19 | 1.0 | 1.4 | 0.13 | 0.70 | 1.3 |
| 4 | 0.5 | 0.17 | 0.76 | 0.2 | 0.55 | 1.5 | 0.2 | 0.8 | 1.4 | 0.5 | 0.18 | 0.68 | 0.18 | 0.60 | 1.3 | 0.18 | 0.30 | 1.1 |
| 5 | 0.53 | 0.18 | 0.8 | 0.19 | 0.39 | 1.0 | 0.28 | 0.64 | 0.9 | 0.5 | 0.17 | 0.72 | 0.23 | 0.65 | 1.3 | 0.28 | 0.66 | 1.3 |
| 6 | 0.54 | 0.17 | 0.79 | 0.23 | 0.47 | 1.2 | 0.3 | 0.60 | 1.0 | 0.53 | 0.18 | 0.76 | 0.2 | 0.50 | 1.2 | 0.31 | 0.69 | 1.2 |
| 7 | 0.50 | 0.17 | 0.63 | 0.24 | 0.48 | 1.0 | 0.31 | 0.80 | 1.4 | 0.51 | 0.19 | 0.76 | 0.26 | 0.41 | 1.2 | 0.28 | 0.65 | 1.2 |
| Planar Sheared Flow | ||||||||||||||||||
| 2 | 0.43 | 0.23 | 0.76 | 0.28 | 1.0 | 1.42 | 0.29 | 1.34 | 1.57 | 0.49 | 0.19 | 0.8 | 0.29 | 0.90 | 1.28 | 0.28 | 0.94 | 1.4 |
| 3 | 0.47 | 0.19 | 0.77 | 0.15 | 0.60 | 1.34 | 0.18 | 0.50 | 1.5 | 0.55 | 0.18 | 0.9 | 0.16 | 1.0 | 1.64 | 0.13 | 0.38 | 1.0 |
| 4 | 0.47 | 0.18 | 0.71 | 0.21 | 0.50 | 1.29 | 0.22 | 0.68 | 1.33 | 0.52 | 0.19 | 0.76 | 0.19 | 0.60 | 1.31 | 0.18 | 0.46 | 0.9 |
| 5 | 0.49 | 0.15 | 0.8 | 0.16 | 0.29 | 1.15 | 0.23 | 0.60 | 0.73 | 0.53 | 0.19 | 0.78 | 0.24 | 0.50 | 1.48 | 0.31 | 0.56 | 1.1 |
| 6 | 0.50 | 0.15 | 0.75 | 0.25 | 0.50 | 1.18 | 0.30 | 0.63 | 1.03 | 0.55 | 0.19 | 0.89 | 0.21 | 0.41 | 1.20 | 0.32 | 0.73 | 1.2 |
| 7 | 0.47 | 0.15 | 0.66 | 0.27 | 0.43 | 1.18 | 0.26 | 0.74 | 1.03 | 0.55 | 0.19 | 0.82 | 0.25 | 0.42 | 1.32 | 0.29 | 0.63 | 1.1 |
| Flow Types | Mean Drag Coefficient, CD0 | |||||
|---|---|---|---|---|---|---|
| C1 | C2 | C3 | C4 | C5 | C6 | |
| Shape 1 | ||||||
| Uniform | 0.7 | 0.28 | 0.41 | 0.64 | 0.21 | 0.41 |
| Planar sheared | 0.43 | 0.28 | 0.29 | 0.49 | 0.29 | 0.28 |
| Shape 2 | ||||||
| Uniform | 0.86 | 0.0034 | 0.028 | 0.88 | 0.02 | 0.17 |
| Planar sheared | 0.82 | −0.015 | 0.035 | 0.97 | −0.017 | 0.18 |
| Shape 3 | ||||||
| Uniform | 1.45 | 0.14 | 0.52 | 1.44 | 0.08 | 0.66 |
| Planar sheared | 1.31 | 0.2 | 0.73 | 1.54 | 0.14 | 0.55 |
Disclaimer/Publisher’s Note: The statements, opinions and data contained in all publications are solely those of the individual author(s) and contributor(s) and not of MDPI and/or the editor(s). MDPI and/or the editor(s) disclaim responsibility for any injury to people or property resulting from any ideas, methods, instructions or products referred to in the content. |
© 2023 by the authors. Licensee MDPI, Basel, Switzerland. This article is an open access article distributed under the terms and conditions of the Creative Commons Attribution (CC BY) license (https://creativecommons.org/licenses/by/4.0/).
Share and Cite
Annapeh, H.F.; Kurushina, V. Hydrodynamic Loads on a Group of Six Structures of Different Cross-Sections in Uniform and Sheared Flow. J. Mar. Sci. Eng. 2023, 11, 383. https://doi.org/10.3390/jmse11020383
Annapeh HF, Kurushina V. Hydrodynamic Loads on a Group of Six Structures of Different Cross-Sections in Uniform and Sheared Flow. Journal of Marine Science and Engineering. 2023; 11(2):383. https://doi.org/10.3390/jmse11020383
Chicago/Turabian StyleAnnapeh, Henry Francis, and Victoria Kurushina. 2023. "Hydrodynamic Loads on a Group of Six Structures of Different Cross-Sections in Uniform and Sheared Flow" Journal of Marine Science and Engineering 11, no. 2: 383. https://doi.org/10.3390/jmse11020383
APA StyleAnnapeh, H. F., & Kurushina, V. (2023). Hydrodynamic Loads on a Group of Six Structures of Different Cross-Sections in Uniform and Sheared Flow. Journal of Marine Science and Engineering, 11(2), 383. https://doi.org/10.3390/jmse11020383