Article

Open Sea Lab: An integrated Coastal Ocean Observatory Powered by Wave Energy

1
Marine Energy Research and Innovation Center (MERIC), Av. Josemaría Escrivá de Balaguer 13105, of. 1011, Lo Barnechea, Santiago 7690000, Chile
2
Hydraulic and Environmental Engineering Department, Pontificia Universidad Católica de Chile, Av. Vicuña Mackenna 4860, Santiago 7820436, Chile
3
Coastal Marine Research Station (ECIM), Pontificia Universidad Católica de Chile, Osvaldo Marin 1672, Las Cruces 2690000, Chile
4
Institute of Naval Architecture and Ocean Engineering, Universidad Austral de Chile, General Lagos 2086, Campus Miraflores, Valdivia 5111187, Chile
5
Enel Green Power Chile, Av. Santa Rosa 76, Santiago 8330099, Chile
*
Author to whom correspondence should be addressed.
J. Mar. Sci. Eng. 2022, 10(9), 1249; https://doi.org/10.3390/jmse10091249
Submission received: 11 August 2022 / Revised: 25 August 2022 / Accepted: 26 August 2022 / Published: 5 September 2022
(This article belongs to the Special Issue Wave, Tidal and Offshore Wind Energy Site Assessment and Monitoring)

Abstract

:
Current advances in wave energy technologies have enabled the development of new integrated measurement platforms powered by the energy of wave motion. Instrumentation is now being deployed for the long-term observation of the coastal ocean, with the objectives of analyzing the performance of wave energy converters (WECs) and studying their interactions with the surrounding environment and marine life. In this work, we present the most relevant findings of the installation and initial operation of the Open Sea Lab (OSL), the first coastal observatory in Latin America powered entirely by a WEC device. We evaluated the preliminary data regarding the combined operation of the system, the generation of energy, and the observations obtained by the continuous monitoring of physical variables at the site. The data showed the seasonal variability of the energy produced by the WEC for a range of wave heights during the period of observation. We also investigated the rapid development of biofouling on mooring lines, junction boxes, and other parts of the system, which is characteristic of the settlement and growth of organisms in this ocean region. These analyses show how this new facility will advance our understanding of the coastal environment in the south Pacific Ocean and foster new interdisciplinary collaborations addressing environmental and technical challenges, thereby contributing to the development of wave energy on the continent.

1. Introduction

The 4000 km latitudinal breadth of the Chilean coast along the southeastern Pacific Ocean has significant wave energy potential, reaching values of up to 100 kW/m, and has been recognized as a region with one of the largest reserves of resources in the world [1,2,3]. Central Chile also has a unique strategic importance and scientific priority for the installation of wave energy technologies, with 76% of the population of the country living close to the coast near abundant marine energy resources. However, the region also presents challenges due to increasing human activities in the nearshore environment and the limited availability of high-resolution physicochemical information on these dynamic coastal environments. Improving our understanding of coastal processes and how they are transformed by climate change is therefore a critical issue to advance the development of marine renewable energies and maritime industries on the coast of Chile and in Latin America.
Motivated by these advantages, the Marine Energy Research and Innovation Center (MERIC) in Chile, a partnership between academia, state funding institutions (CORFO-ANID), and private industry (Enel Green Power), has recently deployed a complete coastal ocean observation system in the south Pacific Ocean, the first one with these characteristics in the continent, powered entirely by wave energy. The Open Sea Lab (OSL) was installed in April 2021 in front of the Coastal Marine Station, Estación Costera de Investigaciones Marinas (ECIM) of the Pontificia Universidad Católica de Chile (PUC) at Las Cruces, in central Chile (Lat: 30°30′ S). The OSL consists of an oceanographic wave-energy-generating buoy associated with the PUC laboratories in ECIM and Santiago and the laboratories of the Universidad Austral in Valdivia. The buoy platform is powered by a PB3 PowerBuoy® [4] point absorber from Ocean Power Technologies, which provides a continuous energy supply to multiple instruments and generates critical data for studying the interactions between wave energy generation and the physical and ecological processes of the coastal environments in central Chile. In this context of an increasing need for ocean information to support technological development, significant international efforts have been carried out to install integrated ocean observation systems, such as the Coastal Ocean Nearshore Observation System in France (ILICO) [5] or the National Operational Wave Observation System in the US [6]. Other facilities are directly related to the development of marine energies, such as the French Wave Energy Test Site SEM-REV [7], the Hawai’i National Marine Renewable Energy Center (HINMREC) [8], the European Marine Energy Centre (EMEC) [9], and the Pacific Marine Energy Center (PMEC) [10], among others. The OSL without a doubt plays a key role in the international efforts for the development of integrated ocean observation and marine energy, contributing to addressing key questions for the industry and scientific community concerning this type of technology in this particular region in terms of biofouling, corrosion, energy production, reliability, operation and maintenance, and social acceptability. The region of the south Pacific Ocean is a natural laboratory, as a site that combines critical environmental, social, economic, and technical challenges that will be necessary to address for the successful development of marine energy installations.
Using the instruments installed on the OSL platform, measurements are conducted in real time to investigate wave characteristics, flow circulation, and hydrographic patterns in Cartagena Bay. Two CTDOs, fluorometers, and pH and pressure turbidity sensors are deployed at two different depths, and tension sensors are installed on mooring lines. The system also incorporates a bottom-anchored ADCP that measures current velocities at five depth bands and surface waves. The platform is coupled to an onshore meteorological station and an X-band radar at ECIM, which provides additional data on surface waves and flow circulation for the bay. After standardization and validation, the data will be open and available to the scientific community to support research on wave energy; wave forecasting; beach erosion; marine corrosion; biofouling; and larval, particle, and chemical transport, among other topics. The OSL will also be available for educational purposes and to study the social and economic aspects of the development of marine energy projects in Latin America.
The objective of this manuscript is to present an overview of the new OSL, the challenges associated with its installation, and the auxiliary components of the in situ instrumentation and to discuss the potential of the platform to trigger interdisciplinary oceanographic and applied research and education in coastal marine sciences and marine energy on the southern Pacific Ocean.

2. Materials and Methods

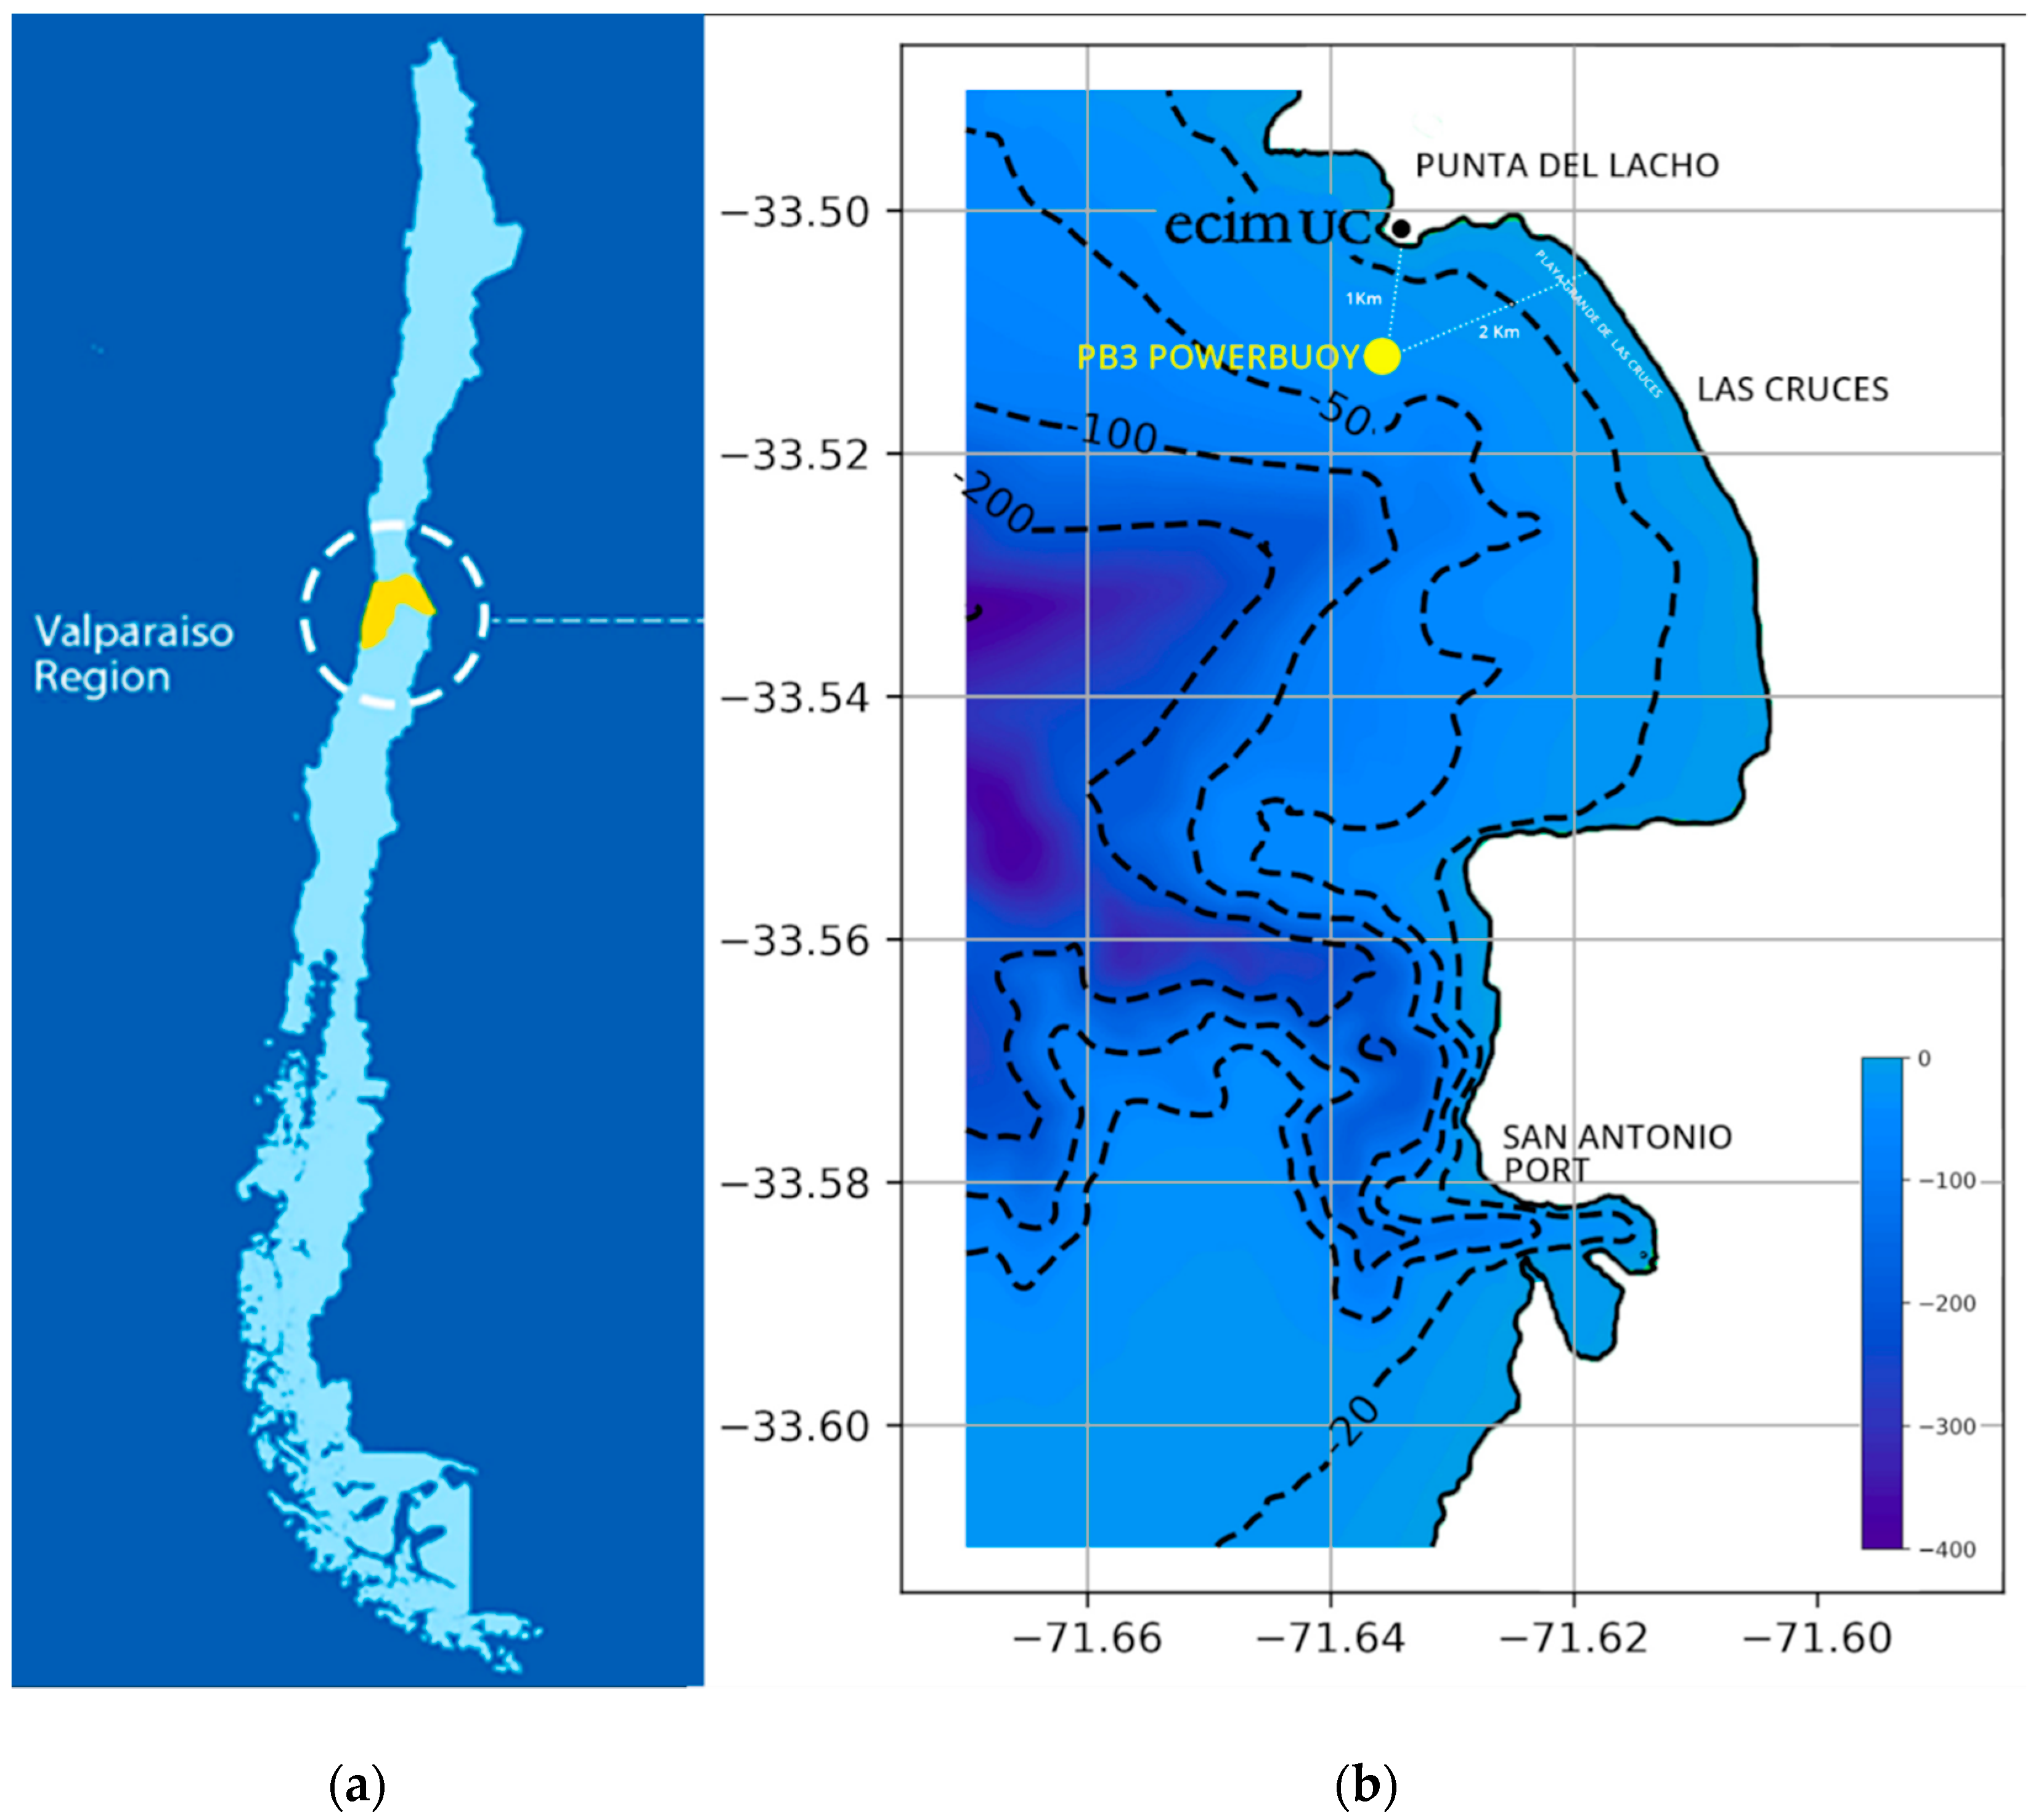
2.1. Location and Site Description
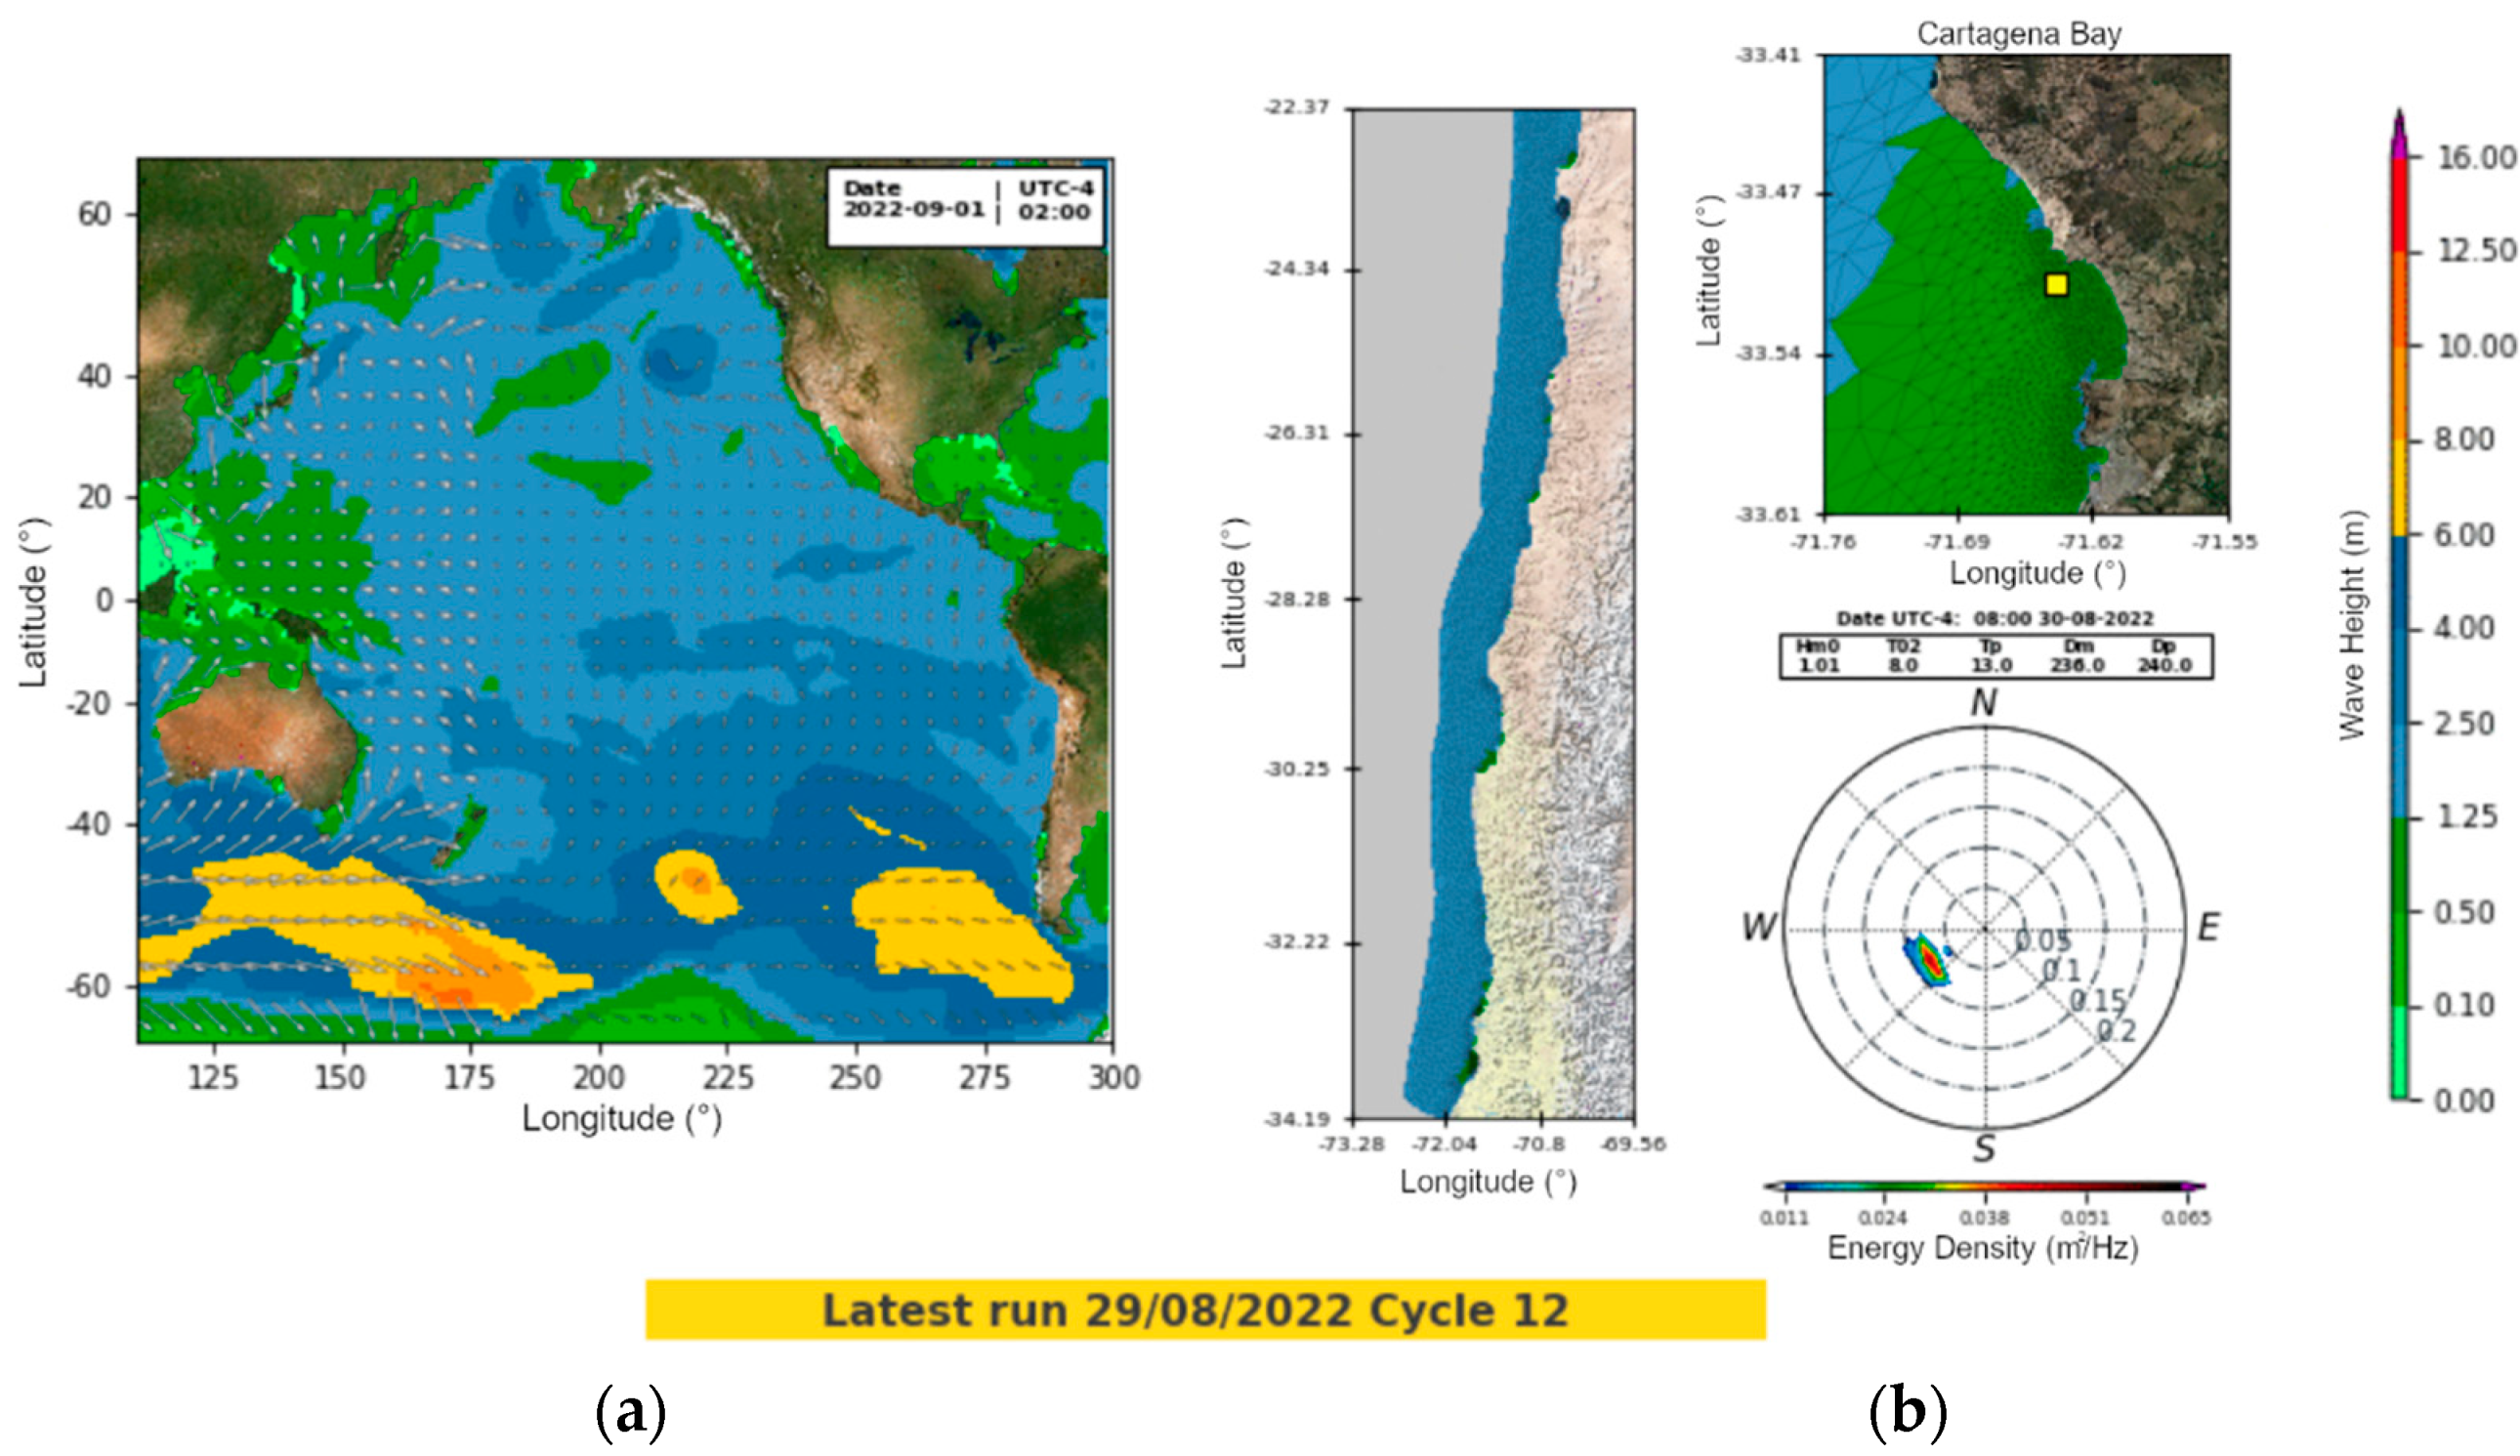
The project is located on the central coast of Chile, in the bay of Las Cruces (Lat. 30°30′ S), at a distance of 1 km from the Punta del Lacho Marine Reserve and 2 km from Las Cruces beach (Figure 1). This location was chosen because of its unique characteristics: It is located close to the ECIM marine station of the Pontificia Universidad Católica de Chile, a research center for coastal ecology with nearly 40 years of experience in applied research that has been a hub for recent investigations on biofouling and corrosion in marine energy systems. The site is less than 11 km from the largest commercial port in Chile, the port of San Antonio, and only 130 km from the capital, Santiago. Notably, ECIM has stewardship of one of the oldest marine protected areas in the southeastern Pacific Ocean.
The head of the San Antonio submarine canyon, south of the Cartagena Bay, connects to the Maipo River [11], the most important river for the country’s economy [12], which has a complex interaction with the coast [13,14]. Cartagena Bay has a southwest orientation with isobaths of the seabed that are fairly parallel to the shoreline, up to 50 m depth, where we observe a small canyon that connects with the deep San Antonio canyon, which can reach depths of over 500 m within few kilometers from shore (Figure 1).
Regarding the sea-state conditions, over 80% of the waves have a southwest direction (220–240°), which are common conditions in the coast of Chile, with significant wave heights between 1 and 2 m and a peak period range of 11 to 18 s ([15]). Recent investigations have shown that the median wave power is 15 kW/m, with a wave power over 7 kW/m 90% of the time [16]. The monthly median wave power, on the other hand, presents a maximum of 20 kW/m with no significant monthly variations, as shown in Figure 2. The location of the OSL in Las Cruces presents a low seasonal variability of wave conditions, with differences of about 20–30% between the median and maximum wave power [16], indicating favorable conditions for the installation of wave energy converters (WECs).
Experimental studies at this same location have also shown that these high-energy wave-exposed environments harbor a high diversity of sessile biofouling species that rapidly grow on all hard surfaces deployed at sea, and the high productivity of the Humboldt upwelling ecosystem renders some of the highest biomass accumulation rates reported anywhere in the world [17]. Species with a large body size that are highly adapted to rough weather conditions can resist wave impacts and associated shear stresses and cause mechanical failure or impairment in a range of new and existing technologies [18]. These ecological characteristics therefore pose major challenges for the successful operation of wave energy converters and most maritime industries, as well as for the implementation of long-term instrumental observations. The PB3 WEC will therefore accelerate the research needed to find environmentally sound ways to control the biofouling problem. The highly corrosive environment also poses a major threat to long-term instrument deployment and integrity of buoys and technologies; therefore, it must be considered as part of the research design [18].

2.2. Modelling

The implementation of the OSL started with the development of a high-resolution wave forecast and hindcast system using the WaveWatch III model [19], which is currently operational and running for Cartagena Bay (forecast website, Figure 3). The WaveWatch III model is configured to run 4 cycles per day and yields a 7-day forecast of wave conditions as directional power density spectra every hour, using the wind and ice concentration input data from CFSR v2 [20] and a bathymetry with a combined source from GEBCO, nautical charts, and a special survey carried out for this project. In addition to this wave forecast system, the tide predictions are implemented using ADCIRC model [21], which integrates astronomical constituent and atmospheric information (CFSR v2 [20]). This additional forecast also runs 4 cycles per day and yields a 7-day hourly forecast.

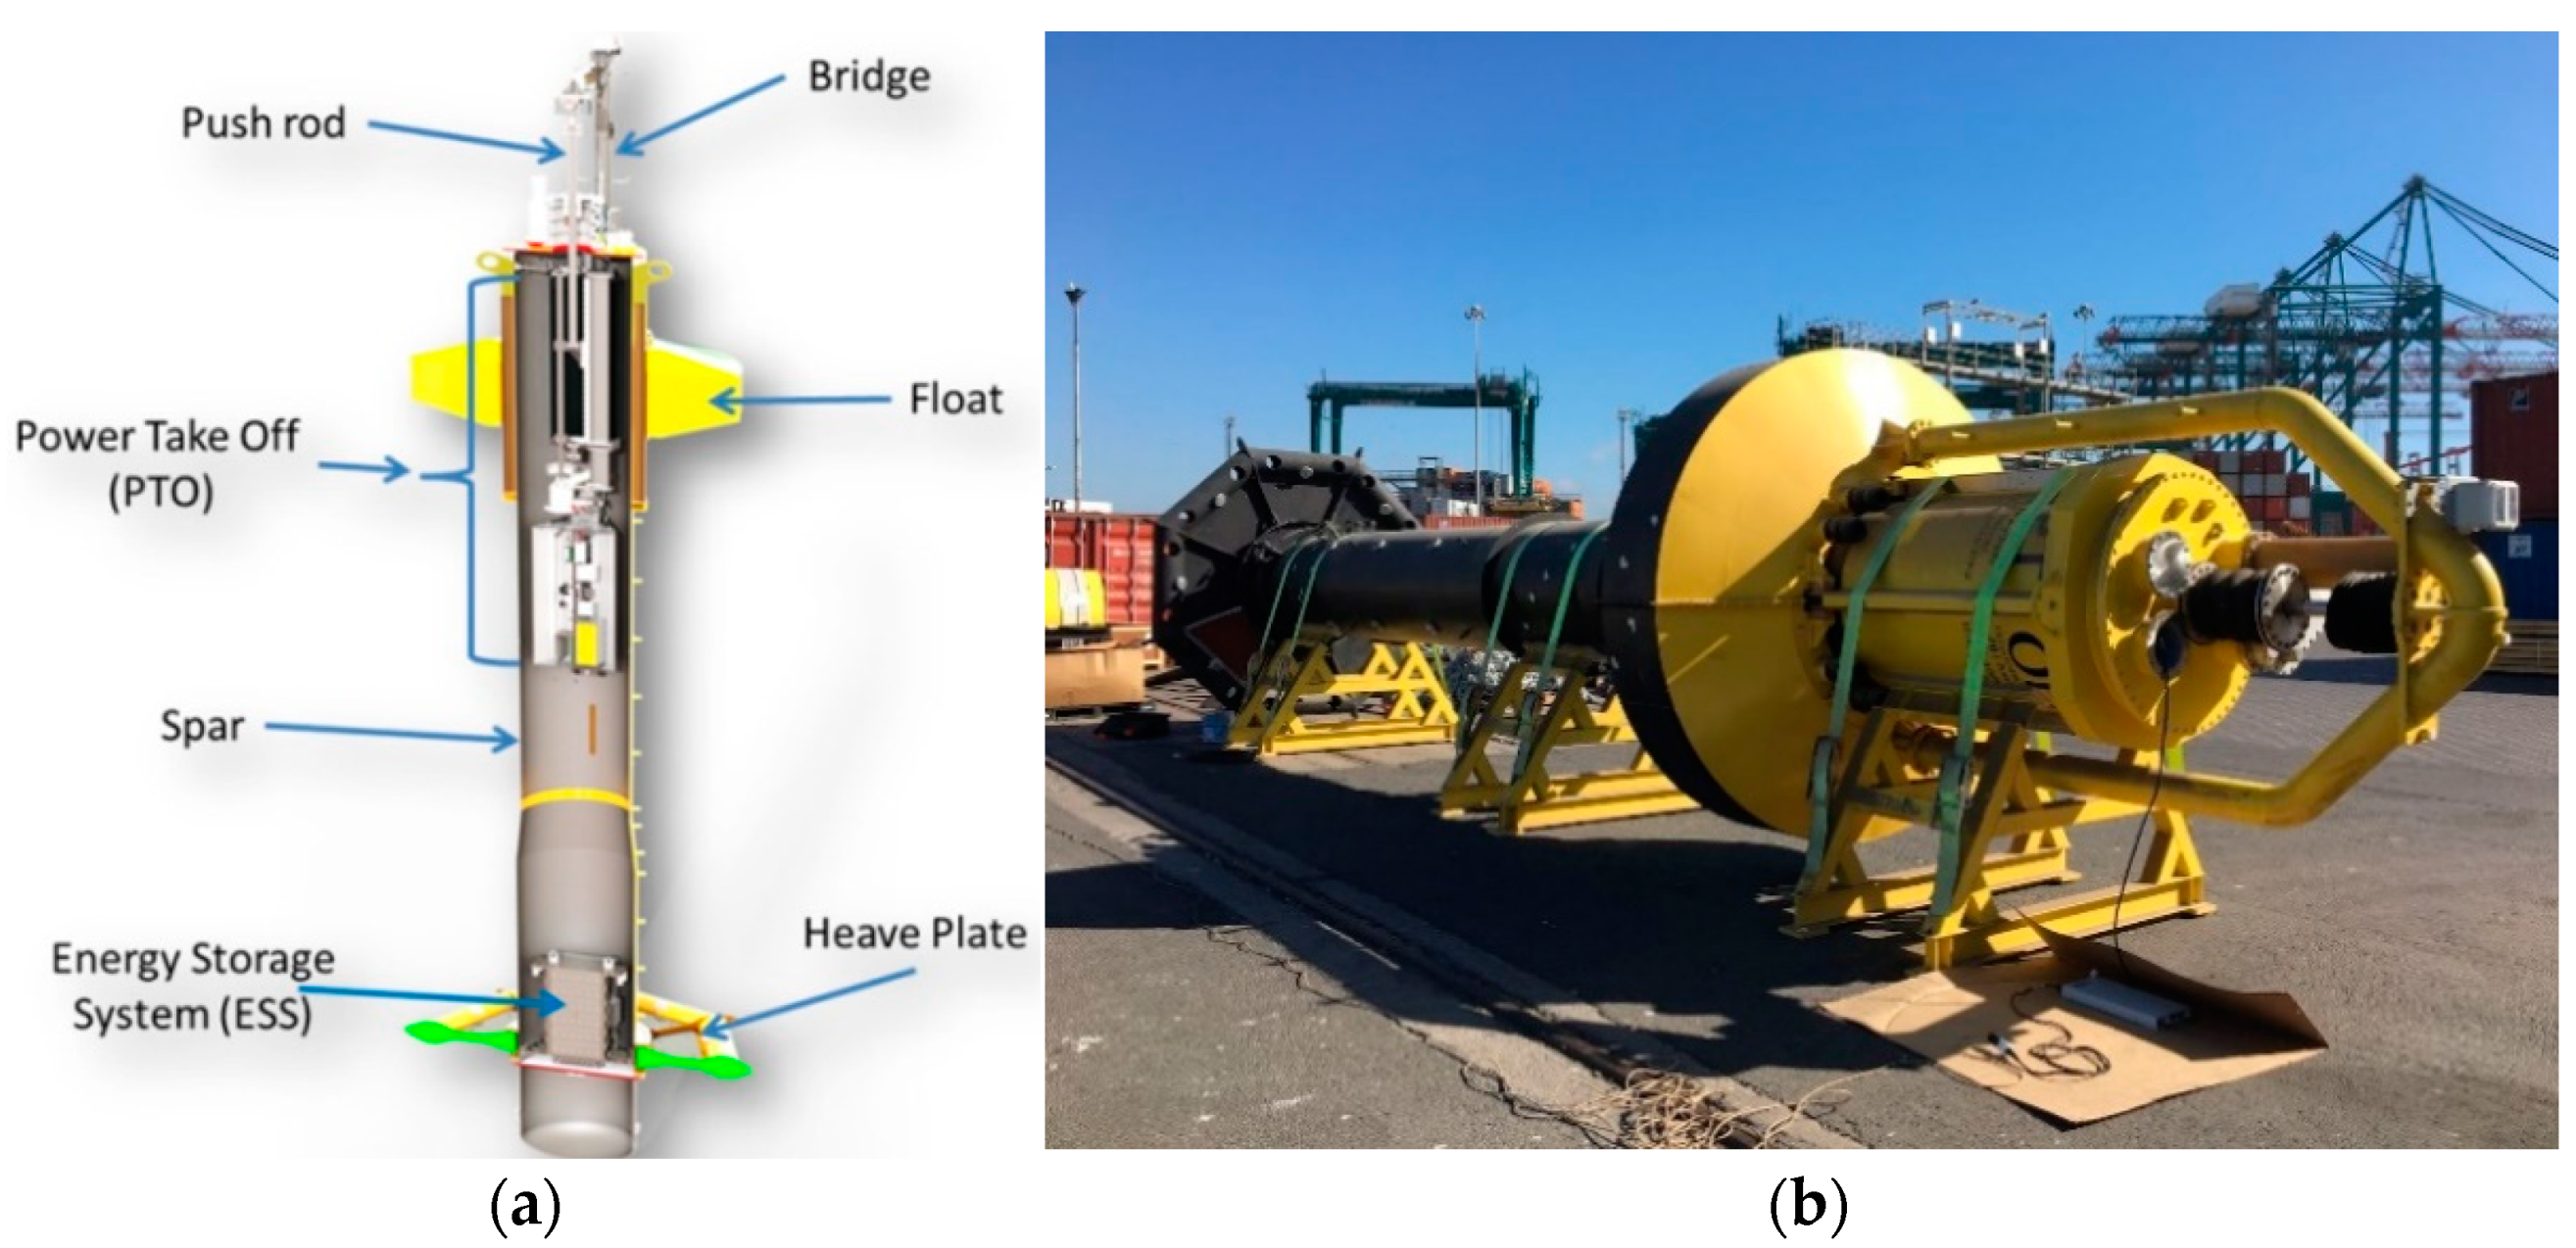
2.3. PB3 PowerBuoy System

The PB3 PowerBuoy [4] is the center of the Open Sea Lab project. It is a wave energy converter from Ocean Power Technologies, Inc., with a total height of 13.3 m and a diameter of 2.65 m at its widest section (Figure 4). This device has been installed at different locations, demonstrating its robustness when operating under extreme conditions [22]. Its operating principle is based on the relative linear motion between the “float” (Figure 4a) and the rest of the buoy, driving a power take-off (PTO) system contained in the spar that converts mechanical energy into electricity, which is then stored in a lithium battery system.
The energy generated by the WEC device is available via junction boxes to all the equipment needed to power and collect the data from each of the sensors on the platform. On top of the buoy, there is a directional Wi-Fi antenna to send and receive information to and from ECIM.
In order to ensure its secure operation, the PB3 PowerBuoy has a human machine interface (HMI) system, which is used to monitor the current status of the PowerBuoy in real time and has access to the battery status; GPS position; relative position between the float and the spar; and the internal pressure, temperature, and humidity of the spar, among other information. In the case of extreme events, or if one of the previous parameters is out of range, the system can lock the PowerBuoy, and electricity generation is suspended. This can be done remotely from the HMI system, or automatically by its own control system.

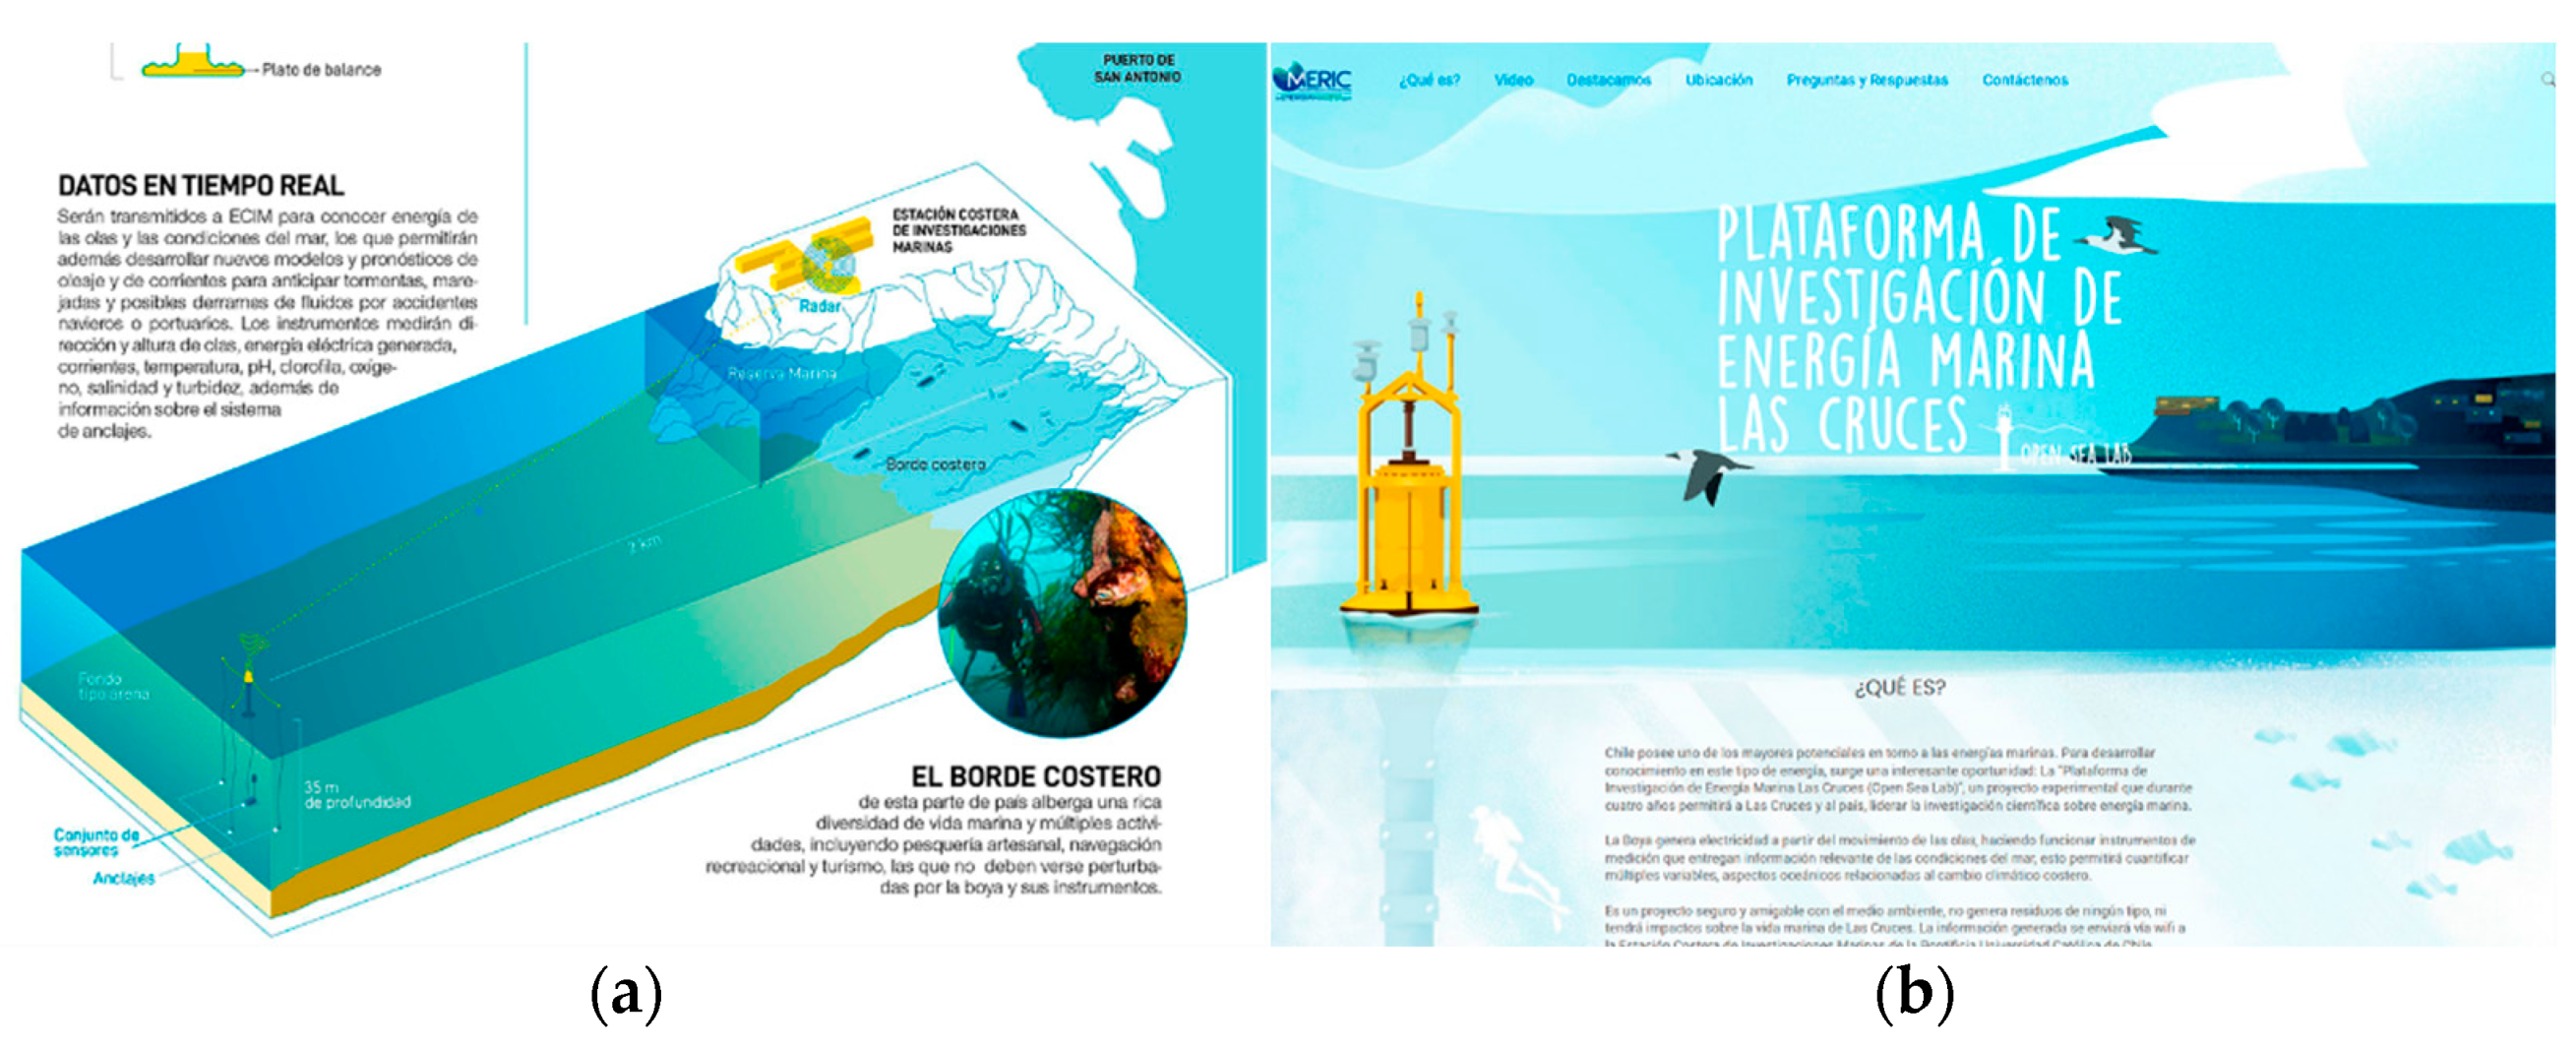
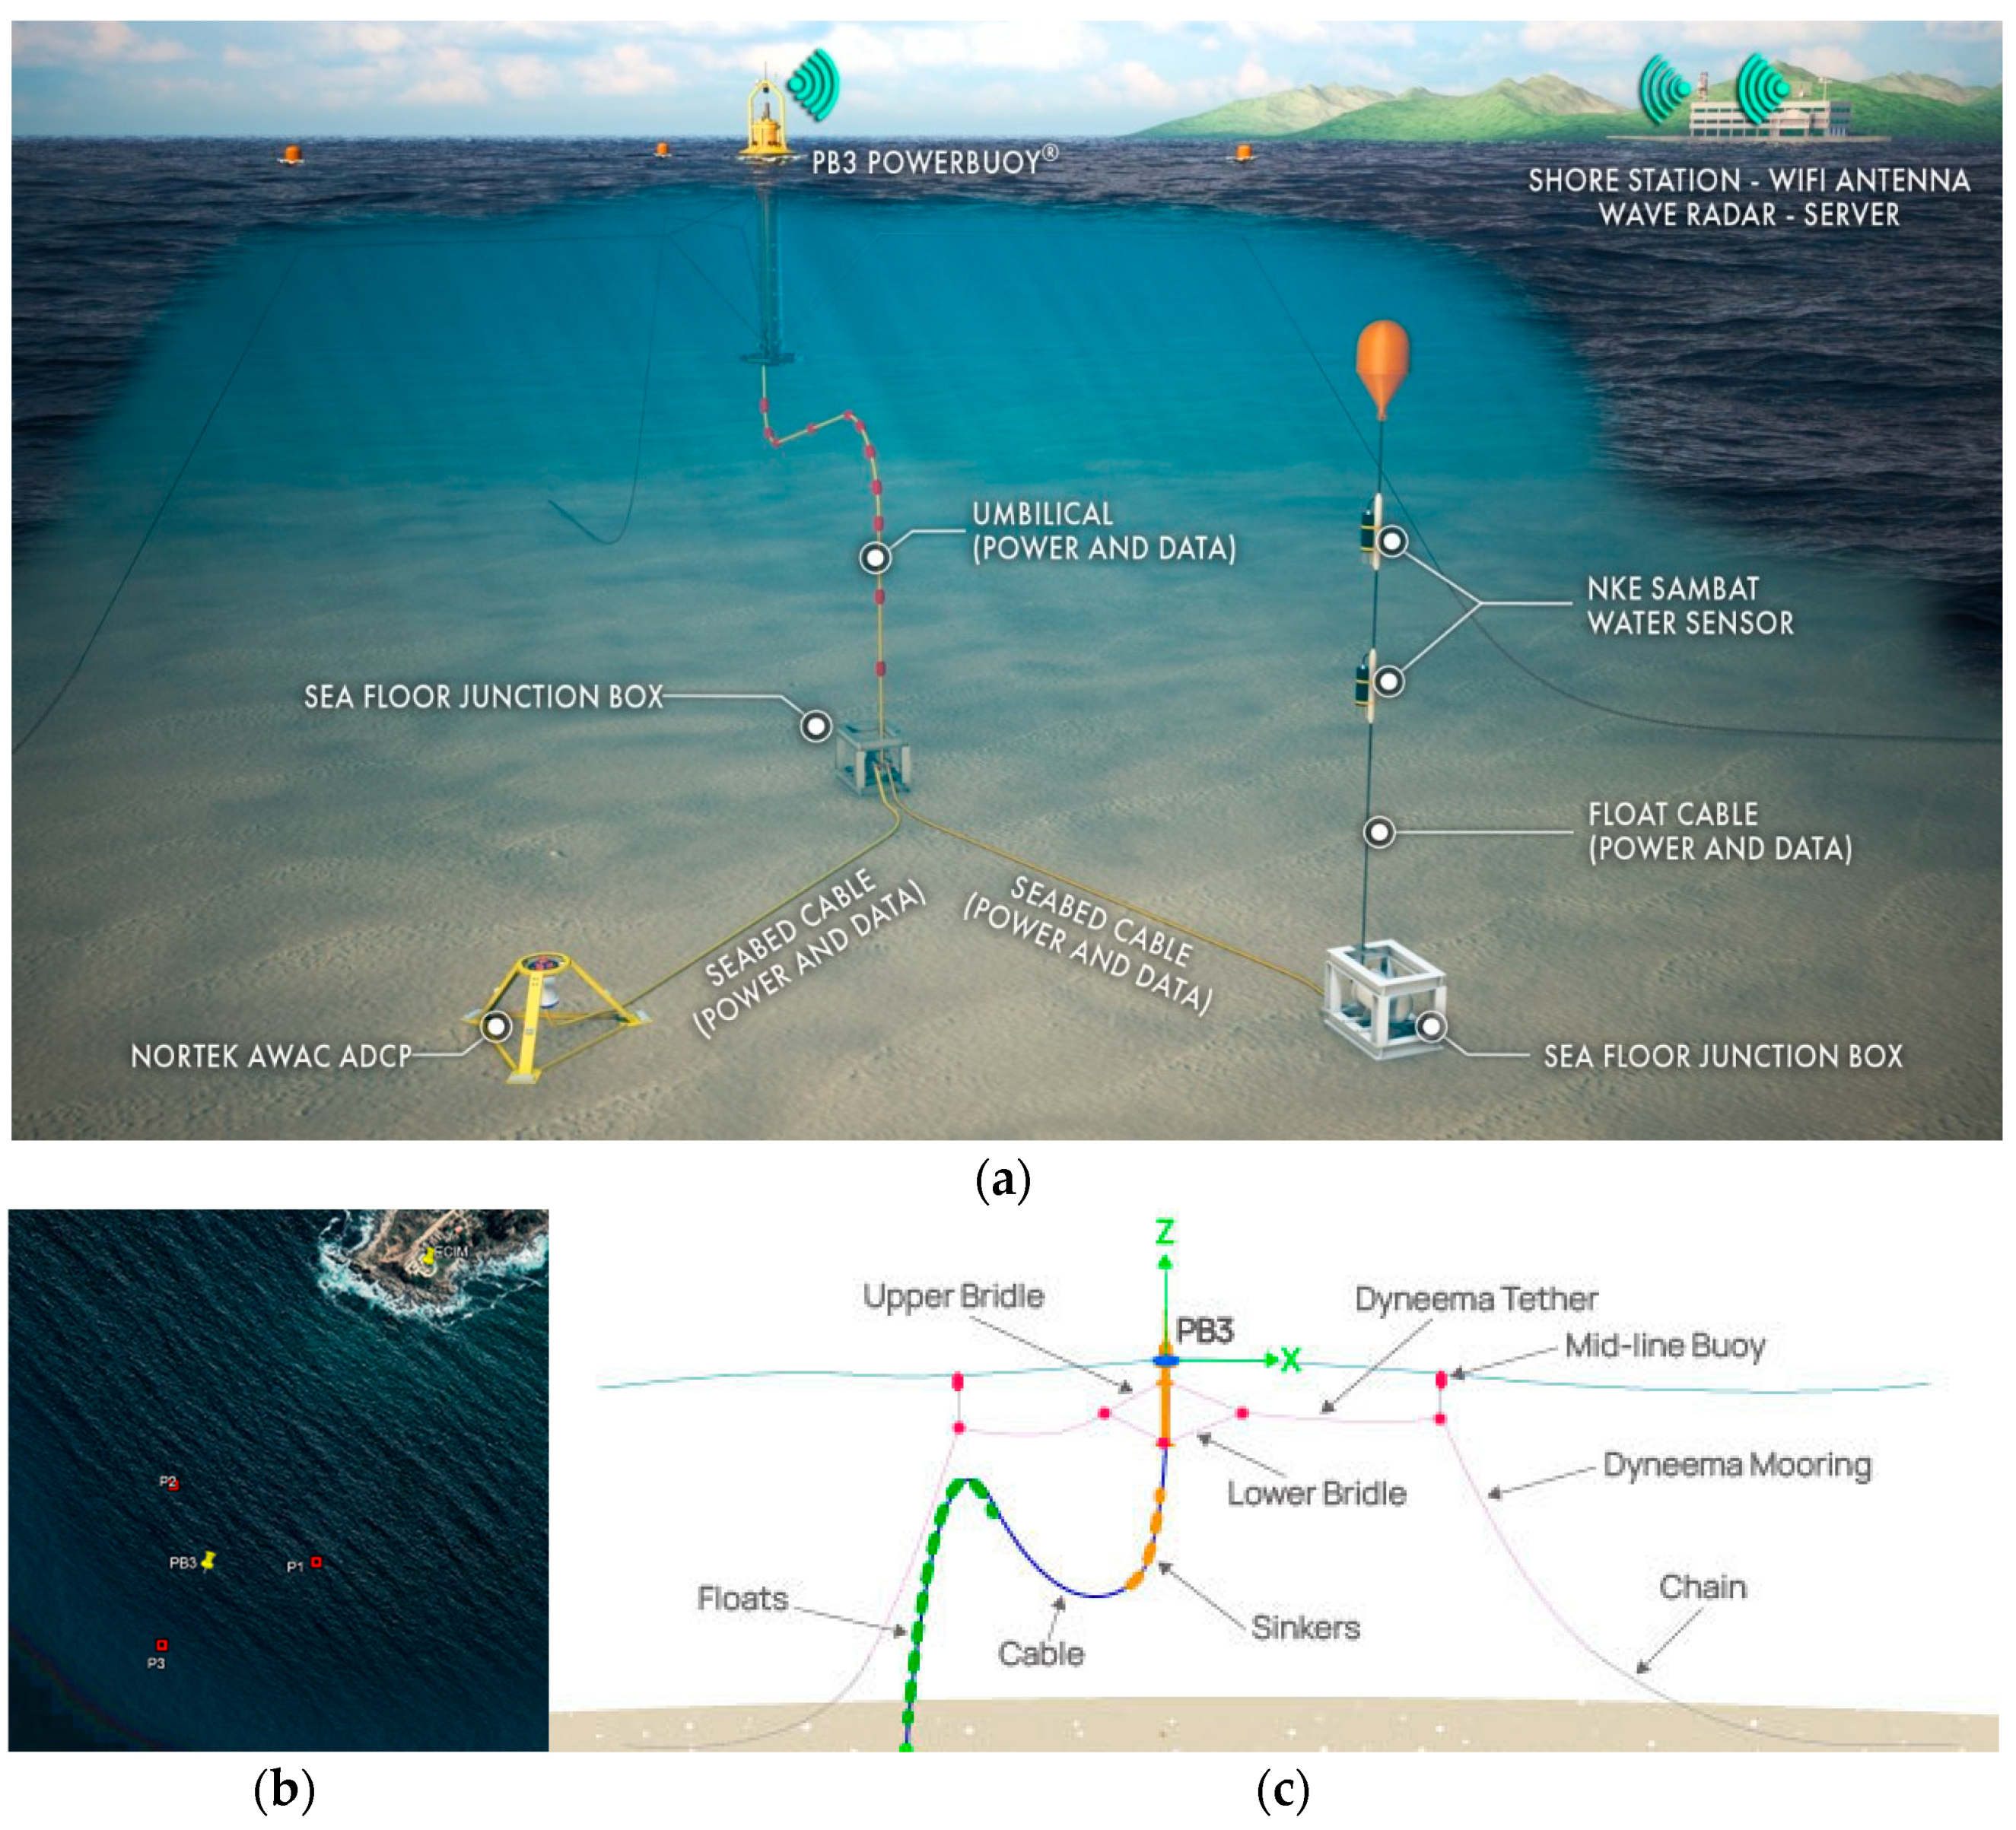
2.4. General Layout of the OSL

The layout of the PowerBuoy device, the mooring system, and sensors at the site is shown in Figure 5a–c. Each of the three mooring lines of the PowerBuoy are approximately 150 m long and consist of a 6-ton anchor, mooring chains, Dyneema lines, and an auxiliary surface buoy (ASB). Each line is connected to two bridle lines attached to the PowerBuoy spar using load pins. An umbilical cable connects the PB3 to a sea floor junction box, which connects to two CTDOs attached to the same vertical line at different depths with another junction box, and an ADCP to measure flow velocities at the site. On shore, there is another Wi-Fi antenna and rack at ECIM, which receives all the data from the PB3 system. The X-band radar and the meteorological station are connected directly to a computer at ECIM.

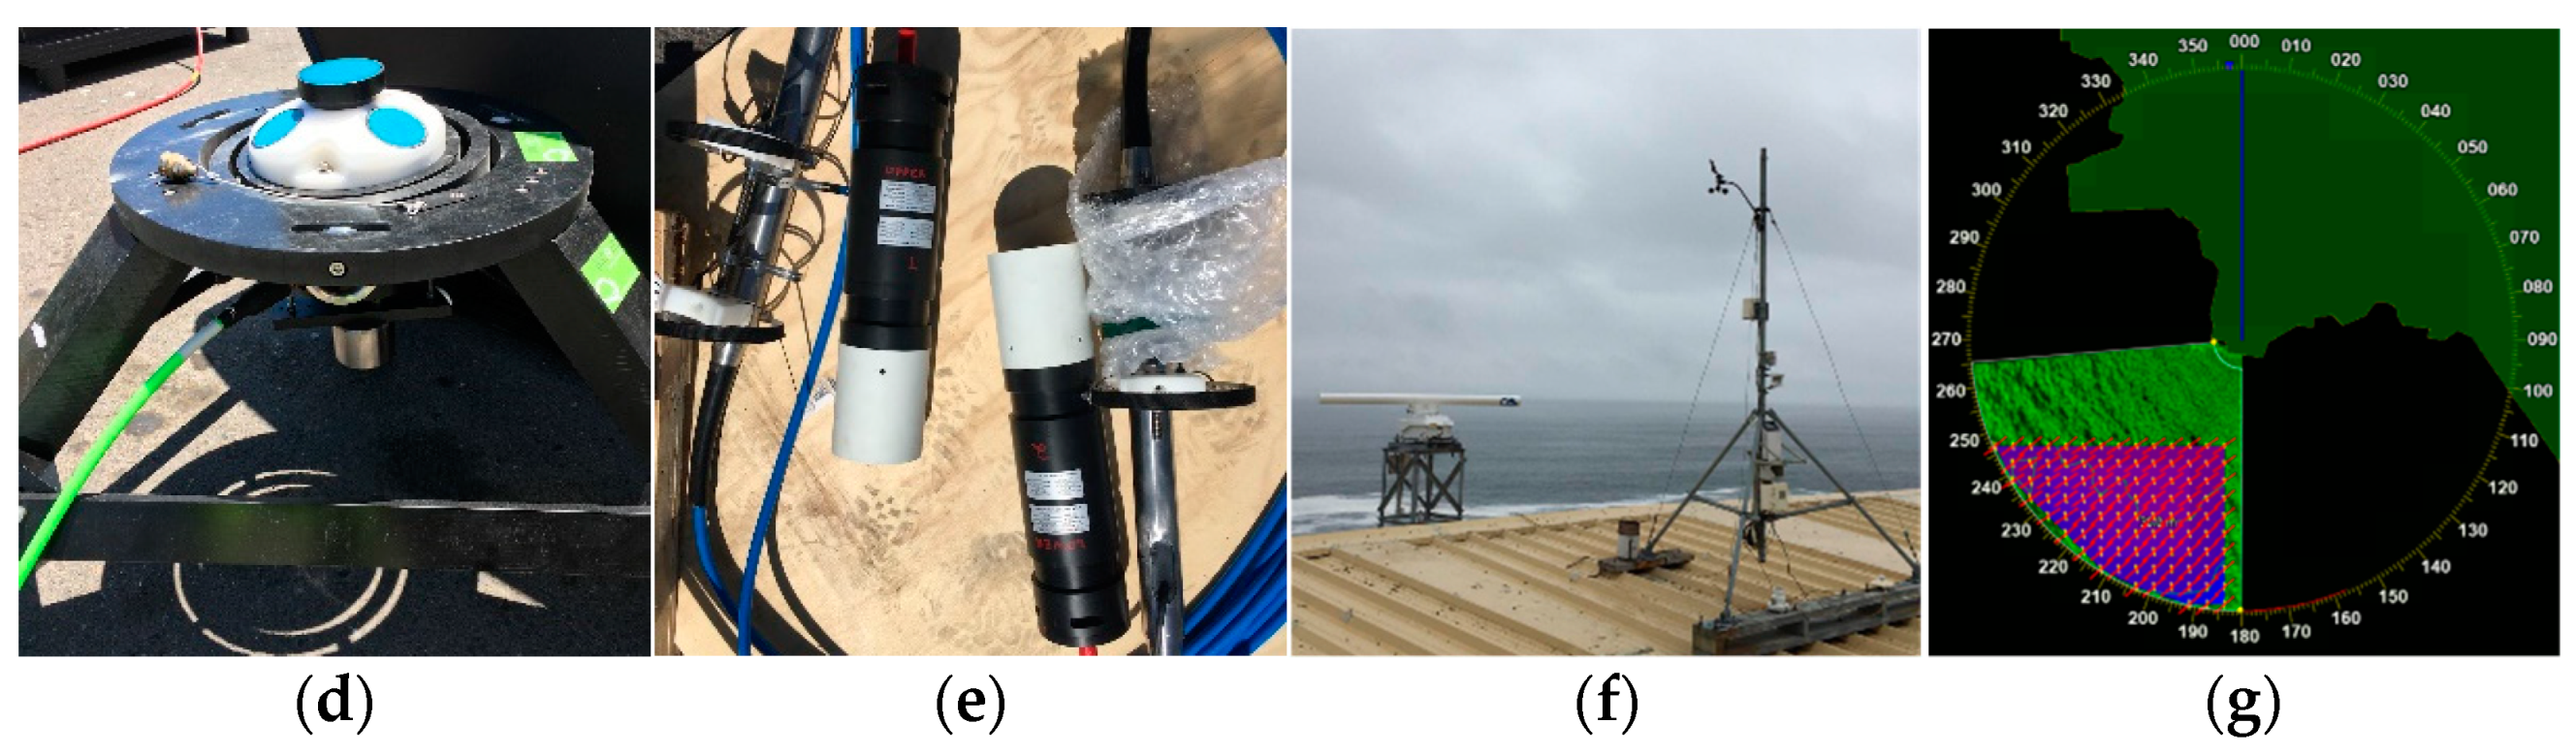
2.5. Offshore Instrumentation

As presented above, the offshore instrumentation of the OSL powered by the PB3 includes an AWAC 600 kHz ADCP from Nortek (Figure 5d), two SAMBAT water quality sensors from NKE Instrumentation (Figure 5e), and six load pins from Strainstall. The 600 kHz ADCP is installed at the seabed and provides measurements of current profiles and wave directional spectra, all in high resolution. This instrument is fixed to a self-aligning structure to ensure its correct positioning during deployment and operation.
The two water quality sensors, or CTDOs, measure temperature, conductivity, salinity, turbidity, dissolved oxygen, pH, fluorescence, and depth. An important characteristic of these sensors is the brush that cleans the optical sensors 4 times a day, thus reducing biofouling and improving measurements while also reducing the periodicity and maintenance times. While automatic cleaning is costly in terms of energy, it is afforded by the continuous energy provision provided by the PB3. In addition, six load pins are installed at the clevises connecting the mooring lines to the PB3 PowerBuoy to provide line tension data. A summary of the installed offshore instrumentation and the sampling frequencies of the data collected at the OSL are shown in Table 1.

2.6. Onshore Instrumentation

The OSL also includes a SeaDarQ X-band radar and an Atmos meteorological station, as shown in Figure 5f,g. The radar has two main components: the antenna radar, a Sperry Marine 8 ft turning unit, and the SeaDarQ V5 from Nortek (Norway) software for environmental monitoring. This integration offers three kinds of applications: oil spill detection, hydrography, and the detection of small objects. In the hydrographic mode, the system measures surface currents and waves in a range of 1.5 km. The Atmos meteorological station provides measurements of wind speed and direction, air temperature, relative humidity, rainfall, and photosynthetically active solar radiation (PAR). A summary of the onshore instrumentation and sampling frequencies of the data is provided in Table 2.

2.7. Data Transfer and Architecture

Due to the large volume of environmental and physical data collected, a hardware system was designed according to the requirements established for monitoring the coastal ocean. The system consists of two racks: one exclusively for all the SeaDarQ X-band radar high-resolution data, and the other for all the rest of the data collected by the OSL offshore sensors, the PowerBuoy operation, and the HMI system.
Each rack has independent UPSs to secure an electricity supply and data storage unit sufficient for 2 years of data. Although the units have data storage capacities, all raw data is also stored in the cloud, where all information is uploaded daily. The data are saved in primary form and are then pre- and post-processed, including basic data quality control, and plotted for inspection, in order to be displayed in the user interface. The platform can also perform simple post-processing and data analysis, generating statistics for initial analysis. One of the important attributes of the OSL is the open access to real-time data for the scientific community and for the environmental assessment of the site and interactions with the WEC device.

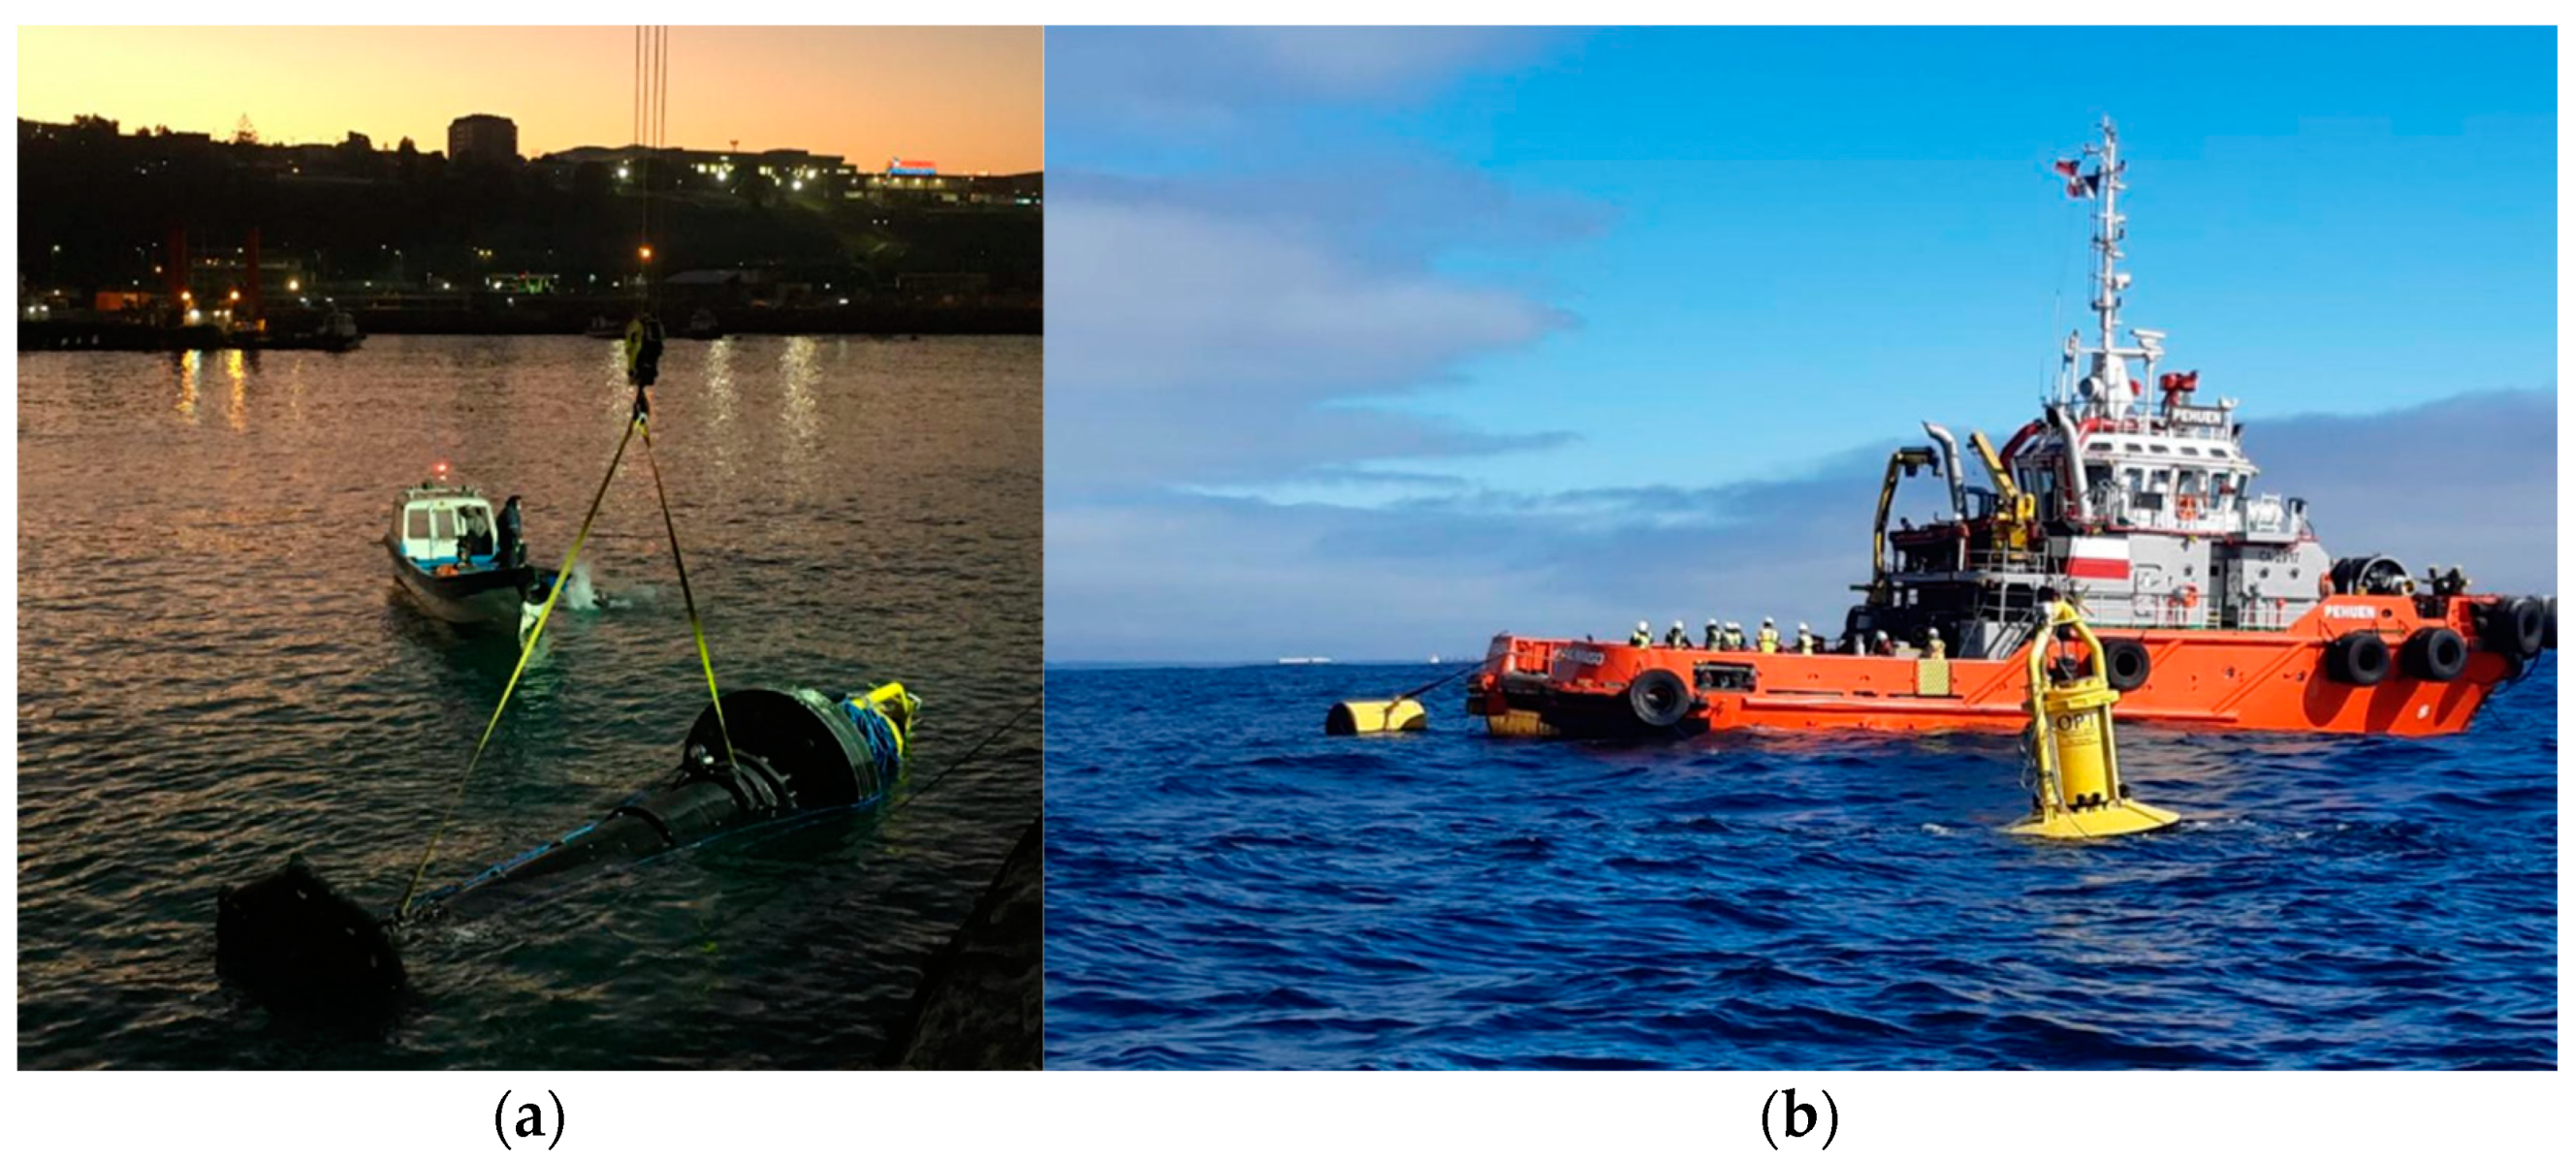
2.8. Additional Challenges of OSL Installation

In this section, we will summarize the main challenges that needed to be considered for the installation of the OSL, which will also need to be addressed in future developments and extensions of the OSL or in the installation of platforms in regions with similar characteristics to the Chilean coast. We will also briefly explain the experiences of the team in terms of social and legal aspects and offer an analysis of the additional potential environmental impacts of the OSL that are currently being monitored.

2.8.1. Social Acceptance and Local Context

The pandemic affected the installation of the OSL; however, MERIC researchers worked closely with the local community, especially in terms of the social perception of the PB3 component in Las Cruces and its possible effects [23]. Social scientists identified all the local stakeholders in the coastal region through fieldwork and previous experience with community-based projects at ECIM and associated research centers [24,25].
Sixty-four legal and nonlegal entities were identified, and twenty-three were contacted in San Antonio Province, including municipalities, fishermen unions, divers’ unions, algae collectors’ unions, communal environmental committees, port captaincies, cultural organizations, schools, neighborhood committees, and other environmental institutions. This identification allowed for the distribution of these entities into 10 groups, and a socialization and sensibilization plan for the deployment and operation of the Open Sea Lab was created, along with support from Ministry of Energy experts in community engagement and relations.
The elaboration of this plan involved many activities, such as the establishment of interdependency between groups, the definition of messages and media for each group, communication risk management, controversial scenario modeling, and a community questions simulation, all in order to anticipate potential risk situations and obtain total community acquiescence.
Taking into account that the country was in total lockdown due to the pandemic in 2020 with social distancing and the prohibition of social gatherings, a digital plan and strategy for social engagement had to be developed, and several digital products were created, including a flier for the scientific community (Figure 6a) and a landing page to inform local stakeholders (Figure 6b), which included animated explanatory videos, a project description, location, key assets, contact information, and a Q&A.
Additionally, various other types of communication were made and included in this plan, including phone calls, letters, e-mails, text messages, and virtual meetings, all in order to explain the scope of the project and resolve any questions. All this work was clearly more difficult to perform in a pandemic context, as most of it had to be performed remotely; nevertheless, it resulted in a positive co-construction of many aspects of the project, in which the community appreciates and values its significance for the region.

2.8.2. Permits and Technical Aspects

For the installation of the OSL, two permits were required according to Chilean legislation. First, a permit for the portion of seawater and seabed at the site of installation was obtained from DIRECTEMAR (General Directorate of Maritime Territory and Merchant Marine) of the Chilean Navy. Second, the installation required authorization to carry out marine scientific and technological research, which was obtained from the SHOA (Hydrographic and Oceanographic Service) of the Chilean Navy.
For the deployment of the PB3 and associated instruments, an ocean-going tug with a towing capacity of 60.25 t was used (Figure 7), along with small workboats to support diving operations. Due to the limited deck space on the tug, each mooring line with its corresponding anchor and ASB had to be transported and installed separately, thus increasing the installation time. Regarding the installation of the mooring system, 1.5 t drag embedment anchors were initially considered based on preliminary seabed survey results. After the first installation attempts and embedment tests, these anchors proved unsuitable for the hard soil of the site and were replaced with 6 t hybrid anchors. These anchors use a combination of a concrete deadweight and a drag embedment anchor for permanent moorings and are especially suitable for the hard soil of the installation site.
The wave conditions, which rarely left windows of more than 1–2 days with Hs < 1 m, limited diving and complicated the cargo handling operations, significantly increasing the installation time over several days. The limited availability of more suitable vessels for this type of work in the area of San Antonio became apparent and forced the team to request vessels and technical teams from other distant ports in the country. Moreover, locally hired crews with skills and experience in ocean-going operations showed inexperience with mooring systems and cable maneuvering in these coastal, high-energy environments. In all, the deployment of the instruments could not be completed at once and had to be extended over several months of favorable weather conditions. Since this was the team’s first experience installing a WEC and associated instruments in Chile, some complications were expected and did occur. The knowledge gained for future installations and the maintenance of wave energy devices at a larger scale in Chile is invaluable, and the deployment operations highlighted the need for physical and human infrastructure in Chilean port areas, including vessels typically used for offshore construction in oil and gas environments and training personnel in coastal wave environments.

2.8.3. Potential Local Impacts on Seabed Communities

In addition to the continuous monitoring of marine mammals, which is performed by direct observations and the analysis of hydrophone signals, and the monitoring of birds in the vicinity of the PB3, an inspection of benthic organisms was conducted before the deployment and at regular intervals after the anchors, junction boxes, and instruments were deployed. The monitoring consisted of two main activities: (a) direct observations by scuba divers who made short video transects of the sea bottom and (b) the deployment of baited remote underwater video (BRUV) for a standard period of one hour on each occasion. We are planning to maintain these activities periodically to observe any changes or impacts on the local seabed communities and analyze specific factors that can affect these modifications in the long term. The observations and results of this work will be reported in future publications and/or announcements.

3. Preliminary Results and Observations of the OSL

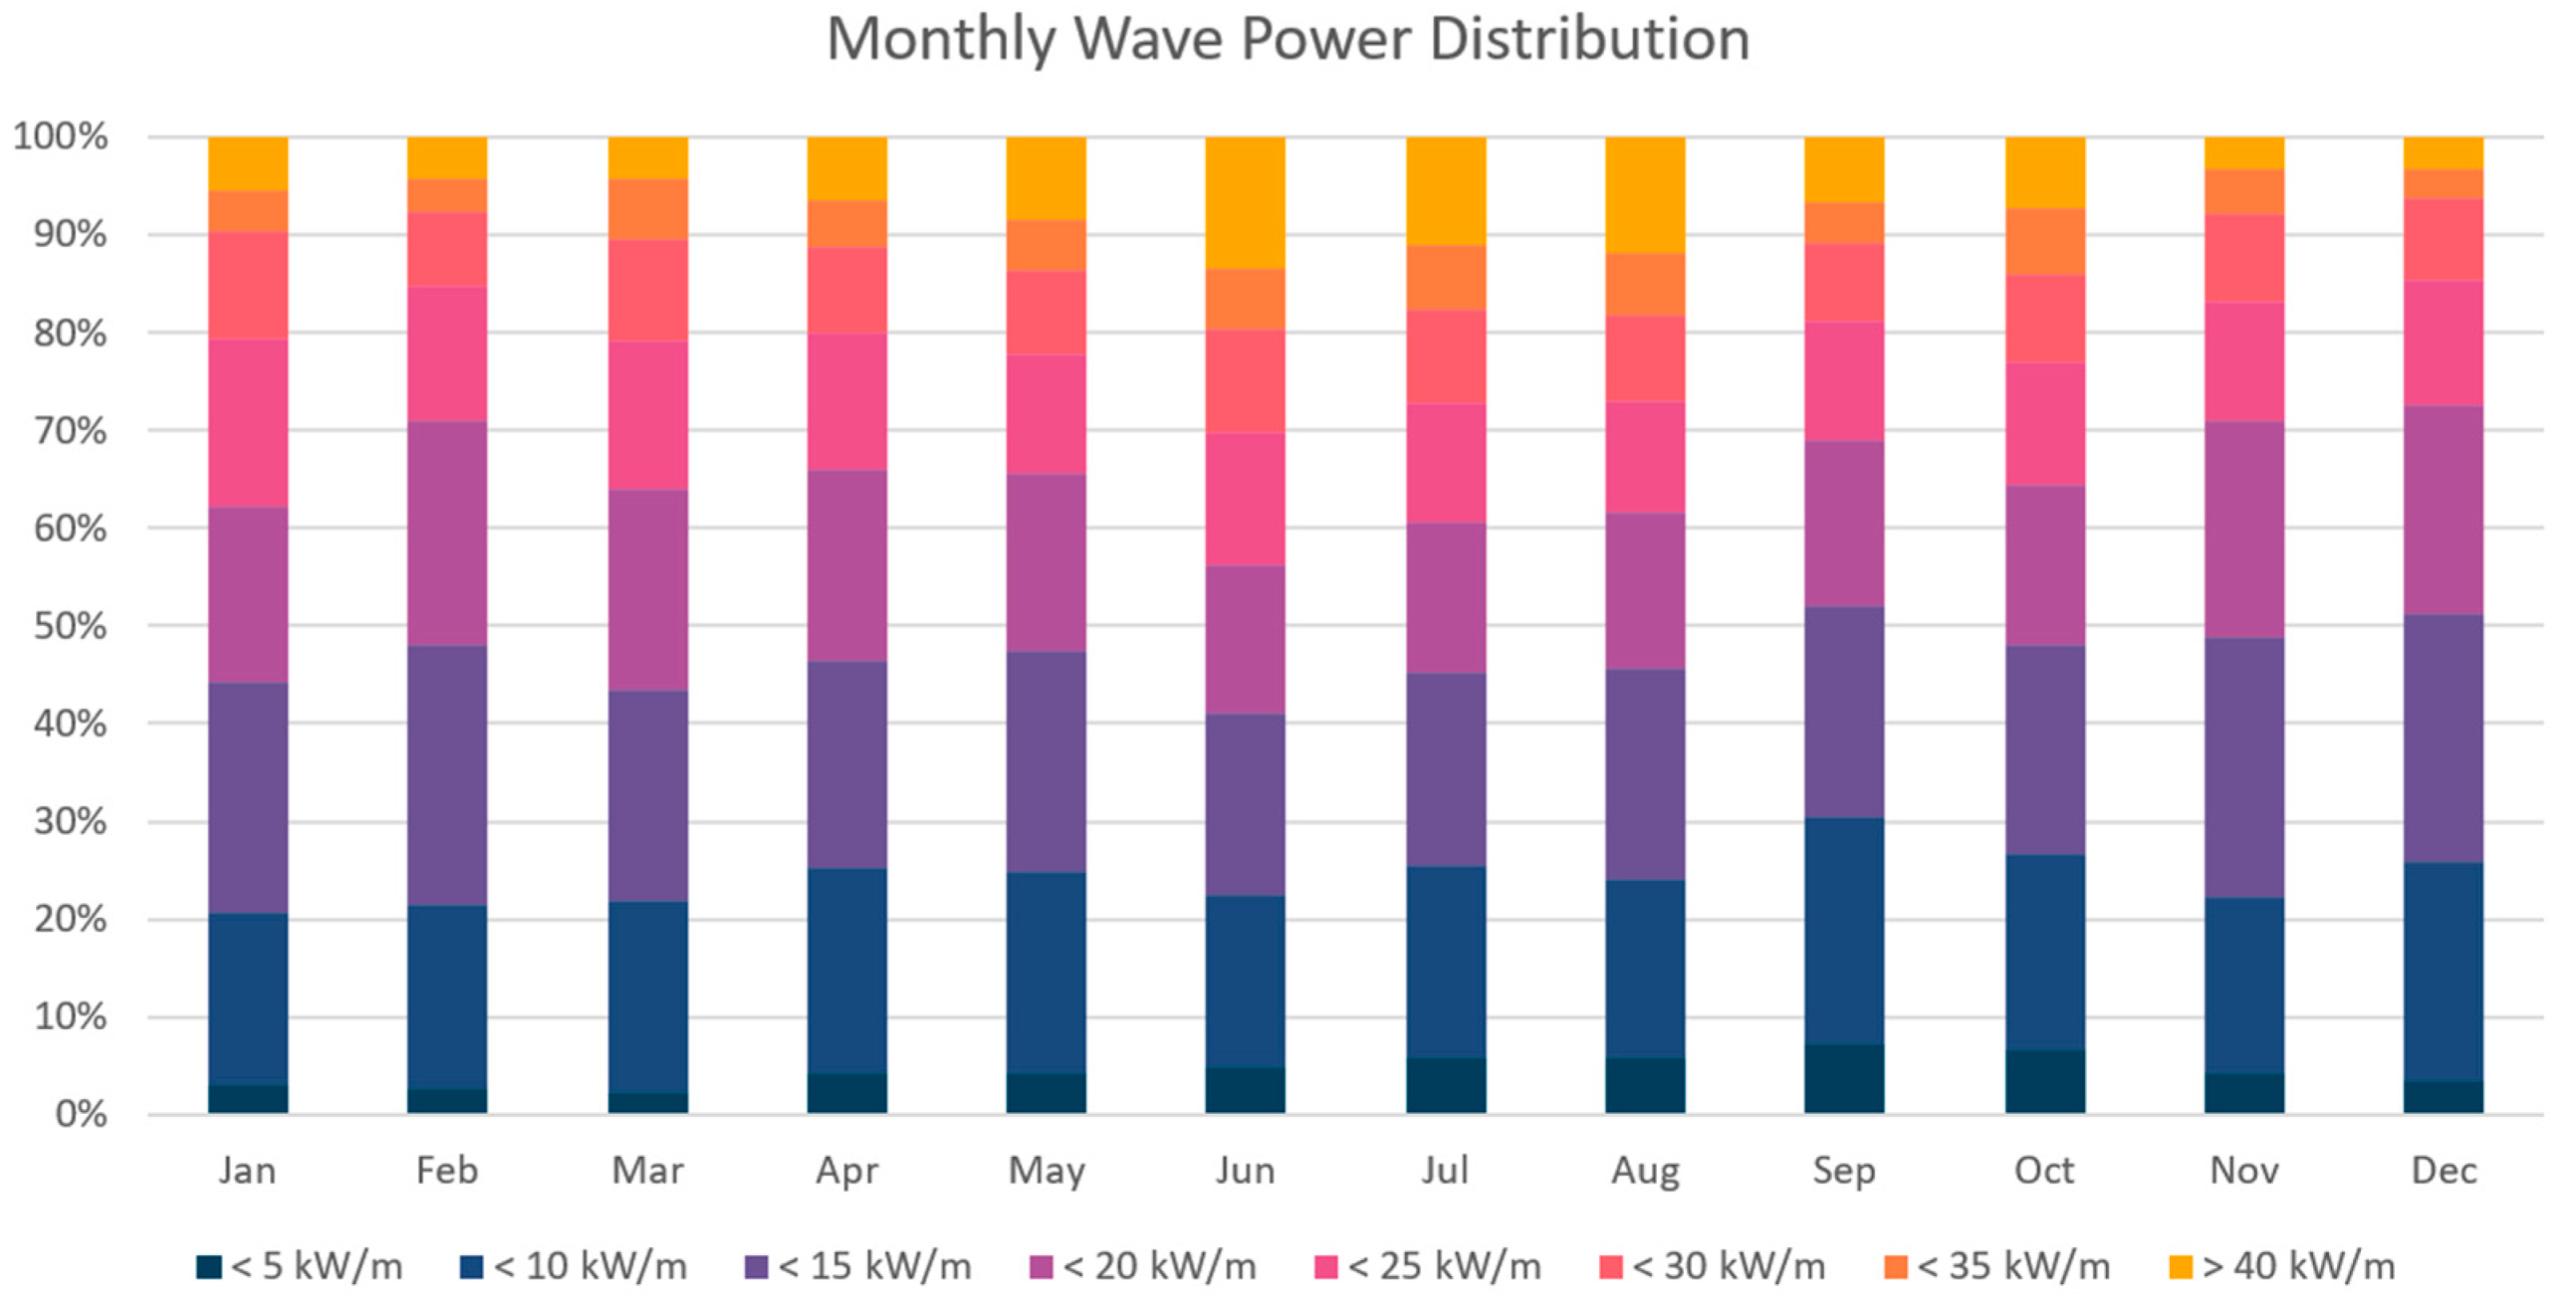
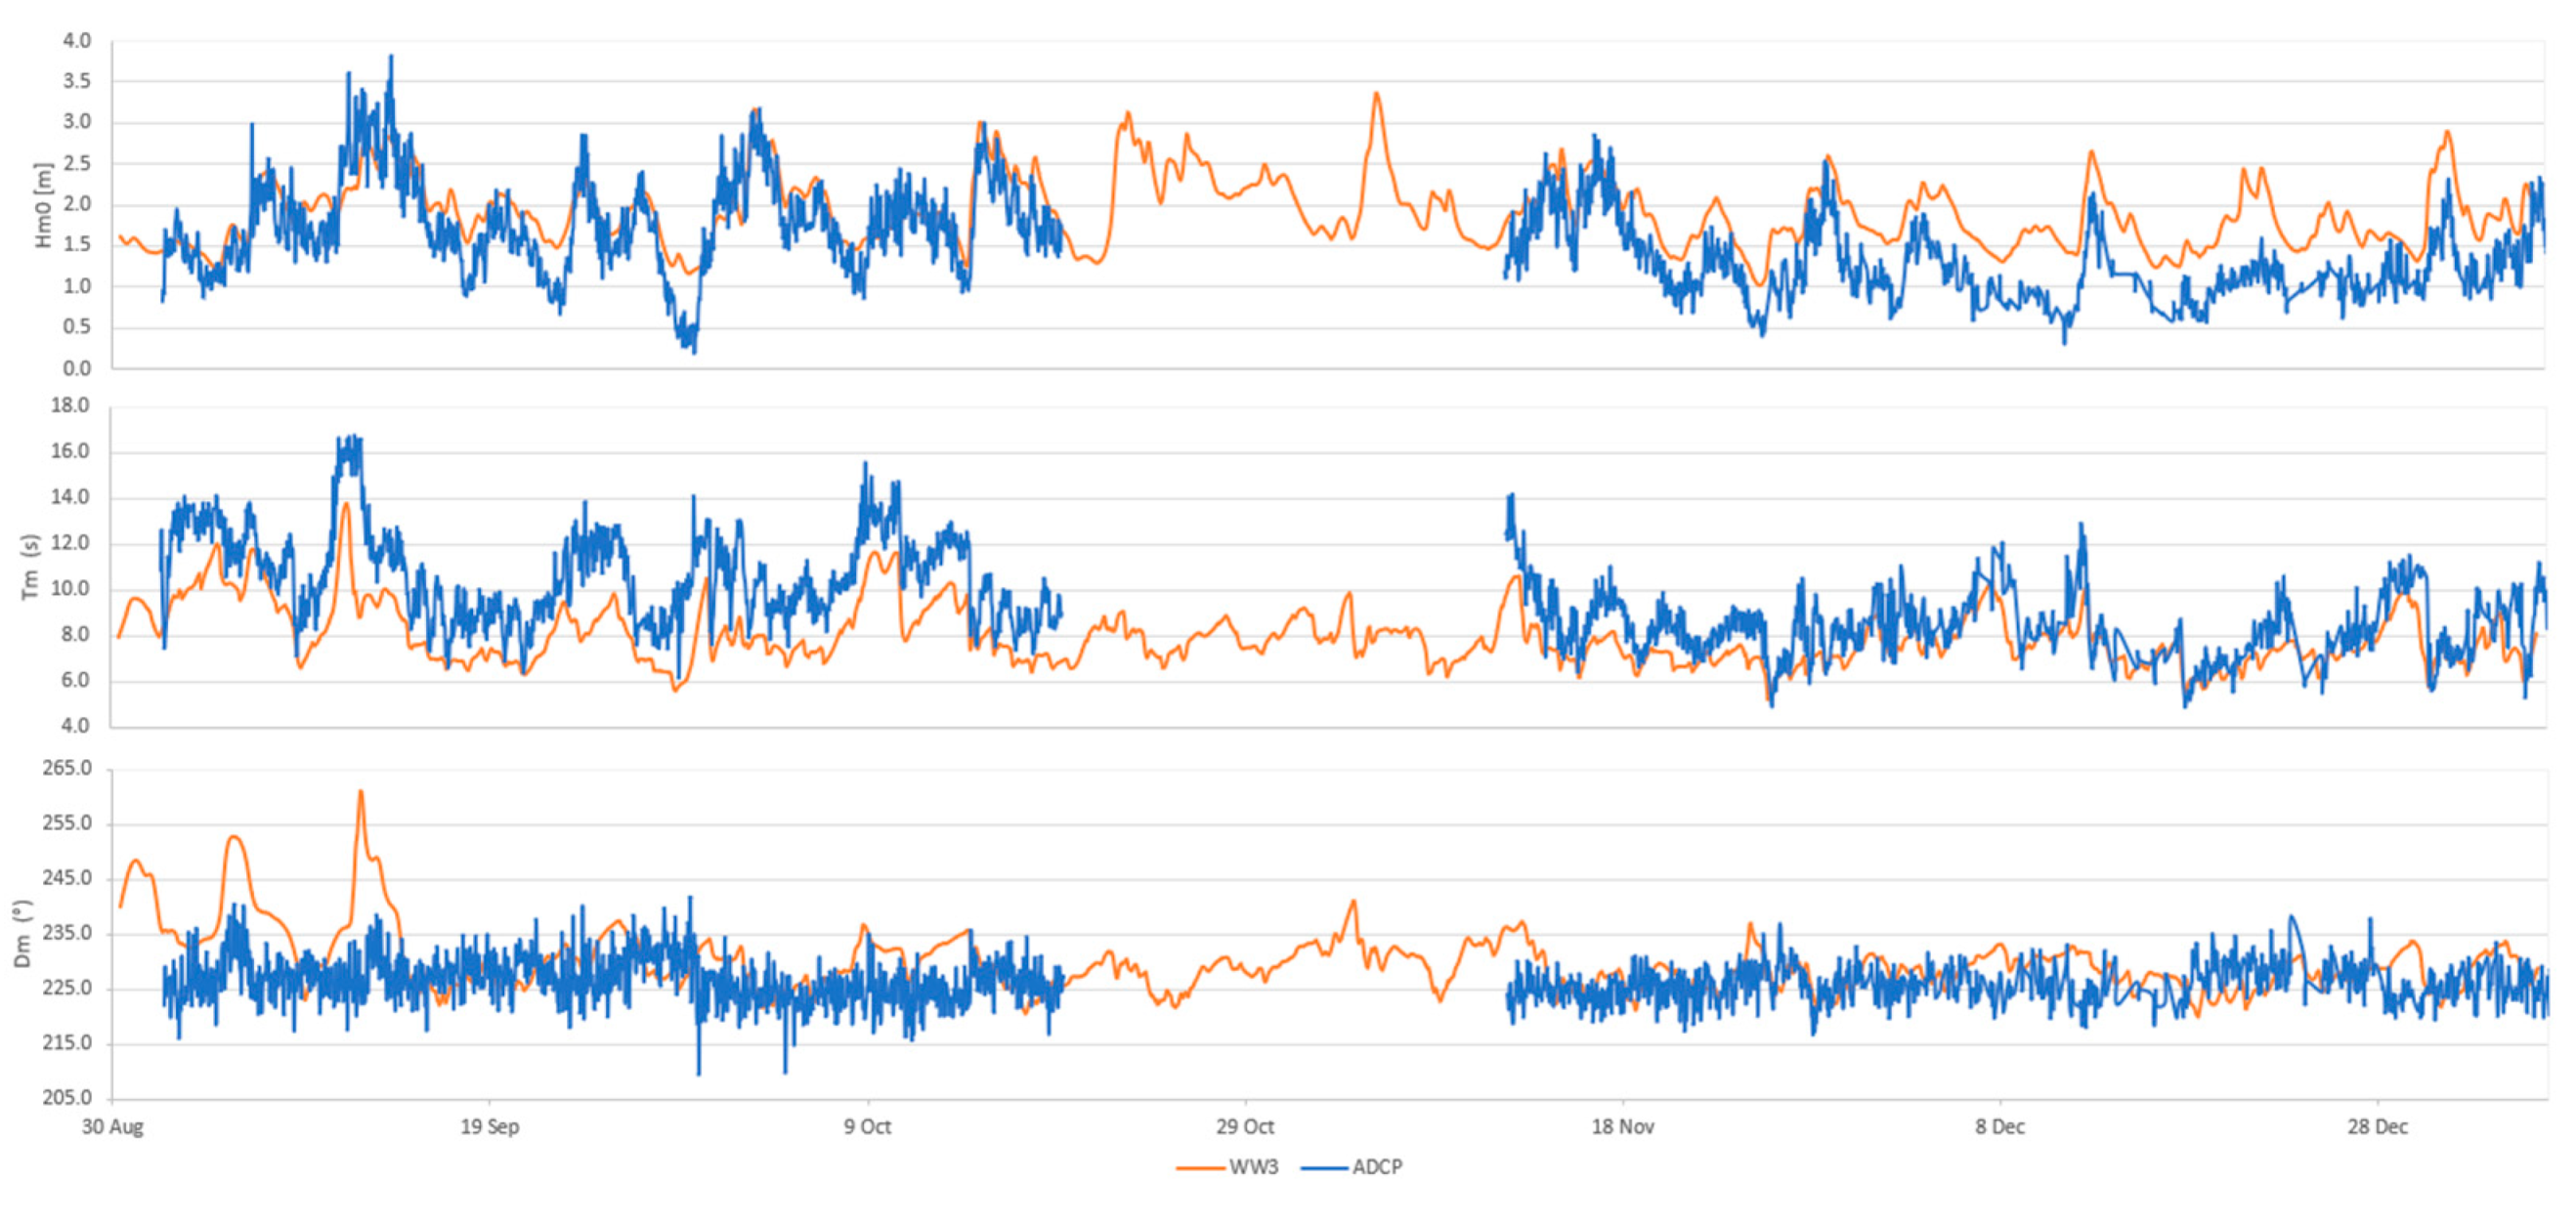
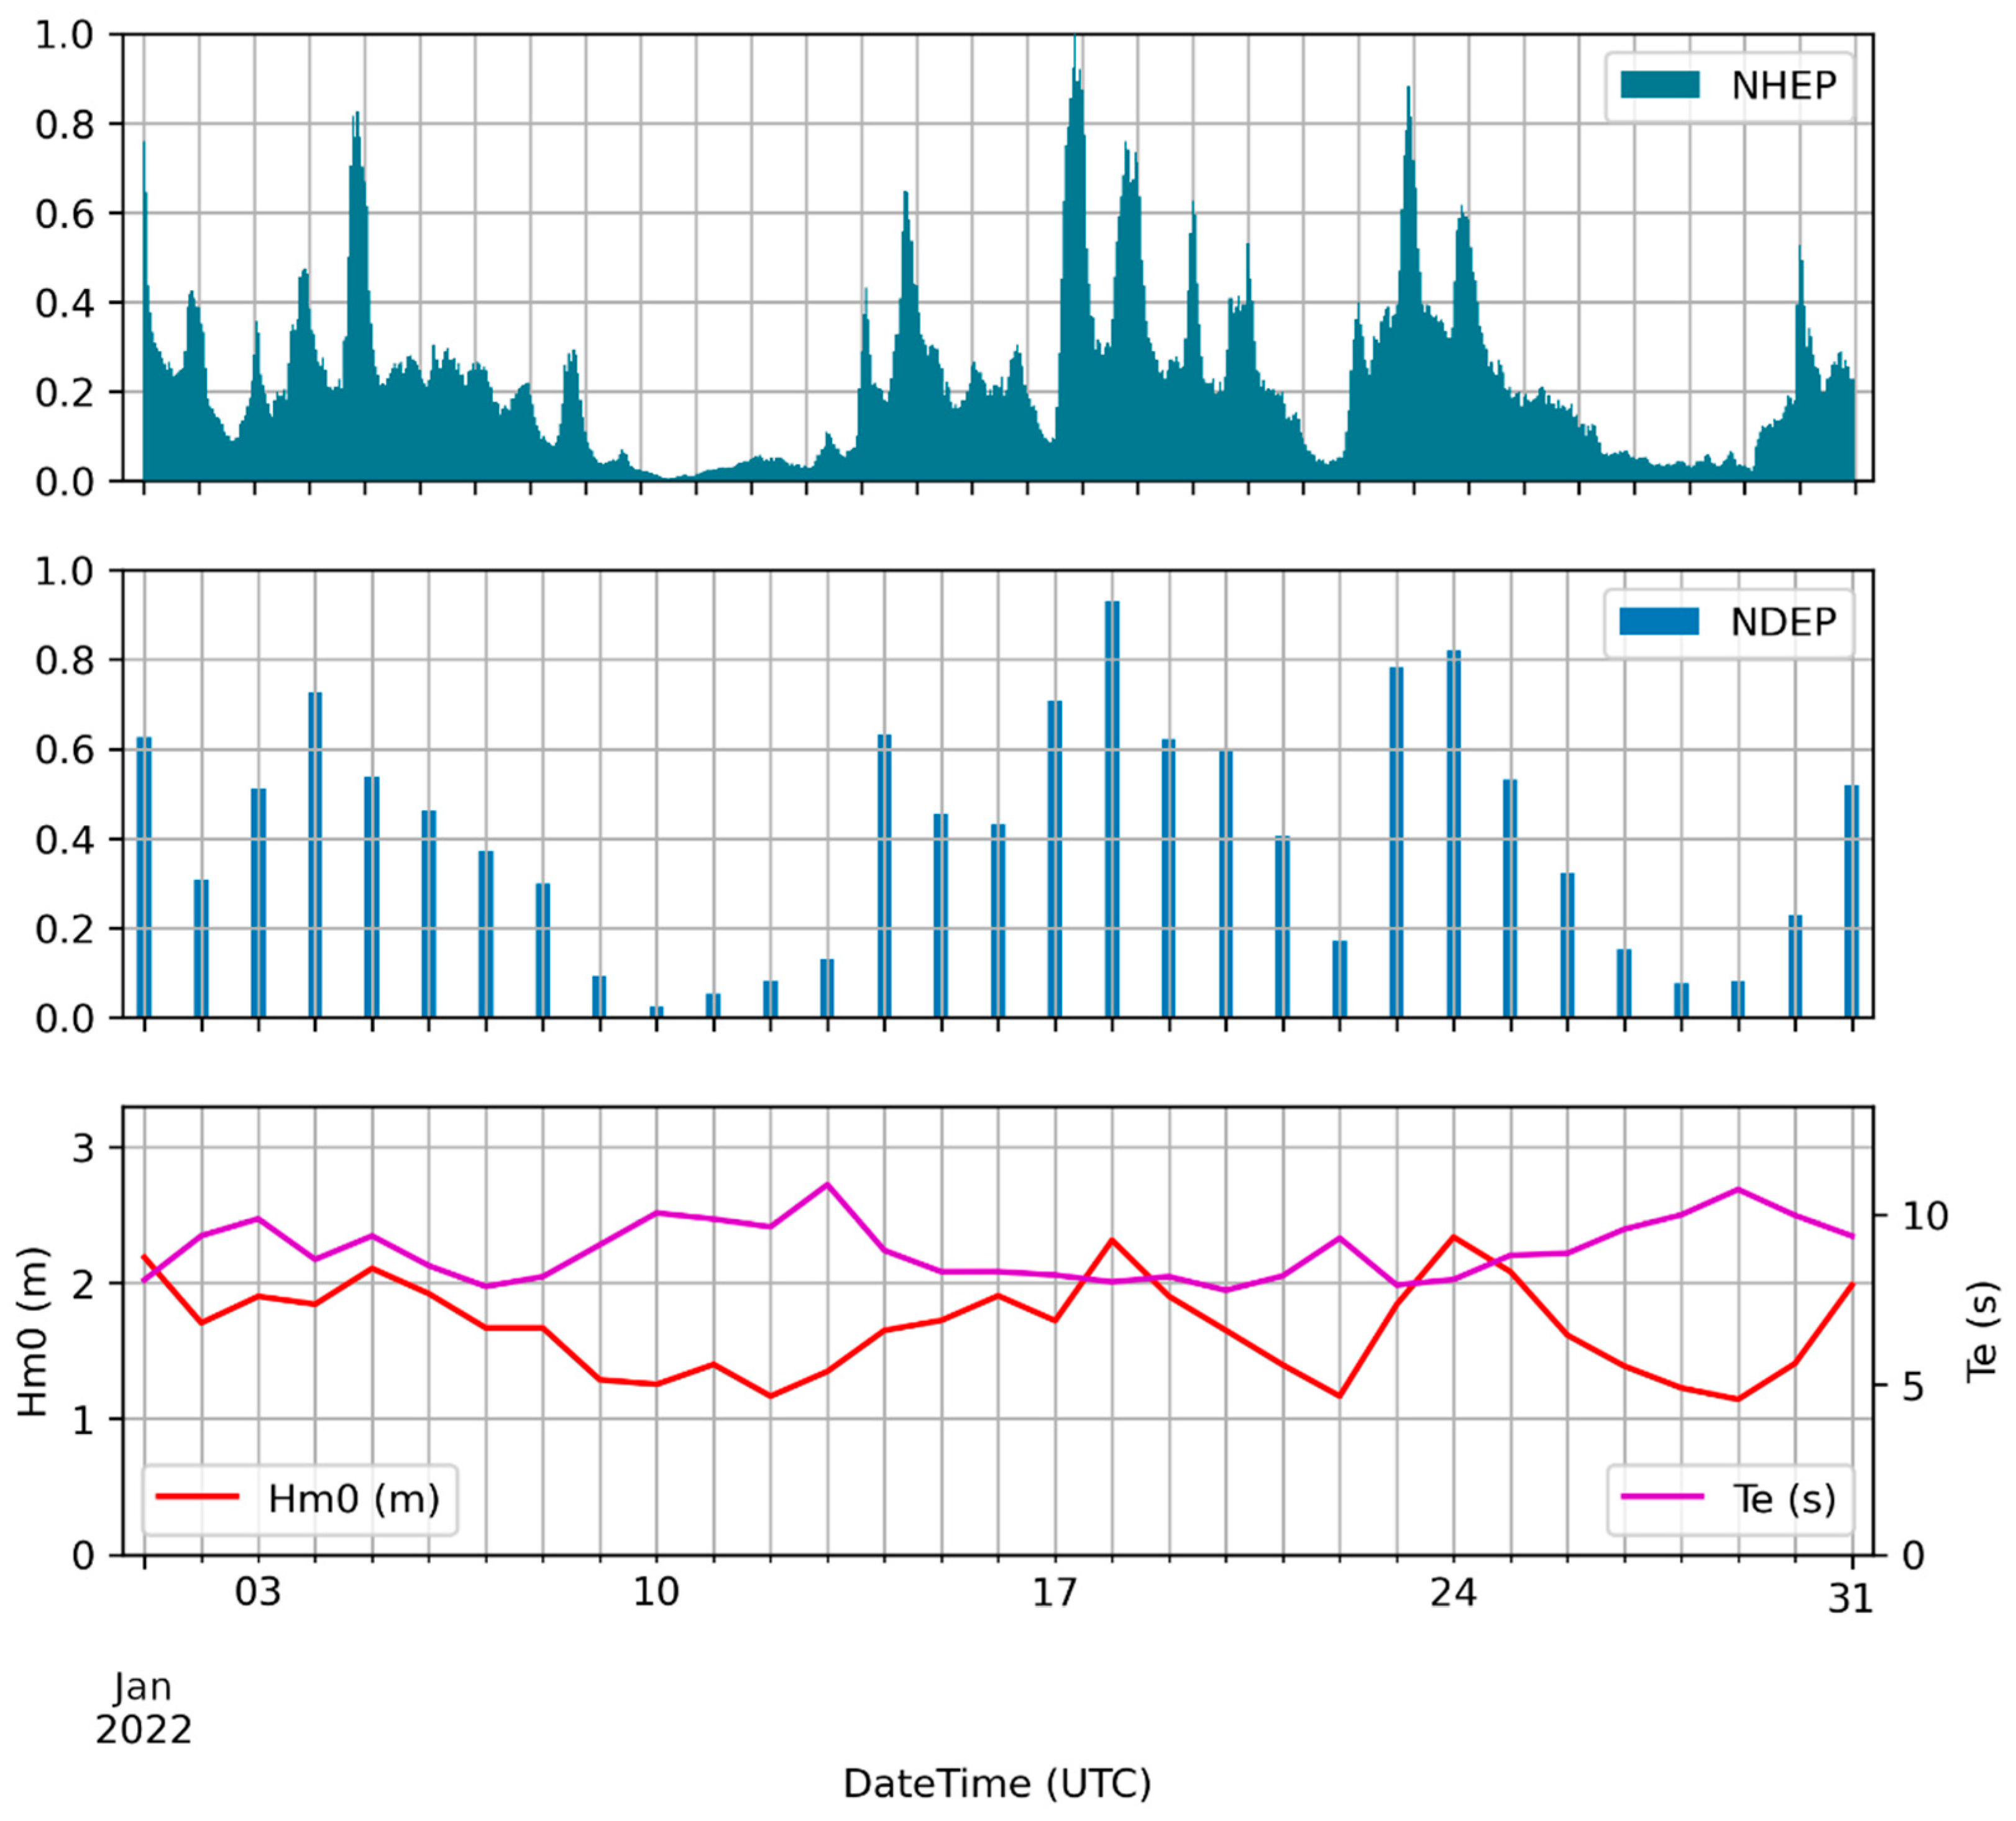
3.1. Wave Measurements

Figure 8 shows the wave height (Hm0 (m)), mean period (Tm (s)), and mean direction (Dm (°)) for the observations from AWAC and the model data from WaveWatch III; the data from the wave model was configured with the same settings as the forecast system working in Cartagena Bay. The wave parameters were estimated as follows:
H m 0 = 4 m 0
T m = m 0 m 1
where m n is the n order moment:
m n = f n S ( f , θ ) d f d θ
D m = tan 1 ( sin ( θ ) S ( f , θ ) d f d θ cos ( θ ) S ( f , θ ) d f d θ )
where S ( f , θ ) is the wave energy spectrum, with f as the wave frequency and θ as the wave direction.
The period of measurement ranged from 31 August 2021 to 29 December 2021, with a gap of 15 days in October due to maintenance work.
In terms of wave height in Figure 8, we observed a slight underestimation (<0.5 m) in the peaks and an overestimation bias of the mean period of 2 s. In the case of the mean wave direction, the data agreed with the description in Section 2.1, where the mean wave direction is generally from the southwest and west; the differences between our observations and model results will be studied in detail in further investigations, and are out of the scope of this paper at the moment. However, these discrepancies are within the typical range of error between wave models and observations [16]; currently, we are working on applying a machine learning correction to the output data of the wave model by using a convolutional neural network to improve this information, thus increasing the fit with field observations.
Regarding the ADCP observations, the wave height presented a range of 1.0–2.5 m with two storms (3.5 and 3.0 m) of long swells (16 and 12 s, respectively), both from the southwest direction, which is common during the winter months. Starting in the spring, the wave height began to decrease (~2 m) with a mean wave period around 10 s, while the southwest mean wave direction was maintained. These conditions continued during the summer, with sporadic northwest storms of lower wave height (not shown).

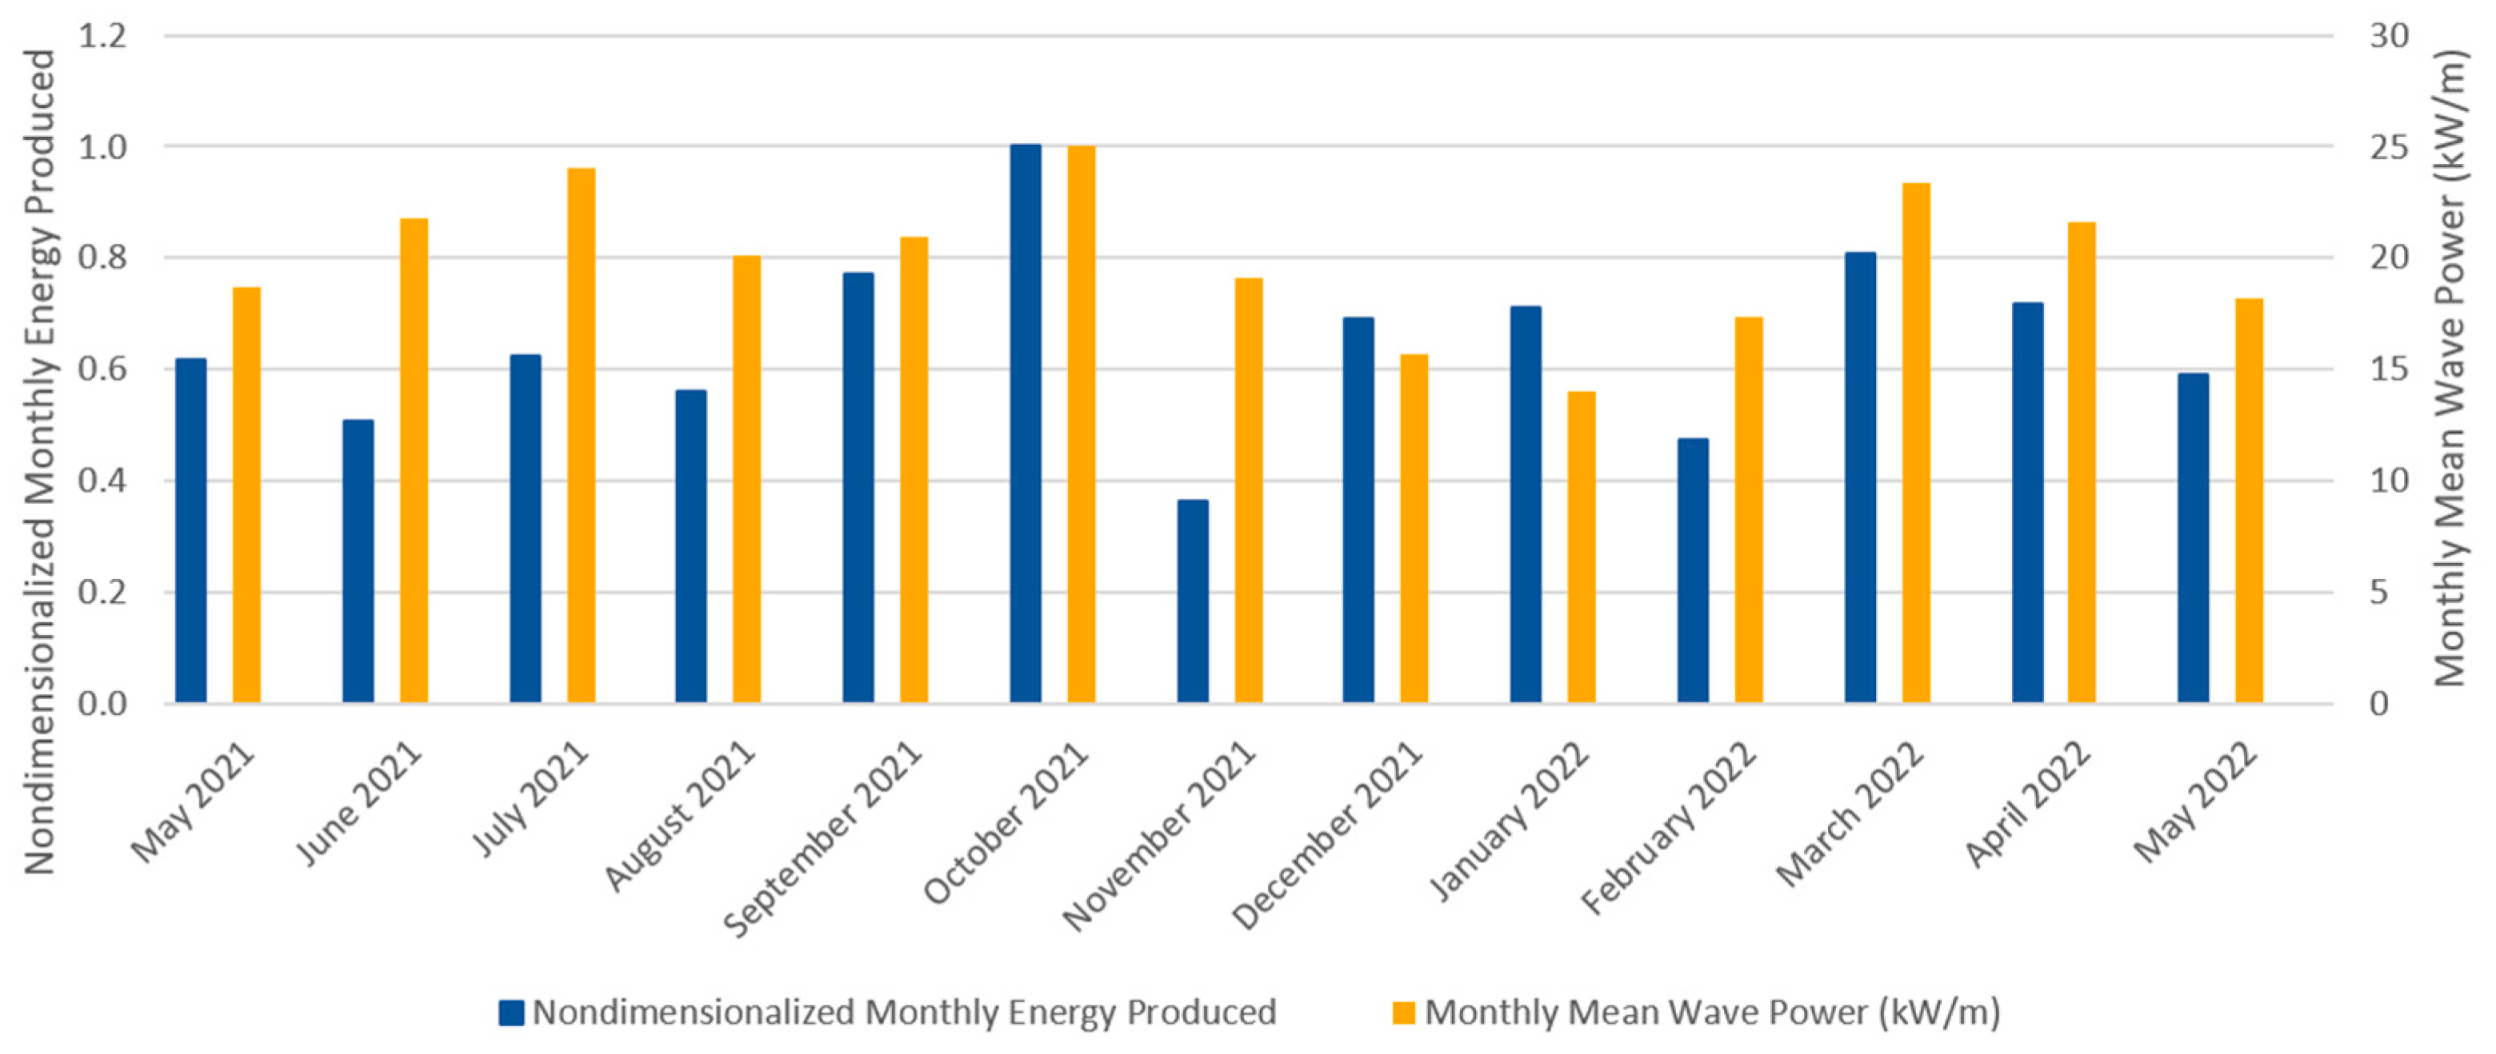
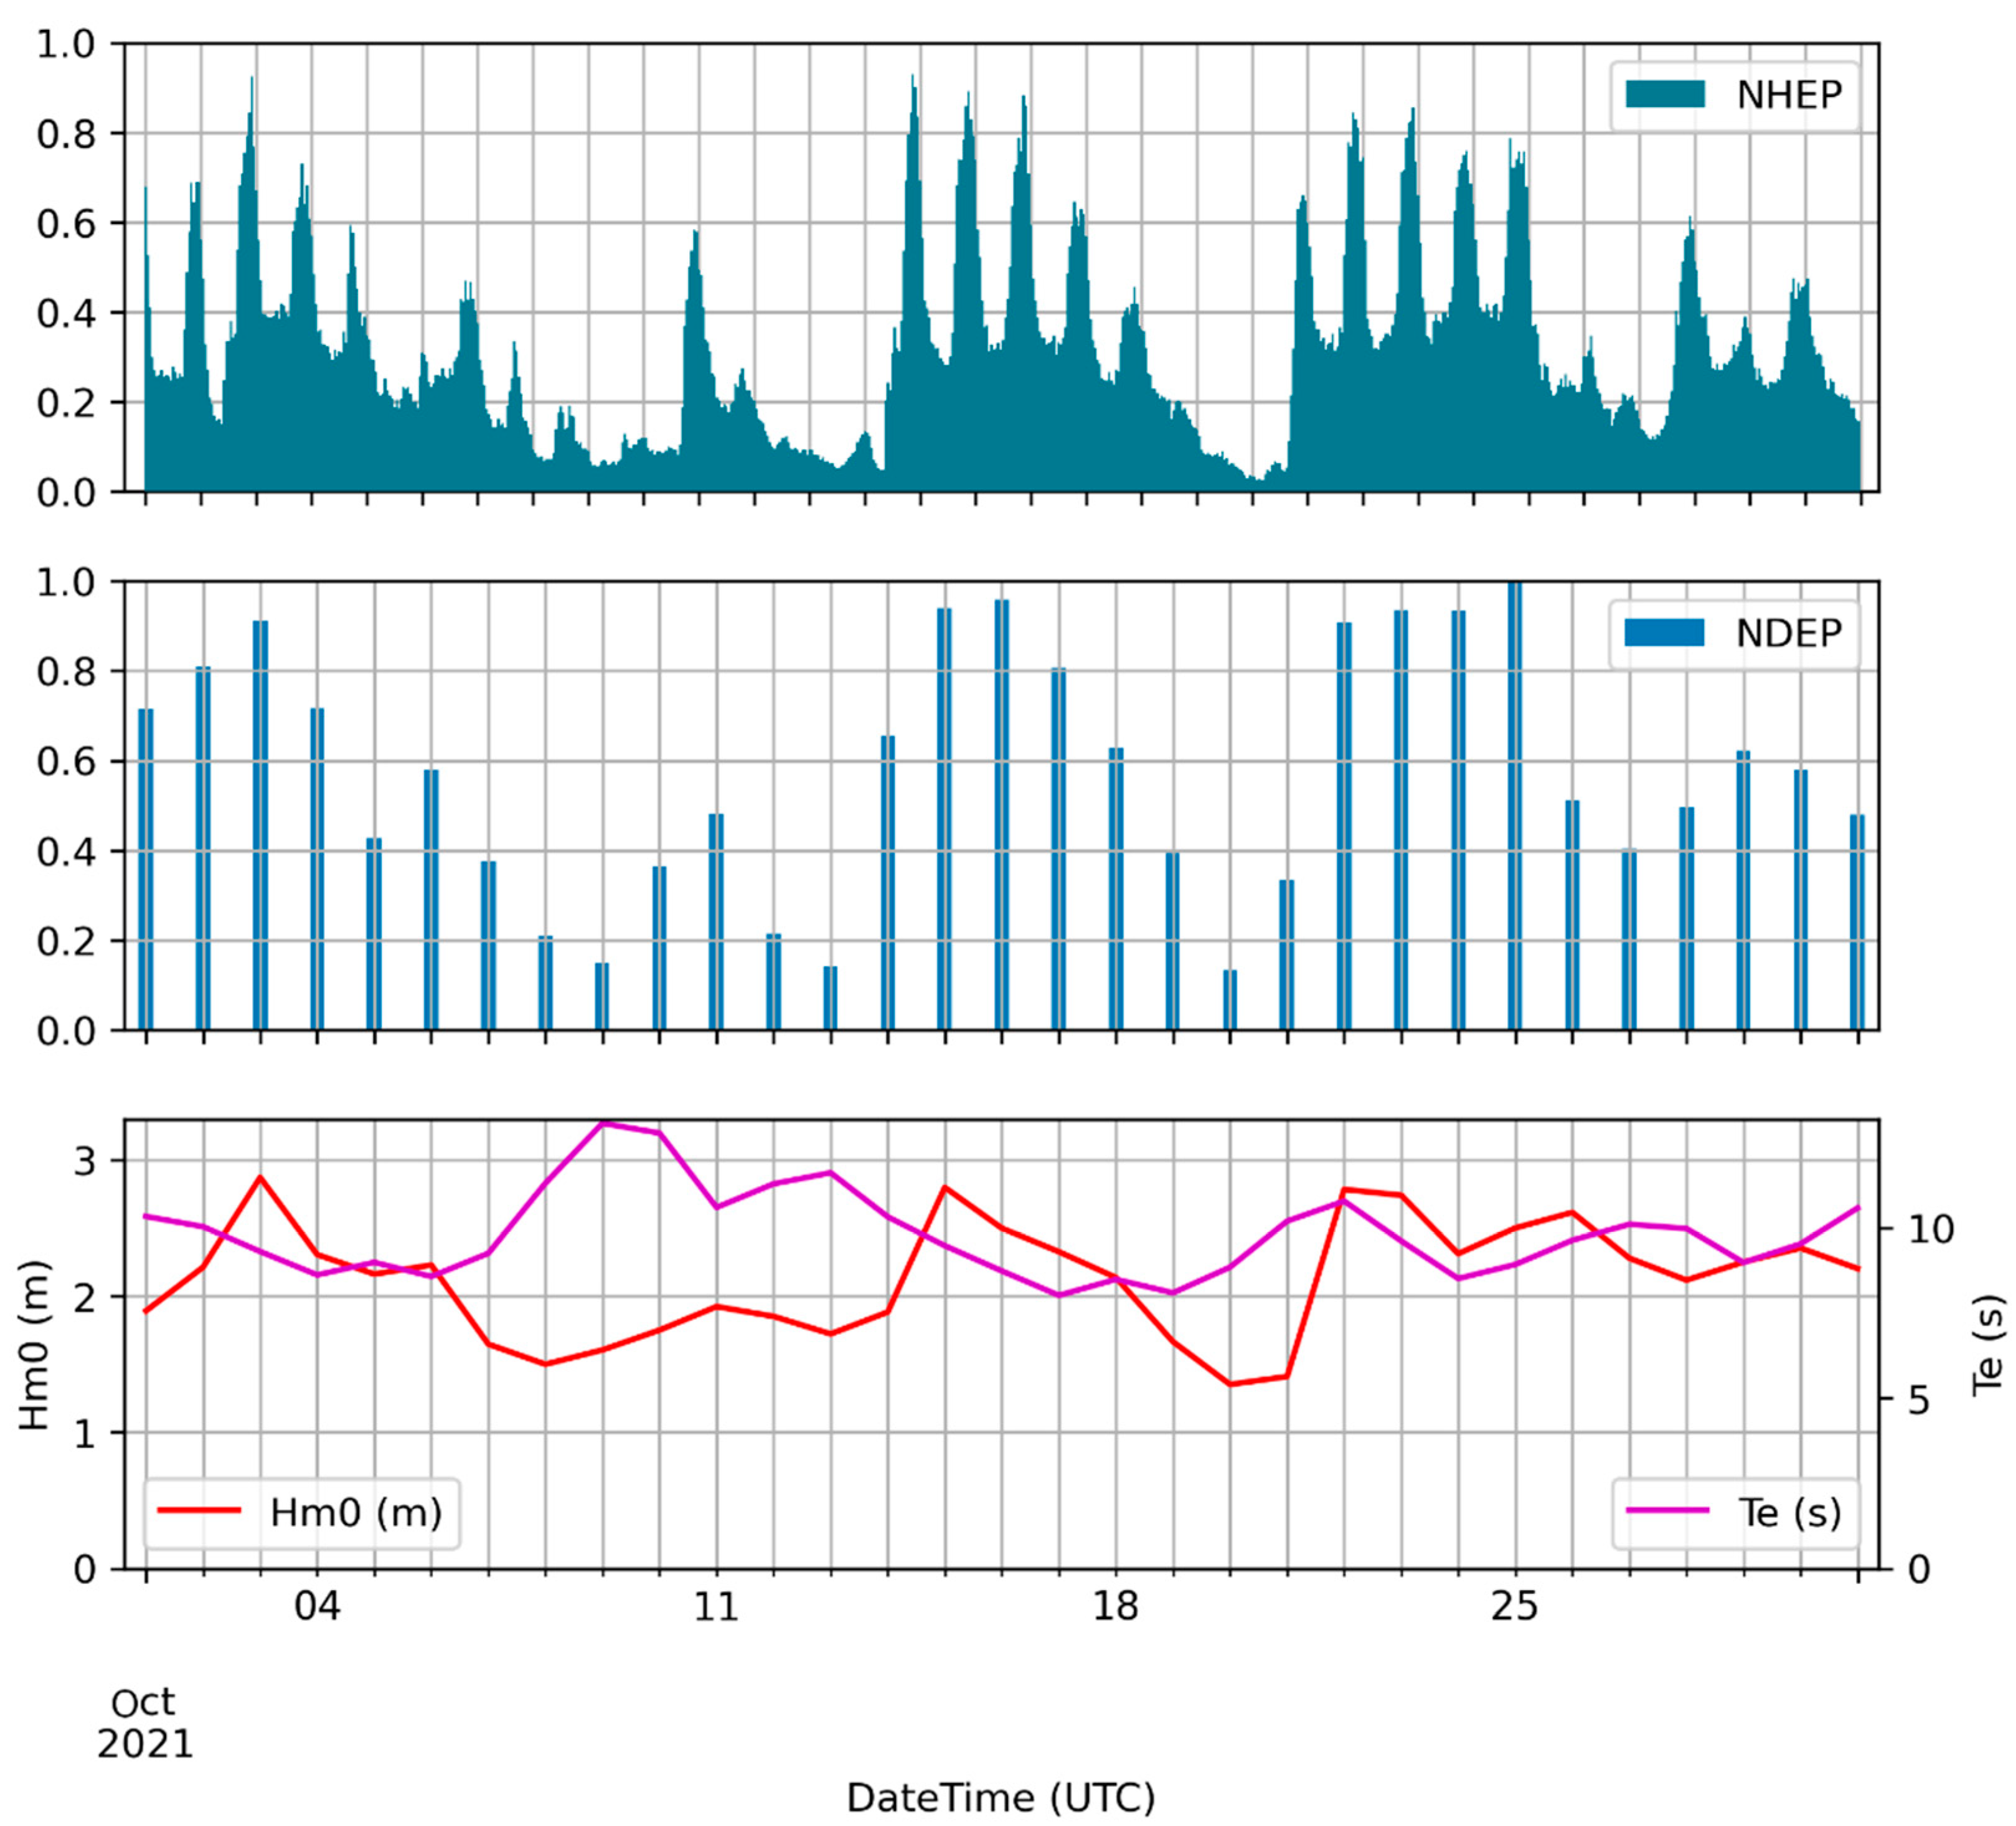
3.2. Energy Production
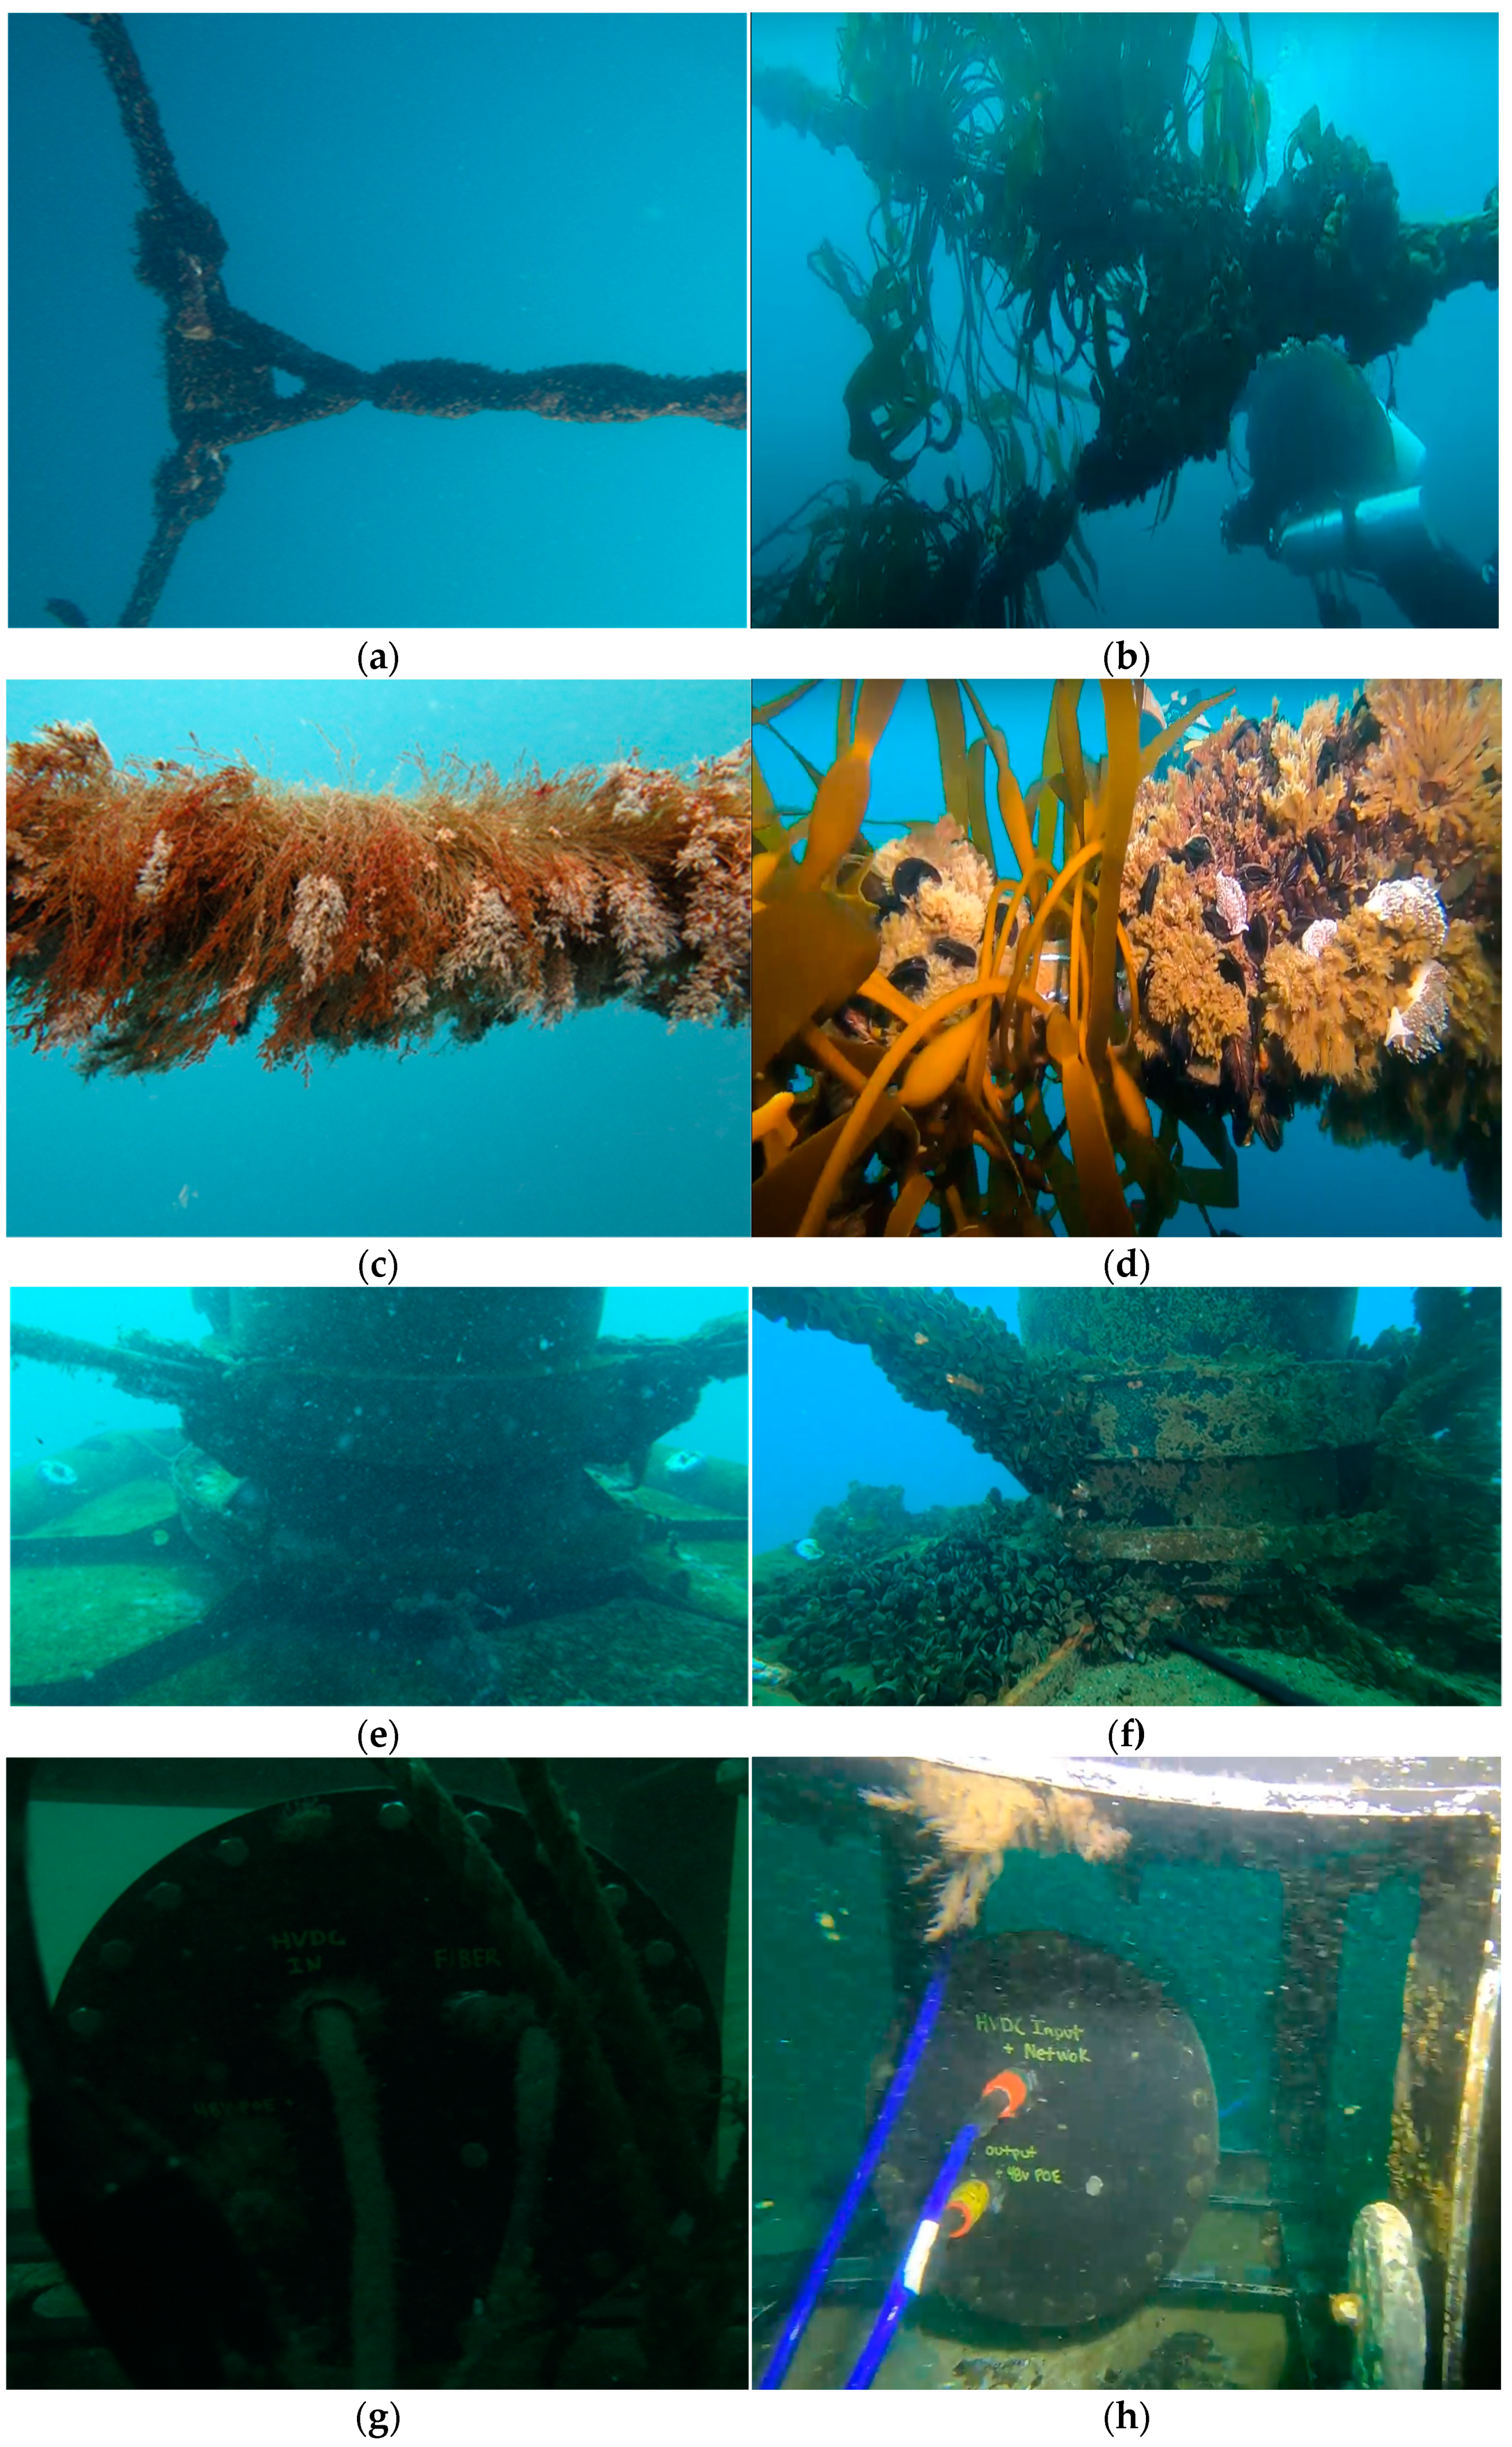
Figure 9 shows the nondimensionalized monthly energy produced and monthly mean wave power (kW/m) from the start of the operation to June 2022. Figure 10 shows the nondimensionalized hourly energy produced (NHEP) and the nondimensionalized daily energy produced (NDEP) by the WEC for the month with the greatest energy production (October 2021), while Figure 11 shows the same for the month with the least energy production without stopping the system (January 2022). It is important to mention that during the months of November (12 days), February (5 days), and March (4 days), programmed energy interruptions were made in the system due to interventions in the surrounding monitoring system, which for safety reasons required PowerBuoy operation to stop. Additionally, the daily wave height Hm0 and energy period Te, which were obtained from the WW3 hindcast for those periods, are included in Figure 10 and Figure 11.

3.3. Video Footage

Two routine inspections were carried out during the project; these were conducted by two scuba divers, who took samples, photos, and videos at the same points of interest to subsequently carry out analyses and comparisons over time. These inspections were carried out at 3 and 15 months after installation, in July 2021 and July 2022, respectively, with 12 months between them.

4. Discussion

The preliminary research presented in this work with the aim of installing the PB3 indicated that the site had sea-state conditions with wave heights close to 2 m more than 80% of the time and predominant SW swells (~12 s and 230°). The observations collected from the AWAC ADCP (Figure 8) agree with the preliminary studies, confirming the great energy potential of the chosen site.
In terms of energy production, in Figure 9, we can notice that if we exclude the month of November, in which the buoy was stopped for 12 days, the nondimensionalized monthly energy produced and monthly mean wave power (kW/m) show a good correlation. This correlation was expected, as information from preliminary studies was used to adjust the device to the predominant sea conditions in the study area, thus providing optimal performance. In addition, we can see that the PB3 produced energy every month since installation, with differences of more than double the energy production between the highest and the lowest month. In summary, the month with the greatest energy production was October 2021, at the end of the winter, and the month with the least energy production without stopping the system was January 2022, in the middle of the summer, indicating significant seasonal variations that require further study.
In Figure 10, we observe that in October, the month with the greatest energy production, the PowerBuoy generated energy every hour in a non-uniform way; nevertheless, many peaks of energy production were recorded. This triggered daily disparities in energy production, with differences of more than five times between one day and another, which is in line with other energy production data from other sites [4]. On the other hand, January 2022—which was the month with the least energy production without stopping the system, as is clear in Figure 11—the conditions are similar to October in terms of energy production variability; between hours, there were significant differences of more than five times, although energy was produced during every single hour of the month. The main difference in energy production between October 2021 and January 2022 was not the energy factor, since in both cases the PB3 produced energy continuously. The main differences were observed for the instantaneous amount of energy produced and its magnitude, having more peaks of maximum energy and a larger baseline production in October compared to January.
If we compare the daily energy produced with the wave conditions for the months considered—October 2021 in Figure 10 and January 2022 in Figure 11—we can observe that in October 2021, the mean wave height was Hm0 = 2.1 m with a standard deviation of 0.5 m and the mean energy period was Te = 9.8 s with a standard deviation of 1.3 s, while in January the mean wave height was Hm0 = 1.7 m with a standard deviation of 0.4 m and the mean energy period was Te = 9.0 s with a standard deviation of 1.0 s. The daily production was highest for a wave height Hm0 > 1.9 m and lowest for Hm0 < 1.5 m; it also depended slightly on the energy period, which is in agreement with the literature and simulations for this WEC under these wave conditions, where the power generated is not only dependent on wave height and energy period, but also on the shape of the wave spectra [26].
In terms of the video footage, we identified differences in the presence of biofouling between the two inspections: the first took place in July 2021, 3 months after the deployment of the PB3, while the second occurred in July 2022, 15 months after the deployment of the PB3 and 12 months since the last inspection. In the triple mooring connector between the PB3 and the auxiliary buoys, the colonization of hydrozoans was observed during the first inspection, dominating in the succession of settled species (Figure 12a); during the second inspection, it was found that the dominant species were mainly mussels, Mytilus chilensis, and giant kelp, Macrosystis pyrifera (Figure 12b). Regarding the holding rope at a depth of 5 m, during the first inspection we observed a dominant encrustation of exclusively hydrozoans between 5 and 6 cm long (Figure 12c), while in the second, it was clearly observed that the succession of species was modified, where mainly sessile organisms, such as the mussel Mytilus chilensis and the giant kelp Macrosystis pyrifera, dominated (Figure 12d). With regard to the balance plate at a depth of 10–13 m in July 2021, only hydrozoans were identified as the main colonizers (Figure 12e), while 12 months later, notable differences were observed in the colonizing species: the mussel Mytilus chilensis was mainly observed as dominating the encrustation while the Austromegabalanus barnacle had a considerably lesser presence (Figure 12f). Related to the junction box at a depth of 34 m after 3 and 15 months of immersion (Figure 12g,h), we clearly observed no presence of biofouling and no signs of encrusting organisms and their colonization and succession; this was due to the absence of light being a determining factor at the time of surface colonization.

5. Conclusions

More than a year after the installation of the OSL on the central coast of Chile in the south Pacific Ocean, the first preliminary results are available for the scientific community and industry. In spite of the short period of operation, we can highlight some truly important aspects: First, the PB3 mainly operates with a wave sea-state in normal conditions with no special peaks out of the normal range, as estimated in the previous studies carried out for this project (e.g., 80% conditions of Hs ~ 2.0 m and Dm ~220–240° with peaks of Hs ~ 4.0 m). In terms of energy production, the main results are in line with what other sites have reported [4]: constant energy production since installation but with significant variability, exhibiting differences in energy production of more than five times between consecutive days. In addition, there were some seasonal variations observed, with October and January as the months with the greatest and least energy production, respectively. Taking into consideration wave parameters, it is easy to notice that the daily energy production was highest for a wave height Hm0 > 1.9 m and lowest for Hm0 < 1.5 m, and it showed a slight correlation with the energy period, indicating that while the energy produced is dependent on the wave height and energy period, these are not the only factors, and considering only these parameters may lead to erroneous analyses [26].
Regarding the biofouling observations, the antifouling-coated PB3 column showed a relatively slow settlement and growth of macroscopic biofouling. In contrast, the unpainted surfaces of the PB3, anchoring lines, junction boxes, buoys, etc., were completely covered (ca. 100%) by hydrozoans within one month. The upside-down surfaces of buoys and the PB3 were also colonized by the pedunculate barnacle Lepas sp. The anchoring chains were less covered than the ropes and surfaces above ca. 8–10 m, which were more covered than deeper areas. After approximately 12 months, the biofouling community included large sessile invertebrates such as the barnacle Austromegabalanus psitaccus, the mussel Mytilus chilensis, and the giant kelp Macrocystis pyrifera.
As we continue operating the OSL project and collecting data, more valuable information will be available in the upcoming months. We are also planning our future work in research and development, one of the key aspects of which will be interdisciplinary research connecting wave energy generation, data collection and management, and the detailed analysis of the environmental interactions of the OSL at the coast. During our six years of work at the MERIC center, interdisciplinary research was established from the beginning, with the close collaboration among different actors and stakeholders that took part in the development of this project. This new platform for environmental monitoring opens a new era in research on and the development of marine energies in the continent, and it will generate new activities in multiple research and academic areas.
The spectral data from the AWAC device will be used to improve the current forecast system using machine learning techniques ([27,28]). In the same manner, the long-term data from mooring line forces will be used to validate and develop new numerical and experimental models that will provide additional insights into the response of the system and the mooring lines under conditions imposed by extreme events, as shown, for example, in [29].
Considerable opportunities for education have also risen from this project. The OSL will not only strengthen the research and development capacities of technological applications but will also serve to create undergraduate and graduate teaching units from the academic institutions working in MERIC. A new generation of professionals and scientists in Latin America will then be able to grow from these new possibilities.
Our work with the community not only implied avoiding acceptability problems throughout the development of the project but also strengthened our relations with the people living near the site. In this way, both the project and the community have benefited from enriching interactions. Proof of this is found in the interest of the local community of Las Cruces not only in the installation of this system and its possible benefits in tourism, teaching, and research but also in their interest in working with us and encouragement to improve the accessibility of the real-time data and forecasting system generated by the OSL project. Specifically, communities are interested in this information for the continuous development of coastal economic activities, such as fisheries and shellfish harvesting. Therefore, the OSL brings an enormous possibility of transforming Chile into a research and development pole at the Latin American level for marine energies and environmental monitoring, achieving a global position in these areas in the upcoming decades.

Author Contributions

Conceptualization, J.C., F.L., L.S., C.E., S.A.N., G.T., C.C., R.C., D.M., B.P., N.O. and R.F.; Data curation, J.C., F.L. and L.S.; Formal analysis, J.C., F.L. and L.S.; Funding acquisition, D.M. and B.P.; Investigation J.C., F.L., L.S., C.E., S.A.N., G.T., C.C., R.C., B.P., N.O. and R.F.; Methodology, J.C., F.L., L.S., C.E., S.A.N., G.T., C.C., R.C., D.M., B.P., N.O. and R.F.; Project administration, B.P.; Resources, D.M. and B.P.; Software, J.C., F.L. and L.S.; Supervision, C.E., S.A.N., G.T., C.C., R.C., D.M. and B.P.; Validation, J.C., F.L., L.S., C.E., S.A.N., G.T., C.C., R.C., D.M., B.P., N.O. and R.F.; Visualization, J.C., F.L. and L.S.; Writing—original draft, J.C., F.L., L.S., C.E., S.A.N., G.T., C.C., R.C., D.M., B.P., N.O. and R.F.; Writing—review and editing, J.C., F.L., L.S., C.E., S.A.N., G.T., C.C., R.C., D.M., B.P., N.O. and R.F. All authors have read and agreed to the published version of the manuscript.

Funding

This study was conducted under the partial support of MERIC—Marine Energy Research and Innovation Center (14CEI2-28228). Powered@NLHPC: This research was partially supported by the supercomputing infrastructure of the NLHPC (ECM-02).

Institutional Review Board Statement

Not applicable.

Informed Consent Statement

Not applicable.

Data Availability Statement

All the data presented in this study are available for scientific purposes upon request at https://www.meric.cl (accessed on 15 June 2022), with the exception of the energy produced data, which is not publicly available for being considered “Proprietary information” by Ocean Power Technology.

Conflicts of Interest

The authors declare no conflict of interest.

References

  1. Gunn, K.; Stock-Williams, C. Quantifying the global wave power resource. Renew. Energy 2012, 44, 296–304. [Google Scholar] [CrossRef]
  2. Enferad, E.; Nazarpour, D. Ocean’s Renewable Power and Review of Technologies: Case Study Waves. In New Developments in Renewable Energy, 1st ed.; Arman, H., Yuskel, I., Eds.; IntechOpen: London, UK, 2013; Volume 3, pp. 273–300. [Google Scholar] [CrossRef]
  3. Rusu, L.; Onea, F. The performance of some state-of-the-art wave energy converters in locations with the worldwide highest wave power. Renew. Sustain. Energy Rev. 2017, 75, 1348–1362. [Google Scholar] [CrossRef]
  4. Parsa, K.; Mekhiche, M.; Sarokhan, J.; Stewart, D. Performance of OPT’s Commercial PB3 PowerBuoy™ during 2016 Ocean Deployment and Comparison to Projected Model Results. In Proceedings of the ASME 2017 36th International Conference on Ocean, Offshore and Arctic Engineering, Trondheim, Norway, 25–30 June 2017; Volume 10. Ocean Renewable Energy. [Google Scholar] [CrossRef]
  5. Cocquempot, L.; Delacourt, C.; Paillet, J.; Riou, P.; Aucan, J.; Castelle, B.; Charria, G.; Claudet, J.; Conan, P.; Coppola, L.; et al. Coastal Ocean and Nearshore Observation: A French Case Study. Front. Mar. Sci. 2019, 6, 324. [Google Scholar] [CrossRef]
  6. Bernard, L.; Birkemeier, W.; Bouchard, R.; Buckley, E.; Burnett, W.; Jensen, R.; Luther, M.; O’Reilly, W.; Tamburri, M.; Teng, C. A National Operational Wave Observation Plan, 1st ed.; NOAA Integrated Ocean Observing System: Silver Spring, MD, USA, 2009. [Google Scholar]
  7. Mouslim, H.; Babarit, A.; Clément, A.; Borgarino, B. Development of the French wave energy test site SEM-REV. In Proceedings of the 8th European Wave and Tidal Energy Conference, Uppsala, Sweden, 7–10 September 2009. [Google Scholar]
  8. Cross, P. Hawai’i National Marine Renewable Energy Center (HINMREC); Report No. DE-FG36-08GO18180; Report for US Department of Energy (DOE); University of Hawaii: Honolulu, HI, USA, 2020. [Google Scholar] [CrossRef]
  9. The European Marine Energy Centre. Available online: https://www.emec.org.uk/ (accessed on 29 July 2022).
  10. Pacific Marine Energy Center. Available online: https://www.pmec.us/ (accessed on 29 July 2022).
  11. Hagen, R.A.; Vergara, H.; Naar, D.F. Morphology of San Antonio submarine canyon on the central Chile forearc. Mar. Geol. 1996, 129, 197–205. [Google Scholar] [CrossRef]
  12. Arróspide, F.; Mao, L.; Escauriaza, C. Morphological evolution of the Maipo River in central Chile: Influence of instream gravel mining. Geomorphology 2018, 306, 182–197. [Google Scholar] [CrossRef]
  13. Loose, B.; Niño, Y.; Escauriaza, C. Finite volume modeling of variable density shallow-water flow equations for a well-mixed estuary: Application to the Río Maipo estuary in central Chile. J. Hydraul. Res. 2005, 43, 339–350. [Google Scholar] [CrossRef]
  14. Flores, R.P.; Williams, M.E.; Horner-Devine, A.R. River plume modulation by infragravity wave forcing. Geophys. Res. Lett. 2022, 49, e2021GL097467. [Google Scholar] [CrossRef]
  15. Beyá, J.; Álvarez, M.; Gallardo, A.; Hidalgo, H.; Winckler, P. Generation and validation of the Chilean Wave Atlas database. Ocean Model. 2017, 116, 16–32. [Google Scholar] [CrossRef]
  16. Lucero, F.; Catalan, P.A.; Ossandón, A.; Beyá, J.; Puelma, A.; Zamorano, L. Wave energy assessment in the central-south coast of Chile. Renew. Energy 2017, 114, 120–131. [Google Scholar] [CrossRef]
  17. Thiel, M.; Macaya, E.; Acuna, E.; Arntz, W.; Bastias, H.; Brokordt, K.; Camus, P.; Castilla, J.; Castro, L.; Cortes, M.; et al. The Humboldt Current System of Northern and Central Chile. Oceanogr. Mar. Biol. 2007, 45, 195–345. [Google Scholar]
  18. Tiron, R.; Mallon, F.; Dias, F.; Reynaud, E.G. The challenging life of wave energy devices at sea: A few points to consider. Renew. Sustain. Energy Rev. 2015, 43, 1263–1272. [Google Scholar] [CrossRef]
  19. The WAVEWATCH III® Development Group (WW3DG). User Manual and System Documentation of WAVEWATCH III® Version 6.07; Tech. Note 333; NOAA/NWS/NCEP/MMAB: College Park, MD, USA, 2019; p. 465, Appendices. [Google Scholar]
  20. Saha, S.; Moorthi, S.; Wu, X.; Wang, J.; Nadiga, S.; Tripp, P.; Behringer, D.; Hou, Y.; Chuang, H.; Iredell, M.; et al. NCEP Climate Forecast System Version 2 (CFSv2) 6-Hourly Products; Research Data Archive at the National Center for Atmospheric Research, Computational and Information Systems Laboratory; National Center for Atmospheric Research, Computational and Information Systems Laboratory: Boulder, CO, USA, 2011. [Google Scholar] [CrossRef]
  21. Luettich, R.A.; Westerink, J.J.; Scheffner, N.W. ADCIRC: An Advanced Three-Dimensional Circulation Model for Shelves, Coasts, and Estuaries, I: Theory and Methodology of ADCIRC-2DDI and ADCIRC-3DL; Technical Report DRP-92-6; Coastal Engineering Research Center (U.S.): Washington, DC, USA; Engineer Research and Development Center (U.S.): Vicksburg, MS, USA, 1992; Volume 1, pp. 1–144. [Google Scholar]
  22. Edwards, K.; Mekhiche, M. Ocean Testing of a Wave-Capturing Power Buoy. In Ocean Waves Workshop ScholarWorks@UNO; Ocean Power Technologies: Monroe Township, NJ, USA, 2011. [Google Scholar]
  23. Copping, A.E.; Hemery, L.G. OES-Environmental 2020 State of the Science Report: Environmental Effects of Marine Renewable Energy Development around the World, 1st ed.; Ocean Energy Systems (OES): Paris, France, 2020. [Google Scholar]
  24. Ruano-Chamorro, C.; Castilla, J.C.; Gelcich, S. Human dimensions of marine hydrokinetic energies: Current knowledge and research gaps. Renew. Sustain. Energy Rev. 2018, 82 Pt 3, 1979–1989. [Google Scholar] [CrossRef]
  25. Estévez, R.A.; Espinoza, V.; Ponce Oliva, R.D.; Vásquez-Lavín, F.; Gelcich, S. Multi-Criteria Decision Analysis for Renewable Energies: Research Trends, Gaps and the Challenge of Improving Participation. Sustainability 2021, 13, 3515. [Google Scholar] [CrossRef]
  26. Parsa, K.; Kim, M.; Williams, N. Accurate WEC Power Estimation for Multi-Modal Wave Spectra. In Proceedings of the ASME 2022 41st International Conference on Ocean, Offshore and Arctic Engineering OMAE, Hamburg, Germany, 5–10 June 2022. [Google Scholar]
  27. Den Bieman, J.P.; Van Gent, M.R.; Van den Boogaard, H.F. Wave overtopping predictions using an advanced machine learning technique. Coast. Eng. 2020, 166, 103830. [Google Scholar] [CrossRef]
  28. Ellenson, A.; Pei, Y.; Wilson, G.; Ozkan Haller, H.T.; Fern, X. An application of a machine learning algorithm to determine and describe error patterns within wave model output. Coast. Eng. 2020, 157, 103595. [Google Scholar] [CrossRef]
  29. Ringsberg, J.W.; Yang, S.H.; Lang, X.; Johnson, E.; Kamf, J. Mooring forces in a floating point-absorbing WEC system—A comparison between full-scale measurements and numerical simulations. Ships Offshore Struct. 2020, 15, S70–S81. [Google Scholar] [CrossRef] [Green Version]
Figure 1. (a) Location and OSL site in the region of Valparaíso in central Chile with respect to the boundaries of the country at the western coast of the continent. (b) View of the bathymetric description of the bay, indicating the latitude and longitude of the site.
Jmse 10 01249 g001
Figure 2. Monthly wave power (kW/m) distribution at the OSL site in Las Cruces.
Jmse 10 01249 g002
Figure 3. Wave forecast system using the WaveWatch III model in Cartagena Bay: (a) global grid, 0.5° resolution; (b) unstructured mesh and high-resolution mesh in Cartagena Bay.
Jmse 10 01249 g003
Figure 4. (a) Diagram with the main parts of the PB3 PowerBuoy, courtesy of Ocean Power Technologies. (b) PB3 PowerBuoy on the preconditioning stage.
Jmse 10 01249 g004
Figure 5. (a) General arrangement of the OSL project, including the PowerBuoy and sensors and their layout with respect to ECIM. (b) Array of mooring lines, where “P” is the anchor’s final location. (c) Diagram of mooring lines of the OSL and specific components of the system. (d) ADCP AWAC 600 kHz from Nortek installed on the self-aligning structure. (e) Image of the two water-quality sensors before sea deployment. (f) Atmos meteorological station and X-band radar on the roof of ECIM. (g) Image of the measurements and detection area of the X-band radar with a range of 1.5 km.
Jmse 10 01249 g005aJmse 10 01249 g005b
Figure 6. (a) Flyer for the scientific community. (b) OSL landing page for local stakeholders. Both in Spanish, for reference only.
Jmse 10 01249 g006
Figure 7. (a) Lowering of the PB3 PowerBuoy into the water at San Antonio Port. (b) PB3 PowerBuoy deployed at its final position in Cartagena Bay.
Jmse 10 01249 g007
Figure 8. Time series of the significant spectra for wave height (Hm0 (m)), mean period (Tm (s)), and mean direction (Dm (°)) between 31 August 2021 and 29 December 2021. The orange line corresponds to the hindcast of the WW3 numerical modeling in the vicinity of the OPT buoy. The blue line corresponds to the processed results of the ADCP during the same period.
Jmse 10 01249 g008
Figure 9. Nondimensionalized monthly energy produced and monthly mean wave power (kW/m) from the start of the operation to June 2022.
Jmse 10 01249 g009
Figure 10. Upper and middle panel: nondimensionalized hourly and daily energy produced in October 2021, respectively. Lower panel: daily wave height Hm0 and energy period Te obtained from the WW3 hindcast for the same period.
Jmse 10 01249 g010
Figure 11. Upper and middle panel: nondimensionalized hourly and daily energy produced in January 2022, respectively. Lower panel: daily wave height Hm0 and energy period Te obtained from the WW3 hindcast for the same period.
Jmse 10 01249 g011
Figure 12. Images taken during two inspections 3 and 15 months after installation, including a triple mooring connector between the PB3 and the auxiliary buoys at a depth of 5 m in July 2021 (a) and July 2022 (b). Holding rope in July 2021 (c) and July 2022 (d). Balance plate in July 2021 (e) and July 2022 (f). First junction box at a depth of 34 m in July 2021 (g) and July 2022 (h).
Jmse 10 01249 g012
Table 1. Offshore instrumentation and sampling frequencies.
InstrumentManufacturerSampling Frequencies
ADCP AWAC 600 kHzNortek2 (Hz)
Water quality sensorsNKE Instrumentation2.5 (Hz)
Load pinsStrainstall1 (Hz)
Internal data PowerBuoyOcean Power Technologies2 (Hz)
Table 2. Onshore instrumentation and sampling frequencies.
InstrumentCompanySampling Frequencies
Meteorological stationAtmosEvery 10 min
X-band radar with SeaDarQ V5 softwareNortekEvery 60 min
Publisher’s Note: MDPI stays neutral with regard to jurisdictional claims in published maps and institutional affiliations.

