1. Introduction
Vertical cell guides (VCG) are used to position containers vertically inside of each ship’s holds (see
Figure 1) to slide the containers in the right direction. Containers tend to swing during handling procedures and in certain conditions, they may swing too strongly and damage the surrounding objects, either on land or in mid-air. If the metal structure of the guides is damaged by previous critical impacts or a sum of less critical impacts to the same space, then the container can get stuck during handling operations, causing the same container to get damaged and damage additional surrounding metal structures, including the same VCG. Additionally, this leads to significant downtimes when adding new or replacing damaged portions of the VCG along the entire length of the hold, resulting in subsequent legal actions and sudden changes in managerial decisions concerning further relocation of the container. Therefore, securing the process of handling via in-time access to events, and access to data, is a priority to insurance companies, logistics representatives, and operators [
1].
Long metal cables attached to the quay crane (QC) spreader are used to move containers along the VCG [
2]. That is why the handling process itself is nonlinear, where the observed motion of the spreader with the attached container follows a nonlinear state equation, more similar to a complex sinusoidal dependency due to the natural swinging of the two attached bodies in free space with the random noisiness of chaotic nature.
The control and prediction of trajectories of movement for both the spreader and the container is a complex computational task, due to the complexity of external impacts, the dynamics of the metal structures, and the involvement of unpredictable forces [
3,
4]. No existing mathematical models nor conventional computational techniques, including complexity full port digital twins, can accurately mimic the movements, dynamics, and outcomes of actual containers during handling operations, reproduce actual container impacts in various environments, and actual container sliding impacts with metal ship infrastructures [
5]. However, there are occasions when more straightforward and useful solutions integrating real-time data acquisition, analytics, and transfer systems are far more effective than conventional ones, giving users access to extremely effective digitized inspection tools [
6].
A focus of data science research is on usable signal processing methods for practical engineering solutions [
7,
8]. Due to the aforementioned factors, even though the linked study is still in its early stages, there is a wealth of scientific literature on this popular research direction in transportation-related subfields [
9,
10] and computer science categories [
11,
12,
13]. Digitized impact detection systems have not been applied on a broader scale due to many limiting factors and a lack of standardized solutions [
10]. The IDM draws attention to the aspects of a more involved methodology for detecting multiple feature impacts that are pertinent to the aforementioned and more general container handling procedures. The visibility of the actual impact processes and the ability to vary the threshold level might be improved by the addition of a wider range of criteria [
14]. The majority of the current research is focused on visual inspection-based damage identification employing observational data and handheld visual inspection instruments [
15]. For scientists and engineers, executing objective experiments and comparative trials under uniform settings is quite challenging due to the lack of consolidated datasets. The acceleration signal patterns can also be beneficial for forensics; for example, they can reveal whether the container was handled with care during operations or whether there were collisions with the VCG on board the ship that caused unnatural sway [
16,
17,
18], sliding effects, along with various ways of losing stability when being transported on the ship and elsewhere [
19,
20,
21]. New data-driven technologies are being created [
22,
23] to support the intelligent and sustainable development of digitized and secure logistics [
24,
25] to cope with the intense digitalization and globalization of trade, which mostly uses shipping containers [
26]. The purpose of this research is to further develop the engineering community’s and the participating organizations’ capacity for research in the field of smart logistics [
27].
To be able to adjust the system in practice, we continue to investigate the IDM technique based on signal filtering and threshold adjustment techniques while excluding natural causes from true impact occurrences. The remainder of this paper is organized as follows. The hardware framework is presented with a computational framework explaining, in brief, the IDM and the measurement experimental settings. The effectiveness of the IDM is confirmed in the results part concerning threshold variability, and the study findings are summarized together with plans for method improvement in the conclusions section.
2. Materials and Methods
The authors’ earlier study served as the foundation for the IDM methodology establishment and analytics that are being debated further, which also incorporates more recent measurement data from trials carried out in Klaipeda city [
3] Limited Liability Stevedoring Company (LLSC) “Klaipedos Smelte” container terminal. It involves customary practices for loading and unloading container ships. The data logger was mounted in the same location on the spreader of the quay crane (QC) during these experiments, recording the acceleration values to simulate the potential for sensing impacts on the containers if adjusted adequately. The entire handling procedure was documented during these studies and was most prominently covered in our earlier works [
6,
28,
29]. Our case studies allowed us to identify the period of each procedure carried out by the QC, not only in the inner parts of the ship but also until the final placement of the container on the truck. The main adaptability concept of the IDM deals with impacts on the VCG of the ship. The same metrics were used to assess the damage caused to the containers during subsequent transshipments close to the operators within the same terminal [
11].
A quay or yard crane (YC) that is transporting a container oscillates at its natural frequency as a result of numerous outside factors and mechanical parts that are highly dynamic. The oscillation curve in the plane is stochastic and close to the sinusoid fluctuation because the oscillation’s amplitude is too small when proportionally compared to the length of the steel cables holding the spreader with the attached container. However, external forces (wind, ship movement caused by waves, influence of the operator performing control actions—his overall skills, physical and mental stability, as well as additional operational vibrations, etc.) during the container handling process in the open air complete the container’s spectrum of motion with components of a different frequency at every step [
10,
30].
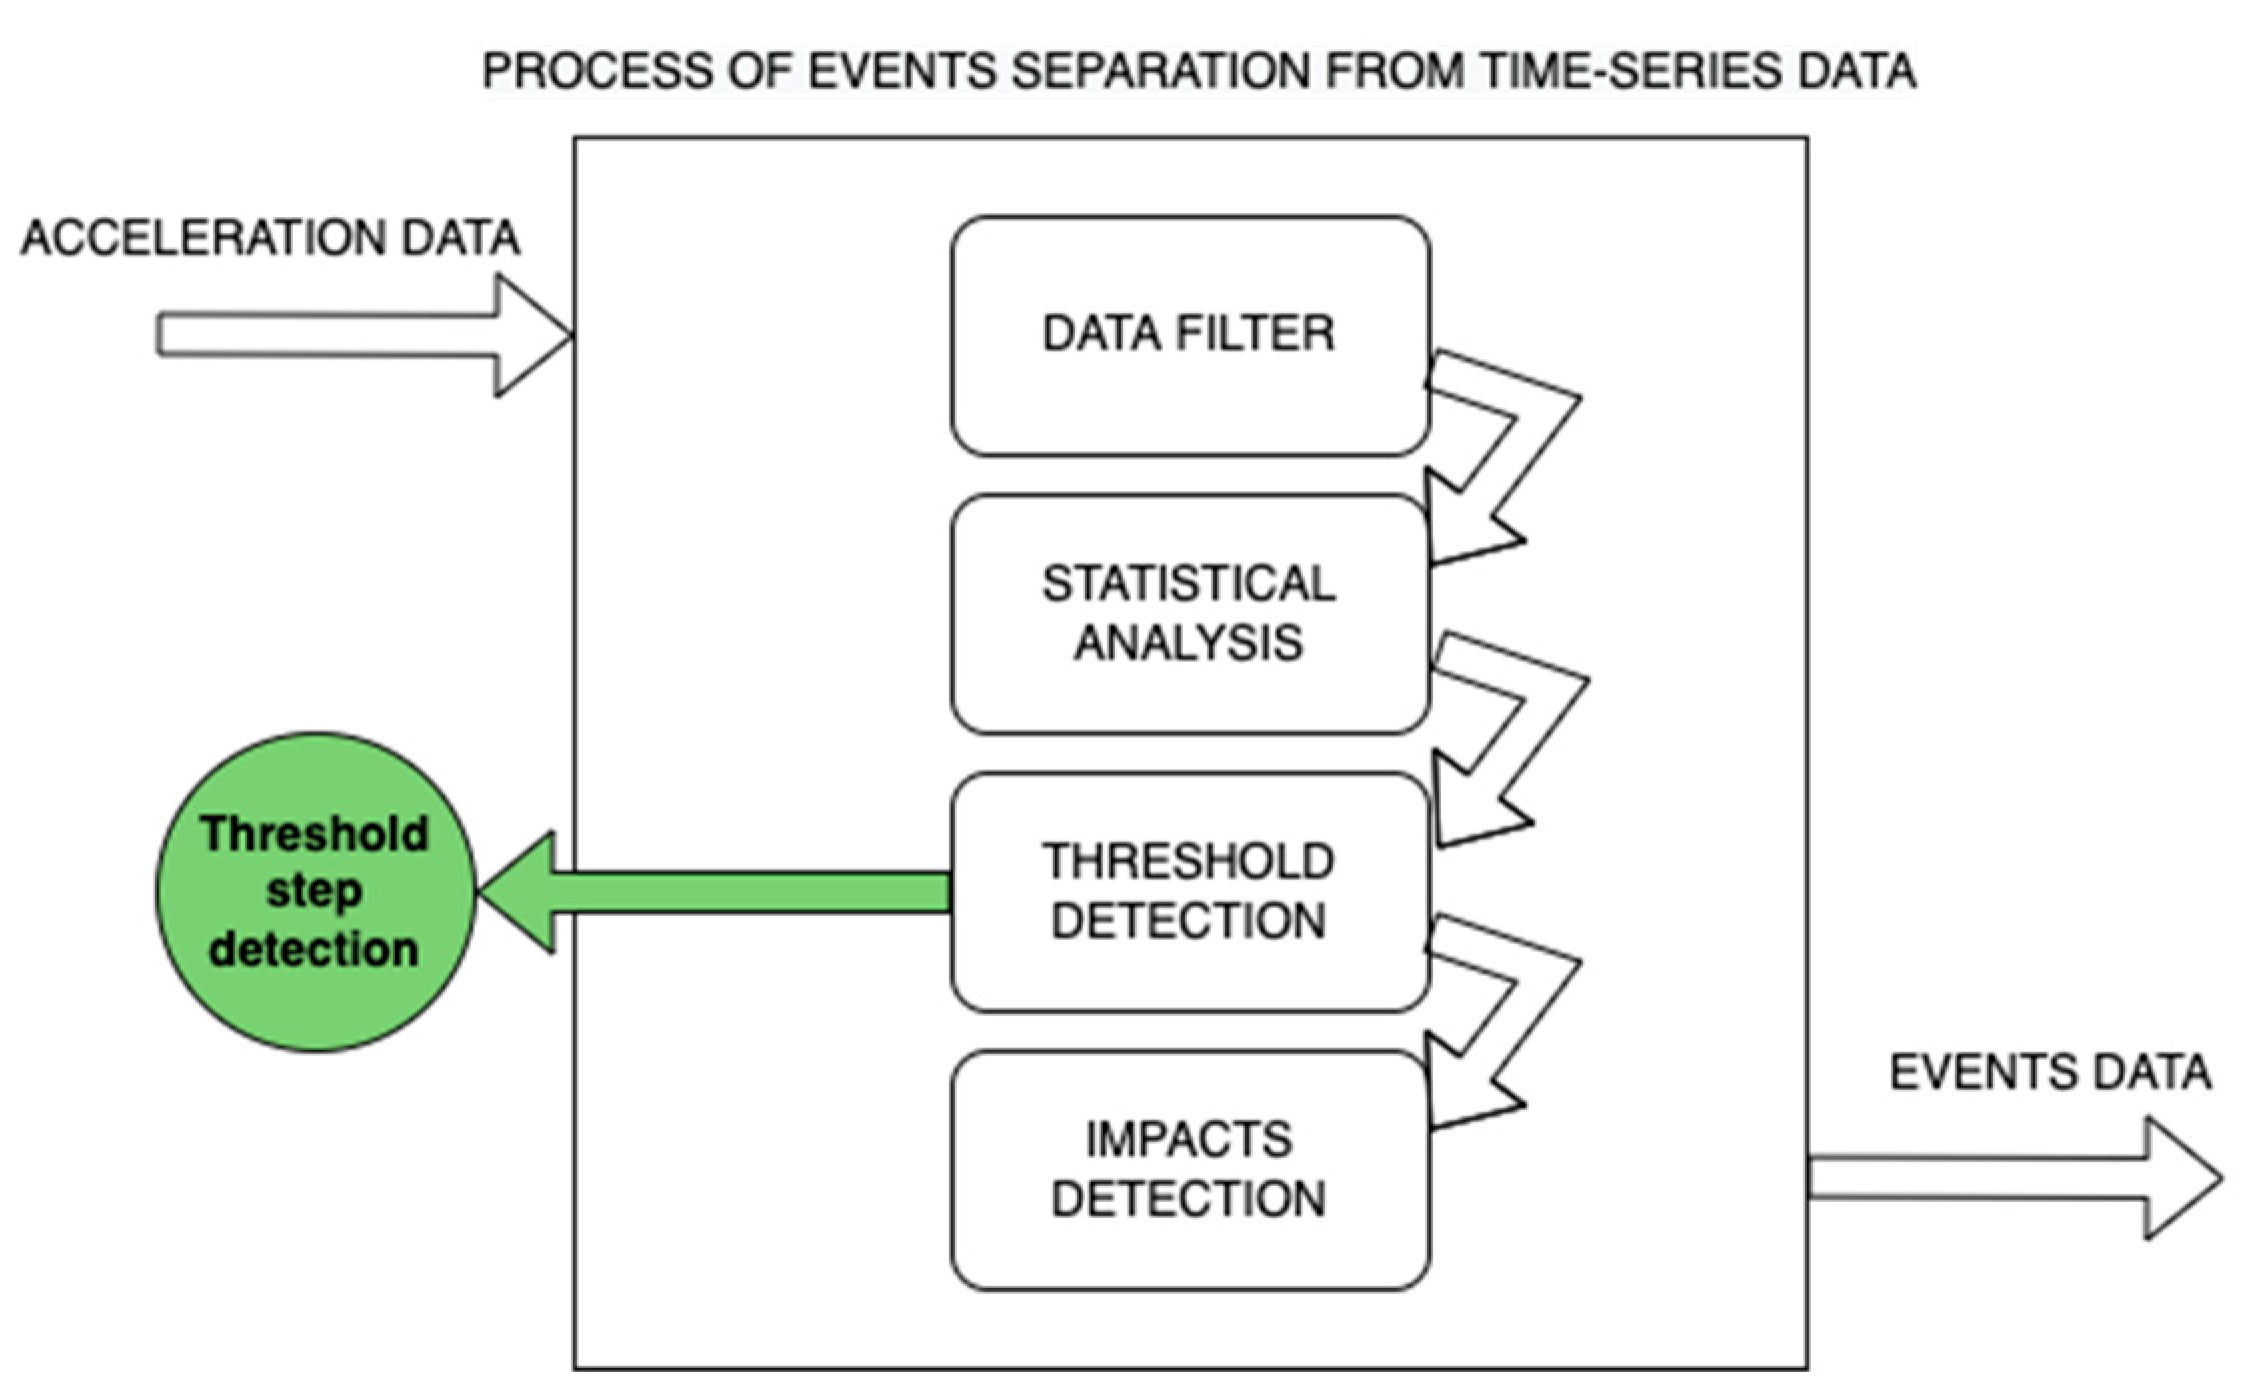
Figure 2 shows the system’s embedded IDM signal processing method in broad strokes. Utilizing updated historical data from a larger number of handling operations, than reported in the previous study [
3], this technique was tested to identify the real thresholds parameters for each case study in a broader range, further transformed into a more unified methodology for a broad spectrum of container handling operations aboard the individual ship. The system with the variation threshold IDM was utilized further to stop critical security events from taking place inside the ship’s hull that would have resulted in greater damage to the container exterior the cargo inside and the metal frame infrastructure of the ship.
The discussed detection method, namely the IDM, consists of several key analytical processes: signal filtering is the first step, followed by peak value detection in the filtered signal using statistical analysis techniques from an increased data set, followed by a visual inspection method for optimal threshold value observation and finally, isolation of actual events by grouping prospective events.
The following material demonstrates briefly the key steps taken by the IDM to compute and visualize the impacts and highlights the critical results of each process. Physical container impacts against the VCG create higher frequency components in the signal; therefore, isolating these oscillations with a high-pass filter permits further investigation. Here, a filter with the lowest feasible phase distortions (high-pass FIR filter), a constant delay across the frequency range, and a monotonic amplitude response in the passable frequency range were employed to lower the signal’s distortion (1):
Here,
N is the queue of the filter, and
bN are the coefficients obtained by using the GNU Octave function “fir1” (2):
Here,
af is the array of the filtered acceleration values, S is the array of the starting values of half-wave indices, E is the array of the computed half-wave, M is the quantity of the computed half-waves,
p are the values of extremums, and finally
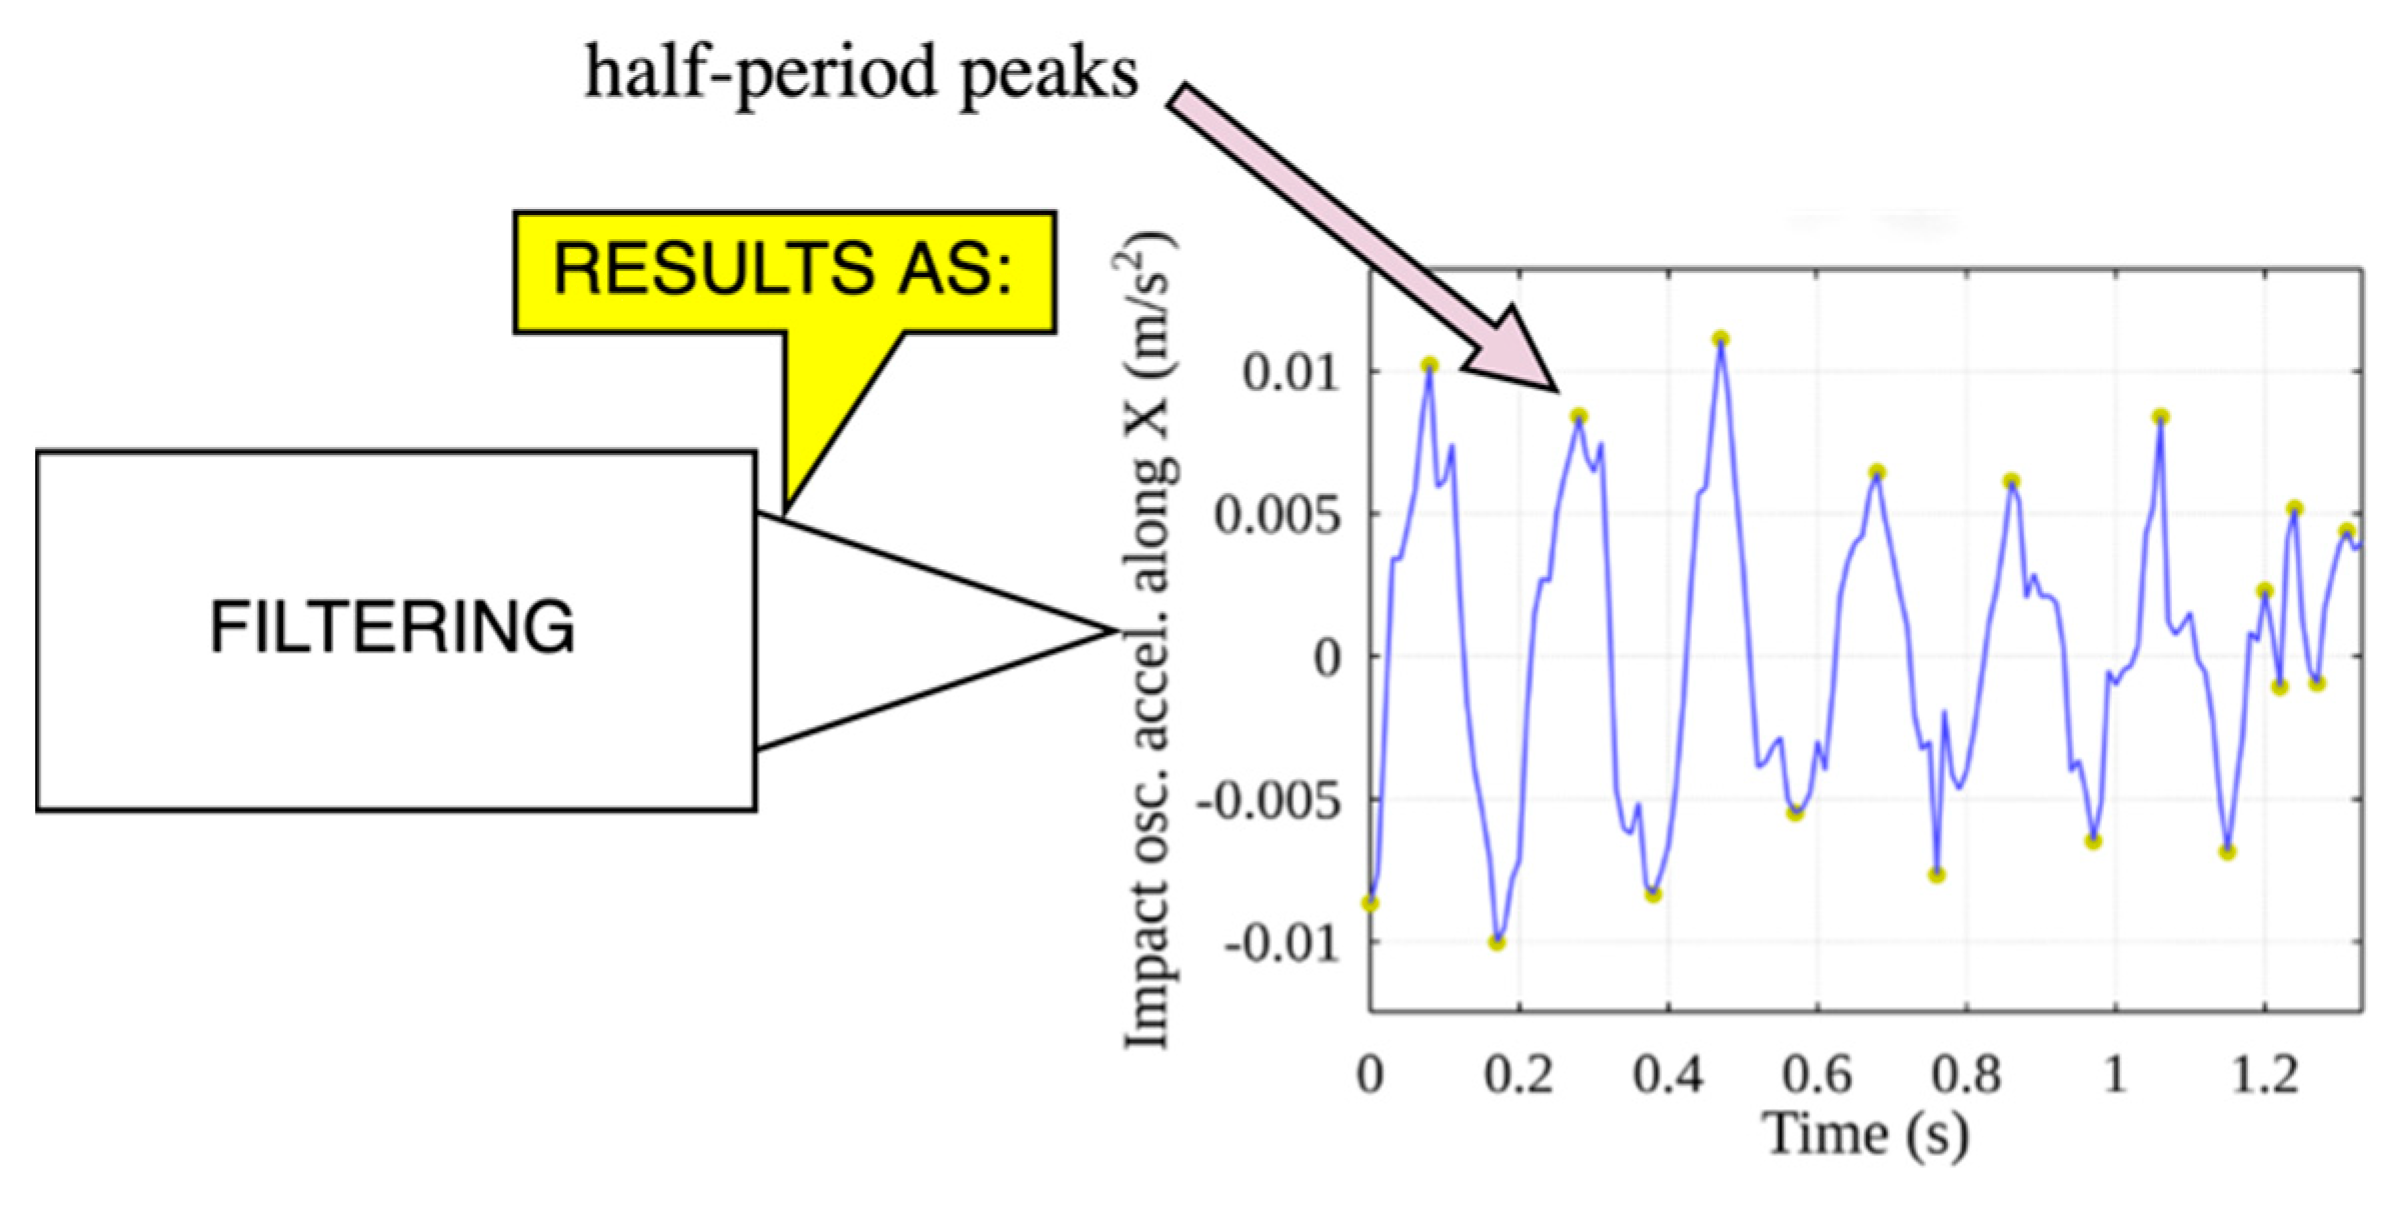
pidx are the positions of the detected extremums. The starting process of filtering the incoming data and detecting peaks is presented below in
Figure 3.
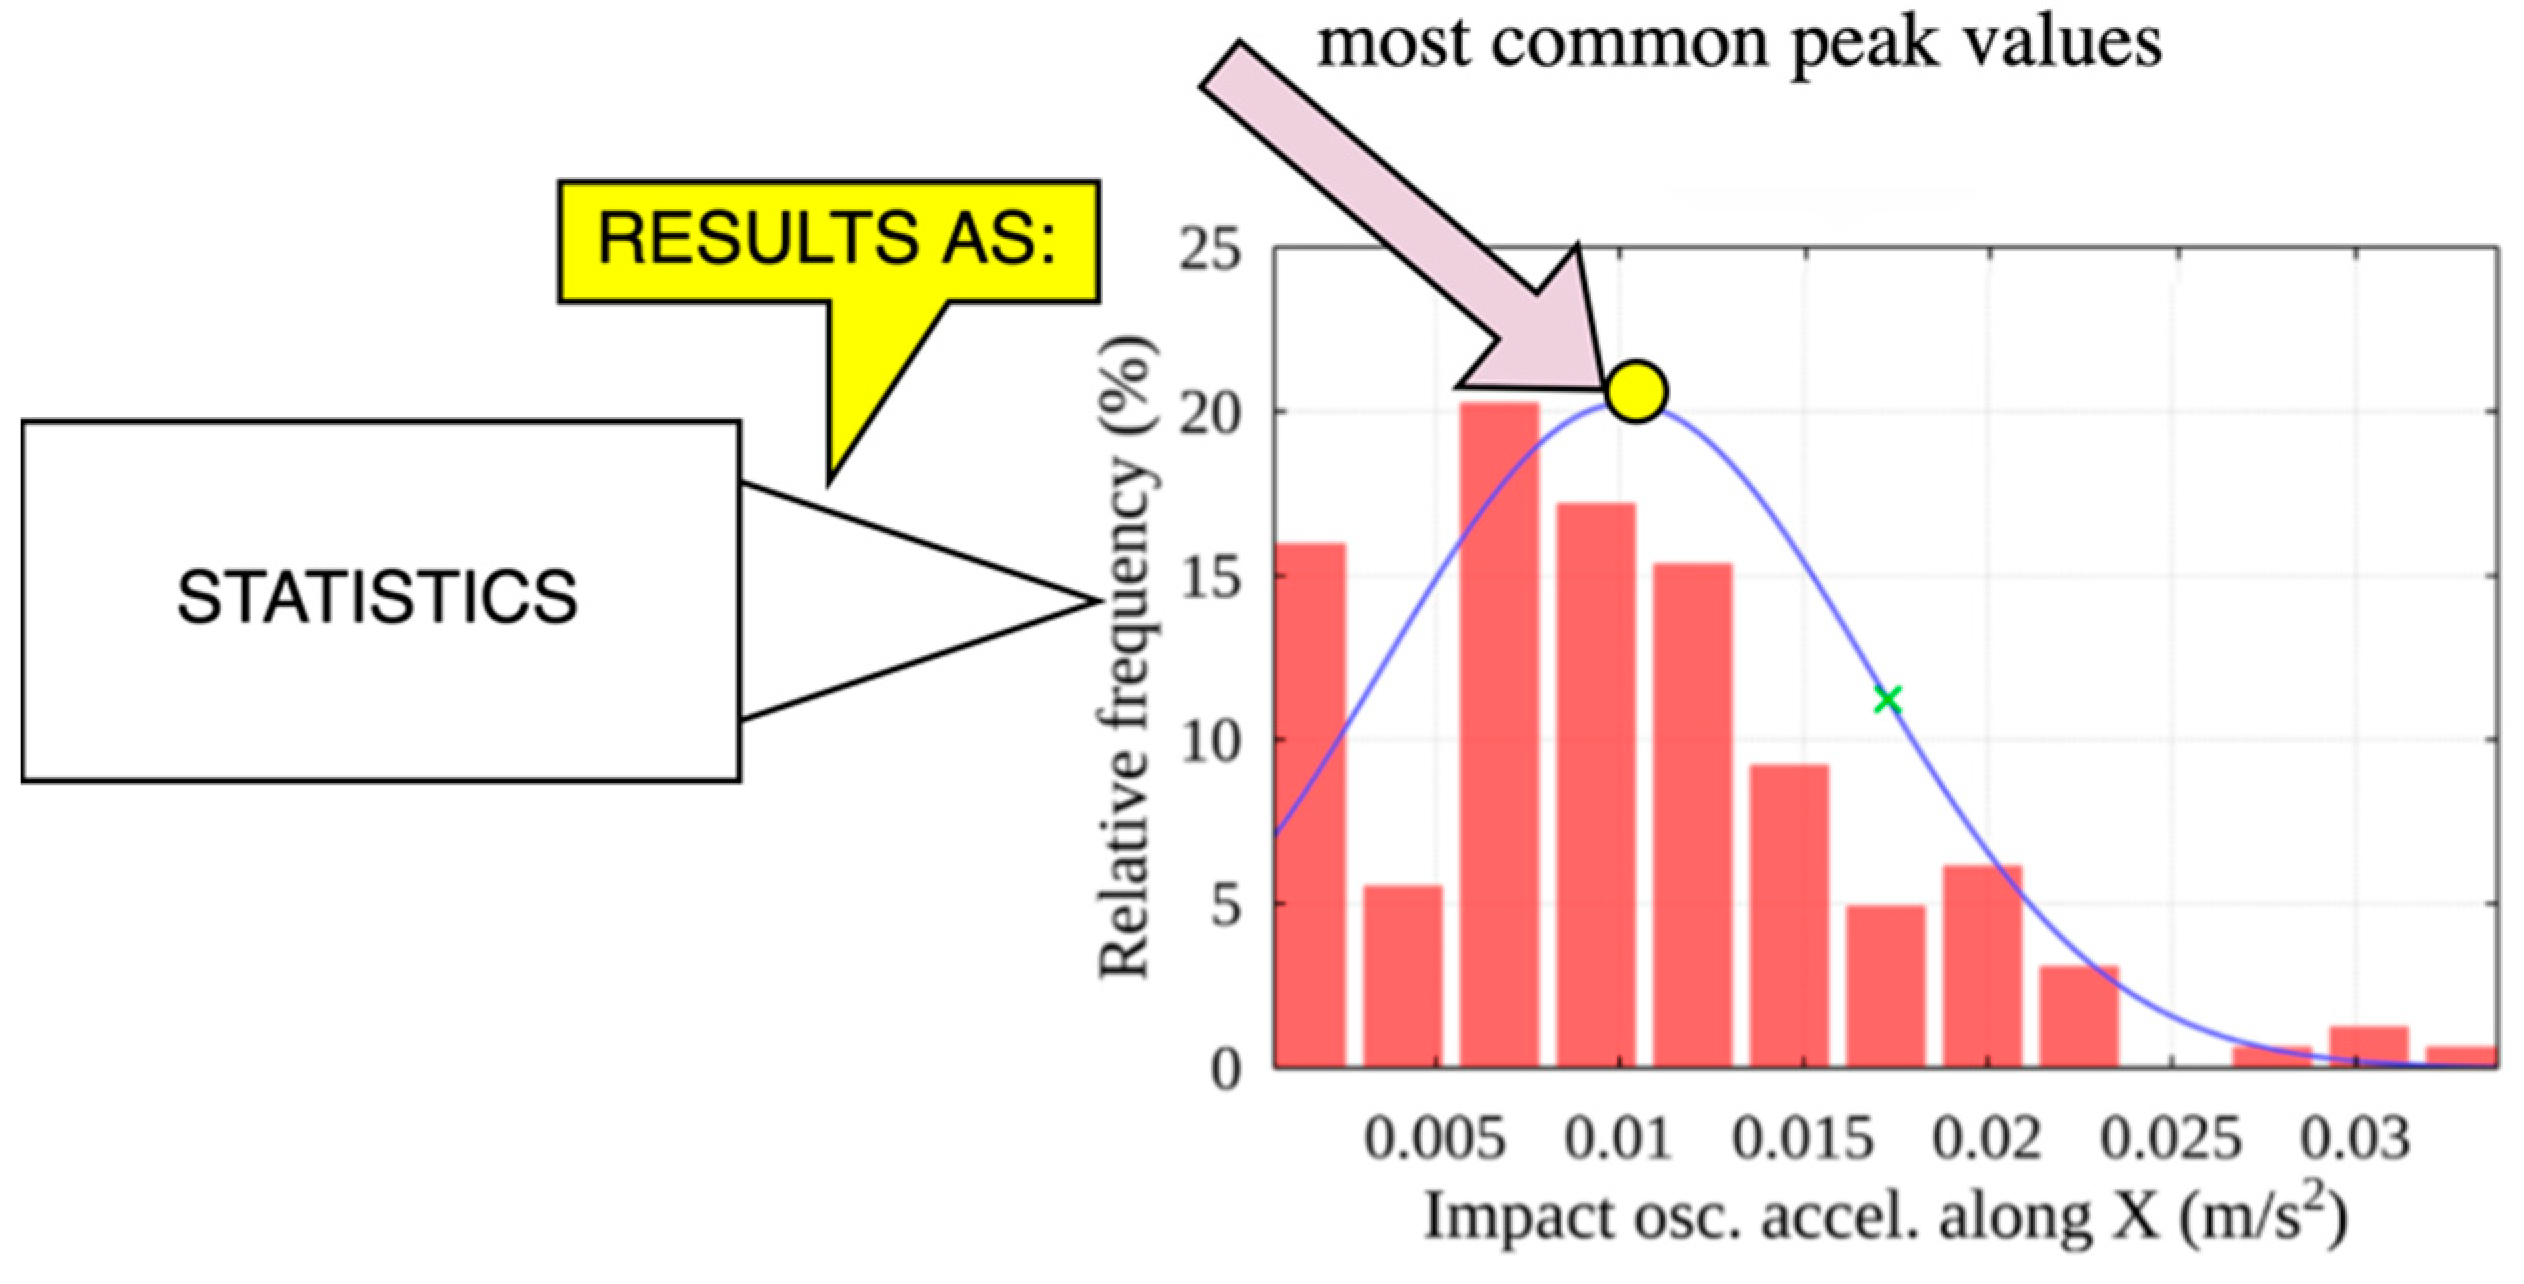
Here, any peak discovered in the earlier phase might have been caused by an actual strong impact on the metal frames of the VCG. Peaks connected to the impact are chosen based on the filtered signal’s threshold value. On the other hand, peaks with absolute values over the threshold denote prospective exact moments of these events. The threshold is established quantitatively as a statistical process (refer to
Figure 4). The distribution function that most accurately matches the peak values is identified but may vary according to the complexity and nature of the monitored process if applied to solve other impact detection tasks outside of the interior of the ship.
The statistics method uses a threshold value for the event frequency parameter, which at this time equals 100%. As the value of the aforementioned parameter falls, such peaks within the signal occur less frequently as we go toward higher peak amplitudes. The acceleration threshold value is obtained using the distribution function after choosing a particular value of the parameter. In the example of
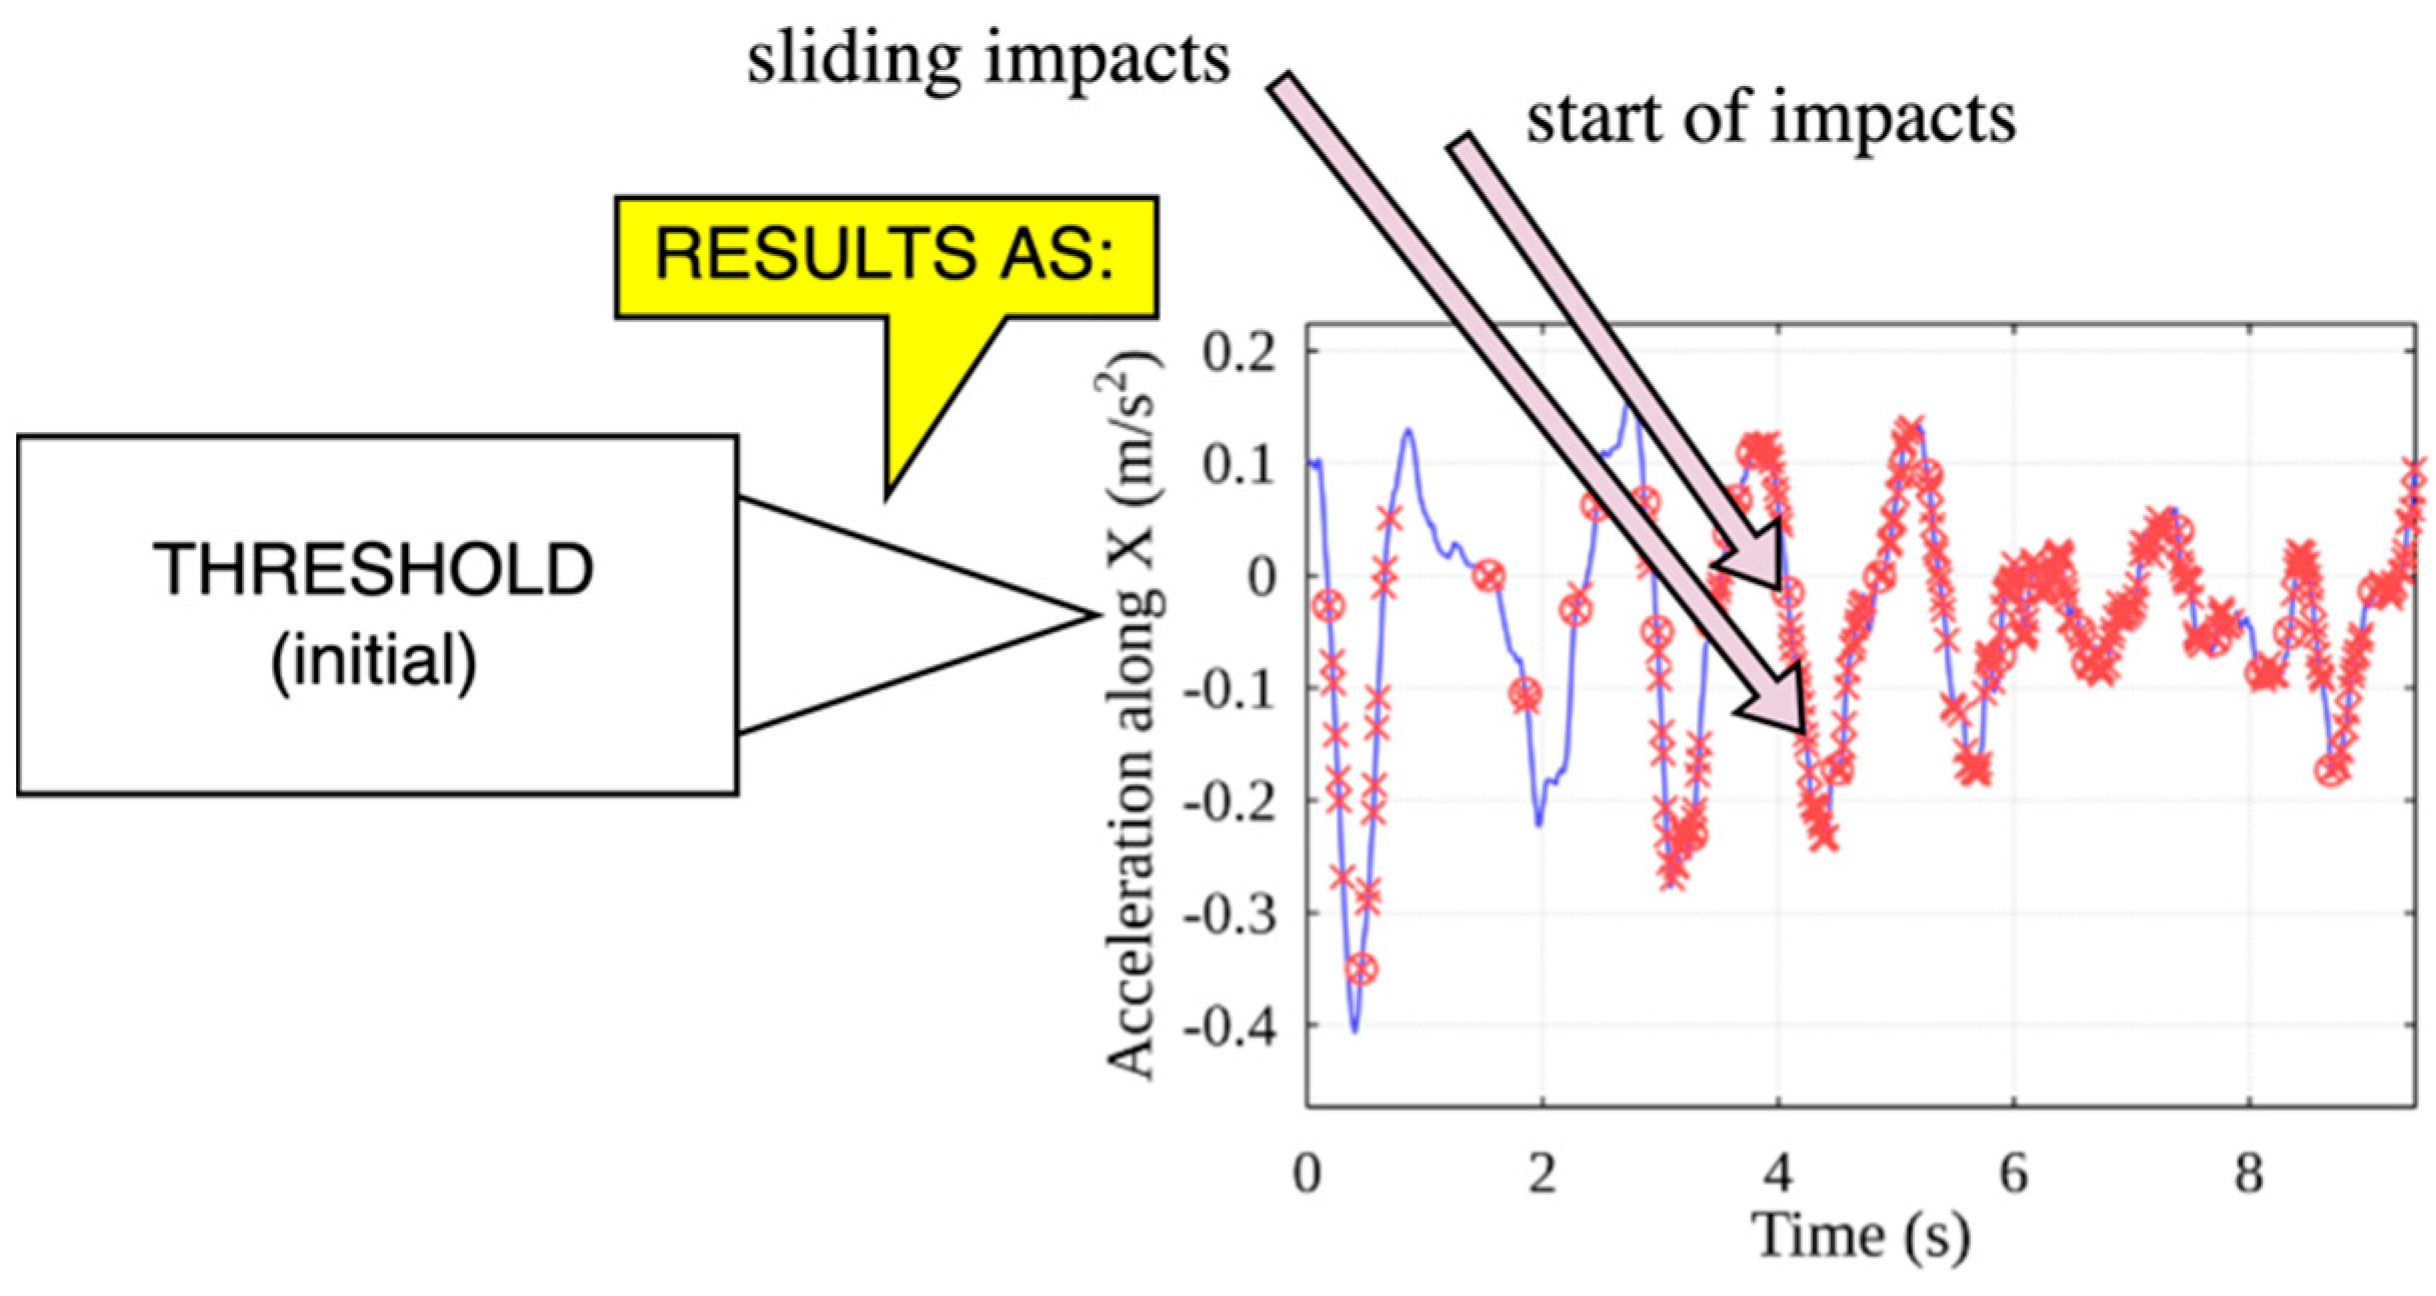
Figure 4, the most frequent peak values are considered noise in the peak area of the chosen distribution. The peaks with amplitudes greater than the threshold value are chosen from the collection of peaks using the computed acceleration threshold value, allowing for the identification of the peaks that represent possible impact occurrences. Clustering of these potential occurrences produces distinct impact events, such as initial impact or subsequent sliding with less forceful impacts (see
Figure 5).
The results also change over a wide range when the filter corner frequency and event frequency thresholds are varied concerning the signal frequency range. This evaluation metrics effectiveness was assessed through trials in which the parameter values were varied across a wide range. Several more situations of container vertical handling were explored for this study, compared with the previous one, and the sequence of the results was summarized by computing the root means square of the variables (RMS), which is known among engineers. Yet, this research is mostly interested in the weighted values of the RMS along each axis. Mostly the X-axis, due to larges swings and more movements along this axis. The so-called weighted value for the individual acceleration axis is produced by first calculating the RMS values of the filtered acceleration half-waves related to each potential impact event, and then averaging them, according to the following Equation (3):
Here:
a—the values array of the acceleration parameter;
N—the total number of half-waves of discovered impacts;
S—an array representing the indices of the half-waves;
E—an array representing the half-wave end indices.
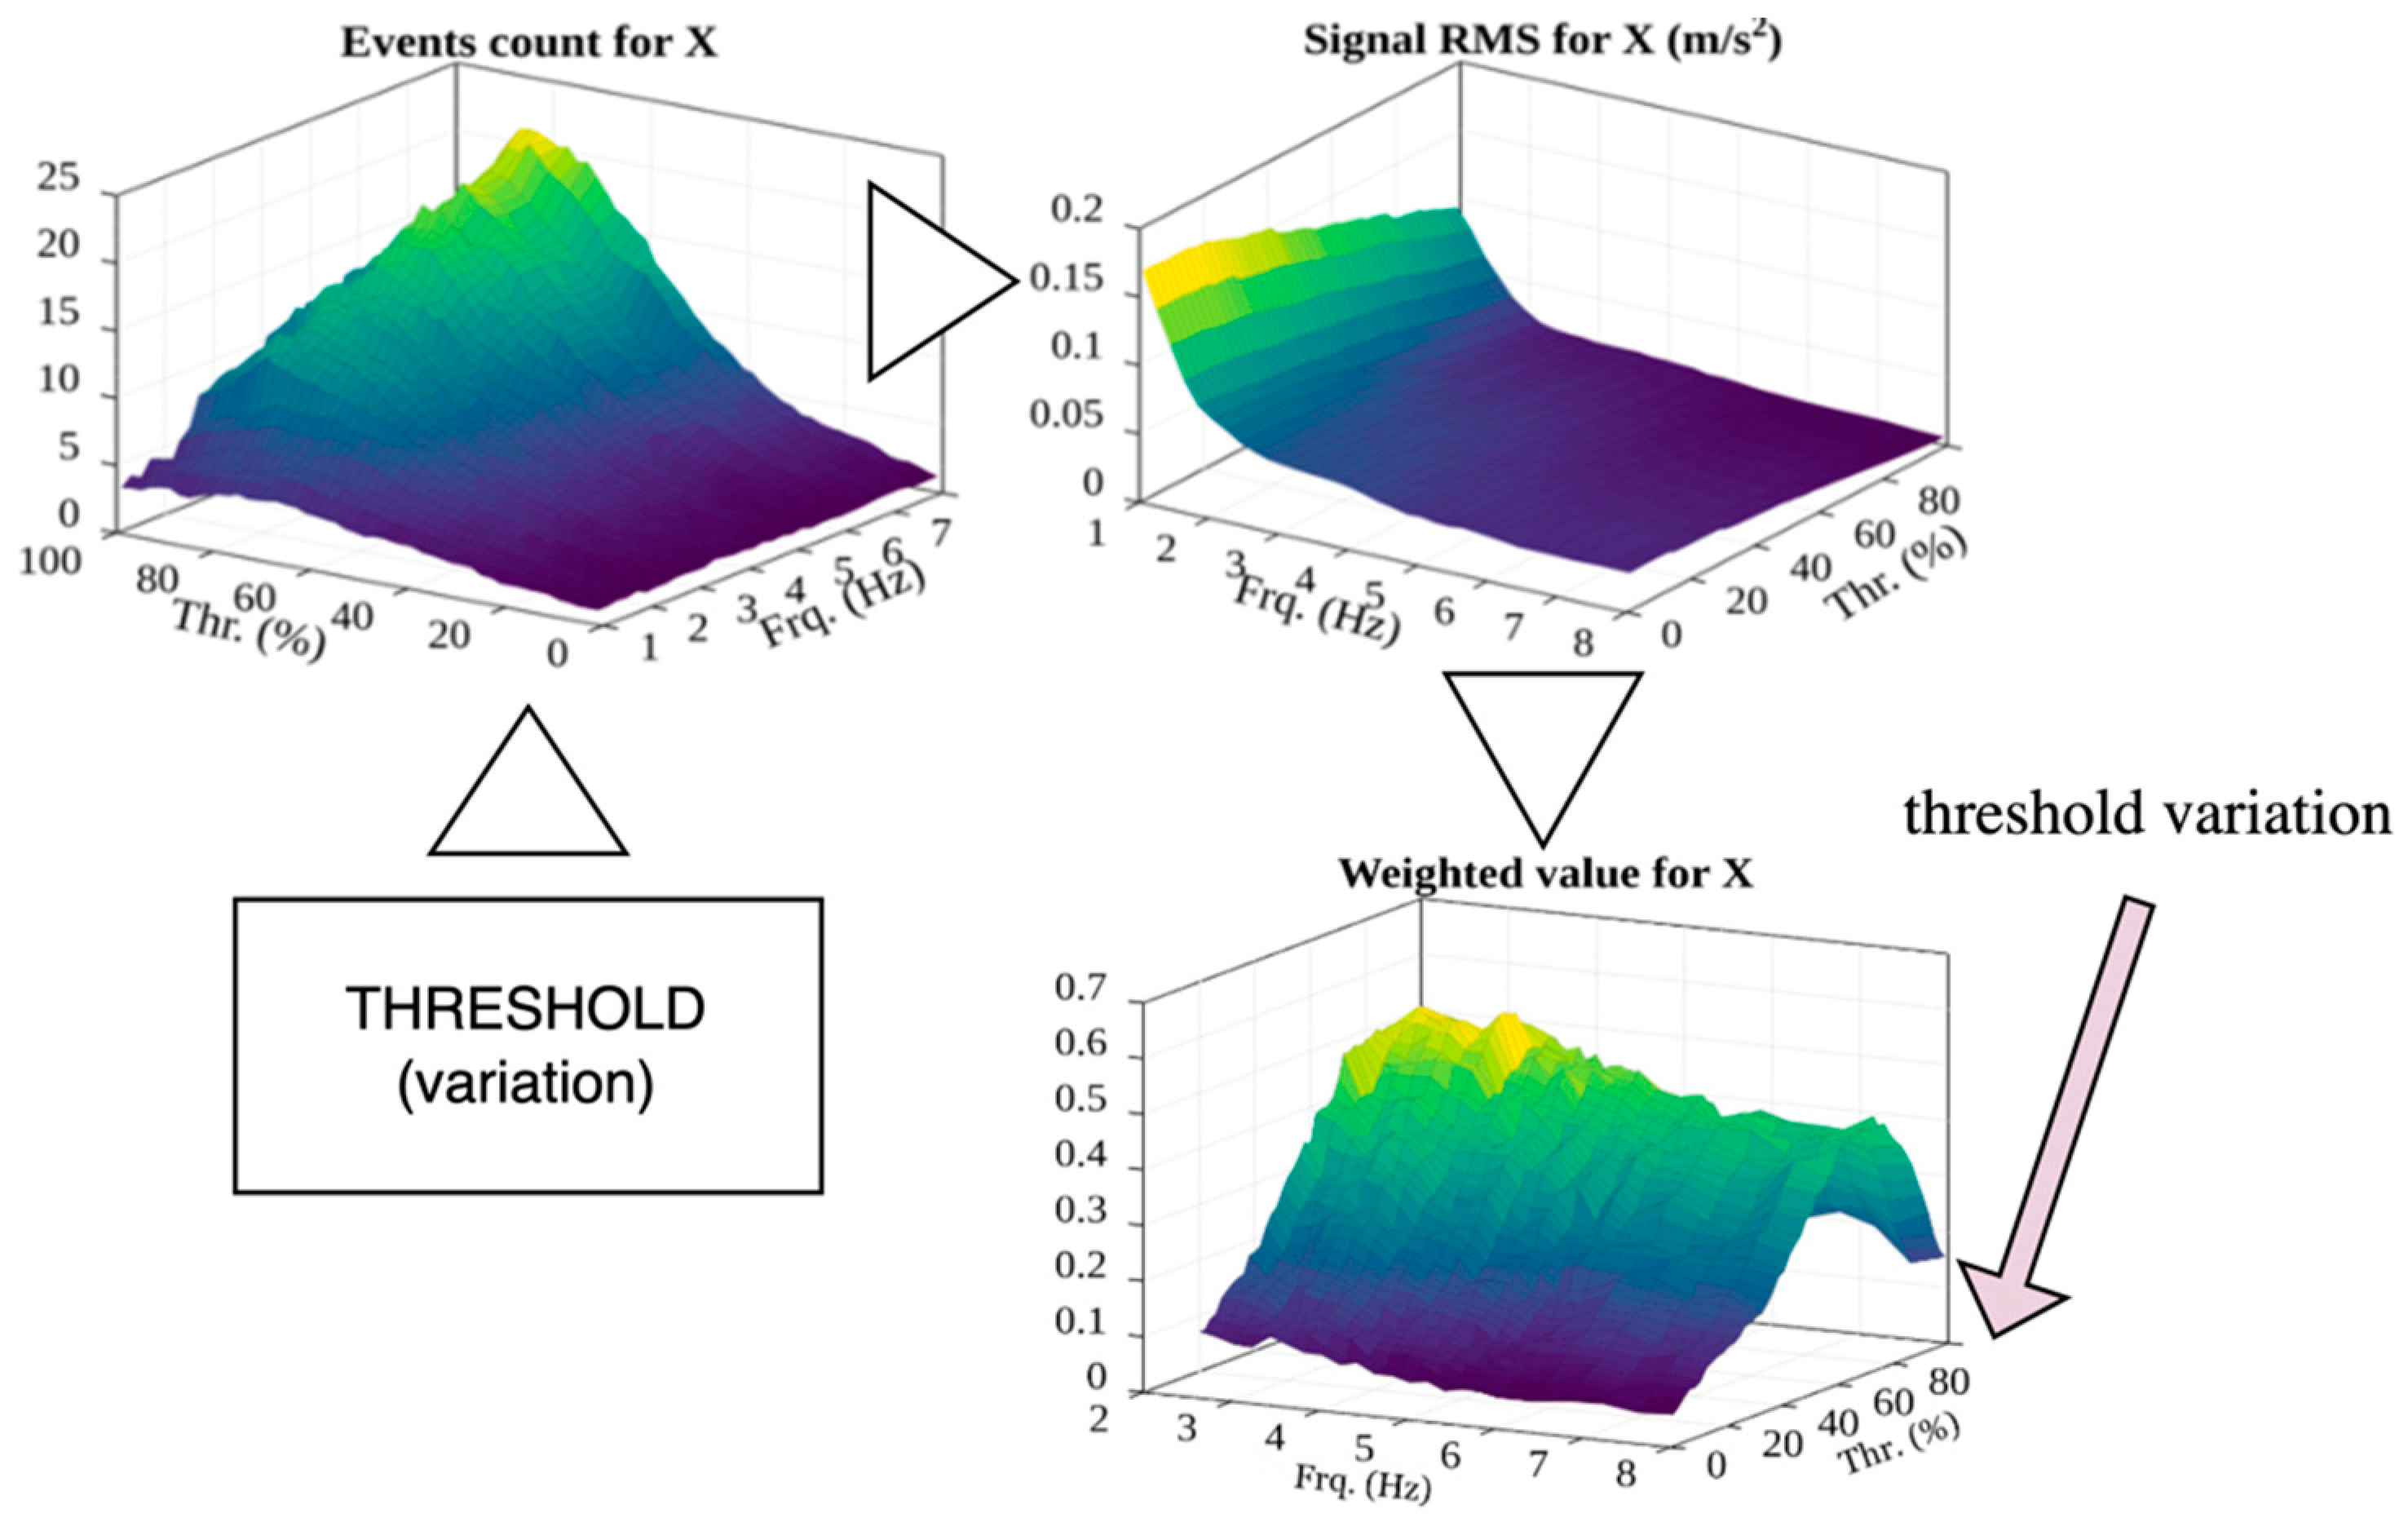
The last threshold detection process deconstructs the optimal threshold search methodic of the IDM (see
Figure 6), based on visual inspection of the weighted values for individual axes, taking the first iteration of events count analysis along various frequency ranges and calculation of the RMS in the desired range.
The visualization of the Weighted values distribution along the optimal frequency range and the threshold range gives the right estimators on the right search path. As an example, using the three-way estimation shown in
Figure 6, the IDM search mechanism evaluates if the variation in the filter frequency is increased, then the period of acceleration oscillations is shortened, increasing the number of recognized peaks for the same duration.
The primary benefit of this kind of application of the IDM is the ability to track the actual impact events within a single container row of the hull before going on to the next. This makes it possible to gather sufficient information to use the suggested methodology effectively to decide whether impacts happen naturally and are non-essential due to the lower force of impact in that exact moment, or as a result of the critical imperfections in the VCG’ metal framework. The event frequency, which at this point corresponds to 100%, is detected by the aforementioned IDM that uses a variation in the threshold (see
Figure 3 as an example) to determine the desired suitable threshold level to be used as a starting point for impacts detection for each separate handling operation, a section of the movement trajectory of the container, whether it is in mid-air outside of the ship, or the inner parts of the hull.
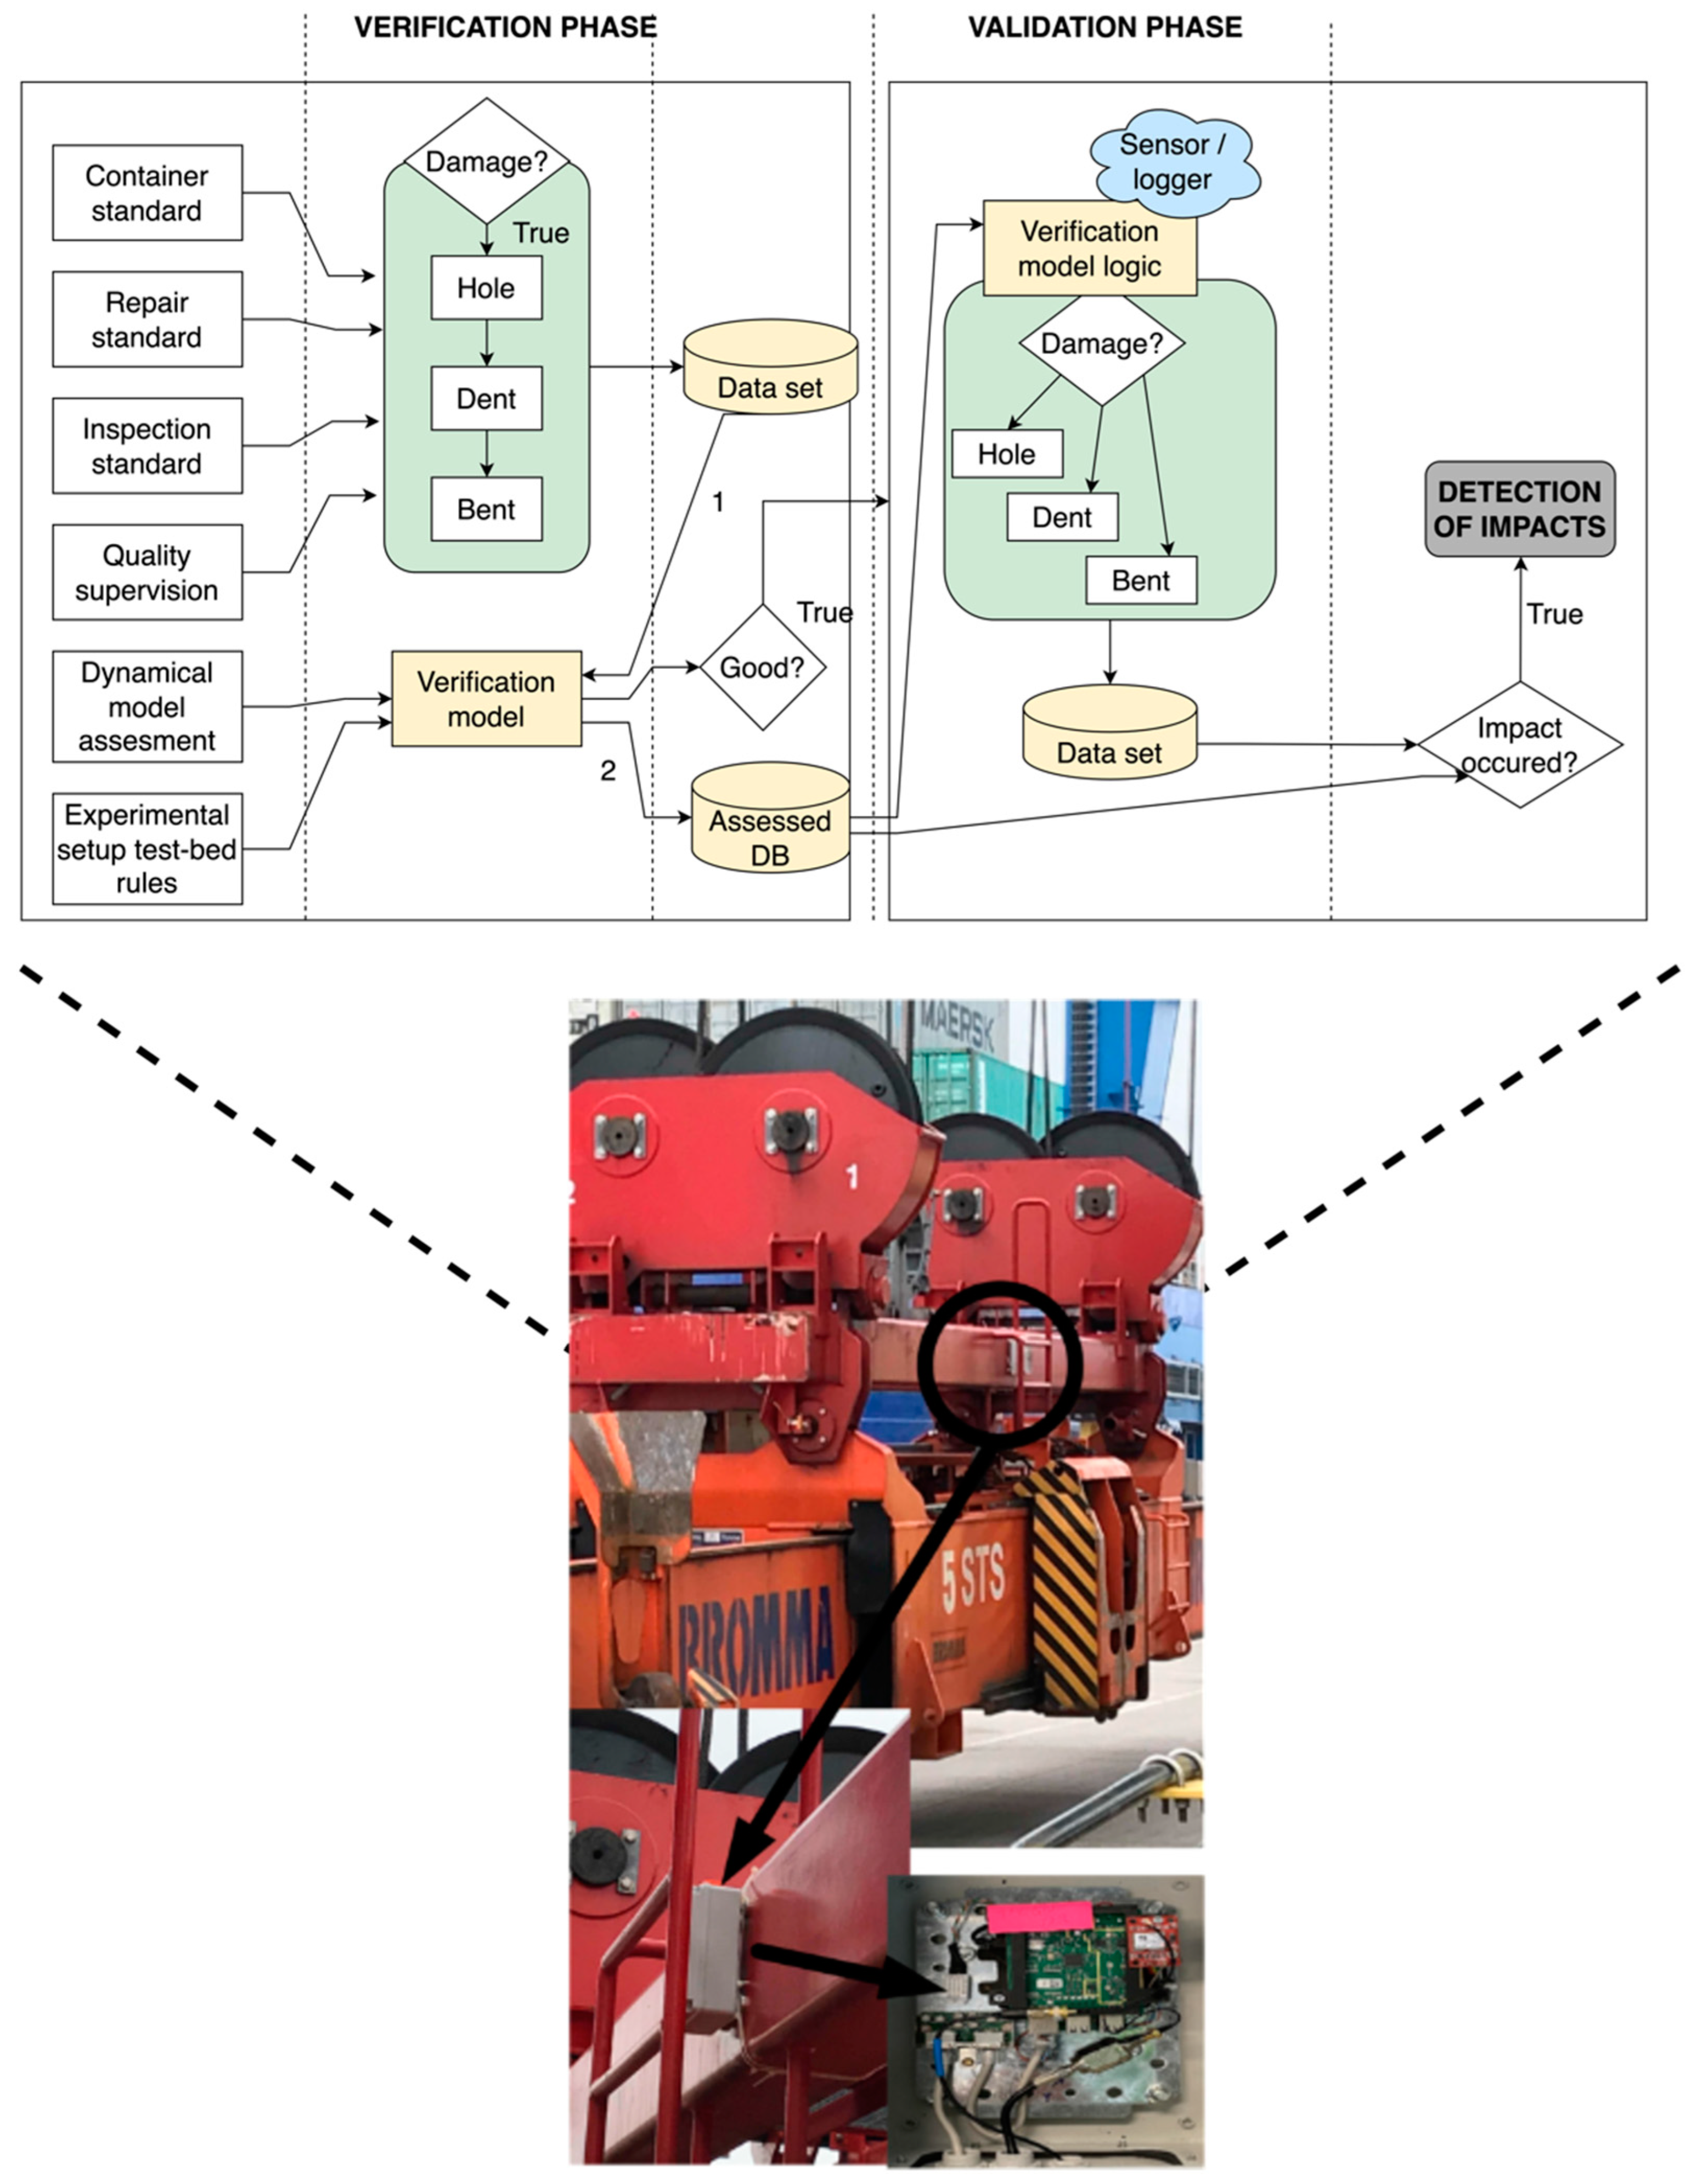
The first threshold value was successfully used in several case studies, with critical impact detected as predicted, but the major goal of this research is to additionally assess how well different threshold levels impact the sheer numbers of detections, how well-established the primary threshold estimation is, or should it be corrected accordingly. The IoT system’s structure is shown in
Figure 7 along with its primary components, placement of the physical system within the experimental setting, and evaluation criteria, data sources that were exploited. During the system components verification phase we analyzed the common procedures, technological processes and managerial operations performed and accounted for at the terminal and produced a larger data set of individual handling procedures with clear impacts detected, training the IDM, detecting threshold levels, and analyzing the signals as stated before.
Detection of impacts will include the initial impacts and the sliding impacts occurring one after the other in a predictable manner (refer to
Figure 5). Later, during the system validation stage, the system detects impacts, which were already known to her, utilizing the programmed logic of the IDM and the constants detected during the verification stage. In general, the acceleration signal processing with frequency threshold detection method, visual inspection policy, operational standards, and electronics are all combined in the IDM research framework assessing the VCG damage (impacts) detection. The IoT sensor was comprised of internal electronics, wireless communication, data storage protocols, and a specific computational mechanism that tells if the impact occurred or not, the processor, where the manipulation of sensor data is carried out using the developed software with step-by-step detection and operating instructions. It was mounted on the spreader of a QC, and more than 100 operations were performed to support the claims of this paper. The sensory unit collected data samples every 100 ms, enabling the system to gather real-time data on motions and impacts. Data rates and beacon intervals were 250 kbit/s and 100 ms, respectively. A historical log was created remotely and stored on the device’s SD card as a backup with the prior measurement data provided to the server and user along with a blank alarm message in the packet. Each new packet had a 100 ms delay since the system had to form each one from a t-1 measurement before sending it to the user. To undertake an inner analysis of the acquired data samples, an edge computing capability enabled unit was built, which is covered in the following section. End-node devices included:
A SINDT-232 Digital Accelerometer with high-stability 200 Hz MPU6050 3-Axis Acceleration and 0.05-degree Accuracy;
Data communication module;
A Raspberry Pi 4-based edge computing unit with four ARM A72 1.5 GHz cores and 8 GB of RAM supplied with a 128 GB SD UHS-I card.
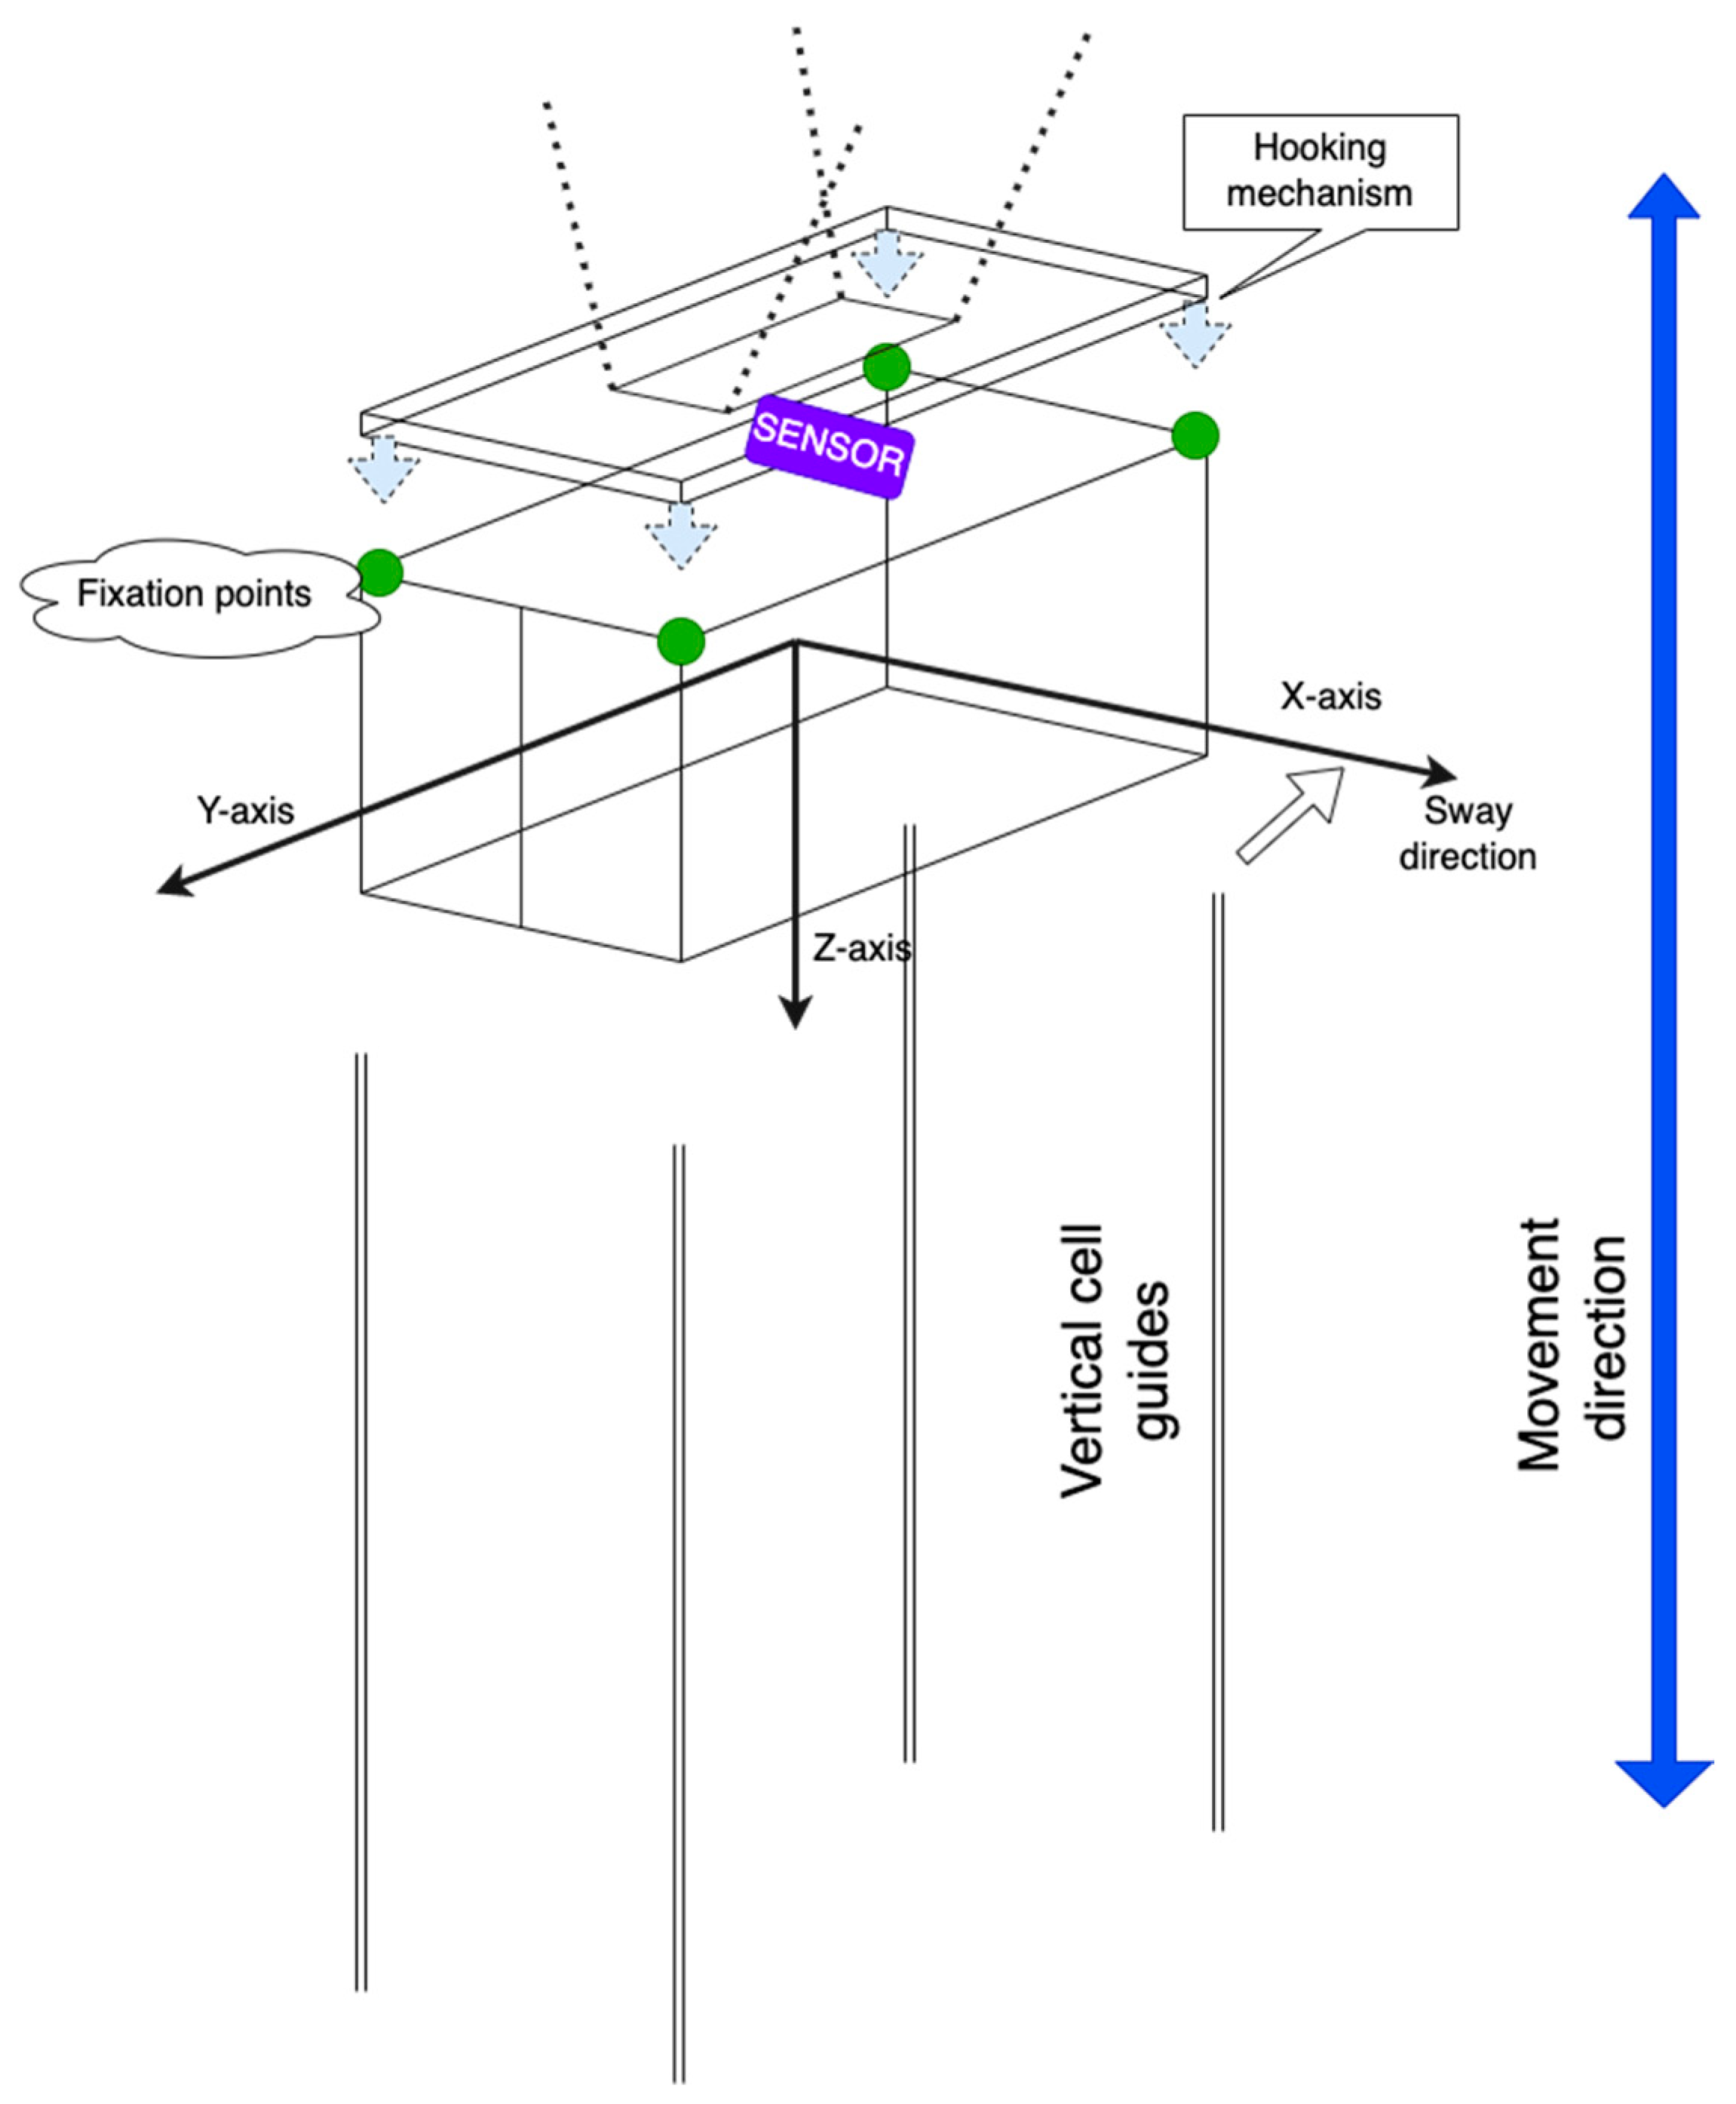
The precise location of the device and its internal electronics for data retrieval as well as the direction in which the container should move along the VCG are shown in
Figure 8 below.
Magnets and straps held the sensory gadget in place on the spreader of the chosen QC in a secure location (bottom section of
Figure 7). From the spreader’s first vertical movements up until its final position, data was gathered by the digital accelerometer. Inside the ship’s hull, containers are stacked one on top of the other. The container’s movement along the ship’s hull is indicated by the Y-axis. Throughout the whole handling process, the container is primarily moved along the X-axis due to natural causes (mechanical and structural).
3. Results
Firstly, the standardized input parameters of the IDM include [
3] (starting point):
High-pass filter frequency set to 3.8 Hz, filter row set to 200, threshold level set to 73%.
The parameter optimum was searched based on the data of accelerations on the X-axis.
Loading direction: 1 to 2 (vertical movement from the ship).
Vertical movement height above 10 m.
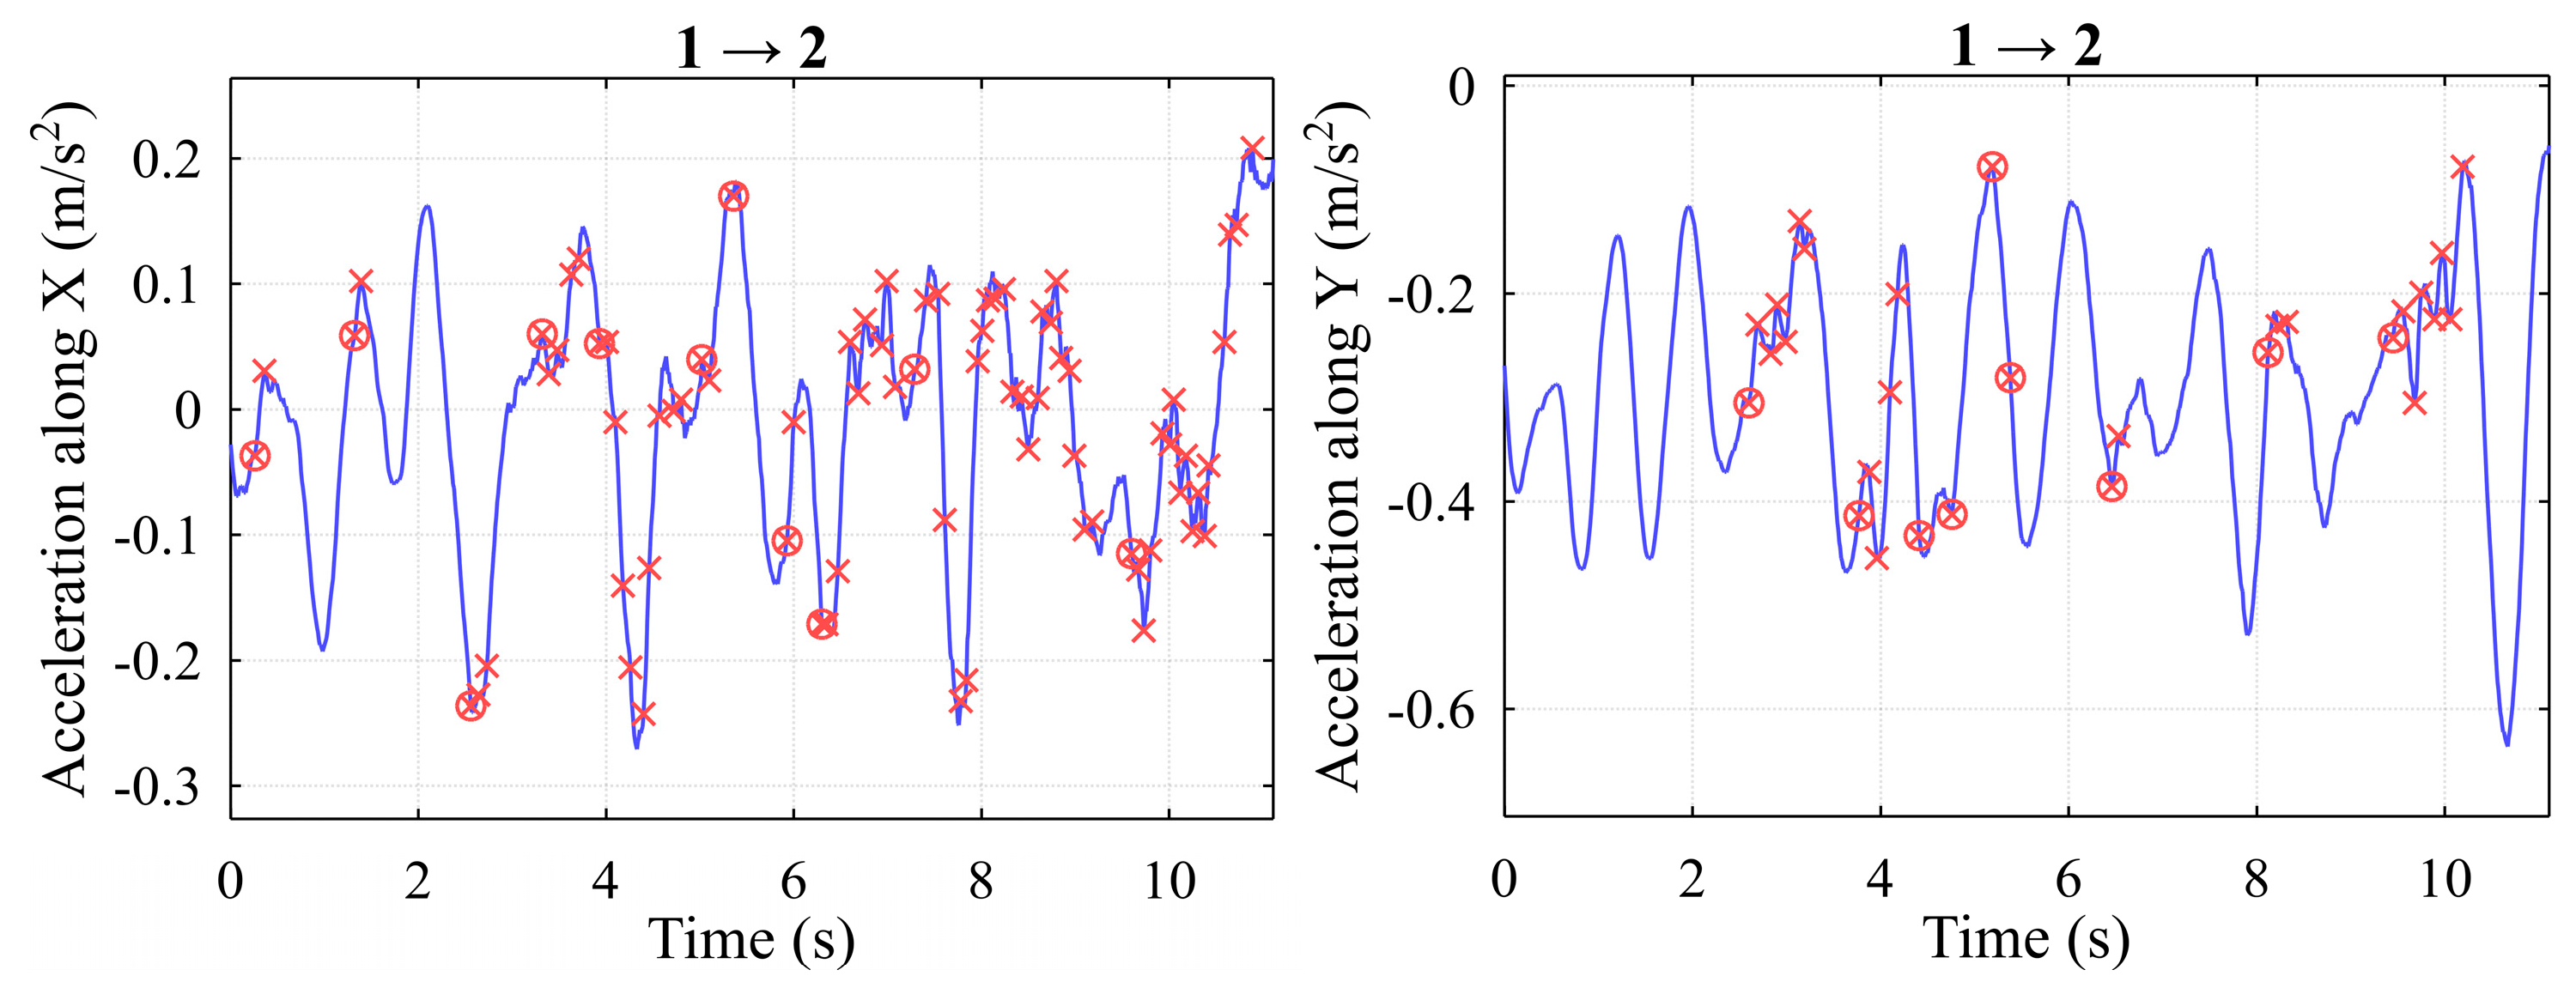
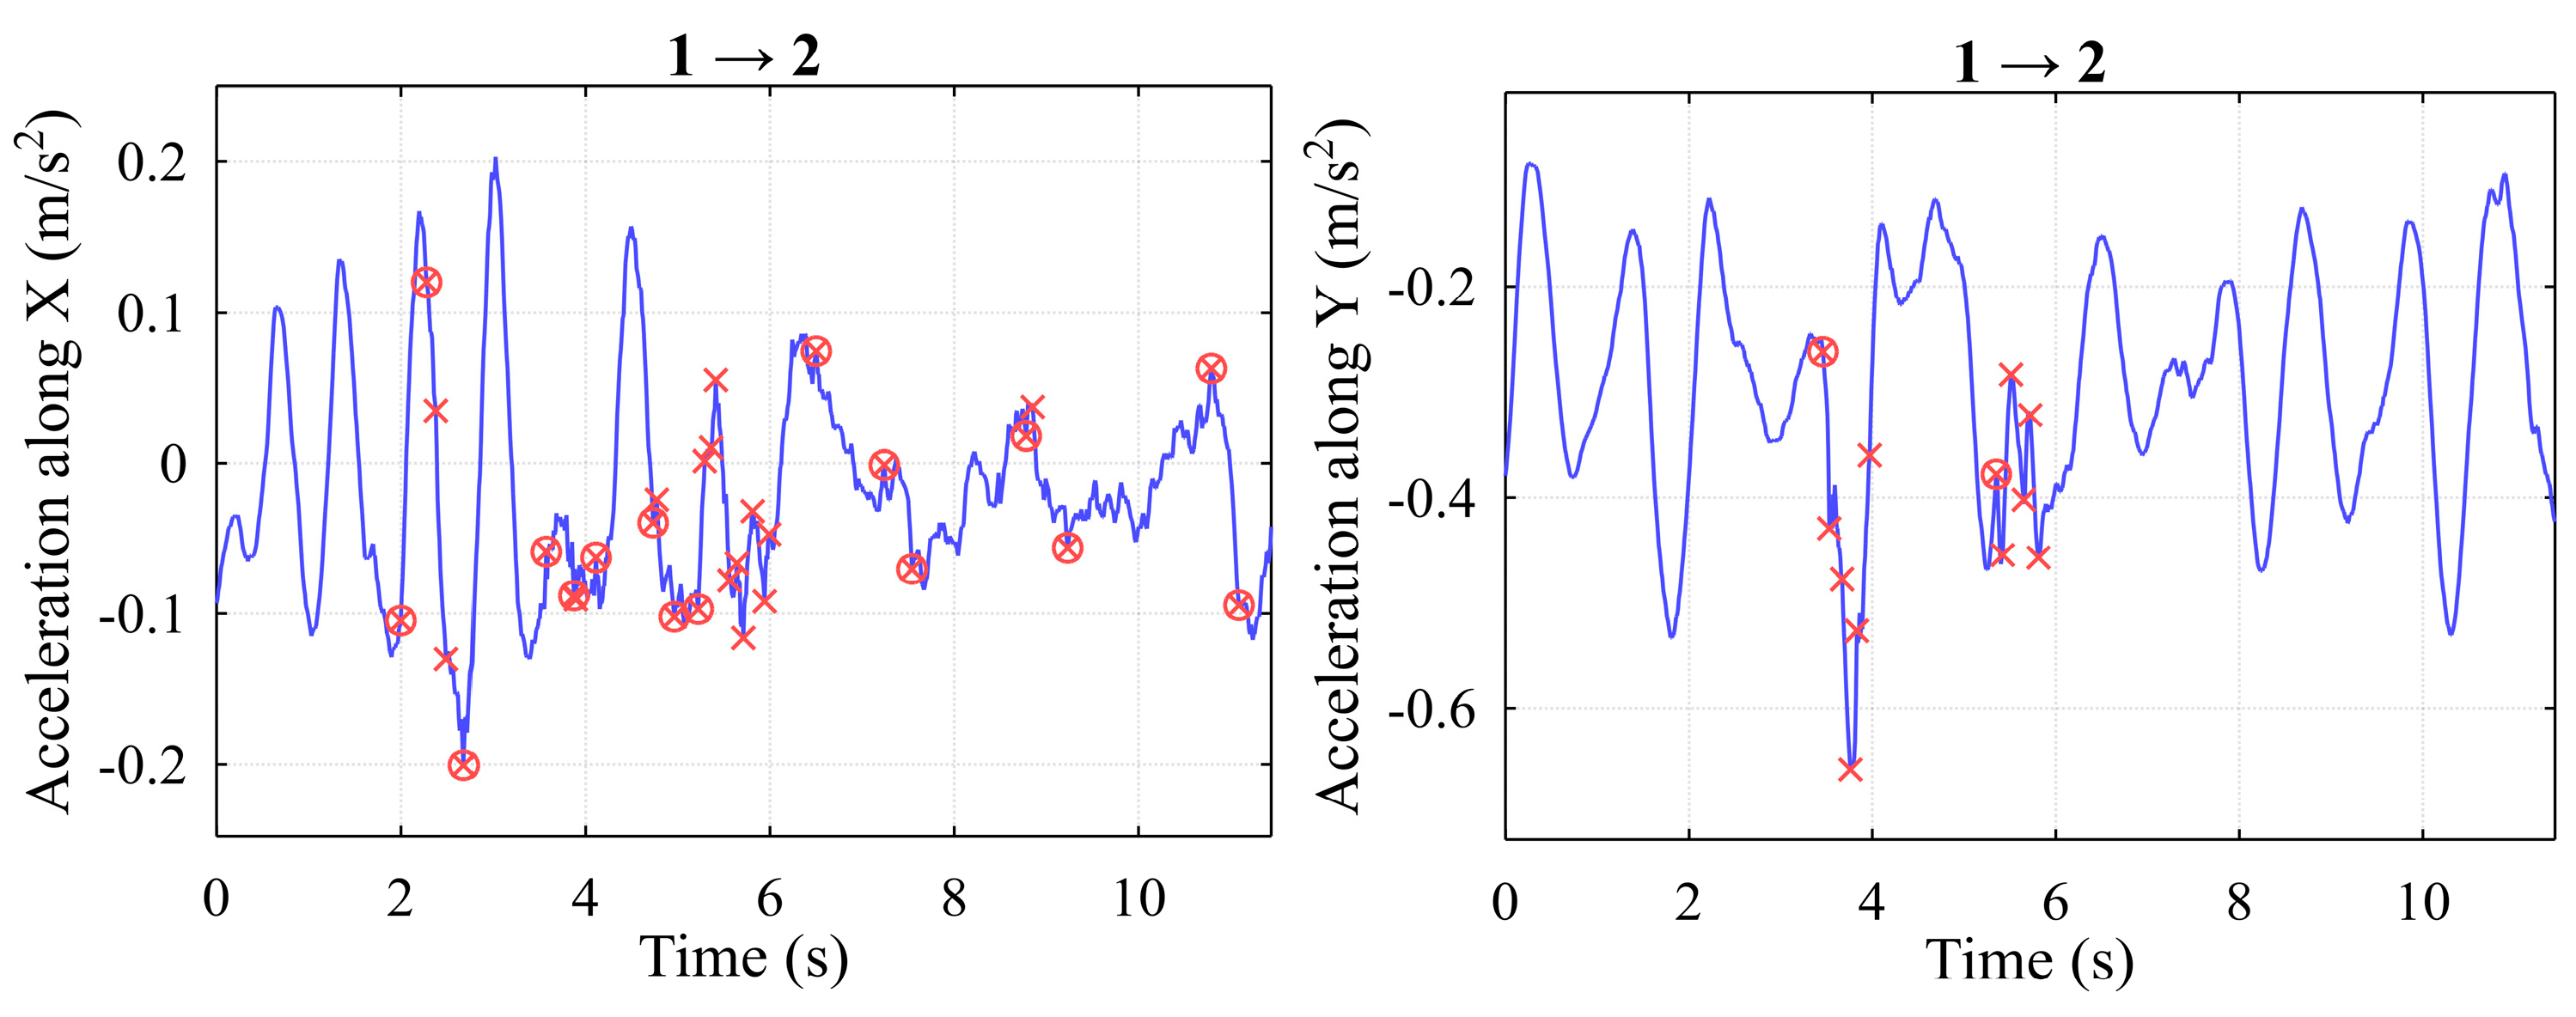
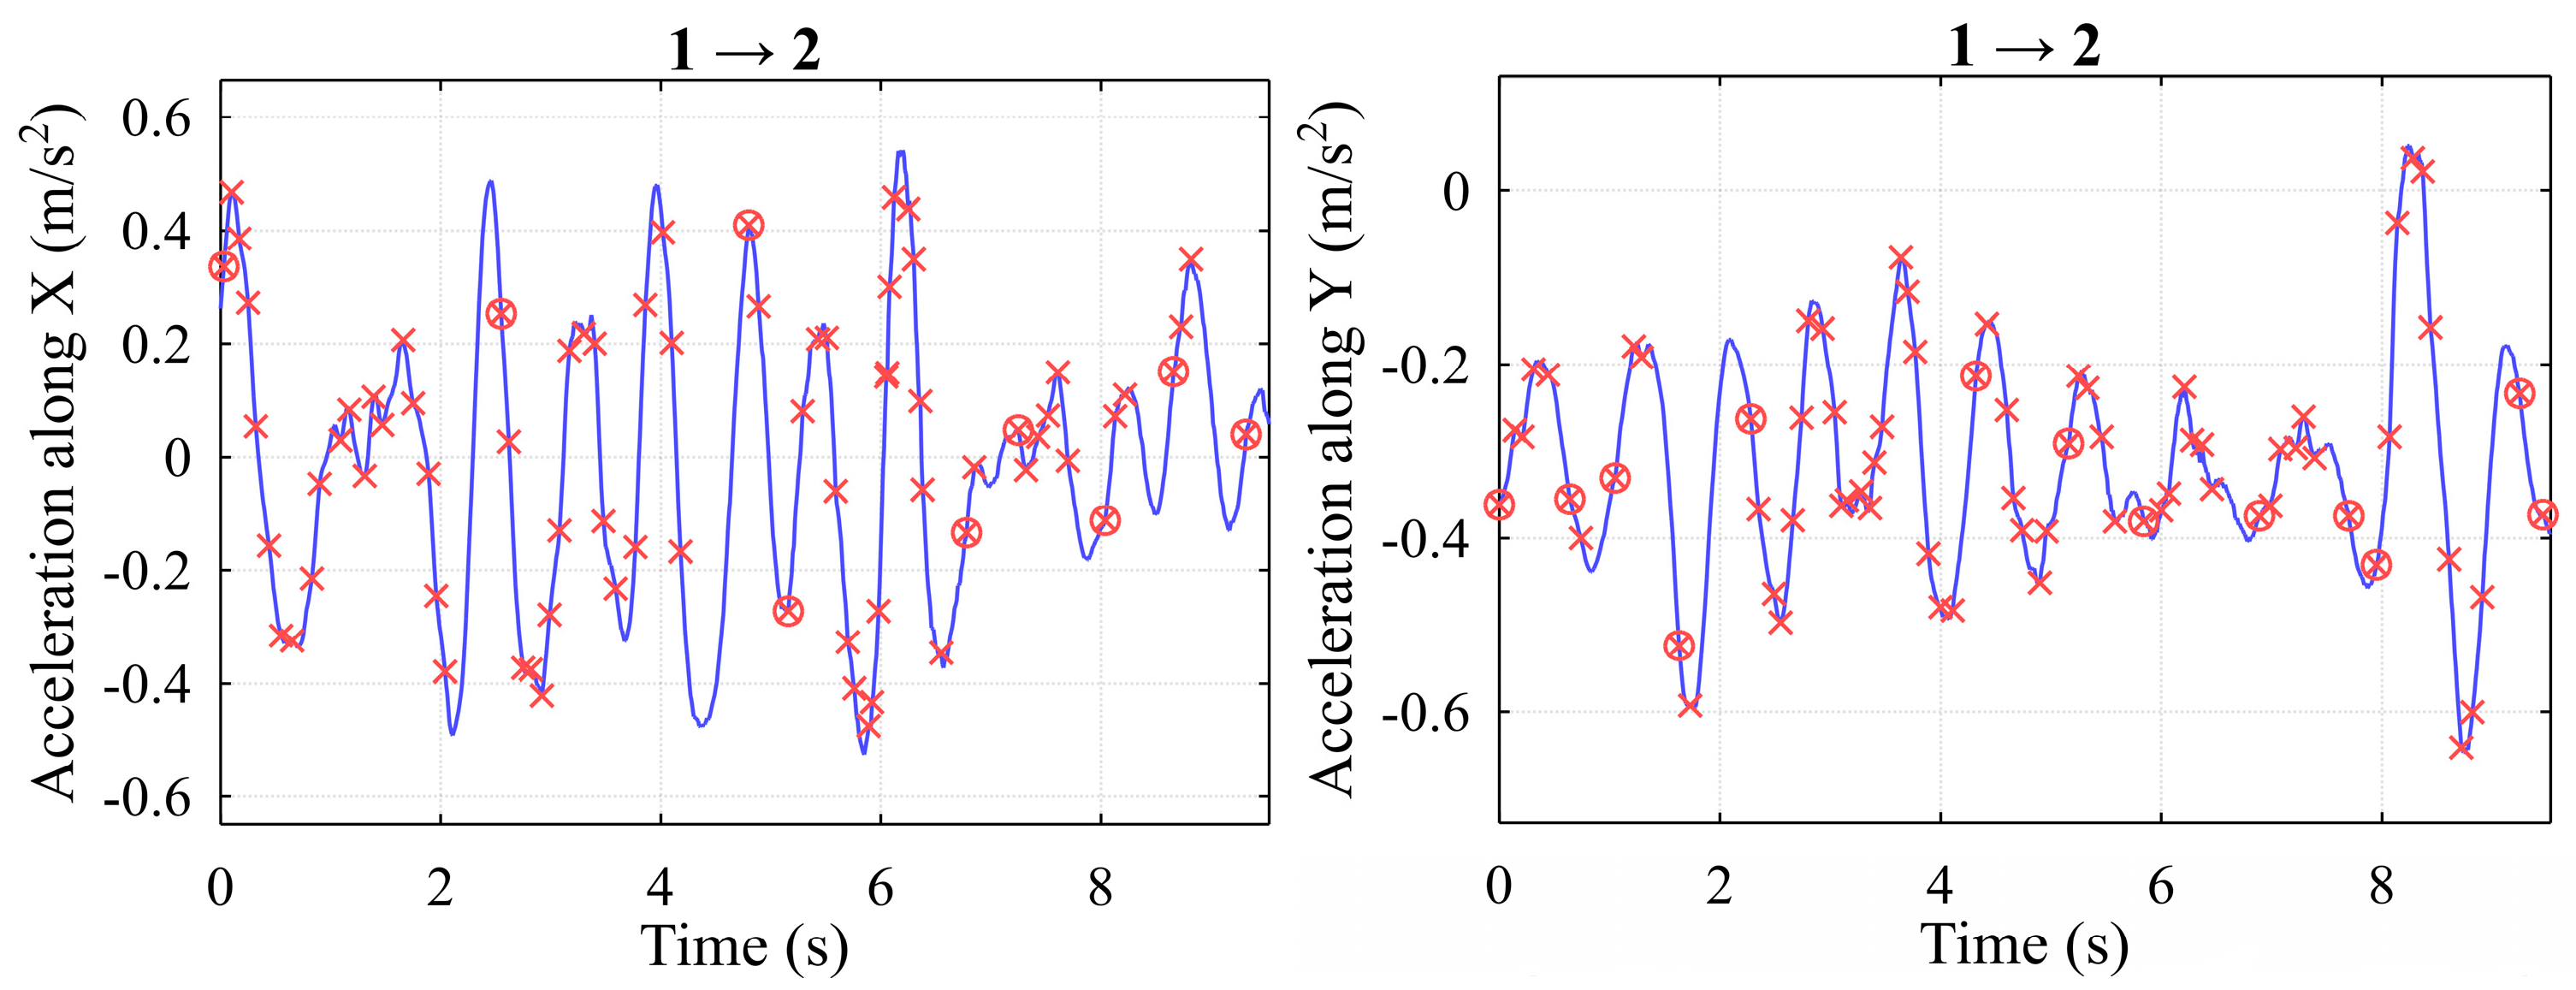
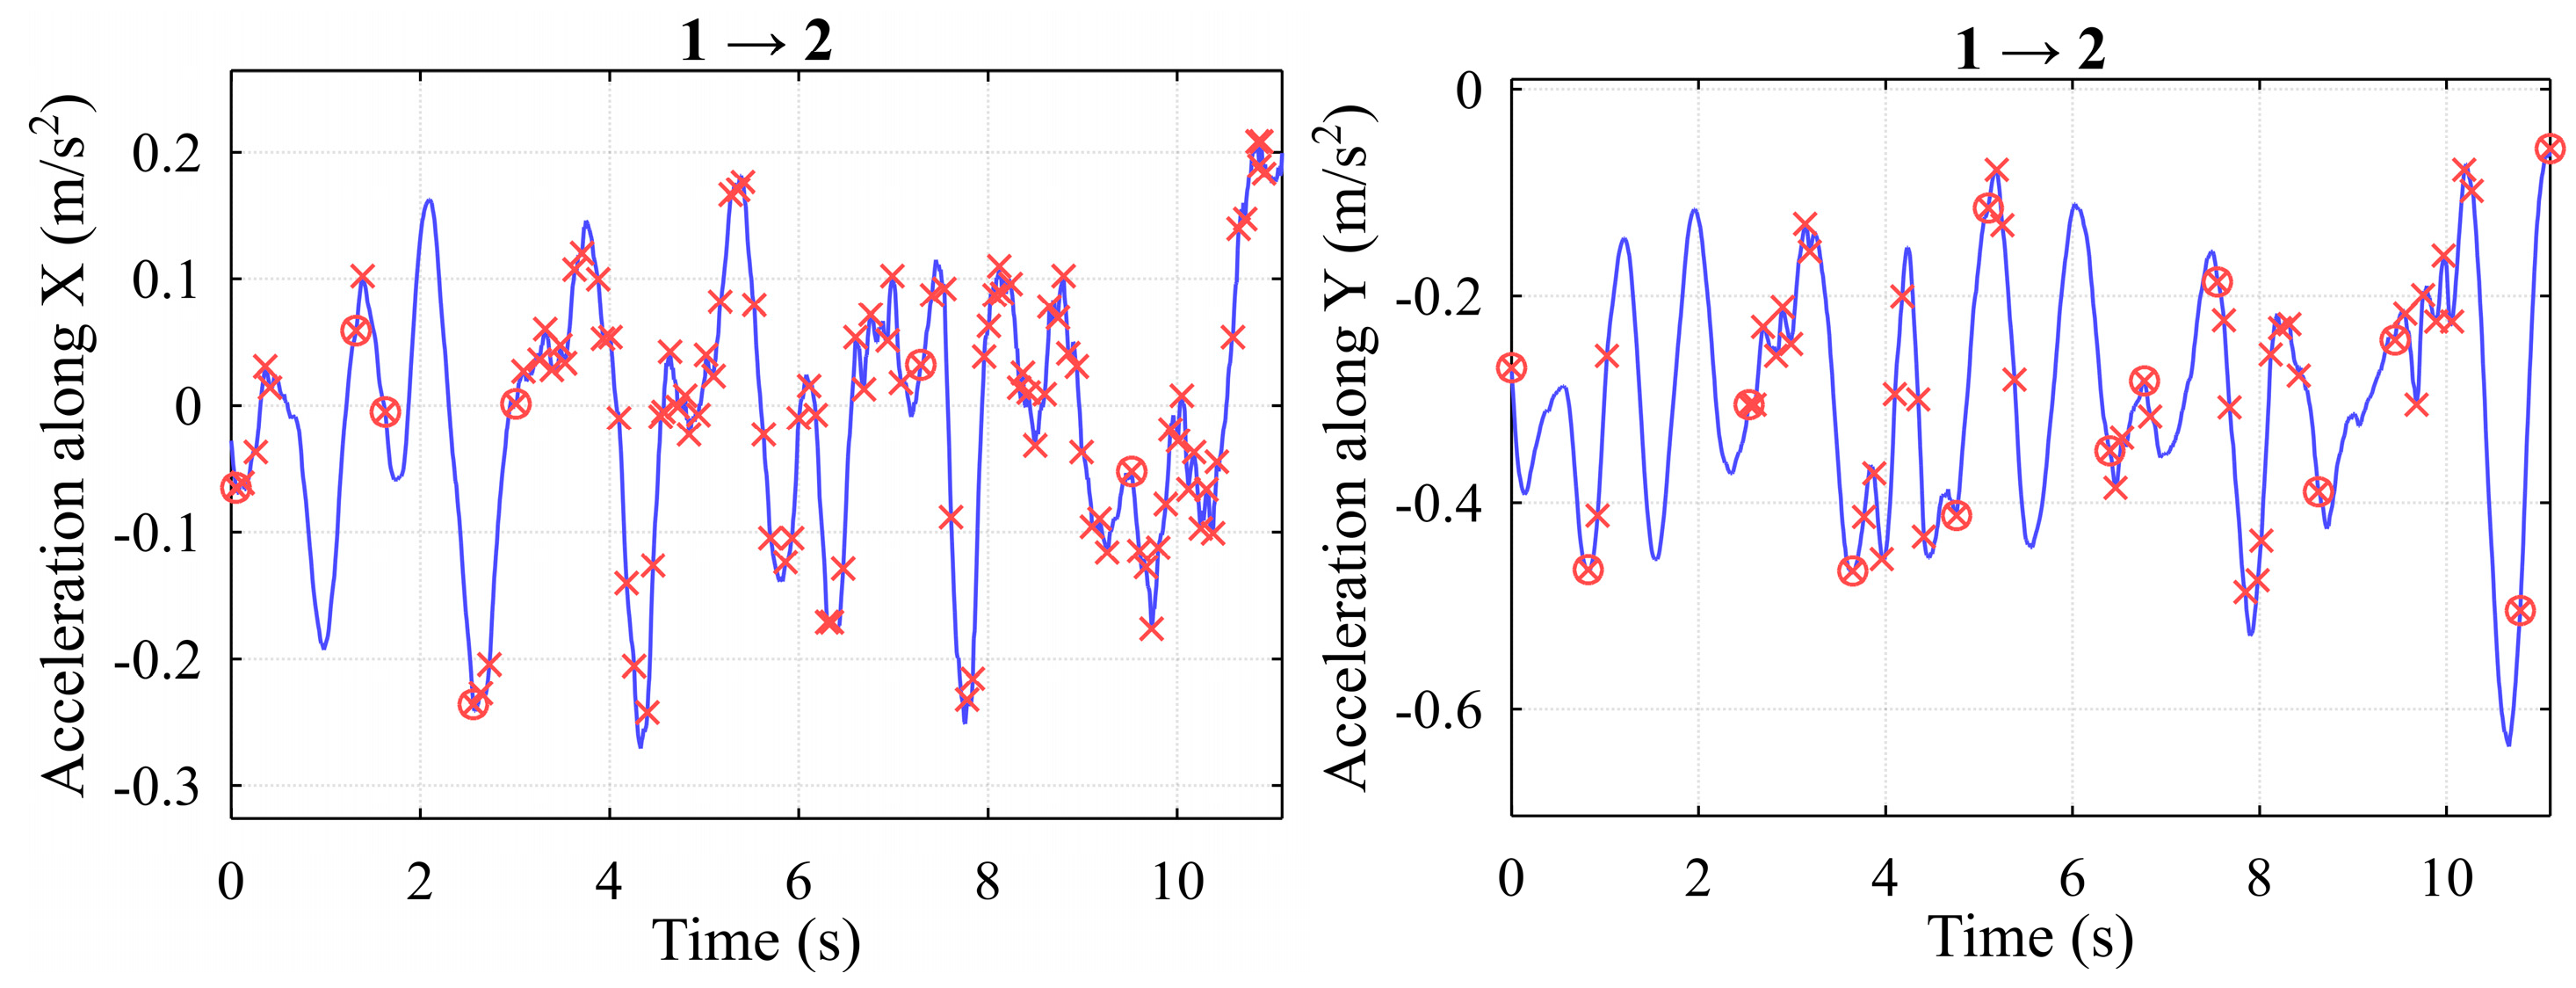
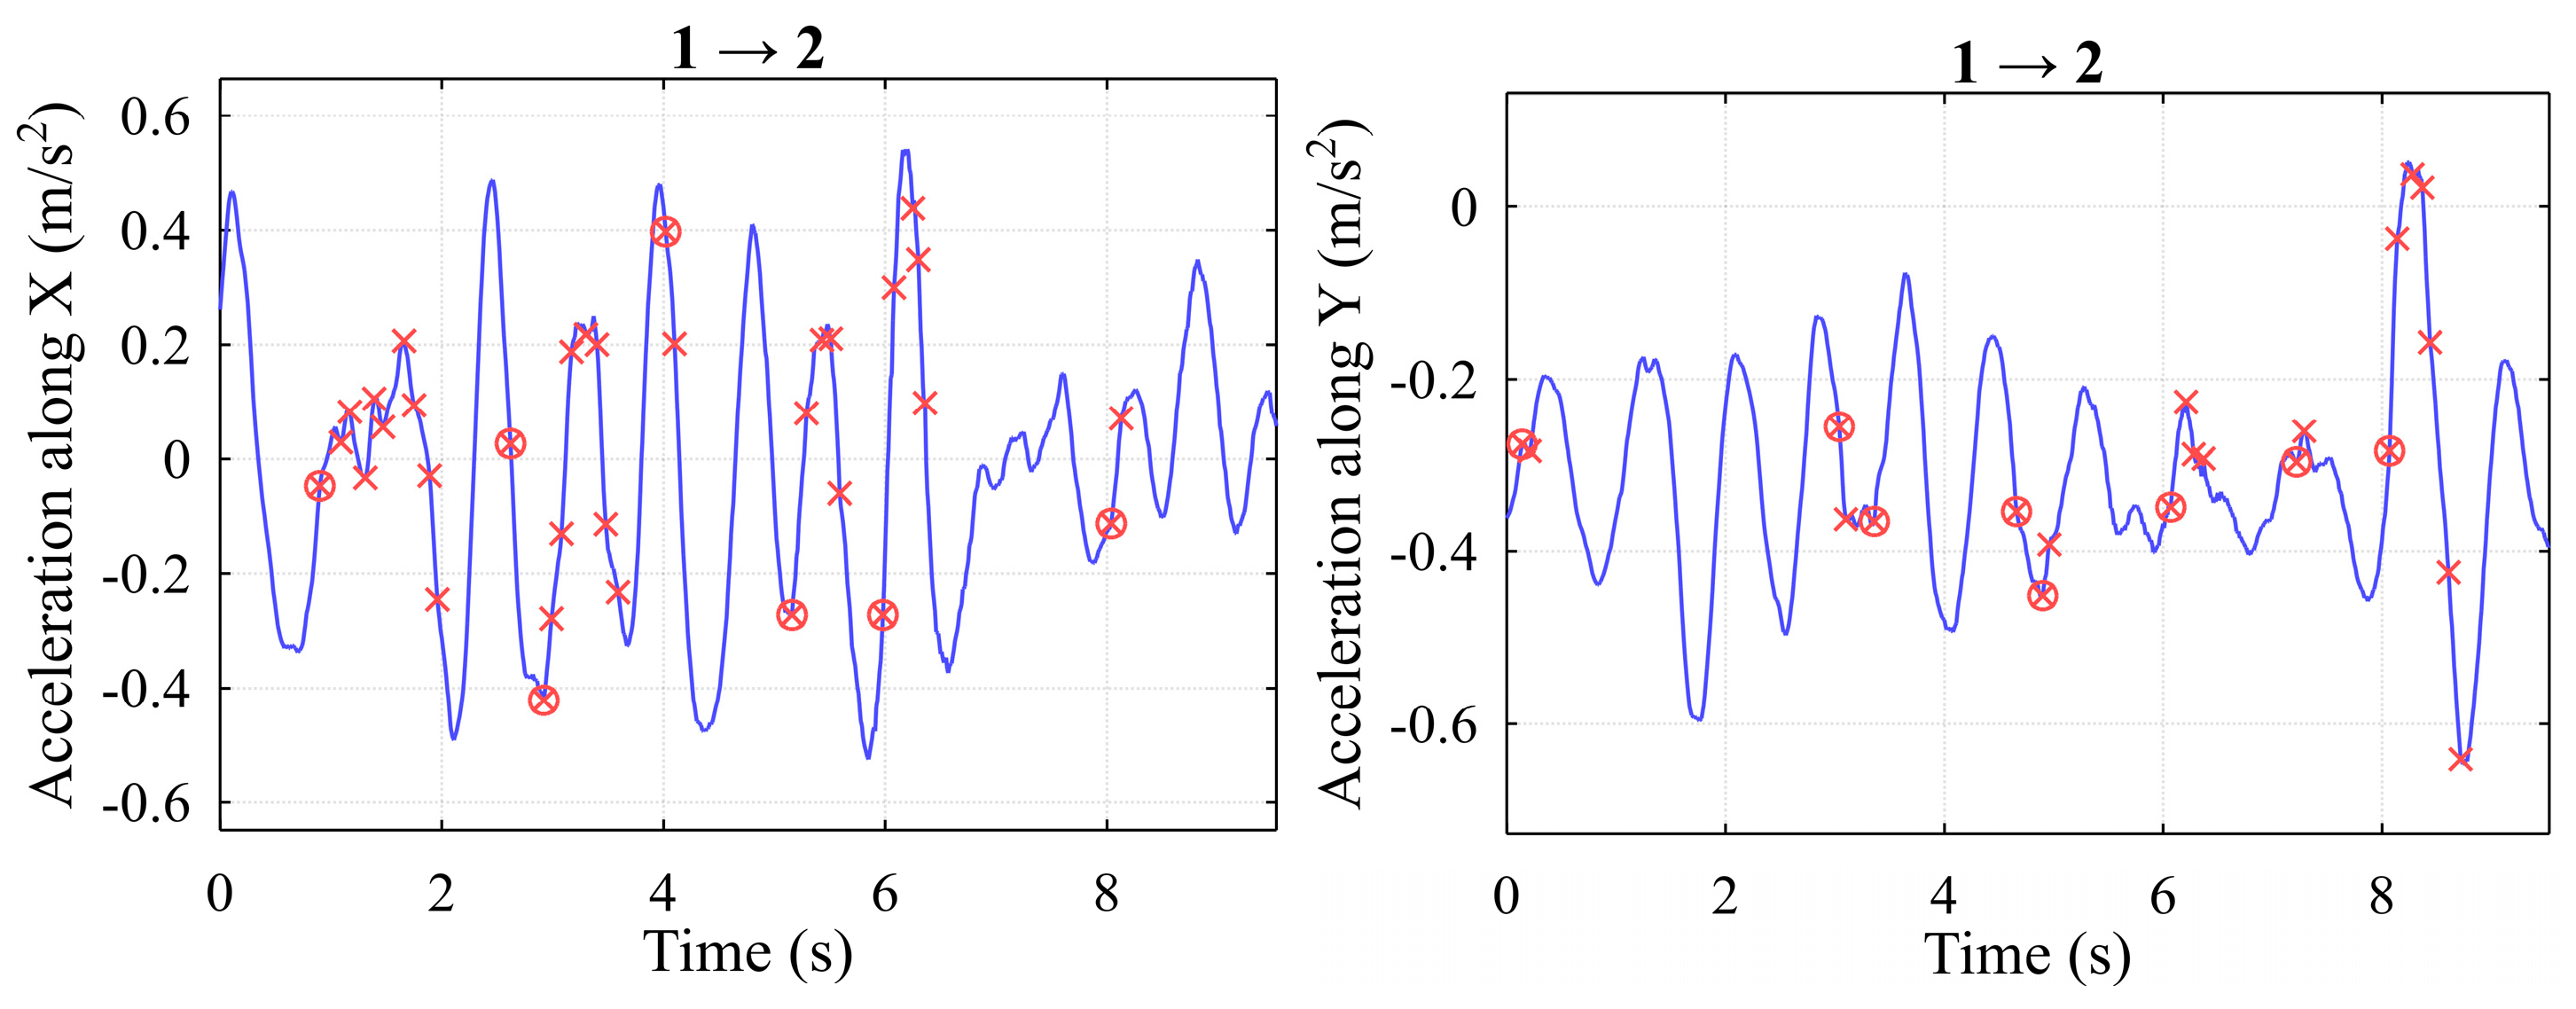
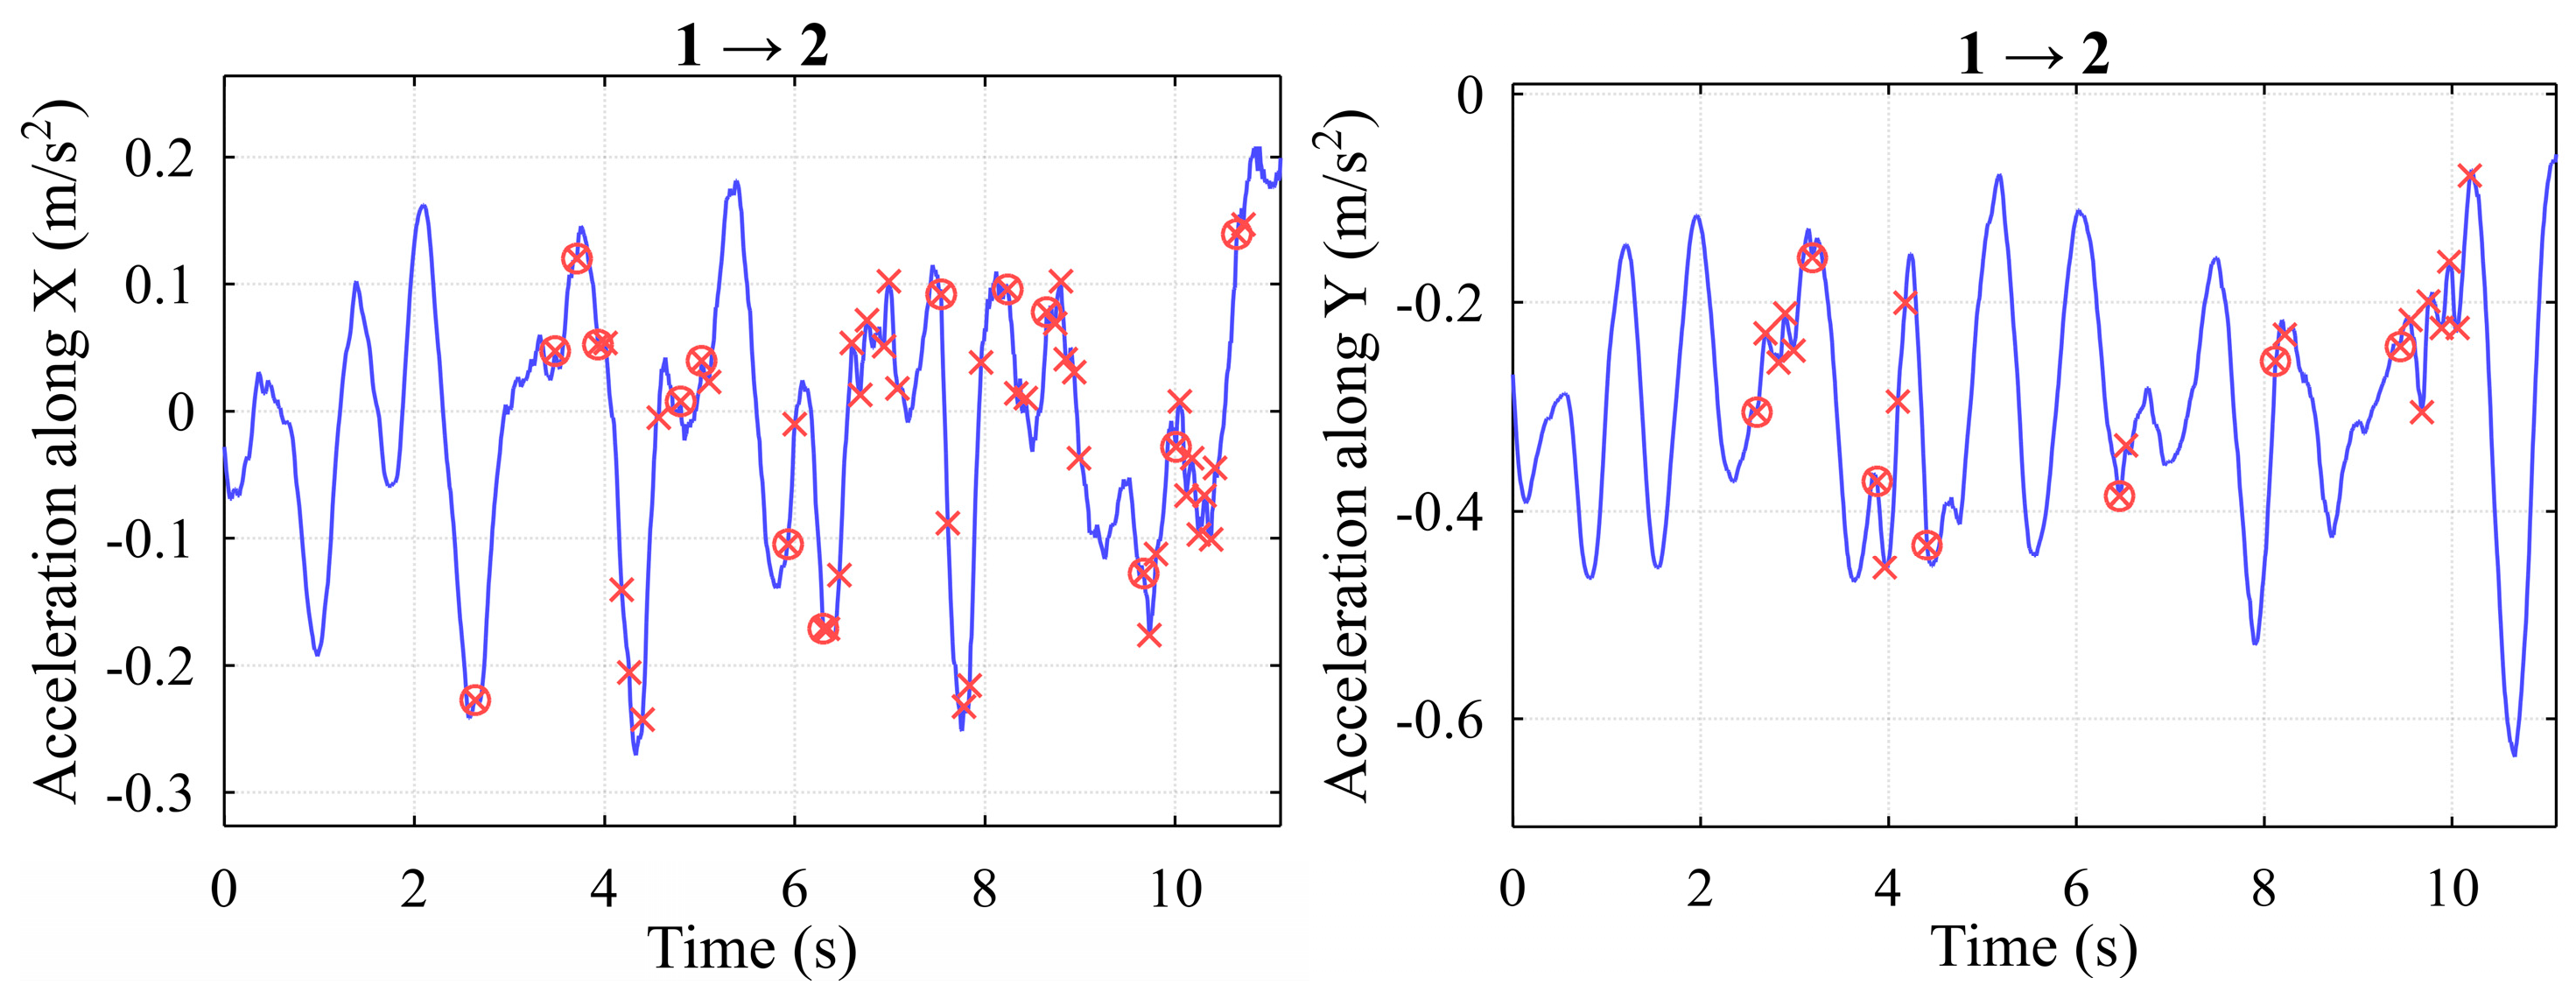
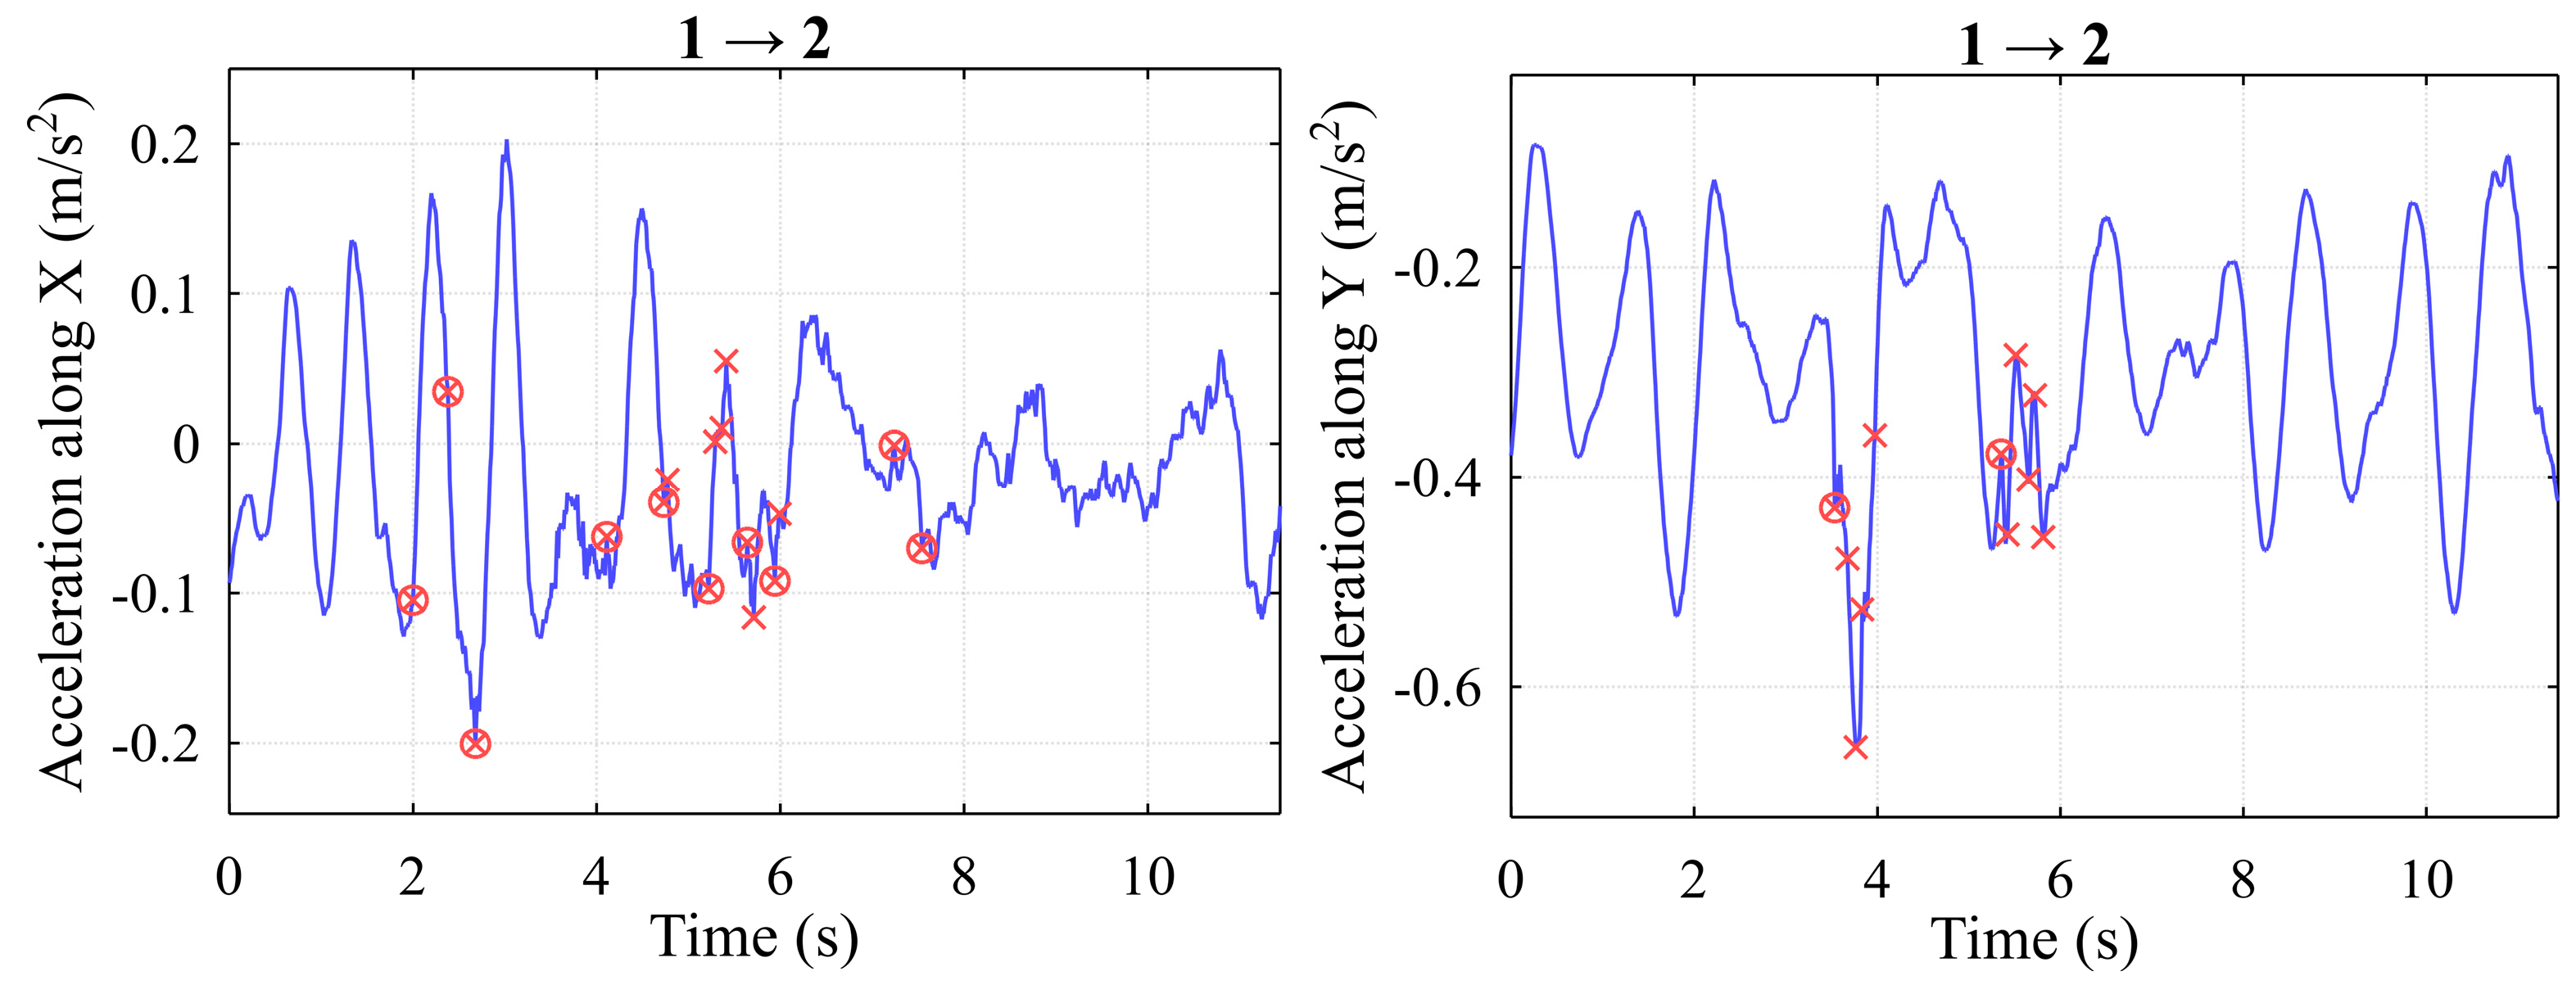
As a result, the following impacts were detected for the X and Y axes, for three separate use case studies, performed by the same operators under identical weather conditions, with the container mass varying between statistically allowed margins (see
Figure 9,
Figure 10 and
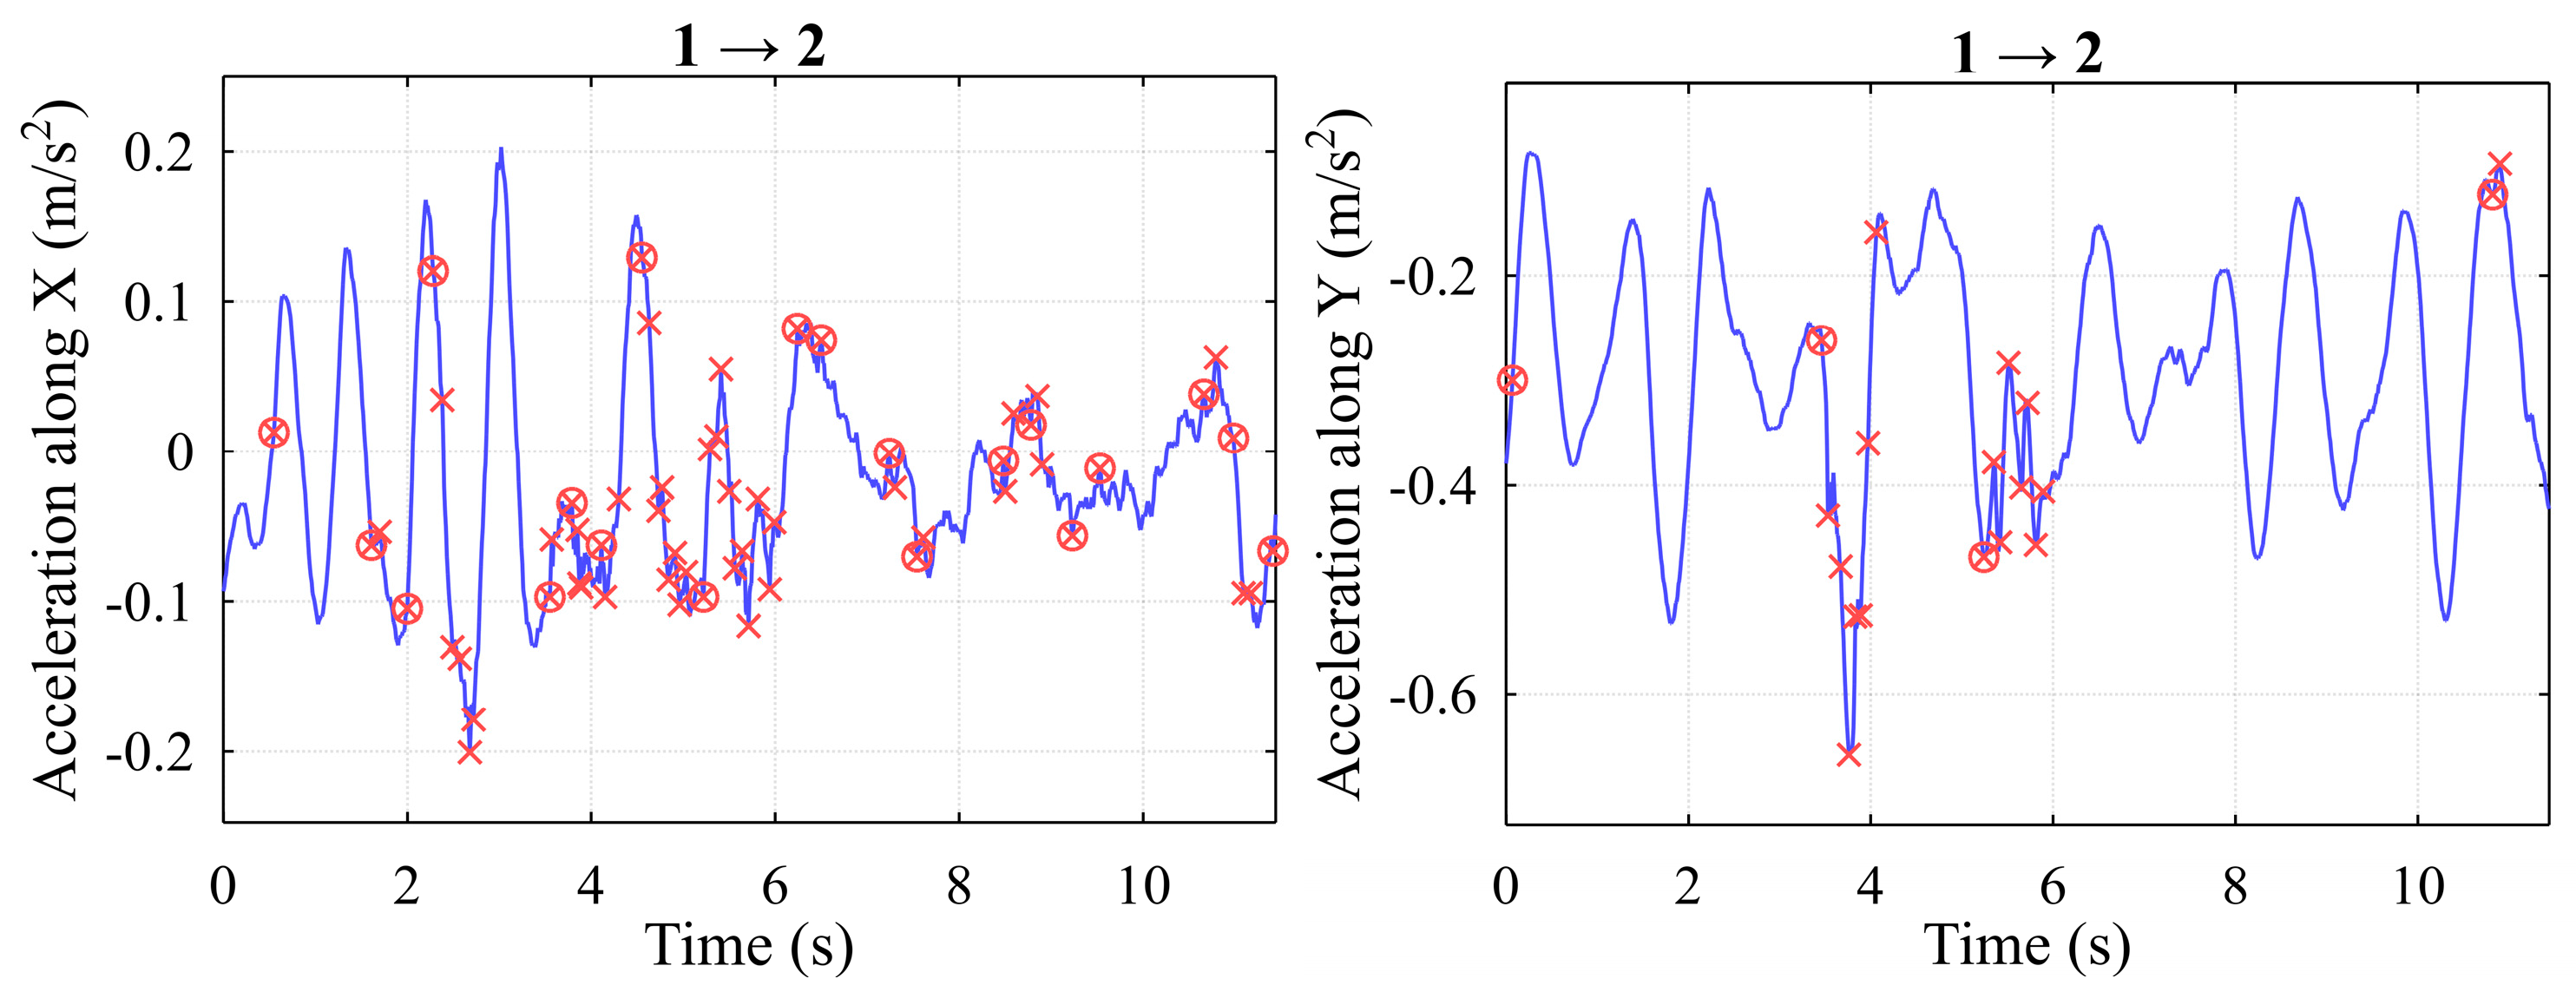
Figure 11). Here, the circles represent the initial strong impacts on the VCG, and the crosses represent the subsequent smaller sliding-like impacts that are less essential to the integrity of the metal structures in our case studies.
Change in the threshold gave promising results. A 10% increase resulted in one additional impact detected in the first use case along the Y-axis (refer to
Figure 12).
A 10% increase resulted in four additional impacts detected in the second use case along the Y-axis (
Figure 13), yet interestingly, the number of impacts along the X-axis decreased by four as well.
A 10% increase resulted in four additional impacts detected in the third use case along the X-axis (refer to
Figure 14), and the number of impacts along the Y-axis decreased by two.
A 10% decrease resulted in the decrease in detected impacts along the X-axis by two (refer to
Figure 15), and the number of impacts along the Y-axis decreased by four.
A 10% decrease resulted in three additional detections along the X-axis (refer to
Figure 16), and the number of impacts along the Y-axis decreased by two.
A 10% decrease resulted in the diminished number of impact detections along the X-axis, from 16 up to ten (
Figure 17), and the number of impacts along the Y-axis remained the same.
Further changes to the level of the threshold (
), with smaller steps (
), gave interesting results (see
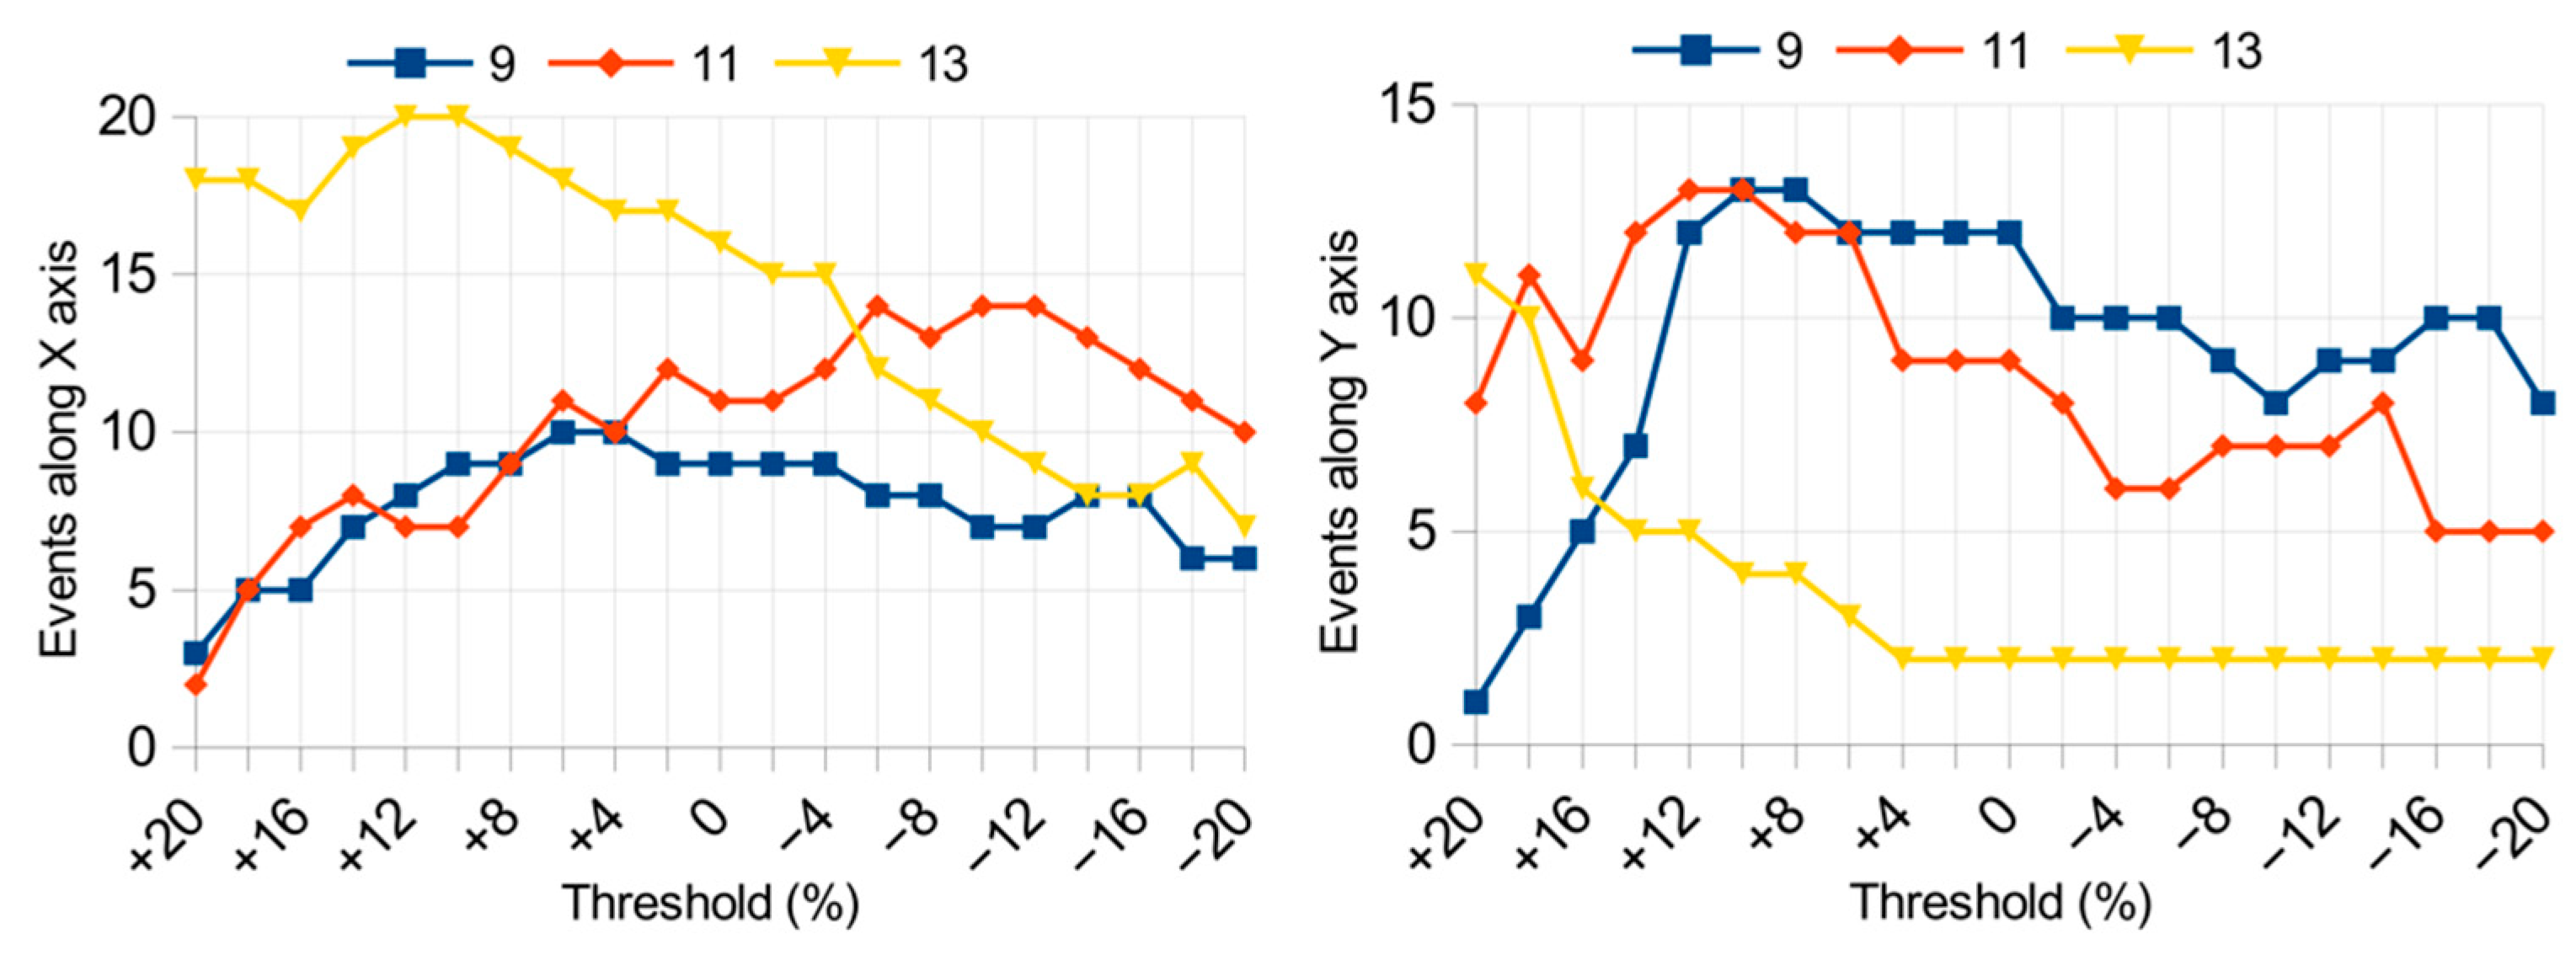
Table 1). From the provided results it is visible that the dependency is not linear for both the X and Y axes. In some cases, the increase in the threshold increased the number of detections up to several times (3rd case of the Y-axis), reaching eleven detected impacts from nominal two at the base parameters of the IDM. On the other hand, the second case showed quite different results. The number of detected impacts decreased by one from the nominal threshold level, jumping up and down at each step. Similar situations occurred with the X-axes of all three use cases. This is a clear indication that each use case study is unique and requires a full estimation of the dynamics of the machinery, the impact on the environment, and the randomized influence from the surrounding technological processes.
The threshold level deviation study proved that even a small change in the estimation of the components of the signal can gradually change the number of detected critical events, which is unacceptable in large-scale applications, due to the sheer volumes of data generated for each transshipment operation. Evaluation of smaller impacts is acceptable if the computational complexity of the solution, namely the IDM, is diminished by the efficient training and verification sessions, acquisition of valuable statistics and sensory information from many other handling operations, performed by other operators, cranes, spreader movement control systems and visual inspection policies at the later stages, tasks which are performed by the research team accordingly. Other measurement experiments performed using the system also indicated impacts, yet for each operator, those numbers vary differently. The authors point out that this kind of research has never been conducted before by other research groups, also the real estimation of impacts is impossible to assess, due the security reasons, working environment, and speed of events.
The following
Figure 18 demonstrates a clear trend in the change in the number of detected impact events with the varying threshold for all three case studies for both X- and Y-axes.
Concluding results indicate that the Y-axis is less stressed during handling procedures due to the dynamic properties of the structure, the cable placement, and environmental impact. Therefore, more events are being detected on the X-axis, where a clearer trend is observed up to the optimal IDM parameters, with one case study deviating from the trend, mostly due to severe differences in handling procedures. Lowering the threshold level diminished the number of detections, yet a clear pattern emerged, with averaging impacts varying between six and ten at the lowest level of the threshold for the X-axis. Two operations seemed close up until the starting point of the search, deviating more afterward, yet staying on the same course. While the last use case (13th) was detected as an impacts full process at the start, almost doubling the number of detected impacts compared to the 9th use case, the number of events gradually diminished to the same level as the rest of them. Seeing a similar pattern on the Y-axis for the 13th use case, it becomes clear that such a strong difference in detections is due to operational instability and lower force impacts against the VCG, more sliding impacts occurring, which should be filtered more effectively is a higher level of the threshold is intended to be used. The starting parameters proved to work great on average, gaining results adequately. While the decrease in the threshold level may prove to be more agile and adaptable in practice, detecting less, but more strong impacts.
The results indicate that in real experimental scenarios, it is truly impossible to detect everything, while the processes are chaotic and unpredictable. The metal structures of the ship tend to be damaged already during the experiments, and the tides tend to move the ship along the X-axis, causing sway of the structure and supporting impacts and sliding impacts which have fewer impacts yet add noisiness to the signal. Therefore, it is intended to continue the investigation to clarify the optimal IDM parameters suitable for the unified detection solutions. Additionally, the measurement of signals may be distorted because of handling procedures or failures in wireless transmission, and containers may exhibit many concurrent modes of stability loss during their placement in the inner holds, making the effective detection of real events difficult.
4. Conclusions
The IDM is a combination of filtering techniques, statistical analytics methods, and visualization means, that all together generate decision support information, extracting valuable content from acceleration values. However, the data must provide real-time information for the predictive maintenance of the ship’s infrastructure. For example, the data must include a signaling tool to alert repair units to check the containers and vertical cell guides of the holds in the event of a significant impact, or a collective data set to provide real-time information for the predictive maintenance of the ship’s infrastructure.
The results of this paper indicate that the amplitudes of acceleration values on the Z-axis are significantly larger in comparison due to vertical movements being much faster and stricter in vertical trajectory in the inner hull of the ship, along the VCG. The operator of the crane moves the joystick of the spreader control unit, resulting in long-term sliding of the container against the wall and the VCG, all after the initial stronger force impact. Additionally, the natural sway and vibrations of the entire crane structure and the ships drift on the tides near the berth including the additional movements of the containers and the additional impacts. This was previously observed by the authors. All this is an open research task for future researchers and engineers, working with relative control systems, methods, and decision support innovations. More realistic and probable impact events occur because the operator does not gently begin handling procedures, nor gently brake the lifting or lowering process, thus regulating the speed with jumps [
4,
6]. The authors also indicate that the observed parameters, which were found using the acceleration data of a single axis, can be also applied when searching for impacts on the other axes, thus making the detection techniques more agile and standardized.
The proposed method with a varying threshold level, if adapted for individual ship assessment, can be further used for the risk assessment of an individual row on the X-axis, even though it needs to be enhanced to enable the detection of each single load cycle event. This type of application’s key benefit is the ability to log any actual security events that take place within a row before switching to another. This makes it possible to gather enough information to use the suggested methodology to make appropriate decisions in time. Future research must examine each case study independently.

