1. Introduction
Initially, the CO
2 hydrate is a secondary refrigerant used to reduce the usage of the primary refrigerants and to improve the efficiency of the secondary system [
1]. Understanding the rheology of the CO
2 hydrate slurry can predict the pressure drop of refrigerating pipes accurately and help to optimize the efficiency of the refrigerating system. In recent years, as the development of oil and gas in deep-water regions progresses [
1], the reservoir gases become compounds, including methane, ethane, propane, butane, CO
2 and H
2S [
2,
3]. The acid gas (CO
2 and H
2S) can form gas hydrates in the wellbore much more easily than methane. Thus, the hydrate flow assurance problem in the wellbore and pipe becomes more complicated when natural gas contains CO
2.
Currently, the rheology of the hydrate slurry is a fundamental issue in calculating the pressure drop along the pipe length and time, and plays an important role in predicting hydrate plugging in the wellbore. However, CO2 hydrate accelerates the process of gas hydrate formation and amplifies the pressure drop induced by hydrate slurry flowing. Thus, the current prevention method for gas hydrate underestimates the risk of gas hydrate containing acid gas. The current hydrate management plan becomes improper. Studies focusing on the rheology of the rCO2 hydrate slurry contributes to the development of a high-efficiency hydrate management plan. Moreover, the rheology of the CO2 hydrate slurry participates in a number of industrial applications as an important fundamental concept, such as CO2 secondary refrigeration and CO2 storage in deep-water stratum.
Generally, the rheology of the hydrate slurry is influenced by multiple factors, including mesoscopic structure between hydrate particles, hydrate concentration, rheology of the carry fluid, additive concentrations, etc. [
4,
5,
6]. Since the hydrate slurry only keeps stable under the high-pressure and low-temperature environment, only two kinds of viscosimeters can satisfy the experimental requirement after a customizing upgrade, which are the Ostwald viscosimeter and rotatory viscosimeter [
4,
5,
6,
7,
8,
9,
10,
11]. Based on the kinds of carry fluid, the studies of hydrate slurry rheology can be divided into two parts [
11]. The first part is the hydrate slurry formed from the water-in-oil emulsion system [
5,
7,
8,
9,
10]. The other is the hydrate slurry formed from the aqueous solution [
12,
13,
14,
15,
16,
17,
18,
19,
20,
21]. In the water-in-oil emulsion system, Sinquin et al. (2004) pointed out that the increase in pressure drop by the hydrate slurry is dominated by the friction factor under turbulent flow and the apparent viscosity under laminar flow [
7]. In the most of their experiments, the hydrate slurry exhibits Newtonian behavior, and the relative viscosity of the hydrate slurry increases with the volume fraction of hydrate [
7]. In some specific cases, the hydrate slurry exhibits shear-thinning behavior due to high enough interparticle forces between hydrate particles [
7]. Peng et al. (2012) and Yan et al. (2014) conducted a series of experiments to investigate rheological properties of natural gas hydrate slurries with varied anti-agglomerants [
5,
8]. They also used the flow loop to test flow performance of the hydrate slurry under the shut-down and the restarting condition [
5,
8]. The hydrate slurry in a water-in-diesel oil emulsion exhibits obvious shear-thinning behavior and the increase in hydrate volume fraction makes the hydrate slurry become more shear-thinning. An empirical Herschel–Bulkley-type equation is developed, considering the hydrate volume fraction to describe the rheological property of the hydrate slurry [
5,
8]. Webb et al. (2012, 2014) experimentally investigated the rheology of the hydrate slurry in the water-in-crude oil emulsion, which varied in time, shear rate (1~500 s
−1), water cut (0~50%), temperature (0~6 °C) and initial pressure of methane (750~1500 psig) [
22,
23]. The yield stress of the hydrate slurry was found to increase with an annealing time of up to 8 h, and then remain constant. The hydrate slurry performed shear-thinning behavior and the increase in water cut resulted in an increase in the apparent viscosity and the yield stress [
22,
23]. Qin et al. (2017) used a control-stress rheometer to study the rheology of hydrate slurries in water-in-oil emulsion, which found that the hydrate formation induced the significant increase in apparent viscosity [
9]. The yield stress of the hydrate slurry in oil varied between 3 and 25 Pa at the water cut, ranging from 0.05 to 0.3 [
9]. Liu et al. (2020) experimentally analyzed the influence of the surfactant’s concentration on the rheology of the hydrate slurry. The surfactant had a positive contribution to the stability of the hydrate slurry [
24]. When the surfactant concentration was beyond 5 wt%, the viscosity of the slurry decreased significantly [
24]. The yield stress of the hydrate slurry was related to the shut-in time. In the first 10 min of shut-in, the yield stress was constant. When the shut-in time is beyond 20 min, the yield stress increased greatly. Liu et al. (2021) studied the rheology of the hydrate slurry containing wax and defined the three stages of apparent profile, which are the initial growth and aggregation, dynamic recovery and the balanced stage [
10]. Wax can increase the viscosity of the hydrate slurry but weaken the thixotropy of the hydrate slurry [
10]. The most proper reason that wax can induce an extra increment of viscosity for the hydrate slurry is due to the emergence of wax-hydrate coupling aggregates [
10].
In the aqueous solution, Andersson and Gudmundsson (2000) firstly used the flow loop to text the rheology of hydrate-in-water and pointed out that the hydrate-in-water exhibits Bingham behavior [
12]. Darbouret et al. (2005) experimentally investigated the rheology of TBAB hydrate slurries as the requirement from the secondary refrigeration field [
25]. The Bingham behavior of TBAB hydrate slurries was found in experiments of the ranges of particle contents and shear rates, and a corresponding method was proposed to decide its apparent viscosity and yield stress [
25]. Delahaye et al. (2008, 2011) conducted research on the rheology of the CO
2 hydrate slurry with additives [
1,
15]. The rheology of the CO
2 hydrate slurry is highly dependent on the volumetric hydrate fraction [
1,
15]. Without the effect of additives, the CO
2 hydrate slurry exhibits shear-thickening behavior with a volumetric hydrate fraction ranging from 4 to 10 vol%, and shear-thinning behavior with volumetric hydrate fraction ranging from 11 to 20 vol% [
1,
15]. Hashimoto et al. (2011) used a stress-control-type rheometer to study the rheology of TBAB and TBAF hydrate slurries, and pointed out their rheology exhibits pseudoplastic [
16]. Clain et al. (2012, 2015) experimentally verified the shear-thinning behavior of the TBPB hydrate slurry with a volumetric hydrate concentration ranging from 0 to 28.2 vol% [
4,
25]. Meanwhile, the particle size of the TBPB hydrate slurry was confirmed at range between 75 to 160 um by focused-beam reflectance measurement (FBRM) [
25]. The hydrate particle growth and agglomeration were indicated to have a potential relation with the rheological properties of the hydrate slurry. Jerbi et al. (2013) used the capillary viscometer method to reveal the rheological properties of the CO
2 hydrate slurry by using a flow loop with an inner diameter of 7.74 mm [
17]. The CO
2 hydrate slurry is a power fluid and the non-Newtonian index decreased from 1 to 0.6 as the volumetric hydrate concentration increased from 0 to 22 vol% [
17]. Sun et al. (2020) experimentally revealed the rheology of the methane hydrate slurry in the bubbly flow and pointed out that the methane hydrate slurry with bubbly exhibited shear-thinning under low-shear-rate conditions and shear-thickening under high shear rate condition [
18]. Fu et al. (2020a,b, 2022) used the same method as Sun et al., to investigate the influence of hydrate formation on water-based drilling fluid [
6,
19,
21]. The hydrate has an obvious effect on the rheology of the drilling fluid. The increase in volumetric hydrate concentration enhances the non-Newtonian behavior of the drilling fluid. Under the high shear rate condition, the water-based drilling fluid with hydrate also tends to the shear-thickening behavior [
6,
19,
21]. Muhlstedt et al. (2021) used a stress-control rotational rheometer to study the rheology of water-based drilling fluid with THF hydrate. The influence of hydrate formation on the shear-stress and shear rate were analyzed [
26]. Based on Fu et al., and Muhlstedt et al.’s work, although the effect of the hydrate on the rheology of the drilling fluid is negligible, the rheology of water-based drilling fluid is highly dependent on the additives of drilling fluid. Sakurai et al. (2021) revealed the hydrate formation process in the water-dominated bubbly flow and verified Sun et al.’s result in which the hydrate formation in the bubbly flow can increase the shear stress of the bubbly flow [
27].
Although previous researchers have conducted experiments to reveal the rheology of the CO
2 hydrate slurry, a consistent conclusion has not been reached. In Delahaye et al.’s work, the rheology of the CO
2 hydrate slurry could be shear-thinning and shear-thickening depending on volumetric hydrate concentration [
1,
15]. In Jerbi et al., and Lv et al.’s work, the CO
2 hydrate slurry was found to be shear-thinning fluid [
27,
28]. In this work, a new flow loop with an inner diameter of 50 mm is built up to study the rheology of the CO
2 hydrate slurry by using the capillary method, where the 50 mm inner diameter of the flow loop is quietly closed to the industrial conditions and the experiments are designed based on the Reynolds number similar criterion. Different from previous works, the CO
2 hydrate slurry exhibits an apparent shear-thickening behavior in the whole experiment. An empirical Herschel–Bulkley-type equation is developed to predict the shear stress and the apparent viscosity of the CO
2 hydrate slurry.
2. Experiment
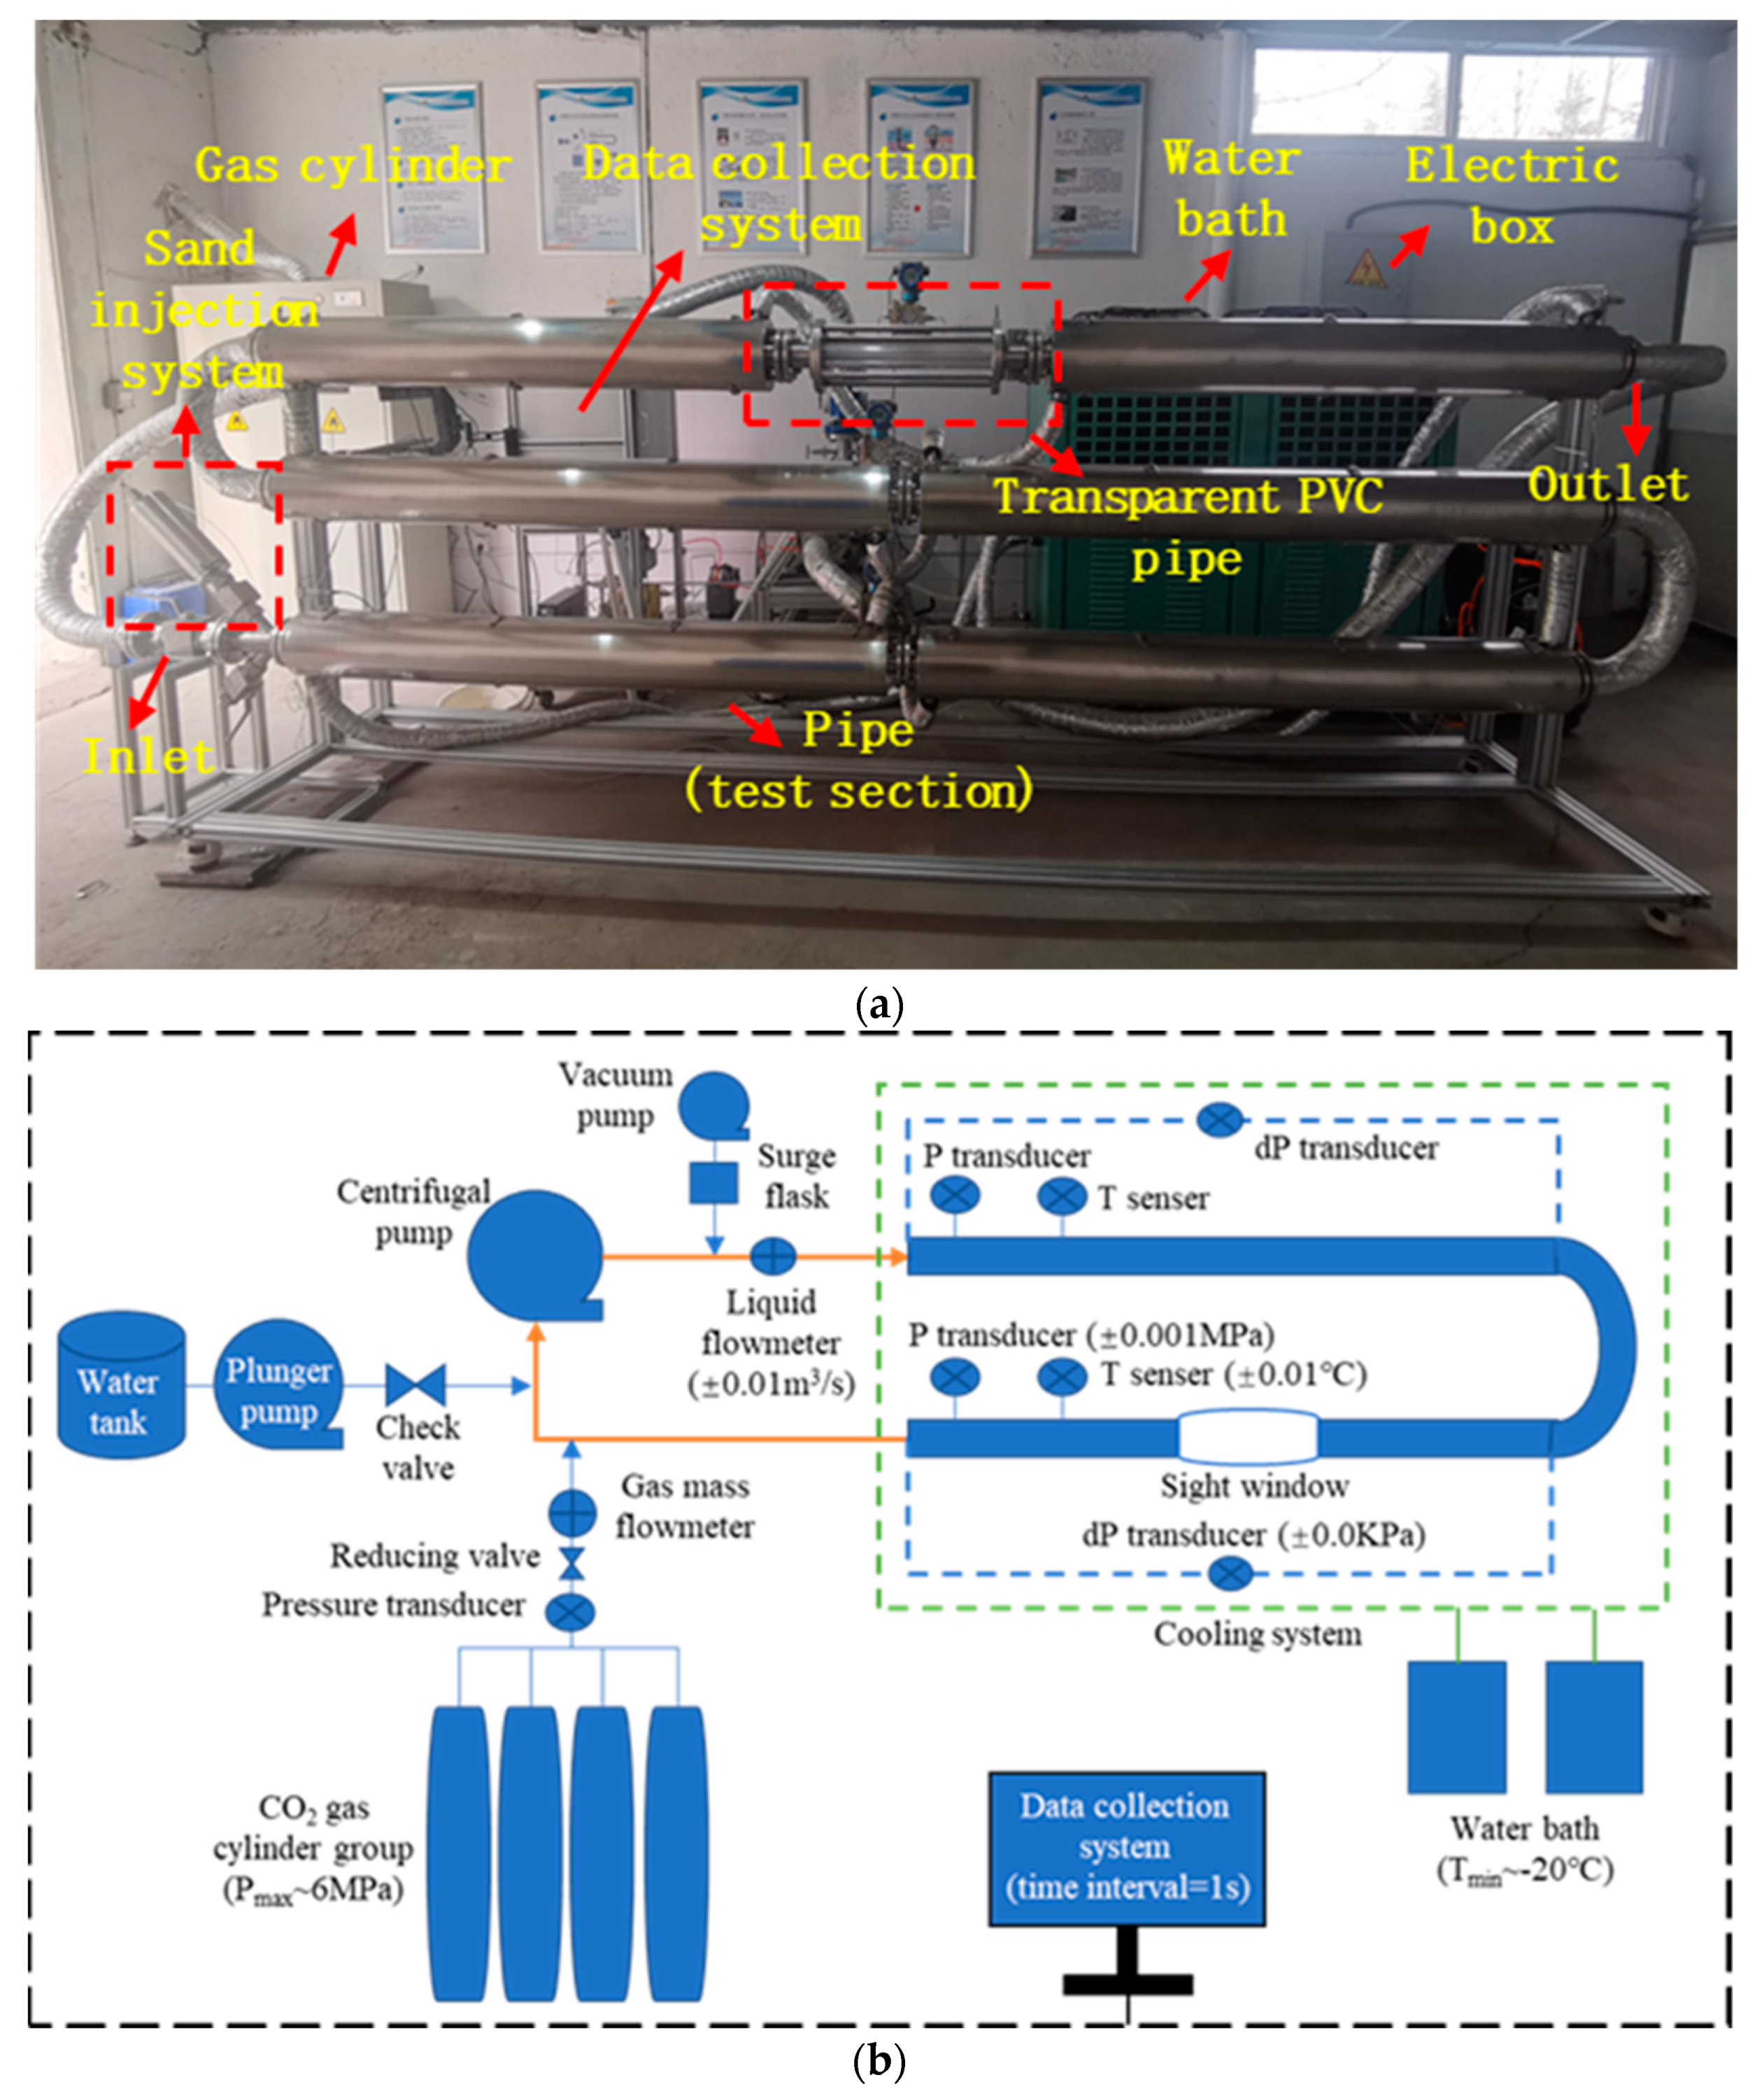
In this work, a new flow loop was built up to study the rheology of the CO
2 hydrate slurry. Compared to our previous flow loop, the new loop had a larger inner diameter and longer test section, which were 50 mm and 15 m, respectively. The large diameter of test section pipe provided a flow condition closed to the industrial condition, where the drainage line in deep-water well had a diameter of 80 to 100 mm. The centrifugal pump equipped in the flow loop could tolerate 10 vol% volumetric gas fraction which enabled the void fraction and hydrate fraction inside the flow loop to be up to 10 vol% and beyond 12 vol%, correspondingly. The accuracies of temperature, pressure, pressure drop and flow rate were 0.01 °C, 0.001 MPa, 0.01 Kpa and 0.01 m
3/s. The tolerances of pressure and temperature were 5 Mpa and 0 °C. The interval of data collection was 1 s. The transparent PVC pipe enabled the observation of flow pattern and morphology of the hydrate slurry but limited the maximum pressure of the flow loop. The total volume of the flow loop was 43,000 mL. The image and schematic of the new flow loop are given in
Figure 1a,b.
The experiments were designed based on the Reynolds number similar criterion, where the CO2 hydrate slurry had the same Reynolds number with fluid in the drainage line of a deep-water natural-gas hydrate well. The rheology of the CO2 hydrate slurry was tested by the capillary method. The capillary method uses the pressure drop of the hydrate slurry in the horizontal pipe to evaluate its rheology. Since the rheology is measured in the pipe, the flow condition in the experiment was the same as the deep-water well. Thus, the rheological model developed based on the capillary method is more reliable for the petroleum engineers. The experiments had void fractions ranging from 0 to 7.09 vol%, flow velocity ranging from 0 to 4 m/s, volumetric hydrate concentration ranging from 1.4 to 17.2 vol% and pressure ranging from 0 to 4 Mpa. The experimental procedure is illustrated as follows:
- (1)
In the preparation stage, the flow loop is cleaned up by the deionized water and vacuumed by the vacuum pump. When the pressure of the flow loop drops to 0.1 MPa, the flow loop is vacuumed. Then, the plunger pump is used to pump water inside the flow loop until the expected volume of water and an electric weight can weigh the pumped water in real time. At this stage, the data collection system starts to record experimental data, such temperature, pressure, pressure drop, flow rate, etc.
- (2)
Then, the valve of the gas cylinder opens and CO2 is injected inside the flow loop. At the same time, the cooling system starts to cool down the test section and the pressure of the flow loop is kept under 1.2 MPa. In this stage, the temperature of the flow loop decreases and CO2 dissolves into water. When the temperature drops to the target and the pressure is kept the constant, the water is saturated with CO2.
- (3)
CO2 is injected into the flow loop until the pressure reaches the target and the valve of the gas cylinder closes. CO2 hydrate starts to crystalline in the flow loop, and the pressure of the flow loop decreases correspondingly.
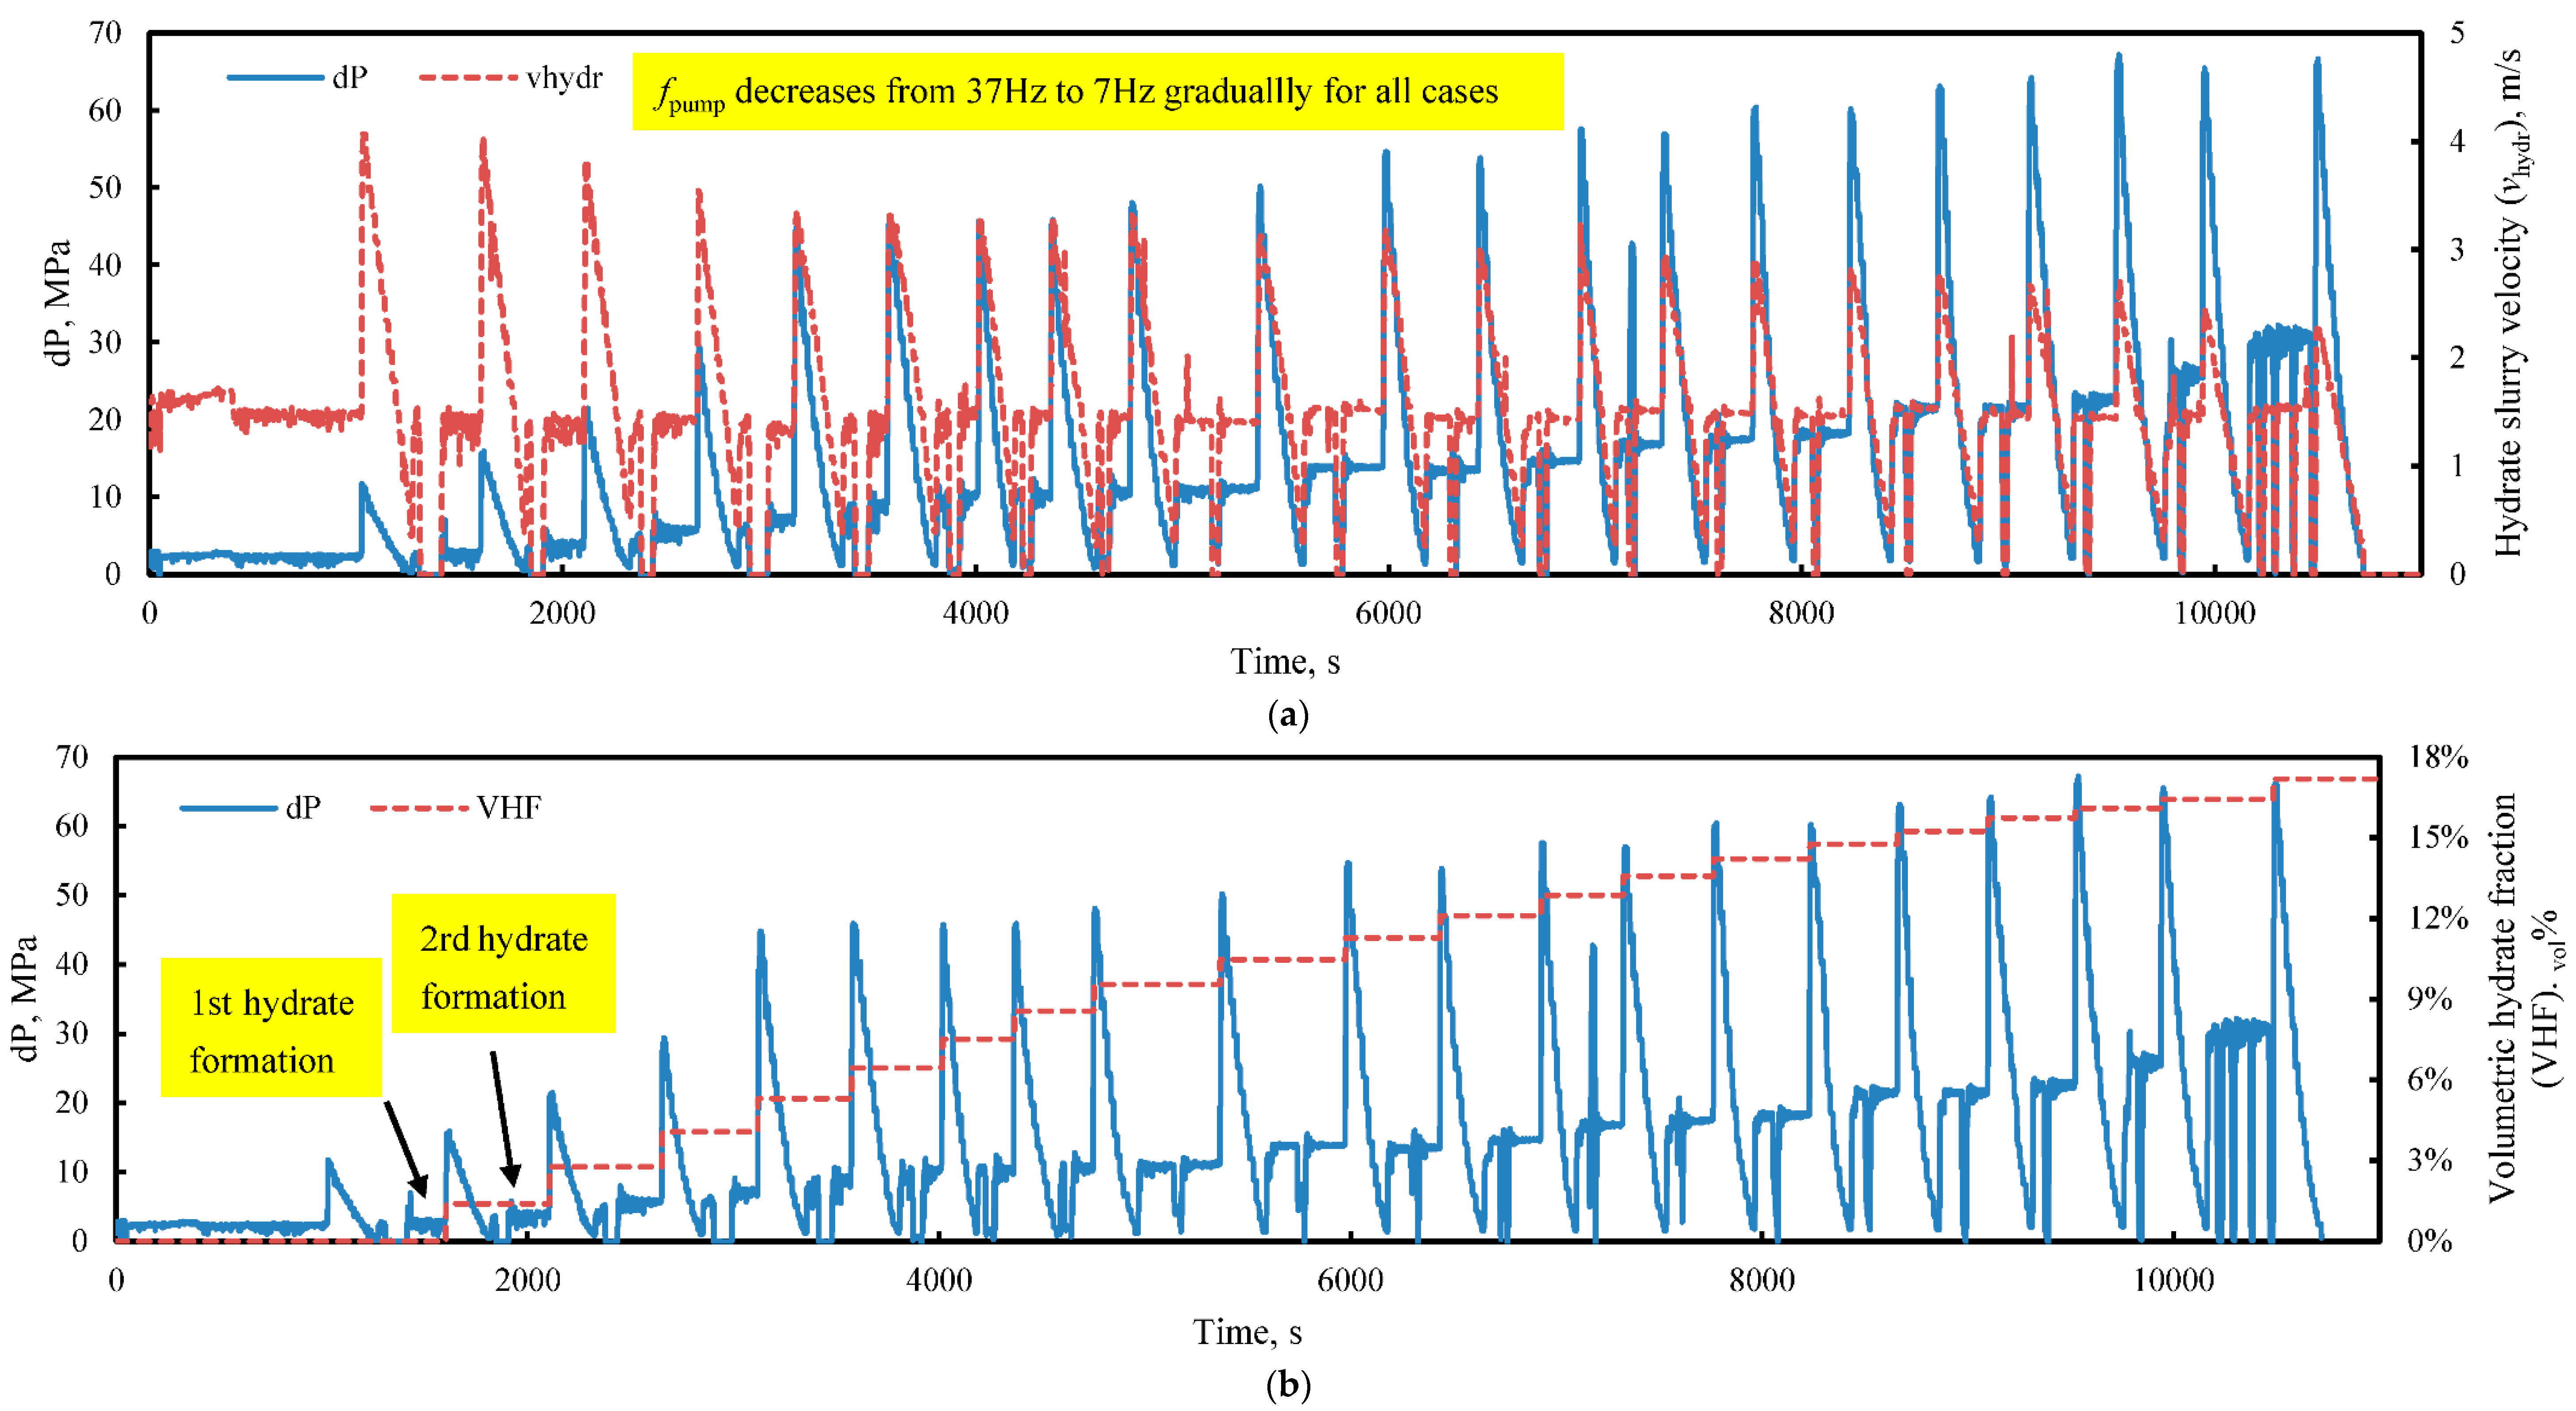
- (4)
When the pressure keeps the constant, the hydrate formation stops in the flow loop. Thus, the flow loop varies from 37 Hz to 7 Hz and records the flow velocity and pressure drop of the hydrate slurry at the same time.
- (5)
CO2 is injected into the flow loop again and the second hydrate formation experiment is conducted to increase the volumetric hydrate concentration in the flow loop. When the void fraction decreases to be negligible, and the volumetric hydrate concentration becomes hard to increase, the experiment stops.
The rheological experiments of the CO
2 hydrate slurry consist of a CO
2 hydrate formation experiment and rheological examination experiment. The CO
2 hydrate formation experiment increases the volumetric concentration in the flow loop. The rheological examination experiment tests the pressure drop of the hydrate slurry under a different flow velocity, where such pressure drops can evaluate the rheology of the hydrate slurry by the capillary method. The whole procedure of the rheological experiment is given in
Figure 2a,b.
In
Figure 2a, the experiment consists of 20 times of CO
2 injections, which means 20 times of CO
2 hydrate formation experiments. The volumetric hydrate concentration is increased after each hydrate formation experiment and gradually ascends from 1.4 to 17.2 vol%. After hydrate formation, the pump frequency (
fpump) decreases from 37 Hz to 7 Hz and the flow velocity of the hydrate slurry also decreases correspondingly. In
Figure 2a, as the volumetric hydrate fraction increases, the range of flow velocity shrinks at the same time. This is because the increased viscosity of the hydrate slurry induces higher friction force with the pipe wall, and the centrifugal pump needs more frequency to maintain the velocity of the hydrate slurry. At 37 Hz, the velocity of the hydrate slurry decreases from 4 to 2.16 m/s, which is about a half, as the volumetric hydrate concentration increases from 1.4 to 17.2 vol%.
Figure 2b exhibits the effect of volumetric hydrate concentration on the pressure drop of the hydrate slurry, where first and third hydrate formation experiments are marked. The pressure drop of the hydrate slurry increases greatly as the volumetric hydrate concentration increases. For instance, under the hydrate slurry velocity of 15.5 m/s, the pressure drops are 6 and 65.8 kPa at the volumetric hydrate concentration of 1.4 and 17.2 vol%. The pressure drops increase by about 11 times.
3. Rheological Model
Previous researchers have performed numbers of experiments to study the rheology of hydrate slurries in aqueous solutions, as shown in
Table 1 [
1,
4,
6,
12,
13,
14,
15,
18,
19,
21]. All those works use the capillary method (Ostwald viscosimeter) to investigate the rheology of the hydrate slurry. However, their rheology does not meet a unique conclusion which exhibits Bingham, shear-thinning and shear-thickening in different aqueous solutions. If the aqueous solution contained additives, the hydrate slurry would be highly related to the physical and chemical properties of additives. Compared with Delahaye et al.’s work, we used the flow loop with a larger inner diameter to research the rheology of the CO
2 hydrate slurry and a wider range of apparent viscosities. The flow loop with a larger dinner diameter enables the flow condition of the hydrate slurry in experiments to be closed to the industrial condition and the experimental results become reliable.
Although no clear agreement for the CO
2 hydrate slurry rheology is reached, the hydrate slurry is recognized as a power-law fluid which is a non-Newtonian fluid. In this model, the rheology of the CO
2 hydrate slurry is assumed to be a laminar flow regime in the cylindrical pipe under most of the experimental conditions. Since the wall slip is widely considered in the multiphase flow in porous media or in the micro-tube, the flow behavior of the hydrate slurry in the pipeline is a macroscopic problem, and the other influencing factors are more important than the wall slip, such as hydrate concentrations and flow velocity [
18]. Therefore, we ignore the wall slip in this work. The Metzner and Reed model (1955) is a theoretical and fundamental base to describe the rheology of the hydrate slurry which revealed the relationship between flow rate, shear rate and shear stress, as shown in Equation (1) [
29]:
where
Q is the flow rate of the hydrate slurry, m
3/s,
R is the inner diameter of the pipe, m, τ is the shear stress, Pa,
γ is the shear rate, s
−1.
The shear stress of the hydrate slurry is formulated by the pressure drop of the hydrate slurry, test section length and the diameter of the pipe [
30], as shown in Equation (2):
where τ
HS is the shear stress of the hydrate slurry, Pa, Δ
P is the pressure drop of the hydrate slurry, Pa,
D is the diameter of the pipe, m,
L is the length of the test section pipe, m.
Moreover, the Herschel–Bulkley equation is a classical expression for the non-Newtonian fluid to illustrate the relationship between shear rate and shea stress [
30], as shown in Equation (3):
where τ
0 is the yield stress of the hydrate slurry, Pa,
γHS is the shear rate of the hydrate slurry, s
−1,
n is the non-Newtonian fluid index,
K is the consistency factor. Equation (4) defines the
n index [
30]:
In our previous works, the apparent viscosity of the hydrate slurry was defined as the ratio of shear stress and shear rate of the hydrate slurry [
6], as shown in Equation (5):
where μ
app is the apparent viscosity of the hydrate slurry, mPa s.
4. Experimental Results and Discussion
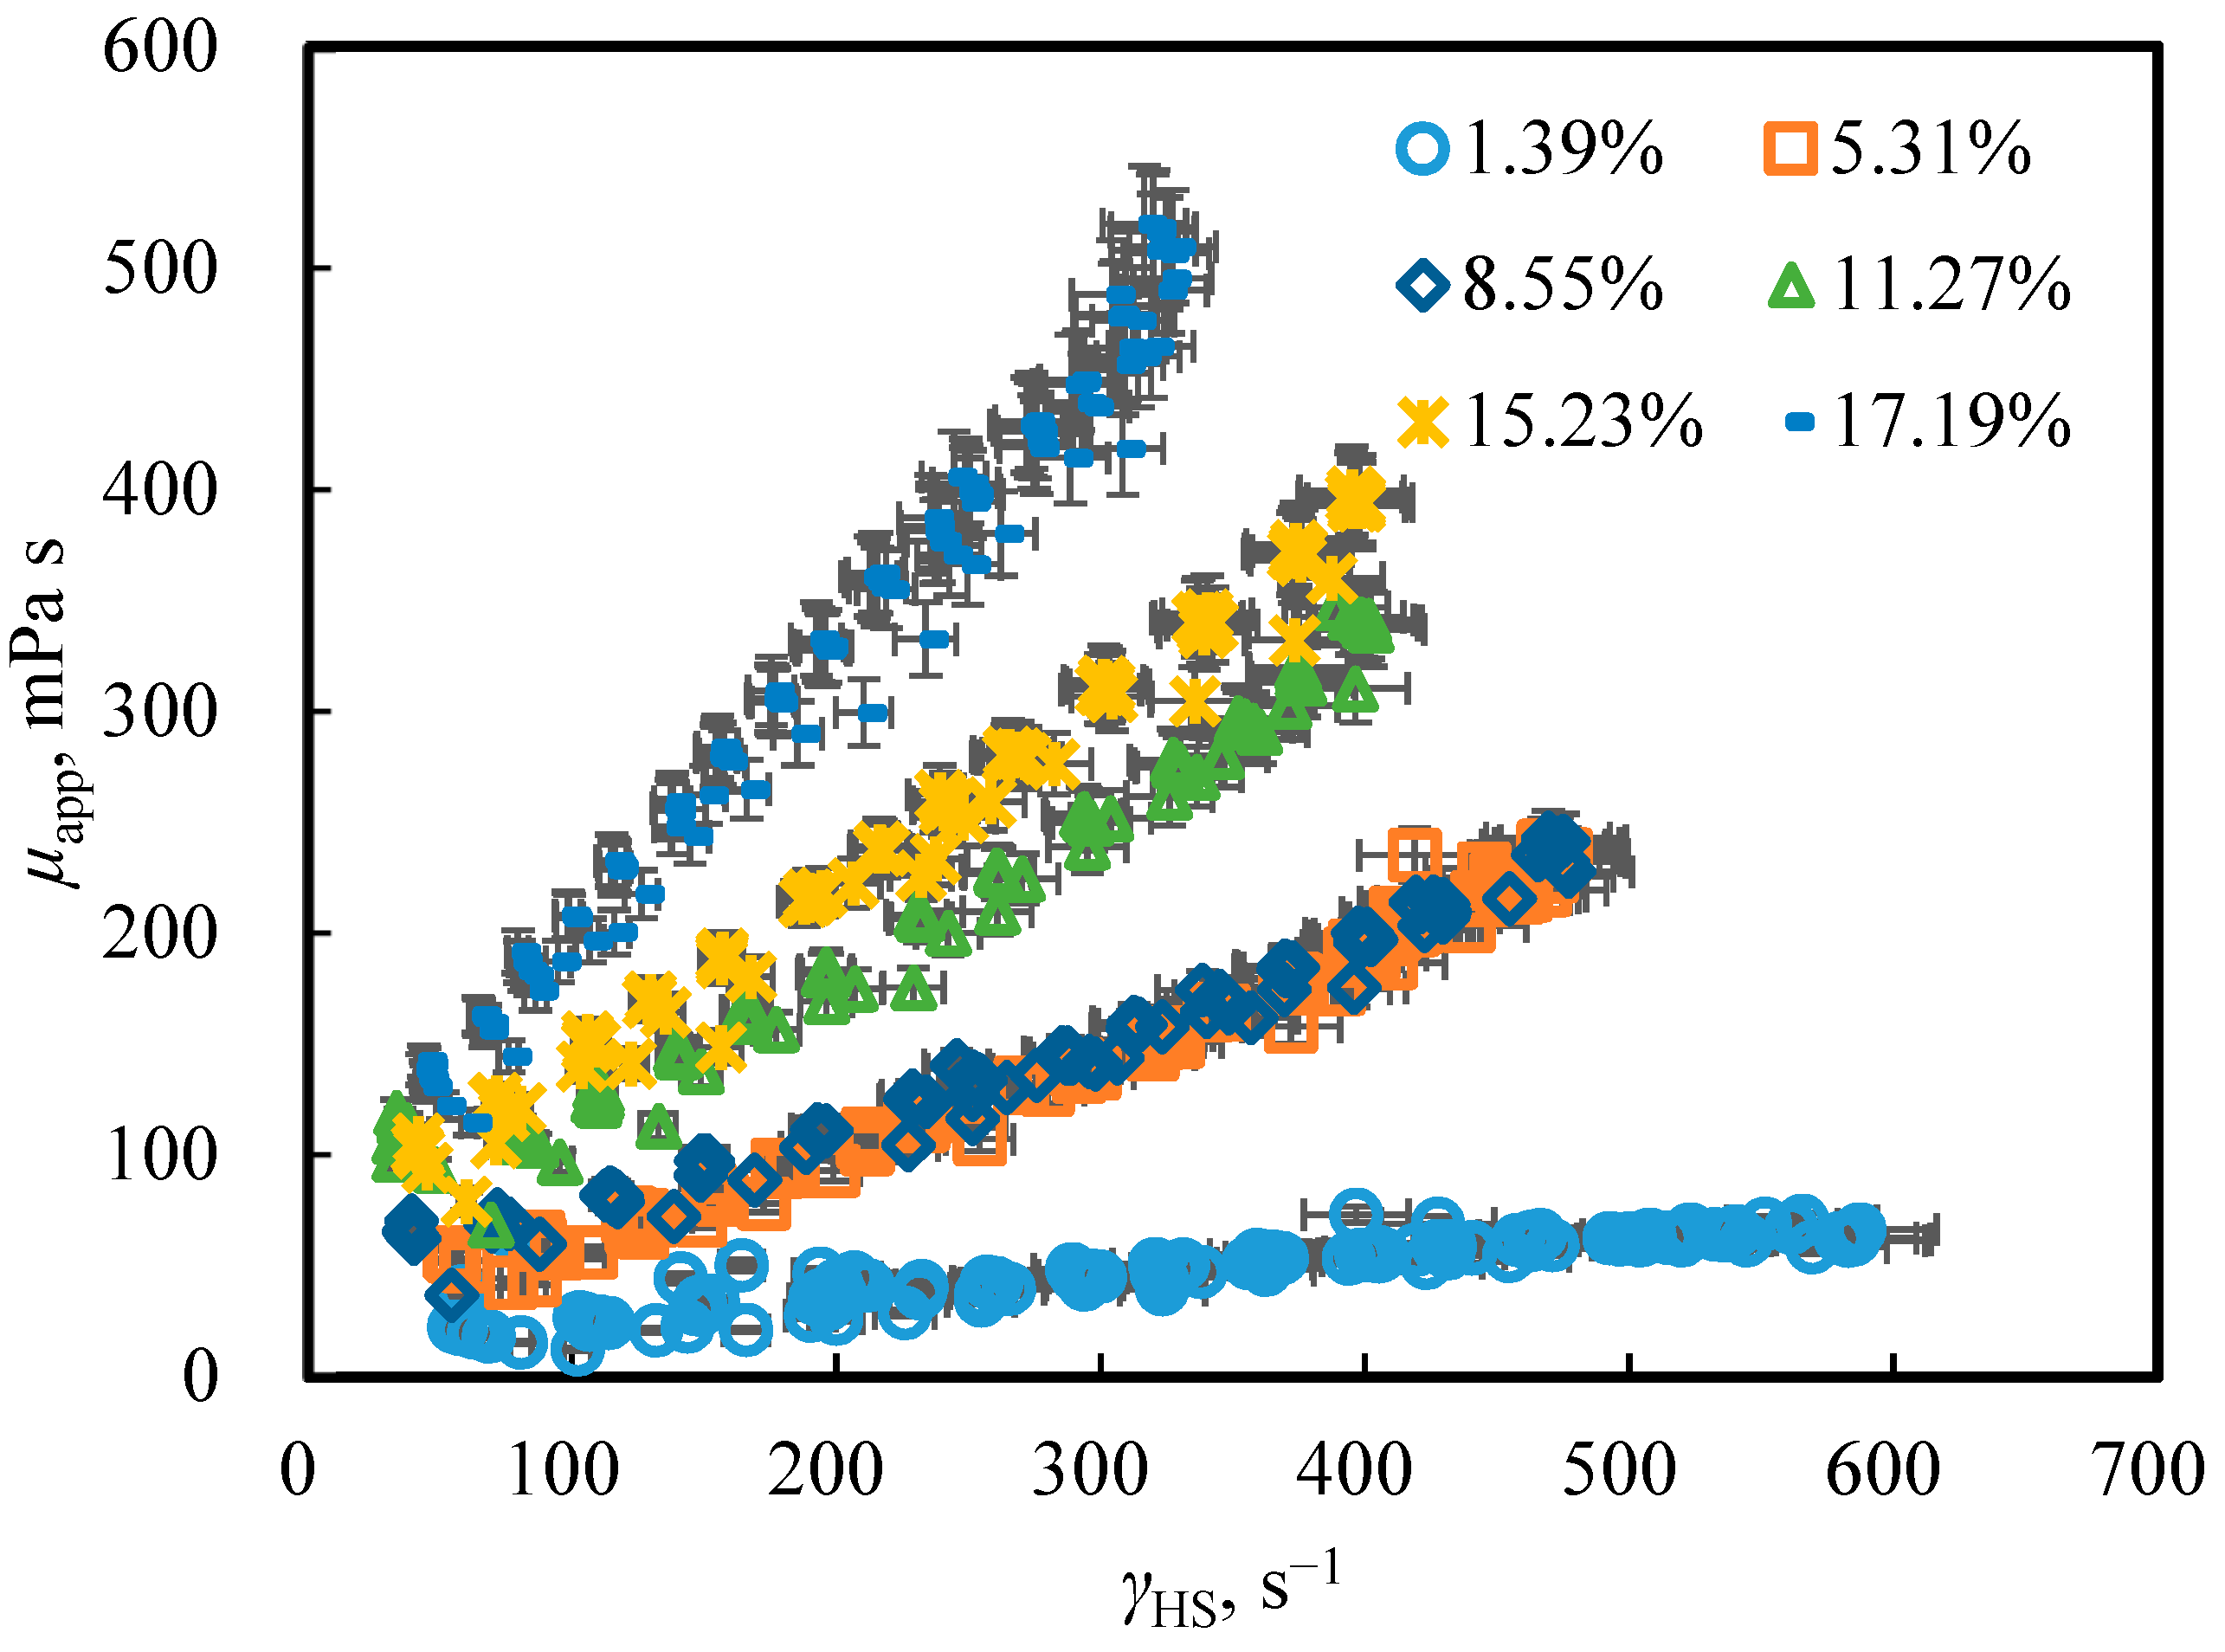
The rheology of the CO2 hydrate slurry in current experiments are studies within volumetric hydrate concentrations from 1.4 to 17.2 vol%, shear rates from 40 to 590 s−1 and void fractions from 7.09 to 2.32 vol%. The rheology model of the CO2 hydrate slurry is developed based on the Herschel–Bulkley equation (power-law model). The volumetric hydrate concentration is taken into account when describing the non-Newtonian index (n factor) and the consistency factor (K factor).
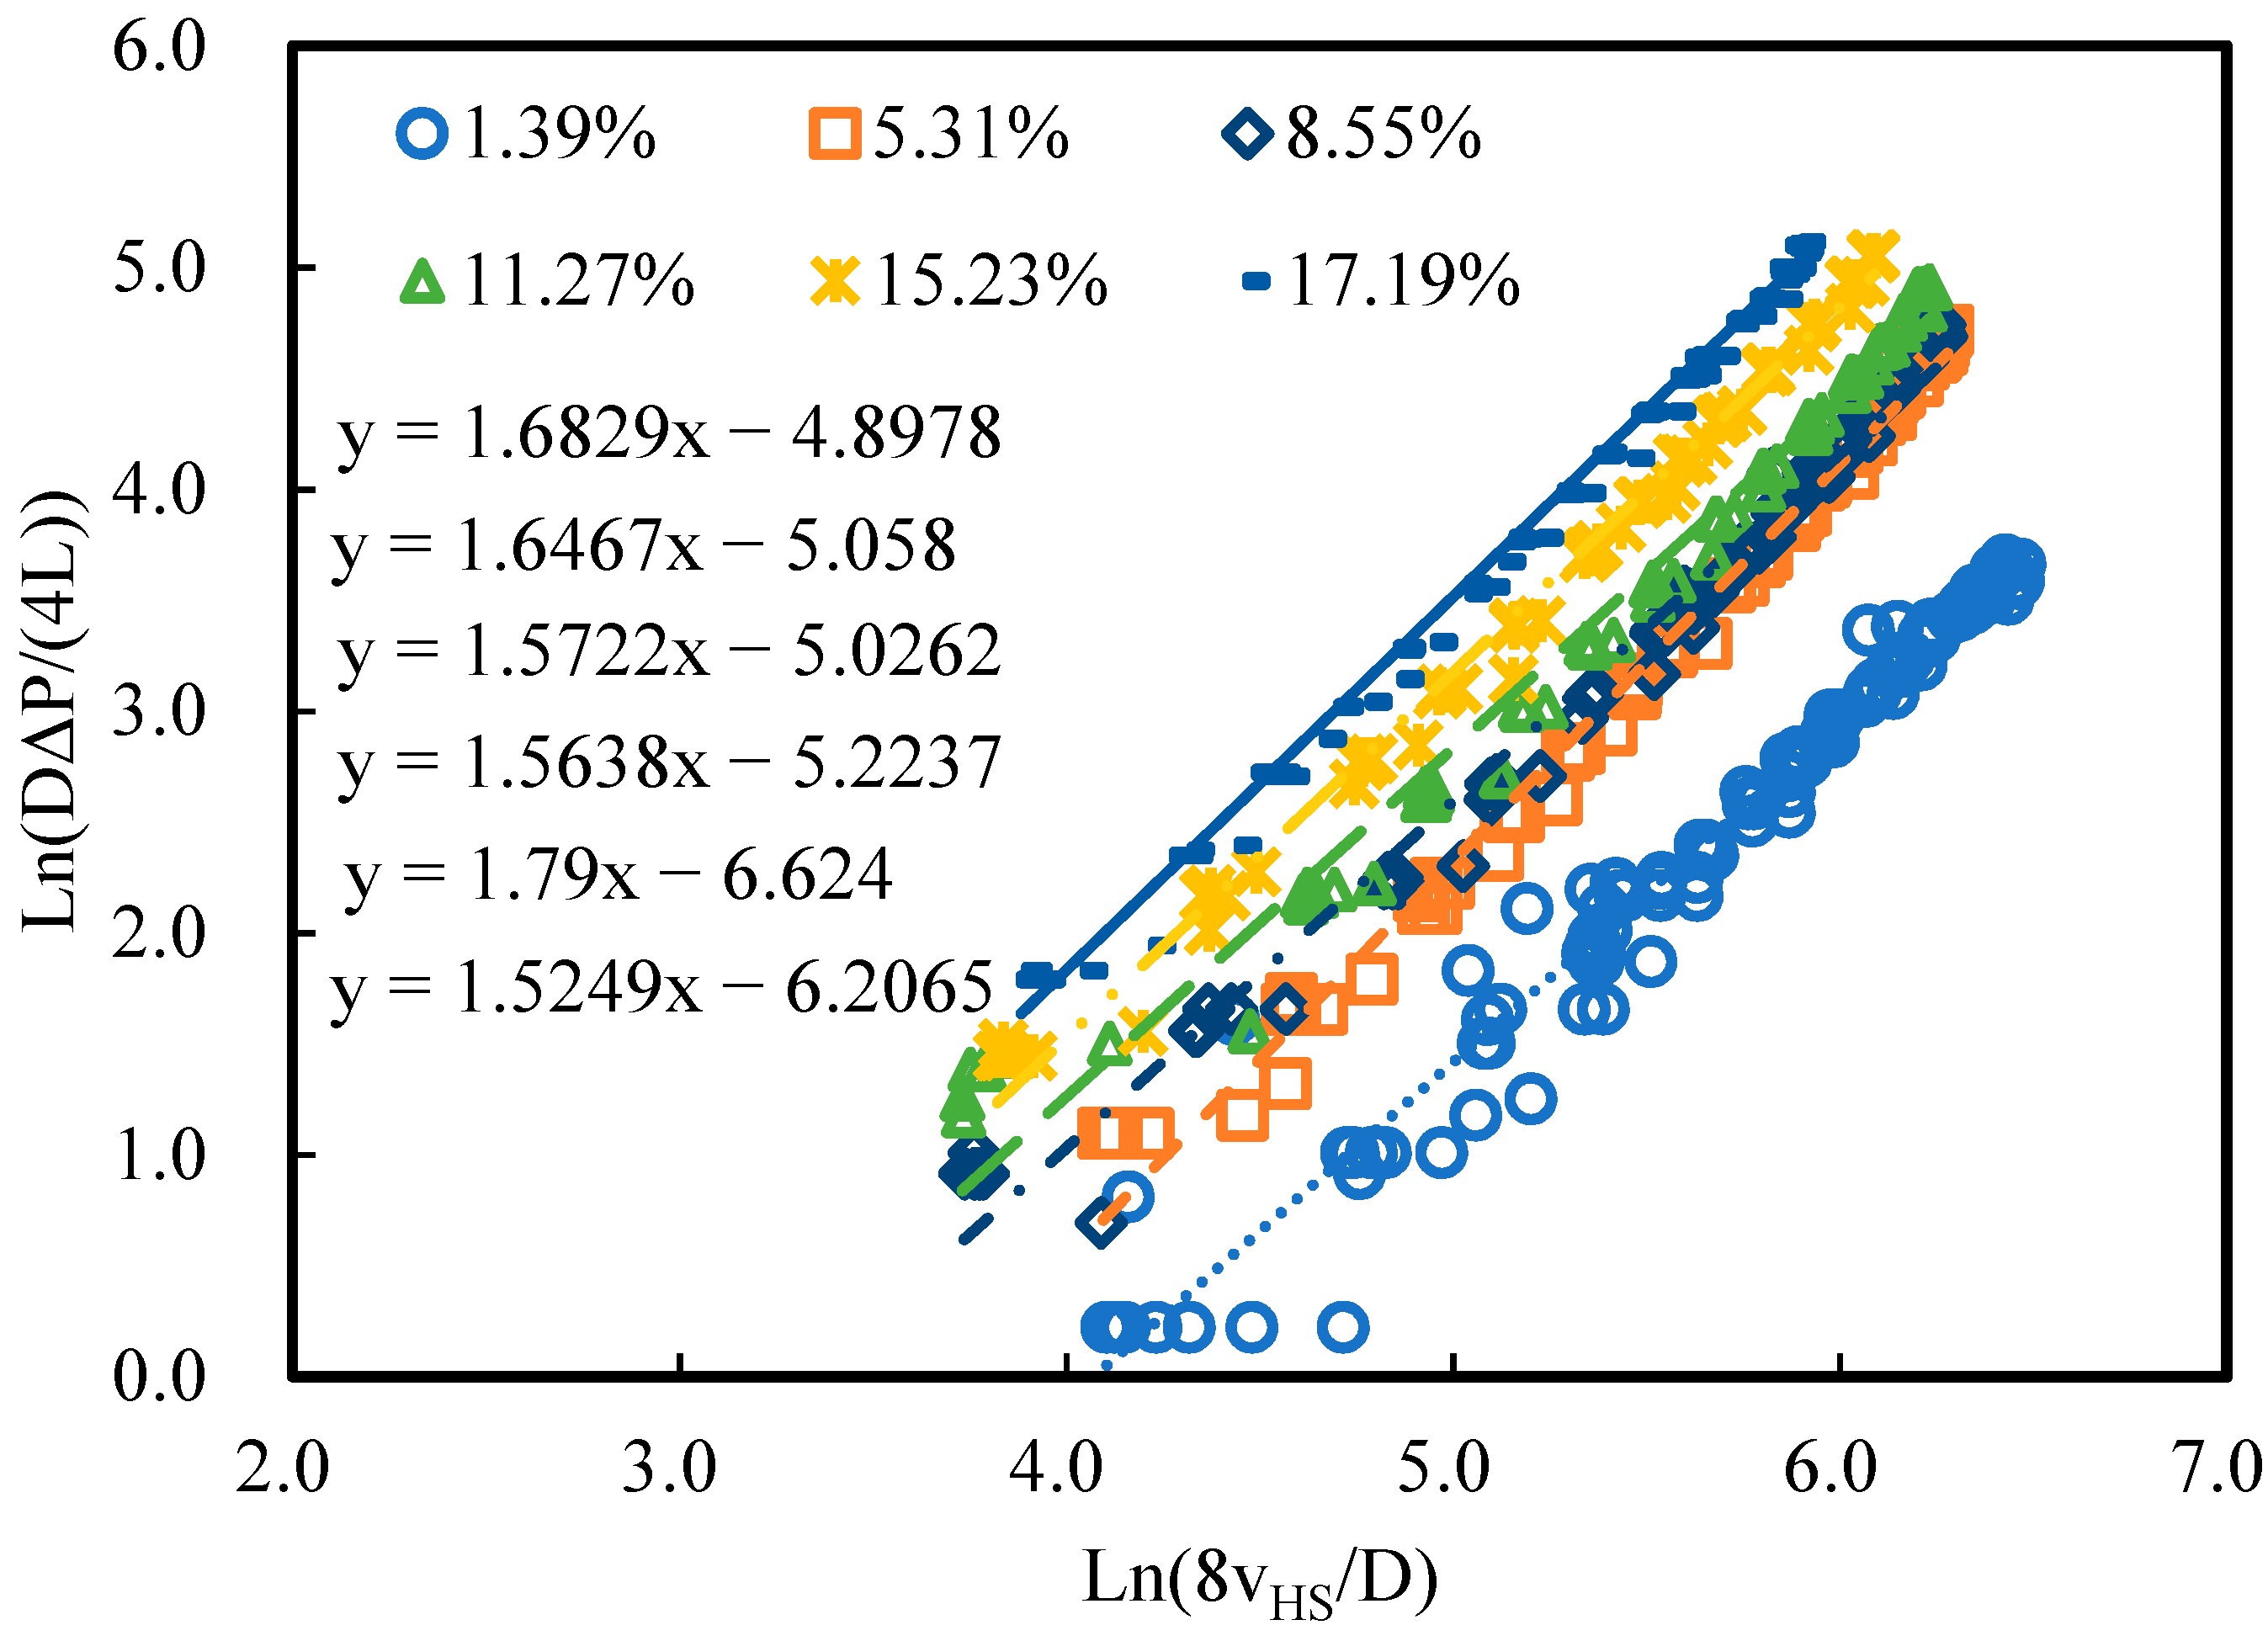
The
n index is obtained from the differential ratio of Ln(DΔP/(4L)) and Ln(8v
HS/D) which is the slope of the curve in Ln(DΔP/(4L)) verse Ln(8v
HS/D) as an expression of Equation (4). The pressure drop is directly measured in experiments and the flow velocity of the hydrate slurry is calculated based on the flow rate measured in experiments. As shown in
Figure 3, under each volumetric hydrate concentration condition, Ln(DΔP/(4L)) and Ln(8v
HS/D) have a linear relationship between them, indicating that they have an unique
n index under a certain hydrate concentration condition. When CO
2 hydrate starts to form in the flow and the volumetric hydrate concentration increases from 1.4 to 17.2 vol%, the
n index varies from 1.53 to 1.79. The
n index is always above 1, which indicates that the CO
2 hydrate slurry performs shear-thickening behavior.
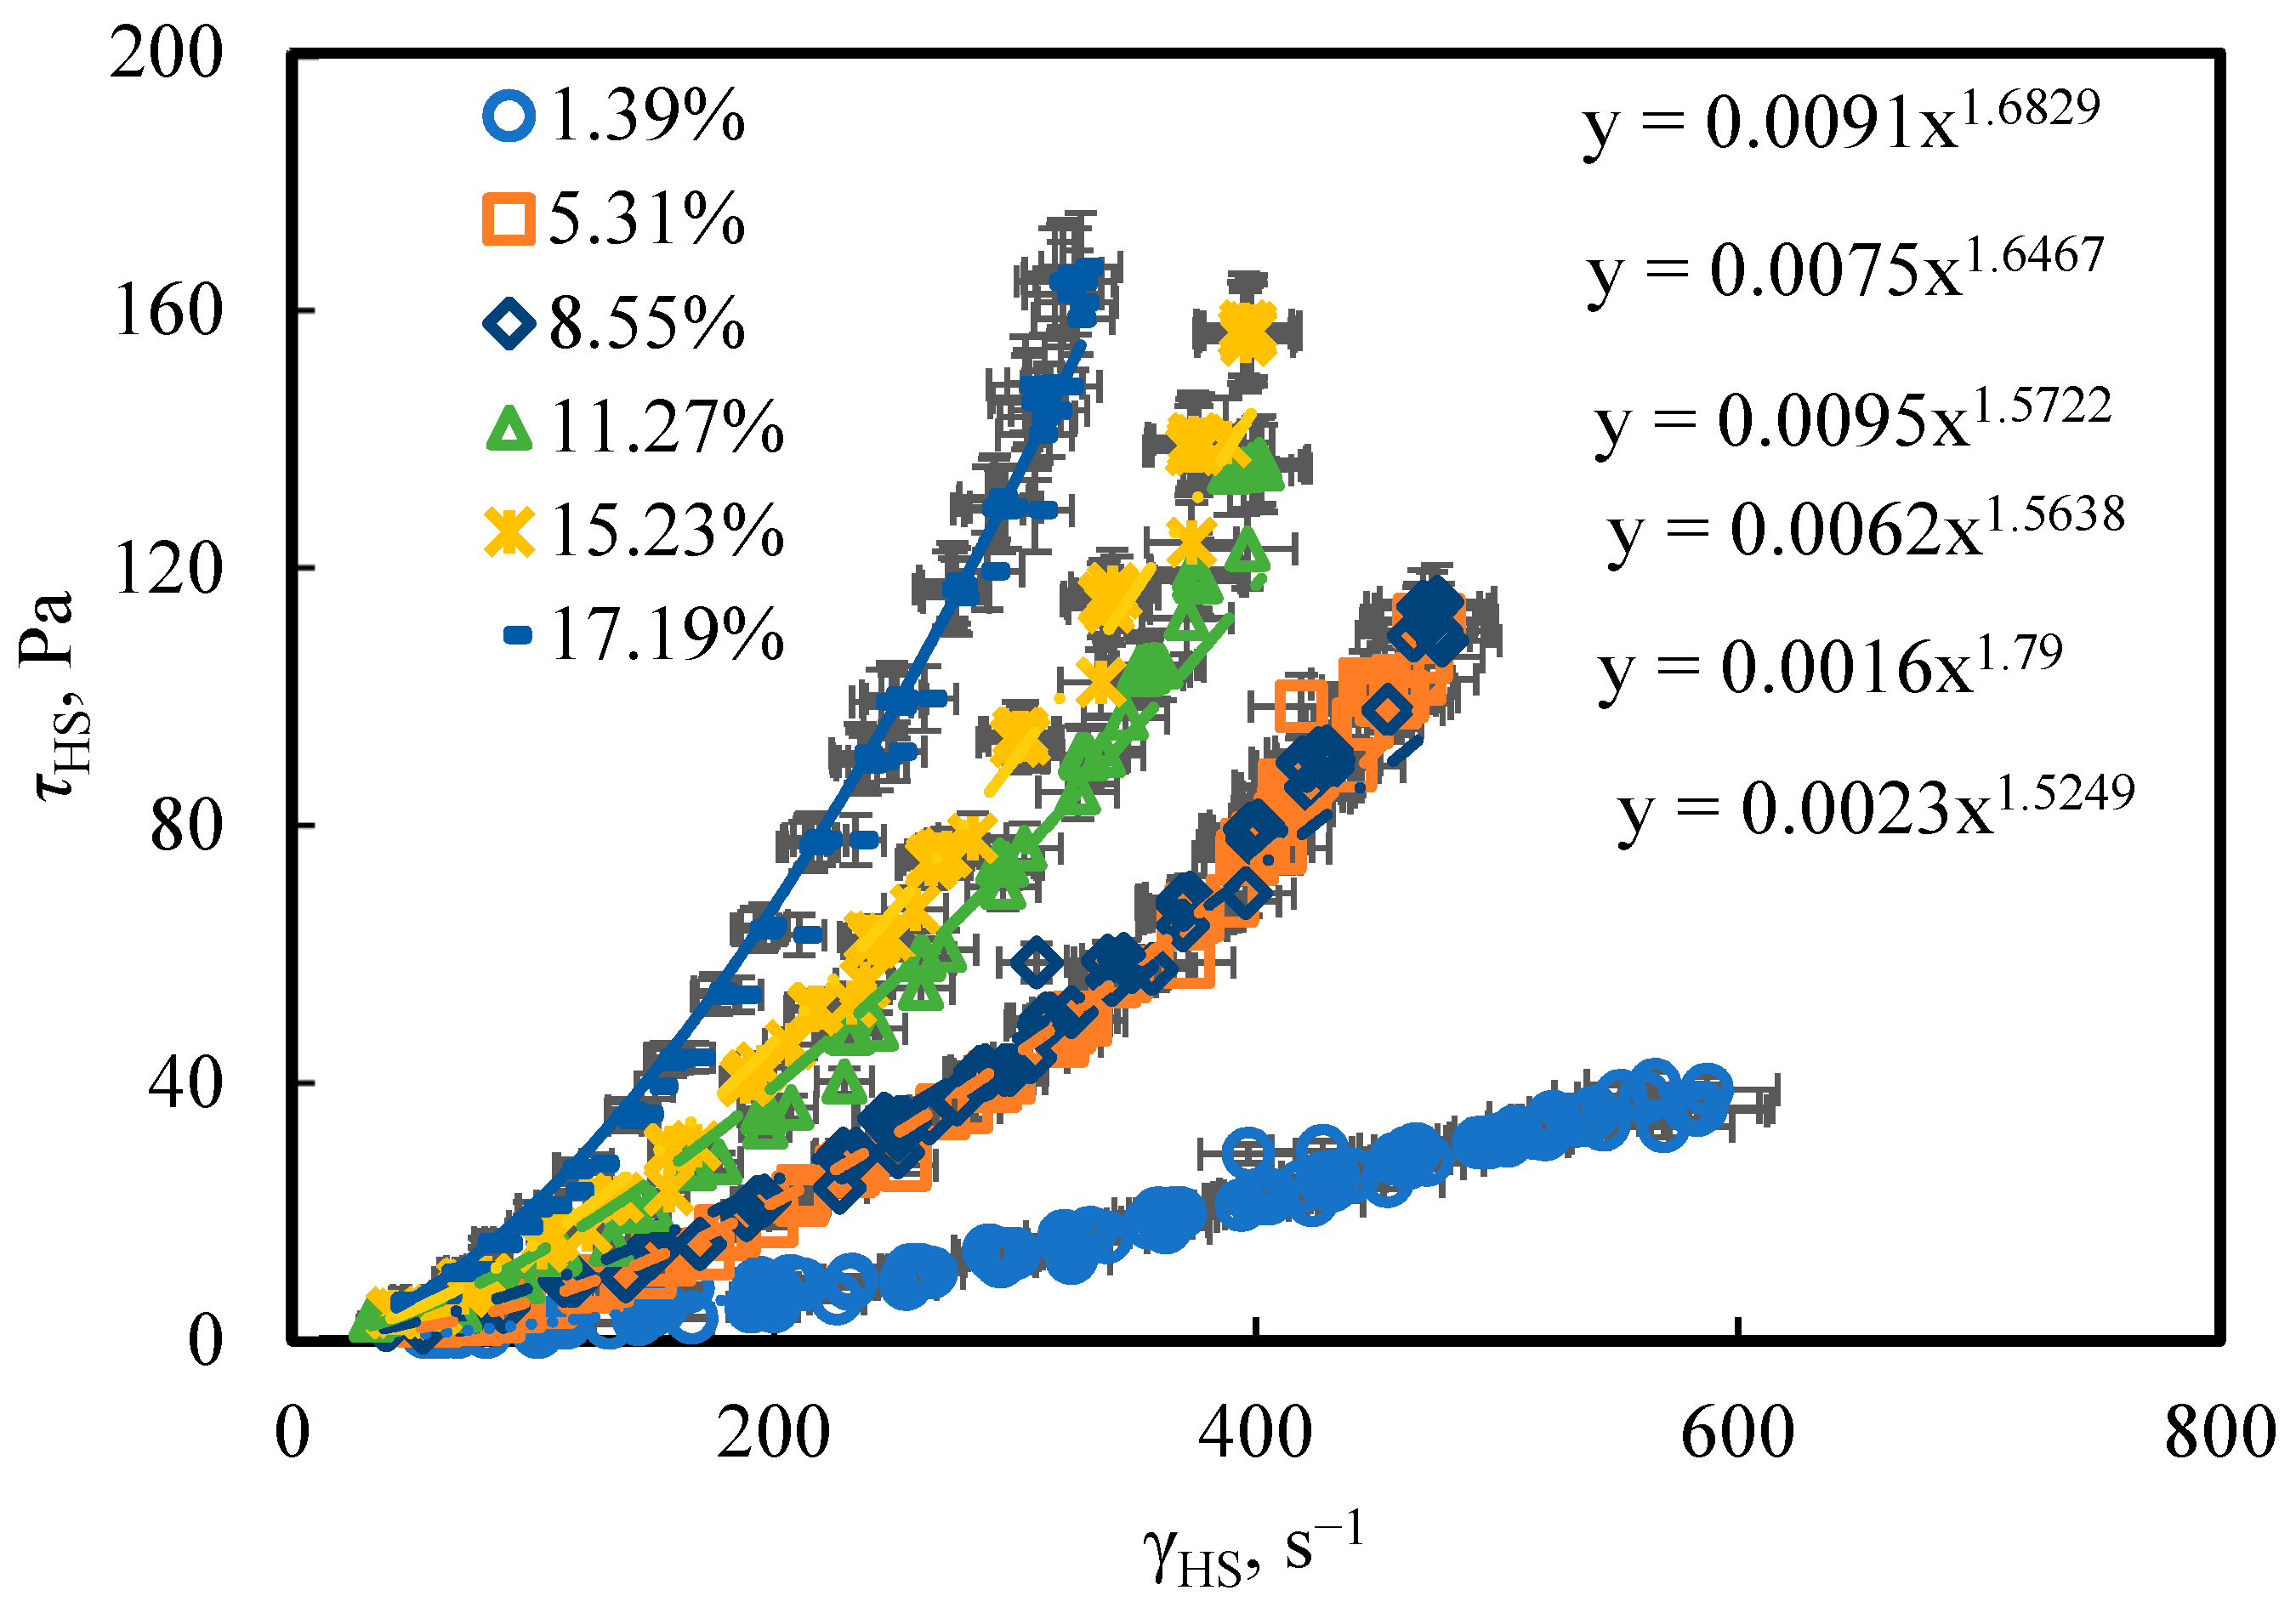
In
Figure 4, the relationship between shear stress and shear rate is exhibited. The shear stress increases exponentially while the shear rate increases, which identifies that the CO
2 hydrate slurry is a typical power-law model. Compared with Equation (3), the coefficient of the regression equation for shear stress and shear rate is the consistency factor of the CO
2 hydrate slurry. As the volumetric hydrate concentration ranges from 1.4 to 17.2 vol%, the K factor varies from 0.0016 to 0.0095. Moreover, the regression equation has no intercept with shear stress. The yield stress of the CO
2 hydrate slurry is zero, and Equation (5) is simplified as μ
app =
KγHSn−1.
Based on the simplified Equation (5),
Figure 5 is plotted to present the relationship between shear rate and the apparent viscosity of the CO
2 hydrate slurry. The apparent viscosity increases exponentially with the shear rate increasing, where the CO
2 hydrate slurry is demonstrated by shear-thickening behavior. As the volumetric hydrate concentration increases from 1.4 to 17.2 vol%, the ascending trend of the apparent viscosities along the shear rate become more obvious. Generally, the increase in the volumetric hydrate concentration enhances the non-Newtonian behavior of the CO
2 hydrate slurry. This result reaches an agreement with our previous works.
In this work, the formation of CO
2 hydrate in the flow loop induces a CO
2–water two-phase flow transits to become a CO
2–water–CO
2 hydrate three-phase flow. CO
2 hydrates result in the non-Newtonian behavior of the hydrate slurry and the increase in the apparent viscosity. The CO
2 hydrate slurry exhibits obvious shear-thickening behavior throughout both the low-shear-rate region and high-shear-rate region. This result shows an apparent difference to our previous work [
18,
19] and Delahaye et al.’s work [
1,
15]. In the previous work, the rheology of the hydrate slurry would transit between the shear-thinning behavior and the shear-thickening behavior according to the variations of the volumetric hydrate concentration or the shear rates [
15,
18]. Generally, the shear-thinning behavior of the hydrate slurry depends on the inner structure between hydrate particles. If hydrate particles have agglomerated structure between each other, the increase in flow velocity and shear rate can break up the agglomerate of hydrate particles and make the hydrate slurry flow more easily [
5,
8,
11]. Thus, the hydrate slurry would exhibit shear-thinning behavior. The shear-thickening behavior of the hydrate slurry depends on the friction and collision between hydrate particles [
31,
32]. If hydrate particles are suspended in the hydrate slurry as individual particles or small agglomerates, the flow of the hydrate slurry would induce frictions and collisions between hydrate particles and cause additional energy dissipations and pressure drops [
33,
34]. Thus, the higher flow velocity of the hydrate slurry causes the higher intensity of frictions and collisions between hydrate particles. The increase in flow velocity results in more increments of pressure drop, and the hydrate slurry starts to exhibit shear-thickening behavior. In this work, since the hydrate slurry is always under high circulation condition, the hydrate particles suspended in the flow loop are fully dispersed. Thus, the CO
2 hydrate slurry in the current experiment performs shear-thickening behavior.
The effect of volumetric hydrate concentration and shear rate on the apparent viscosity of the CO
2 hydrate slurry is revealed in
Figure 6. Because of the shear-thickening behavior of the hydrate slurry, the increase in shear rate results in the apparent viscosity increasing for all hydrate concentration conditions. Moreover, the ascent of volumetric hydrate concentration also induces the apparent increase in viscosity. The increase in volumetric hydrate concentration means the quantity of suspended hydrate particles in the hydrate slurry increases. The probability of frictions and collisions between hydrate particles is improved and the increment of pressure drops induced by the hydrate slurry flowing is enhanced. Thus, the increase in volumetric hydrate concentration drives the hydrate slurry performing more non-Newtonian.
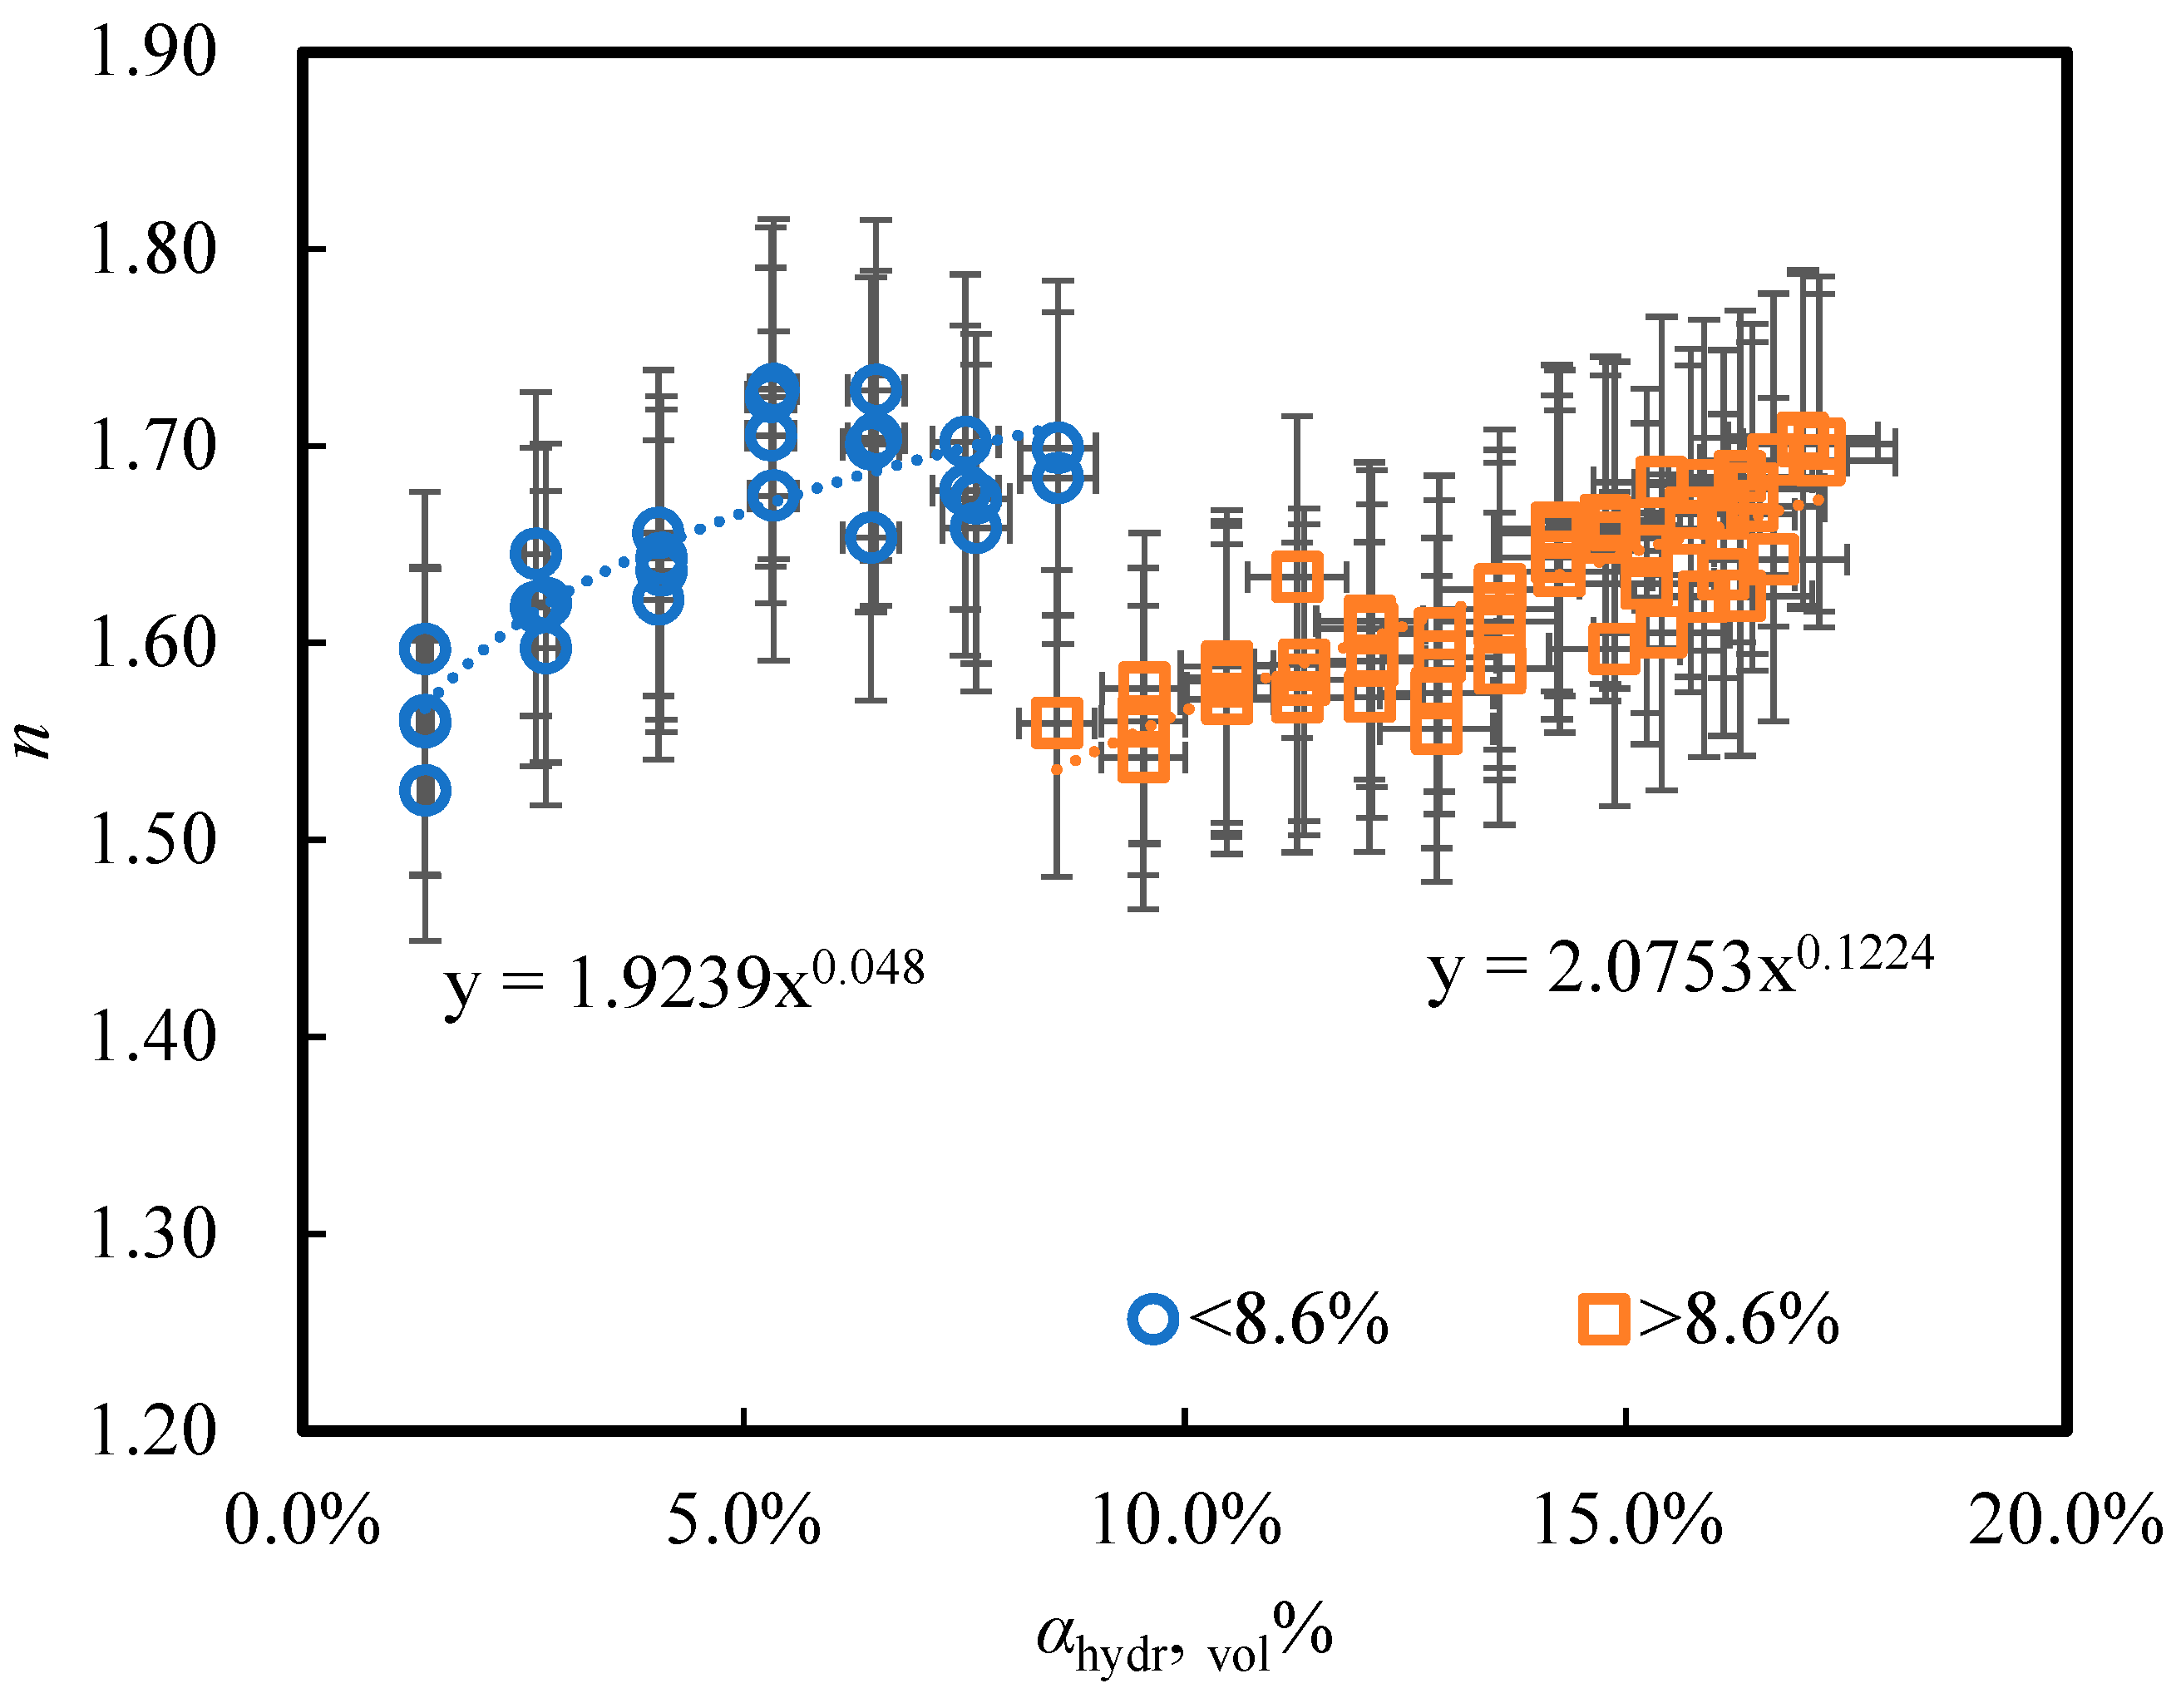
From Equation (4) and
Figure 3, the non-Newtonian fluid index (
n index) under varied volumetric hydrate concentration condition can be obtained.
Figure 7 exhibits variations of the n index of the CO
2 hydrate slurry along the volumetric hydrate concentration. The n index increases exponentially with the increase in volumetric hydrate concentration. Different from our previous work, the trend in the
n index is discontinuity along the volumetric hydrate concentration, increasing from 1.4 to 17.2 vol%. The regressed correlations of the
n index are given in Equation (6):
The discontinuity of the
n index of the CO
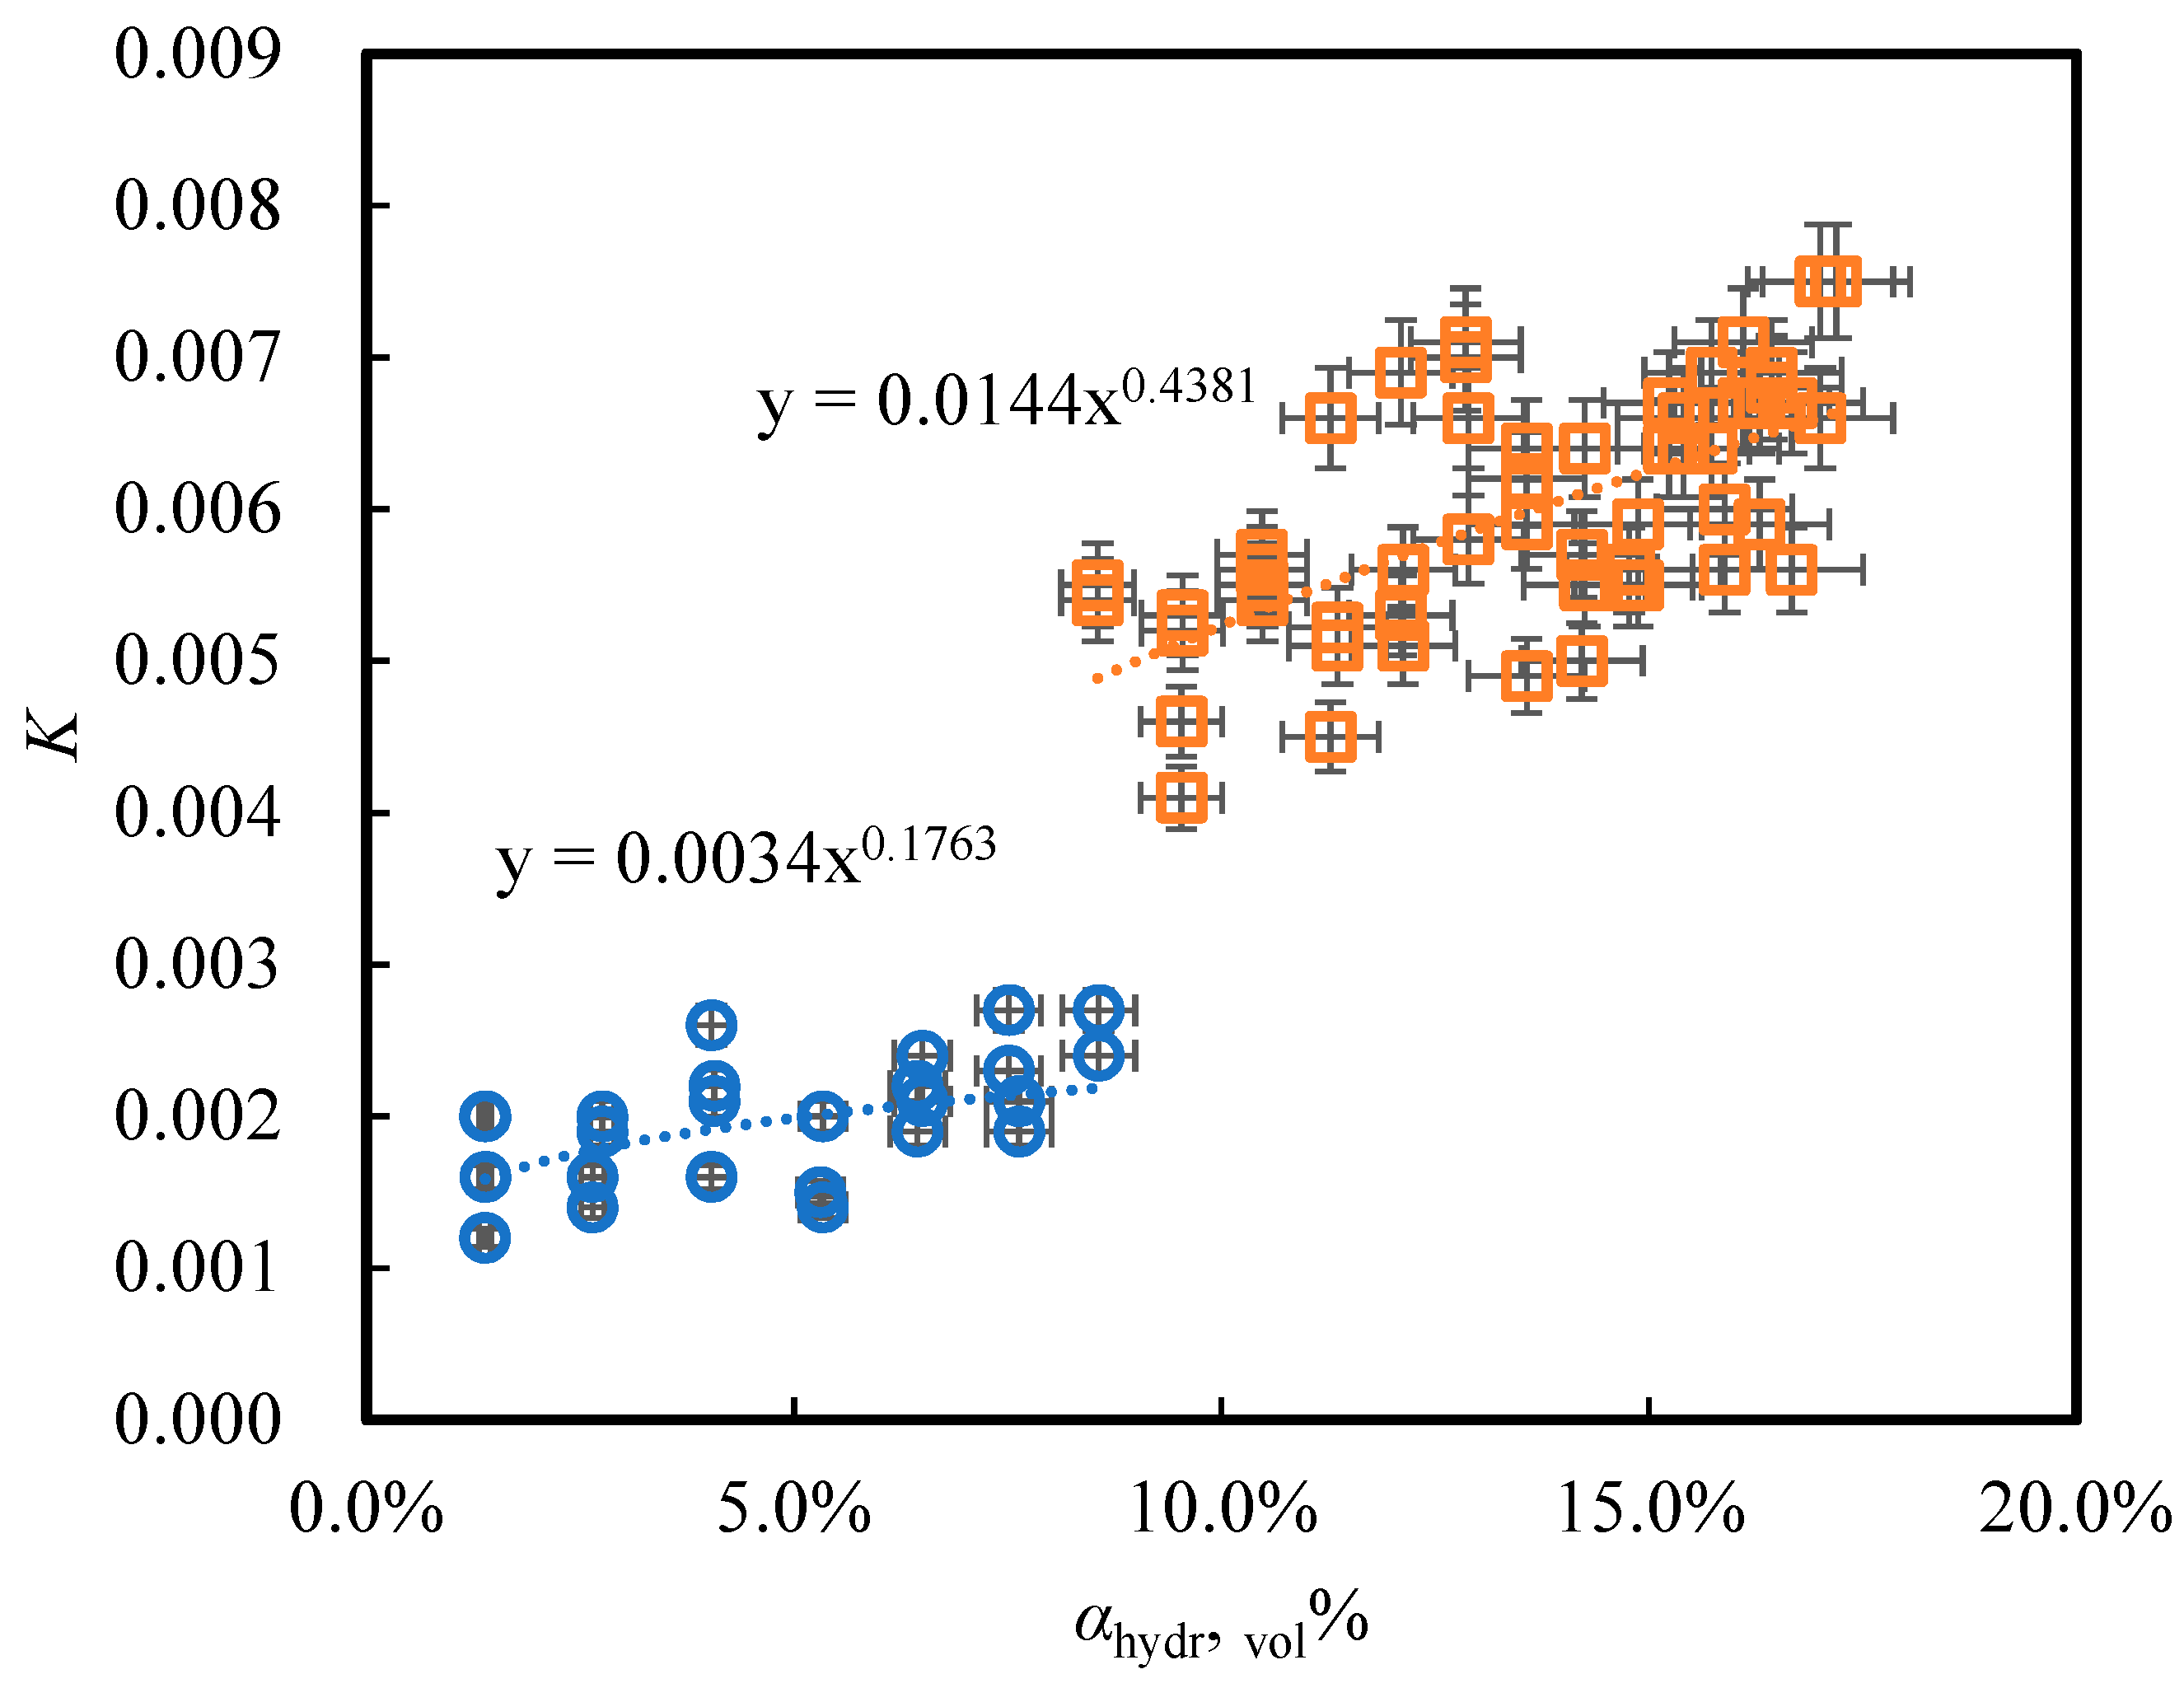
2 hydrate slurry indicates the change of rheological property of the hydrate slurry. The critical volumetric hydrate concentration is 8.6 vol% in
Figure 7. Although no solid evidence was found in the experiment to explain this discontinuity, the existing theory does. The main reason for this is that the CO
2 hydrate slurry is not fully converted to the non-Newtonian fluid when the volumetric hydrate concentration is less than 8.6 vol%. A similar conclusion is received in the CH
4 hydrate slurry [
18]. Under 8.6 vol%, the CO
2 hydrate slurry starts to exhibit non-Newtonian fluid behavior due to hydrate particles but is still not fully converted where the flow pattern is located in the transient zone. At this stage, the pressure drop of the hydrate slurry is mainly contributed by turbulent flow and its rheology. Above 8.6 vol%, the CO
2 hydrate slurry is fully converted to the non-Newtonian fluid, where flow pattern is a normally laminar flow. At this stage, the pressure drop of hydrate slurry is dominated by the rheology. However, in this work, once the hydrate forms in the flow loop, the CO
2 hydrate slurry is considered a non-Newtonian fluid, and the same assumption is made in previous work. This assumption takes an advantage for modeling the rheology of the hydrate slurry easily and has good accuracy within the experimental range. Local engineers can utilize this model easily and conveniently.
From Equation (3) and
Figure 4, the consistency factor (
K) factor under varied volumetric hydrate concentration condition can be plotted in
Figure 8. Based on the critical volumetric hydrate concentration, the correlations of the
K factor are also regressed differently as shown in
Figure 7. The
K factor increases exponentially as the volumetric hydrate concentration increases. Moreover, by substituting Equations (6) and (7) into simplified Equation (5), the expression of the apparent viscosity of the CO
2 hydrate slurry is obtained, as shown in Equation (8).


