Article

Normalized Stress–Strain Behavior of Deep-Sea Soft Soils in the Northern South China Sea

1
College of Engineering, Ocean University of China, Qingdao 266100, China
2
Shandong Provincial Key Laboratory of Ocean Engineering, Ocean University of China, Qingdao 266100, China
3
College of Environmental Science and Engineering, Ocean University of China, Qingdao 266100, China
4
Shandong Provincial Key Laboratory of Marine Environment and Geological Engineering, Ocean University of China, Qingdao 266100, China
*
Authors to whom correspondence should be addressed.
J. Mar. Sci. Eng. 2022, 10(8), 1142; https://doi.org/10.3390/jmse10081142
Submission received: 7 July 2022 / Revised: 7 August 2022 / Accepted: 11 August 2022 / Published: 18 August 2022
(This article belongs to the Special Issue Advances in Marine Engineering: Geological Environment and Hazards)

Abstract

:
The study of the physical and mechanical properties of marine soil is of great importance for marine geohazard prediction, submarine energy extraction, and submarine foundation design. In this study, a series of basic geotechnical tests and triaxial compression tests are performed on samples taken from the Shenhu sea area in the South China Sea (SCS). Physical and mechanical properties, particularly normalized stress–strain behavior, are investigated. The microstructural and mineralogical characterization is carried out, through scanning electron microscopy (SEM), and X-ray diffraction (XRD). The results indicated that the sample could be classified as high-plasticity silt (MH) with high water content and high compressibility, that the soil has the highest quartz content in its mineral composition, a loose skeleton composed of flocculent structures under the microscope and is distributed with the remains of marine organisms. Furthermore, a new stress–strain-normalized condition is theoretically derived, based on the hyperbola function. In this condition, the concept of standard normalized factor, which is defined as the ultimate value of principal stress difference, is introduced. Meanwhile, the normalized stress–strain relationship of soft soil from the SCS is established under consolidated undrained conditions and the results of the model are compared with the experimental results, with a good normalization effect. It is believed that the work presented in this paper could contribute to the design and construction of offshore engineering.

1. Introduction

Offshore developments for hydrocarbon resources and offshore engineering construction have now developed for use in deep-water areas [1,2]. The geotechnical properties of seabed sediments play a crucial role in the safety and stability of deep-water foundations [3]. The deep-sea sediments, which usually consist of normal consolidated (NC) or lightly over-consolidated (OC) clay [4], are generally characterized by their poor mechanical properties [5,6,7,8]. Meanwhile, due to the complex and changeable marine environment, the mechanical properties of seabed sediments are prone to change under the coupling of complex loads such as wind, waves, currents, and hydrate decomposition, resulting in engineering geological disasters such as submarine instability and submarine landslides, which pose serious threats to marine infrastructure and engineering construction [9,10,11].
However, due to the difficulty of obtaining deep-sea soils, and the specific nature of marine and terrestrial sediments, the presence of natural gas hydrates usually directly or indirectly affects the physical and mechanical properties of the soil. Many scholars have summarized the different characteristics of natural gas hydrates, as well as their formation and decomposition principles [12], and suggested possible effects of hydrate saturation and pore-scale distribution in sediments on the mechanical properties of sediments [13,14]. Therefore, the study of physical and mechanical properties, as well as the mineral composition of deep-sea soils, is crucial. The basic physical properties of deep-sea soils can be determined by geotechnical tests [15,16,17,18]. To better understand the engineering properties of deep-sea soils, many scholars have researched this topic. Through geotechnical property tests on marine soils in the South China Sea, the mechanical properties of submarine soils on the continental slope of the South China Sea were revealed from macroscopic and microscopic perspectives; based on triaxial compression tests, the stress–strain characteristics between in situ soils and remodeled soils were analyzed, and six structural types of submarine sediments on the continental shelf in the northern part of the South China Sea were described [19,20,21]. Meanwhile, the effect of temperature on the mechanical properties of deep-sea soils can be studied by considering triaxial compression tests at different temperatures [22,23,24]. The microstructure and undrained shear strengths of deep-sea sediments were analyzed based on critical state lines and different stress paths of isotropy that remodeled deep-sea soils [25,26]. In addition, Silva et al. conducted a comparative study of deep-sea fine-grained sediments and terrestrial clays, considering consolidation undrained triaxial tests under isotropically (CIU) and anisotropically (CAU) conditions, and pointed out that the difference in mineral composition of the soil also affects the mechanical parameters of the material, and the sufficient attention should be paid to the creep properties of clay in deep-sea engineering [27,28]. The deformation and strength properties of soils can be expressed by stress–strain relationships from triaxial tests, while the engineering mechanical properties of soils are complex due to the influence of boundary conditions such as confining pressure and stress paths [29,30,31]. To express the stress–strain relationship of soft soils in a unified equation, it is crucial to normalize the stress–strain relationship of soft soils. Several scholars have also proposed normalization factors [32,33]. However, due to the harsh normalization conditions of the existing normalization factors, the soft soils in many regions cannot be satisfied, and if the existing normalization factors are used to normalize the stress–strain relationship of soft soils that do not meet these harsh normalization conditions, satisfactory normalization will not be achieved [34,35,36]. The quality of the normalization factor selection will directly affect the degree of normalization of the stress–strain relationship of soft soil.
In this study, a series of basic geotechnical tests and triaxial compression tests were carried out on deep-sea soft soil taken from the SCS to investigate its physical and mechanical properties. The microstructure and mineral composition of the soil samples are analyzed using SEM and XRD tests. Furthermore, based on the hyperbolic equation of the stress–strain relationship proposed by Konder, the normalization factors and normalization conditions for normalizing the stress–strain relationship in soft soil are discussed, and the normalization factors proposed in this study are applied to the consolidation-undrained test of soft soil in the SCS. Based on this analysis, normalized models are established to predict the stress–strain relationship.

2. Materials and Methods
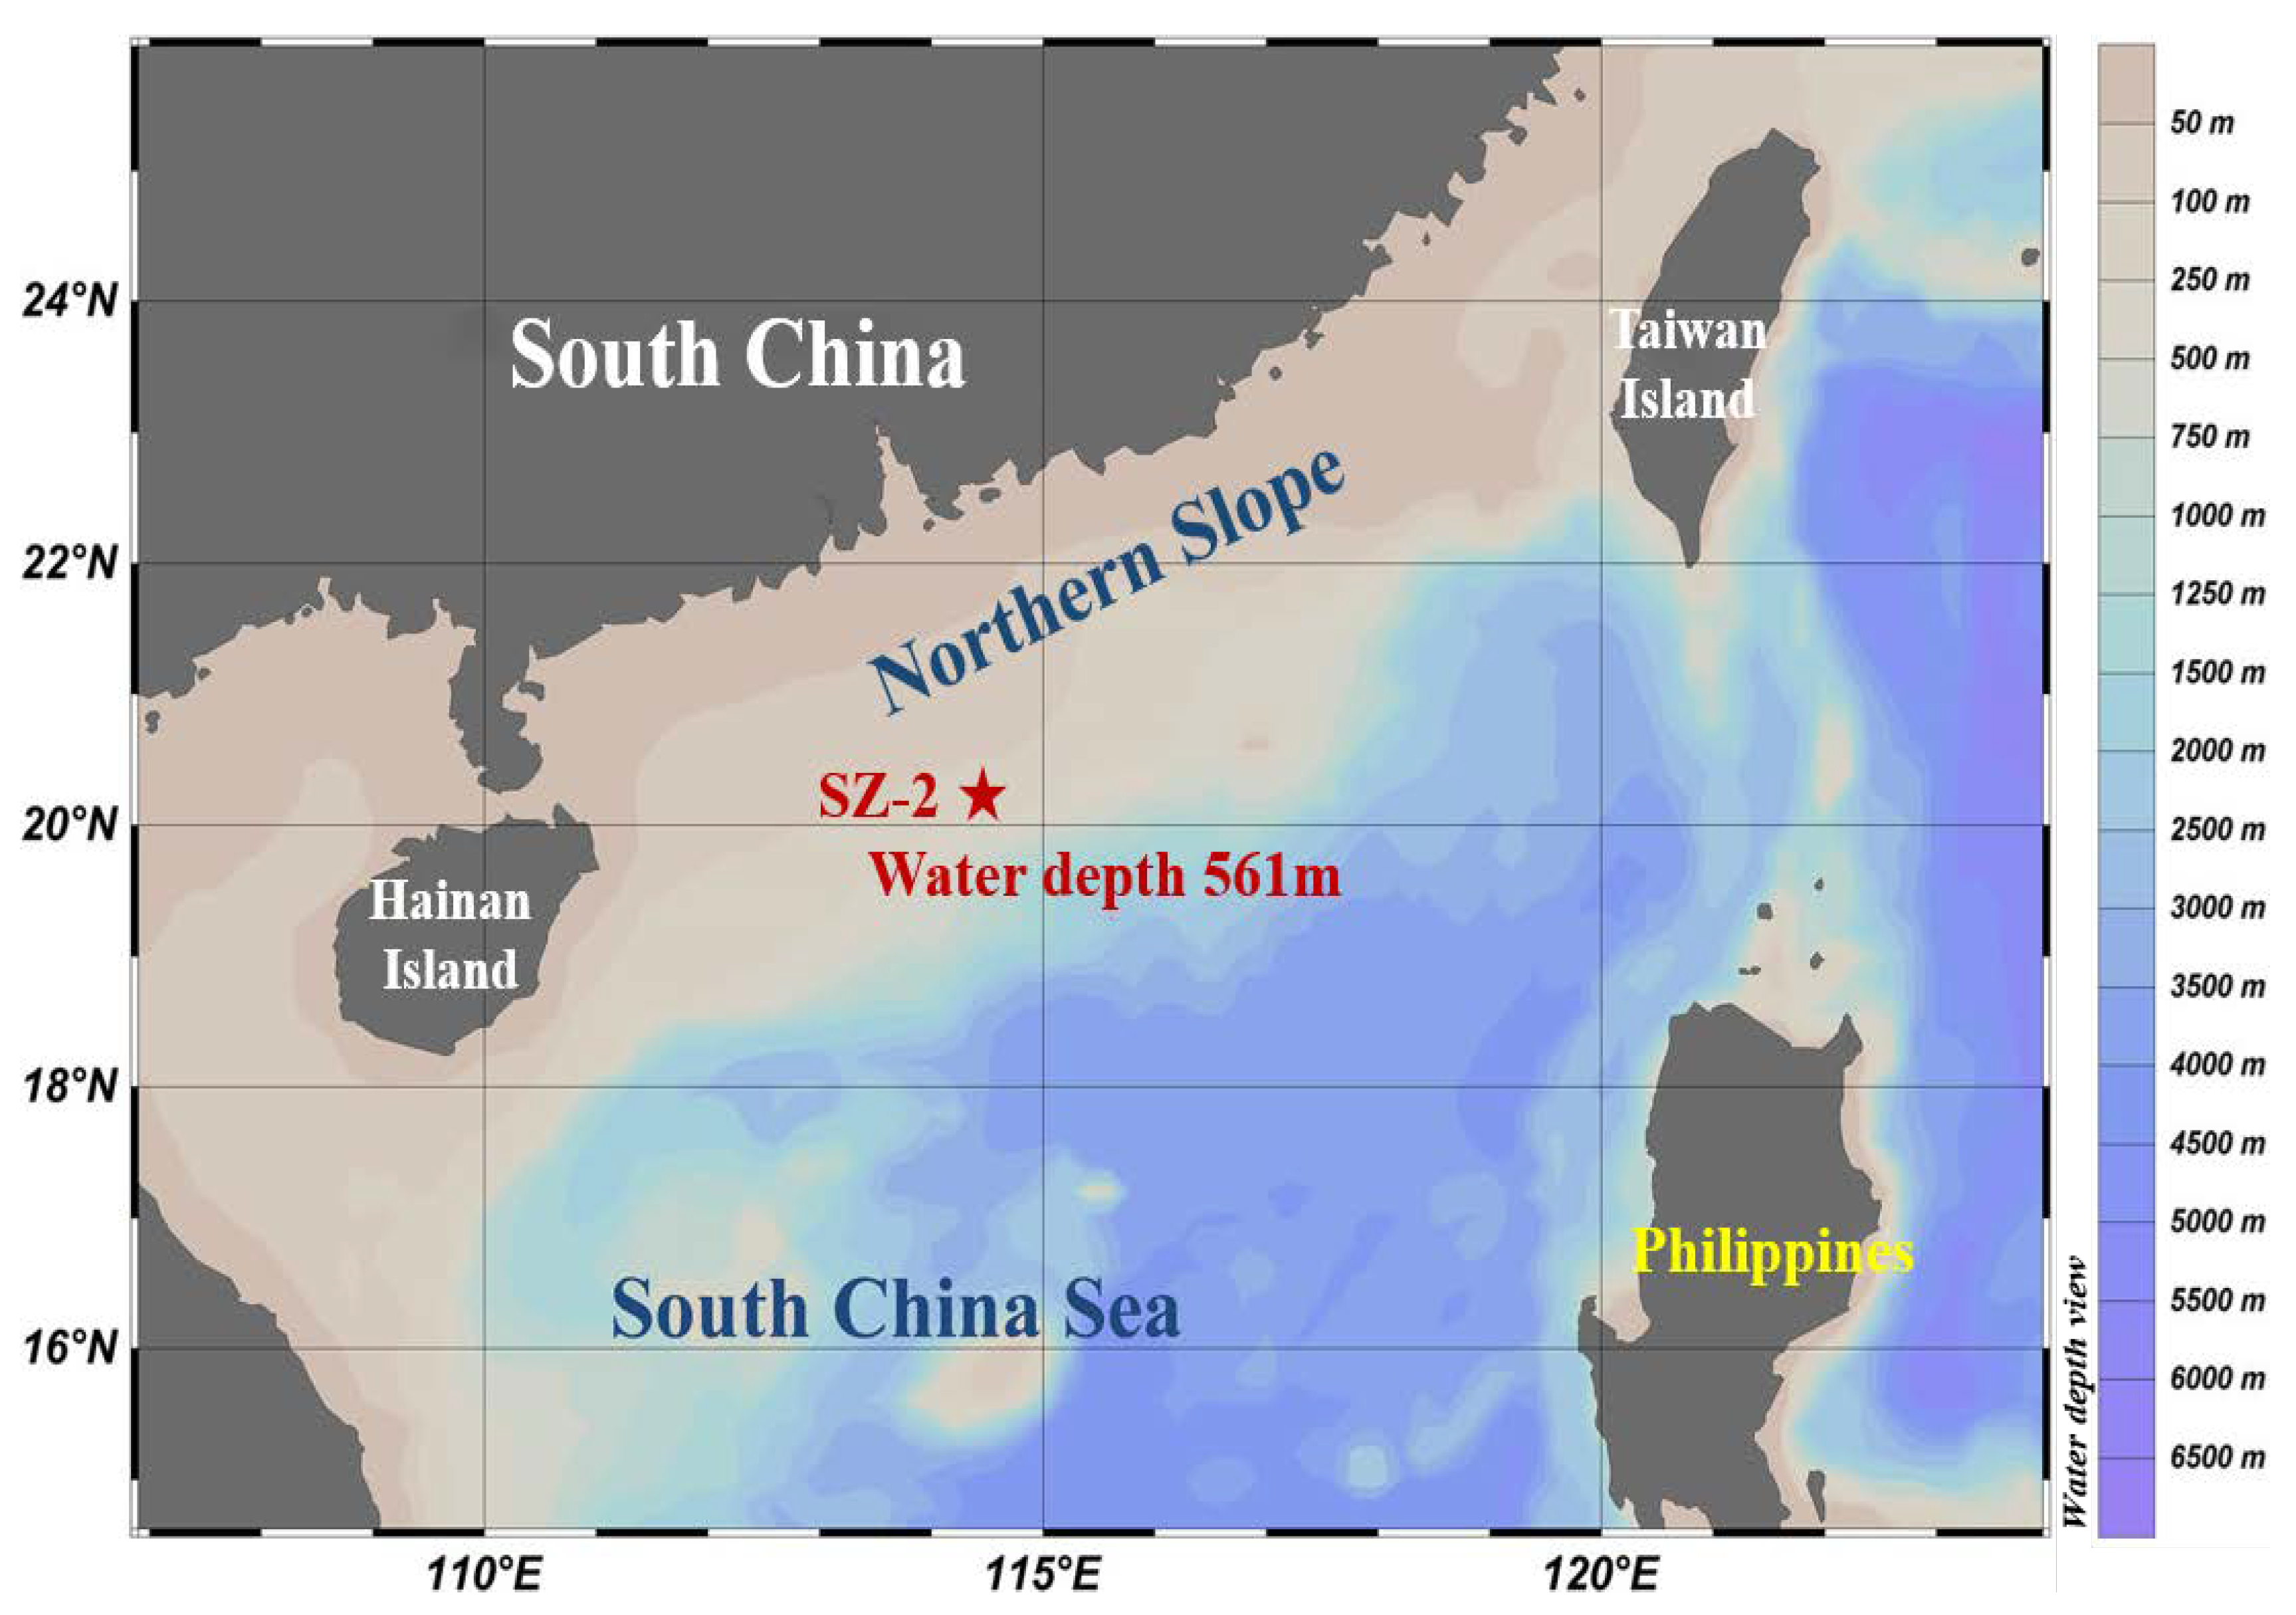
2.1. Soil Samples

In this study, soil samples were taken from the Shenhu sea area in the north of the SCS based on the 2020 shared voyage of the SCS scientific research, as shown in Figure 1. Using a gravity sampler, the longitude and latitude of the sampling point were found to be 114.57 degrees east longitude and 20.27 degrees north latitude, the water depth of the sampling site was 561 m, and the sampling depth of the soil sampling was 4.85 m.

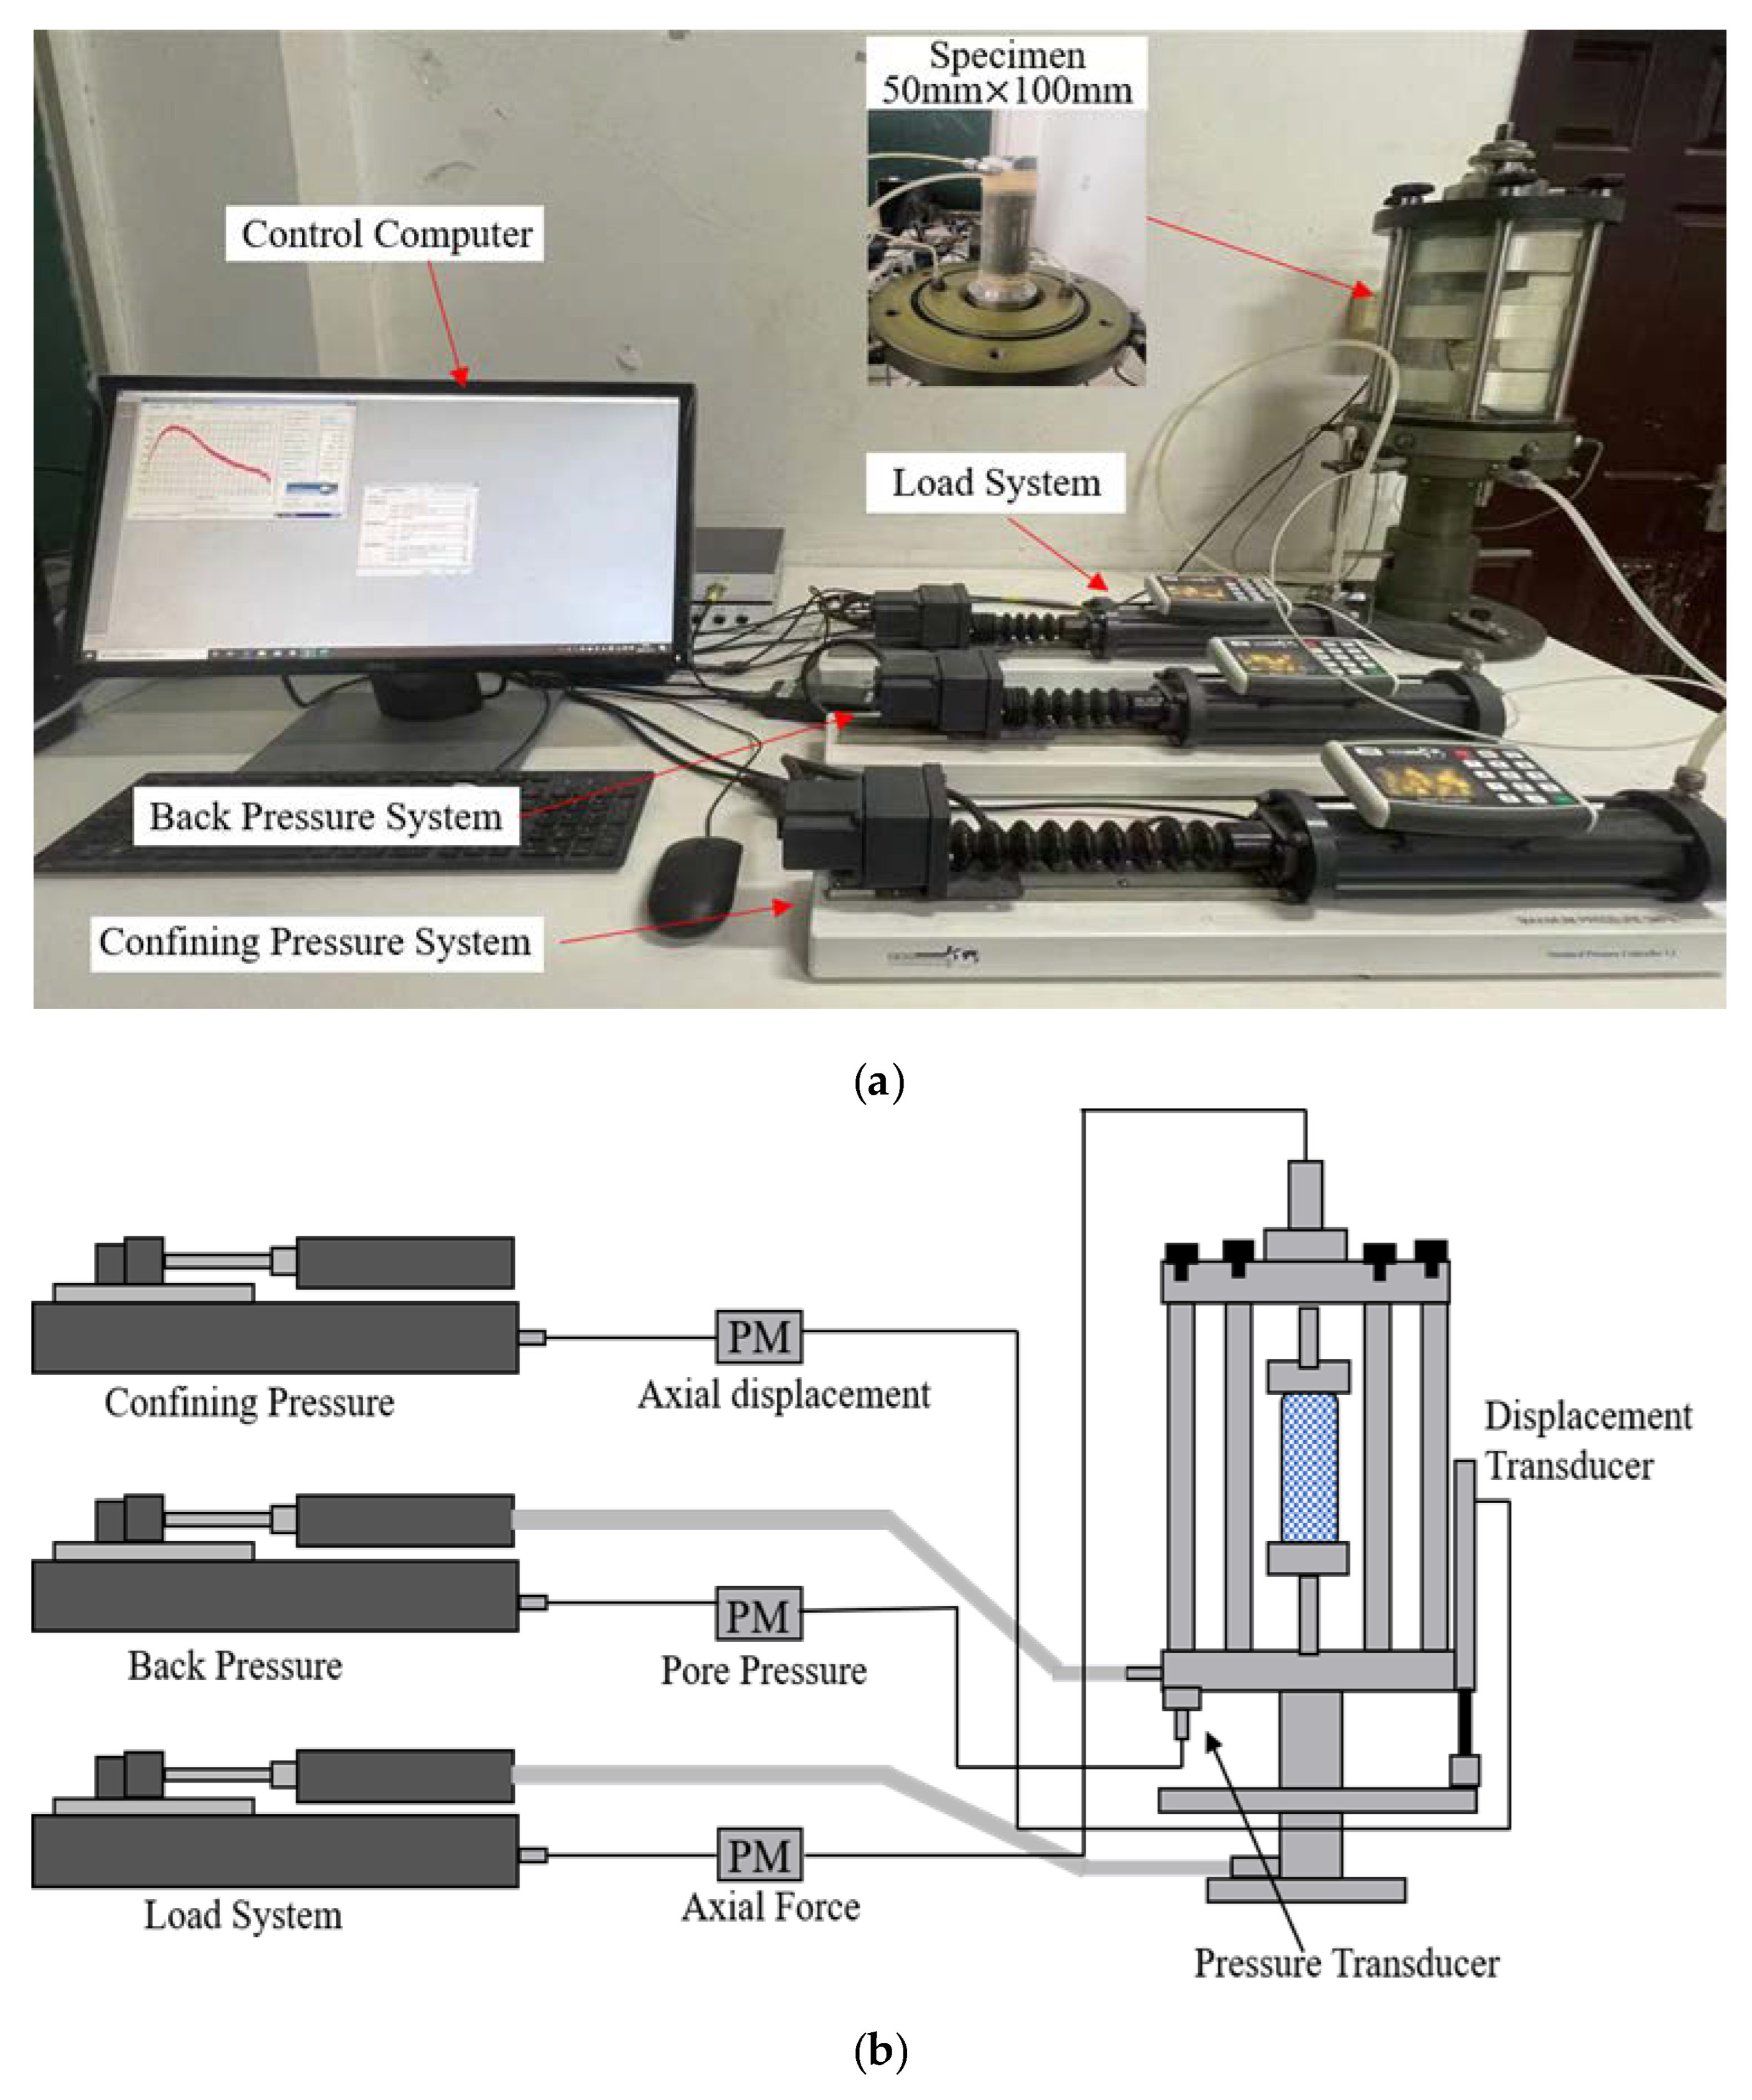
2.2. Testing Methods

The basic geotechnical test was carried out by taking the surface column sample (30 cm) of the in situ specimen according to the standard of ASTM D421-85 (2007) [37]; sediment samples were taken from the PVC tube, the grain size distribution of soil samples was determined by the densitometry method, the water content was measured by the drying method, and the liquid limit and plasticity were measured by the GYS-2 digital soil liquid–plastic limit analyzer. All methods were subjected to three parallel tests, and the basic mechanical property parameters of the soil were obtained.
X-ray diffraction (XRD) tests were conducted to determine the mineral composition of the soil samples. These tests were conducted with a Shimadzu XD-D1 X-ray diffractometer. “MDI jade 9.0” software was used to carry out the qualitative analysis. X-ray diffraction patterns were obtained using a continuous-scanning-mode X-ray tube with a scanning range from 2° to 32° (2θ) and a scanning rate of 4° per minute. The diffraction data on crystal plane spacing and diffraction intensity were obtained through sorting and compared with the diffraction data of standard minerals for mineral identification.
Scanning Electron Microscopy (SEM) analyses of in situ soils were performed in an S-4800 Cold Field Emission SEM produced by Hitachi. First, the in situ samples were processed by the vacuum freeze-drying method, and then they were sputtered with a layer of carbon and one or more layers of gold. For each specimen, a set of images were taken at a range of magnifications to provide contact patterns between soil particles and to understand the microscopic properties of the soil sample.
Additionally, consolidated undrained triaxial shear tests were performed to investigate the geotechnical behavior of deep-sea soft clay, the GDS Triaxial testing system (as shown in Figure 2) was used in the tests. In situ samples were taken in the laboratory and solid cylindrical triaxial samples of diameter ∅ = 50 mm and height h = 100 mm were cut with soil cutters and wire saws. Before the test, the samples were vacuum pumped and saturated by the vacuum pump. In this test, the specimens were first saturated by the backpressure saturation method, and a strain-controlled method was conducted with a 0.14 mm/min axial shear rate; three triaxial samples were taken and consolidated under the confining pressure of 100 kPa, 200 kPa, and 300 kPa, and then the consolidated undrained (CU) shear test was performed, and, finally, the test was terminated when the axial strain reached 20%.

3. Results and Discussion

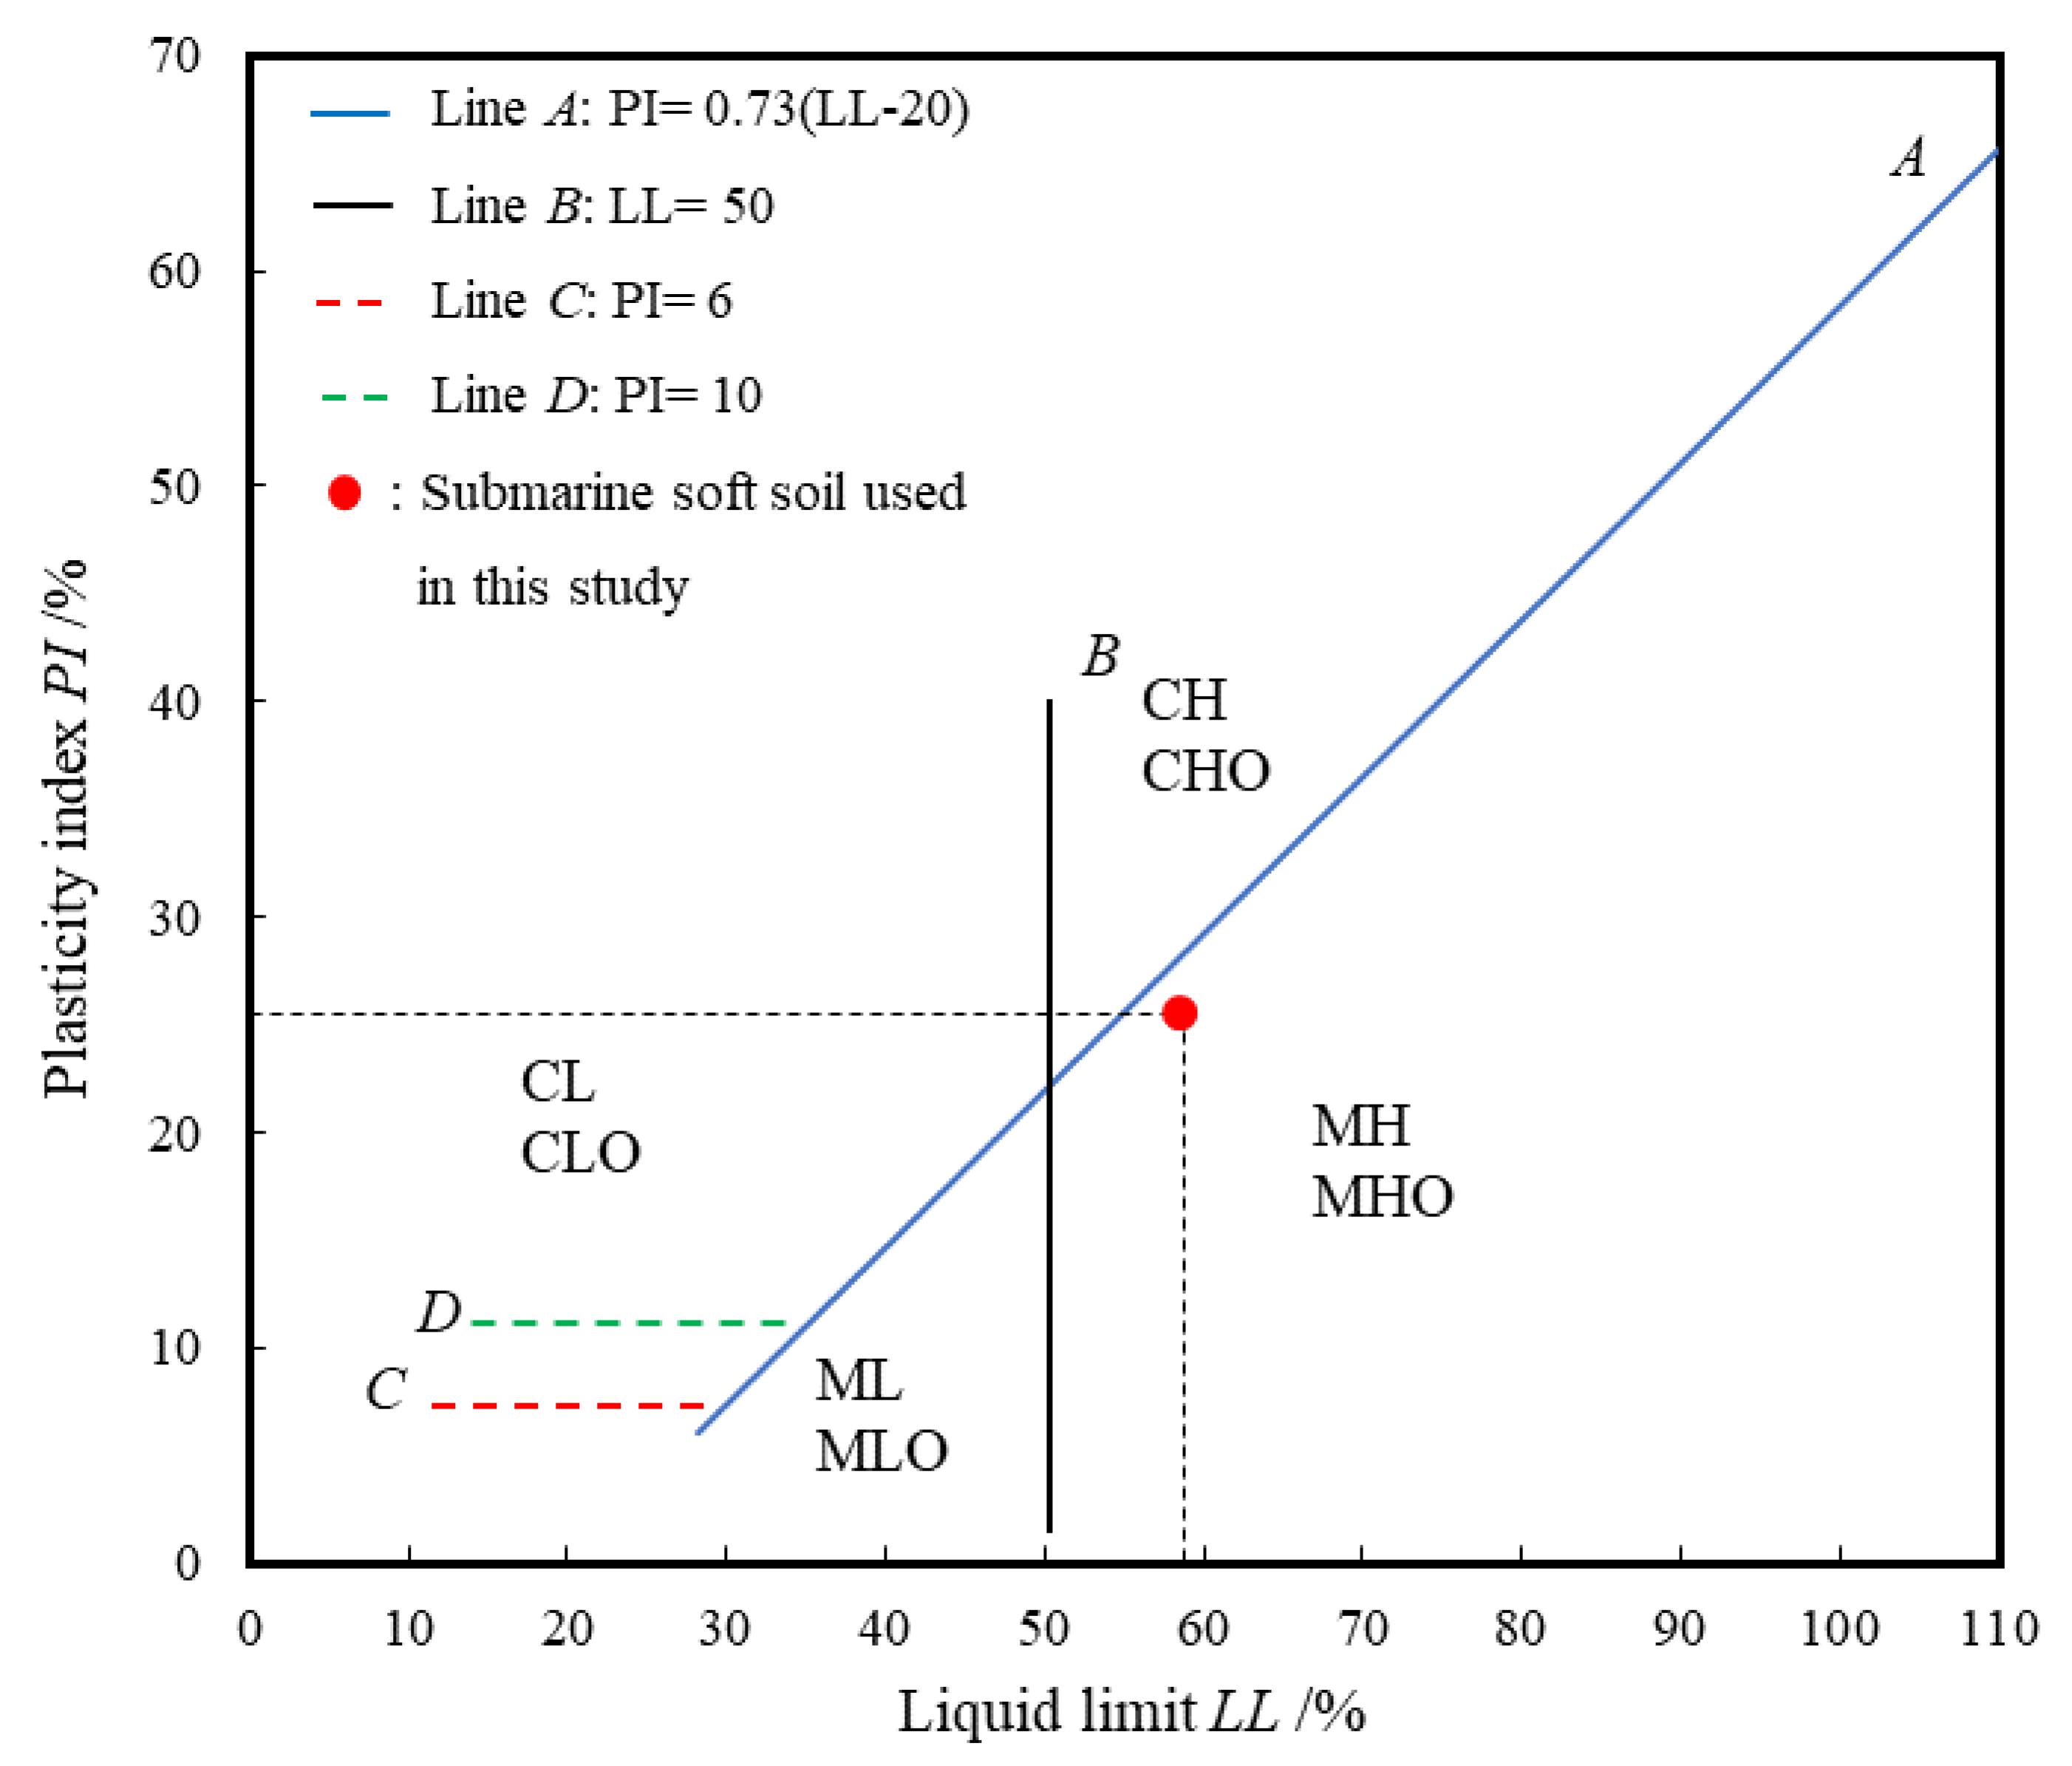
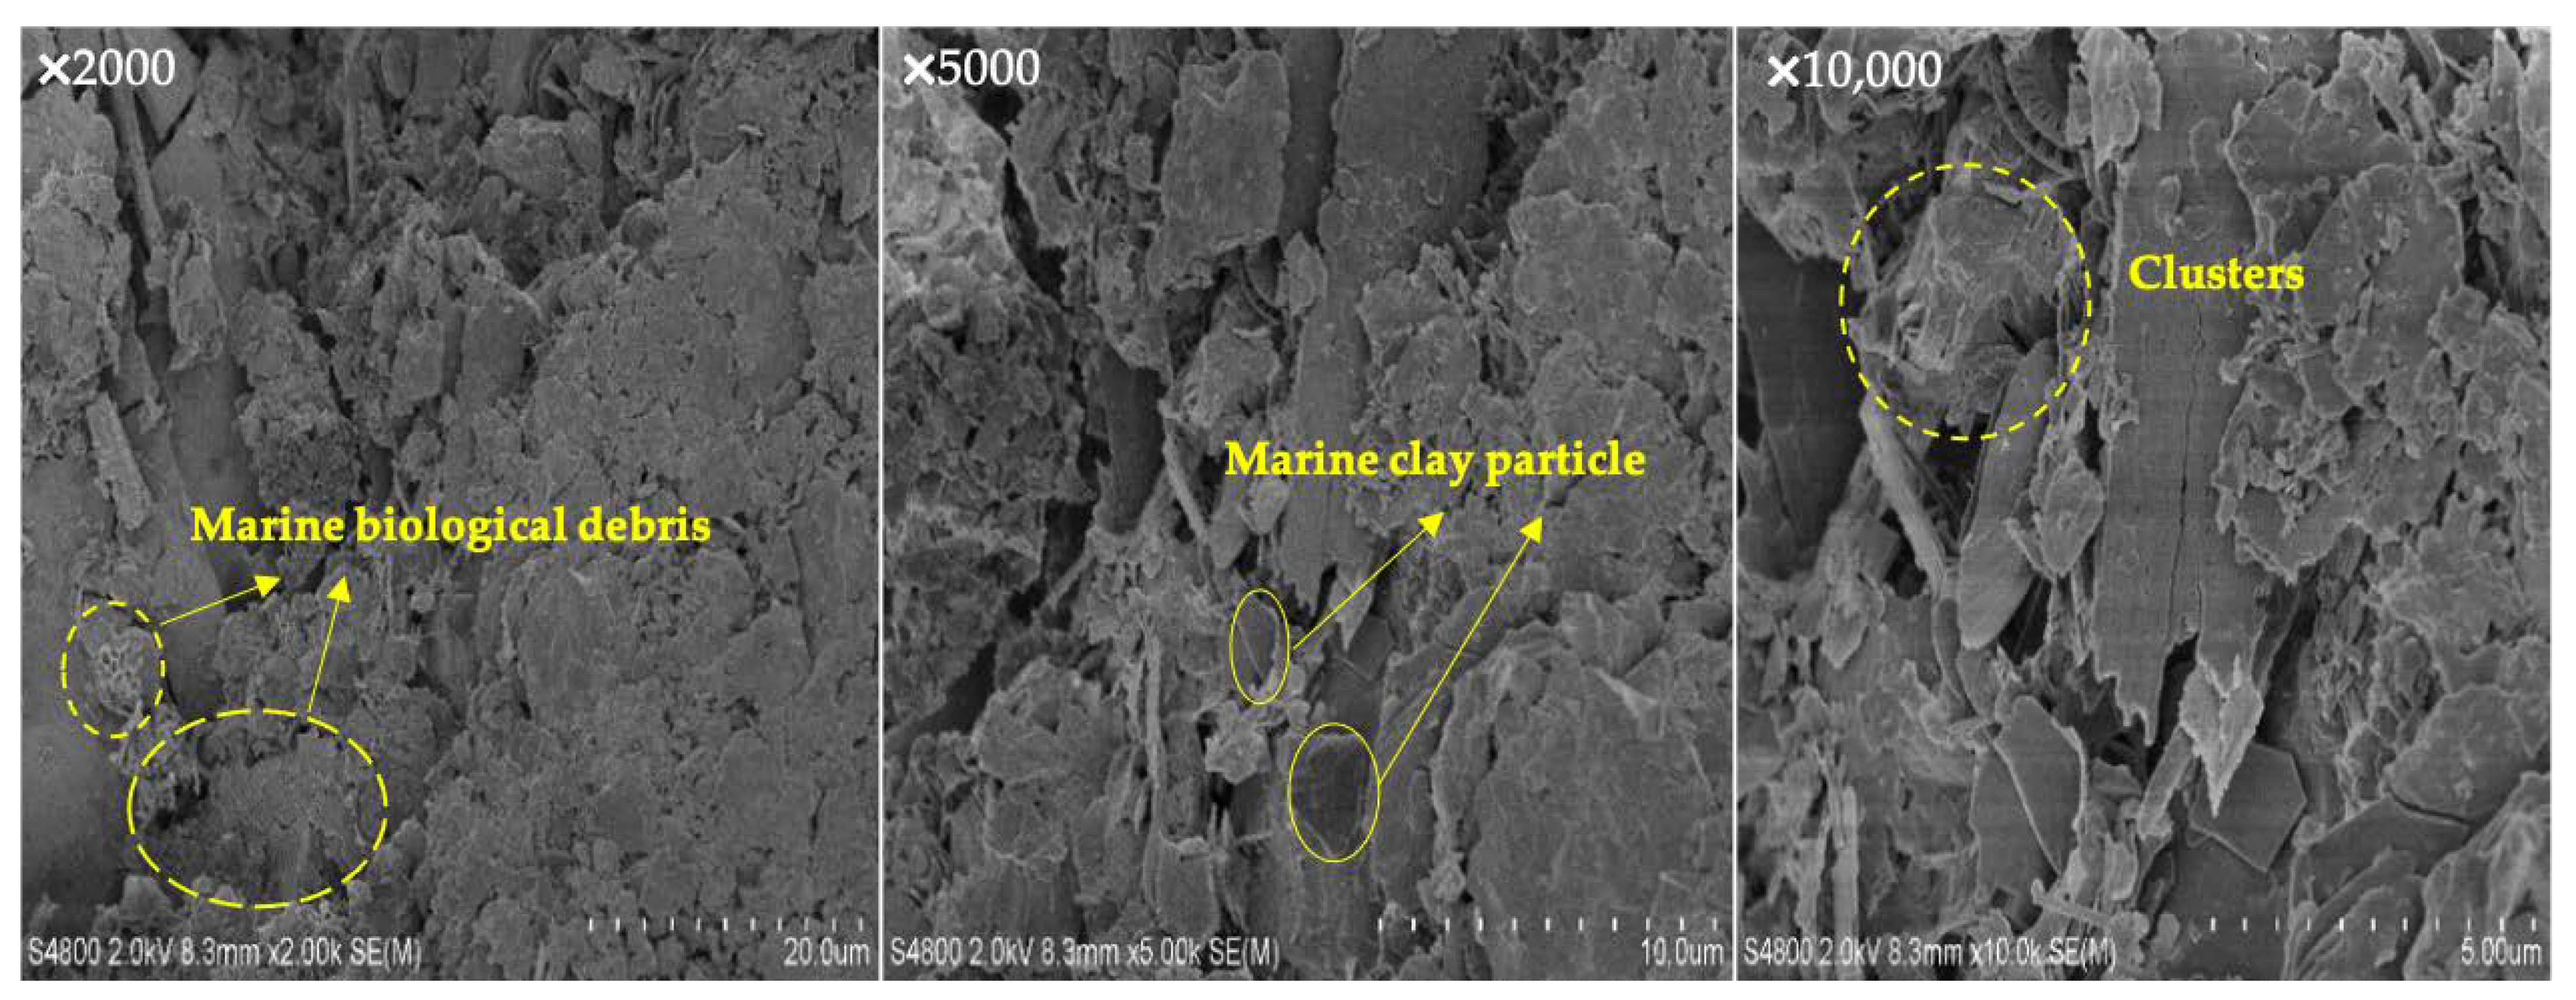
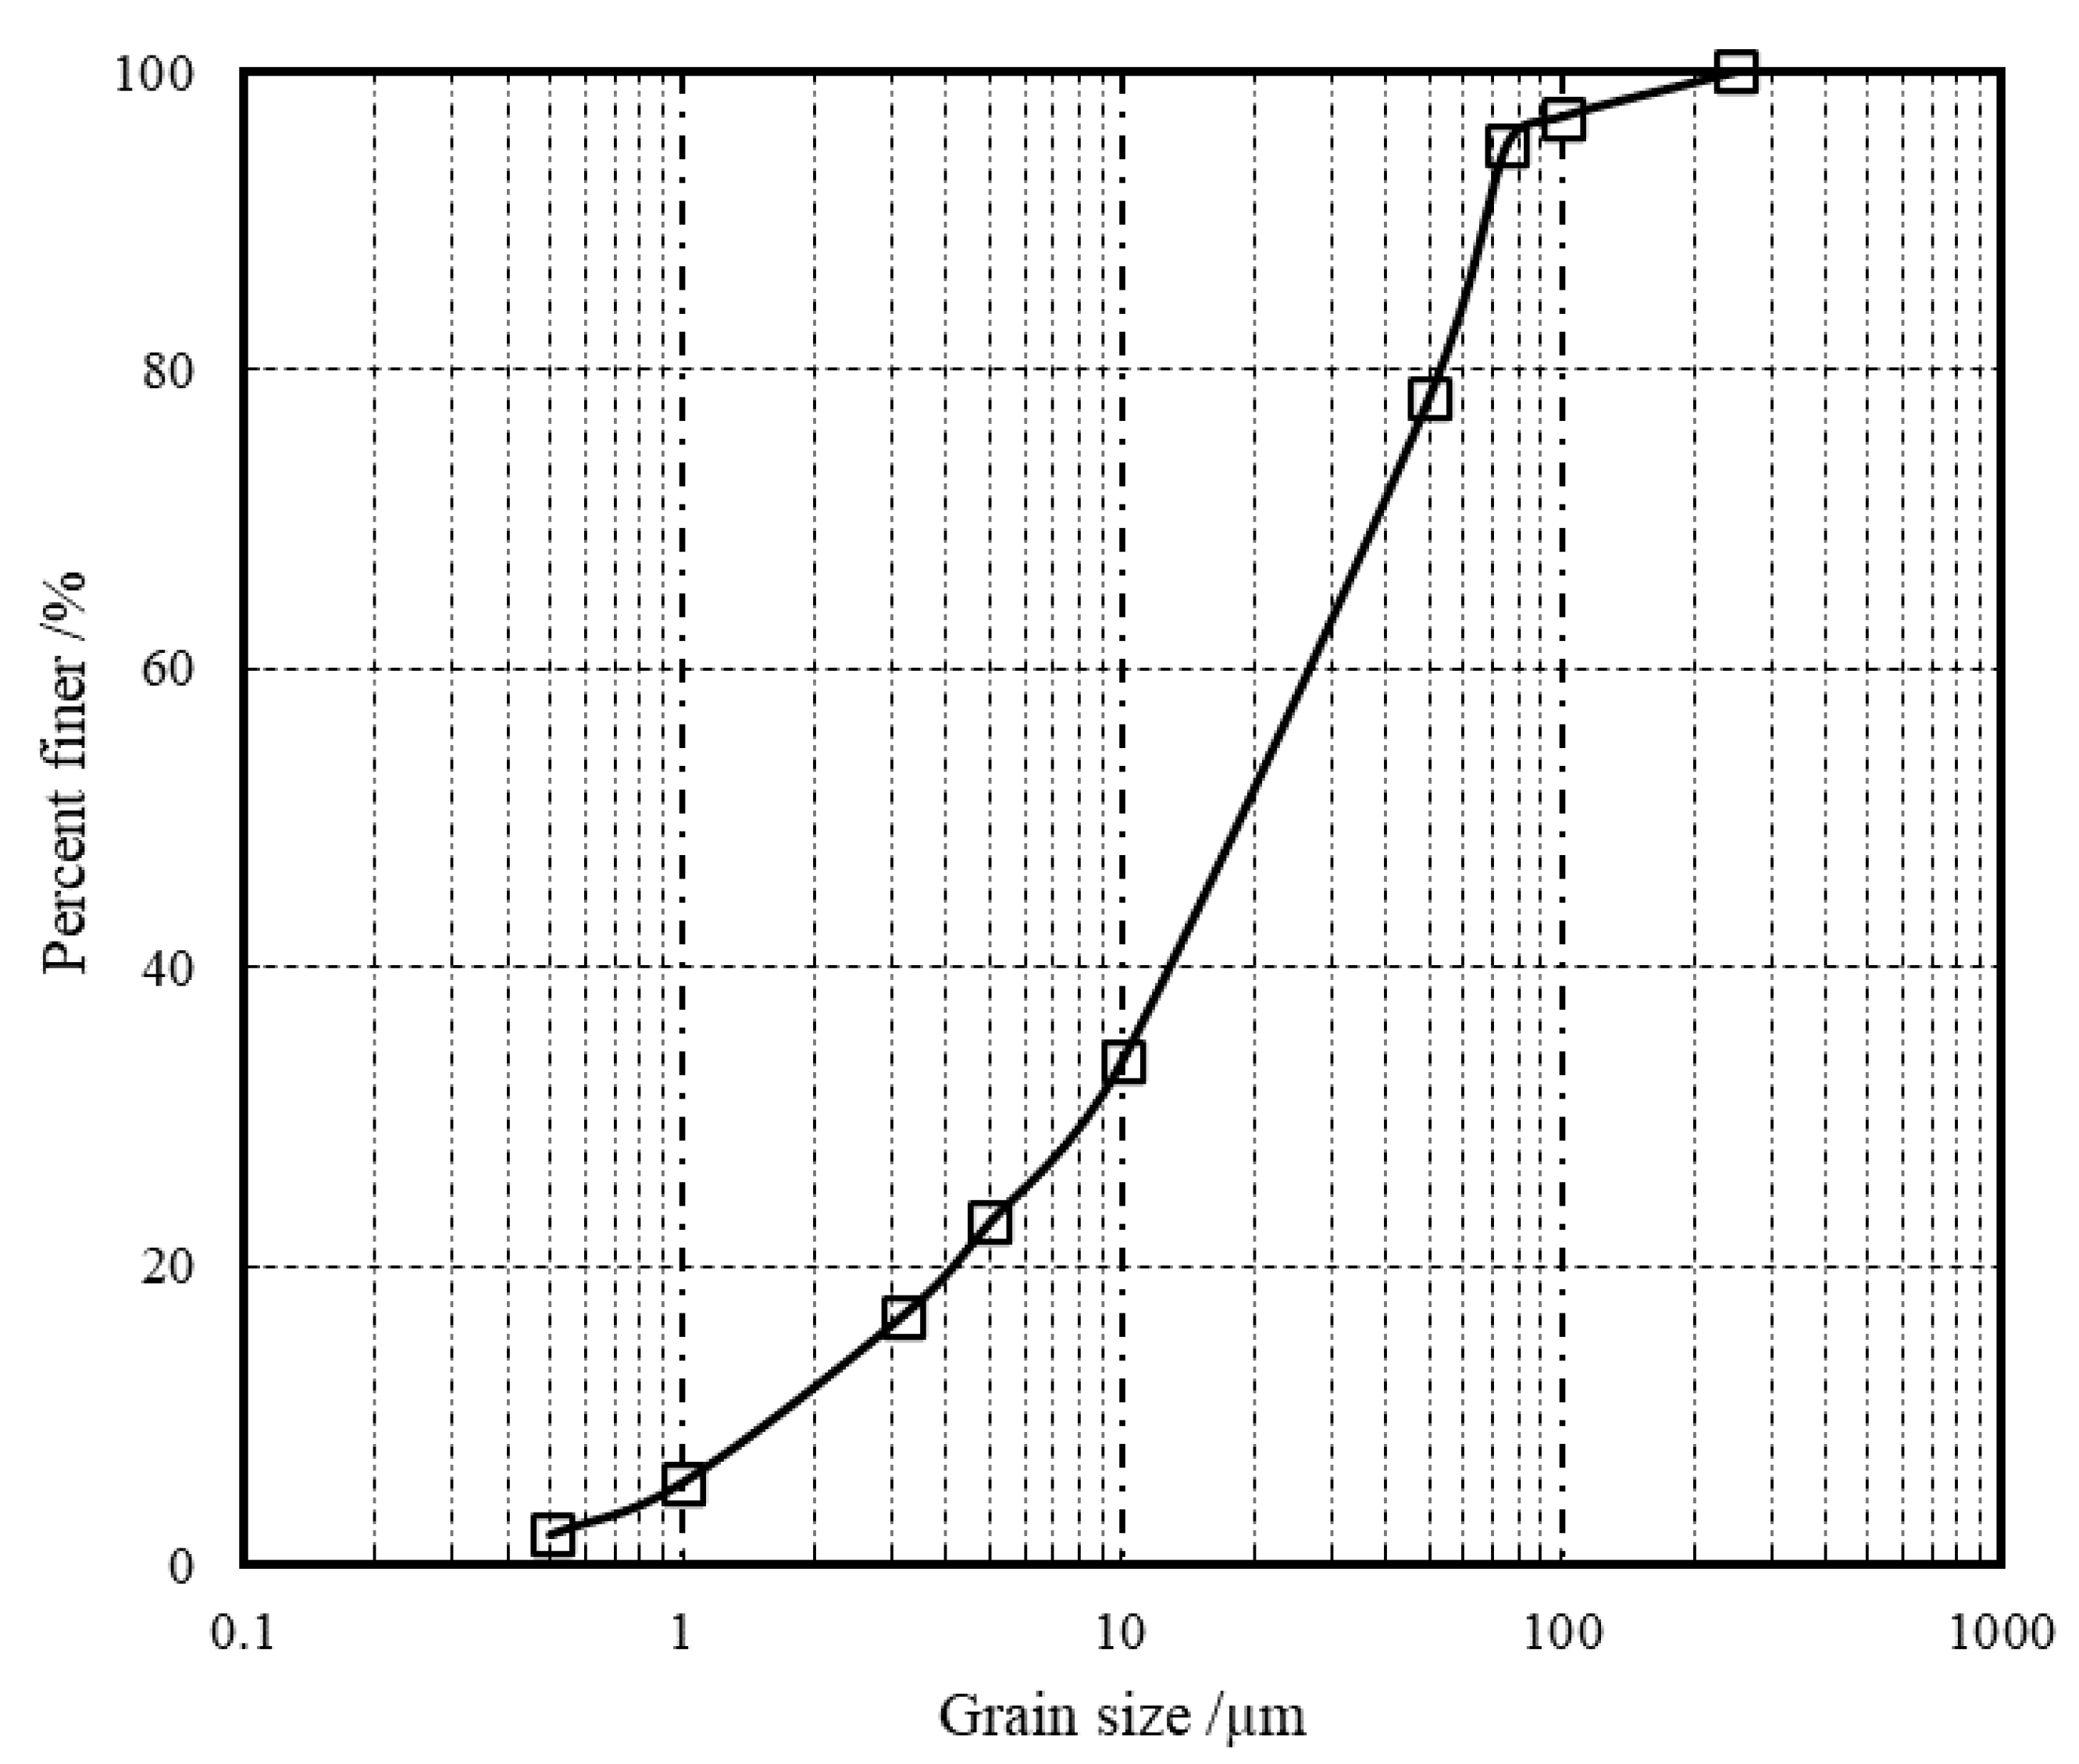
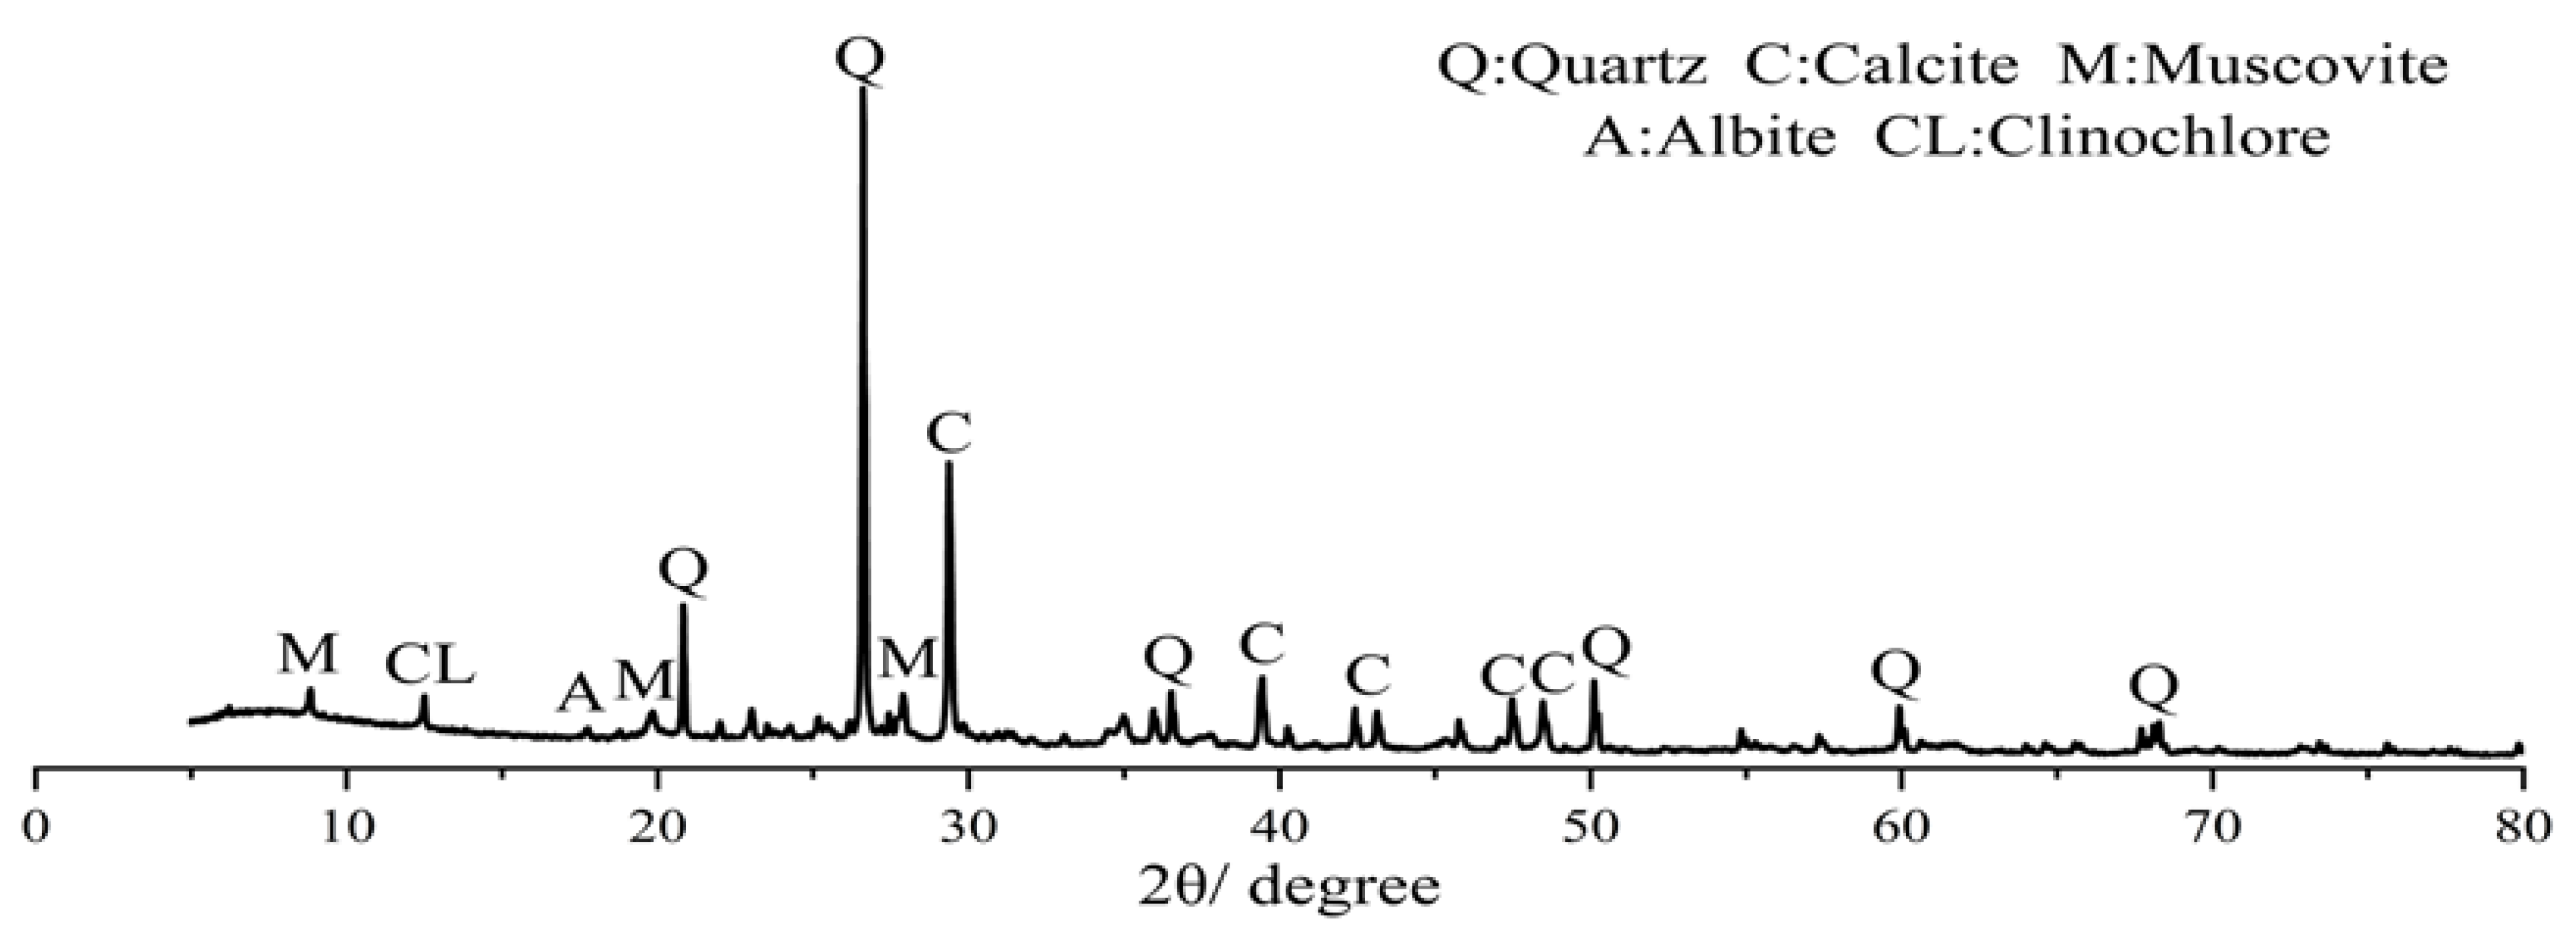
3.1. Basic Physical Properties

A series of laboratory tests were performed to investigate the basic physical properties of the soil samples. The results of the basic physical properties tests of soil samples are shown in Table 1 according to the standard of ASTM D421-85 (2007) [37].
The grain-size distribution of the sample is shown in Figure 3; different particle diameter indices of the soil samples were calculated as shown in Table 2. The coefficient of nonuniformity Cu and coefficient of curvature Cc of the deep-sea soil samples are calculated as follows:
C u = d 60 d 10 = 7.5
C c = d 30 2 d 10 × d 60 = 0.53
From the test results, it can be concluded that the coefficient of nonuniformity Cu = 7.5 ≥ 5. This soil was shown to contain particles of different thicknesses, which can be categorized into heterogeneous soils [37]; however, since the coefficient of curvature Cc = 0.53 < 1, it can be concluded that the soil is poorly graded [37] and the particle composition of the soil is mainly powder, followed by clay and sand.
The plastic limit (PL), liquid limit (LL), and plasticity index (PI) were 34.8%, 59.8%, and 25%, respectively. Therefore, according to the Unified Soil Classification System (USCS) (ASTM, 2017) [38], the study sample in this area was classified as MH (high-plasticity silt), as shown in Figure 4.
The mineral composition was determined by X-ray (XRD) diffraction tests, the results of which are given in Figure 5, and the mineral content results are shown in Table 3. The XRD pattern shows some high peaks at the 2θ angle of 20.827°, 26.609°, and 29.368°. The clay minerals are mostly powdered, with the highest percentage of quartz SiO2, followed by muscovite, calcite, and a small amount of albite and clinochlore. The ionic composition of the soil sample, in order of content, is Si, Al, Ca, Fe, K, Na, Mg. Compounds mainly include SiO2 and CaCO3, etc.
The in situ samples were processed by the vacuum freeze-drying method and analyzed by scanning electron microscopy (SEM) to obtain the microstructural properties of the soil. The microstructure electron microscope scan photo of the in situ sample is shown in Figure 6. From the figure, it can be seen that the soil particles are more obvious between the large-pore soil skeleton structure, the surface contains more marine biological debris under the sedimentation in the marine environment, contact between particles mostly occurs in the form of edge–surface, and the soil sample as a whole shows an open flocculation structure; this is the main structural characteristic in an all-seawater sedimentary environment.

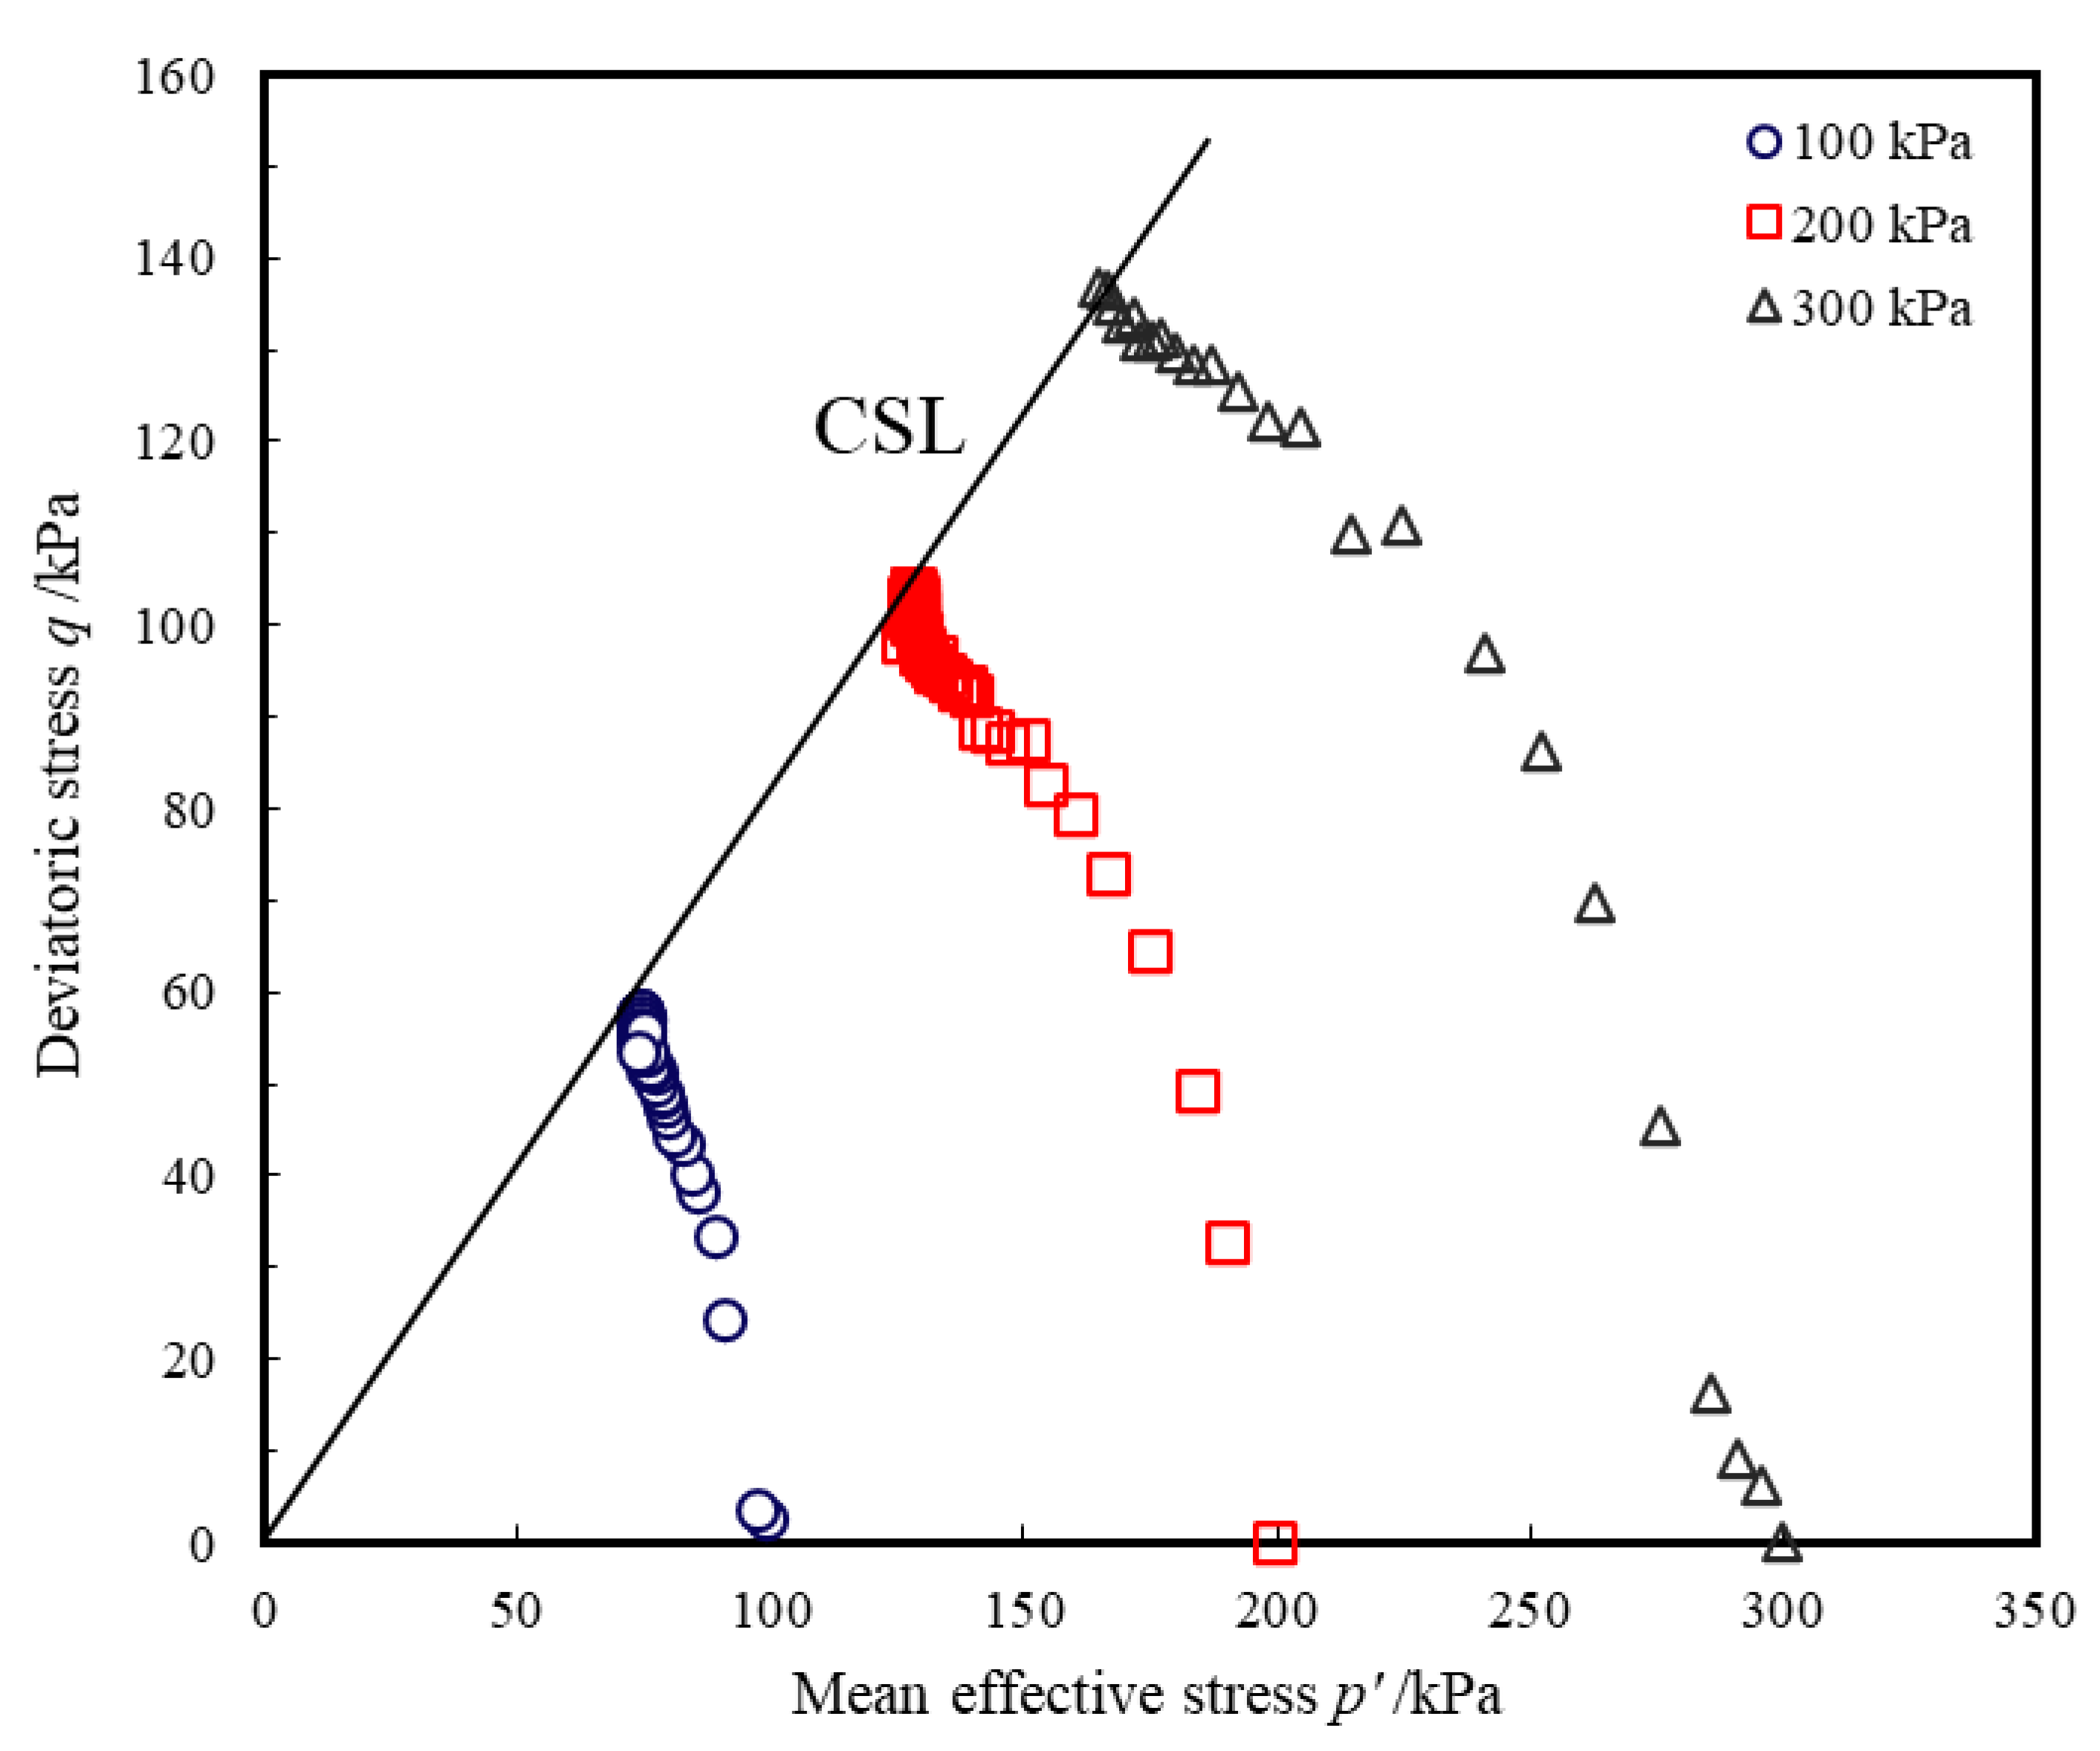
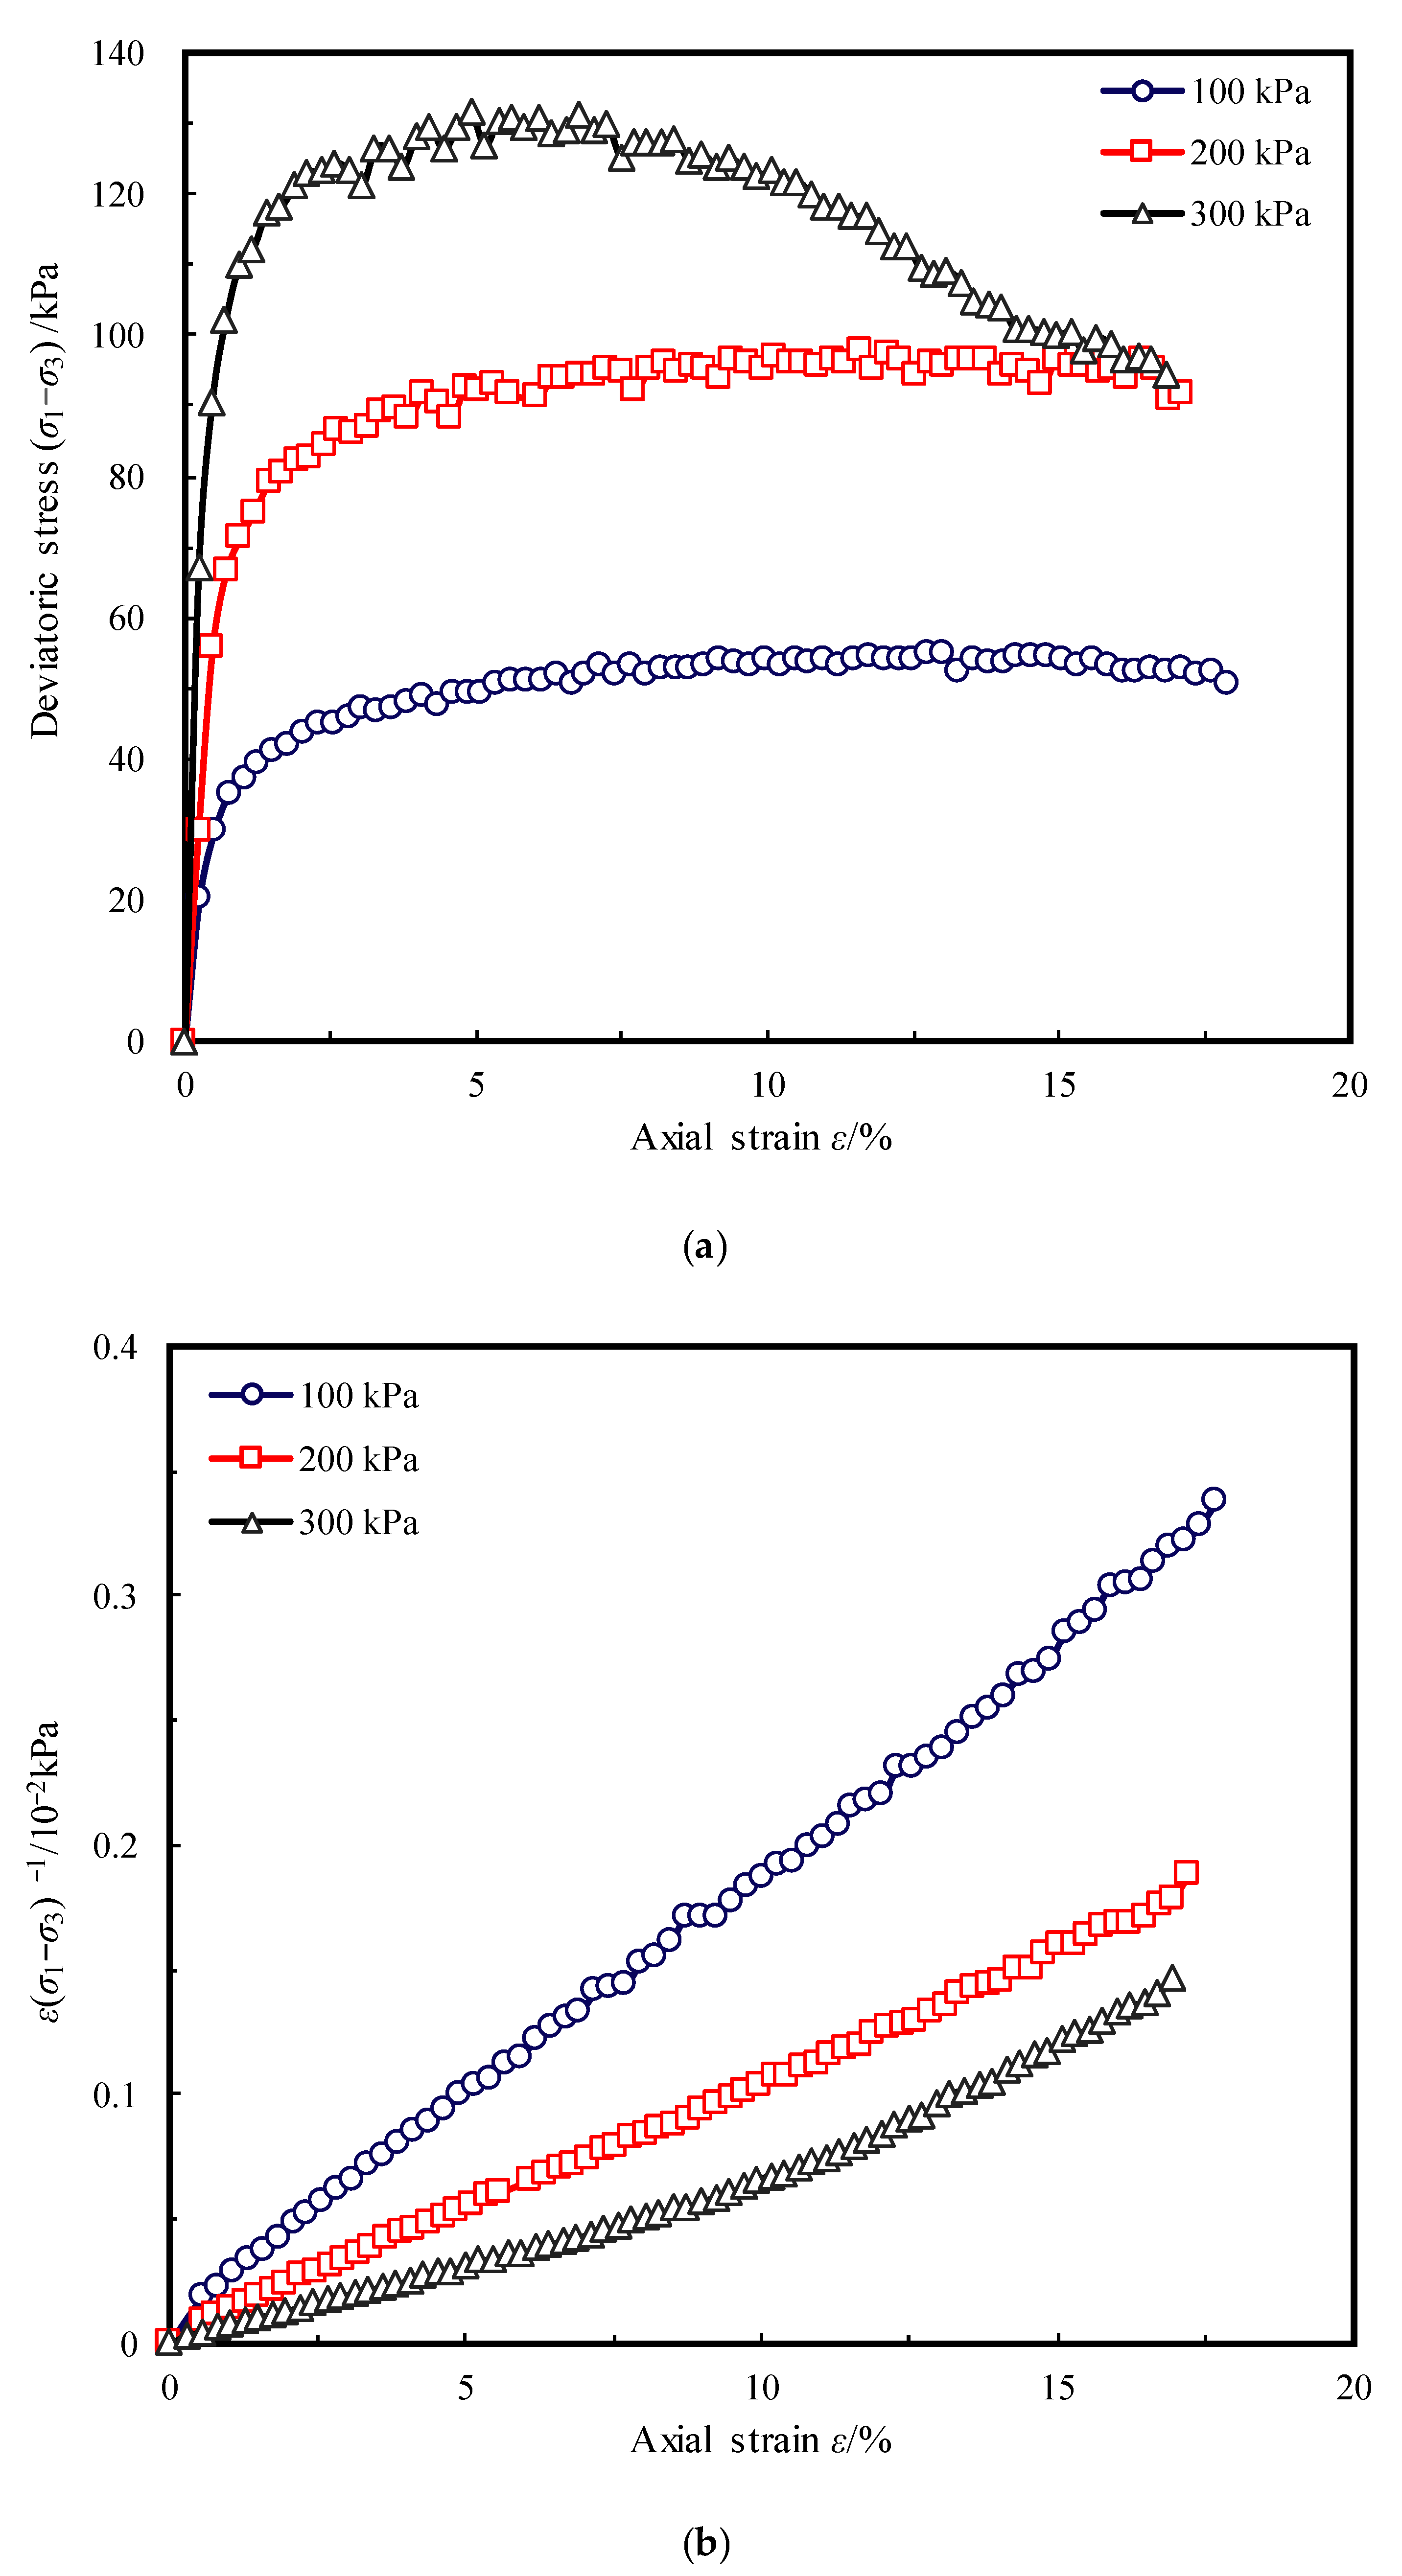
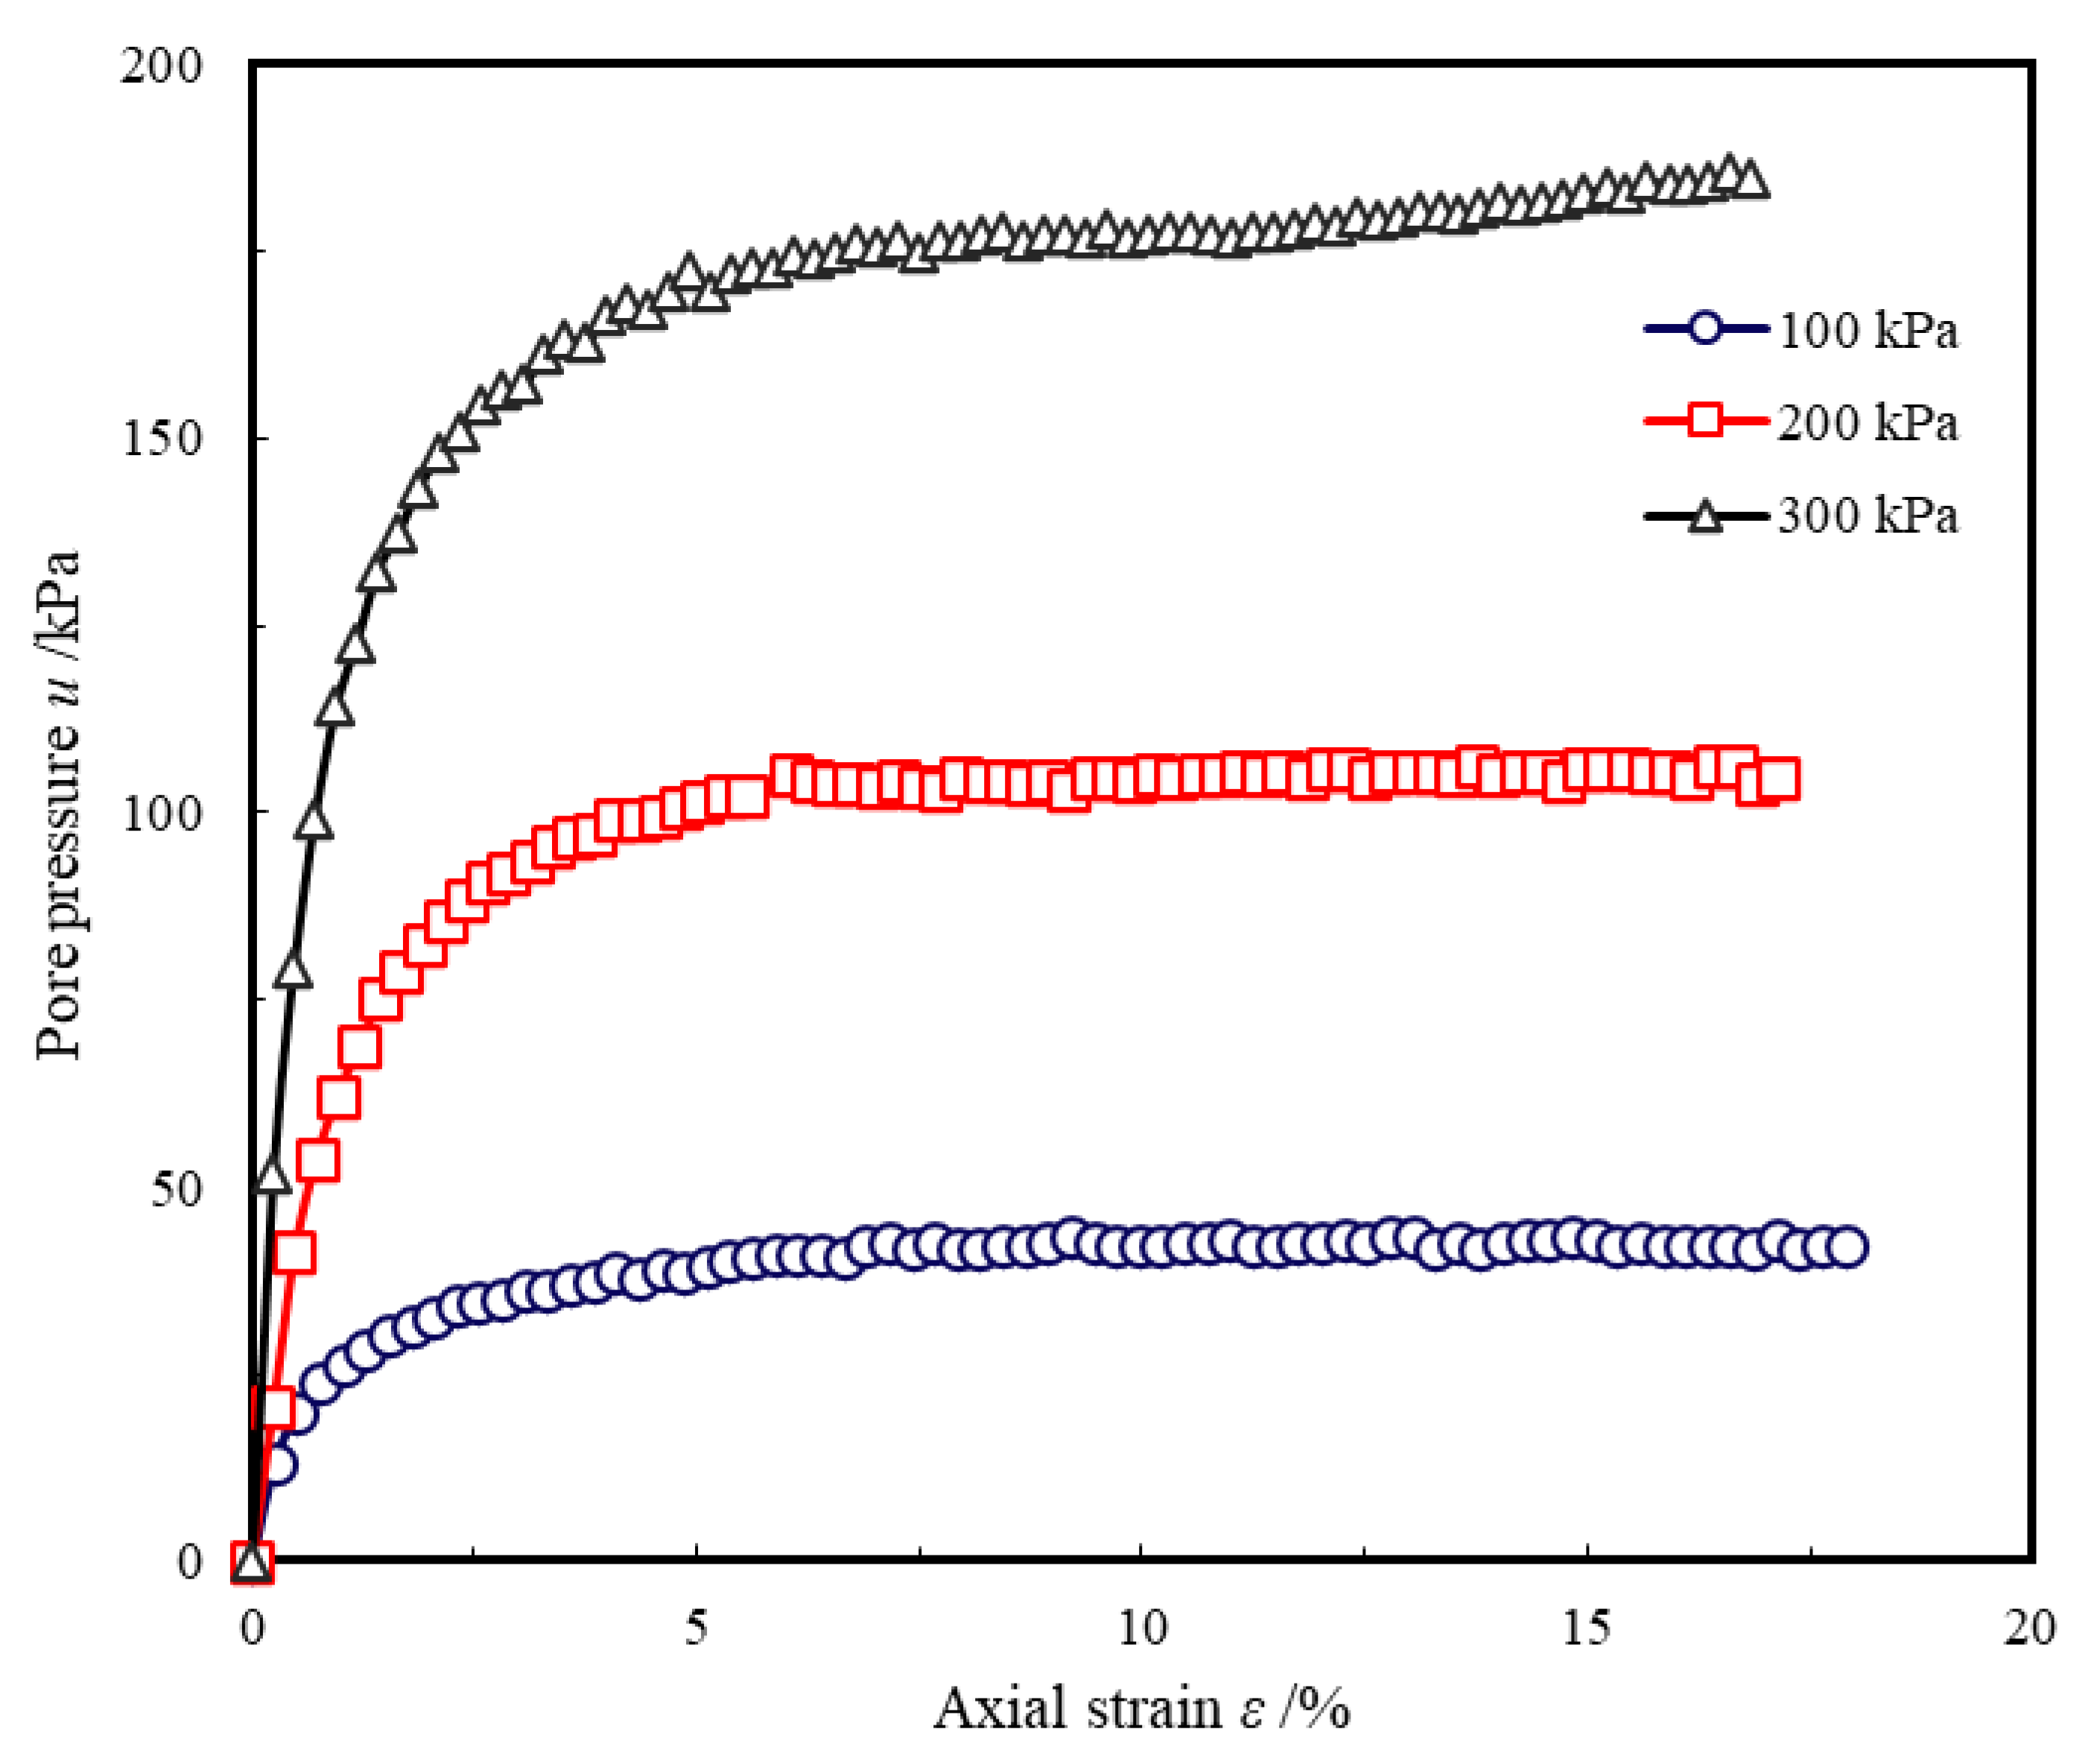
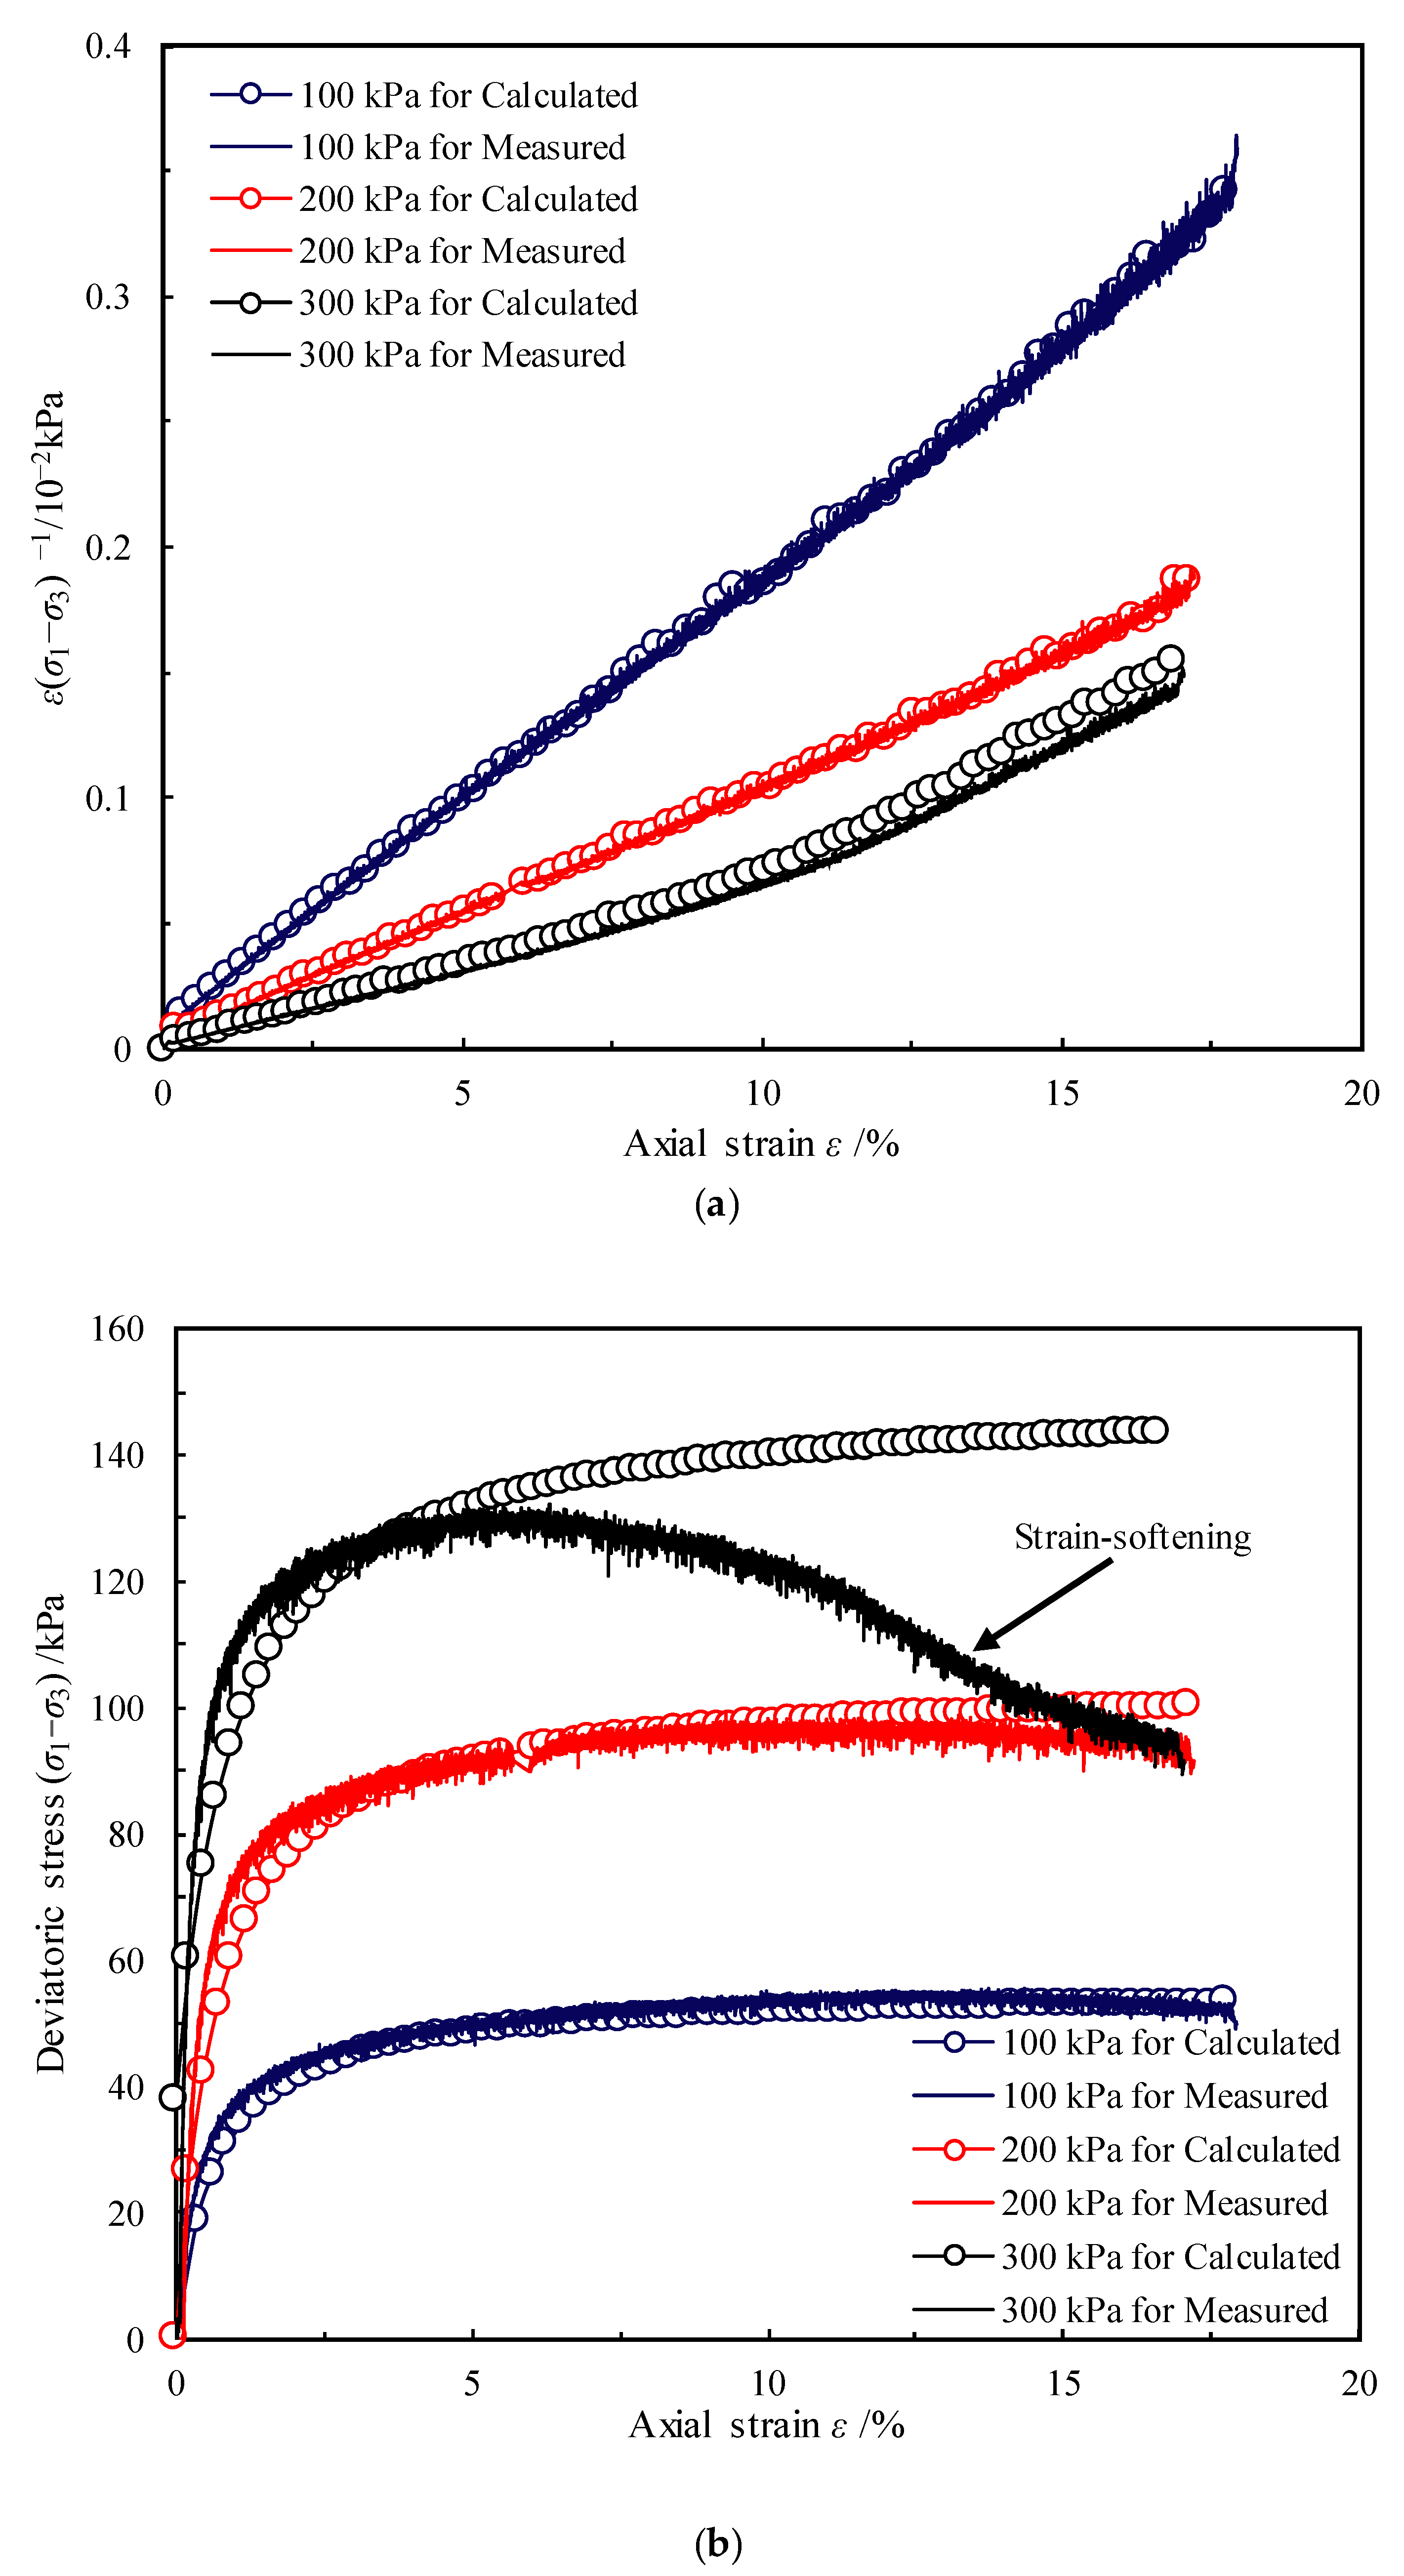
3.2. Mechanical Properties

The stress–strain behavior under different confining pressures is present in Figure 7a. One can note that there is no obvious peak point in each curve at a low confining pressure; the strength at final stability is about 54 kPa and 93 kPa, respectively, the soil shows stable or weaker strain-hardening characteristics, and the stress increases slowly, step by step, with the increase in strain. When the confining pressure reaches 300 kPa, the curve shows a clear peak point, and when the peak strength is 132 kPa, the soil exhibits strain-softening characteristics. It can be concluded that the strength of the soil gradually increases with the increase in the surrounding pressure. This phenomenon is mainly due to the large void space in the soft soil of the seabed. The soil body shows the compression of pore volume under a low perimeter pressure, and the microstructure between the soil skeleton does not change; thus, the soil strength is low. Under a high perimeter pressure, the soil will not only undergo compression of pore volume, but also cause the microstructure between soil particles to change, and the soil skeleton will become more compact and dense, which significantly increases the soil body’s ability to resist external load, and the shear strength also increases as a result. When the load reaches the ultimate bearing capacity, the soil skeleton is damaged and the microstructure of the soil is destroyed; thus, the bearing capacity is reduced and the strain-softening characteristics are exhibited.
In addition, Figure 8 illustrates the effective stress paths obtained from the consolidated–undrained triaxial test. From the soil samples plotted on the p’-q coordinate plane, it can be observed that the sample generates positive pore-water pressure (the effective stress paths gradually bend to the upper left), passes through a phase-transformation state, and then dilates with the same stress ratio and terminates with the critical state line (CSL). As deep-sea sediments are mainly composed of powder particles and clay particles, the natural sedimentation process of in situ marine sediment can form a high-porosity structure such as honeycomb, velvet, and flocculation by lapping between clay particles, which forms a certain cementation structure between the particles. The higher the clay content, the more significant the cementation effect, as shown in Figure 9, thus increasing the shear strength of the soil [39,40]. However, with the increase in confining pressure, as shown in Figure 7a and Figure 8, the structure of the marine sediments is gradually destroyed; that is, the clay particles gradually became densely stacked, the sediments were destroyed and strain-softening obviously occurred.
Figure 10 shows the relationship curve between pore water pressure development and axial strain, which shows a two-stage change characteristic. The pore water pressure rapidly increases in the initial stage, and subsequently, when the axial strain is approximately 4%, with the increase in axial strain, the growth rate of pore water pressure gradually decreases and tends toward a critical point, showing the continuous accumulation of pore water pressure.

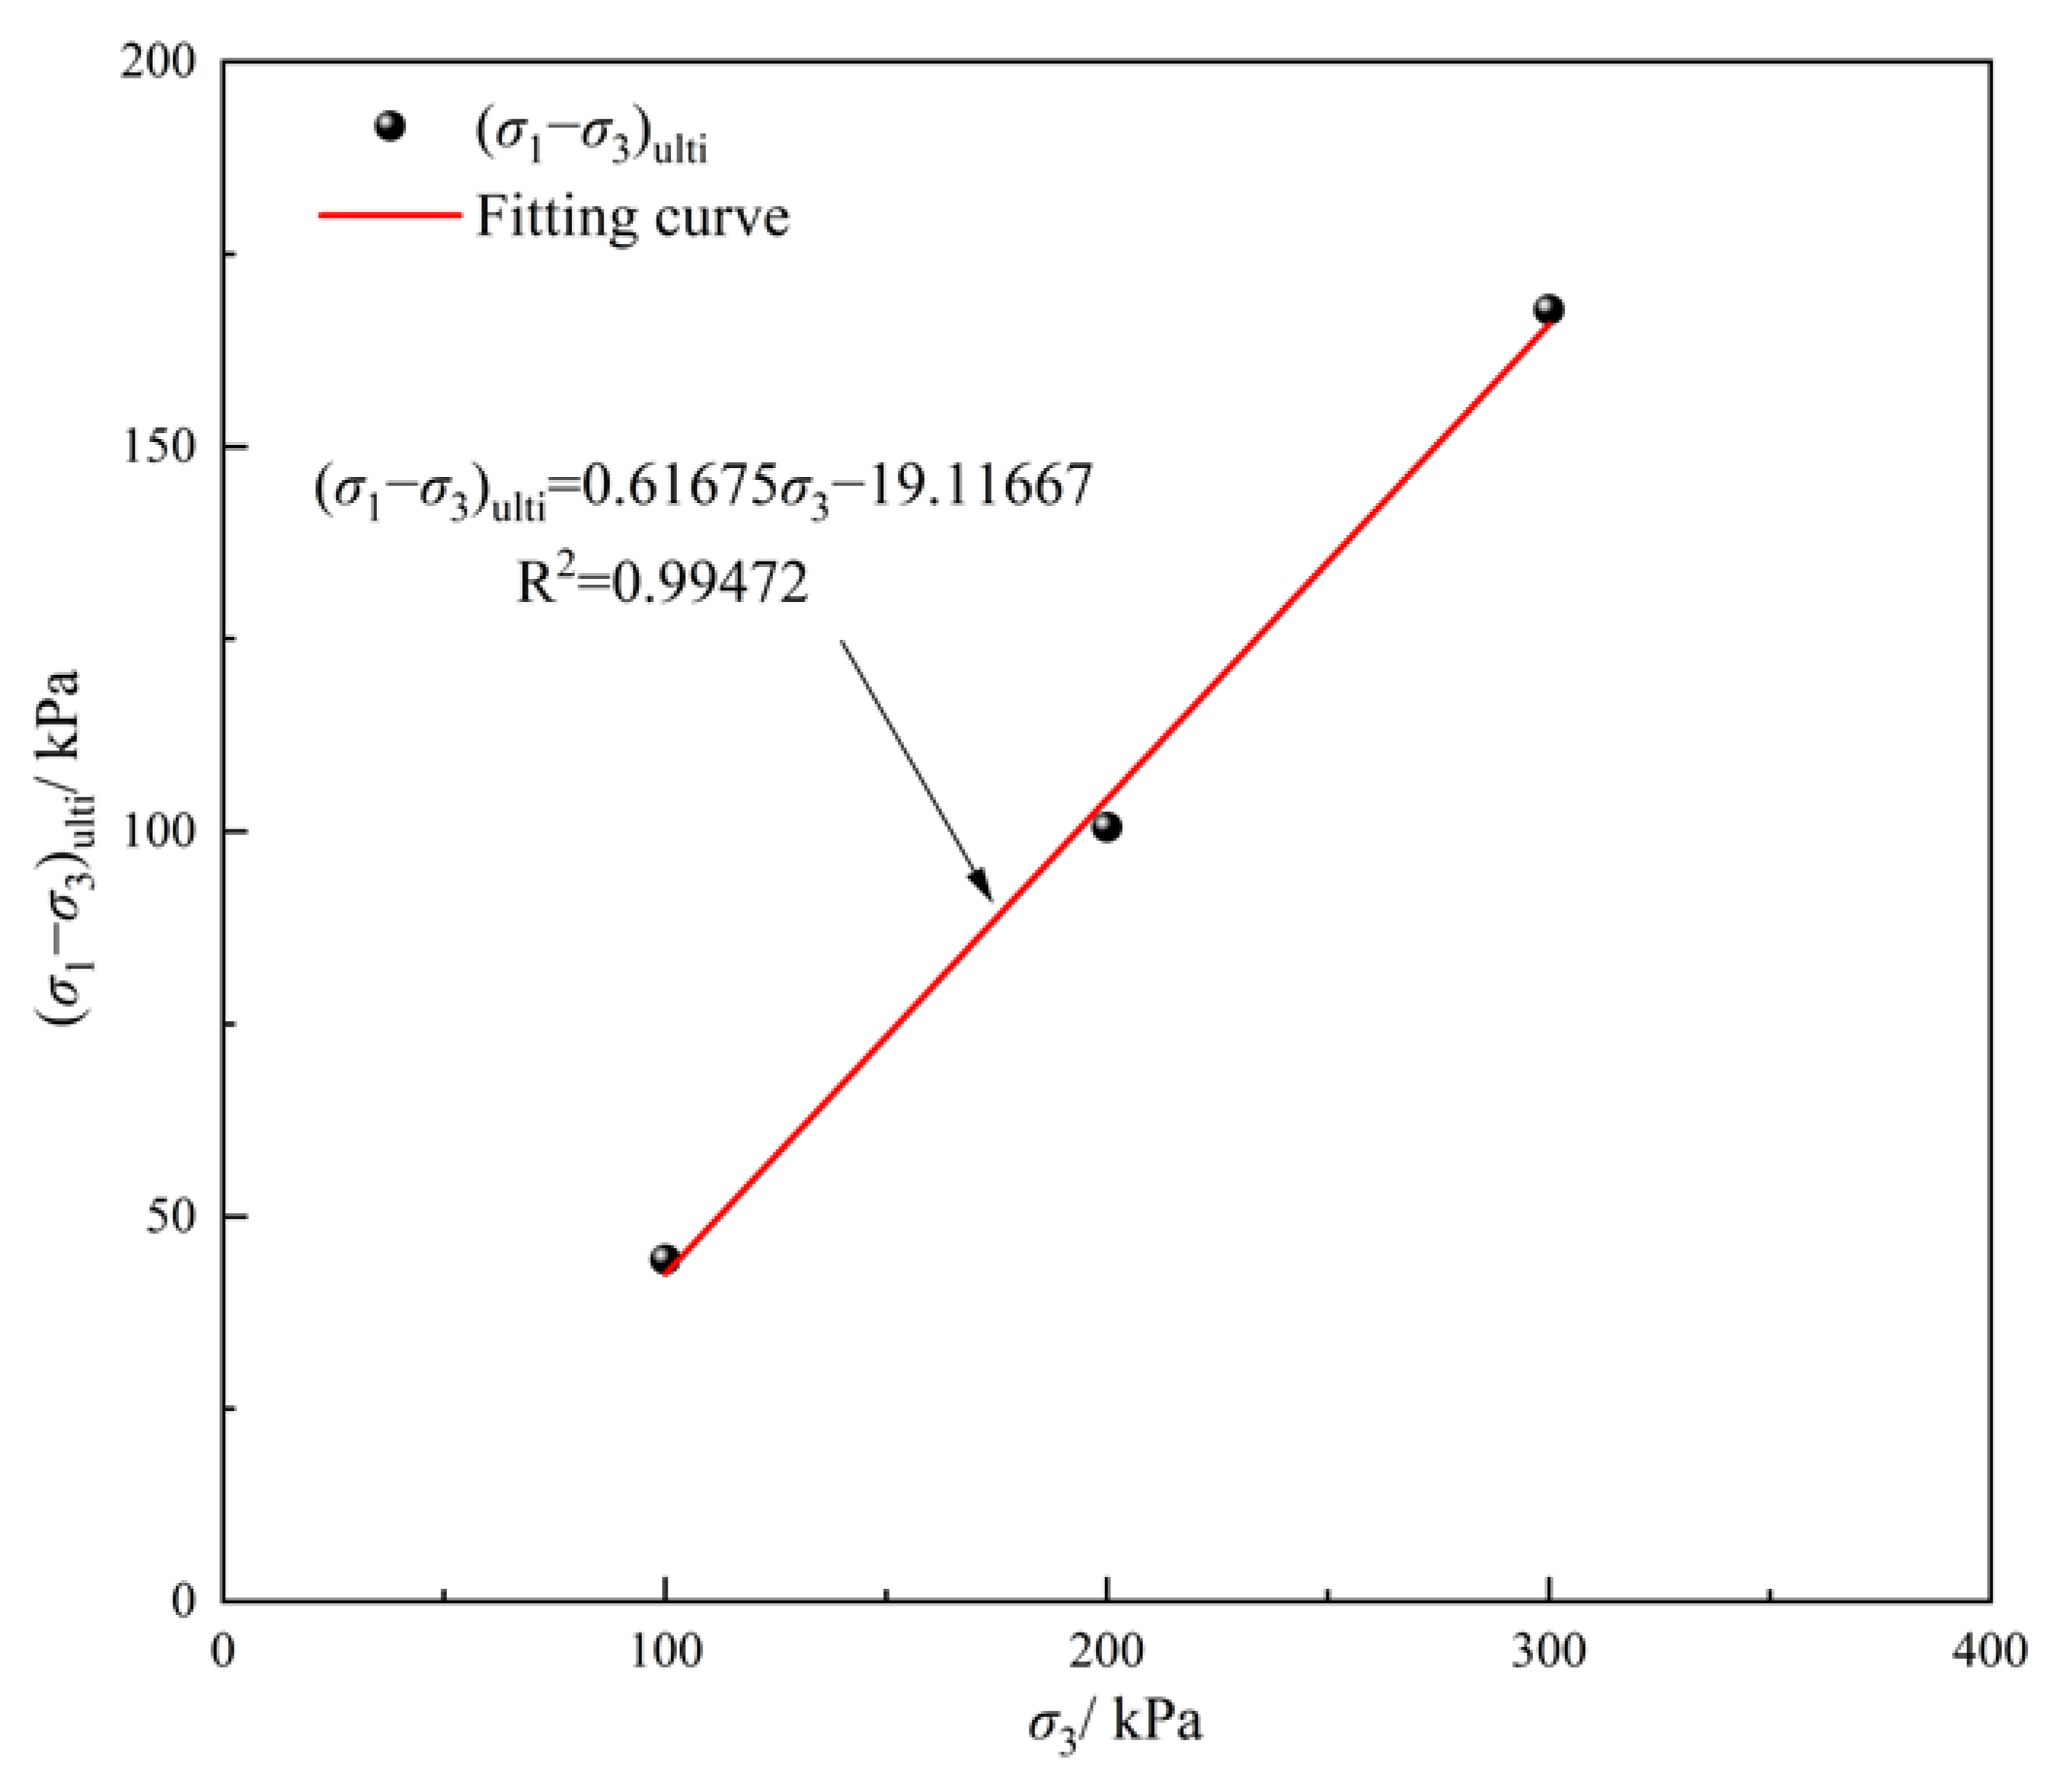
3.3. Selection of Normalization Factors

Konder proposed that the ( σ 1 σ 3 ) ε to determine the conventional static triaxial test relationship can be approximated by the hyperbolic equation [41] as follows:
σ 1 σ 3 = ε a i ε + b i
where a i is the reciprocal of the asymptotic value of the principal stress difference ( σ 1 σ 3 ) ulti   under a certain constant consolidation confining pressure; b i is the reciprocal of the initial tangent modulus E 0 i under a certain constant consolidation confining pressure.
Equation (3) can be converted to:
ε σ 1 σ 3 = a i ε + b i
Both sides of Equation (4) are multiplied by A to:
ε σ 1 σ 3 A = A a i ε + A b i
Since the two parameters of Equation (3) are different under different confining pressures parameters, to obtain the ( σ 1 σ 3 ) ε   relationship normalized equation under different confining pressures,   σ 3 , such that:
ε σ 1 σ 3 A = M ε + N
where M and N are constants.
From Equations (5) and (6):
M = A a i
N = A b i
From Equations (7) and (8):
A = M ( σ 1 σ 3 ) ulti
A = N E 0 i
Combining Equations (9) and (10) yields:
M ( σ 1 σ 3 ) ulti = N E 0 i
The normalization factor of the normalization curve of the relationship between ( σ 1 σ 3 ) ε   under the different confining σ 3   is desirable   M ( σ 1 σ 3 ) ulti , and its normalization conditions are:
( σ 1 σ 3 ) ulti E 0 i = N M
That is, the asymptotic value of the principal stress difference ( σ 1 σ 3 ) ulti is a positive proportional function of the initial tangent modulus E 0 i .
The stress–strain relationship curve of the specimen in Figure 7b is fitted with Equation (4), and parameters ai and bi are shown in Table 4.
When the initial tangent modulus E 0 i = 0, this can be inferred from Equation (3), ( σ 1 σ 3 ) ulti = 0. Thus, according to the relevant parameters of Table 4, the relationship between the asymptotic value of the principal stress difference ( σ 1 σ 3 ) ulti and the confining pressure σ 3   under different confining pressures is shown in Figure 11. The relationship curve in Figure 11 can be fitted with a linear equation:
( σ 1 σ 3 ) ulti = 0.61675 σ 3 19.11667
correlation coefficient R2 = 0.9947.

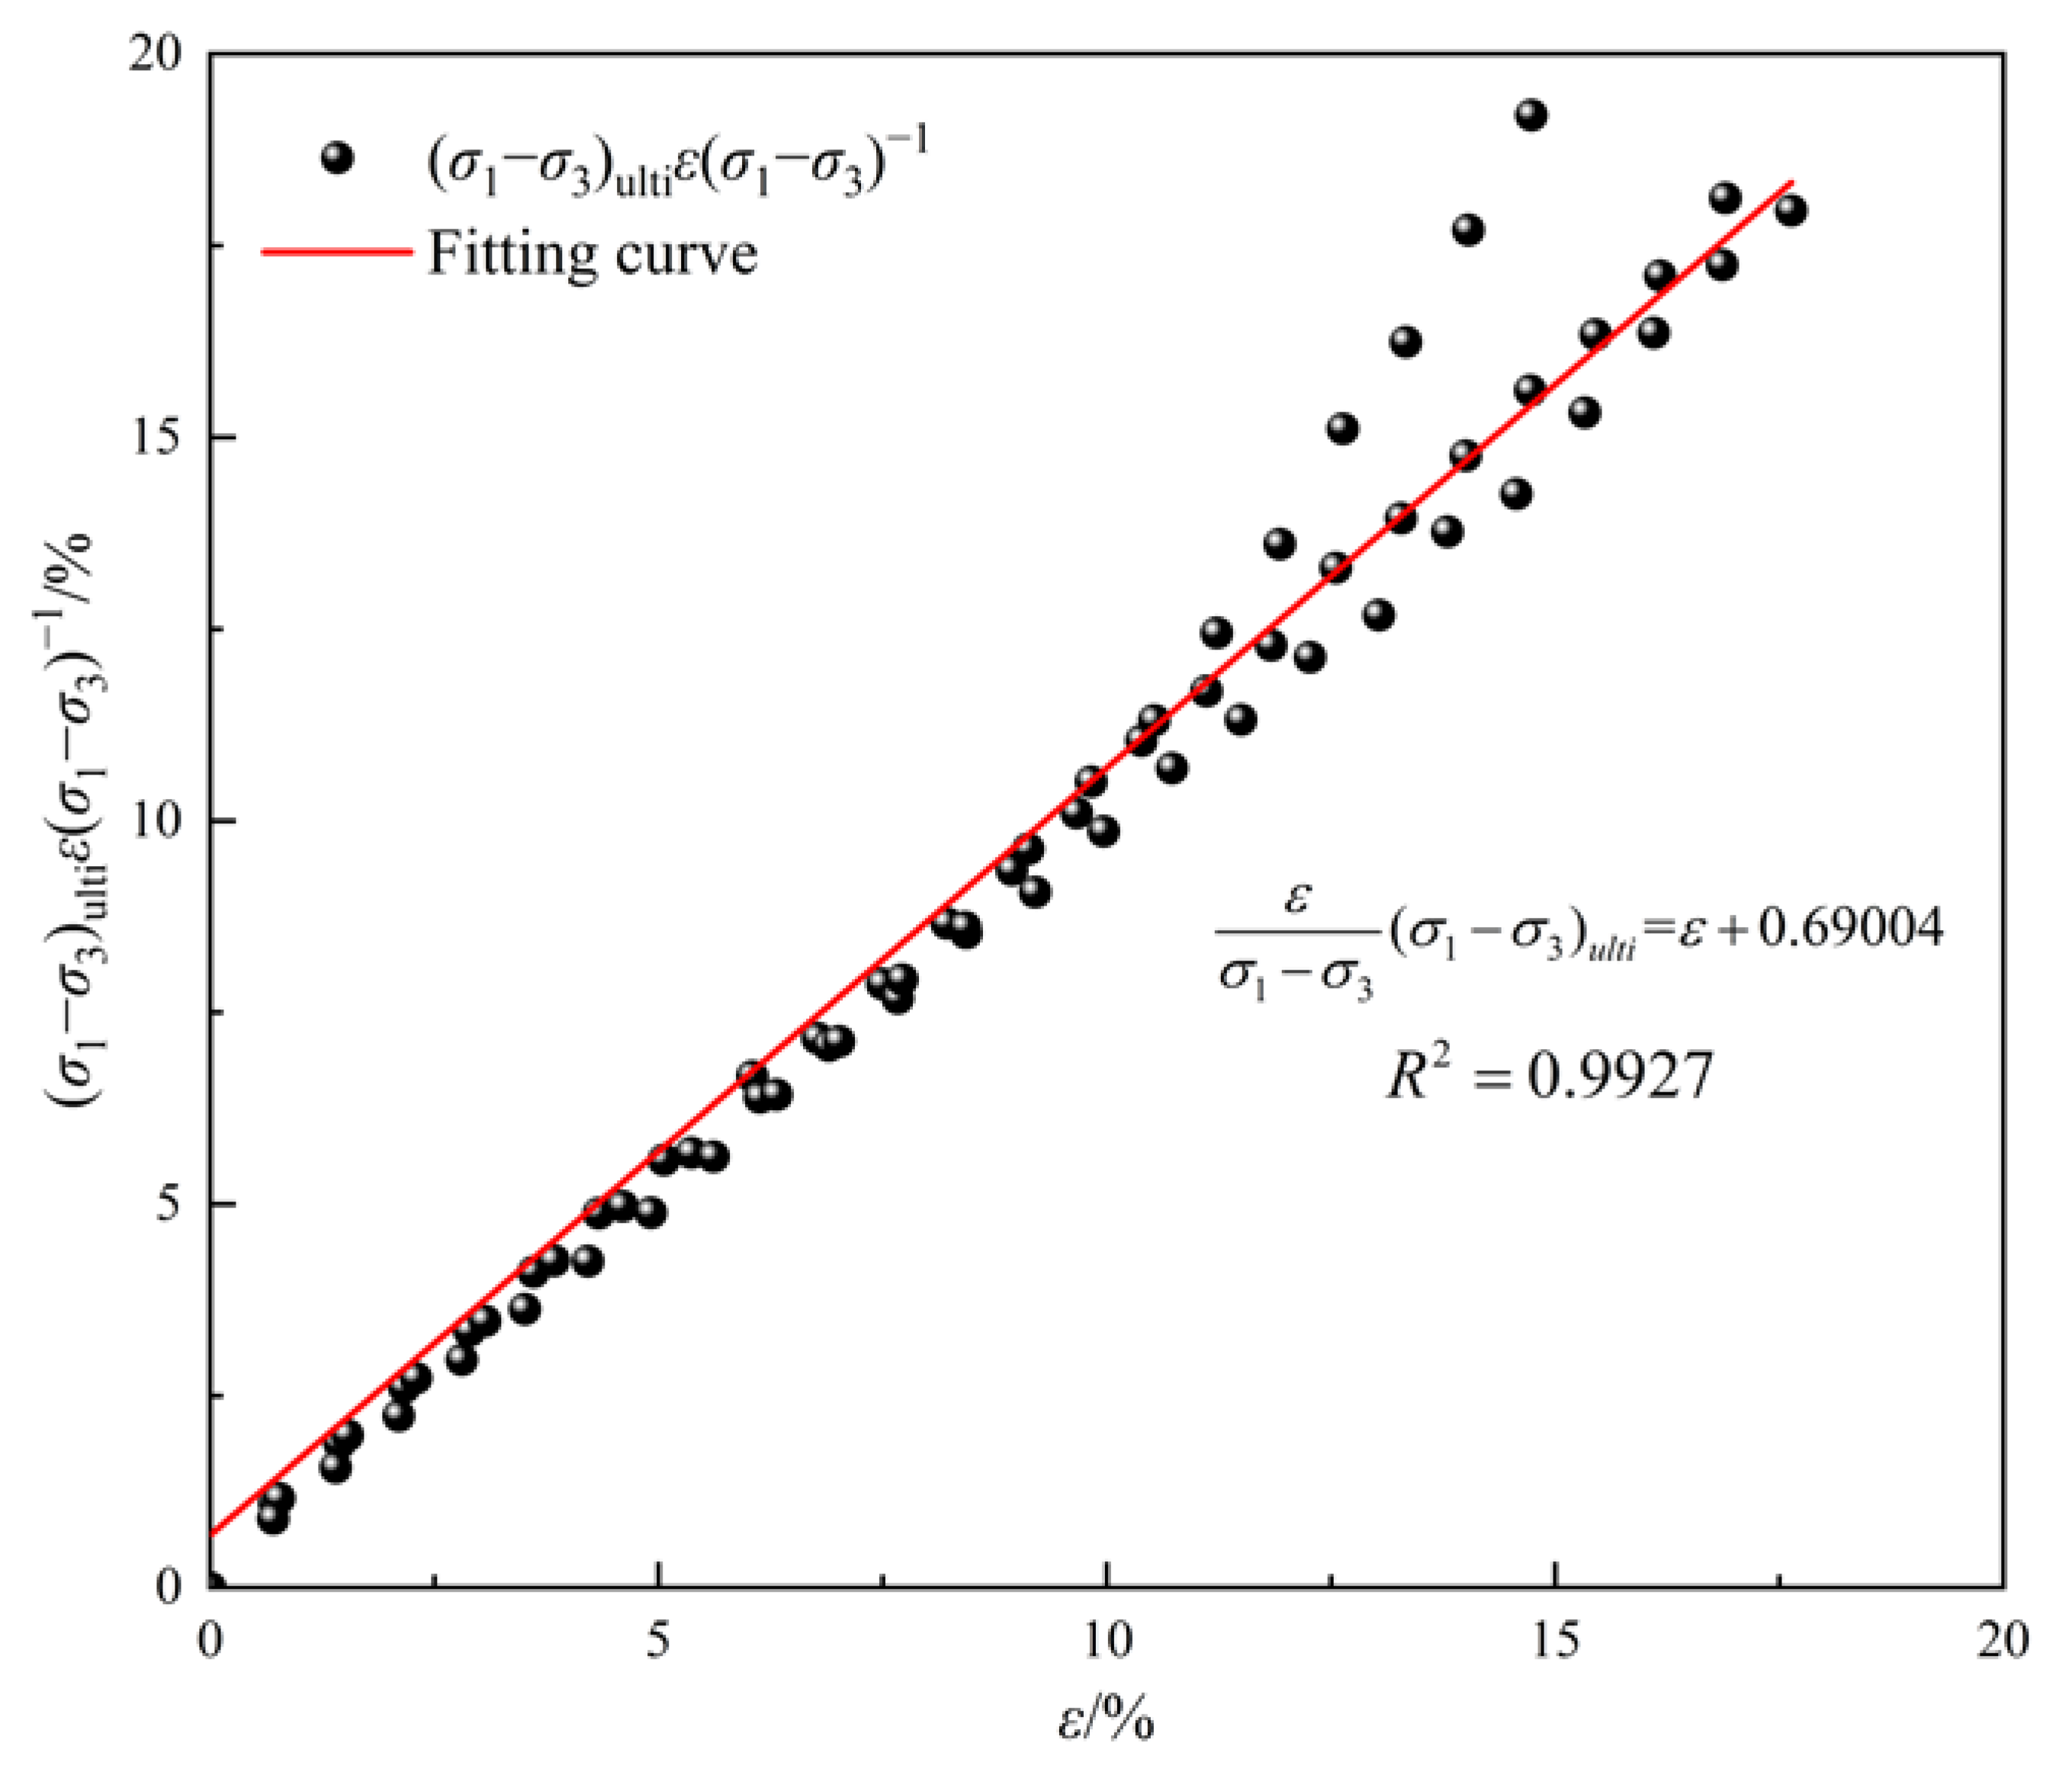
3.4. Normalized Analysis of Stress–Strain Properties

A normalized analysis of the CU stress–strain characteristics of soft soil in the SCS is presented. Taking the asymptotic value of the principal stress difference ( σ 1 σ 3 ) ulti   as the normalization factor, the normalization analysis of the   ε σ 1 σ 3 ε   relationship under different confining pressures is shown in Figure 12.
According to Figure 12, the resulting normalization equation is:
ε σ 1 σ 3 ( σ 1 σ 3 ) ulti = ε + 0.69004
Its correlation coefficient is R2 = 0.9927, which has good normalization.
Combining Equations (13) and (14) yields:
σ 1 σ 3 ε = 0.61675 σ 3 19.11667 ε + 0.69004
Equation (15) is a normalization equation based on the asymptotic value of the principal stress difference, with ( σ 1 σ 3 ) ulti   as the normalization factor.
Equation (15) can predict the   ε σ 1 σ 3 ε relationship under different consolidation confining pressures and ( σ 1 σ 3 ) ε relationship curve, as shown in Figure 13.
As can be seen from Figure 12 and Figure 13, the normalization analysis of the stress–strain characteristics of deep-sea soft soils from the SCS was carried out using the principal stress difference asymptote value ( σ 1 σ 3 ) ulti   as the n−ormalization factor. When the soil sample shows strain-hardening or strain-stabilization under different confining pressures, its normalization effect is perfect; when the soil sample exhibits strain-softening under a high confining pressure, there is a certain error in the normalization effect of the softening stage. The stress–strain relationship equation represented in Equation (15) can predict the stress–strain relationship under the low confining pressures of soft soils in the SCS under the consolidated–undrained triaxial test.

4. Conclusions

The particle composition of the deep-sea soft soil in this study is mainly powder, followed by clay soil and sand, the soil sample is classified as MH, and the soil particle gradation is poor. The mineral composition of the soil is mainly quartz, muscovite, and calcite, and the soil also contains a small amount of albite and chlorite. Microscopically, the skeleton structure of the soil is very loose, containing more marine biological debris, contact between particles mostly occurs in the form of edge-surface, and the soil sample presents an open flocculation structure overall.
The stress–strain relationship of soft soil from the SCS under consolidation undrained conditions shows a typical hyperbolic relationship. Under a low confining pressure, the soil exhibits a stable or weakly strained hardening type; under a high confining pressure, the soil embodies a strained softening.
According to the stress–strain hyperbolic equation proposed by Konder, the normalization conditions must be met to normalize the stress-strain equation. An asymptotic value of principal stress difference ( σ 1 σ 3 ) ulti   is proposed as the standard normalization factor. The stress–strain relationship equation for soft soil from the SCS under consolidated–undrained conditions, established by the standard normalization factor, can predict the stress–strain relationship under different confining pressures using the consolidated-undrained shear test of the soft soil.
The stress–strain relationship normalization equation established in this paper is based on the stress–strain hyperbolic equation proposed by Konder, so the normalization equation is only suitable for strain stabilization and strain-hardening, and is not suitable for the softening stage of strain-softening.

Author Contributions

Conceptualization, Z.L., H.K.; Data curation, Y.Y.; Formal analysis, Y.Y. and Z.L.; Funding acquisition, H.K., Y.J. and; Writing—original draft, Y.Y.; Writing—review and editing, H.K., Y.Y., C.Z. and Z.L. All authors have read and agreed to the published version of the manuscript.

Funding

This research was funded by the National Natural Science Foundation of China (No. 41831280), and supported by Shandong Provincial Key Laboratory of Ocean Engineering.

Institutional Review Board Statement

Authors have signed the statement.

Informed Consent Statement

Authors have signed the statement.

Data Availability Statement

Authors state that all data are available.

Acknowledgments

Authors are indebted to the 2020 shared voyage of the Northern South China Sea scientific research. We thank the anonymous reviewers for their valuable comments.

Conflicts of Interest

The authors declare no conflict of interest.

References

  1. Li, X.; Jiang, X.; Hopman, H. A review on predicting critical collapse pressure of flexible risers for ultra-deep oil and gas production. Appl. Ocean Res. 2018, 80, 1–10. [Google Scholar] [CrossRef]
  2. Guo, X.; Stoesser, T.; Nian, T.; Jia, Y.; Liu, X. Effect of pipeline surface roughness on peak impact forces caused by hydrodynamic submarine mudflow. Ocean Eng. 2022, 243, 110184. [Google Scholar] [CrossRef]
  3. Peng, J.; Liu, H. Analytical study on comprehensive behaviors of drag anchors in the seabed. Appl. Ocean. Res. 2019, 90, 101855. [Google Scholar] [CrossRef]
  4. Ren, Y.; Yang, Q.; Wang, Y.; Zhao, W. Experimental study on the undrained shear strength of deep-sea soft soil using improved T-bar penetrometer. Mar. Georesour. Geotechnol. 2020, 38, 1199–1208. [Google Scholar] [CrossRef]
  5. Li, Y.; Wang, G.; Jing, L.; Zhang, L.; Cheng, X. Unified Description of the Mechanical Properties of Typical Marine Soil and Its Application. Shock. Vib. 2017, 2017, 3892193. [Google Scholar] [CrossRef]
  6. Ting-Kai, N.; Hou-bin, J.; Ning, F.; Xing-Sen, G.; Yong-gang, J. Experiment on dynamic strain-pore pressure of soft clay in the northern slope of South China Sea. Rock Soil Mech. 2018, 39, 1564. [Google Scholar]
  7. Nian, T.K.; Jiao, H.B.; Fan, N.; Guo, X.S. Microstructure analysis on the dynamic behavior of marine clay in the South China Sea. Mar. Georesour. Geotechnol. 2020, 38, 349–362. [Google Scholar] [CrossRef]
  8. Yang, Q.; Ren, Y.; Niu, J.; Cheng, K.; Hu, Y.; Wang, Y. Characteristics of soft marine clay under cyclic loading: A review. Bull. Eng. Geol. Environ. 2018, 77, 1027–1046. [Google Scholar] [CrossRef]
  9. Zhu, C.; Jiao, X.; Cheng, S.; Li, Q.; Liu, K.; Shan, H.; Li, C.; Jia, Y. Visualising fluid migration due to hydrate dissociation: Implications for submarine slides. Environ. Geotech. 2020. [Google Scholar] [CrossRef]
  10. Guo, X.S.; Zheng, D.F.; Nian, T.K.; Lv, L.T. Large-scale seafloor stability evaluation of the northern continental slope of South China Sea. Mar. Georesour. Geotechnol. 2020, 38, 804–817. [Google Scholar] [CrossRef]
  11. Guo, X.S.; Nian, T.K.; Gu, Z.D.; Li, D.Y.; Fan, N.; Zheng, D.F. Evaluation methodology of laminar-turbulent flow state for fluidized material with special reference to submarine landslide. J. Waterw. Port Coast. Ocean. Eng. 2021, 147, 04020048. [Google Scholar] [CrossRef]
  12. Zhu, C.; Li, Z.; Chen, D.; Li, S.; Song, X.; Shan, H.; Jia, Y. Seafloor breathing helping forecast hydrate-related geohazards. Energy Rep. 2021, 7, 8108–8114. [Google Scholar] [CrossRef]
  13. Farahani, M.V.; Hassanpouryouzband, A.; Yang, J. Development of a coupled geophysical–geothermal scheme for quantification of hydrates in gas hydrate-bearing permafrost sediments. Phys. Chem. Chem. Phys. 2021, 23, 24249–24264. [Google Scholar] [CrossRef] [PubMed]
  14. Farahani, M.V.; Hassanpouryouzband, A.; Yang, J. Insights into the climate-driven evolution of gas hydrate-bearing permafrost sediments: Implications for prediction of environmental impacts and security of energy in cold regions. RSC Adv. 2021, 11, 14334–14346. [Google Scholar] [CrossRef]
  15. Huang, W.; Li, J.; Lu, Y.; Li, D.; Mou, Y.; Wu, X.; Li, Z. Mechanical Properties of Soft Soil considering the Influence of Unloading Stress Paths. Adv. Civ. Eng. 2021, 2021, 8813882. [Google Scholar] [CrossRef]
  16. Dai, X.; Xu, T.; Chen, J. Physical and Mechanical Properties of Deep Oceanic Sediments Cored from the Bottom of Challenger Deep, Mariana Trench. Geofluids 2021, 2021, 9109132. [Google Scholar] [CrossRef]
  17. Guo, X.S.; Nian, T.K.; Wang, Z.T.; Zhao, W.; Fan, N.; Jiao, H.B. Low-temperature rheological behavior of submarine mudflows. J. Waterw. Port Coast. Ocean. Eng. 2020, 146, 04019043. [Google Scholar] [CrossRef]
  18. Liu, X.; Zhang, M.; Zhang, H.; Jia, Y.; Zhu, C.; Shan, H. Physical and mechanical properties of loess discharged from the Yellow River into the Bohai Sea, China. Eng. Geol. 2017, 227, 4–11. [Google Scholar] [CrossRef]
  19. Lu, B.; Li, G.; Huang, S.; Li, C. Physical properties of sediments on the Northern Continental Shelf of the South China Sea. Mar. Georesour. Geotechnol. 2006, 24, 47–60. [Google Scholar] [CrossRef]
  20. Guo, X.; Nian, T.; Zhao, W.; Gu, Z.; Liu, C.; Liu, X.; Jia, Y. Centrifuge experiment on the penetration test for evaluating undrained strength of deep-sea surface soils. Int. J. Min. Sci. Technol. 2022, 32, 363–373. [Google Scholar] [CrossRef]
  21. Luo, T.; Song, Y.; Zhu, Y.; Liu, W.; Liu, Y.; Li, Y.; Wu, Z. Triaxial experiments on the mechanical properties of hydrate-bearing marine sediments of South China Sea. Mar. Pet. Geol. 2016, 77, 507–514. [Google Scholar] [CrossRef]
  22. Sun, A.; Yang, G.; Yang, Q.; Qi, M.; Wang, N.; Ren, Y. Experimental investigation of thermo-mechanical behaviors of deep-sea clay from the South China Sea. Appl. Ocean. Res. 2022, 119, 103015. [Google Scholar] [CrossRef]
  23. Abuel-Naga, H.M.; Bergado, D.T.; Bouazza, A.; Ramana, G.V. Volume change behaviour of saturated clays under drained heating conditions: Experimental results and constitutive modeling. Can. Geotech. J. 2007, 44, 942–956. [Google Scholar] [CrossRef]
  24. Delage, P.; Sultan, N.; Cui, Y.J. On the thermal consolidation of Boom clay. Can. Geotech. J. 2000, 37, 343–354. [Google Scholar] [CrossRef]
  25. Hattab, M.; Hammad, T.; Fleureau, J.M.; Hicher, P.Y. Behaviour of a sensitive marine sediment: Microstructural investigation. Géotechnique 2013, 63, 71–84. [Google Scholar] [CrossRef]
  26. Low, H.E.; Lunne, T.; Andersen, K.H.; Sjursen, M.A.; Li, X.; Randolph, M.F. Estimation of intact and remoulded undrained shear strengths from penetration tests in soft clays. Géotechnique 2010, 60, 843–859. [Google Scholar] [CrossRef]
  27. Silva, A.J.; Moran, K.; Akers, S.A. Stress–strain–time behavior of deep sea clays. Can. Geotech. J. 1983, 20, 517–531. [Google Scholar] [CrossRef]
  28. Lee, H.J. The role of laboratory testing in the determination of deep-sea sediment engineering properties. In Deep-Sea Sediments; Springer: Boston, MA, USA, 1974; pp. 111–127. [Google Scholar]
  29. Cai, Y.; Hao, B.; Gu, C.; Wang, J.; Pan, L. Effect of anisotropic consolidation stress paths on the undrained shear behavior of reconstituted Wenzhou clay. Eng. Geol. 2018, 242, 23–33. [Google Scholar] [CrossRef]
  30. Guo, X.; Nian, T.; Wang, D.; Gu, Z. Evaluation of undrained shear strength of surficial marine clays using ball penetration-based CFD modelling. Acta Geotech. 2022, 17, 1627–1643. [Google Scholar] [CrossRef]
  31. Wang, L.; Lei, H.; Bo, Y.; Jiang, M.; Wang, P.; Liu, M. Geotechnical behavior of soft dredger fill and deep sea soft clay. In IOP Conference Series: Earth and Environmental Science; IOP Publishing: Bristol, UK, 2020; Volume 570, p. 062036. [Google Scholar]
  32. Puzrin, A.; Frydman, S.; Talesnick, M. Normalized nondegrading behavior of soft clay under cyclic simple shear loading. J. Geotech. Eng. 1995, 121, 836–843. [Google Scholar] [CrossRef]
  33. Puzrin, A.M.; Burland, J.B. Non-linear model of small-strain behaviour of soils. Geotechnique 1998, 48, 217–233. [Google Scholar] [CrossRef]
  34. Prevost, J.H.; Keane, C.M. Shear stress-strain curve generation from simple material parameters. J. Geotech. Eng. 1990, 116, 1255–1263. [Google Scholar] [CrossRef]
  35. Wu, C.S.; Hong, Y.S.; Lin, H.C. Axial stress–strain relation of encapsulated granular column. Comput. Geotech. 2009, 36, 226–240. [Google Scholar] [CrossRef]
  36. Liu, J.; Chang, D.; Yu, Q. Influence of freeze-thaw cycles on mechanical properties of a silty sand. Eng. Geol. 2016, 210, 23–32. [Google Scholar] [CrossRef]
  37. ASTM D421-85; Standard Practice for Dry Preparation of Soil Samples for Particle-Size Analysis and Determination of Soil Constants (Withdrawn 2016). ASTM International: West Conshohocken, PA, USA, 2007.
  38. ASTM D2487-17; Standard Practice for Classification of Soils for Engineering Purposes (Unified Soil Classification System). ASTM International: West Conshohocken, PA, USA, 2017.
  39. Zhang, C.; Pan, Z.; Yin, H.; Ma, C.; Li, X. Influence of clay mineral content on mechanical properties and microfabric of tailings. Sci. Rep. 2022, 12, 10700. [Google Scholar] [CrossRef]
  40. Daha, B.K.; Zheng, J.J.; Zhang, R.J.; Song, D.B. Enhancing the mechanical properties of marine clay using cement solidification. Mar. Georesour. Geotechnol. 2019, 37, 755–764. [Google Scholar]
  41. Duncan, J.M.; Chang, C.Y. Nonlinear analysis of stress and strain in soils. J. Soil Mech. Found. Div. 1970, 96, 1629–1653. [Google Scholar] [CrossRef]
Figure 1. Sampling site (modified from [6]).
Jmse 10 01142 g001
Figure 2. GDS Triaxial testing system. (a) Physical apparatus; (b) Schematic diagram.
Jmse 10 01142 g002
Figure 3. Grain size distribution curve of soil samples.
Jmse 10 01142 g003
Figure 4. Plasticity diagram (ASTM D2487). Note: CL: Low-plasticity clay; CLO: Low-plasticity organic clay; ML: Low-plasticity silt; MLO: Low-plasticity organic silt; CH: High-plasticity clay; CHO: High-plasticity organic clay; MH: High-plasticity silt; MHO: High-plasticity organic silt.
Jmse 10 01142 g004
Figure 5. X-ray diffraction curves of soil.
Jmse 10 01142 g005
Figure 6. Microstructure of soil by SEM tests.
Jmse 10 01142 g006
Figure 7. Stress−strain curves in CU test. (a) Deviatoric stress-strain behaviour; (b) Normalized deviator stress-strain behaviour.
Jmse 10 01142 g007
Figure 8. Effective stress paths in CU test.
Jmse 10 01142 g008
Figure 9. Schematic diagram of the interface mechanical interaction between soil particles.
Jmse 10 01142 g009
Figure 10. Pore pressure-strain curves in CU test.
Jmse 10 01142 g010
Figure 11. Relationship between (σ1σ3)ulti and σ3.
Jmse 10 01142 g011
Figure 12. Normalized stress–strain curves with ( σ 1 σ 3 ) ulti adopted as the normalized factor.
Jmse 10 01142 g012
Figure 13. Predicted stress–strain curves with ( σ 1 σ 3 ) ulti   adopted as normalized factor. (a) Normalized deviator stress-strain behaviour; (b) Deviatoric stress-strain behaviour.
Jmse 10 01142 g013
Table 1. Basic properties of soil samples.
PropertyValue
Water content, w (%)46.4
Density, ρ (g/cm3)1.517
Initial void ratio, e01.63
Liquid limit, LL (%)59.8
Plastic limit, PL (%)34.8
Plasticity index, PI (%)25
Specific gravity, Gs2.73
Table 2. Different particle diameter indices of soil samples.
Particle Diameter IndicesValue
Effective particle diameters, d10 (mm)0.004
Continuous particle diameters, d30 (mm)0.008
The median of particle diameters, d50 (mm)0.021
Control of particle diameters, d60 (mm)0.03
Table 3. Compositions of clay minerals.
CompositionPercentage (%)
Quartz40.9
Muscovite29.3
Calcite22.5
Albite6.6
Clinochlore0.623
Table 4. Fitting parameters.
σ 3 / kPa a i b i ( σ 1 σ 3 ) ulti / kPa R 2
1000.018150.0081344.390.99825
2000.010260.00282100.570.99884
3000.01026−0.01091167.740.97516
Publisher’s Note: MDPI stays neutral with regard to jurisdictional claims in published maps and institutional affiliations.

