Review

State-of-the-Art Review of Vortex-Induced Motions of Floating Offshore Wind Turbine Structures

1
SINTEF Ocean, P.O. Box 4762 Torgarden, 7465 Trondheim, Norway
2
Department of Marine Technology, Faculty of Engineering, NTNU, 7491 Trondheim, Norway
*
Author to whom correspondence should be addressed.
J. Mar. Sci. Eng. 2022, 10(8), 1021; https://doi.org/10.3390/jmse10081021
Submission received: 24 June 2022 / Revised: 9 July 2022 / Accepted: 15 July 2022 / Published: 26 July 2022
(This article belongs to the Special Issue Recent Advances in Floating Structures)

Abstract

:
The motivation for this study is the fast development of floating offshore wind energy and the immature methodology and engineering practice related to predictions of vortex-induced motions (VIM). Benefiting from the oil and gas industry, in the past several decades, extensive knowledge and experience on vortex-induced vibrations (VIV) on slender marine structures has been gained. As the learnings from these efforts should be transferred and adapted to the renewable energy industry, a state-of-the-art review on influential VIM research has been carried out in this paper, focusing on: (1) engineering practice, (2) model tests, (3) numerical calculation, and (4) field measurement. Engineering gaps and potential research topics are identified as future work.

1. Introduction

The ‘Green Shift’ from fossil energy (coal, oil and natural gas) to renewable energy (sunlight, wind, waves and tide) is now a global trend [1]. DNV forecasts that by 2050, the installed floating global wind capacity will have grown from today’s 100 megawatts (MW) to over 264 gigawatts (GW) [2,3], so that 2% of the world’s electricity demand can be supplied by cost-efficient and dependable floating offshore wind; see Figure 1. Floating offshore wind is considered to be a viable solution at water depths exceeding 50 to 60 m with abundant wind resources. As a fast-evolving technology, it has the potential for less foundation material, shortened installation cycle and decommissioning, and additional wind power generation.
Floating wind sites are under investigation in water depths exceeding 100 m. For export substations in such water depths, DNV indicates that floating foundations are considered commercially more attractive than jacket foundations. However, to fully take up the potential, floating wind needs to overcome major challenges related to costs and confidence. New risks can be managed by using off-the-shelf bottom fixed turbines and well-known oil and gas technology for floaters (see Figure 2).
The floating offshore wind turbine (FOWT) is a fully coupled system: aerodynamics, hydrodynamics, structural dynamics, electrical dynamics, mechanical systems and controller, and it will move in all degrees of freedom under the influence of environmental loads such as wind, waves and currents [4,5,6]. Dynamic electrical cables are crucial in exporting power from an FOWT. Understanding, modeling and simulating the fluid–structure interaction problems of FOWT are vital to ensure the operability, safety, and sustainability of the floating offshore wind system.
Vortex-induced motions (VIM) of the hull can affect the mooring system design as well as the electrical cable design in terms of both extreme loading and fatigue loading. VIM could have three primary effects on the mooring design [7,8,9]:
  • Increase in the average in-line drag coefficient.
  • Large low-frequency VIM motion amplitudes relative to the total floating substructure responses.
  • Additional low-frequency oscillating mooring line tensions.
Fluid–structure interaction (FSI) problems such as vortex-induced vibrations (VIV) and VIM need to be considered in the design, transportation, installation and operation of FOWTs. Moreover, the unnecessary conservatism (Factor of Safety—FoS of 20–30 when considering VIV in present design practice) should be reduced to contribute to cost-effective design.
However, industry has not yet had the opportunity to share and review the collective data/knowledge on VIM in order to establish a common understanding of the problem, and an industry consensus on how to deal with VIM in design is still lacking.
Figure 1. Floating wind will deliver 2% of the world’s power supply until 2050. Source: IEA web (2020). DNV GL Energy Transition Outlook [2].
Jmse 10 01021 g001
Figure 2. Examples of typical floating offshore wind turbines, sketch inspired by drawing of DNV.
Jmse 10 01021 g002

2. Theoretical Background

VIV and VIM are both resonant fluid–structure interaction phenomena. VIM could be considered as a special subset of VIV, represented by rigid body motion, small mass ratio and aspect ratio, and six degrees-of-freedom (DOFs); see Figure 3b [10,11]. When fluid flows past a cross-section of a slender cylinder (illustrated in Figure 3a), the energy provided by the fluid flow is balanced by the energy dissipated by damping acting on the system. A self-limited oscillation of amplitude close to the dimension of a cross-section in the cross-flow (CF) direction is triggered by the frequency of vortex shedding, which is approximately equal to one of the natural frequencies involved. Furthermore, the cross-section is free to move in both in-line (IL) and CF directions. Floaters such as spars and semi-submersibles are susceptible to VIM among with other environmental loads, while power cables connecting the offshore wind turbines to the grid can experience complex environmental loads, including VIV, wave loads and floater motions (e.g., VIM) acting on their top ends.

2.1. Reynolds Number

The Reynolds numbers ( R e ) is the ratio of inertial forces to viscous forces within a fluid, and it is defined as:
R e = U D ν
where U is the free stream velocity, D is the characteristic length, and ν is the kinematic viscosity. VIM is known to occur under larger Reynolds numbers than VIV, since the characteristic length of floating units and its sub-structures are significantly larger than for slender marine structures such as marine risers, subsea cables and pipelines.

2.2. Strouhal Number

The Strouhal number ( S t ) is the dimensionless proportionality constant given as the ratio between the predominant frequency of vortex shedding and the diameter of the cylinder divided by the free stream velocity:
S t = f s t D U
where f s t = S t U / D is the vortex shedding frequency of a stationary cylinder in uniform flow, which means a full cycle of vortex shedding process. The Strouhal number is sensitive to the Reynolds number and surface roughness ratio. Figure 4 presents the Strouhal number versus Reynolds number relationship for a circular cylinder [12]. The so-called ‘camel hump’ (abrupt increase of S t ) develops in the high Re ( R e > 1 × 10 5 ) region.

2.3. Keulegan–Carpenter Number

The Keulegan–Carpenter ( K C ) number is defined as K C = U m T / D , where U m is the amplitude of the oscillatory flow velocity, T is the oscillatory flow period and D is the diameter of the cylinder. In oscillatory flow, the ratio between Reynolds number and Keulegan–Carpenter number is a constant β = R e m a x / K C = D 2 / υ T . Drag and inertia coefficients for smooth cylinders as a function of K C number were investigated by [15]. The vortex flow regimes around a circular cylinder subject to oscillatory flow and undergoing CF vibrations were studied by [16]. The flow of vortices was visualized by using an aluminium powder technique.

2.4. Reduced Velocity

The reduced velocity ( U r ) is the normalized flow velocity defined as:
U r = U T n D = U D f n
where T n and f n are the natural period and frequency of a free oscillation system, respectively. VIM response amplitude ratios are presented as a function of reduced velocity and used as design curves. It is important to note that there are significant Reynolds number effects, as illustrated in Figure 5.
For an FOWT undergoing six DOF motions, the definition of reduced velocity is complicated. Natural periods in the transverse/cross-flow direction in still water as a function of different headings and offsets are desired to define the reduced velocity due to the non-linear mooring system and hydrostatic stiffness [8,17]. It should be noted that the IL and CF directions are defined with respect to the incoming current direction.
Figure 5. Dimensionless maximum CF VIV amplitude ratio vs. Reynolds number [18,19,20,21,22,23,24,25,26,27,28].
Jmse 10 01021 g005

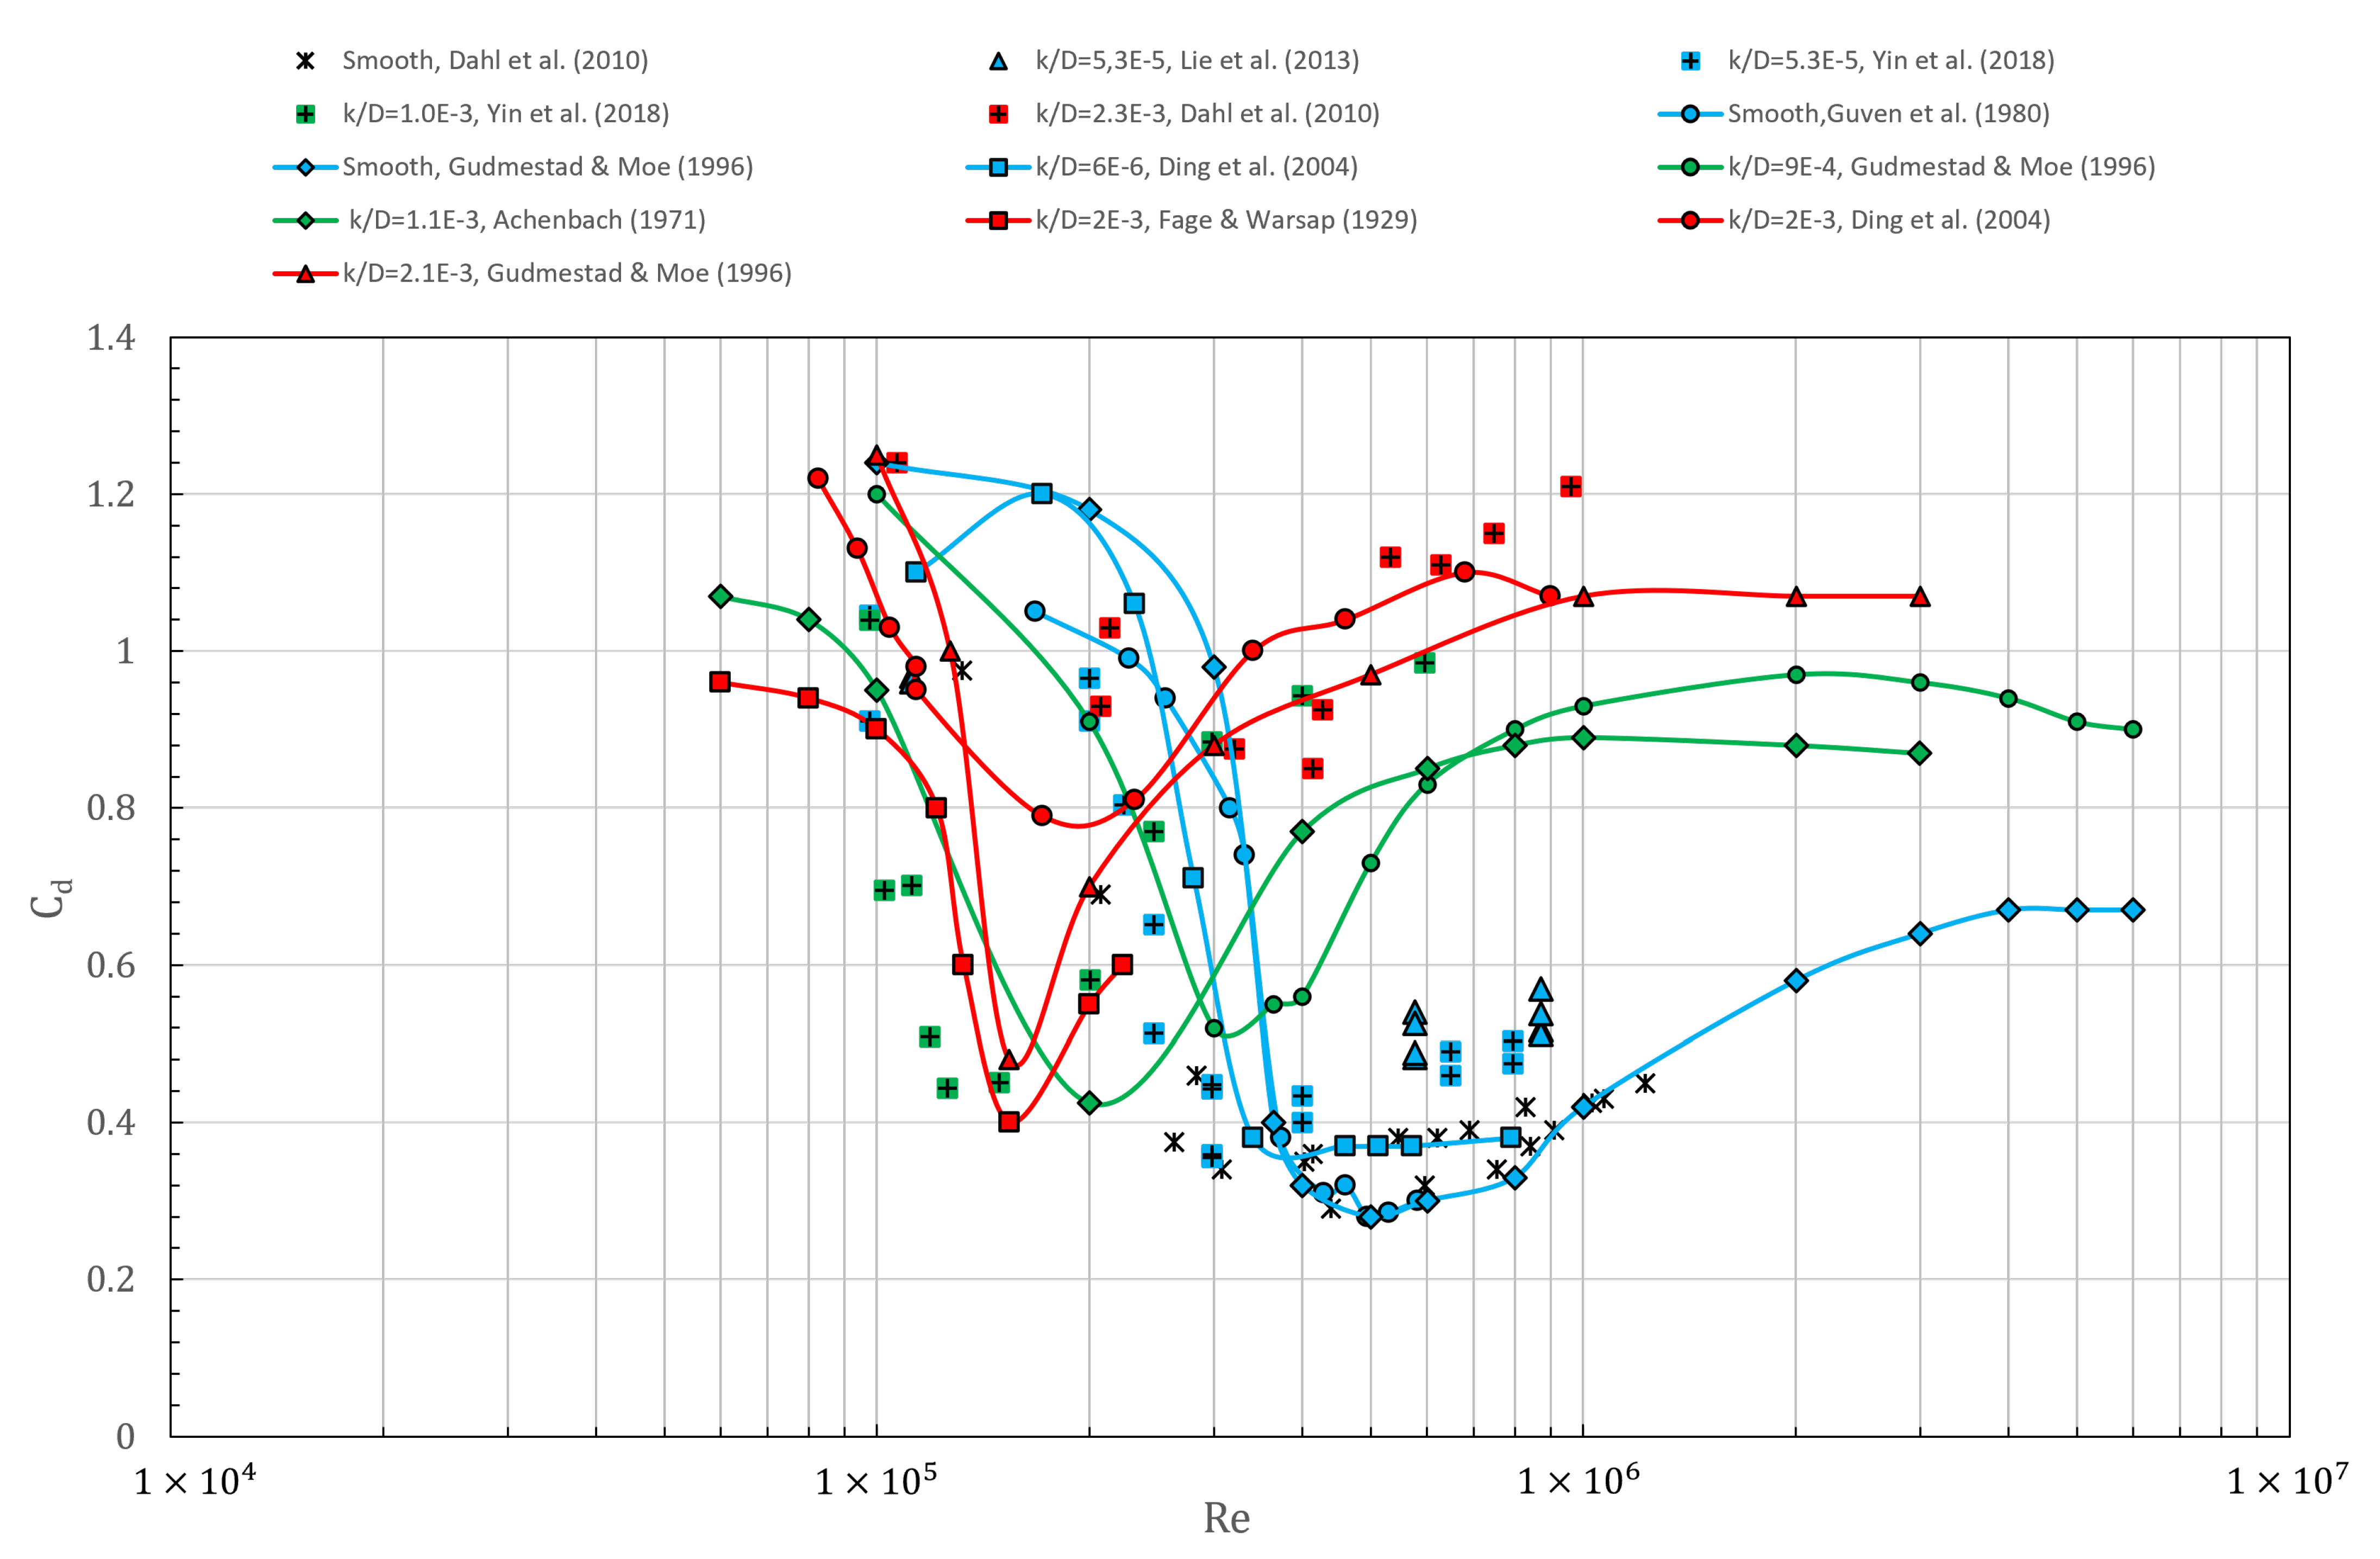
2.5. Drag Coefficient

The mean drag force on the floating unit is given by [8,10]:
F d = C d 1 2 ρ U 2 A p
where C d is the mean drag coefficient, ρ is the density of fluid, A p is the projected area. In the lock-in condition, the drag coefficient is amplified due to large CF amplitude [29].
‘Drag crisis/bucket’ is the region where the boundary layer flow transitions from the laminar regime to the turbulent regime for a smooth, fixed, circular cylinder [30]. Figure 6 illustrates this process. In the sub-critical region, the boundary layer is laminar, and it separates ahead of the 90° position, which leads to a wide wake and high drag; see Points 1–4. In the critical region, the boundary layer is still laminar, but the separation is followed by turbulent mixing and flow re-attachment. At 120°, the flow separates again, but the wake width is reduced with a low drag, see point 5, and the corresponding Reynolds number for a smooth circular cylinder is around 2 × 10 5 . In the post-critical region, the boundary layer is turbulent ahead of the separation point and the wake width increases, leading to an increased drag [31].
Figure 7 shows the mean drag coefficients extracted from experiments on a stationary circular cylinder with varying Reynolds numbers and surface roughness ratios.

2.6. Vortex Shedding

Vortex sheddings of large FOWTs are complicated. The interaction between surface wave and current and multi-directional current profiles have to be taken into account. A low aspect ratio introduces end effects on vortex shedding, which is different from the assumption of vortex shedding from a cross-section of an infinitely long cylinder. For semi-submersibles, it is even more complex; in addition to the mentioned issues, there are different headings of currents and waves, and the wake interference between hull substructures such as columns and pontoons need more investigation.

2.7. Mass Ratio

The mass ratio is defined as
m * = m ρ 1 4 π D 2
where m is the mass per unit length.

2.8. Froude Number

The Froude number is defined as:
F r = U g L
where g is the acceleration of gravity, and L is the characteristic length. Wave forces are important for floaters piercing the free surface and the submerged floaters with typical drafts of FOWTs. The challenge is that lab tests can not fulfil both Froude scaling and Reynolds scaling with the same geometric similarity simultaneously.

2.9. Aspect Ratio

Compared to marine risers, pipelines and cables, floating units experiencing VIM have relatively small aspect ratios ( A R = L / D ). Studies on the influences of aspect ratio on VIM are limited [11]. It should be noted that the Strouhal number increases with aspect ratio ( A R ) [37,38]; this is due to that the von Kármán vortex shedding, which was found to be valid only when A R > 2.0 [39,40]. A critical aspect ratio of ( A R ) c r i t 2.0 was suggested [39,41], which needs to be considered especially for floaters with low aspect ratios. Another effect of low aspect ratio is due to the free end. There have been discussions on whether the trailing vortices exist or not due to the free end. Ref. [42] investigated the free end effects on VIV of floating circular cylinders with very low aspect ratios. It was concluded that the free-end structures only affected the VIV behaviour of the cylinder piercing the free surface when A R < 0.5 .

2.10. Damping

Damping related to an offshore wind turbine has been discussed and summarized in [43,44,45,46]:
  • Aerodynamic damping;
  • Control damping;
  • Mass or liquid dampers;
  • Structure damping;
  • Hydrodynamic damping;
  • Soil damping.
Similar to VIV responses, for the VIM responses of the FOWT, the structural damping is important to determine the amplitude ratio and the ‘lock-in’ range [47,48]. The explicit structural damping ratio used for structure design lies within 1–5% of the critical damping, depending on the included damping components. The lower damping ratio values were typically recommended for fatigue design [49]. However, the lower values were considered to be more conservative than the actual damping level, therefore, a direct estimation of structural damping was proposed by [46].

2.11. Response Amplitude

The displacement amplitude ratio represents the non-dimensional response amplitude:
A D n o m = A I L / C F D = 2 σ I L / C F D
where σ I L / C F is the standard deviation of the displacement in the in-line or cross-flow direction.
Understanding of the Reynolds number and surface roughness ratio k / D effects on VIV response amplitude has been improved due to the development of experimental techniques. Generally, for sub-critical Reynolds numbers (< 10 5 ), the CF VIV response amplitude ratio increases with the Reynolds number [50,51,52,53]; as the Reynolds number further increases, the VIV response amplitude ratio for super-critical or even higher Reynolds numbers are significantly lower than that at sub-critical Reynolds numbers [21,22].

2.12. Response Frequency

In a state-of-the-art review of VIM in 2012, ref. [11] compared the frequency ratio between IL and CF responses f I L / f C F qualitatively; see Table 1. Generally, both f C F / f n and f I L / f C F vary with reduced velocity. A qualitative comparison between VIV responses of long cylinder and VIM responses of short cylinder was carried out by [11], and based on the limited data, no evidence of a lower branch in VIM motions was found at that time. This conclusion was supported by other experimental results as well [53].
The natural period is influenced by the stiffness provided by the mooring system. High stiffness in shallow water helps to reduce VIM due to the low reduced velocities outside the lock-in region. A large VIM response can cause significant tension forces in mooring lines. While in deep water, VIM effects on mooring lines are less, since the mooring stiffness generally decreases [8].
Due to the large characteristic dimensions, VIM exhibits much lower response frequencies than VIV. Table 2 gives an indication of the lowest natural frequencies for current types of floating turbines with turbines above 2 megawatts (MW) [54]. It is seen that the natural frequencies of surge and sway motions are significantly lower than the other types of responses.

2.13. Turbulence Intensity

Turbulence intensity is a scale parameter characterizing the turbulence expressed as a fraction of the mean velocity. An idealized flow with absolutely no fluctuations in speed or direction would have a turbulence intensity (I) value of 0. The turbulence intensity can be expressed as:
I = u U ¯
where u is the root-mean-square of the turbulent velocity fluctuations, and U ¯ is the mean velocity. The high levels of turbulence in laboratories such as ocean basins or towing tanks can affect VIV/VIM responses. However, the structure and intensity of turbulence in ocean currents and the potential impact of current turbulence on VIM remains an uncertainty for further observation and investigation. Correlation between field measurements and model tests may help to improve the understanding [8].

3. Engineering Practice in Relation to VIM

Spar platforms have relatively large aspect ratios (draft over diameter). They are permanently anchored to the seabed vertically by a spread moored system. There exist several variations of spar platforms [55]. The Classic Spar is a cylindrical deep draft floater. A Truss Spar has a buoyant cylindrical upper section (hard tank), which provides buoyancy, and a lower section composed of a space frame truss. The Cell Spar consists of several smaller diameter tubes joined together in contrast to a single large diameter tube forming the hull.
Spar-type floaters have been deployed by offshore floating wind turbines, such as Hywind Scotland; see Figure 8a. It should be noted that the dimensions are much smaller than a typical spar platform in the oil and gas industry.
Semi-submersibles (semi) are floating structures with multi-legs and a large deck. These legs are interconnected at the bottom underwater with horizontal pontoons, which provide buoyancy force [56]. Some of the earlier semis resemble the ship form with twin pontoons having a bow and a stern. This configuration was considered desirable for relocating the unit from drilling one well to another either under its own power or being towed by tugs. Early semis also included significant diagonal cross bracing to resist the prying and racking loads induced by waves. The introduction of heavy transport vessels that permit the dry tow of mobile offshore drilling units (MODUs), the need for much larger units to operate in deep water, and the need to have permanently stationed units to produce from an oil and a gas field resulted in the further development of the semi concept. The next generation semis typically appear to be a square with four columns and the box- or cylinder-shaped pontoons connecting the columns. The box-shaped pontoons are often streamlined, eliminating sharp corners for better station keeping. Diagonal bracing is often eliminated to simplify construction.
Semi is also one type of floater for FOWT, as illustrated in Figure 2. A design of an FOWT with a semi-submersible floater is shown in Figure 8b.
Figure 8. Spar and semi-submersible type FOWTs. (a) The Hywind Scotland wind park is located 25 km east of Peterhead in Scotland. Courtesy of Equinor. (b) The 12 MW INO WINDMOOR FOWT [57].
Jmse 10 01021 g008
There is no well-established, concrete analytical method for VIM responses of FOWTs. Since VIV/VIM is a strongly non-linear phenomenon, model testing has often been used to determine the hull VIM responses and calibrate the numerical simulations. It is clear that the industry needs widely accepted and consistent practices for addressing spar VIM in order to ensure the integrity of existing and future floater designs, following up the transition from the oil and gas industry to the renewable energy industry. However, the industry has not yet had the opportunity to share and review the collective data/knowledge on VIM in order to establish a common understanding of the problem and an industry consensus on how to deal with VIM in design. In the standard of the International Organization for Standardization ISO19901-7 [58], for instance, ‘a concrete method of assessing VIM displacement is not represented in the standard document, though the requirement on the VIM demands for an assessment on the basis of a proper way’ [59]. In this section, following the standards and regulations, the recommended practices are discussed. The existing regulations and recommended practice accounting for VIM are fragmentary [7,8,11,58,60,61,62,63]:
  • DNV- RP-C205 Environmental Conditions and Environmental Loads’ [63] provides information on current modeling as well as VIV and VIM; for the latter two, see also section ’Dynamics and their Influence on Wind Turbine Performance’.
  • DNV- ST- 0119 Floating wind turbine structures’ [62] gives approaches to modeling wind and waves.
  • ISO19901-7 Specific requirements on station-keeping systems for floating offshore structures and mobile offshore units’ [58]
The VIM on floating structures is often treated by design curves. A typical VIM design curve gives the design amplitude ratio as a function of reduced velocity. Figure 9 shows an example of a VIM design curve of a typical spar of FOWTs.
For semi-submersibles, the current heading and draft are important parameters [65,66]. A design guidance of a Deep Draft Semi-submersible® considering VIM responses from model tests was derived [65]. This guidance was found to lead to very conservative estimates of VIM [67], which was mainly due to Reynolds number effects.
API Recommended Practice 2SK: Design and Analysis of Stationkeeping Systems for Floating Structures [8] identified the following gaps with regard to VIM:
  • The duration for peak current and resulting VIM can be much longer than the peak storm duration.
  • The calibration of factor of safety (FoS) for mooring design does not include the spar VIM condition and the uncertainties associated with spar VIM. Consequently, sensitivity checks may be warranted.
Both experimental and numerical research activities have been carried out to investigate the VIM responses during the past decades; however, the understanding of VIM and engineering practice still need further improvements.

4. Review of VIM Model Tests

Because there is no established analytical method for determining FOWT motion responses undergoing VIM, model testing is recommended to determine VIM amplitude, response frequency and drag coefficient in design. There are two recommended practices for model tests: at either super-critical or sub-critical Reynolds numbers in a towing tank. Extensive VIM model tests were carried out for the oil and gas industry as well as recently the renewable energy industry. The target test specimens include circular cylinders [19,21,22,23,68], spars [30,59,69,70,71,72] and semi-submersibles [65,67]. The models were either submerged in water in a horizontal position or fully submerged/floating, surface piercing vertically.
This section reviews selected influential VIM model tests, outlining the state-of-the-art experimental techniques on VIM. The main dimension parameters of typical floaters of FOWTs are shown in Figure 10.

4.1. Model Tests on Spar

MARIN [50] carried out several model test programs of a truss spar to evaluate the VIM responses and optimize the strake configuration. The importance of Reynolds number effects were pointed out, and roughness on the hard tank of the spar could minimize such effects. It was also suggested that the detailed modeling of appendages (pipes, mooring chains, cathodic protection anodes, fairleads, etc.) could influence VIM motions in addition to the damping from attached structures such as the truss on a truss spar. As a follow-up study [70], the wave effects on the VIM motions of a truss spar platform was studied at the MARIN Offshore Basin. It was observed that waves in line with the current direction generally reduced VIM responses, while for the waves in the transverse direction, the effects were not consistent.
Chevron and Shell performed a series of spar VIM experiments in three different facilities—Force Technology in Denmark, the David Taylor Model Basin in Bethesda Maryland and UC Berkeley in California—to investigate the Reynolds number effects and hull appurtenances on spar VIM for a vertically moored 6 DOF truss spar hull model with strakes [30]. For spar with strakes, when the reduced velocity is smaller than 7, there were very little difference between the sub-critical and super-critical Reynolds number VIM tests. Another important finding was that strake’s mitigation effectiveness was very dependent on heading, even without chains and pipes. The performance of the strakes is influenced by the presence of the pipes and chains significantly, and the effectiveness with respect to the suppression of VIM is also dependent on the heading.
The effects of initial roll or pitch angles on the VIM amplitudes of a floating circular cylinder with a low aspect ratio ( m * = 1 , A R = 1.5 ) were investigated experimentally [74], with Reynolds numbers from 1.2 × 10 4 to 1.0 × 10 5 . The reduced velocity varied from 1 to 12. The results of VIM amplitudes showed that the yaw motion was affected by the initial pitch angle. The initial roll or pitch angle did not affect the VIM amplitudes for the motions in the in-line, transverse and vertical directions nor the roll and pitch motions.
As a result of the development of the offshore wind industry in Japan, extensive VIM research work have been performed by the Maritime Bureau, Ministry of Land, Infrastructure, Transport and Tourism [59,75,76,77]. VIM tests on two spar models with different dimensions, a large model ( D = 1.5 m, L = 5.0 m) and small model ( D = 0.3 m, L = 1.0 m), were carried out at The National Maritime Research Institute (Japan) [75,76]. The corresponding Reynolds numbers were at super-critical and sub-critical regions. The comparisons clearly illustrated the Reynolds number scaling effect. It was necessary to carry out model tests at super-critical Reynolds numbers, in which A C F , m a x 0.6–0.7D, while A I L , m a x 0.2 A C F , m a x . The drag coefficient of the spar in the super-critical Reynolds number region was about 0.4–0.6. Two mono-column models with much smaller aspect ratios ( A R ) were tested with the same test set-up at the same facility [77]. The VIM amplitude and lift coefficient of a fixed floater were checked, which were used as input for the wake oscillator model. The most recent publication [59] summarized the experimental work and presented the time domain simulation using a wake oscillator model. The inputs such as the new increased ratio of the drag coefficient, lift coefficient on a fixed floater and modified wake frequency were calibrated. The comparison of VIM amplitude in the CF direction showed good agreement.
Relevant VIM research articles have been continuously published in the past decade led by Rodolfo T. Gonçalves, initially affiliated as University of São Paulo [78,79,80], and then University of Tokyo [42,73,81,82]. An overview of principle effects that could influence the VIM of spar and mono-column floaters was presented in [78]. It was pointed out that both model tests and computational fluid dynamics (CFD) could be used to evaluate the VIM suppression devices. Another finding was that waves and external damping could influence the VIM responses. VIM experiments on floating circular cylinders with low aspect ratios ( A R : 0.2, 0.3, 0.4, 0.5, 0.75, 1.0, 1.5, 2.0, m * = 1 ) were carried out at a recirculating water channel at the Fluid & Dynamics Research Group Laboratory facility of the University of São Paulo, Brazil [81]. The VIM amplitudes in both IL and CF directions decreased with the decreasing aspect ratio. The results of drag and lift forces also showed the same behavior, confirming the reduction in amplitudes with decreasing aspect ratio. The heave plate effects on the VIM amplitudes were further investigated [82]. VIM experiments on a floating circular cylinder with aspect ratio A R = 2 were carried out with heave plates of various dimensions (diameter and height) appended. In general, the heave plate with larger dimensions mitigates the VIM amplitudes more effectively. Ref. [42] studied the VIM responses of single floating circular cylinders with low aspect ratios and different free-end corner shapes ( r / R = 0 , 0.25 , 0.5 , 1.0 , m * = 1 , A R = 0.5 ). Both the CF and IL VIM amplitude ratio were the highest for the semi-sphere case ( r / R = 1.0 ). The amplitude ratio behaviors were practically the same for the other radius values ( 0.0 r / R 0.5 ); the difference was observed in the high reduced velocity larger than 7, in which the maximum amplitudes decreased by increasing the corner radius.
NREL’s 5 MW OC3 spar FOWT model (1:50) was tested in the ocean basin of Shanghai Jiao Tong University [83]. A complete model including spar, wind turbine, and mooring system was manufactured. The test matrix included wind, waves and combined wind and waves. The tests followed the strategy in MARIN’s FOWT test [84] but with a compromise of Froude scaling for the platform tests and Reynolds scaling for the wind turbine. VIM was not investigated in the model test; actually, for the platform, it is also challenging when consider Reynolds number effects (Reynolds scaling) and surface wave effects (Froude scaling). One observation from the measurements was that the wind loads had a clear influence on the dynamic responses of the mooring system.
VIV experiments of a moored spar were performed by [85] in a recirculating water tunnel. Combined IL and CF oscillations were observed, and the response frequency ratio was equal to 2.0, i.e., f I L = 2 f C F , resulting in the classic figure eight orbits. The lower end of the spar model had a counterclockwise direction, while the upper end had a clockwise direction. The hypothesis that the region with a counterclockwise orbital motion is the region within which the cylinder is excited by the flow was validated. It indicated that helical strakes should be placed in the region with counterclockwise orbital motions.
The first model of Hywind Demo was tested in the SINTEF Ocean’s ocean basin [86]. Towing tests of the Hywind Scotland floating wind turbine model were carried out at MARINTEK’s towing tanks [87]. The model scale was 1:40, and two different draughts (61 m and 76 m) were tested. The objective was to find the lowest threshold speed where VIM was triggered.
As a summary of research topics for VIM of spar/cylindrical floaters, the followings have been focused on:
  • Reynolds number effects;
  • Strake mitigation efficiency;
  • Response frequency ratio;
  • Coupling between VIM and roll, pitch;
  • Effects of hull appurtenances.

4.2. Model Tests on Rigid Circular Cylinders at High Reynolds Numbers

The dimensions of floaters of a floating wind turbine are significantly larger than those of the marine risers and subsea pipelines, resulting in large Reynolds numbers. For spar with diameters of 10–15 m and the current velocities of 1 to 2.5 m/s, the corresponding Reynolds numbers are in the range of 10 6 to 3.8 × 10 7 . Therefore, VIV model tests on a circular cylinder at high Reynolds numbers are relevant for FOWT VIM research.
There exist a handful VIV model tests at high Reynolds numbers (> 2 × 10 5 ) [18,19,21,22,23,88], providing more realistic hydrodynamic parameters (drag coefficients, lift coefficients, excitation coefficients, added mass coefficients) and response characteristics (amplitude, frequency). High Reynolds number VIV tests are necessary to qualify the prototype mitigation devices such as strakes, fairings and grooves, and investigate effects from surface roughness and auxiliary lines. High Reynolds number VIV tests shed light on the Reynolds number scaling effects, reducing uncertainties in the design process.
The VIV test set-up could either be vertical (Figure 11a) or horizontal (Figure 11b); see the two full-scale VIV test rigs in the towing tanks of SINTEF Ocean in Figure 11. System stiffness of free oscillation tests is provided by spring packages. The driving force of forced oscillation tests is provided by a hydraulic system. By locking the rig and model, stationary tests could be performed. End plates are used to avoid 3D effects from both ends of the test model and surface wave effects. The incoming uniform current is simulated by towing the carriage at different speeds.
Key results from the free oscillation tests are the response amplitude and frequency. Testing at a sub-critical Reynolds number regime is acceptable to a certain extent and slightly conservative. The response of flexible pipes was reviewed by [52], when the Reynolds number ranged from 10 3 to 2 × 10 5 . It was found that the response amplitude increased with an increased Reynolds number. At large reduced velocities ( U r > 7 ), the sub-critical tests will yield a slightly higher amplitude ratio [30], while [19,21,22] reported significant differences of amplitude ratio between sub-critical and super-critical Reynolds numbers. Figure 5 summarizes selected experimental data that illustrate the Reynolds number and surface roughness effects on the CF VIV amplitude ratio. The maximum amplitude ratios within a certain Reynolds number range obtained from different experimental works are presented, and a clear decreasing trend is seen from Reynolds numbers of 10 5 to 10 6 . When the Reynolds number is larger than 5 × 10 5 , A C F , m a x is around 0.5 D to 0.6 D [22,23].
Empirical numerical VIV prediction tools [89,90,91,92] need hydrodynamic coefficients and response characteristics (amplitude, frequency) at prototype Reynolds numbers. ExxonMobil performed full-scale Re number VIV model tests on a rigid bare riser and a riser with helical strakes, the Reynolds number ranged from 8 × 10 4 to more than 10 6 [18]. Various surface roughnesses were modeled by using sandpaper. It was found that in the critical Reynolds number regime, the VIV response amplitude and the excitation coefficient of a bare riser are sensitive to the Reynolds number and surface roughness.
Full-scale VIV tests have been developed and carried out in the towing tanks at MARINTEK/SINTEF Ocean [19,21,22]. The hydrodynamic diameter of the test model varied from 0.3 to 1.2 m approximately, and the highest towing speed reached up to 2.5 m/s.
In [23], free oscillation tests with controlled dampling were used to calculate the hydrodynamic coefficients, and ramp tests (varying towing speed) were illustrated to give similar response data as constant speed towing tests.
To the author’s knowledge, the hydrodynamic coefficients and response data from existing high Reynolds number VIV tests still could not form a solid generalized basis for empirical tools due to the following reasons:
  • The tests only includes pure CF motion but with a lack of IL motion.
  • Different frequency ratios between IL and CF were not investigated at high Reynolds number tests. This is crucial for the VIM of FOWTs.
  • The Reynolds numbers were either discrete or limited up to supercritical. Even though the Reynolds number effects in this regime seem to be weak [21,22,23], it is unclear if this is still true at even higher Reynolds numbers, e.g. trans-critical and post-critical.
  • Interaction between surface waves and currents has not been investigated at high Reynolds numbers.

4.3. Model Tests on Semi-Submersibles

VIM responses of a semi-submersible with four squared columns (1:70) were performed at MARIN [93]. The largest VIM motions were observed for the 45° towing direction. The drag amplification, effect of mass ratio and correlation length were checked. At higher reduced velocities, a combination of VIM and galloping responses occurred. Large yaw motions were observed for the galloping in high currents.
A series of experimental results of a typical Deep Draft Semi-submersible® were presented [65,94]. It showed that VIM can be excited by a static current and results in a dynamic motion. This motion was along one of the platform’s diagonals under full lock-in conditions, while the directionality of the response became less pronounced for conditions well above lock-in. The IL and CF VIM motions could be of equal magnitude under conditions of high reduced velocity. The current-induced response amplitudes formed a distribution, and the distribution was dependent on the current velocity and the current heading with respect to the vessel. Approximations of these distributions were provided to be used in conjunction with fatigue computations of risers and mooring lines.
A small-scale (1:100) semi-submersible model unit with four square columns supported by a set of equivalent moorings was tested in the towing tank at the Institute of Technological Research in São Paulo, Brazil [95]. Eight incident angles/headings were tested in a reduced velocity range from 2.5 to 20, corresponding to a Reynolds number range from 6 × 10 3 to 8.5 × 10 4 . The lock-in range in the CF and IL directions was identified, A C F , m a x / L 0.4 (L is the width of the column), A I L , m a x / L 0.15 . Considerable yaw motions were verified. It was found that the effects of the current incidence angle and hull appendages (e.g., chains, pipes and anodes) are decisive in the VIM of a semi-submersible floating unit.
Wave effects on VIM responses were investigated by performing VIM tests with co-linear current and wave conditions [79]. Both regular waves and irregular waves were tested. Regular wave tests showed that the VIM was completely mitigated, while yaw motions were smaller than for the cases of the pure current conditions. Irregular wave tests showed lower VIM than the pure current tests, but the power spectral density showed considerable energy levels around the natural frequency of motions, transverse and yaw. It was speculated that the VIM amplitudes depend on the IL motions imposed by the incident waves on the platform. Damping tests and tests with different drafts were also performed. These studies illustrated the importance of considering VIM in the design phase not only for risers and mooring lines definition but also for the hull definition.
VIM tests on the semi-submersible floating wind turbine design for the DeepCwind project (OC4 Phase II) with a 1:72.72 reduced scale model were carried out in the towing tank of the University of Tokyo, Japan [72,73]. The results showed that the CF VIM amplitudes were around 70% of the diameter of the semi-platform column, which is similar to the ones observed for the deep-draft semi-submersibles with circular columns and larger than for the platforms with square columns.
As a part of a VIM joint industry project, VIM model tests on two deep draft semi-submersible platforms were carried out in a towing tank ( U r = 1 25 , R e = 7 × 10 3 8 × 10 4 ) [96]. One of these had square rounded columns, and the other had circular columns. By comparing the VIM results of the bare hull and the hull with a higher level of surface roughness ( k / L = 7.8 × 10 3 , L is the face dimension of columns), no significant difference was observed for the model with squared columns, but it was clearly seen for the model with circular columns. The effects of low surface roughness ( k / L = 3.9 × 10 3 ) were not fully understood. Another interesting finding was that for the model with circular columns, the yaw motion was found to be coupled with VIM responses, especially CF motions.
VIM model tests on a deep draft semi-submersible platform were carried out at different aspect ratios (0.87–1.90), draft conditions and current incidences (varying from 0° to 45°) at Shanghai Jiao Tong University [97,98]. It was observed that the most significant CF VIM occured at 30° to 45° incidence angle in the reduced velocity range from 5 to 8, with A C F , m a x / L 0.67 0.75 . IL responses were found to be random and with smaller amplitudes.
Wave effects on the VIM responses of a generic bare hull semi-submersible with four square rounded columns were investigated as a part of the ‘VIM JIP’ run by MARIN and University of São Paulo [99]. It was suggested that the wave height and wave incidence angle are relevant factors for wave–VIM interaction. The same irregular wave ( H s = 4 m, T p = 10 s) was tested in the opposite direction of the current, collinear with the current, or transverse to the current direction. A reduction of 15%, 30%, or no influence on the peak response was observed, respectively. This was consistent with the observation from [70]. A comparison between results from 3 DOF and 6 DOF test set-ups indicated that the latter showed a smaller response with a narrower lock-in region. The reduction found for the 6 DOF set-up was attributed to the disruption of the vortex coherence caused by the heave, roll and pitch motions, which were restricted for the air bearing set-up.
Heave plate effects on flow-induced motions (FIM) of a multi-mono-column platform (JAPPAKU FOWT—JPK) model was investigated experiemntally [100]. It was shown that the heave plate decreased the FIM (mainly transverse motions). The existence of a central column also showed the importance of incident angle.
SINTEF Ocean has developed and validated the Real-Time Hybrid Model ReaTHM® testing, which is an experimental method where numerical simulations are combined in real time with model testing. Using this method alleviates the scaling issue, since the aerodynamic loads are simulated and applied on the physical model by the use of six winches and lines connected to the tower top. These loads are calculated by numerical tools such as SIMA [101], and they include the elasticity, aerodynamics and control system [102,103,104].

5. Review of Numerical Studies of VIM

Comparing with experimental work, numerical studies on VIM are very limited. This section reviews selected numerical simulation work including computational fluid mechanics (CFD) work related to FOWT and VIM.

5.1. Numerical Simulation of FOWT

To study the VIM of spar and mono-column type floating production storage and offloading, a wake oscillator model was proposed by [77], and results were compared with experiments from [75,76].
There exist some notable general numerical studies on spar-type FOWTs [4,64,105,106,107,108].
A linearized aero-hydro-servo-elastic floating wind turbine model was presented and used to perform integrated design optimization of the platform, tower, mooring system, and blade-pitch controller for a 10 MW spar floating wind turbine [106,107].
The influence of vortex-induced loads on a spar-type FOWT was investigated in [105] using a coupled aero-hydro-vortex-mooring numerical model, and the vortex-induced loads are simulated by a CFD approach. It was concluded that the sway and roll motions were dominated by the lift force induced by the vortex shedding. The coupling of different responses and non-linearities of the stiffness was also observed. Ref. [4] investigated the effect of wave–current–structure interaction on a moored 6MW spar-type FOWT. Regular waves and uniform current were considered, while wind loads were not considered.
Mooring lines are one of the key elements of FOWTs. Digital twins were developed to detect the long-term drift and near-future axial tension of mooring lines to predict the extreme loads and fatigue [108]. The dynamic response of a fully non-linear model of a DeepCWind FOWT was investigated [109] after one of its three-catenary mooring systems was broken. It was suggested that the tension change was closely related to the drift motion, necessitating an increase in the minimum breaking load (MBL) of the mooring line components.
A spar-type FOWT with a conventional three-line mooring system in catenary configuration was studied by [110] using RIFLEX [111], and it included the non-linear restoring force–offset relationship (restoring stiffness). Such non-linear stiffness has been further confirmed in the data analysis of Hywind Scotland field measurements [17], resulting in a large variation of natural frequency ratio between IL and CF, which needs to be considered in the VIM analysis.
Along with the collaboration between Equinor and SINTEF on the topic ‘Large floating wind turbines’, SINTEF Ocean carried out relevant numerical studies on the VIM of a FOWT. A case study of a spar-type FOWT using three different analysis methods was carried out [64]:
  • Linear frequency domain analysis with coefficient-based VIV loads [111].
  • Non-linear time domain simulation with a harmonic load applied perpendicular to the current direction.
  • Non-linear time domain simulation with the recently developed time domain VIV load model [92].
Load coefficients established for the VIV of slender structures have been used in the analyses. The focus was on the qualitative characteristics of the predicted response and on what is included in the different types of analyses values. The time domain VIV load model has advantages of handling non-linearities and time-varying flow, it is therefore a promising analysis method for VIM predictions. The hydrodynamic coefficients may be influenced by the high Reynolds numbers and small aspect ratios of FOWTs, which need further investigation.

5.2. Application of CFD on VIM Study

CFD has been used as an important tool for studying the vortex-induced motion of offshore floating structures since the early 2000s, with a major focus on the spar concept. Early studies also investigated the VIM of straked cylinders given the similarities between straked cylinder and spar platforms [112]. Later on, there have been a good number of publications that used CFD to simulate the VIM of spar, to name a few [113,114,115,116]. Most of these works have focused on exploring the capabilities of CFD to predict VIM and validate against model tests. A variety of CFD methods have been considered, including Reynolds averaged Navier–Stokes (RANS) equations and Detached Eddy Simulations (DES).
Overall speaking, due to the limitations of computational power, the above-mentioned work could not achieve very high grid resolution. Seeing from today’s standard, one may question the mesh resolution in these studies. However, in most of these papers, a mesh convergence study was presented, giving additional confidence in the results presented therein. Regardless, these early studies already demonstrated that CFD can predict the vortex-induced motion of a spar with satisfactory agreement with model tests. In addition, there are several important conclusions that can be instructive even for CFD studies today:
  • Details of the structure matter. It is practical to ignore some details simply because they may introduce unnecessarily additional work without bringing in equivalent gain, but this must be undertaken with caution. This has been discussed in the above-mentioned papers, and it turned out that by including or excluding some appurtenances on a spar installation, predictions can deviate a lot, and this is confirmed by several model tests [30,50,95]. Yet, choices must be made due to the compromises between cost and accuracy.
  • Flow direction matters. This is straightforward, because when a spar is fully appended with strakes, chains, and pipes, the current from different directions will induce different levels of VIM.
  • Each design is different, and special considerations are needed even with a commonly accepted practice. For example, as [116] has observed, whether or not flow separation is happening on the spar hull will rather strongly impact the final prediction.
In 2013, a CFD guideline for spar VIM was proposed by [117], in which different CFD approaches have been reviewed, and some were tested. Numerical details have been discussed in this paper, including choice of turbulence model, grid resolution, time step size and method for handling dynamic motion. This guideline places a solid common practice to increase the reliability of CFD results on spar VIM.
When it comes to more recent research, there is a clear tendency that more work starts to investigate semi-submersibles [118,119,120,121]. In [121], the authors made a quite comprehensive review on this topic, so the work mentioned therein is not repeated here.
Compared to spar, semi-submersibles raise different challenges, amongst which the most critical one is that as the structure becomes more complex, wake interactions among different columns play a more important role. This means that the wake has to be properly resolved in addition to the boundary layers and near-structure flow regions. In other words, the application of CFD on semi-submersibles is more expensive. On the other hand, there are more design parameters for a semi-submersible than for a spar platform, where CFD can contribute to the early design stage where the number, size, shape and arrangement of columns together may easily result in a massive parameter matrix. Multiple promising designs may need predictions from CFD rather than theoretical estimations, and the above-mentioned CFD studies demonstrated CFD’s strength in comparing the VIM performances of semi-submersibles under different column arrangements.
The Reproducible Offshore CFD JIP was initiated for developing and verifying a CFD modeling practice for several typical offshore applications [122,123,124], and SINTEF Ocean joined some work packages. One work package was about semi-submersible VIM [123]. Model tests on squared column semi-submersible were used for benchmarking the CFD models. Generally, the comparison between CFD simulations and model tests was good; however, the yaw responses were over-predicted at higher reduced velocities.
CFD simulation of a multi-mono-column platform FOWT (OC4) was carried out by using OpenFOAM [125]. A range of reduced velocities was investigated. By comparing the results from current only and collinear wave and current cases, it was observed that the given incident waves (collinear as current) mitigate VIM responses for a wide range of reduced velocities. This finding is useful, and it is of interest to investigate the interaction of incident waves and currents on VIM.

Summary of Application of CFD on VIM Study

  • Using CFD for VIM has been shown to be a promising approach both for spars and semi-submersibles. The comparisons presented above give confidence to the further application of CFD in the design phase, especially when the screening of preliminary designs is finished, and some promising candidates stand out. In this stage, running CFD simulations of these candidates will give more reliable force and VIM predictions than more simplified numerical tools, while also being a lot cheaper/faster compared to model tests.
  • High-quality model test measurements form a solid basis to validate CFD modeling, providing the possibility to make a very detailed comparison and quality control.
  • CFD provides flexibility to extract detailed forces/loads on segments, separated columns, and even some small structural details. This can be important for optimizations. Emphasis can also be put to access the pressure and wall shear stress plots on the structure, so instructive information is more easily extracted from CFD simulations for designers to identify where improvements can potentially be made.
  • Detailed flow visualizations, especially in the wake, are accessible in CFD. This may be especially interesting for semi-submersibles. With the intuitive and detailed flow visualizations, physical insight in the fluid/vortex dynamics could be improved.

6. Review of Field Measurements of FOWTs

High-quality, high-resolution field measurements are essential to either check the ‘scaling effects’ of laboratory tests or validate numerical simulations. For FOWTs, the following measurements are usually made, as listed in Table 3.
The VIM of a prototype Deep Draft Semi-submersible® (SBM Atlanta) with four square columns was reported and compared with model tests in [67]. GPS measurements provided the motion of the prototype Semi under current conditions. The measured mean radial offset ranges from 0.2D to 0.6D, and the lock-in region is centered around 0.35D, while the maximum measured Y-direction amplitude was around 0.2D. There was no sea-state information available based on platform measurements. It was assumed that the sea state was less than 6 ft for the presented data time frame based on observations at nearby oceanographic buoys. A key observation from the comparison indicated that the VIM motion from model tests was significantly less than from the field measurements.
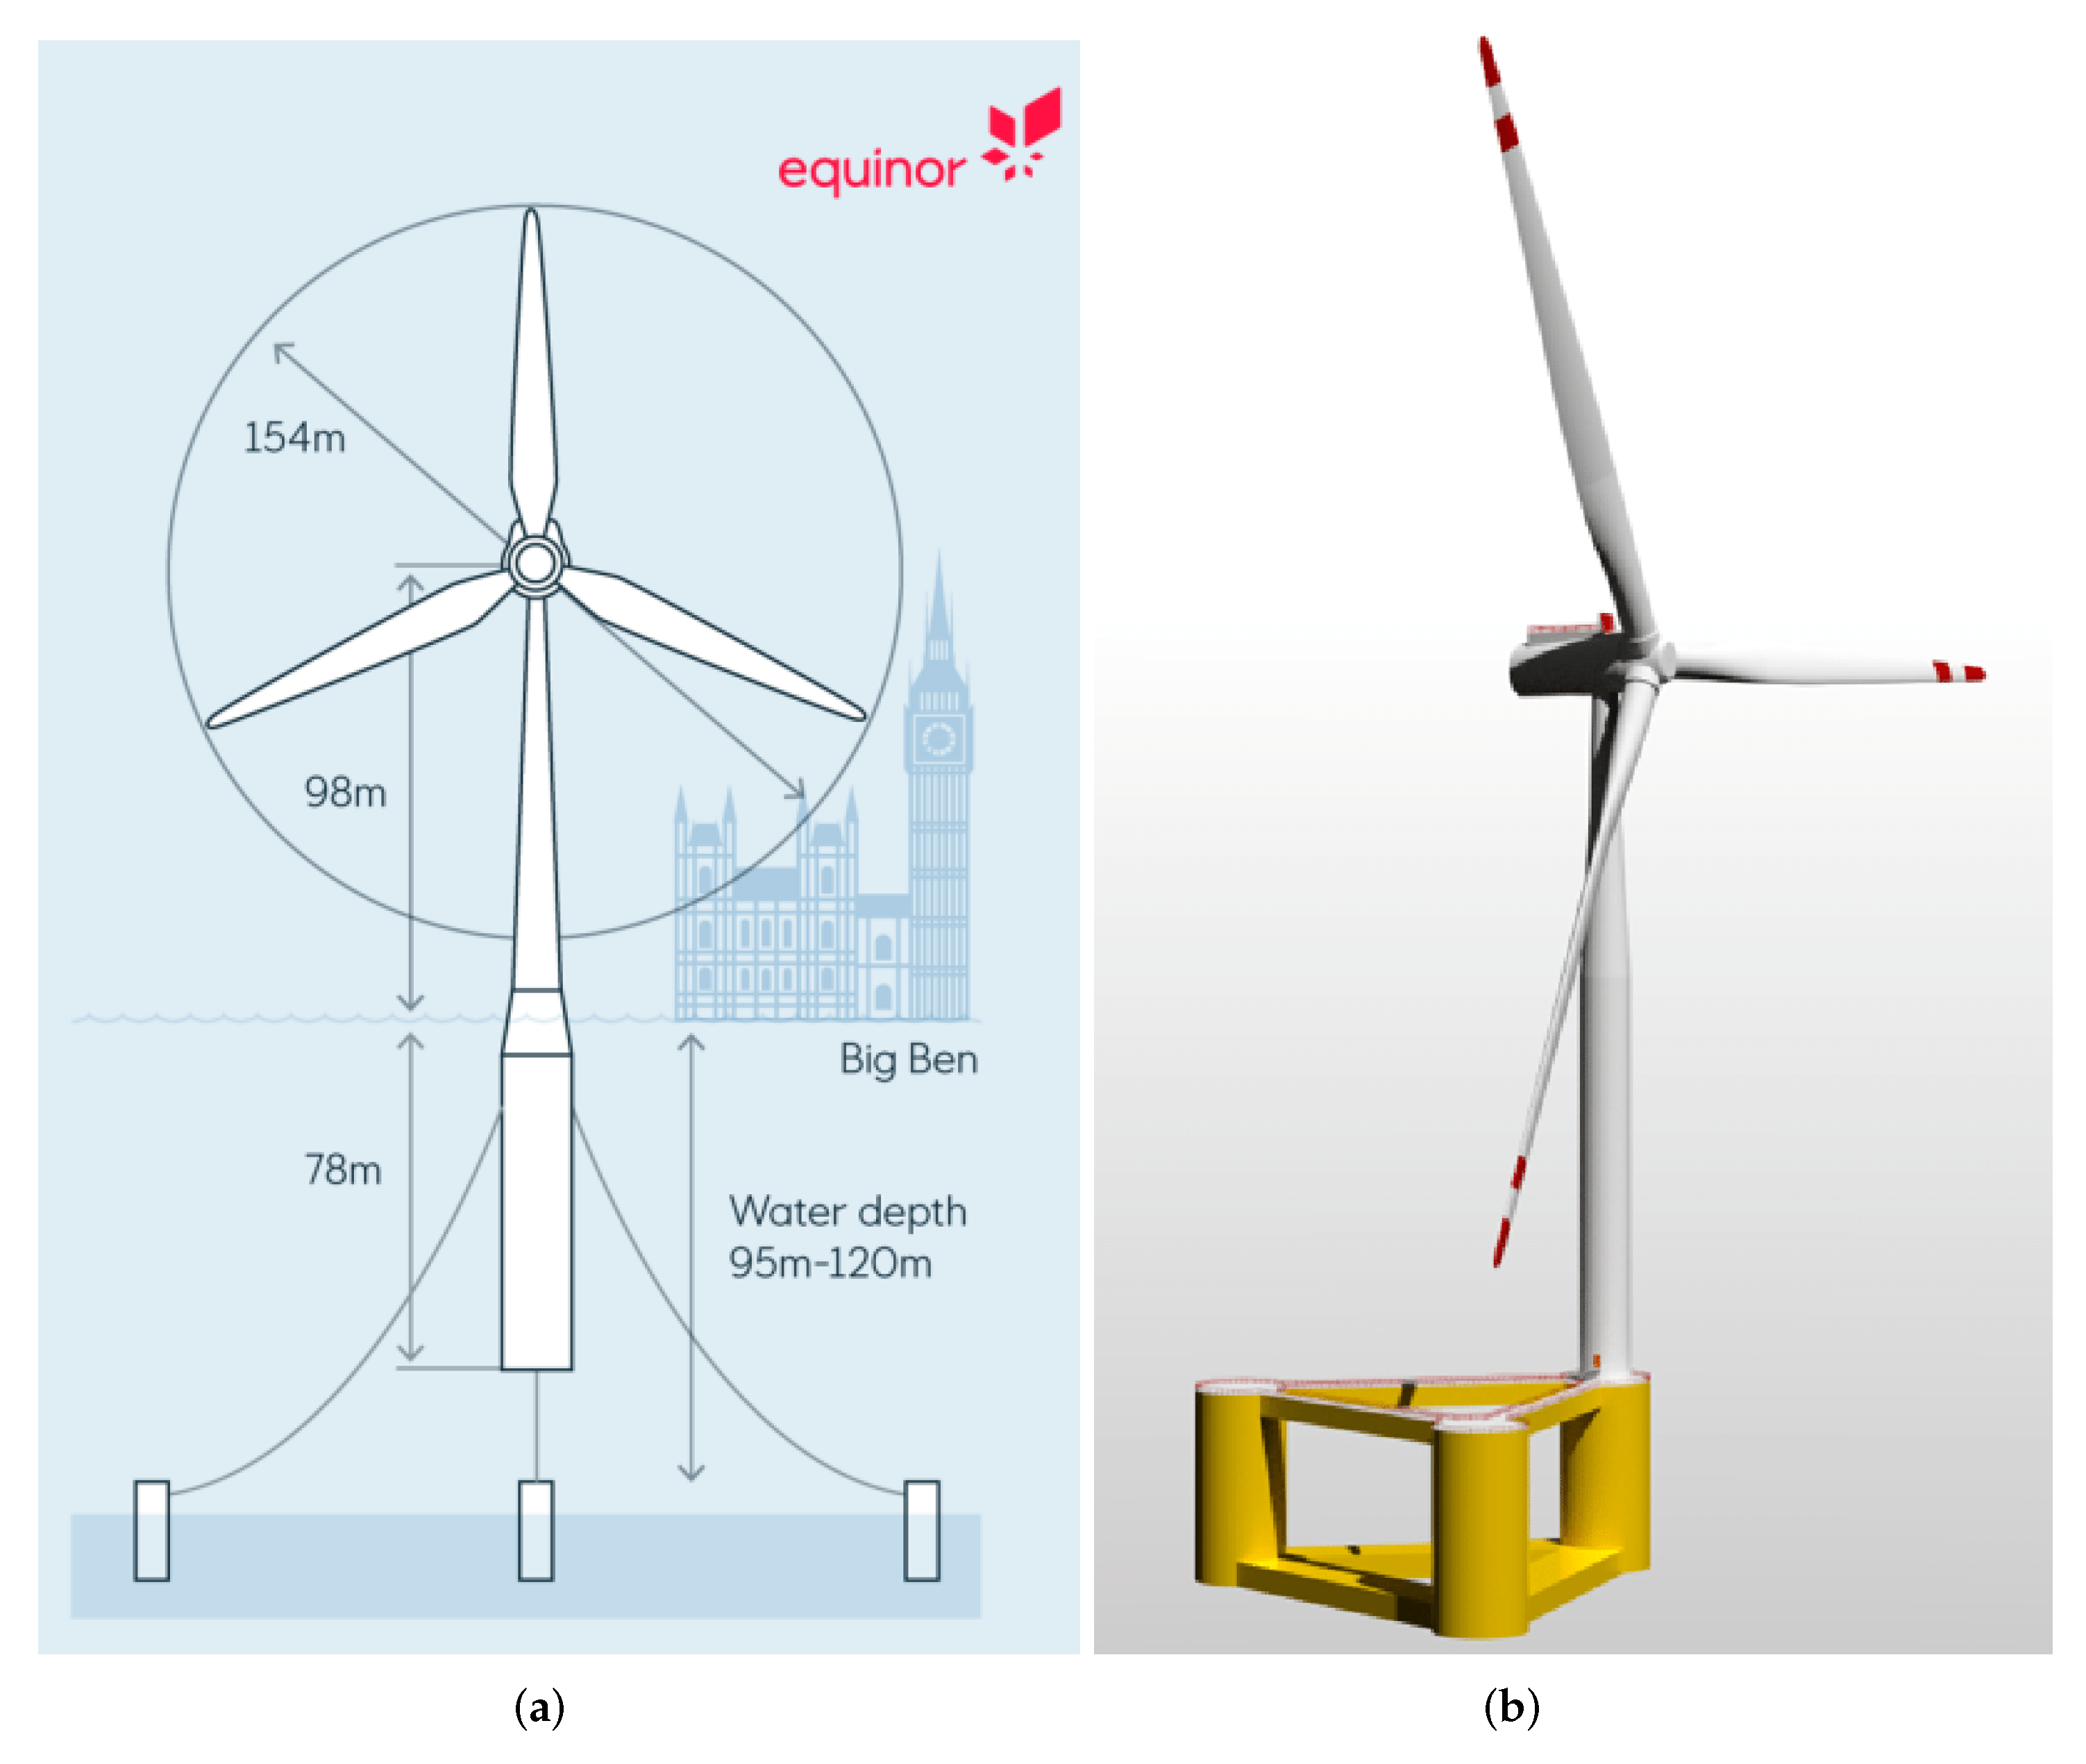
‘The Hywind Demo is a demonstration system that was installed and commissioned in Norway in 2009; it was the world’s first full-scale floating offshore wind turbine. The installed capacity of the demo system is 2.3 MW. The demo unit is located 10 km west of the island of Karmøy off the Norwegian west coast. The water depth is 220 m’
[127]. Field data of ‘Hywind Demo’ were provided by Equinor (earlier Statoil). The field measurements were used to validate numerical tools [126,127].
In [126], numerical simulations by use of the SIMA analysis tool were carried out and compared to field measurements. Comparative dynamic simulations were carried out with the estimated wave elevation time series as input together with measured and further refined statistical parameters of the wind field. VIM was not considered in the study. Overall, good agreement was seen between the measured and simulated responses, which built confidence to further develop the proposed analysis tool.
In [127], a FAST model developed by NREL was validated against the field measurement of ‘Hywind Demo’. Measured wind speeds and wave spectra were used to develop the wind and wave conditions used in the model. The overall system performance and behavior were validated for eight sets of field measurements that span a wide range of operating conditions.
The Hywind Scotland wind park is located about 25 km east of Peterhead in Scotland at water depths in the range of 95–120 m, as illustrated in Figure 12A. The wind farm consists of five floating units, each equipped with a 6 MW wind turbine. The turbines are installed in two rows with a distance between each neighboring turbine of 9 rotor diameters (RDs), as shown in Figure 12B [128].
Measurements of floater responses from the Hywind Scotland wind farm both for turbines in free wind and in wake and for different atmospheric stability conditions were presented in [128]. Generally, the floater motions were small for all wind speeds, showing that the design performs satisfactorily in both free wind and wake conditions.
The VIM of Hywind Scotland FOWT was investigated in [17]. The field measurement data were analyzed and compared with time domain VIV analysis, focusing on the floating unit HS4. Data analysis of field measurements on HS4 was carried out, focusing on the VIM responses and mooring line tension. Key response characteristics such as amplitude and frequency under various environmental loads were investigated and presented. Non-linear time-domain simulation was carried out by using VIVANA-TD. Furthermore, the predicted VIM responses and mooring line tension force were compared with field measurements.

7. Conclusions

The transition to offshore renewable energies calls for the cost-effective design, transportation, installation, operation and maintenance of new-type offshore structures such as FOWTs. FSI problems such as VIV and VIM need to be considered; moreover, the unnecessary conservatism (FoS of 20–30) should be reduced to contribute to cost-effective design.
However, the industry has not yet had the opportunity to share and review the collective data/knowledge on VIM in order to establish a common understanding of the problem and an industry consensus on how to deal with VIM in design.
It is clear that the industry needs widely accepted and consistent practices for addressing VIM in order to ensure the integrity of existing and future designs of floaters. Both experimental and numerical research activities have been carried out to investigate the VIM responses in the past few decades. Existing knowledge and experience gained from the oil and gas industry need to be examined, transferred and further developed in the renewable energy industry.
Therefore, inspired by the massive research activities during the past decade, the present paper reviewed a selection of influential VIV and VIM research work with a focus on the VIM of spar and semi-submersible of FOWTs, as shown in Table 4.
FOWT is a fully coupled system: aerodynamics, hydrodynamics, structural dynamics, electrical dynamics, mechanical systems and controller. FSI problems should be investigated with concerns on all related substructures and coupled effects. To obtain a better understanding of the VIM of offshore floaters, especially FOWTs, the following activities need to be carried out in the long-term and integrated organically to provide cost-effective solutions in design, operation and maintenance phases:
  • Sophisticated model tests;
  • Advanced numerical models;
  • High-fidelity field measurement data;
  • Application of data science.
In the near future, the following research tasks are suggested:
  • VIM model tests on integrated models (floater–mooring–subsea power cables) at small/moderate Reynolds numbers under representative sea states, investigating the coupling between VIM and other dynamic responses.
  • Numerical case study on the model as mentioned above, and validation against model tests.
  • Application of CFD on screening of VIM of FOWTs in early design phase prior to model tests. Trial cases on spar and semi-submersibles, validated against small-scale model tests mentioned above.
  • Moderate Reynolds number two degree-of-freedom vortex-induced vibrations model testing to obtain hydrodynamic coefficients for circular cylinder: excitation coefficients, added mass coefficients, and drag coefficients.

Author Contributions

Conceptualization, D.Y., E.P., J.W., H.L. and N.Y.; writing—original draft preparation, D.Y. and F.J.; writing—review and editing, D.Y., E.P., J.W., S.S., H.L. and B.J.L.; project administration, D.Y. and F.J.; funding acquisition, D.Y. and N.Y. All authors have read and agreed to the published version of the manuscript.

Funding

This research was funded by SINTEF Ocean’s basic research funding (Grunnmidler) NO. GM ET 302006784-06, 302006782-09; GM SHK 302006753-14.

Institutional Review Board Statement

Not applicable.

Informed Consent Statement

Not applicable.

Data Availability Statement

Not applicable. This is a review article, all data and derived data are from referred literatures.

Acknowledgments

The authors acknowledge financial support on VIM study from SINTEF Ocean’s fundamental research funding (GM).

Conflicts of Interest

The authors declare no conflict of interest.

Nomenclature

RIFLEXRiser system analysis program developed by MARINTEK/SINTEF Ocean
SIMOA time-domain simulation program for study of motions and station keeping of
multi-body system, developed by MARINTEK/SINTEF Ocean
SIMANumerical workbench for marine operations and mooring analysis softwares,
developed by MARINTEK/SINTEF Ocean
AAmplitude
H s Significant wave height
ρ Density of fluid
f s t Vortex shedding frequency of a fixed cylinder in water, or Strouhal frequency
f n Natural frequency
f x In-line oscillation frequency
f y Cross-flow oscillation frequency
gGravity acceleration
kRoughness height
u Root-mean-square of the turbulent velocity fluctuations
A p Projected area
A R Aspect ratio, A R = L / D
C d Mean drag coefficient
DDiameter
F d Mean drag force
F r Froude number
ITurbulence intensity
R e Reynolds number
S t Strouhal number
T n Natural period
UFluid velocity
U ¯ Mean velocity
U r Reduced velocity
LCharacteristic length
ν Kinematic viscosity
CFCross-flow
CFDComputational fluid dynamics
DDFDeep draft floater
DOFDegree of freedom
FDFrequency domain
FEMFinite element method
FLSFatigue limit state
FoSFactor of safety
FOWTFloating offshore wind turbine
GPSGlobal Positioning System
GWGigawatt
ILIn-line
MBLMean breaking load
MODUMobile offshore drilling unit
MRUMotion reference unit
MWMegawatt
PSDPower spectral density
ROMReduced-order models
SemiSemi-submersibles
TDTime domain
TLPTension-leg platform
ULSUltimate limit state
VIMVortex-induced motions
VIVVortex-induced vibrations

References

  1. IEA. Net Zero by 2050; Technical Report; IEA: Paris, France, 2021. [Google Scholar]
  2. DNV. Floating Offshore Wind: The Next Five Years; Technical Report; DNV: Baerum, Norway, 2021. [Google Scholar]
  3. DNV GL. Floating Wind: The Power to Commercialize; Report; DNV GL: Baerum, Norway, 2020. [Google Scholar]
  4. Zheng, Z.; Chen, J.; Liang, H.; Zhao, Y.; Shao, Y. Hydrodynamic Responses of a 6 MW Spar-Type Floating Offshore Wind Turbine in Regular Waves and Uniform Current. Fluids 2020, 5, 187. [Google Scholar] [CrossRef]
  5. Wen, B.; Tian, X.; Li, Z.; Peng, Z. Coupling dynamics of floating wind turbines: History, progress and challenges. Adv. Mech. 2022; in press. [Google Scholar]
  6. Aksnes, V.; Alsos, H.; Bachynski-Polić, E.; Berthelsen, P.A.; Delhaye, V.; Furevik, B.R.; Jostad, H.P.; Kristiansen, T.; Ommani, B. On common research needs for the next generation of floating support structures. In Proceedings of the ASME 2022 41st International Conference on Ocean, Offshore and Arctic Engineering, Hamburg, Germany, 6–10 June 2022. [Google Scholar]
  7. ABS. Guidance Notes on Global Performance Analysis for Floating Offshore Wind Turbines; Technical Report; ABS: Spring, TX, USA, 2020. [Google Scholar]
  8. API. API Recommended Practice 2SK, Design and Analysis of Stationkeeping Systems for Floating Structures, 3rd ed.; API: Washington, DC, USA, 2005. [Google Scholar]
  9. DNV. DNV-OS-C106 Structural Design of Deep Draught Floating Units—LRFD Method; DNV: Baerum, Norway, 2015. [Google Scholar]
  10. Blevins, R.D. Flow-Induced Vibration, 2nd ed.; Krieger Publishing Company: Kriegerdrive, FL, USA, 1990. [Google Scholar]
  11. Fujarra, A.L.C.; Rosetti, G.F.; de Wilde, J.; Gonçalves, R.T. State-of-Art on Vortex-Induced Motion: A Comprehensive Survey After More Than One Decade of Experimental Investigation. In Proceedings of the ASME 2012 31st International Conference on Ocean, Offshore and Arctic Engineering, Rio de Janeiro, Brazil, 1–6 June 2012; pp. 561–582. [Google Scholar]
  12. Potts, A.E.; Potts, D.A.; Marcollo, H.; Jayasinghe, K. Strouhal Number for VIV Excitation of Long Slender Structures. In Proceedings of the ASME 2018 37th International Conference on Ocean, Offshore and Arctic Engineering, Madrid, Spain, 17–22 June 2018; Volume 5. [Google Scholar]
  13. Lienhard, J.H. Synopsis of Lift, Drag, and Vortex Frequency Data for Rigid Circular Cylinders; Technical Report, Bulletin 300; Washington State University: Pullman, WA, USA, 1966. [Google Scholar]
  14. Potts, D.A.; Marcollo, H.; Jayasinghe, K. Strouhal Number for Vortex-Induced Vibration Excitation of Long Slender Structures. J. Offshore Mech. Arct. Eng. 2022, 144, 041906. [Google Scholar] [CrossRef]
  15. Sarpkaya, T. Force on a circular cylinder in viscous oscillatory flow at low Keulegan—Carpenter numbers. J. Fluid Mech. 1986, 165, 61–71. [Google Scholar] [CrossRef]
  16. Kozakiewicz, A.; Sumer, B.; Fredsøe, J.; Hansen, E. Vortex Regimes Around a Freely Vibrating Cylinder In Oscillatory Flow. Int. J. Offshore Polar Eng. 1997, 7, 94. [Google Scholar]
  17. Yin, D.; Passano, E. Large Floating Wind Turbines Coupled Analysis A3-1: Hywind Scotland—VIM analysis; Technical Report OC2022 F-020; SINTEF Ocean: Trondheim, Norway, 2022. [Google Scholar]
  18. Ding, Z.J.; Balasubramanian, S.; Lokken, R.T.; Yung, T.W. Lift and damping characteristics of bare and straked cylinders at riser scale Reynolds numbers. In Proceedings of the Offshore Technology Conference, Houston, TX, USA, 3–6 May 2004. [Google Scholar]
  19. Lie, H.; Szwalek, J.L.; Russo, M.; Braaten, H.; Baarholm, R.J. Drilling riser VIV tests with prototype Reynolds numbers. In Proceedings of the ASME 2013 32nd International Conference on Ocean, Offshore and Arctic Engineering, Nantes, France, 9 June 2013; Volume 7. [Google Scholar]
  20. Dahl, J.M.; Hover, F.S.; Triantafyllou, M.S.; Oakley, O.H. Dual resonance in vortex-induced vibrations at subcritical and supercritical Reynolds numbers. J. Fluid Mech. 2010, 643, 395–424. [Google Scholar] [CrossRef] [Green Version]
  21. Yin, D.; Lie, H.; Baarholm, R.J. Prototype Reynolds number VIV tests on a full-scale rigid riser. In Proceedings of the ASME 2017 36th International Conference on Ocean, Offshore and Arctic Engineering, Trondheim, Norway, 25 June 2017; Volume 2. [Google Scholar]
  22. Yin, D.; Lie, H.; Baarholm, R.J. Prototype Reynolds number VIV tests on a full-scale rigid riser. J. Offshore Mech. Arct. Eng. 2018, 140, 011702. [Google Scholar] [CrossRef]
  23. Resvanis, T.L.; Vandiver, J.K. Efficient measurement of hydrodynamic coefficients for vibrating cylinders at supercritical Reynolds numbers. J. Fluids Struct. 2022, 108, 103427. [Google Scholar] [CrossRef]
  24. Dahl, J.M. Vortex-Induced Vibration of a Circular Cylinder with Combined In-line and Cross-flow Motion. Ph.D. Thesis, Center for Ocean Engineering, Department of Mechanical Engineering, MIT, Webb Institute, Glen Cove, NY, USA, 2008. [Google Scholar]
  25. Raghavan, K.; Bernitsas, M.M. Experimental investigation of Reynolds number effect on vortex induced vibartion of rigid circular cylinder on elastic supports. Ocean. Eng. 2011, 38, 719–731. [Google Scholar] [CrossRef]
  26. DeepStar. DeepStar—High Reynolds Number Results, VIV Data Repository. 2003. Available online: http://web.mit.edu/towtank/www/vivdr/index.html (accessed on 30 June 2017).
  27. Allen, D.W.; Henning, D.L. Surface Roughness Effects on Vortex-Induced Vibration of Cylindrical Structures at Critical and Supercritical Reynolds Numbers. In Proceedings of the Offshore Technology Conference, Houston, TX, USA, 5–8 May 2001. [Google Scholar]
  28. Allen, D.; Henning, D. Vortex-induced vibration tests of a flexible smooth cylinder at supercritical Reynolds numbers. In Proceedings of the Seventh International Offshore and Polar Engineering Conference, Honolulu, HI, USA, 25–30 May 1997. [Google Scholar]
  29. Vandiver, J.K. Drag coefficients of long flexible cylinders. In Proceedings of the Offshore Technology Conference, Houston, TX, USA, 2 May 1983. [Google Scholar]
  30. Roddier, D.; Finnigan, T.; Liapis, S. Influence of the Reynolds Number on Spar Vortex Induced Motions (VIM): Multiple Scale Model Test Comparisons. In Proceedings of the ASME 2009 28th International Conference on Ocean, Offshore and Arctic Engineering, Honolulu, HI, USA, 31 May–6 June 2009; Volume 5, pp. 797–806. [Google Scholar]
  31. Pearcey, H.H.; Singh, S.; Matten, R.B.; Cash, R.F. Fluid Loading on Roughened Cylindrical Members of Circular Cross-Section; Technical Report NMI R191, OT-O-8411; National Maritime Institute: Feltham, UK, 1985. [Google Scholar]
  32. Fage, A.; Warsap, J.H. The Effects of Turbulence and Surface Roughness on the Drag of Circular Cylinders; Technical Report; H. M. Stationery Office: London, UK, 1929. [Google Scholar]
  33. Achenbach, E. Influence of surface roughness on the cross-flow around a circular cylinder. J. Fluid Mech. 1971, 46, 321–335. [Google Scholar] [CrossRef]
  34. Guven, O.; Farrell, C.; Petal, V.C. Surface roughness effects on the mean flow past circular cylinders. J. Fluid Mech. 1980, 98, 673–701. [Google Scholar] [CrossRef]
  35. Gudmestad, O.T.; Moe, G. Hydrodynamic Coefficients for Calculation of Hydrodynamic Loads on Offshore Truss Structures. Mar. Struct. 1996, 9, 745–758. [Google Scholar] [CrossRef]
  36. Yin, D.; Lie, H.; Russo, M.; Grytøyr, G. Drilling riser model tests for software verification. J. Offshore Mech. Arct. Eng. 2018, 140, 011701. [Google Scholar] [CrossRef]
  37. Okamoto, T.; Yagita, M. The Experimental Investigation on the Flow Past a Circular Cylinder of Finite Length Placed Normal to the Plane Surface in a Uniform Stream. Bull. JSME 1973, 16, 805–814. [Google Scholar] [CrossRef]
  38. Rooney, D.M.; Rodichok, J.; Dolan, K. Finite Aspect Ratio Effects on Vortex Shedding Behind Two Cylinders at Angles of Incidence. J. Fluids Eng. 1995, 117, 219–226. [Google Scholar] [CrossRef]
  39. Kawamura, T.; Hiwada, M.; Hibino, T.; Mabuchi, I.; Kumada, M. Flow around a Finite Circular Cylinder on a Flat Plate: Cylinder height greater than turbulent boundary layer thickness. Bull. JSME 1984, 27, 2142–2151. [Google Scholar] [CrossRef] [Green Version]
  40. Sumner, D.; Heseltine, J.L.; Dansereau, O.J.P. Wake structure of a finite circular cylinder of small aspect ratio. Exp. Fluids 2004, 37, 720–730. [Google Scholar] [CrossRef]
  41. Sakamoto, H.; Arie, M. Vortex shedding from a rectangular prism and a circular cylinder placed vertically in a turbulent boundary layer. J. Fluid Mech. 1983, 126, 147–165. [Google Scholar] [CrossRef]
  42. Gonçalves, R.T.; Sakata, K.; Gambarine, D.M.; Cicolin, M.M.; Hirabayashi, S.; Assi, G.R.S. Experimental Study on Vortex-Induced Vibration of Floating Circular Cylinders with Low Aspect Ratio and Different Free-End Corner Shapes. In Proceedings of the ASME 2018 37th International Conference on Ocean, Offshore and Arctic Engineering, Madrid, Spain, 17–22 June 2018; Volume 2. [Google Scholar]
  43. Salzmann, D.C.; van der Tempel, J. Aerodynamic damping in the design of support structures for offshore wind turbines. In Proceedings of the International Conference & Exhibition Copenhage Offshore Wind, Copenhagen, Denmark, 26–28 October 2005. [Google Scholar]
  44. Damgaard, M.; Andersen, J.K.F. Natural Frequency And Damping Estimation of an Offshore Wind Turbine Structure. In Proceedings of the Twenty-second International Offshore and Polar Engineering Conference, Rhodes, Greece, 17–22 June 2012. [Google Scholar]
  45. Koukoura, C.; Natarajan, A.; Vesth, A. Identification of support structure damping of a full scale offshore wind turbine in normal operation. Renew. Energy 2015, 81, 882–895. [Google Scholar] [CrossRef]
  46. Van Vondelen, M.; Navalkar, S.T.; Iliopoulos, A.; van der Hoek, D.; van Wingerden, J.W. Damping Identification of Offshore Wind Turbines using Operational Modal Analysis: A Review. Wind Energy Sci. 2021; preprint. [Google Scholar] [CrossRef]
  47. Williamson, C.H.K.; Govardhan, R. Vortex Induced Vibrations. Annu. Rev. Fluid Mech. 2004, 36, 413–455. [Google Scholar] [CrossRef] [Green Version]
  48. Vandiver, J.K. Damping parameters for flow-induced vibration. J. Fluids Struct. 2012, 35, 105–119. [Google Scholar] [CrossRef]
  49. Van der Tempel, J. Design of Support Structures for Offshore Wind Turbines. Ph.D. Thesis, Delft University of Technology, Delft, The Netherlands, 2006. [Google Scholar]
  50. Van Dijk, R.; Magee, A.; van Perryman, S.; van Gebara, J. Model Test Experience on Vortex Induced Vibrations of Truss Spars. In Proceedings of the Offshore Technology Conference, Houston, TX, USA, 5–8 May 2003. [Google Scholar]
  51. Govardhan, R.N.; Williamson, C.H.K. Defining the ‘modified Griffin plot’ in vortex-induced vibration: Revealing the effect of Reynolds number using controlled damping. J. Fluid Mech. 2006, 561, 147–180. [Google Scholar] [CrossRef]
  52. Swithenbank, S.B.; Vandiver, J.K.; Larsen, C.M.; Lie, H. Reynolds number dependence of flexible cylinder VIV response data. In Proceedings of the ASME 2008 27th International Conference on Ocean, Offshore and Arctic Engineering, Estoril, Portugal, 15–20 June 2008; Volume 5, pp. 503–511. [Google Scholar]
  53. Blevins, R.D.; Coughran, C.S. Experimental Investigation of Vortex-Induced Vibration in One and Two Dimensions With Variable Mass, Damping, and Reynolds Number. J. Fluids Eng. 2009, 131, 101202. [Google Scholar] [CrossRef]
  54. Moan, T.; Gao, Z.; Bachynski, E.E.; Nejad, A.R. Recent Advances in Integrated Response Analysis of Floating Wind Turbines in a Reliability Perspective. J. Offshore Mech. Arct. Eng. 2020, 142, 052002. [Google Scholar] [CrossRef] [Green Version]
  55. Khalifeh, M.; Saasen, A. Different Categories of Working Units. In Introduction to Permanent Plug and Abandonment of Wells; Springer International Publishing: Cham, Switzerland, 2020; pp. 137–163. [Google Scholar]
  56. Kaiser, M.J. Chapter 5—Pipeline Installation and Vessel Specifications. In The Offshore Pipeline Construction Industry; Kaiser, M.J., Ed.; Gulf Professional Publishing: Houston, TX, USA, 2020; pp. 113–140. [Google Scholar]
  57. Thys, M.; Souza, C.; Sauder, T.; Fonseca, N.; Berthelsen, P.A.; Engebretsen, E.; Haslum, H. Experimental Investigation of the Coupling between Aero- and Hydrodynamical Loads on A 12 MW Semi-Submersible Floating Wind Turbine. In Proceedings of the ASME 2021 40th International Conference on Ocean, Offshore and Arctic Engineering, Online, 21–30 June 2021; Volume 9. [Google Scholar]
  58. ISO19901-7; Petroleum and Natural Gas Industries—Specific Requirements for Offshore Structures—Part 7: Stationkeeping Systems for Floating Offshore Structures and Mobile Offshore Units. ISO: Geneva, Switzerland, 2013.
  59. Fujiwara, T. VIM simulation on a cylindrical floating structure. J. Mar. Sci. Technol. 2018, 23, 288–301. [Google Scholar] [CrossRef]
  60. Mercier, R.S.; Ward, E.G. (Eds.) Spar Vortex-Induced Motions—Proceedings of MMS/OTRC Workshop; Offshore Technology Research Center: Navasota, TX, USA, 2003. [Google Scholar]
  61. ABSG Consulting Inc. Floating Offshore Wind Turbine Development Assessment—Final Report and Technical Summary; Techreport, Task Order 140M0120F0021; ABSG Consulting Inc.: Arlington, VA, USA, 2021. [Google Scholar]
  62. DNV. DNV-ST-0119 Floating Wind Turbine Structures; DNV: Baerum, Norway, 2018. [Google Scholar]
  63. DNV. DNV-RP-C205 Environmental Conditions and Environmental Loads; DNV: Baerum, Norway, 2009. [Google Scholar]
  64. Passano, E.; Grytøyr, G.; Haslum, H.; Lie, H.; Yin, D. Simulation of VIM of an offshore floating wind turbine. In Proceedings of the ASME 2022 41st International Conference on Ocean, Offshore and Arctic Engineering, Hamburg, Germany, 6–10 June 2022. [Google Scholar]
  65. Rijken, O.; Leverette, S. Experimental Study Into Vortex Induced Motion Response of Semi Submersibles With Square Columns. In Proceedings of the ASME 2008 27th International Conference on Ocean, Offshore and Arctic Engineering, Estoril, Portugal, 15–20 June 2008; Volume 4, pp. 263–276. [Google Scholar]
  66. Zou, J.; Poll, P.; Antony, A.; Das, S.; Padmanabhan, R.; Vinayan, V.; Parambath, A. VIM Model Testing and VIM Induced Mooring Fatigue of a Dry Tree Paired-Column Semisubmersible Platform. In Proceedings of the Offshore Technology Conference, Houston, TX, USA, 5–8 May 2014. [Google Scholar]
  67. Rijken, O.; Leverette, S. Field Measurements of Vortex Induced Motions of a Deep Draft Semisubmersible. In Proceedings of the ASME 2009 28th International Conference on Ocean, Offshore and Arctic Engineering, Honolulu, HI, USA, 31 May–6 June 2009; Volume 6, pp. 739–746. [Google Scholar]
  68. Yin, D.; Lie, H.; Wu, J. Structural and Hydrodynamic Aspects of Steel Lazy Wave Riser in Deepwater. J. Offshore Mech. Arct. Eng. 2020, 142, 020801. [Google Scholar] [CrossRef]
  69. Irani, M.; Finn, L. Model Testing for Vortex Induced Motions of Spar Platforms. In Proceedings of the ASME 2004 23rd International Conference on Offshore Mechanics and Arctic Engineering, Vancouver, BC, Canada, 20–25 June 2004; Volume 1, pp. 605–610. [Google Scholar]
  70. Finnigan, T.; Irani, M.; van Dijk, R. Truss Spar VIM in Waves and Currents. In Proceedings of the ASME 2005 24th International Conference on Ocean, Offshore and Arctic Engineering, Halkidiki, Greece, 12–17 June 2005; Volume 2, pp. 475–482. [Google Scholar]
  71. Finnigan, T.; Roddier, D. Spar VIM Model Tests at Supercritical Reynolds Numbers. In Proceedings of the ASME 2007 26th International Conference on Offshore Mechanics and Arctic Engineering, San Diego, CA, USA, 10–15 June 2007; Volume 3, pp. 731–740. [Google Scholar]
  72. Gonçalves, R.T.; Chame, M.E.F.; Silva, L.S.P.; Koop, A.; Hirabayashi, S.; Suzuki, H. Experimental Study on Flow-Induced Motions (FIM) of a Floating Offshore Wind Turbine Semi-Submersible Type (OC4 Phase II Floater). In Proceedings of the ASME 2019 2nd International Offshore Wind Technical Conference, Glasgow, UK, 9 June 2019. [Google Scholar]
  73. Gonçalves, R.T.; Chame, M.E.F.; Silva, L.S.P.; Koop, A.; Hirabayashi, S.; Suzuki, H. Experimental Flow-Induced Motions of a FOWT Semi-Submersible Type (OC4 Phase II Floater). J. Offshore Mech. Arct. Eng. 2020, 143, 012004. [Google Scholar] [CrossRef]
  74. Fujarra, A.L.C.; Hirabayashi, S.; Cenci, F.; Gonçalves, R.T. Effect of the initial roll or pitch angles on the vortex-induced motions (VIM) of floating circular cylinders with low aspect ratio. In Proceedings of the Annual Autumn Conference 2019 of the Japan Society of Naval Architects and Ocean Engineers (JASNAOE), Himeji, Japan, 21–22 November 2019. [Google Scholar]
  75. Fujiwara, T.; Saito, M.; Maeda, K.; Sato, H.; Ishida, K. Experimental Investigation of VIM Characteristics on Column Type Floater in Super Critical Reynolds Number. In Proceedings of the ASME 2013 32nd International Conference on Ocean, Offshore and Arctic Engineering, Nantes, France, 9 June 2013; Volume 5. [Google Scholar]
  76. Fujiwara, T.; Saito, M.; Maeda, K.; Sato, H.; Ishida, K.; Kato, S. Experimental Investigation of VIM Characteristics on Spar Type Floater in Higher Reynolds Number. J. Jpn. Soc. Nav. Archit. Ocean. Eng. 2014, 20, 39–47. [Google Scholar]
  77. Fujiwara, T. VIM Simulation Method on a Cylindrical Floating Structure. In Proceedings of the ASME 2016 35th International Conference on Ocean, Offshore and Arctic Engineering, Busan, Korea, 18 June 2016; Volume 1. [Google Scholar]
  78. Gonçalves, R.T.; Rosetti, G.; Fujarra, A.L.C.; Nishimoto, K.; Ferreira, M.D. Relevant Aspects in Vortex-Induced Motions of Spar and Monocolumn Platforms: A Brief Overview. In Proceedings of the COBEM 2009, 20th International Congress of Mechanical Engineering, Gramado, Brazil, 15–20 November 2009. [Google Scholar]
  79. Gonçalves, R.T.; Rosetti, G.F.; Fujarra, A.L.; Oliveira, A.C. Experimental study on vortex-induced motions of a semi-submersible platform with four square columns, Part II: Effects of surface waves, external damping and draft condition. Ocean. Eng. 2013, 62, 10–24. [Google Scholar] [CrossRef]
  80. Gonçalves, R.T.; Rosetti, G.F.; Franzini, G.R.; Meneghini, J.R.; Fujarra, A.L.C. Two-degree-of-freedom vortex-induced vibration of circular cylinders with very low aspect ratio and small mass ratio. J. Fluids Struct. 2013, 39, 237–257. [Google Scholar] [CrossRef]
  81. Gonçalves, R.T.; Meneghini, J.R.; Fujarra, A.L. Vortex-induced vibration of floating circular cylinders with very low aspect ratio. Ocean. Eng. 2018, 154, 234–251. [Google Scholar] [CrossRef]
  82. Gonçalves, R.T.; da Silva, R.O.P.; Marques, M.A.; Hirabayashi, S.; da Silva Assi, G.R.; Simos, A.N.; Suzuki, H. Experimental Study on Vortex-Induced Motions of Floating Circular Single Cylinders with Low Aspect Ratio and Different Heave Plate Geometries. In Proceedings of the International Ocean and Polar Engineering Conference, Virtual, 12–16 October 2020. [Google Scholar]
  83. Duan, F.; Hu, Z.; Niedzwecki, J. Model test investigation of a spar floating wind turbine. Mar. Struct. 2016, 49, 76–96. [Google Scholar] [CrossRef] [Green Version]
  84. Martin, H.R.; Kimball, R.W.; Viselli, A.M.; Goupee, A.J. Methodology for Wind/Wave Basin Testing of Floating Offshore Wind Turbines. ASME. J. Offshore Mech. Arct. Eng. 2014, 136, 020905. [Google Scholar] [CrossRef]
  85. Carlson, D.W.; Modarres-Sadeghi, Y. Vortex-induced vibration of spar platforms for floating offshore wind turbines. Wind Energy 2018, 21, 1169–1176. [Google Scholar] [CrossRef]
  86. SINTEF Ocean. Available online: https://www.sintef.no/en/expertise/ocean/design-and-verification-of-offshore-wind-turbines/ (accessed on 1 May 2022).
  87. Rambech, H.J. Towing Test of Hywind Scotland Floatingwind Turbine—Study of VIM—Calm Water Towing Tests; Technical Report MT2014 F-118; MARINTEK: Trondheim, Norway, 2014. [Google Scholar]
  88. de Wilde, J.; Sworn, A.; Cook, H.; Willis, N.; Bridge, C. Cross Section VIV Model Test For Novel Riser Geometries. In Proceedings of the Deep Offshore Technology Conference, New Orleans, LA, USA, 30 November–3 December 2004. [Google Scholar]
  89. Triantafyllou, M.; Triantafyllou, G.; Tein, Y.D.; Ambrose, B.D. Pragmatic riser VIV analysis. In Proceedings of the Offshore Technology Conference, Houston, TX, USA, 5–8 May 1999. [Google Scholar]
  90. Vandiver, J.K.; Li, L. Shear7 v4.5 Program Theoretical Manual; Massachusetts Institute of Technology: Cambridge, MA, USA, 2007. [Google Scholar]
  91. Passano, E.; Larsen, C.M.; Lie, H.; Wu, J. VIVANA Theory Manual Release 4.6 Rev.0; Technical Report MT2014 F-135; MARINTEK: Trondheim, Norway, 2015. [Google Scholar]
  92. Passano, E.; Wu, J.; Sævik, S.; Yin, D. Lazy Wave Riser JIP: VIVANA-TD Theory/User Manual; Technical report OC2020 F-061; SINTEF Ocean: Trondheim, Norway, 2020. [Google Scholar]
  93. Waals, O.J.; Phadke, A.C.; Bultema, S. Flow Induced Motions on Multi Column Floaters. In Proceedings of the ASME 2007 26th International Conference on Offshore Mechanics and Arctic Engineering, San Diego, CA, USA, 10–15 June 2007; Volume 1, pp. 669–678. [Google Scholar]
  94. Rijken, O.; Leverette, S.; Davies, K. Semi Submersible with Four Square Columns. In Proceedings of the Deep Offshore Technology Conference, New Orleans, LA, USA, 30 November–3 December 2004. [Google Scholar]
  95. Gonçalves, R.T.; Rosetti, G.F.; Fujarra, A.L.; Oliveira, A.C. Experimental study on vortex-induced motions of a semi-submersible platform with four square columns, Part I: Effects of current incidence angle and hull appendages. Ocean Eng. 2012, 54, 150–169. [Google Scholar] [CrossRef]
  96. Fujarra, A.L.C.; Gonçalves, R.T.; Rosetti, G.F.; da Silva Jr, H.C.; Koop, A. Roughness Effects on the VIM Response of Deep-Draft Semi-Submersible Platforms. In Proceedings of the Twenty-Fifth (2015) International Ocean and Polar Engineering Conference, Kona, HI, USA, 21–216 June 2015; pp. 1035–1041. [Google Scholar]
  97. Liu, M.; Xiao, L.; Yang, J.; Tian, X. Parametric study on the vortex-induced motions of semi-submersibles: Effect of rounded ratios of the column and pontoon. Phys. Fluids 2017, 29, 055101. [Google Scholar] [CrossRef]
  98. Liu, M.; Xiao, L.; Lu, H.; Xiao, X. Experimental study on vortex-induced motions of a semi-submersible with square columns and pontoons at different draft conditions and current incidences. Int. J. Nav. Archit. Ocean. Eng. 2017, 9, 326–338. [Google Scholar] [CrossRef]
  99. Maximiano, A.; Koop, A.; de Wilde, J.; Gonçalves, R.T. Experimental Study on the Vortex-Induced Motions (VIM) of a Semi-Submersible Floater in Waves. In Proceedings of the ASME 2017 36th International Conference on Ocean, Offshore and Arctic Engineering, Trondheim, Norway, 25 June 2017; Volume 7. [Google Scholar]
  100. Gonçalves, R.T.; Malta, E.B.; Simos, A.N. Experimental study of the effect of heave plate dimensions on the flow-induced motions (FIM) of a multi-column floating offshore wind turbine (FOWT). In Proceedings of the ASME 2022 41st International Conference on Ocean, Offshore and Arctic Engineering, Hamburg, Germany, 6–10 June 2022. [Google Scholar]
  101. SINTEF Ocean. SIMA User Guide; SINTEF Ocean: Trondheim, Norway, 2021. [Google Scholar]
  102. Sauder, T.; Chabaud, V.; Thys, M.; Bachynski, E.E.; Sæther, L.O. Real-Time Hybrid Model Testing of a Braceless Semi-Submersible Wind Turbine: Part I—The Hybrid Approach. In Proceedings of the ASME 2016 35th International Conference on Ocean, Offshore and Arctic Engineering, Busan, Korea, 18 June 2016; Volume 6. [Google Scholar]
  103. Bachynski, E.E.; Thys, M.; Sauder, T.; Chabaud, V.; Sæther, L.O. Real-Time Hybrid Model Testing of a Braceless Semi-Submersible Wind Turbine: Part II — Experimental Results. In Proceedings of the ASME 2016 35th International Conference on Ocean, Offshore and Arctic Engineering, Busan, Korea, 18 June 2016; Volume 6. [Google Scholar]
  104. Berthelsen, P.A.; Bachynski, E.E.; Karimirad, M.; Thys, M. Real-Time Hybrid Model Tests of a Braceless Semi-Submersible Wind Turbine: Part III —Calibration of a Numerical Model. In Proceedings of the ASME 2016 35th International Conference on Ocean, Offshore and Arctic Engineering, Busan, Korea, 18 June 2016; Volume 6. [Google Scholar]
  105. Li, Y.; Liu, L.; Zhu, Q.; Guo, Y.; Hu, Z.; Tang, Y. Influence of Vortex-Induced Loads on the Motion of SPAR-Type Wind Turbine: A Coupled Aero-Hydro-Vortex-Mooring Investigation. J. Offshore Mech. Arct. Eng. 2018, 140, 051903. [Google Scholar] [CrossRef] [Green Version]
  106. Hegseth, J.M.; Bachynski, E.E. A semi-analytical frequency domain model for efficient design evaluation of spar floating wind turbines. Mar. Struct. 2019, 64, 186–210. [Google Scholar] [CrossRef]
  107. Hegseth, J.M.; Bachynski, E.E.; Martins, J.R. Integrated design optimization of spar floating wind turbines. Mar. Struct. 2020, 72, 102771. [Google Scholar] [CrossRef]
  108. Walker, J.; Coraddu, A.; Collu, M.; Oneto, L. Digital twins of the mooring line tension for floating offshore wind turbines to improve monitoring, lifespan, and safety. J. Ocean. Eng. Mar. Energy 2022, 8, 1–16. [Google Scholar] [CrossRef]
  109. Yang, R.Y.; Chuang, T.C.; Zhao, C.; Johanning, L. Dynamic Response of an Offshore Floating Wind Turbine at Accidental Limit States—Mooring Failure Event. Appl. Sci. 2022, 12, 1525. [Google Scholar] [CrossRef]
  110. Liang, G.; Merz, K.; Jiang, Z. Modeling of a Shared Mooring System for a Dual-Spar Configuration. In Proceedings of the ASME 2020 39th International Conference on Ocean, Offshore and Arctic Engineering, Online, 3 August 2020; Volume 9. [Google Scholar]
  111. SINTEF Ocean. RIFLEX Theory Manual; SINTEF Ocean: Trondheim, Norway, 2021. [Google Scholar]
  112. Thiagarajan, K.P.; Constantinides, Y.; Finn, L. CFD Analysis of Vortex-Induced Motions of Bare and Straked Cylinders in Currents. In Proceedings of the ASME 2005 24th International Conference on Ocean, Offshore and Arctic Engineering, Halkidiki, Greece, 12–17 June 2005; Volume 3, pp. 903–908. [Google Scholar]
  113. Oakley, O.H., Jr.; Constantinides, Y.; Navarro, C.; Holmes, S. Modeling Vortex Induced Motions of Spars in Uniform and Stratified Flows. In Proceedings of the ASME 2005 24th International Conference on Ocean, Offshore and Arctic Engineering, Halkidiki, Greece, 12–17 June 2005. [Google Scholar]
  114. Halkyard, J.; Sirnivas, S.; Holmes, S.; Constantinides, Y.; Oakley, O.H., Jr.; Thiagarajan, K. Benchmarking of Truss Spar Vortex Induced Motions Derived From CFD With Experiments. In Proceedings of the ASME 2005 24th International Conference on Ocean, Offshore and Arctic Engineering, Halkidiki, Greece, 12–17 June 2005; Volume 3, pp. 895–902. [Google Scholar]
  115. Oakley, O.H., Jr.; Constantinides, Y. CFD Truss Spar Hull Benchmarking Study. In Proceedings of the ASME 2007 26th International Conference on Offshore Mechanics and Arctic Engineering, San Diego, CA, USA, 10–15 June 2007; Volume 3, pp. 703–713. [Google Scholar]
  116. Holmes, S. Predicting Spar VIM Using CFD. In Proceedings of the ASME 2008 27th International Conference on Ocean, Offshore and Arctic Engineering, Estoril, Portugal, 15–20 June 2008; Volume 5, pp. 895–900. [Google Scholar]
  117. Lefevre, C.; Constantinides, Y.; Kim, J.W.; Henneke, M.; Gordon, R.; Jang, H.; Wu, G. Guidelines for CFD Simulations of Spar VIM. In Proceedings of the ASME 2013 32nd International Conference on Ocean, Offshore and Arctic Engineering, Nantes, France, 9 June 2013; Volume 7. [Google Scholar]
  118. Vinayan, V.; Antony, A.; Halkyard, J.; Kim, S.J.; Holmes, S.; Spernjak, D. Vortex-Induced Motion of Deep-Draft Semisubmersibles: A CFD-Based Parametric Study. In Proceedings of the ASME 2015 34th International Conference on Ocean, Offshore and Arctic Engineering, St John’s, NL, Canada, 31 May 2015; Volume 2. [Google Scholar]
  119. Kim, S.J.; Spernjak, D.; Holmes, S.; Vinayan, V.; Antony, A. Vortex-Induced Motion of Floating Structures: CFD Sensitivity Considerations of Turbulence Model and Mesh Refinement. In Proceedings of the ASME 2015 34th International Conference on Ocean, Offshore and Arctic Engineering, St John’s, NL, Canada, 31 May 2015; Volume 2. [Google Scholar]
  120. Kara, M.C.; Kaufmann, J.; Gordon, R.; Sharma, P.P.; Lu, J.Y. Application of CFD for Computing VIM of Floating Structures. In Proceedings of the Offshore Technology Conference, Houston, TX, USA, 5–8 May 2016. [Google Scholar]
  121. Kim, S.J.; Spernjak, D.; Mejia-Alvarez, R.; Vinayan, V.; Sterenborg, J.; Antony, A.; Holmes, S.; Halkyard, J. Numerical simulation of vortex-induced motion of a deep-draft paired-column semi-submersible offshore platform. Ocean. Eng. 2018, 149, 291–304. [Google Scholar] [CrossRef]
  122. Jang, H.; Agrawal, M.; Lee, D.; Xu, W.; Huang, J.; Jiang, F.; Wu, J.; Croonenborghs, E. A Joint-Industry Effort to Develop and Verify CFD Modeling Practice for Predicting Hydrodynamic Coefficients on Bare Riser Surfaces. In Proceedings of the ASME 2021 40th International Conference on Ocean, Offshore and Arctic Engineering, Online, 21–30 June 2021; Volume 1. [Google Scholar]
  123. Jang, H.; Kim, D.H.; Agrawal, M.; Loubeyre, S.; Lee, D.; Huang, J.; Law, Y.Z.; Magee, A.; Koop, A. A Joint-Industry Effort to Develop and Verify CFD Modeling Practice for Vortex-Induced Motion of a Deep-Draft Semi-Submersible. In Proceedings of the ASME 2021 40th International Conference on Ocean, Offshore and Arctic Engineering, Online, 21–30 June 2021; Volume 1. [Google Scholar]
  124. Jang, H.; Agrawal, M.; Huang, J.; Jiang, F.; Wu, J.; Lie, H.; Croonenborghs, E. A Joint-Industry Effort to Develop and Verify CFD Modeling Practice for Predicting Hydrodynamic Coefficients of Risers: Staggered Buoyancy Module and Straked Riser. In Proceedings of the ASME 2022 40th International Conference on Ocean, Offshore and Arctic Engineering, Online, 21–30 June 2022. [Google Scholar]
  125. Li, X.; Xiao, Q.; Gonçalves, R.T.; Peyrard, C. A coupled wave-current-structure study for a floating offshore wind turbine platform. In Proceedings of the ASME 2022 41st International Conference on Ocean, Offshore and Arctic Engineering, Hamburg, Germany, 6–10 June 2022. [Google Scholar]
  126. Skaare, B.; Nielsen, F.G.; Hanson, T.D.; Yttervik, R.; Havmøller, O.; Rekdal, A. Analysis of measurements and simulations from the Hywind Demo floating wind turbine. Wind Energy 2015, 18, 1105–1122. [Google Scholar] [CrossRef]
  127. Driscoll, F.; Jonkman, J.; Robertson, A.; Sirnivas, S.; Skaare, B.; Nielsen, F.G. Validation of a FAST Model of the Statoil-hywind Demo Floating Wind Turbine. Energy Procedia 2016, 94, 3–19. [Google Scholar] [CrossRef] [Green Version]
  128. Jacobsen, A.; Godvik, M. Influence of wakes and atmospheric stability on the floater responses of the Hywind Scotland wind turbines. Wind Energy 2021, 24, 149–161. [Google Scholar] [CrossRef]
  129. Govardhan, R.; Williamson, C. Vortex-induced motions of a tethered sphere. J. Wind. Eng. Ind. Aerodyn. 1997, 69–71, 375–385. [Google Scholar] [CrossRef]
  130. Pesce, C.P.; Amaral, G.A.; Mendes, B.; Oliveira, E.L.; Franzini, G.R. A Model to Assess the Susceptibility of a Multicolumn FOWT Platform to Vortex-Induced Motions in Early Design Stages. In Proceedings of the ASME 2021 40th International Conference on Ocean, Offshore and Arctic Engineering, Online, 21–30 June 2021; Volume 9. [Google Scholar]
  131. Martins, F.; Avila, J. Three-dimensional CFD analysis of damping effects on vortex-induced vibrations of 2DOF elastically-mounted circular cylinders. Mar. Struct. 2019, 65, 12–31. [Google Scholar] [CrossRef]
  132. Christensen, A.Y. Analysis of Vortex Induced Motions for Floating Wind Turbines. Master’s Thesis, Norwegian University of Science and Technology, Trondheim, Norway, 2019. [Google Scholar]
  133. Han, P.; Pan, G.; Tian, W. Numerical simulation of flow-induced motion of three rigidly coupled cylinders in equilateral-triangle arrangement. Phys. Fluids 2018, 30, 125107. [Google Scholar]
Figure 3. VIV and VIM. (a) Sketch illustrates VIV. Fluid–structure interaction due to alternative vortex shedding. Two degree-of-freedom (DOF) motions of a cross-section. (b) VIM is a particular case of VIV on cylinders with low aspect ratio A R , small mass ratio ( m * ), at least 2 DOF and high Reynolds numbers. Sketch inspired of Figure 2 of [11].
Jmse 10 01021 g003
Figure 4. Strouhal number vs. Reynolds number. The original St versus Re curve as collated by [13] seen in the background in gray. The open circles denote the bulk of the data discussed and presented in [12,14] relating to Strouhal number, where the squares are some of the data, which were referenced by Lienhard in the development of the S t versus R e curve. Figure from [12,14].
Jmse 10 01021 g004
Figure 6. Influence of the boundary layer in the sub-critical to post-critical flow regimes, smooth circular cylinder in steady flow [31].
Jmse 10 01021 g006
Figure 7. Collection of mean drag coefficients on a circular cylinder as a function of Reynolds number and surface roughness ratio [18,19,20,32,33,34,35,36].
Jmse 10 01021 g007
Figure 9. A typical VIM design curve: normalized VIM design amplitude versus reduced velocity, reproduced Figure 10 of [64].
Jmse 10 01021 g009
Figure 10. Main dimension parameters of typical floaters of FOWTs. (a) Spar, sketch inspired of Figure 7a of [11]. (b) Three-column semi-submersible, sketch inspired of Figure 2 of [73]. (c) Four-column semi-submersible, sketch inspired of Figure 9 of [11].
Jmse 10 01021 g010
Figure 11. Full-scale VIV model test set-up at SINTEF Ocean [22,68]. (a) Vertical set-up [22]. (b) Horizontal set-up [68].
Jmse 10 01021 g011
Figure 12. (A) The Hywind Scotland wind park is located 25 km east of Peterhead in Scotland. (B) Layout of the wind park consisting of five turbines labeled HS1 to HS5. A blue arrow marks the distance of 9 rotor diameters (RDs) between the turbines [128].
Jmse 10 01021 g012
Table 1. Qualitative behaviour for the response frequencies of long and short cylinders ( f C F : cross-flow; f I L : in-line; f s = S t U / D : vortex-shedding frequency). Adapted from [11].
U r CF motionIL motion
Long cylinder
<1.0no VIVno VIV
1.0–2.5 f C F 0 f I L = f n = 2 f s
2.0–4.0 f C F = f n / 2 = f s f I L = f n = 2 f s
4.0–5.0 f C F f n f s f I L 2 f n 2 f s
5.0–12.5 0.8 f n f C F 1.1 f n , f s f n f I L 2 f n 2 f s
>12.5no VIVno VIV
Short cylinder
2.5–4.0 f C F f n / 2 f I L 2 f C F
4.0–5.0 f C F f n f C F f I L 1.2 f C F
5.0–7.0 f n f C F 0.75 f n 1.2 f C F f I L 2 f C F
>7.0 0.75 f n < f C F 1.1 f n f I L 2 f C F
Table 2. Indicative natural frequencies (Hz) and natural periods (s) of ‘rigid-body motion modes’ of floating offshore wind turbines. Adapted ‘Table 2’ of [54].
MotionFrequency/PeriodSparSemi-SubmersibleTLP
Surge/sway f n [Hz]0.005–0.0250.008–0250.015–0.05
T n [s]40–18540–12020–60
Heave f n [Hz]0.02–0.050.025–0.070.2–2
T n [s]20–5015–400.5–5.0
Pitch/roll f n [Hz]0.02–0.040.02–0.040.2–1.0
T n [s]25–5025–501.0–5.0
Yaw f n [Hz]0.025–0.20.0125–0.020.03–0.2
T n [s]5–4050–805–30
Table 3. Sensors and field measurements of FOWTs.
SensorMeasurementReference
Wave rider buoyWaves and currents[126,127]
Sonic anemometerWind speed[126,127,128]
Wave radarsAir-gap/Wave elevations[126,127]
Acoustic current profilerAverage current profiles[127]
Global Positioning System (GPS)Motion of floaters[67]
Motion reference unit (mruu)6 DOF motions of spar[126,128]
Strain gaugeBending moment of tower and substructure[126]
Force sensorMooring line tension[126]
Wind turbine controlTurbine rotational speed[126,127]
Wind turbine controlBlade pitch angle[126,127]
Blade-root strains in the flap and edge directions[127]
Low-speed shaft torque[127]
Table 4. List of selected VIM and relevant VIV research.
ObjectiveReferenceMethodScaleL [m]D [m] Re max
FOWT spar[85]Experiment1:4700.2540.02 2.6 × 10 3
Spar[75]Experiment-5.01.5 7.0 × 10 5
Spar[75]Experiment-1.00.3 6.9 × 10 4
Spar (straked)[30]Experiment1:22.32.951.75 4.0 × 10 5
Spar (straked)[30]Experiment1:651.010.6 4.0 × 10 5
Spar (straked)[30]Experiment1:142.80.460.27 4.0 × 10 5
Truss spar (straked)[71]Experiment1:22.32.951.75 10 6
Truss spar[70]Experiment1:403.851.4 1.3 × 10 6
Truss spar (straked)[69]Experiment1:47NANANA
Mono-column[77]Experiment-1.01.0 4.5 × 10 5
Mono-column[77]Experiment-0.5360.8 1.8 × 10 5
FOWT semi[72]Experiment1:730.440.98 7.0 × 10 4
Semi[99]Experiment1:56.5NANA 10 4 10 5
Semi[96]Experiment1:100NANA 7.0 × 10 3 8.0 × 10 4
Semi[66]Experiment1:54NANANA
Circular cylinder[23]Experiment-6.2330.325 2.4 × 10 5 8.0 × 10 6
Circular cylinder[21,22]Experiment1:13.270.533 9.0 × 10 4 6.0 × 10 5
Circular cylinder[19]Experiment1:13.260.533 7.5 × 10 4 5.5 × 10 5
Circular cylinder[80]Experiment-0.290.125 7.0 × 10 4
Tethered sphere[129]Experiment 1.4 × 10 4
Semi-FOWT[130]CFD-ROM1:730.440.98 7.0 × 10 4
Circular cylinder[131]CFD- π D D 1.5 × 10 3 3.5 × 10 4
Spar-FOWT[132]CFD-OpenFOAMNANANA > 3.0 × 10 6
Semi-FOWT[132]CFD-OpenFOAMNANANA > 3.0 × 10 6
Semi[121]CFD-DDES-SST 2D1:540.987*0.359 3.0 × 10 4
Triple cylinder[133]CFD-RANS 2D--- 1.0 × 10 3 3.0 × 10 4
Semi[118]CFD1:54--23,500, 47,000
Semi[119]CFD-DDES/URANS1:54-- 1.0 × 10 5
Truss spar[114]CFD-DES-1.4/3.8(truss)0.741 4.0 × 10 4 1.5 × 10 5
Semi[125]CFD-OpenFoam1:730.440.98 7.0 × 10 4
Spar-FOWT[64]FEM, FD&TD1:176 *14.4 3.5 × 10 4
Spar/Mono-column[59,77]Wake oscillator-0.536, 1.0, 5.00.8, 1.0, 0.3, 1.5 2.4 × 10 4 7.0 × 10 5
* Draft.
Publisher’s Note: MDPI stays neutral with regard to jurisdictional claims in published maps and institutional affiliations.

