Article

Lagrangian Observation of the Kuroshio Current by Surface Drifters in 2019

1
State Key Laboratory of Marine and Environmental Science, College of Ocean and Earth Sciences, Xiamen University, Xiamen 361102, China
2
Southern Marine Science and Engineering Guangdong Laboratory (Zhuhai), Zhuhai 519000, China
*
Author to whom correspondence should be addressed.
J. Mar. Sci. Eng. 2022, 10(8), 1027; https://doi.org/10.3390/jmse10081027
Submission received: 27 June 2022 / Revised: 22 July 2022 / Accepted: 25 July 2022 / Published: 26 July 2022
(This article belongs to the Special Issue Advance in Circulation and Internal Wave Dynamics)

Abstract

:
In this research, the features of the Kuroshio Current in 2019 were studied based on the observations of 29 self-developed surface current experiment drifters deployed in the western Pacific Ocean and the East China Sea. The Kuroshio flow pattern and velocity magnitude observed in 2019 were largely consistent with the climatology based on the historical drifter dataset, but they still exhibited distinctive characteristics. The intrusion of the Kuroshio into the South China Sea in the spring was observed by a group of drifters crossing the Luzon Strait from east to west, which is a notable departure from the non-intrusion pattern noted to occur in the spring in most of the historical records. A strong intrusion of the Kuroshio into the East China Sea was also observed, taking an anti-cyclonic turn in the northeast of Taiwan Island. Both the drifter trajectories and altimeter-derived dynamical topography captured the large meander pattern of the Kuroshio south of Japan in 2019, with the flow path having a maximum offshore distance of 470 km. In addition, Lagrangian statistics (lateral diffusivity, integral time scale, and integral space scale) were estimated for four selected regions with adequate drifter samplings. The lateral diffusivity had large values along the Kuroshio segment in the East China Sea and small values on the continental shelf of the East China Sea. The integral time scales for the four regions ranged from 0.8 to 3.7 days, with a corresponding integral space scale of 19~128 km.

1. Introduction

The Kuroshio Current is the western boundary current in the North Pacific Ocean. It originates east of the Philippine Islands, flows along the east coast of Taiwan Island and then the continental slope of the East China Sea (ECS), and eventually turns eastward south of Japan. As a driving force for the marginal seas around China, the Kuroshio plays an important role by transporting mass, heat, and ecological elements [1]. Based on a composite analysis of historical observations by satellite altimeters and surface drifters, the detailed features of the Kuroshio (i.e., current magnitude, transport volume, flow pattern, and axis location) have been found to have significant seasonal variations [2,3]. The mean velocity of the Kuroshio has significant interannual variabilities, with a positive correlation with La Nina events [4] and it also exhibited a remarkable long-term weakening trend during the recent global warming hiatus [5]. Sustained observations on the Kuroshio are still needed for a better understanding of these variabilities.
The lack of a constraining continental shelf on the path of the Kuroshio at the Luzon Strait (LS) makes the current flow northwestward and intrude into the South China Sea (SCS), especially during the northeast monsoon in winter [6,7,8,9]. However, the intrusion of the Kuroshio is regarded as a transient phenomenon rather than a persistent circulation pattern [10]. As a western boundary current flowing by the gap of the LS, multiple steady states of the Kuroshio and the nonlinear hysteresis of the intrusion have also been demonstrated [11,12].
The cross-slope transport of the Kuroshio onshore to the ECS has been reported by observations [13,14,15] and numerical models [16,17] in previous studies. More recent observations based on surface drifters and coastal radars have demonstrated the seasonal cycle of the water exchange between the Kuroshio and the ECS in detail [18], and it is modulated by the interaction between the intra-diurnal tides and ocean currents north of Taiwan [19].
The Kuroshio south of Japan exhibits a peculiar bimodal path, which are the large meander (LM) path and the non-large meander (NLM) path; the NLM path can be further distinguished into the nearshore and offshore NLM paths [20]. The flow pattern with an irregular alternation between the LM and NLM suggests that the Kuroshio has significant interannual and long-term variations [21,22,23].
Satellite-tracked surface drifters have been used for ocean circulation observations since the 1970s. Typical drifters are now equipped with an accurate global positioning system (GPS) for location, with data transmission using satellite systems such as Iridium. The oceanographic community developed a standardized, lightweight, easily deployed drifter with a semirigid drogue under the Surface Velocity Program (SVP). This drifter became the foundation for the global drifter array of NOAA’s Global Drifter Program (GDP) [24]. The program has accumulated more than 25,000 drifter deployments since 1979, and it is now maintaining a global 5° × 5° array of about 1300 satellite-tracked surface drifters in operation. This global array of drifters is very useful for studies on large-scale circulations in climatology or long-term variations, but the distribution of the drifters is still relatively sparse for regional oceans and snapshot analyses. China’s BeiDou Navigation Satellite System (BDS) has provided a new alternative for drifters’ location and telemetry in recent years. With its relatively lower hardware and service price, we have opportunities to deploy the drifters by an even larger amount.
Lagrangian dispersion is an important process in the ocean, influencing the transport of heat, salinity, and other biogeochemical tracers. Taylor [25] was regarded as the pioneer in quantifying the motion of Lagrangian particles as a diffusivity coefficient; they provided the method for extracting diffusivity from individual drifters by integrating the Lagrangian velocity autocorrelation. Davis [26] advanced this method by taking inhomogeneity into account and derived a generalized advection–diffusion equation to describe the evolution of passive tracers in the ocean. As reviewed by Lumpkin et al. [27], drifters are the only instruments suitable for measuring surface or near-surface dispersion, which is a Lagrangian quantity by its very nature. With the drifter dataset by GDP, Zhurbas and Oh [28] calculated the lateral diffusivity and Lagrangian scales in 5° × 5° bins across the whole Pacific Ocean. High values of diffusivity have been observed in the Kuroshio and other areas. Lagrangian statistics in the SCS and LS have also been reported by Qian et al. [29] in selected regions with adequate drifter samplings. These calculations are all for climatological studies and used the entire historical drifter dataset.
In the following sections, we analyze the Kuroshio features observed by a batch of self-developed drifters in 2019. Several important segments on the Kuroshio path were extracted for a detailed comparison with climatological status. We also make an estimation of the Lagrangian statistics (i.e., diffusivity, integral time scale, and space scale) in 2019 using these drifter data instead of the whole historical dataset.

2. Data and Methods

During two separate cruise expeditions to the West Pacific (WP) and the ECS from March to April in 2019, we deployed a batch of self-developed, satellite-tracked drifters, which are named Surface Current Experiment (SUCE) drifters. These drifters have similar designs and configurations as the standard GDP drifters, with a surface floating sphere and a holey-sock drogue. The surface float is integrated with GPS and BDS modules for positioning and telemetry. The horizontal surface current velocities were derived based on the drifter trajectories with a sampling interval of 1 h, in accordance with the data quality control procedures of GDP. In this study, we chose the observation data of 29 drifters (trajectories are shown in Figure 1, and deployment information is listed in Table 1) close to the Kuroshio Current’s path from the total dataset. The drifter set can mainly be divided into three groups: (1) 8 drifters deployed near the LS area from 16–18 March 2019; (2) 13 drifters deployed in the WP from 19 March to 17 April; and (3) 8 drifters deployed in the ECS from 13–23 April. Most of the drifter trajectories lasted until July or August, deriving a total data amount of about 4000 drifter days.
The drifter data product by the GDP was also used in this study. The current measurements were interpolated with a temporal interval of 6 h [30]. Although the floats distributing around the Kuroshio Current in 2019 were scarce, the historical data from 1979 to 2019 were synthesized to provide a climatological background of the surface current.
We used the sea surface height data by satellite altimetry in 2019 as an indication of geostrophic surface current. The Level 4 data product of the global gridded absolute dynamic topography (ADT) was provided by E.U. Copernicus Marine Service Information (CMEMS), with a spatial resolution of 0.25° × 0.25° and a temporal interval of 1 day. This product was processed by the DUACS multi-mission altimeter data processing system [31], incorporating data sources from all altimeter missions: Jason-3, Sentinel-3A, HY-2A, SARAL/AltiKa, Cryosat-2, Jason-2, Jason-1, T/P, Envisat, GFO, and ERS1/2.

3. Surface Current Observation

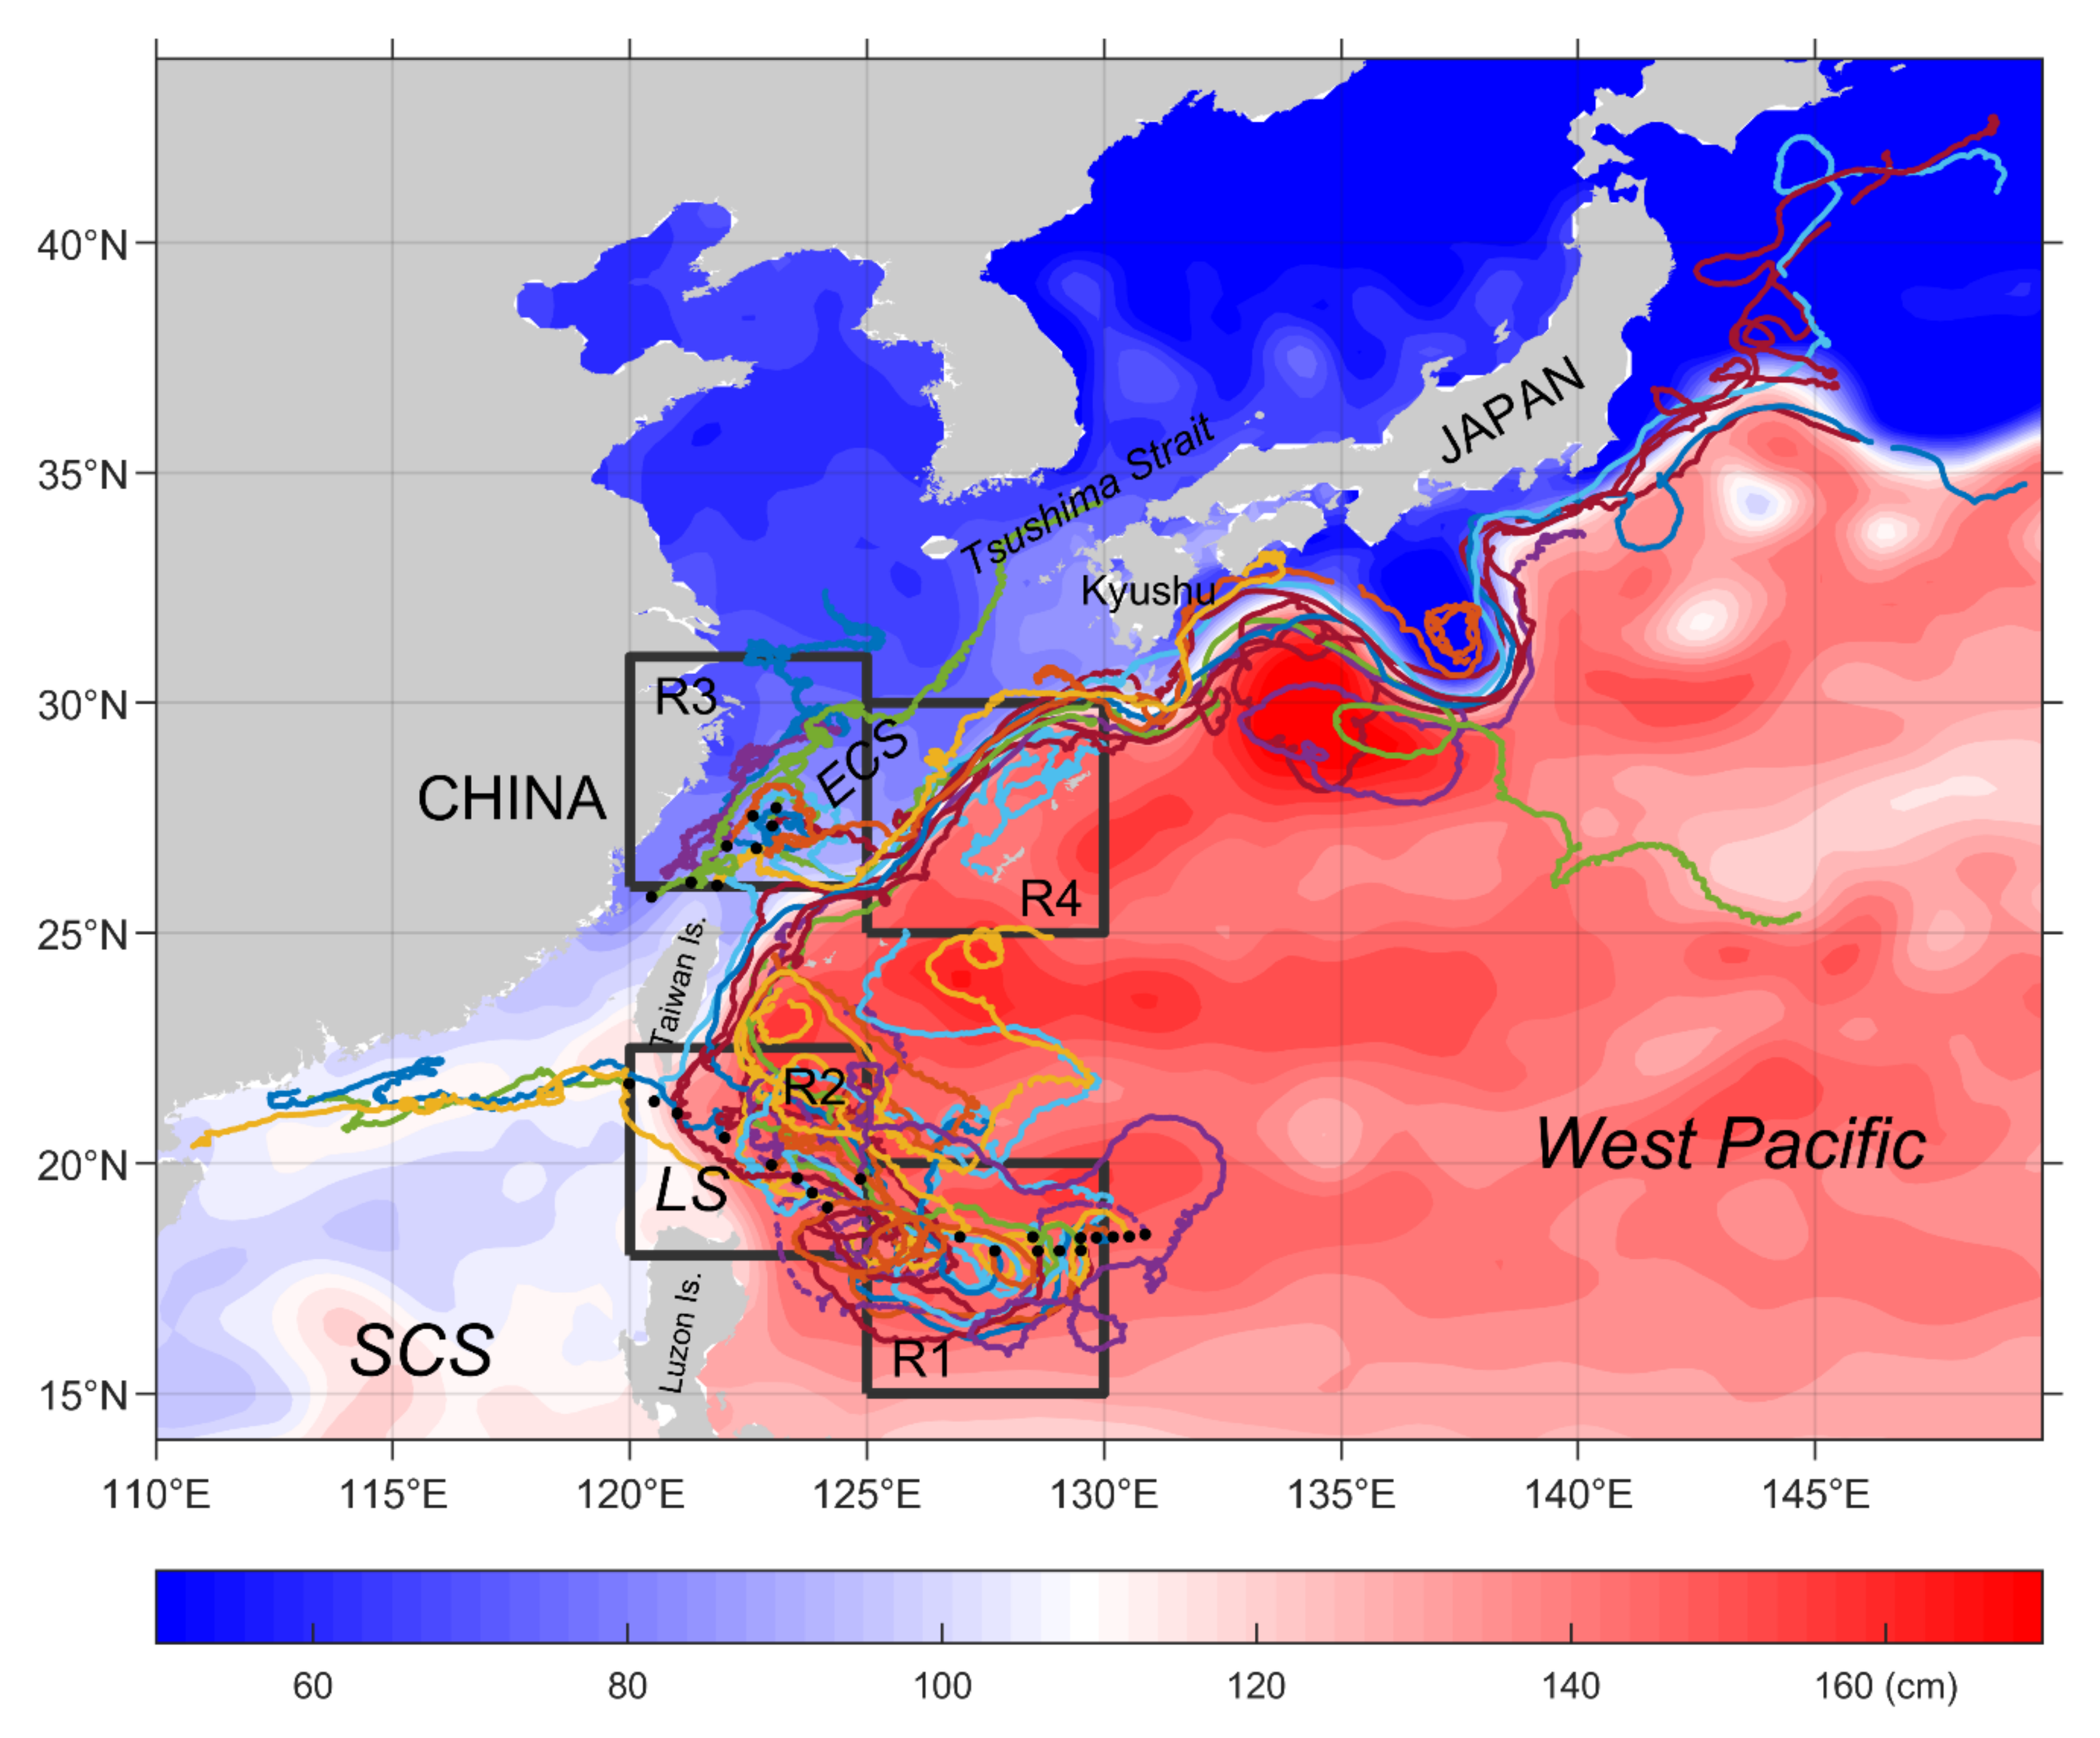
3.1. Overall Trajectories

Figure 1 shows the overall deployment positions and trajectories of the 29 drifters in this study, superimposed on the ADT map, averaged from March to July in 2019. Since the three deployment regions were close to the Kuroshio path, most of the drifters were entrained into the Kuroshio Current system. The Kuroshio streamline can be clearly demonstrated by the concentrated trajectory lines, and it is also consistent with the significant ADT slope along the 110 cm contour. Most drifters flowed all the way from the LS, passing by the east coast of Taiwan Island, along the shelf break of the ECS, to the south of Japan and the Kuroshio Extension. The overall current speed along the Kuroshio was of O(1) m/s, and multiple segments of the path were observed to have a velocity larger than 1.5 m/s, with a maximum value of 2.2 m/s on the southeast of Japan. Several drifters deviated from the main stream in the LS and northeast of Taiwan Island and then entered the SCS or the ECS, indicating significant mass exchanges between the Kuroshio and the adjacent marginal seas. The LM pattern of the Kuroshio south of Japan, together with the involved dipole of cyclonic and anti-cyclonic eddies, showed significant differences from the nearshore climatological path of the Kuroshio.
The detailed features of the Kuroshio captured by the drifters are shown in Section 3.3, Section 3.4 and Section 3.5, where key segments of the Kuroshio in the LS, northeast of Taiwan Island and south of Japan, are discussed, respectively.

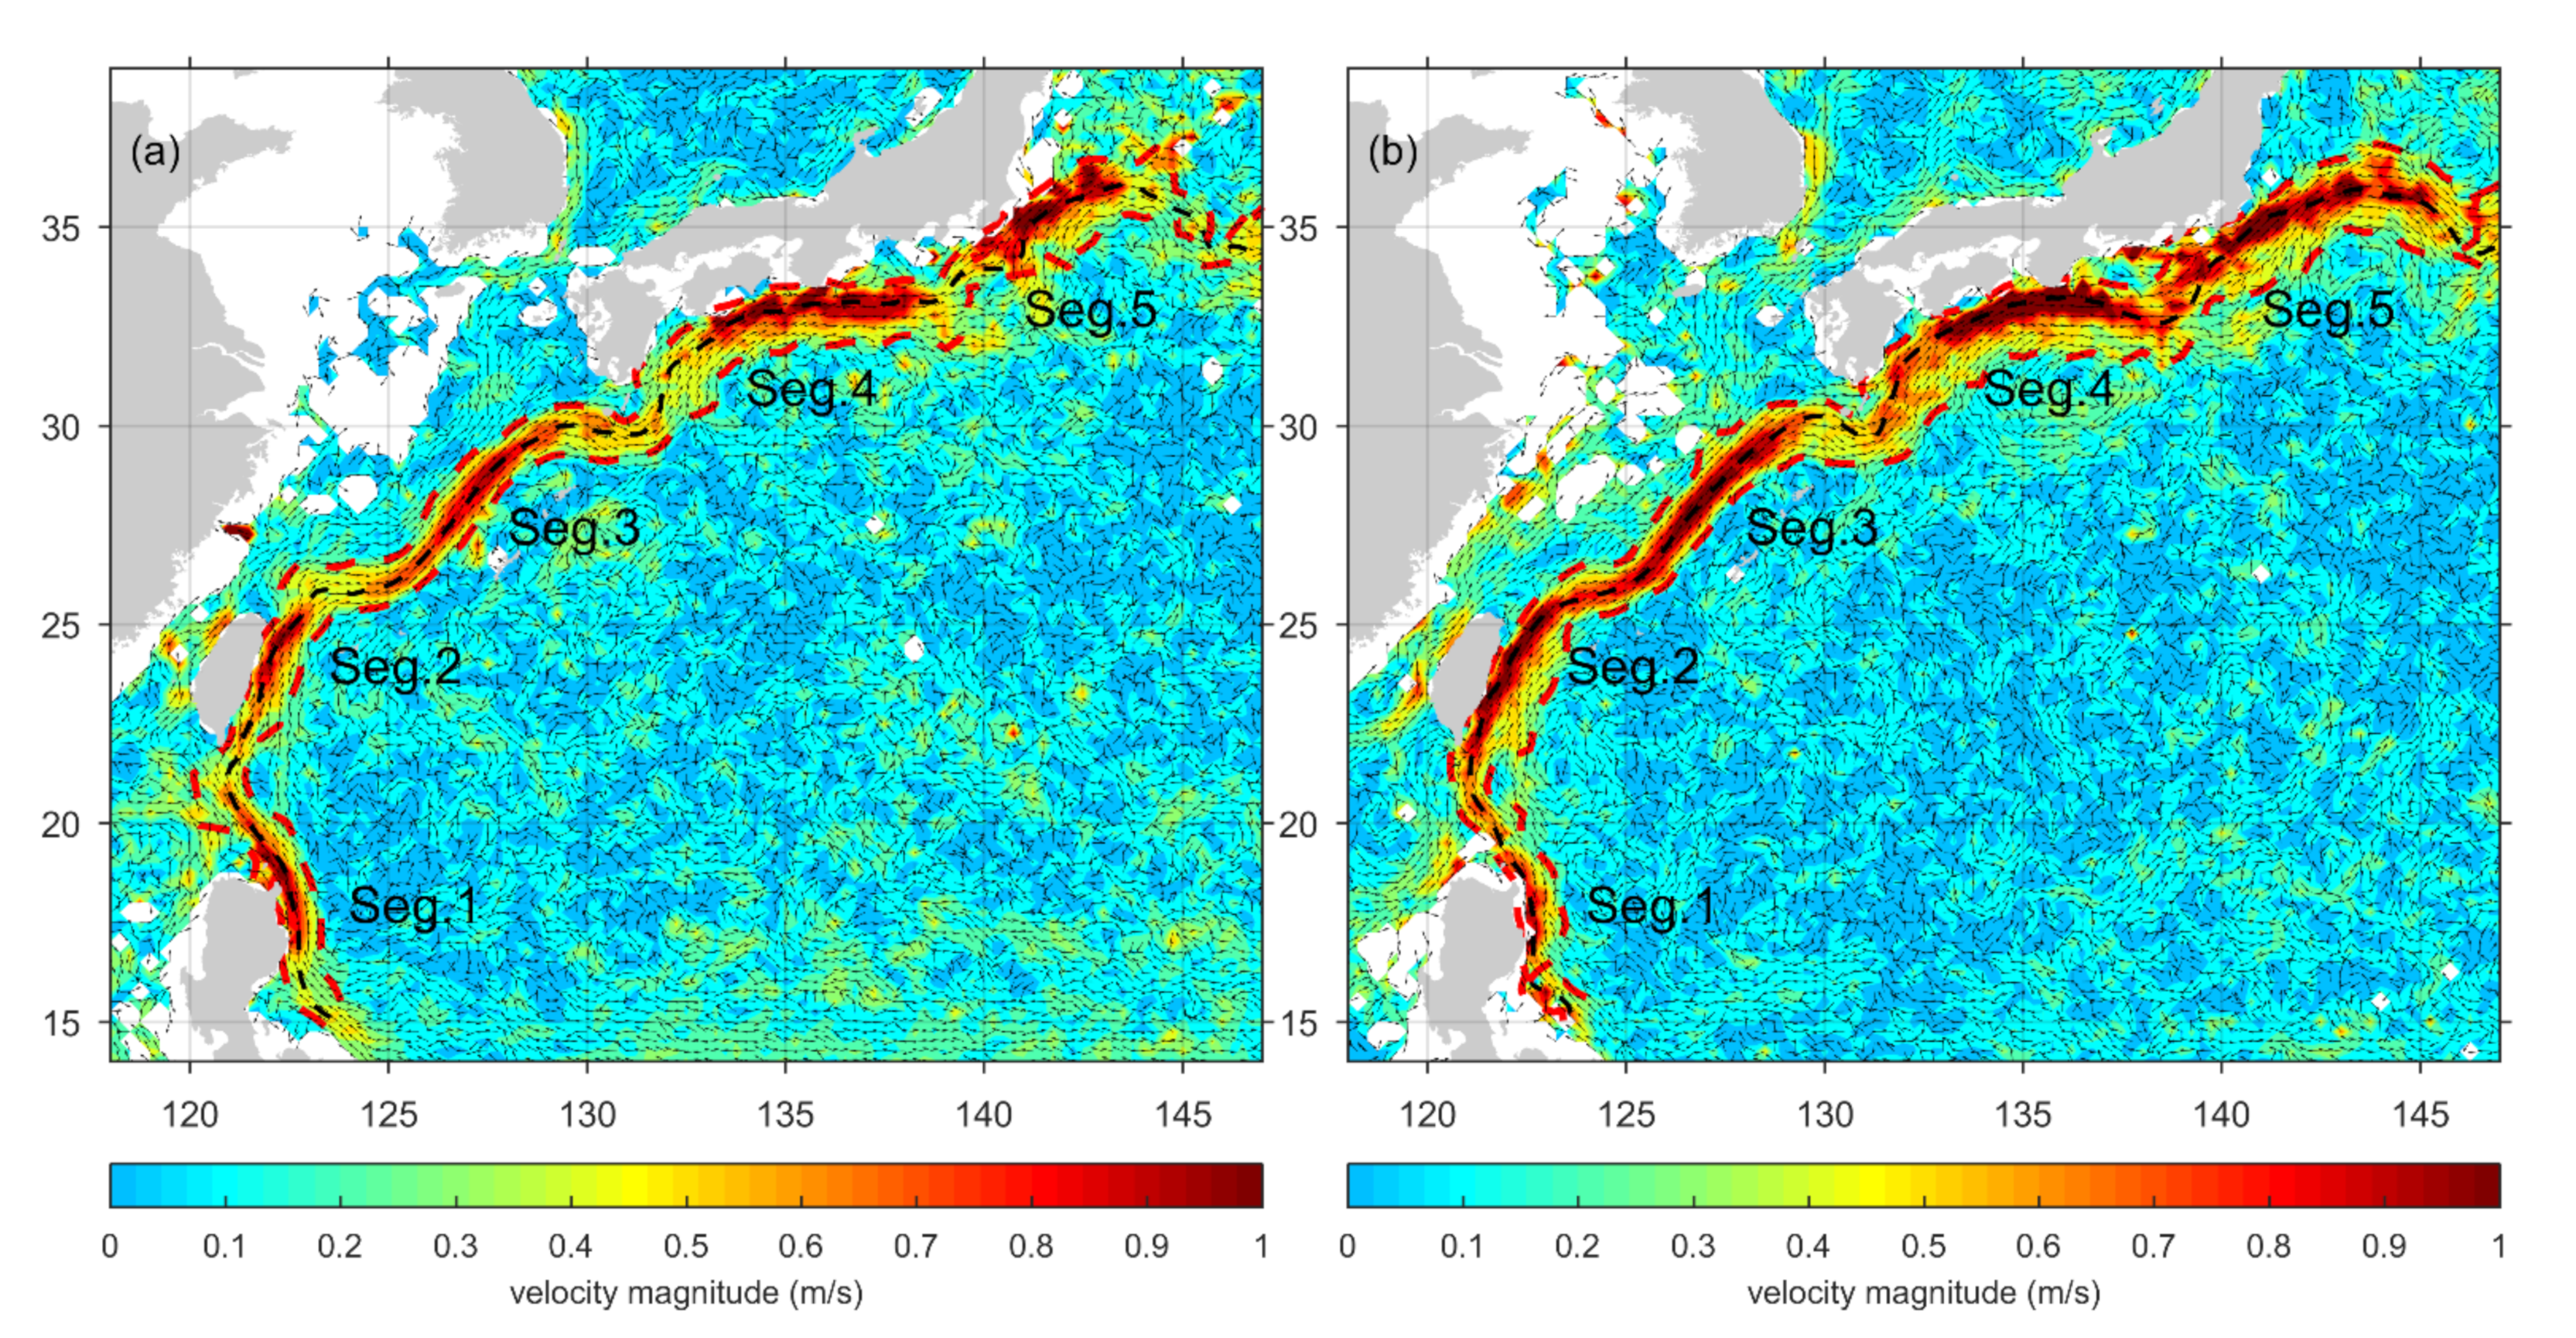
3.2. Climatological Current Field

Based on the newly updated GDP drifter dataset up to 2019, we recalculated the climatological surface current field in the WP for spring (from March to May) and summer (from June to August) by ensemble averaging the discrete velocity observations into geographic bins with a resolution of 0.25° × 0.25° (Figure 2). The quality and reliability of such climatological maps are being improved every year due to the accumulated drifter number and the increased percentage of drifters equipped with GPS instead of Argos as the positioning source.
The axis and boundary of the Kuroshio were then determined using the following method [21]. At the starting point within the Kuroshio, we provided a subsidiary line (length about 200 km) that crossed the Kuroshio perpendicularly. The current velocity was interpolated on the subsidiary line, and the position of the axis Pmax was determined as the point where the downstream current averaged over a fixed width (about 70 km) reaches a maximum. The subsidiary line was then updated to a new position (Pmax + Δr) away from the previous point by Δr (about 10 km) downstream of the Kuroshio (downstream direction determined by the velocity averaged over the same fixed width at Pmax). Then, the axis position on this subsidiary line was determined using the same procedure as described above. By repeating this, the line connecting the series of Pmax points was finally regarded as the Kuroshio axis. Finally, a current speed of 0.3 m/s was the cutoff value to determine the boundary on either side away from the axis [32].
As illustrated in Figure 2, the current speed along the Kuroshio had discrete maxima at five segments: (1) on the northeast of Luzon Island, (2) on the east of Taiwan Island, (3) along the shelf break of the ECS, (4) on the south of Japan, and (5) on the southeast of Japan. Generally, the Kuroshio has similar flow patterns in the two seasons. However, the current speed is larger in summer (a maximum speed of 1.8 m/s on the south of Japan on Seg. 4) than it is in spring (a maximum speed of 1.5 m/s also on Seg. 4). The individual observations are supposed to have larger values without the smoothing effect of the bin average. The estimated axis and boundary have distinctive seasonal variations in the features of turning, looping, bifurcation, and intrusion to the marginal seas [2]. In the following sections, we use these climatological maps as a baseline for comparisons with the Kuroshio in 2019.

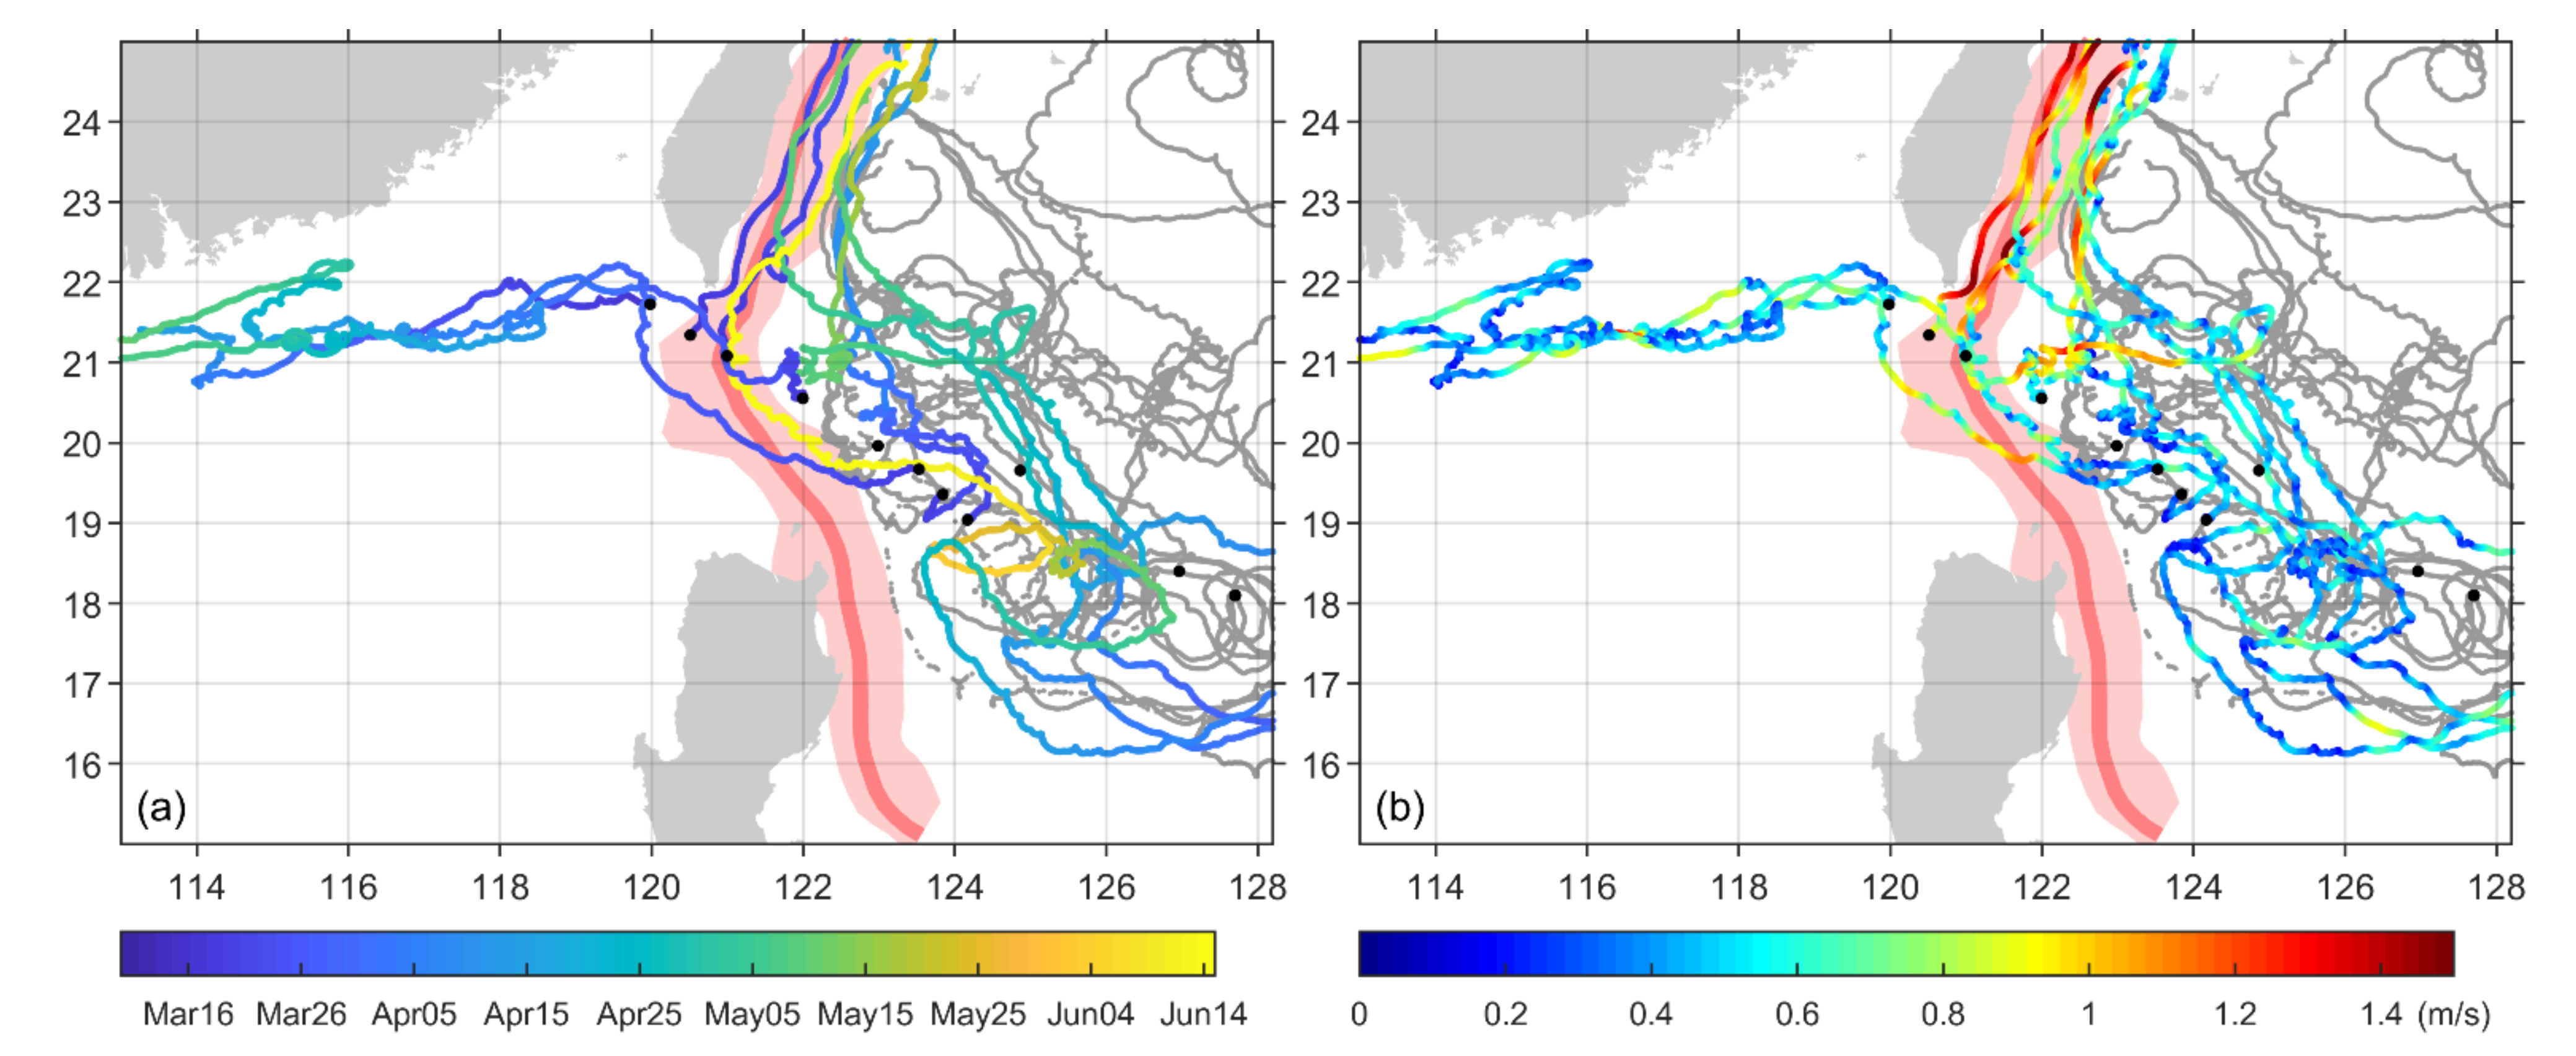
3.3. Kuroshio around the Luzon Strait

The drifter trajectories and surface current speed distribution in the LS and adjacent areas in spring 2019 are shown in Figure 3. Current speeds away from the Kuroshio were basically below 0.8 m/s, while large velocities were only found along the east coast of Taiwan, with a maximum value of 1.5 m/s.
Most of the drifters deployed in this region had direct contact with the Kuroshio. Based on the final routes, these drifters can be divided into three categories. Category I had three drifters (Drifters 927675, 927674, and 927692) floating into the SCS and all the way to the southern coast of China, designated as the “intrusion to the SCS” category. Category II had eight drifters captured by the Kuroshio floating northward in accordance with the climatological Kuroshio path, designated as the “main stream” category. Category III had the drifters that either had no engagement with the Kuroshio or that were briefly entrained to the Kuroshio and soon shed away from the main current to form an eddy loop.
Using the drifter dataset from 1989 to 2002, Centurioni et al. [6] concluded that the drifters cross the LS and reach the interior of the SCS only between October and January. Statistics by Hu et al. [2] showed that no drifter intrusions to the SCS were found during springtime based on the records from 1979 to 2003. However, the intrusions to the SCS by Category I drifters in this study were significant exceptions to the observation results by previous studies. These drifters crossed the LS from east to west with basically zonal paths, and they almost shared the same routes after entering the SCS. Some other drifters deployed at neighboring stations with little time difference had very different destinies. Drifter 927666 (Category II), for an example, was deployed only 6 h before Drifter 927674 (Category I) at an adjacent station along the section through the LS, but it flowed away along the Kuroshio mainstream rather than into the SCS. Such a phenomenon suggests that tides and other high-frequency processes in this region had a strong influence on the Lagrangian transport of water masses.

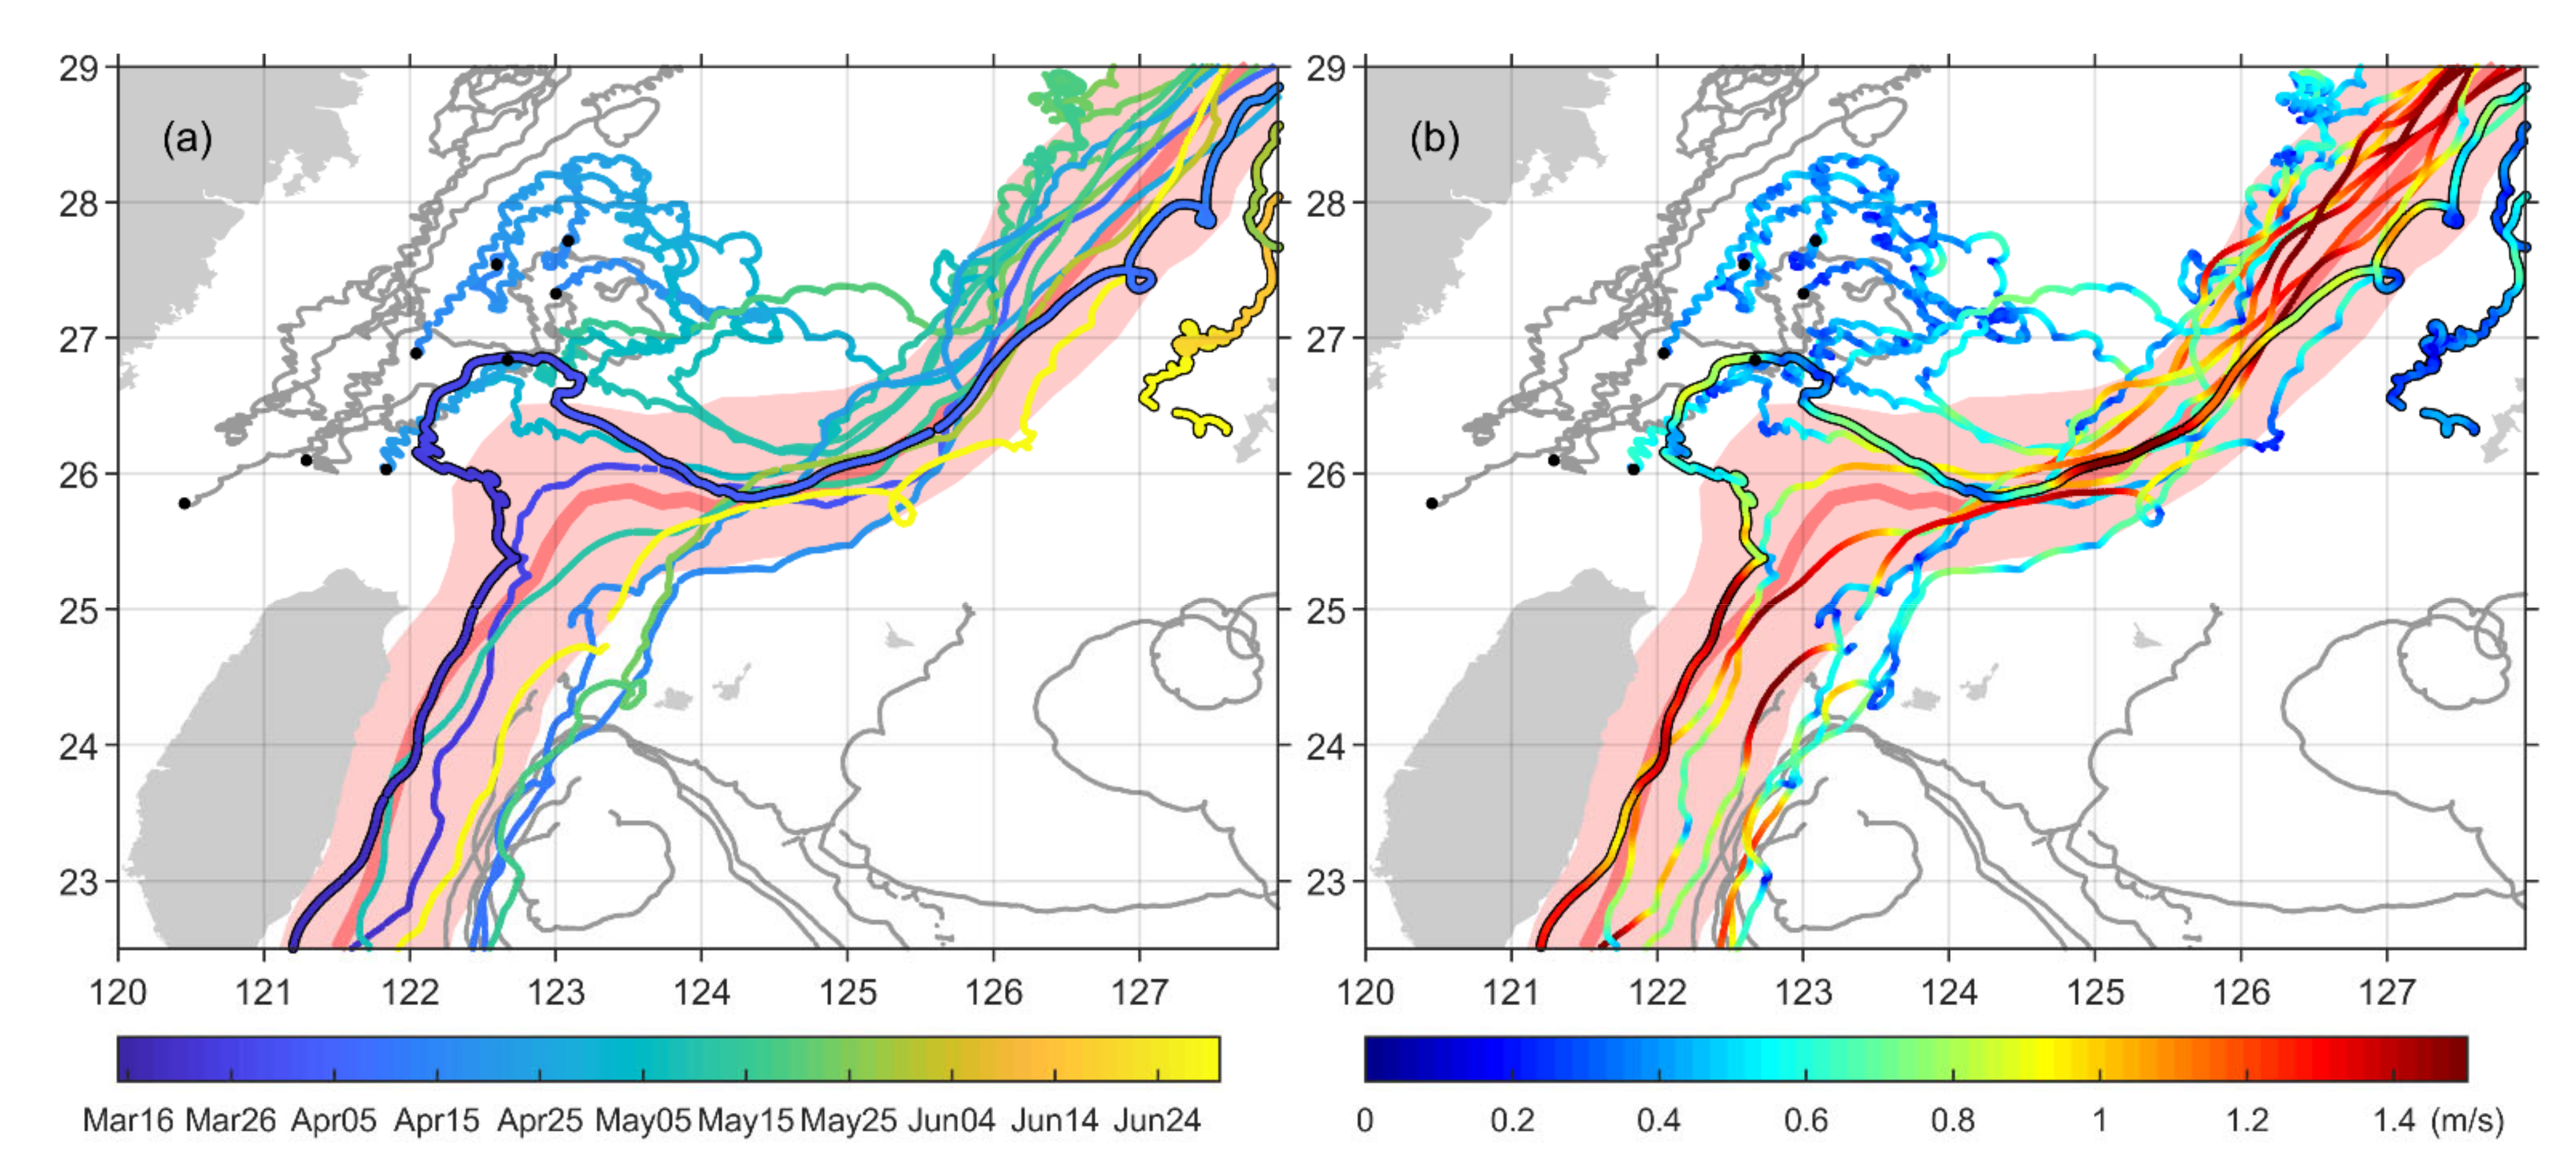
3.4. Kuroshio Northeast of Taiwan Island

The Kuroshio path has a significant anti-cyclonic turn on the northeast of Taiwan. The drifter trajectories and speed distributions in this area are shown in Figure 4. The Kuroshio Current was notably decelerated at the turning segment. Large current speeds were observed on the straight segments east of Taiwan and on the shelf break of the ECS. The maximum current speed was up to 1.8 m/s.
During the observation in 2019, a total of seven drifters moved northward along the east coast of Taiwan, took an anti-cyclonic turn, and continued to move along the shelf break of the ECS. Among these drifters, six (Category IV) had a relatively straight route and their trajectories were mainly on the right side of the climatological axis of the Kuroshio, while only one drifter (Category V), which was on the left side of the axis, deviated shoreward perpendicularly on the northeast of Taiwan and rejoined the Kuroshio main stream after a large anti-cyclonic meander. The trajectory reached as far as the 100 m isobath, indicating the strong intrusion of the Kuroshio water to the ECS. Based on previous studies, the Kuroshio Current in this region has a multicore structure [33], and two types of routes [16] are well identified, which is in good agreement with the Category IV and Category V drifters in this study.
Eight drifters were deployed in the ECS. The trajectories in the shallow area were subjected to significant tortuousness due to tidal currents. Ultimately, only three of them stayed on the continental shelf, while the other five soon mingled in the Kuroshio main stream at the shelf break. The trajectories of these five drifters were very close to the intrusion path of Category V drifters. Both the intrusion of the Kuroshio into the ECS and the ECS outflow to the Kuroshio suggest significant water exchange between the two regions.

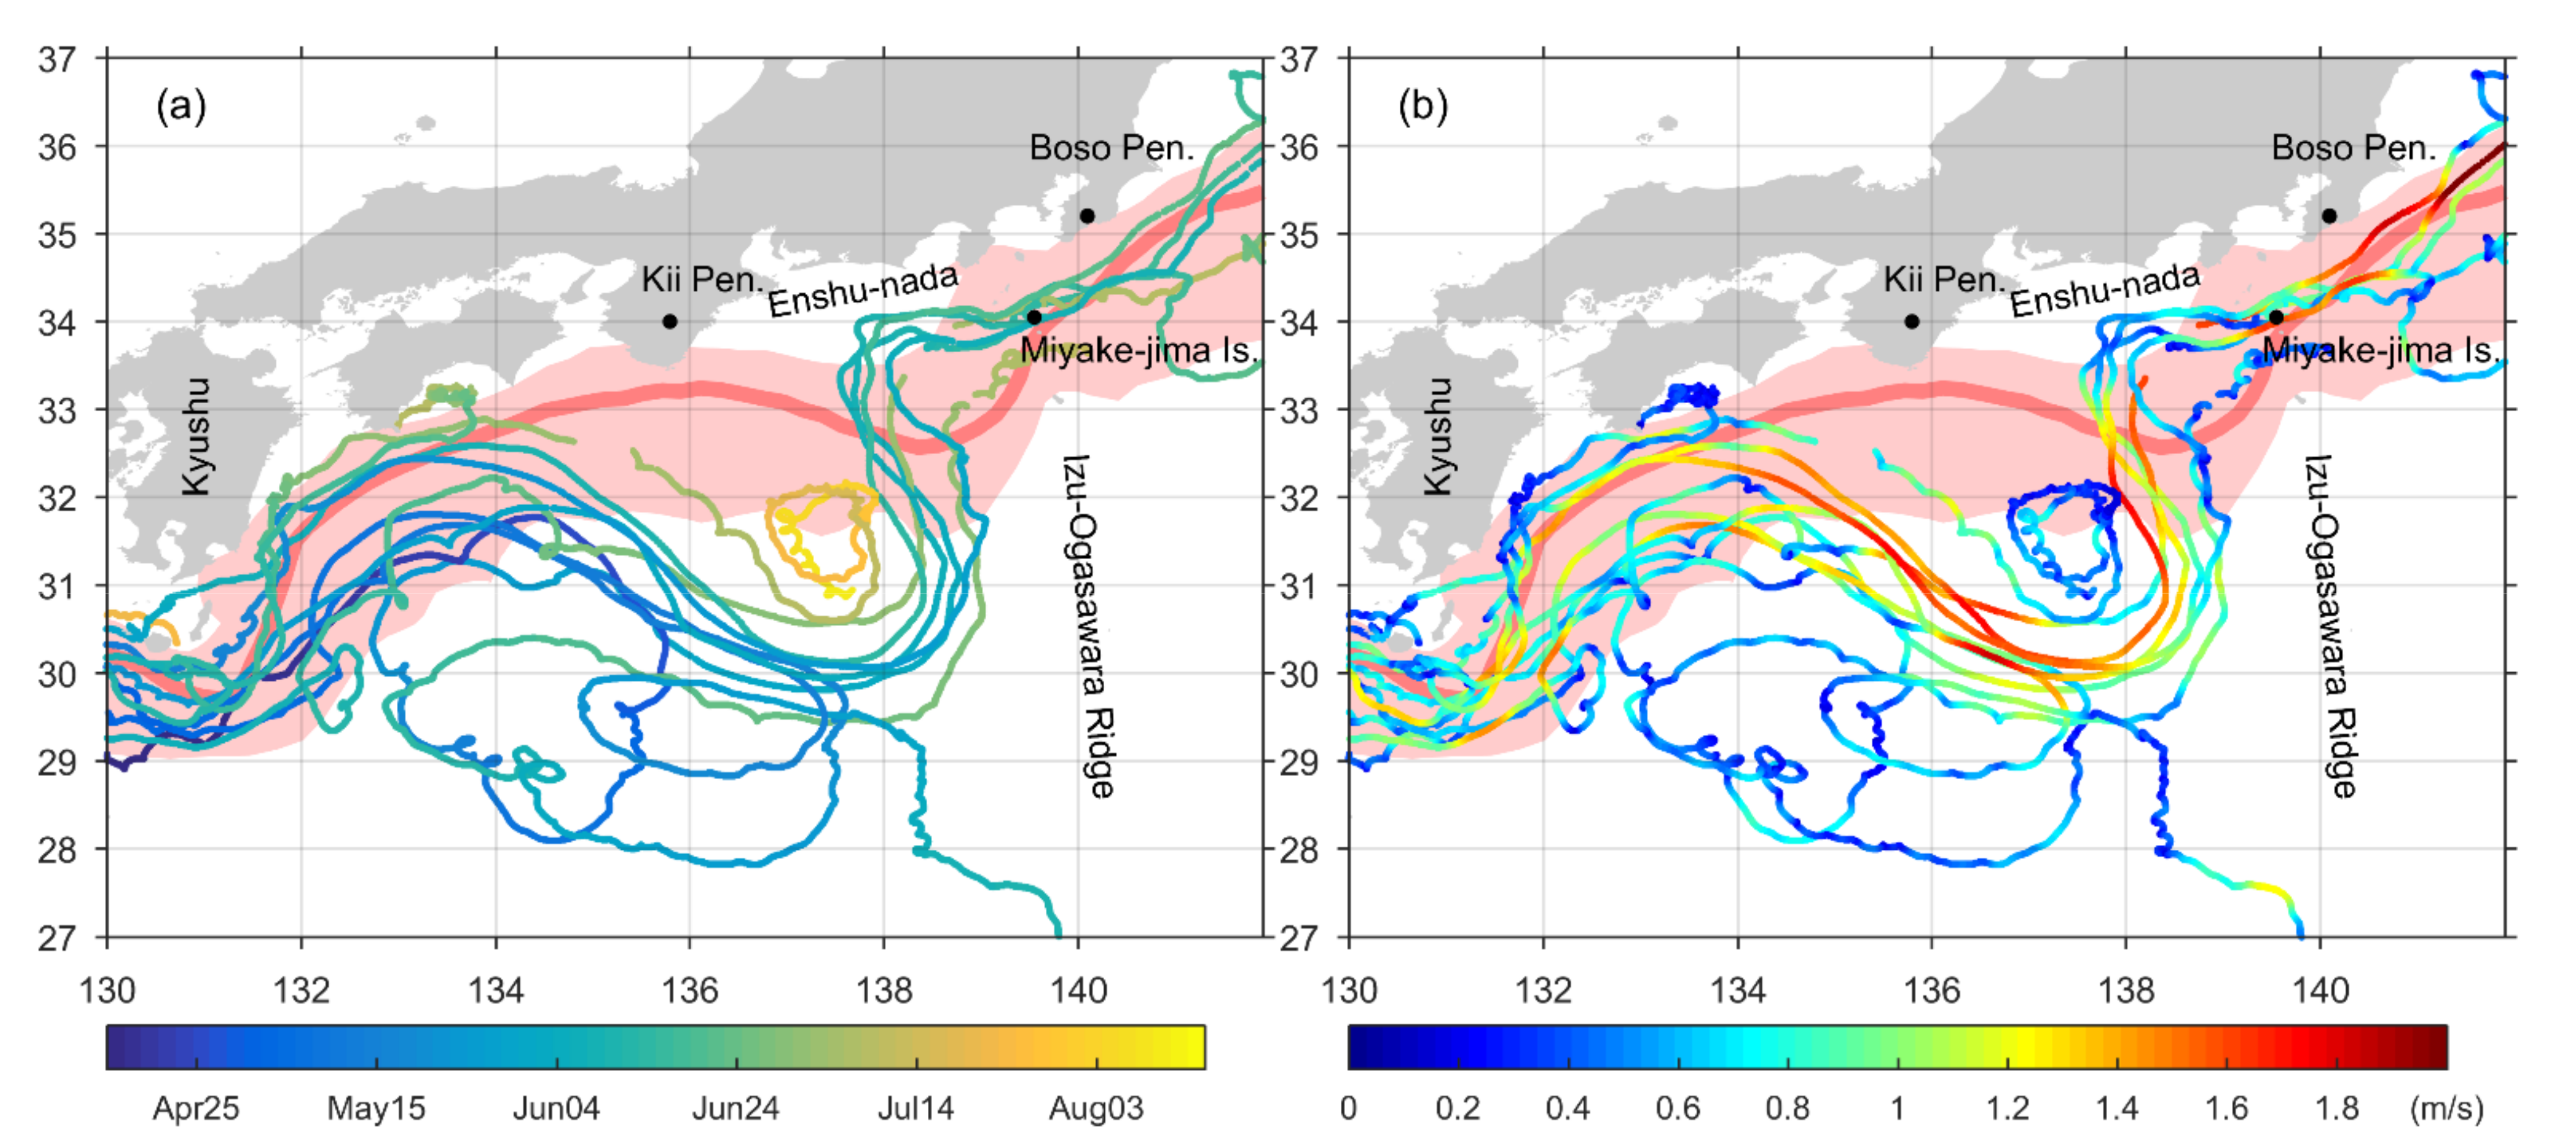
3.5. Kuroshio South of Japan

The drifter trajectories and surface current speed distributions south of Japan are shown in Figure 5. Although the nine drifters passed in different months (from April to August; Figure 5a), the Kuroshio showed a remarkable LM pattern off the coast of Kii Peninsula, which significantly deviated from the climatological Kuroshio path near the coast of Japan. Strong currents with a velocity magnitude of up to 2.0 m/s were observed between the two eddies.
The observed meander path in this study was significantly different from those in historical records. Based on the surface current field by the integration of satellite altimeter and drifters from 1992 to 2000, Ambe et al. [21] made a comprehensive census on the Kuroshio paths. The LM paths have an average distance of 250 km from the coast of Enshu-nada (reaching 32.3° N), with the farthest occasion of 370 km (reaching 31.0° N). However, the LM in this study reached as far as 30.0° N, largely exceeding the average and maximum offshore distances in the census by Ambe et al. (2004). In addition, its zonal position was off the coast of Kii Peninsula rather than off the coast of Enshu-nada. The LM was located to the west of the Izu-Ogasawara Ridge, and its current axis passed through the channel to the north of Miyake-jima Island, hence this LM path should be categorized as the stable type according to Nagano et al. [34].
The ADT map by altimeter (Figure 1) also showed that the LM pattern was consistent with the drifter trajectories. The Kuroshio path on the south of Japan can be identified by the largest ADT slope between the contours of 100 cm and 120 cm. Moreover, the extraordinary LM path lasted up to December 2019 according to the near-real-time altimeter observations.

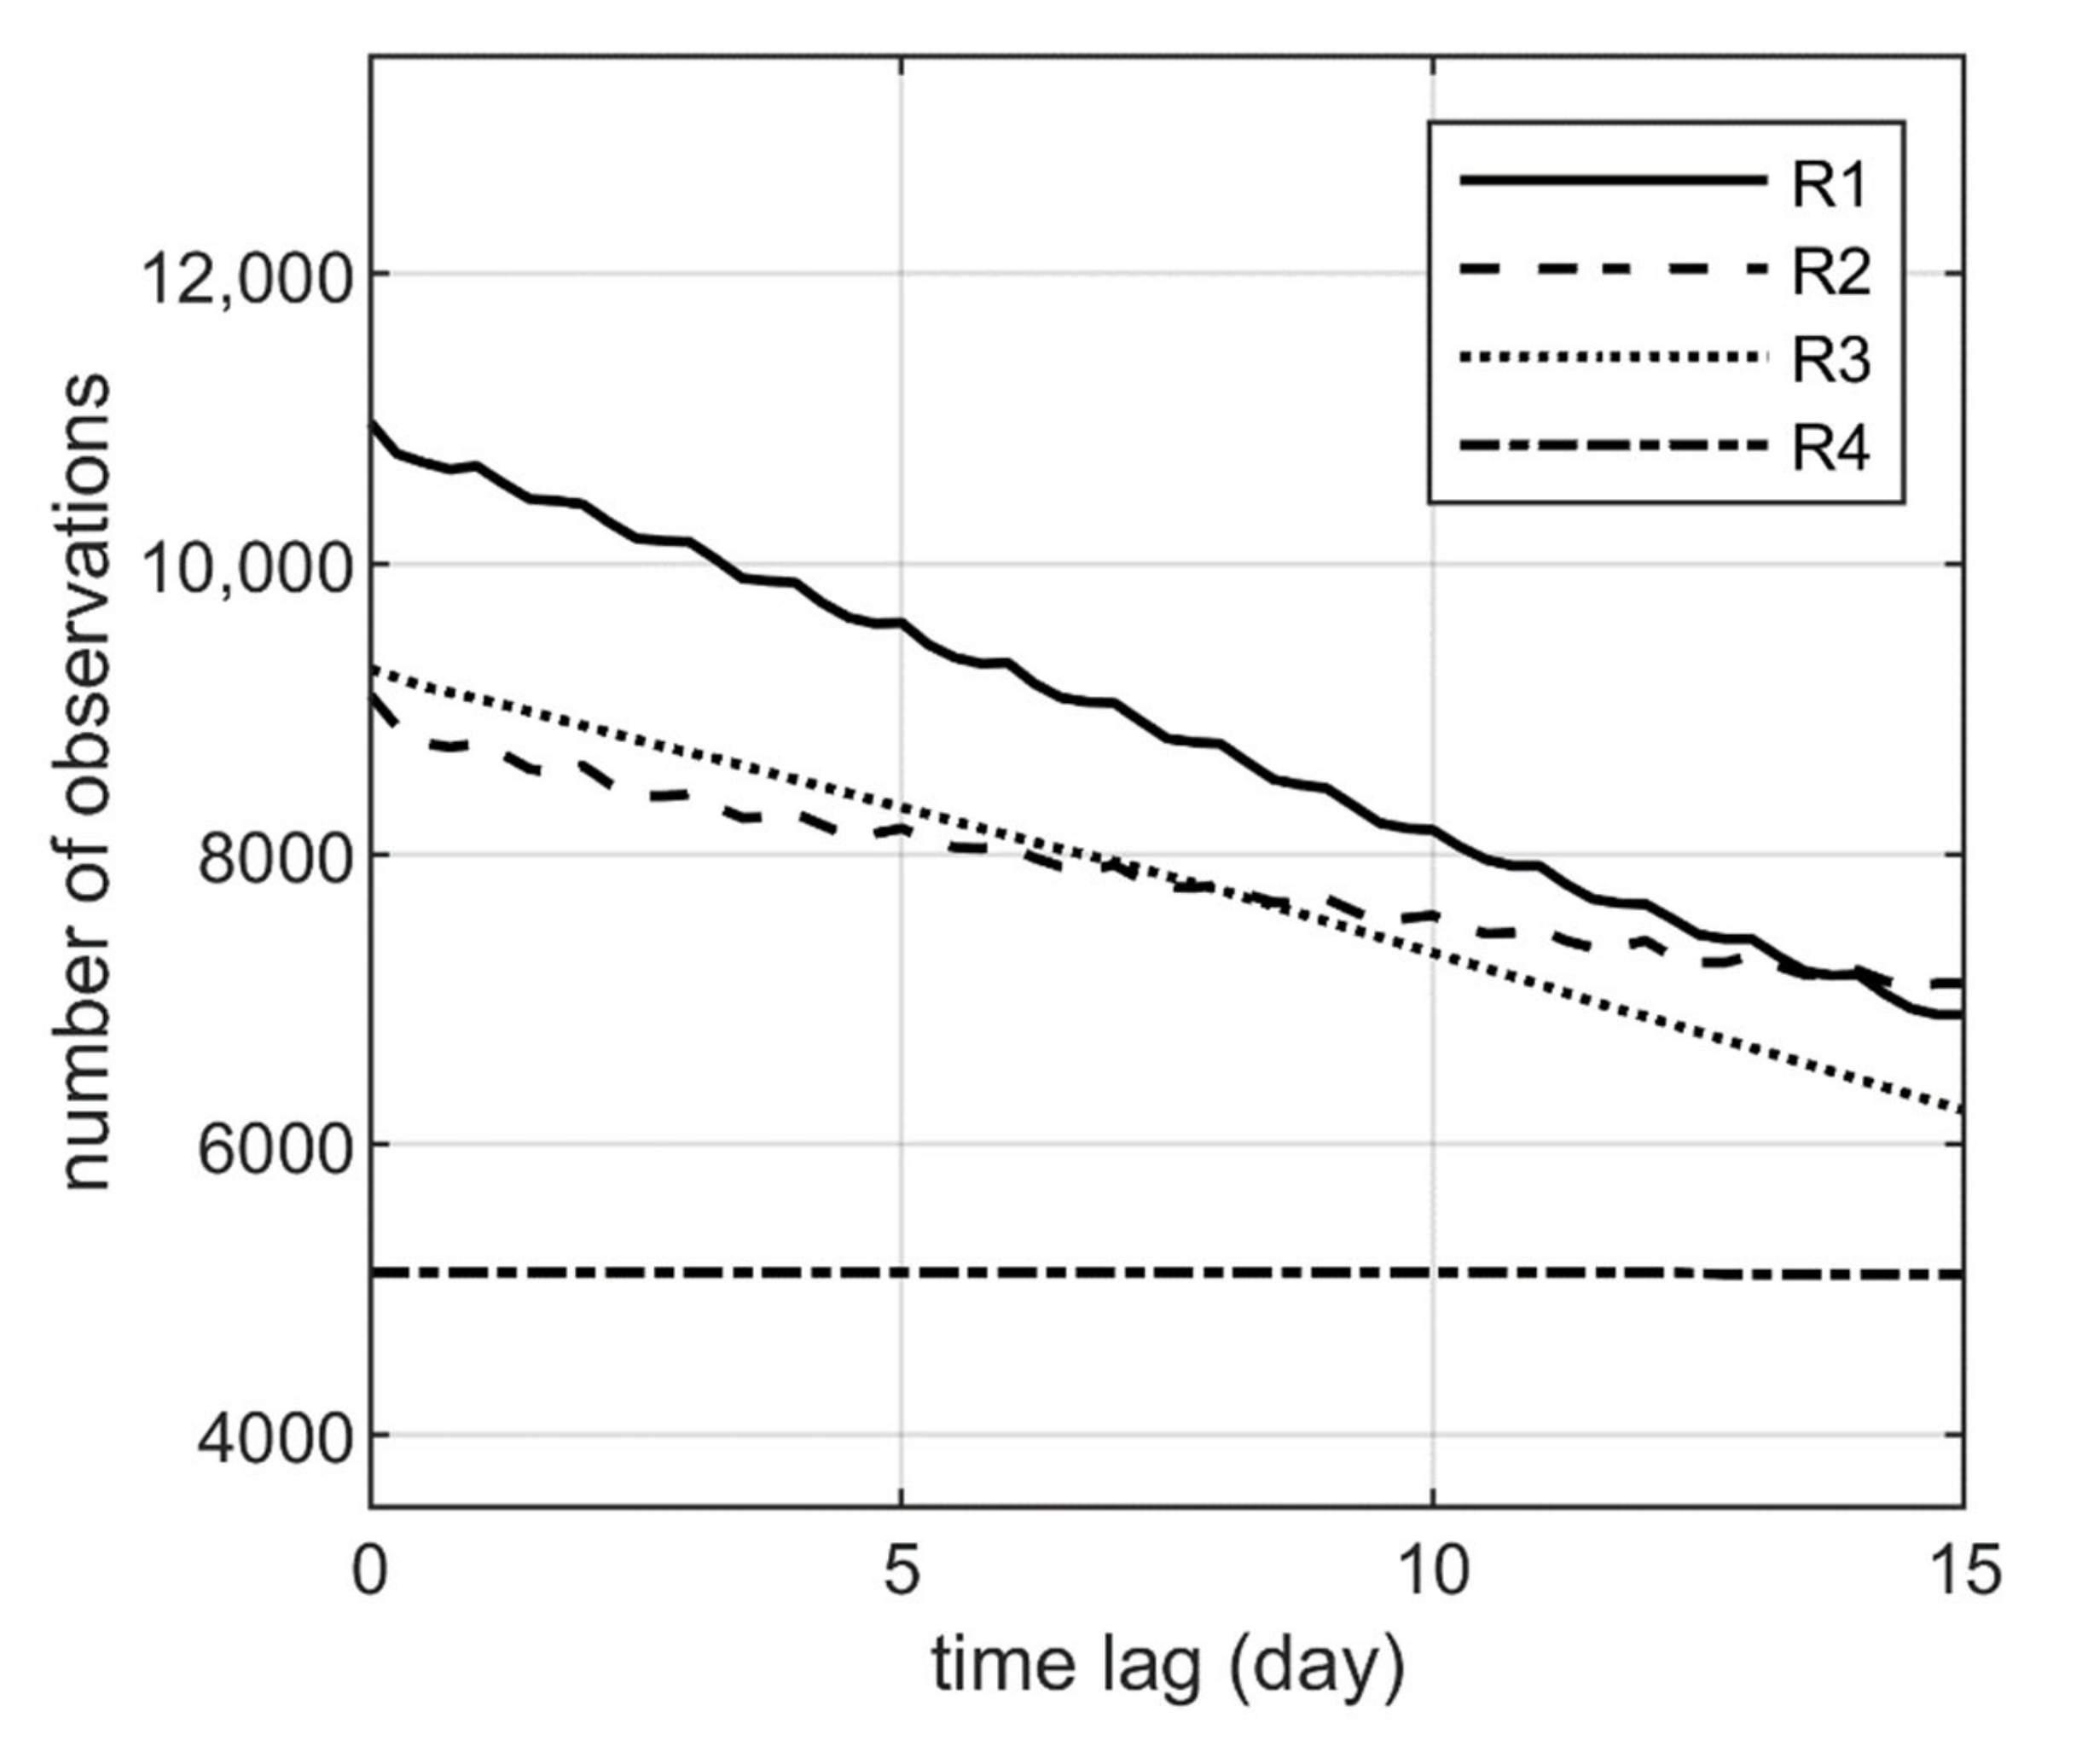
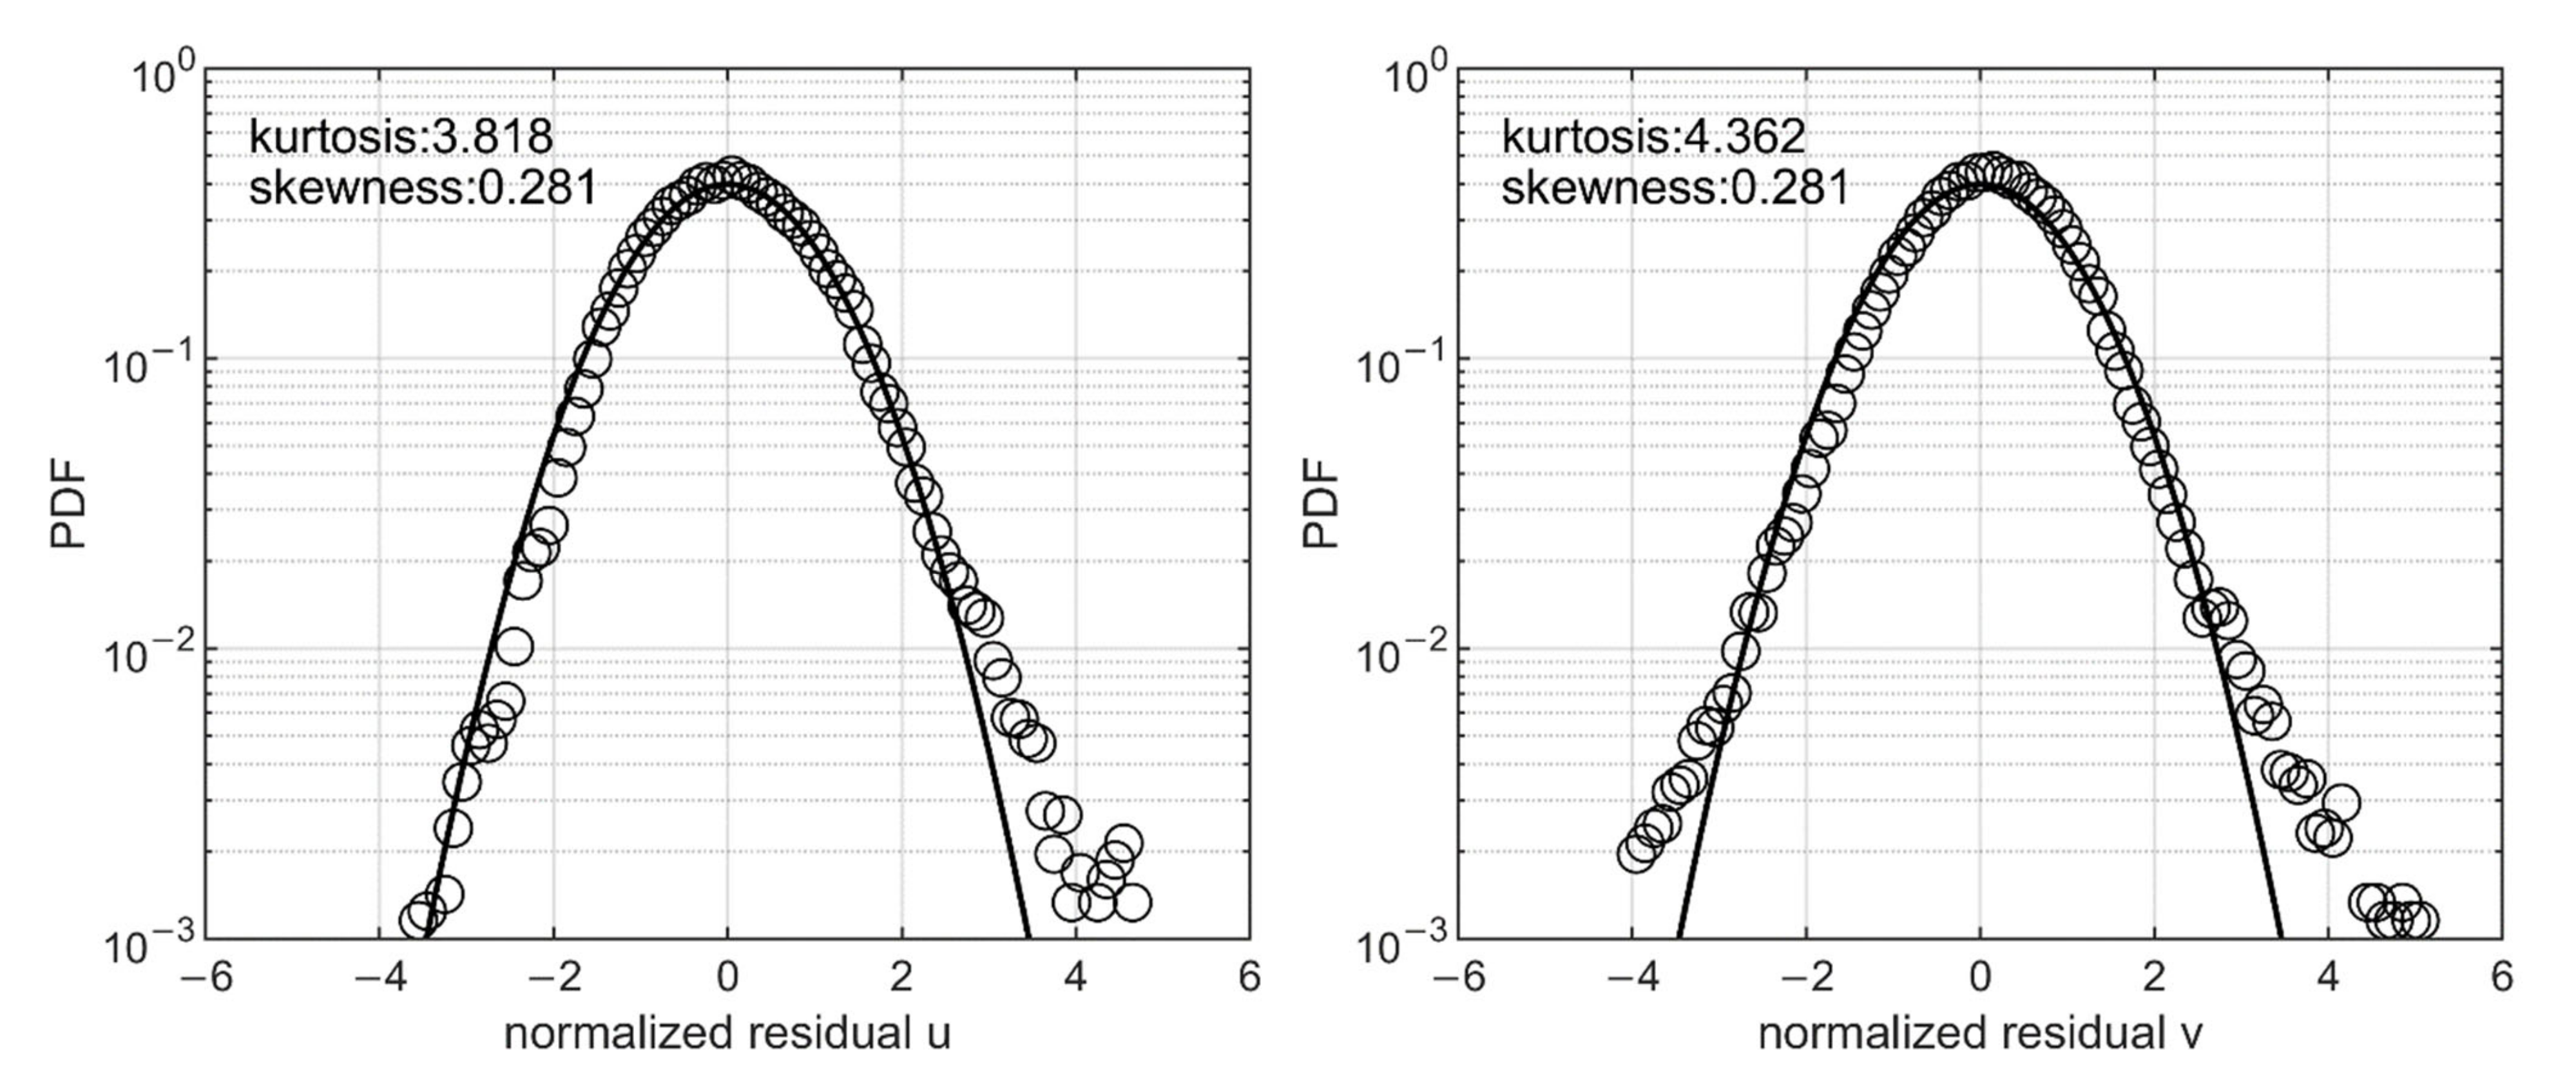
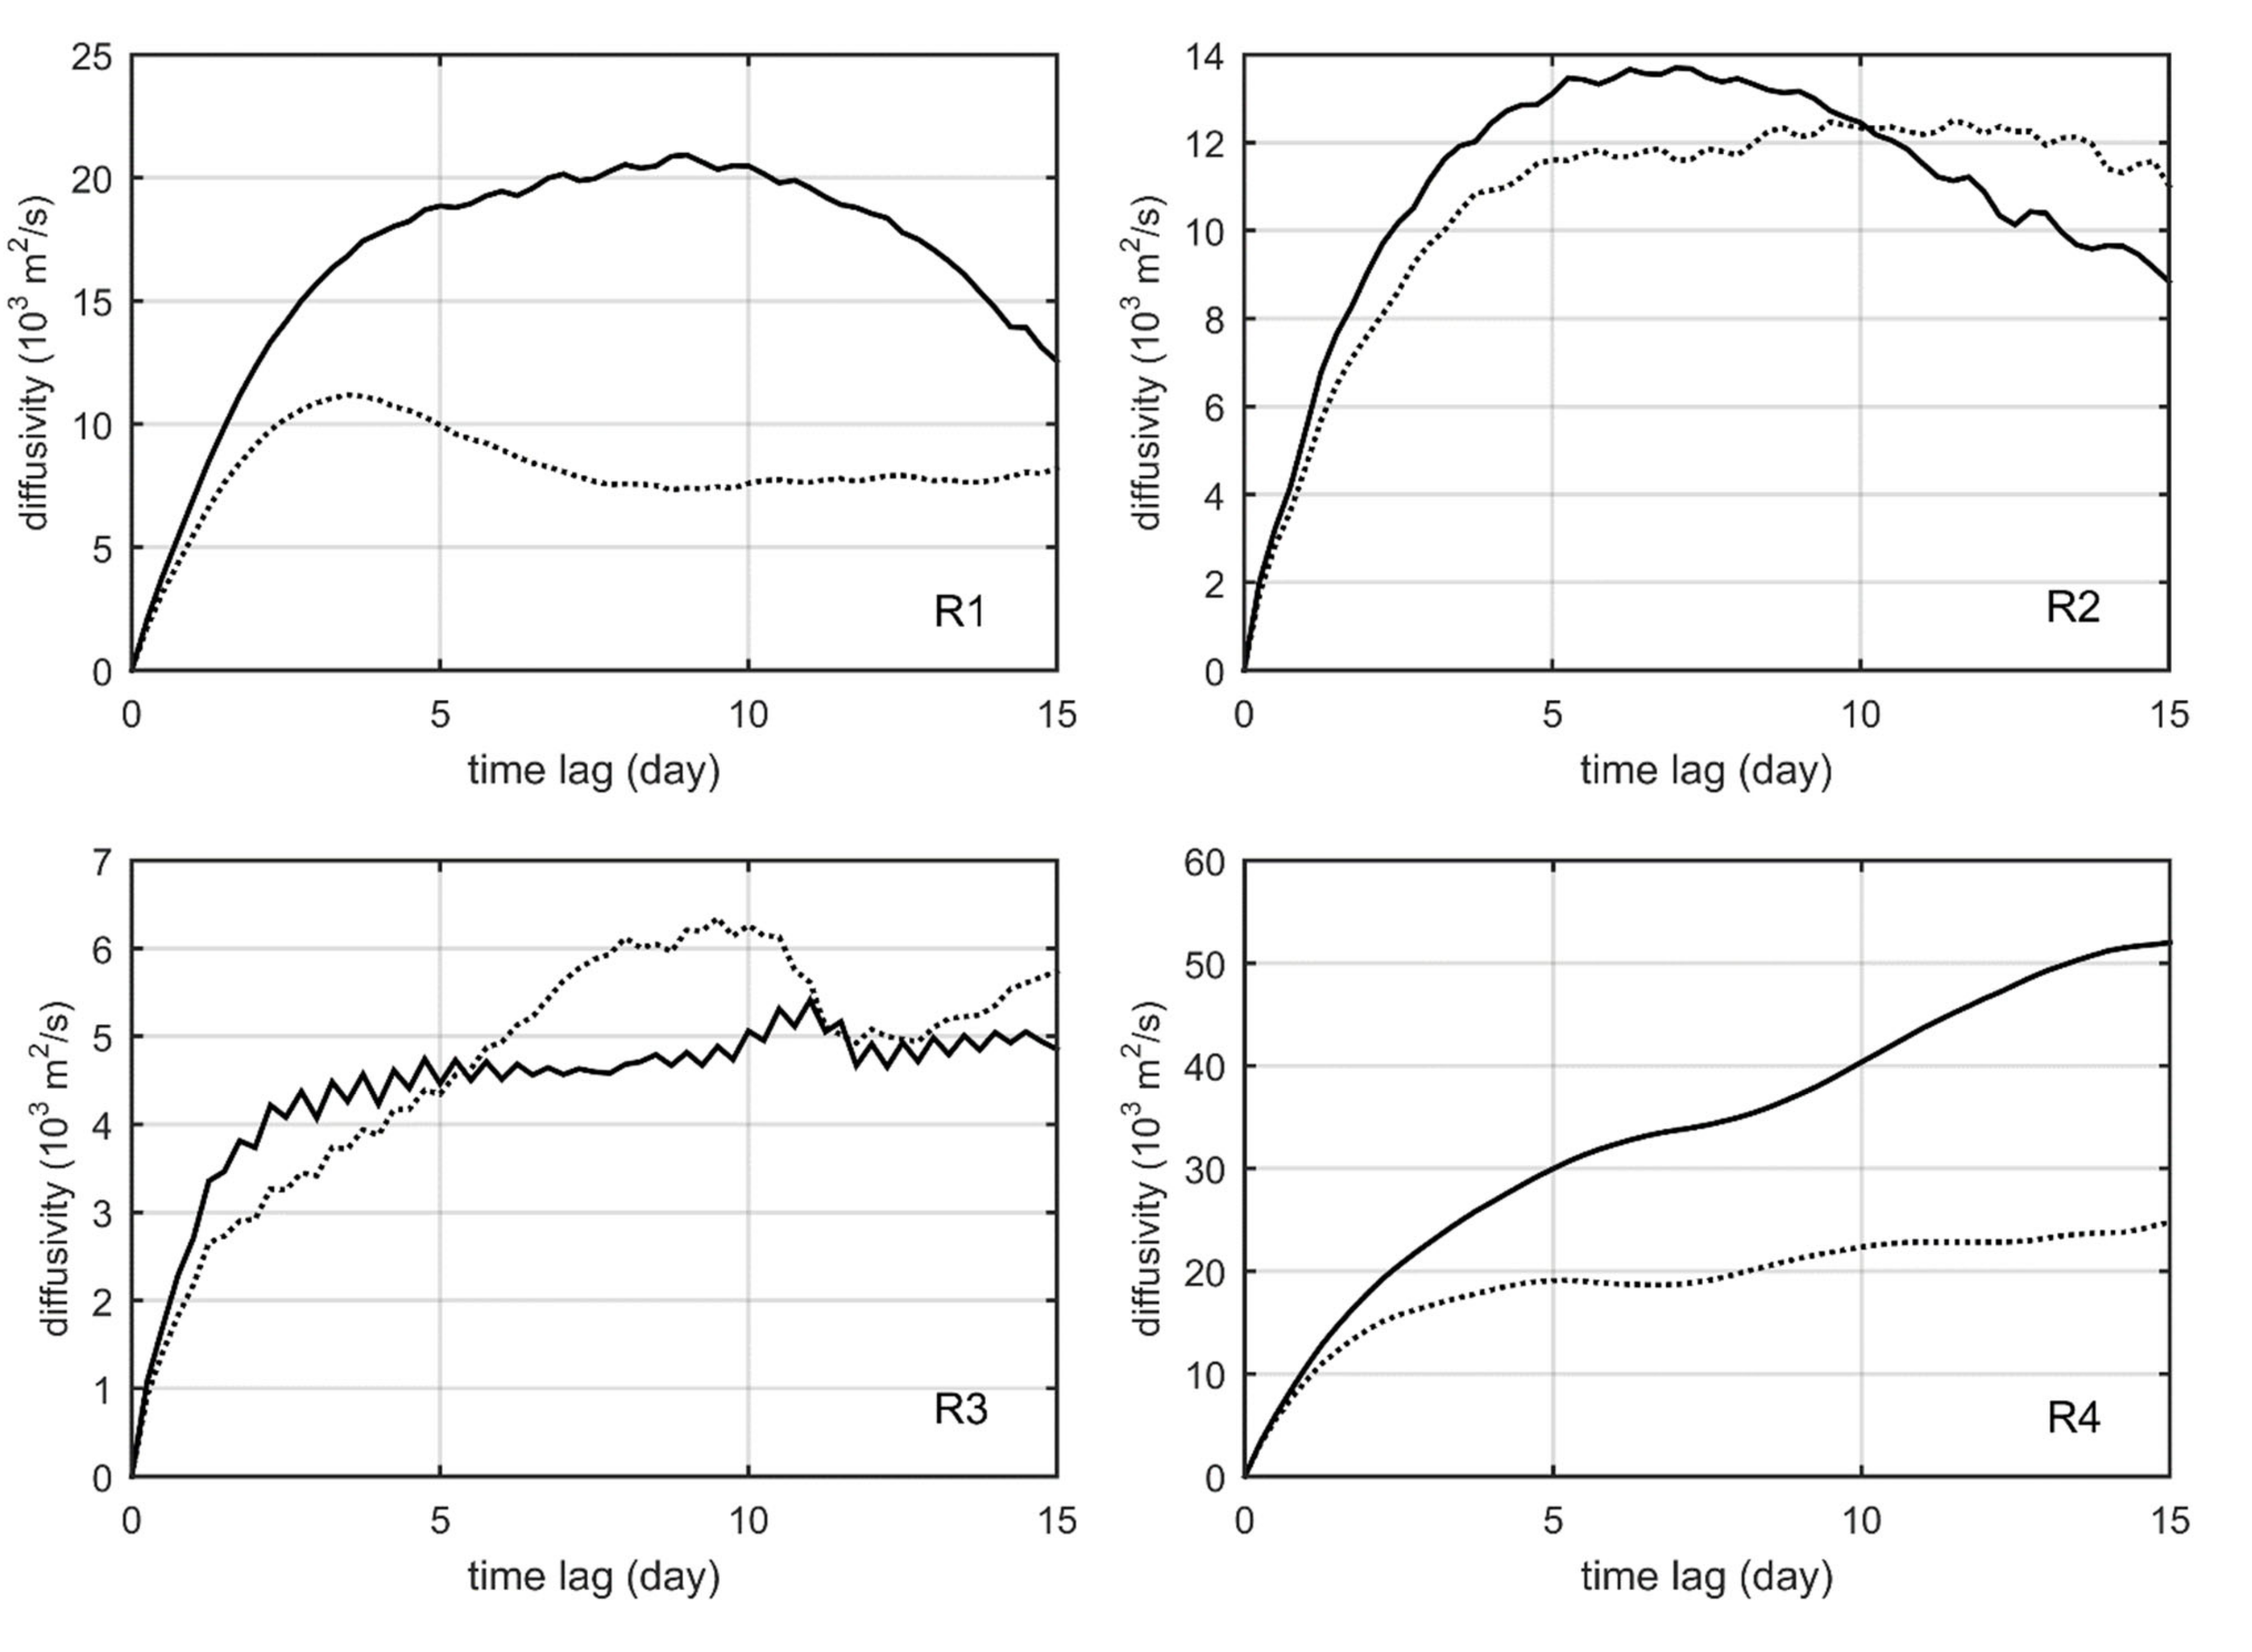
4. Lagrangian Diffusivity and Integral Scales

According to Davis [26] and Poulain [35], the Lagrangian statistics are defined as follows:
u i = u i u i L
d i τ = d i τ d i τ L
where the symbol   L stands for the average over time and space computed at time lag τ before/after the particles are located in a given domain, u i is the zonal or meridional component of the drifter velocity, u i L is the Lagrangian mean velocity at zero time lag τ , which is identical to the Eulerian mean velocity, and u i is the residual velocity component. The index i takes the value of 1 or 2 for zonal or meridional direction.
The d i τ is the drifter displacement component during the time lag τ ; so, d i τ L is the Lagrangian mean displacement during the time lag τ , which is induced by the mean flow. The d i τ is the residual displacement component.
P i j τ = u i 0 u j τ L
K i j τ = u i 0 d j τ L
T i τ = K i i τ / P i i 0
L i τ = K i i τ / P i i 0
where P i j τ is the Lagrangian velocity covariance matrix (i, j = 1 or 2), K i j τ is the Lagrangian diffusivity matrix, T i τ is the Lagrangian integral time scale, and L i τ is the Lagrangian integral space scale. The Lagrangian integral time scale is a typical scale, over which the Lagrangian velocities are correlated, and represents a “memory” scale following the particles [36]. That is, within such a time scale, a particle ‘‘remembers’’ its past motion state by showing a strong autocorrelation. Correspondingly, the Lagrangian length scale is defined as the distance that a particle travels within the time scale at the characteristic speed. As the basic indicators of Lagrangian predictability, these scales are important parameters in identifying the dynamic nature of a diffusive process.
In practice, the Lagrangian statistics are calculated as follows [37]. All the individual drifter observations with location and velocity ( u i ) are collected in a selected region, and they are considered as the initial point of a pseudotrack. With a given time lag τ , the drifter displacement d i τ is searched for and mated to the initial point ( τ means searching back to the past). Using ensemble averaging, we obtain the Lagrangian mean value of u i L and d i τ L ; hence, the residual velocity ( u i ) and residual displacement ( d i τ ) in Equations (1) and (2) can be calculated. Finally, the Lagrangian velocity covariance matrix P i j τ and diffusivity matrix K i j τ are calculated using ensemble averaging, as in Equations (3) and (4). The range of τ used for calculation in this study was chosen as 0~15 days, since the typical time scale of surface flow in different oceans is usually below 6 days [29].
We chose four regions with adequate drifter observations for the Lagrangian statistics calculation (Figure 1): R1 in the West Pacific east of Luzon Island (125° E~130° E, 15° N~20° N), R2 for the LS and adjacent area (120° E~125° E, 18° N~22.5° N), R3 for the ECS (120° E~125° E, 26° N~31° N), and R4 for the shelf break of the ECS (125° E~130° E, 25° N~30° N). The size of each region was approximately 5° × 5°, which was the same as in the maps of Lagrangian statistics in the Pacific and Atlantic Oceans by Zhurbas and Oh [28]. The numbers of available mated drifter observations as a function of τ in the four regions are shown in Figure 6. All the four regions had more than 5000 mated drifter observations for τ , ranging from 0 to 15 days. The numbers in R1–R3 decreased significantly with the increasing τ , while R4 had almost constant numbers, as no drifters were deployed in R4.
The advective–diffusive formalism of Davis [26] and the stochastic models assume that the probability density function (PDF) of the residual velocity is approximately Gaussian. The PDF of u i in all the four regions in this study is shown in Figure 7. Both the PDFs of zonal and meridional u i coincided well with the Gaussian distribution in the peak region, while they had extended tails, especially for the meridional component, compared with the Gaussian distribution. The kurtosis values of 3.8 and 4.3 are only moderately larger than that of Gaussian PDF (kurtosis = 3). Such deviations have also been found in previous studies; thus, the PDF difference is small enough so as to not warrant concern [36].
The diagonal components of the diffusivity matrix ( K x x and K y y ) are related to the dispersive effect of the eddy flows. The computed results as a function of τ for R1–R4 are shown in Figure 8. All the diffusivities in the four regions rapidly grew at τ = 0 until a time lag of a few days. The diffusivities in R1–R3 reached a maximum value and formed a relatively stable curve, which was favorable for the estimation of the asymptotic values. In contrast, both zonal and meridional diffusivities continued to increase at the maximum τ in R4, showing a poor constringency. This feature could be attributed to the strong lateral shear across the Kuroshio in R4 [38].
The asymptotic diffusivities ( K x x and K y y ) were estimated as the maximum value over the τ range of 0–15 days; the asymptotic Lagrangian integral time scale ( T x and T y ) and space scale ( L x and L y ) were computed accordingly using Equations (5) and (6), all of which are shown in Table 2. R4 had the largest zonal and meridional diffusivities (52.0 × 10³ m2/s and 24.8 × 10³ m2/s, respectively), in accordance with the intensified Kuroshio Current, and R3 on the ECS continental shelf had the weakest lateral diffusivities (5.4 × 10³ m2/s and 6.3 × 10³ m2/s) compared with the open ocean areas. The Lagrangian integral time scales in the four regions ranged from 0.8 to 3.7 days, with corresponding Lagrangian integral space scales ranging from 19.5 km to 128.7 km. The zonal asymptotic Lagrangian statistics had values approximately twice the meridional ones in R1 and R4, indicating strong anisotropy, while the zonal and meridional components in R2 and R3 were basically comparable to each other.
These values of asymptotic Lagrangian statistics are basically in accord with the results by Zhurbas and Oh [28] and Qian et al. [29] in the same regions. However, R4 had overestimated values in this study due to the poor constringency of diffusivity components (Kxx and Kyy), which were significantly larger than the mean K value of about 16 × 103 m2/s by Zhurbas and Oh in this area.
The results suggest that it is feasible to estimate the Lagrangian statistics using only one batch of drifters deployed at once, instead of the whole historical drifter dataset, to obtain the estimates for a specific year or season. However, estimates in the areas with strong currents and lateral shears should be treated cautiously.

5. Summary and Discussion

We analyzed the features of the surface Kuroshio Current in 2019 using the observation data of 29 self-developed drifters. Many of the drifters floated all the way from the east of the Philippines to the south of Japan along the Kuroshio main stream. The Kuroshio flow pattern and velocity magnitude in 2019 were largely consistent with climatology based on the historical drifter dataset, but they still had distinctive characteristics.
The intrusion of the Kuroshio into the SCS in spring 2019 was captured by the trajectories of a group of drifters through the LS from east to west, suggesting the possible existence of a springtime Kuroshio branch into the SCS. This presents an exception to the non-intrusion pattern in spring in the historical records presented by Centurioni et al. [6] and Hu et al. [2]. It also indicates that the water exchange variability across the LS is driven not only by the seasonal cycle but also by mesoscale and other high-frequency processes. According to a recent estimate by Huang et al. [39], except for the Kuroshio water, other Pacific waters that are carried by zonal jets, Ekman currents, or eddies can also intrude into the SCS, accounting for approximately 13% of the total flux.
The bifurcation of the Kuroshio northeast of Taiwan Island was observed in spring 2019, and the western branch deviated from the main stream to form a significant intrusion to the ECS. Both the intrusion into the ECS and the outflow from the ECS suggest significant water exchange between the ECS and the Kuroshio.
The drifter trajectories in this study clearly captured the LM of the Kuroshio south of Japan in 2019. This LM lasted for the whole year of 2019, and the southernmost location of the flow axis reached as far as 30° N, which is significantly farther than the offshore distance based on Ambe et al.’s census [21] from 1992 to 2000 by drifters and satellite altimetry. More recently, Wang et al. [23] extended this census to 2014 based on the updated satellite altimeter data, and the southernmost location of the LM occurrences were still within 31° N. There are also other data sources that have been used to identify the LM of the Kuroshio and its path. The Japan Meteorological Agency (JMA) has been providing the time series of the southernmost location of the Kuroshio between 136° E and 140° E since 1965; it is based on temperature profiles and satellite-derived sea surface temperature. According to the recent analysis by Sugimoto et al. [22], the JMA data had the farthest LM southernmost location, of 30° N in 1979, which is a comparable LM event with the one in 2019 in this study.
Lagrangian statistics (i.e., lateral diffusivity, integral time scale, and integral space scale) were estimated for four selected regions with adequate drifter samplings. The area along the Kuroshio in the ECS had the largest diffusivity, and the continental shelf in the ECS had the lowest diffusivity. Although the Lagrangian statistics can be estimated for a single year with a batch of drifters, the estimates of the asymptotic values still need to be verified. The diffusivity components in R4 in this study had poor constringency. Such features could be induced by the pseudotrack effect in currents with strong shear [38] because the spatial grid is not fine enough to resolve the shear flow. Moreover, there are also other possible reasons for this, such as a strong seasonal cycle that is retained in the residual velocity [29]. However, this should not have been the case in this study because we only used the data in one season.

Author Contributions

Conceptualization, J.H.; methodology, Z.S.; software, H.L.; validation, Z.C. and Z.H.; formal analysis, L.Y.; investigation, X.C. and X.W.; writing—original draft preparation, Z.S.; writing—review and editing, J.H.; visualization, J.Z. All authors have read and agreed to the published version of the manuscript.

Funding

This study was supported by the National Natural Science Foundation of China (91958203, 41730533, and 92058205).

Institutional Review Board Statement

Not applicable.

Informed Consent Statement

Not applicable.

Data Availability Statement

The GDP drifter dataset and remote sensing datasets for this research are publicly available and were downloaded from ftp://ftp.aoml.noaa.gov/phod/pub/buoydata, accessed on 26 June 2022 and ftp://my.cmems-du.eu/Core/SEALEVEL_GLO_PHY_L4_NRT_OBSERVATIONS_008_046, accessed on 26 June 2022. We appreciate the provision of these publicly available datasets.

Conflicts of Interest

The authors declare no conflict of interest. The funders had no role in the design of the study; in the collection, analyses, or interpretation of data; in the writing of the manuscript; or in the decision to publish the results.

References

  1. Su, J. A review of circulation dynamics of the coastal oceans near China. Acta Oceanol. Sin. 2001, 23, 1–16. [Google Scholar]
  2. Hu, X.; Xiong, X.; Qiao, F.; Guo, B. Surface current field and seasonal variability in the Kuroshio and adjacent regions derived from satellite-tracked drifter data. Acta Oceanol. Sin. 2008, 27, 11–29. [Google Scholar]
  3. Zhang, Z.-L.; Nakamura, H.; Zhu, X.-H. Seasonal Velocity Variations over the Entire Kuroshio Path Part I: Data Analysis and Numerical Experiments. J. Oceanogr. 2021, 77, 719–744. [Google Scholar] [CrossRef]
  4. Zuo, J.; Zhang, M.; Xu, Q.; Mu, L.; Li, J.; Chen, M. Seasonal and Interannual Variabilities of Mean Velocity of Kuroshio Based on Satellite Data. Water Sci. Eng. 2012, 5, 428–439. [Google Scholar] [CrossRef]
  5. Liu, Z.; Zhu, X.; Nakamura, H.; Nishina, A.; Wang, M.; Zheng, H. Comprehensive Observational Features for the Kuroshio Transport Decreasing Trend during a Recent Global Warming Hiatus. Geophys. Res. Lett. 2021, 48. [Google Scholar] [CrossRef]
  6. Centurioni, L.R.; Niiler, P.P.; Lee, D.-K. Observations of Inflow of Philippine Sea Surface Water into the South China Sea through the Luzon Strait. J. Phys. Oceanogr. 2004, 34, 113–121. [Google Scholar] [CrossRef]
  7. Qiu, Y.; Li, L.; Chen, C.-T.A.; Guo, X.; Jing, C. Currents in the Taiwan Strait as Observed by Surface Drifters. J. Oceanogr. 2011, 67, 395–404. [Google Scholar] [CrossRef]
  8. Guo, J.; Chen, X.; Sprintall, J.; Guo, B.; Qiao, F.; Yuan, Y. Surface Inflow into the South China Sea through the Luzon Strait in Winter. Chin. J. Ocean. Limnol. 2012, 30, 163–168. [Google Scholar] [CrossRef]
  9. Hsu, P.-C. Surface Current Variations and Hydrological Characteristics of the Penghu Channel in the Southeastern Taiwan Strait. Remote Sens. 2022, 14, 1816. [Google Scholar] [CrossRef]
  10. Yuan, D.; Han, W.; Hu, D. Surface Kuroshio path in the Luzon Strait area derived from satellite remote sensing data. J. Geophys. Res. Space Phys. 2006, 111, C11007. [Google Scholar] [CrossRef]
  11. Sheremet, V.A. Hysteresis of a Western Boundary Current Leaping across a Gap. J. Phys. Oceanogr. 2001, 31, 1247–1259. [Google Scholar] [CrossRef]
  12. Yuan, D.; Wang, Z. Hysteresis and Dynamics of a Western Boundary Current Flowing by a Gap Forced by Impingement of Mesoscale Eddies. J. Phys. Oceanogr. 2011, 41, 878–888. [Google Scholar] [CrossRef]
  13. Liu, Z.; Gan, J. Variability of the Kuroshio in the East China Sea Derived from Satellite Altimetry Data. Deep. Sea Res. Part I Oceanogr. Res. Pap. 2012, 59, 25–36. [Google Scholar] [CrossRef]
  14. Ding, R.; Huang, D.; Xuan, J.; Mayer, B.; Zhou, F.; Pohlmann, T. Cross-Shelf Water Exchange in the East China Sea as Estimated by Satellite Altimetry and in Situ Hydrographic Measurement. J. Geophys. Res. Ocean. 2016, 121, 7192–7211. [Google Scholar] [CrossRef]
  15. Wang, J.; Oey, L.Y. Seasonal Exchanges of the Kuroshio and Shelf Waters and Their Impacts on the Shelf Currents of the East China Sea. J. Phys. Oceanogr. 2016, 46, 1615–1632. [Google Scholar] [CrossRef]
  16. Liu, X.; Dong, C.; Chen, D.; Su, J. The Pattern and Variability of Winter Kuroshio Intrusion Northeast of Taiwan. J. Geophys. Res. Ocean. 2014, 119, 5380–5394. [Google Scholar] [CrossRef]
  17. Zhou, F.; Xue, H.; Huang, D.; Xuan, J.; Ni, X.; Xiu, P.; Hao, Q. Cross-Shelf Exchange in the Shelf of the East China Sea. J. Geophys. Res. Ocean. 2015, 120, 1545–1572. [Google Scholar] [CrossRef]
  18. Hsu, P.; Centurioni, L.; Shao, H.; Zheng, Q.; Lu, C.; Hsu, T.; Tseng, R. Surface Current Variations and Oceanic Fronts in the Southern East China Sea: Drifter Experiments, Coastal Radar Applications, and Satellite Observations. J. Geophys. Res. Ocean. 2021, 126, e2021JC017373. [Google Scholar] [CrossRef]
  19. Lu, C.-Y.; Hsu, P.-C.; Zheng, Q.; Ho, C.-R. Variations in Flow Patterns in the Northern Taiwan Strait Observed by Satellite-Tracked Drifters. Remote Sens. 2022, 14, 2154. [Google Scholar] [CrossRef]
  20. Kawabe, M. Variations of Current Path, Velocity, and Volume Transport of the Kuroshio in Relation with the Large Meander. J. Phys. Oceanogr. 1995, 25, 3103–3117. [Google Scholar] [CrossRef]
  21. Ambe, D.; Imawaki, S.; Uchida, H.; Ichikawa, K. Estimating the Kuroshio Axis South of Japan Using Combination of Satellite Altimetry and Drifting Buoys. J. Oceanogr. 2004, 60, 375–382. [Google Scholar] [CrossRef]
  22. Sugimoto, S.; Qiu, B.; Kojima, A. Marked Coastal Warming off Tokai Attributable to Kuroshio Large Meander. J. Oceanogr. 2020, 76, 141–154. [Google Scholar] [CrossRef]
  23. Wang, Q.; Tang, Y. The Interannual Variability of Eddy Kinetic Energy in the Kuroshio Large Meander Region and Its Relationship to the Kuroshio Latitudinal Position at 140 °E. J. Geophys. Res. Ocean. 2022, 127, e2021JC017915. [Google Scholar] [CrossRef]
  24. Lumpkin, R.; Centurioni, L. Global Drifter Program Quality-Controlled 6-Hour Interpolated Data from Ocean Surface Drifting Buoys; NOAA National Centers for Environmental Information: Boulder, CO, USA, 2019.
  25. Taylor, G.I. Diffusion by Continuous Movements. Proc. Lond. Math. Soc. 1922, s2–20, 196–212. [Google Scholar] [CrossRef]
  26. Davis, R.E. Observing the General Circulation with Floats. Deep. Sea Res. Part A Oceanogr. Res. Pap. 1991, 38, S531–S571. [Google Scholar] [CrossRef]
  27. Lumpkin, R.; Özgökmen, T.; Centurioni, L. Advances in the Application of Surface Drifters. Annu. Rev. Mar. Sci. 2017, 9, 59–81. [Google Scholar] [CrossRef]
  28. Zhurbas, V.; Oh, I.S. Drifter-Derived Maps of Lateral Diffusivity in the Pacific and Atlantic Oceans in Relation to Surface Circulation Patterns. J. Geophys. Res. 2004, 109, C05015. [Google Scholar] [CrossRef]
  29. Qian, Y.-K.; Peng, S.; Li, Y. Eulerian and Lagrangian Statistics in the South China Sea as Deduced from Surface Drifters. J. Phys. Oceanogr. 2013, 43, 726–743. [Google Scholar] [CrossRef]
  30. Hansen, D.V.; Poulain, P.-M. Quality Control and Interpolations of WOCE-TOGA Drifter Data. J. Atmos. Ocean. Technol. 1996, 13, 900–909. [Google Scholar] [CrossRef]
  31. Pujol, M.; Mertz, F. Product user manual for sea level SLA products. Copernic. Monit. Environ. Mar. Serv. 2019, 10, 1–51. [Google Scholar]
  32. Yu, L.; Xiong, X.; Guo, Y. Analysis of the path and axis features of the Kuroshio at the depth of 15m based on drifting buoy data. Adv. Mar. Sci. 2014, 32, 316–323. [Google Scholar]
  33. Feng, Y.; Chen, H.; Yuan, Y. Analysis of Argos drifter data for Kuroshio characteristics in East China Sea. Adv. Mar. Sci. 2010, 28, 275–284, (In Chinese with English Abstract). [Google Scholar]
  34. Nagano, A.; Yamashita, Y.; Hasegawa, T.; Ariyoshi, K.; Matsumoto, H.; Shinohara, M. Characteristics of an Atypical Large-Meander Path of the Kuroshio Current South of Japan Formed in September 2017. Mar. Geophys Res. 2019, 40, 525–539. [Google Scholar] [CrossRef]
  35. Poulain, P.-M. Adriatic Sea Surface Circulation as Derived from Drifter Data between 1990 and 1999. J. Mar. Syst. 2001, 29, 3–32. [Google Scholar] [CrossRef]
  36. LaCasce, J.H. Statistics from Lagrangian Observations. Prog. Oceanogr. 2008, 77, 1–29. [Google Scholar] [CrossRef]
  37. Swenson, M.S.; Niiler, P.P. Statistical Analysis of the Surface Circulation of the California Current. J. Geophys. Res. 1996, 101, 22631–22645. [Google Scholar] [CrossRef]
  38. Zhang, H.-M.; Prater, M.D.; Rossby, T. Isopycnal Lagrangian Statistics from the North Atlantic Current RAFOS Float Observations. J. Geophys. Res. 2001, 106, 13817–13836. [Google Scholar] [CrossRef]
  39. Huang, G.; Zhan, H.; He, Q.; Wei, X.; Li, B. A Lagrangian study of the near-surface intrusion of Pacific water into the South China Sea. Acta Oceanol. Sin. 2021, 40, 15–30. [Google Scholar] [CrossRef]
Figure 1. Overall trajectories of the 29 drifters deployed in spring 2019. Black dots are the deployment positions. Colored contours are the averaged ADT from March to July 2019. The rectangles of R1–R4 are the four selected regions for Lagrangian statistics. SCS, LS, and ECS denote the South China Sea, the Luzon Strait, and the East China Sea, respectively.
Jmse 10 01027 g001
Figure 2. Climatological surface velocity distributions for spring (a) and summer (b), derived from the GDP historical drifter dataset. The black, dashed lines are the Kuroshio axis, and the red, dashed lines are the estimated lateral boundaries. Colored shading denotes the velocity magnitude, and vectors are the unified velocity direction. Five segments of the Kuroshio are labeled.
Jmse 10 01027 g002
Figure 3. Drifter trajectories with temporal evolution (a) and current speed distribution (b) in the LS and adjacent areas in spring 2019. Pink shading indicates the climatological location of the Kuroshio in spring with a thick, red line as its axis. Colored, thin lines represent drifters in Category I (intruding to the SCS) and Category II (Kuroshio main stream), and gray, thin lines represent the other drifters (Category III). Black dots are the deployment positions of the drifters.
Jmse 10 01027 g003
Figure 4. Drifter trajectories with temporal evolution (a) and current speed distribution (b) northeast of Taiwan in spring 2019. Colored, thin lines represent drifters along the Kuroshio that deployed in the ECS and joined the Kuroshio; the only drifter in Category V is black-bordered. Gray, thin lines represent the others, which did not enter or flow along the Kuroshio eventually. Pink shading indicates the climatological location of the Kuroshio in spring with a thick, red line as its axis.
Jmse 10 01027 g004
Figure 5. Drifter trajectories with temporal evolution (a) and current speed distribution (b) south of Japan in spring 2019. Pink shading indicates the climatological location of the Kuroshio in summer, with a thick, red line as its axis.
Jmse 10 01027 g005
Figure 6. Number of observations as a function of time lag for the regions of R1–R4. Positive time lag means drifter coming into the region.
Jmse 10 01027 g006
Figure 7. Probability density function (PDF) of residual u1 (left) and u2 (right) in all the four regions of R1–R4 (circles). The solid lines are the Gaussian PDF.
Jmse 10 01027 g007
Figure 8. Lateral diffusivity computed for the four selected regions (R1R4). Solid lines represent the zonal component (Kxx), and dotted lines represent the meridional component (Kyy). Note that each panel has a different scale on the y-axis.
Jmse 10 01027 g008
Table 1. Drifters deployed in spring 2019 in the LS, the WP, and the ECS.
Drifter IDDeploy DateDeploy Longitude ° EDeploy Latitude ° NEnd DateDeploy Region
92767503/16119.982221.726110/14LS
92773903/16120.511121.341107/15LS
92766603/17120.996221.081407/12LS
92767403/17121.997320.552505/31LS
92766503/17122.987819.962303/20LS
92769203/17123.528119.671207/11LS
92767603/18123.843919.356507/12LS
92772303/18124.167619.038207/15LS
92768903/19128.499518.396206/10WP
92773403/19129.505818.376807/16WP
92773303/20129.838618.381907/09WP
92768703/20130.192118.396007/02WP
92769103/20130.531818.406507/15WP
92769303/20130.868318.454307/16WP
92766803/29129.511918.105907/23WP
92767003/30129.058618.098807/24WP
92773103/30128.603818.093507/24WP
92767903/30127.702918.098604/26WP
92769004/14127.695818.096608/08WP
92772004/16126.960618.398908/11WP
92773804/17124.861719.654808/12WP
92771804/13123.084927.714805/26ECS
92773004/13122.593727.540608/06ECS
92768304/14123.000127.325408/08ECS
92768004/14122.669226.835708/10ECS
92772904/15122.043026.884208/10ECS
92766104/19121.837926.028807/10ECS
92768804/20121.291826.096407/15ECS
92768604/23120.455825.778108/13ECS
Table 2. Asymptotic diffusivity and Lagrangian integral scales in R1~R4.
K x x K y y T x T y L x L y
103 m2/s103 m2/sdaydaykmkm
R120.911.22.41.565.637.7
R213.712.51.41.541.240.9
R35.46.30.81.219.525.4
R452.024.83.71.8128.762.7
Publisher’s Note: MDPI stays neutral with regard to jurisdictional claims in published maps and institutional affiliations.

