Abstract
Planning and zoning of marine areas is a common practice worldwide. In China, marine major function-oriented zoning (MMFOZ) is an effective geographical method for ensuring sustainable marine resource and ecosystems development; however, ecosystem-based management (EBM) has neither been considered in MMFOZ research nor in practice. Thus, the current MMFOZ evaluation system does not consider integration between the terrestrial and marine components, and the administrative boundaries are adopted as those of research areas and spatial zoning units. Here, an improved MMFOZ framework is presented through an ecosystem-based delimitation of the research area and subregions and a novel indicator system integrating land- and sea-based impacts, to assess and discriminate MMFOZ. A bay ecosystem and nearby land catchment units were selected as the research object. The results revealed two marine optimized development zones, one marine significant development zone, and six marine restricted development zones were divided, with areas of 358.11 km2 (24.63% of the total zoning area), 605.95 km2 (41.69%), and 489.54 km2 (33.68%), respectively. The improved MMFOZ framework coupled with EBM effectively addressed the limitations of marine spatial planning (MSP), while providing a new practical tool for a novel paradigm of sea governance based on an EBM–MSP coupling framework.
1. Introduction
In recent decades, global coastal and marine activities have promoted economies at great ecological expense on these environments [1]. Marine protected areas (MPAs) and fisheries management have traditionally been recognized as the primary methods for alleviating such ecological crises; however, most are limited to specific species (e.g., fishing management), or confined to small areas of specific ecological value (e.g., MPAs) [2,3,4], thus neglecting larger-scale, multiple uses, and cumulative effects [5]. Consequently, actions to support integrated marine governance have been adopted globally, through approaches, such as integrated coastal zone management, ecosystem-based management (EBM), and marine spatial planning (MSP) [6,7,8]. In addition, the conflicts arising out of the commission of human activities and environmental protection have intensified [9,10]. Some reasons for the same include intensification of the traditional exploitation of sea and its resources alongside the emergence of new coastal and marine uses, as well as environmental changes [11,12]. Therefore, the integration of EBM with MSP, with a focus on conflict resolution [13], has emerged as the predominant paradigm for sustainable ocean governance [14,15,16]. Notably, incorporating an EBM approach into governance and planning can positively impact spatial use in marine areas [17] as it aims to protect marine ecosystem integrity; whereas promoting resource use to balance socio-economic and environmental goals [18,19] is recognized as an effective tool for planning sustainable development approaches for coastal communities [20]. Thus, concerns regarding the practical implementation of EBM have encouraged a coupling with the MSP framework [21,22,23].
EBM is defined as an interdisciplinary management approach which comprehensively considers interactions among ecosystem relevance, integrity, and biodiversity [21]. EBM aims to achieve sustainable utilization of marine resources and optimal management of marine ecosystems through a focus on the dynamic characteristics of ecosystems. Additionally, it aims to utilize marine ecosystems rather than administrative areas as the management object [24,25], thereby maintaining the ecosystem in a healthy, productive, and resilient state [26]. In ecosystem-based planning, essential attributes of functional ecosystems must be included and fed back into the planning processes [27,28]. Both marine ecological restoration and improvements to social benefits require ecosystem-based spatial zoning to devise more spatially targeted marine policies [4,29]. An issue arises, however, in that although most MSP programs claim to use an ecosystem-based approach as a guiding framework, this is rarely the case [30]. First, terrestrial and catchment units have been excluded by most MSPs [20], and such a failure to integrate land use planning in contiguous coastal areas may result in excluding the direct or potential impacts beyond the immediate boundaries. In some regions (e.g., Ireland and other EU countries), the planning and management “split” between land and sea has been exacerbated by frequently conflicting legislative instruments and contentious competences [30]. Second, save for a few cases (e.g., Wadden Sea [31] and Shetland Islands [32]), most MSPs using administrative or political boundaries to divide the marine ecosystem into fragmented patches [16] can lead to potential miscalculations of community aspirations, ecological processes, and integrated management approaches [26]. A set of scientific concepts and guiding principles are, therefore, necessary for effective zoning planning [33], which can only be achieved by transcending administrative boundaries [26].
In China, an MSP system that employs marine major function-oriented zoning (MMFOZ) as the basic framework, and marine functional zoning (MFZ) as the implementation approach [34] has been adopted for sea area management. MFZ is a well-known application of MSP, which is defined as an effective policy tool for coordinating different marine activities, and has played an essential role in the utilization and protection of marine space. Although MMFOZ has received relatively little attention from the international scientific community, it plays an important role in China as a key tool for spatial management, enabling decision makers to control the types of geographic space [35,36]. MMFOZ aims to achieve a balance between the development and protection of marine space, in which a geographical comprehensive zoning method is used to determine the core functions for the development and protection of each Subregion. This method was defined as a general blueprint for the rational utilization and conservation of future ocean spaces [37], and notably differs from MFZ in that it focuses on the positioning, development direction, regulatory requirements for, and regional policies of different marine major function-oriented zones(MMFOZs), which are bound by policy; whereas MFZ focuses on the rational allocation of marine resources, controlling and guiding the direction of marine resource use, as well as environmental protection requirements, which are bound by resource constraints [38]. Specifically, MMFOZ is a planning guide for the development or restricted development of sea areas, whereas the MFZ makes a detailed planning layout for the mode of marine development, including fisheries, reclamation, ports, and tourism.
Since its inception, MMFOZ has attracted considerable research attention in China in terms of conceptual development [39], improvement of technical routes [40], and promotion of the indicator system for zoning [41,42,43]. The most prominent studies [41,42] have focused on MMFOZ area (using the coastline and territorial sea baseline as the zoning boundary, while considering the primary function of the sea side), analysis units (administrative unit, island group, or strategic resource area), development methods (optimized, key, restricted, or prohibited development), and an indicator system (including a three-rule layer with 12 indicators consisting of the resources and environmental carrying capacity, the exploitation intensity, and the developmental potential), all of which play significant roles in promoting the practical implementation of the method. Accordingly, these studies have provided the basic model for China’s current MMFOZ framework. Notably, both MMFOZ and MFZ as management tools of MSP systems in China have shown similar limitations in that they ignore the connectivity and openness of the marine environment; thus, related characteristics of EBM are rarely considered.
Accordingly, two key issues are to be emphasized to resolve these aforementioned problems: (1) Sea-related activities in terrestrial parts of coastal areas (i.e., outside the sea area boundary), as well as any correlated threats to these regions that can pressure or impact the ecosystem, must be included in the marine planning or zoning; (2) methods must be identified for integrating the social, economic, and environmental values of coastal zones into the marine planning/zoning analysis to more successfully resolve sustainable development issues of the coastal zone. To this end, an improved MMFOZ framework is presented here through an ecosystem-based delimitation of the research area and subregions, in addition to indicator construction, to assess and discriminate MMFOZs via quantitative and qualitative methods. The framework was applied to a case study in Meizhou Bay and its adjacent land areas, a region characterized by intensive marine development activities, to verify its applicability. The objectives of this study were to: (1) Establish an improved zoning method based on natural marine ecological elements for determining boundaries of subregions of MMFOZ, and optimize the spatial zoning patterns of the bay ecosystem; (2) construct a novel indicator system based on land–sea integration to better inform functional categories of MMFOZ; and, (3) analyze the different orientation of subregions in Meizhou Bay and provide differentiated management objectives according to the comprehensive evaluation results. This framework successfully provided a quantitative tool for the formulation of differentiated marine management objectives at small spatial scales. Moreover, the analysis here will promote further development of the MSP via the improved EBM-MMFOZ framework, thereby providing a scientific basis for advancing EBM in coastal zones. The research conducted here regarding the deficiencies of MMFOZ also has important implications for marine management in other regions of the world.
2. Materials and Methods
2.1. Study Area
Meizhou Bay is located at the junction of Quanzhou City and Putian City in central Fujian (118°51′–119°10′ E, 24°56′–25°18′ N), and faces Taiwan across the Taiwan Strait (Figure 1). It is a semi-closed, long and narrow bay, with Meizhou Island located at its mouth. The natural deep-water shoreline is >30 km long, with a construction potential for >150 deep-water berths, and would therefore constitute an important natural deep-water port in China [44]. Its advantageous geographic position, strong natural resource endowment, and abundant development opportunities have created a substantial impetus for the socio-economic development of Meizhou Bay; however, rapid development has seriously threatened the sustainable use of regional marine resources. Furthermore, other coastal bays in China face the same dilemma with respect to resource advantages and sustainable development, rendering Meizhou Bay, a relatively independent and integrated ecosystem, a representative geographic region.

Figure 1.
The location of study area: (a) the location of Meizhou Bay (located at the junction of Quanzhou City and Putian City in central Fujian), and (b) status of Meizhou Bay.
2.2. Research Methods and Framework
The conceptual framework of determining MMFOZ is presented in Figure 2. First, ecosystem-based approaches were integrated into the boundary-determining process, including for the determination of the research area and subregions. Second, a land–sea integration evaluation system with 16 indicators, consisting of 24 sub-indicators, was constructed based on three perspectives—marine resources and environmental carrying capacity (hereafter carrying capacity), marine exploitation intensity (hereafter exploitation intensity), and marine developmental potential (hereafter developmental potential). Third, the qualitative indicators of each subregion were assigned scores through corresponding mathematical formulae, and linear interpolation was used to standardize the indicators. Subsequently, indicator weights were assigned scores via the entropy weight method, followed by dividing the three perspectives according to the equal range method (i.e., high, medium, and low). Finally, locations designated as MPAs at the national or provincial level, or military areas were first designated as marine forbidden development zones, while all other areas were placed into three categories of MMFOZs using matrix discriminant analysis:

Figure 2.
Conceptual framework of the research methods.
- (1)
- Marine optimized development zone: Areas with a high degree of sea area utilization, and a resource consumption that exceeds, or is about to exceed, the carrying capacity, where the marine economic structure must be adjusted, marine development and utilization activities must be optimized, and where marine resources and environmental problems are prominent.
- (2)
- Marine significant development zone: Sea areas with a good carrying capacity, a higher developmental potential, and prominent marine geographical advantages. Suitable for high-intensity, centralized development and utilization.
- (3)
- Marine restricted development zone: Sea areas with a weak carrying capacity. Marine development activities involve a large range of ecological risks, or the marine environment is polluted. Resources are seriously damaged and require restoration. These areas are not suitable for high-intensity, centralized development or utilization.
- (4)
- Marine forbidden development zone: National or provincial marine nature reserves, scenic spots, and military-restricted zones lawfully established within the sea area.
2.2.1. Delimitation of Research Area and Subregions
The fluidity and openness of the sea, as well as its indefinite boundaries, make MMFOZ more difficult to conduct in the sea than on land. Ecosystem integrity and land-sea integration require that the natural attributes of the sea, such as topography, flow field, resources, biology, and ecology, have been fully pondered when partitioning subregions for MMFOZ. Accordingly, the natural ecological elements of the study area formed the main basis for the division of land–sea subregions according the EBM principle. To this end, boundaries with obvious landform signs or ecosystem characteristics were adopted in the MMFOZ here, and included terrestrial watersheds, mountains, main coastal highways, and other places with significant differences in topography or vegetation; whereas marine signs included channel trends, tidal currents, as well as typical ecosystem or protected areas (Table 1).

Table 1.
Impact factors of the delimitation of subregions’ boundaries.
Subregions were created using ArcGIS v. 10.0 (ESRI, Redlands, CA, USA), according to the following steps: (1) Data of biological, hydrological, topographical, and other natural ecological characteristics related to subregion were collected for drawing corresponding vector layers, and creating an attribute database for each layer; (2) all layers were then superimposed, and the zones with obvious natural ecological characteristics were divided into independent subregions; and, (3) when multiple ecological features overlapped in the same subregion, the boundary was determined by considering the distribution and evaluation results of each ecological factor in the subregion.
2.2.2. Selection and Calculation of Evaluation Indicators for Subregions
Identifying the four categories of MMFOZ involved numerous factors, and thus, required a scientific indicator system. Based on the results of previous studies [44,45,46], as well as the principles of ecological integrity and land–sea integration, an evaluation system was constructed with 16 indicators, consisting of 24 sub-indicators for MMFOZ category evaluation (Table 2).
Table 2.
Indicator evaluation system for subregions.
Table 3.
Indicator quantification methods and data sources.
Table 3.
Indicator quantification methods and data sources.
| Indicator | Code | Indicator Quantification | Evaluation Methods | Formulae | Data Sources | |
|---|---|---|---|---|---|---|
| Proportion of available shoreline | C11 | Reflects the potential carrying capacity of shorelines for future economic development and population agglomeration | Proportion of shoreline that can be used | Ld: Length of the shoreline in use Lt: Total length of the subregion shoreline | Extracted from remote sensing imagery | |
| Proportion of available beach resources | C12 | Reflects the potential carrying capacity of beaches for future economic development and population agglomeration | Proportion of beach that can be used | Sd: Area of the beach in use St: Total sea area of the subregion. | ||
| Aquatic product Production (i.e., Quantity of fish caught) | C21 | Reflects the sustainable supply capacity of marine life | Amount of fish caught by subregion at the evaluation period | Values obtained from the survey data of each station, and spatial interpolation in ArcGIS | --- | Survey data from the Investigation on Marine Environment and Resources across 13 bays of Fujian Province (Spring 2017) |
| Seawater environmental quality | C31 | Reflects the suitability of the coastal environment for human survival, quality of life, and development | Sum of the product of the marine area for each type of water quality and the standard value of each type of water quality, divided by the subregion area | Bs: Standard value of seawater quality for a given category Sp: Areas of seawater quality for a given category | ||
| Water quality compliance rate | C41 | Reflects the maximum amount of pollutants that can be absorbed by the seawater environment in a certain area while meeting the target value of the marine environment (i.e., the threshold for maintaining the ecological balance without exceeding the requirements of human health) | Proportion of the area meeting the water quality target, to the total area of the seawater control zones | Ni: The area of a given seawater quality category meeting the seawater quality standards in control zones Nt: Total area of the seawater control zones | ||
| Benthic organism diversity index | C51 | Reflects the ability of an ecosystem to maintain its natural attributes, biodiversity, and key ecological processes, while continuing to provide its service functions | After obtaining the diversity index of each station (C51i), C51 was obtained using spatial interpolation in ArcGIS | S: Number of species in the sample Pi: The ratio of the amount of species i to the total number of each species | ||
| Proportion of protected marine areas to total marine areas | C61 | Reflects the importance of typical ecosystems and habitats in a specific sea area | Proportion of protected marine areas to total marine areas of the subregion | Pa: Protected marine areas in the subregion Ta: Total sea areas in the subregion | Marine Functional Zoning of Fujian Province (2011–2020) | |
| Proportion of forested area to total land area | C71 | Reflects abundance of forest area or richness of forest resources in the subregion | Proportion of the vertical projection area of plants to the total subregion area | Fa: Vertical projection area of the forest La: Total subregion area | Extracted from remote sensing imagery | |
| Marine disaster risk index | C81 | Reflects the risk of loss resulting from various marine disasters, such as storm surges, waves, red tides, sea fogs, sea level rise, and coastal zone geological disasters | Product of disaster grade index and the economic intensity coefficient | Id: Disaster grade index kd: Economic intensity coefficient | Marine disaster Bulletin of Fujian Province in 2017 | |
| Direct economic loss attributed to disasters | C82 | Refers to the risk loss caused by marine disasters and marine accidents, reflecting the negative impact degree of marine disasters and marine accidents on people’s lives, and marine economic development in the subregion | Proportion of the subregion GDP to that of the superior administrative region, multiplied by the direct economic loss caused by disasters and accidents of the superior administrative region | GDPd: GDP of subregion GDPc: GDP of superior administrative region ELc: Direct economic loss caused by disasters and accidents in the superior administrative region | ||
| Utilization rate of sea areas | I11 | Reflects the development and utilization degree of sea areas | Proportion of areas with approved sea area user rights to the total sea area | Sq: Sea areas with approved used rights in the subregion Sx: Total subregion sea area | Granting data from the Marine Dynamic Management Center | |
| Reclamation intensity | I12 | Reflects the pressure intensity exerted by reclamation on coastal ecological environments | Proportion of reclamation areas to the total sea area | Sw: Reclamation areas of the subregion Sx: Total sea area of the subregion. | Extracted from remote sensing imagery | |
| Population density of the adjacent land area | I21 | Reflects the status of the human–land relationship (unit: persons·km−2) | Proportion of the total subregion population to the total subregion area | Pt: Total subregion population St: Total land area of the subregion | The Ocean Statistical Yearbooks of Quanzhou City and Putian City (2013–2017) | |
| Urbanization level | I22 | Reflects the development and utilization levels of the adjacent land area | Proportion of urban built-up areas to the available land area | Ct: Urban built-up area of the subregion St: Available land area of the subregion. | ||
| Marine economic development index | I31 | Reflects the current level and growth vitality of the marine economic development | Product of GOP per unit shoreline, and intensity coefficient for the average annual growth rate of GOP over the past five years | Lt: The total shoreline length of the subregion kGOP: Intensity coefficient corresponding to the average annual growth rate of the GOP over the past five years | ||
| Adjacent land economic development index | I41 | Reflects the levels of social and economic development, as well as growth vitality of adjacent land areas | Product of GDP per capita and intensity coefficient of the GDP average annual growth rate over the past five years | : Per capita GDP of the subregion KGDP: Intensity coefficient corresponding to the average annual growth rate of the GDP over the past five years | ||
| Port throughput | P11 | Reflects the traffic superiority of the sea area in the subregion | Proportion of subregion shoreline length to that of the superior administrative region, multiplied by the port throughput of the superior administrative region | Lt: Total shoreline length of the subregion Lc: Total shoreline length of the superior administrative region PTc: Port throughput of the superior administrative region | Master Plan of Meizhou Bay Port | |
| Berth density | P12 | Reflects the traffic superiority of the sea area in the subregion | Number of berths per shoreline | Nb: Number of berths Lt: Total length of the subregion shoreline | ||
| Passenger volume— road and rail transport | P21 | Reflects the traffic superiority of the adjacent land area in the subregion | Proportion of the highway/railway length in the subregion to that in the superior administrative region, multiplied by the highway/railway passenger volume in the superior administrative region | lP: The highway/railway length in the subregion lc: Highway/railway length in the superior administrative region PVc: Highway/railway passenger volume in the superior administrative region | Statistical Bulletin on National Economic and Social Development of Quanzhou City and Putian City in 2017 | |
| Freight volume— road and rail transport | P22 | Reflects the traffic superiority of the adjacent land area in the subregion | Proportion of the highway/railway length in the subregion to that in the superior administrative region, multiplied by the highway/railway freight volume in the superior administrative region | lP: Highway/railway length in the subregion lc: Highway/railway length in the superior administrative region FVc: Highway/railway freight volume in the superior administrative region | ||
| Research and development (R&D) expenditure as a proportion of GDP | P31 | Reflects the support of science and technology for marine development | Proportion of the subregion population to the population of the superior administrative region, multiplied by R&D expenditure as a proportion of superior administrative region GDP | Pt: Total subregion population Pc: Total population of the superior administrative region RDc: R&D expenditure as a proportion of GDP for the superior administrative region | The Ocean Statistical Yearbooks of Quanzhou City and Putian City in 2017 | |
| Number of patents certified | P32 | Reflects the development potential of marine science and technology | Proportion of subregion population to that of the superior administrative region, multiplied by the number of patents certified in the superior administrative region | Pt: Total subregion population Pc: Total population of the superior administrative region PDc: Number of patents certified in the superior administrative region. | ||
| Capacity to treat the wastewater | P41 | Reflects the amount of wastewater treated by wastewater treatment facilities in the subregion | Proportion of subregion GDP of that of the superior administrative region, multiplied by the wastewater treatment capacity in the superior administrative region | GDPd: GDP of the subregion GDPc: GDP of the superior administrative region WCc: Capacity to treat the wastewater of the superior administrative region. | The Ocean Statistical Yearbook of Quanzhou City and Putian City in 2017 | |
| Discharge of industrial wastewater directly into environment | P42 | Reflects the amount of industrial wastewater discharged from the enterprise through all outlets, excluding that discharged into the urban sewage treatment plant | Proportion of subregion GDP to that of the superior administrative region, multiplied by the amount of wastewater directly output into the environment of the superior administrative region | GDPd: GDP of the subregion GDPc: GDP of the superior administrative region DWc: Amount of wastewater directly output into the environment of the superior administrative region | Statistical Bulletin on National Economic and Social Development of Quanzhou City and Putian City in 2017. | |
Data Sources and Processing
Reliable data sources are the basis of conducting an MMFOZ. Three datasets were employed in this study: remote sensing, statistical, and survey data. Remote sensing data were obtained from the Google Earth Engine (combined with ArcGIS). Statistical data were obtained from the Ocean Statistical Yearbooks of Quanzhou City and Putian City (2013–2017), in addition to the Bulletin of Marine Ecology and Environment Status of Quanzhou City and Putian City, 2017. Survey data were obtained from the Investigation of Marine Environments and Resources in 13 Bay of Fujian Province (spring 2017), as well as the Master Plan of Meizhou Bay Port, and the Marine Functional Zoning of Fujian Province (2011–2020), as detailed in Table 3.
The small scale of the study area meant that the smallest administrative region involved was at the town-level; however, township statistics are not available as public data in China. Hence, some statistical data of the subregions could not be acquired directly through publicly available means such as the statistical yearbook. Accordingly, the values of these indicators (C82, P11, P21, P22, P31, P32, P41, and P42 in Table 3) were calculated via the following principles: If an indicator’s subregion value could not be directly obtained but the upper administrative regions (e.g., municipal- or provincial-level) were available, subregional values were calculated using equal proportions of the area, population, gross domestic product (GDP), or other related statistical data with respect to their affiliated larger administrative region.
Standardization of Evaluation Indicators
Linear interpolation was adopted to obtain the standardized evaluation indicators according to Equations (1) and (2):
where Xp and Xn are the standardized values of positive and negative indicators, respectively; Xmin and Xmax are the minimum and maximum values of the indicator, and X is the value of the evaluation indicator prior to standardization. Both Xp and Xn values varied from 0 to 1, where the distribution of each X standardization value is identical to that of the original corresponding value. In the indicator system, C81—Marine disaster risk index, C82—Direct economic loss attributed to disasters, and P42—Discharge of industrial wastewater directly into environment were the negative indicators.
2.2.3. Determination of MMFOZ Categories
The MMFOZ evaluation indicators included the carrying capacity, exploitation intensity, and developmental potential. A weighted summation method was adopted for calculations according to Equation (3):
where Y is the value of the evaluation indicators, N is the number of evaluation factors, wi is the weight of the ith evaluation factor, and ci is the value of the ith evaluation factor.
The equal range method, used to divide these three indicators into three levels (low, medium, and high), is an indicator grading method, which divides the evaluation indicator scores using equal differences between the upper and lower values of each level.
The marine optimized, marine significant, and marine restricted development zones were determined based on indicator evaluation via the matrix discrimination analysis method (Table 4). Comprehensive integrated analyses were then performed to determine the MMFOZ categories.
Table 4.
Matrix discrimination analysis method for identifying the functions of subregions.
3. Results
3.1. Delimitation Results of the Research Area and Subregions
Based on the principles of ecosystem management, the research area and subregions here were divided according to their ecosystem characteristics, as follows (Figure 3 and Figure 4):

Figure 3.
The delimitation of subregion boundaries: (a) catchment units; (b) ridge lines and main roads; (c) trends of tidal currents; (d) channel trends; (e) water depth; and, (f) zonal boundaries of Marine Functional Zoning of Fujian Province (2011–2020).
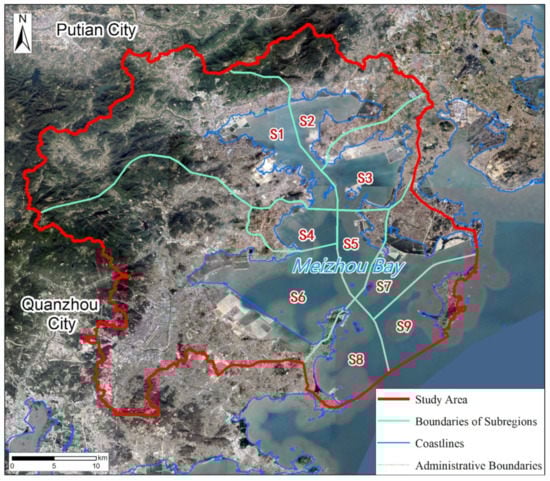
Figure 4.
Final boundaries of the nine subregions.
- (1)
- Research area: The sea area was divided according to the boundaries of the Meizhou Bay ecosystem (i.e., linking the bay mouth and the island cape), while the land area was divided according to the catchment area that discharges into the bay, including both the watershed catchment unit as extracted by DEM from remote sensing images and the ridge line were considered as the research boundaries of the land area (Figure 3a).
- (2)
- Subregions: Division of land subregions was determined using the boundaries of watershed catchment units in the coastal zones (Figure 3a), as well as ridge lines and main roads (Figure 3b); whereas the division of the marine subregions was determined by physical factors of Meizhou Bay, including the trend of tidal currents (Figure 3c), channel trends (Figure 3d), water depth (Figure 3e), and the boundaries of MPAs (Figure 3f). Overall, the study area was divided into nine subregions (Figure 4).
3.2. Calculation of Indicator Values and Weights
Indicator raw values were calculated according to the methods in Table 3, and the results are detailed further in Table 5. Linear interpolations were used to standardize the values, and the indicator weights were assigned according to the entropy weight method (Table 5). Finally, comprehensive indicator values were obtained by multiplying the weights and standardized weight values (Figure 5).
Table 5.
Calculation results of the evaluation indicators of subregions (raw values).
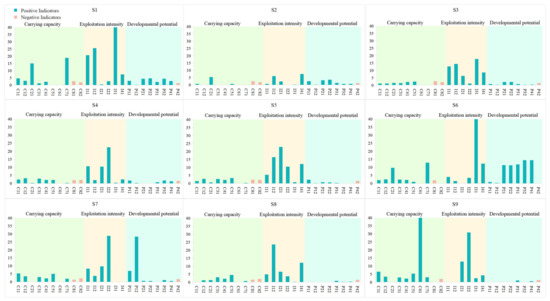
Figure 5.
Product of standardization value of indicators and weights.
The results of indicator weighting (Table 5) were as follows:
- (1)
- Among the 10 indicators in the criterion layer of carrying capacity (Table 5), C61 was the highest weighted (proportion of protected marine area to total marine area, 0.403), followed by C71 (proportion of forested area to total land area, 0.187) and C21 (aquatic product production, 0.148). Weight values of all other indicators were <0.1.
- (2)
- Among the 6 indicators in the criterion layer of exploitation intensity (Table 5), I31 was assigned the highest weight (marine economic development index, 0.353); whereas I41 was assigned the lowest weight (adjacent land economic development index, 0.071). Weight values of all other indicators were between 0.1–0.2, with no significant differences observed.
- (3)
- Among the eight indicators in the criterion layer of developmental potential (Table 5), P12 was assigned the highest weight (berth density, 0.283). Conversely, P12 (discharge of industrial wastewater directly into the environment, 0.017) and P11 (port throughput, 0.068) were assigned the lowest weights. Weight values of all other indicators were between 0.1–0.2, with no significant differences among them.
Figure 5 shows the comprehensive values for different indicators across the nine subregions. Scores depict the status of carrying capacity, exploitation intensity, and developmental potential of the subregions, which can reflect shortcomings and advantages. Accordingly, the functional zone types of this subregion were be divided, and the comprehensive indicator scores for each subregion (Figure 5) were as follows:
- (1)
- For S1, I31(marine economic development index), I12 (reclamation intensity), and I11 (utilization rate of sea areas) were assigned the highest scores under the dimension of exploitation intensity. These were followed by C71 (proportion of forested area to total land area) and C21 (aquatic product production) under the dimension of carrying capacity. All other indicators were assigned relatively low scores. This is attributed to S1 being rich in natural resources, and land-based economic development promoting the thriving coastal areas. In general, S1 scored higher in the two dimensions of exploitation intensity and carrying capacity.
- (2)
- The scores for most indicators of S3, S4, S5, and S8 were similar. In general, the indicator scores under the dimension of exploitation intensity were higher, while those of the other two dimensions were lower. This is attributed to the poor natural resources of these subregions that contribute less to socio-economic prosperity. The scores of all indicators for S2 were generally low, and no outstanding advantages were observed across the three dimensions.
- (3)
- For S6, I31 (marine economic development index) scored the highest under exploitation intensity, followed by C21 (aquatic product production), and C71 (proportion of forested area to total land area). This is because S6 has a large land area, and is capable of supporting greater populations and industries. Furthermore, S6 scored higher in indicator P41 (capacity to treat the wastewater), P32 (number of patents certified), P31 (R&D expenditure as a proportion of GDP), and P2 (adjacent land transportation superiority), indicating that S6 maintained superior developmental potential.
- (4)
- Considering the greater number of berths and shorter shorelines of the Douwei Port Area in S7, the P12 score (berth density) in this subregion was much higher than elsewhere. Further, the high I22 (urbanization level) score in S7 benefitted from the development of the Douwei Port Area.
- (5)
- For all 9 subregions, only S9 contained protected areas; thus, only S9 had a score for C61 (proportion of protected marine area to total marine area), while the scores for all other subregions were 0.
- (6)
- The three negative indicators—C81 (marine disaster risk index), C82 (direct economic loss attributed to disasters), and P42 (discharge of industrial wastewater directly into the environment)—all maintained low scores, with no significant differences among them. Accordingly, these three indicators contributed less to the comprehensive value of their criterion layer.
3.3. Comprehensive Results for Identifying the Functions of Subregions
3.3.1. Matrix Discrimination
The three comprehensive factors (carrying capacity, exploitation intensity, and developmental potential) were measured by adopting the weighted summation to the related indicators (Table 6). The equal range method was then used to grade the comprehensive evaluation values, and determine their threshold standard. The evaluation values were divided into three grades according to the absolute standards, with one-third and two-thirds serving as the dividing points (Figure 6).
Table 6.
Scores of the comprehensive evaluation indicators.

Figure 6.
Results of the grade determination: values < one-third are at low levels, values > two-thirds are at high levels, while values between them are at a medium level: (a) marine resources and environmental carrying capacity, (b) marine exploitation intensity, (c) marine developmental potential.
3.3.2. Comprehensive Evaluation Results
Employing the matrix discrimination method (Table 4), the final subregion functions were comprehensively analyzed, thus forming the conclusive zone division scheme for Meizhou Bay (Figure 7, Table 7). For S1, the sea area had been heavily polluted; thus, it is necessary to improve the spatial layout of this subregion to enhance its sustainable development. Accordingly, the main function type there was determined to be an optimized development zone. For S6, which contained the largest petrochemical industry base in Meizhou Bay, development was centered around this industry. Moreover, the land area of S6 is relatively broad, capable of providing greater resource advantages in population, economy, etc. Marine developmental potential of S6 is also high; thus, it was categorized as a significant development zone. For S9, located at the mouth of Meizhou Bay with favorable geographical conditions, a foundation for tourism development already exists; whereas eco-tourism could be developed into the main industry in the near future. Therefore, S9 was judged as a significant development zone, rather than a restricted development zone, despite including protected areas (these are not established at national or provincial level) located within.

Figure 7.
Comprehensive evaluation results for the MMFOZ in Meizhou Bay: (a) marine resources and environmental carrying capacity, (b) marine exploitation intensity, (c) marine developmental potential, and (d) final MMFOZ categories.
Table 7.
Comprehensive evaluation results for the final functions of subregions.
Table 7 shows that the sole optimized development zone of Meizhou Bay was S1, with a total area of 358.11 km2 (24.63% of the total study area). The significant development zones spanned S6 and S9, with a total area of 605.95 km2 (41.69%). Lastly, the restricted development zones included S2, S3, S4, S5, S7, and S8, with a total area of 489.54 km2 (33.68%). As mentioned, there was no prohibited development zone in the study area.
4. Discussion
4.1. Ecological Elements-Based Zoning Method for Small-Scale Sea Areas
Different choices in the planning/zoning boundaries may affect the results, such as the scope of the research problem, management strategies, and stakeholder involvement in the planning process [20]. Prior to 2018, oceans and land were governed by two departments (State Oceanic Administration and Ministry of Environmental Protection) in China. Owing to limitations in this dual-management system, the formulation of the plan and governance for existing MMFOZ relies on the land–sea boundaries, as well as on the administrative regions [51]. Although this was convenient for the promotion and implementation of MMFOZ under the system at the time, it has been observed that deep-rooted sectoral interests remain, leading to marked divergences between land and sea governance, as well as among different administrative regions [30,52]. Following the Chinese institutional reform in 2018, the ocean and land were under the centralized jurisdiction of the Ministry of Natural Resources [53,54], and it was expected that a unified management system across land–sea boundaries and across administrative boundaries could be achieved.
Here, the Meizhou Bay and the catchment units in the adjacent land were considered as the study area. Zonal boundaries were delineated according to marine ecological characteristics, and the complete homogeneous subregions were evaluated independently from administrative boundaries to propose an improved zoning scheme for marine ecosystems. Although some previous MSPs have been conducted based on marine ecosystem boundaries [55], the commonly assessed parameters of marine natural boundaries, such as breeding, bait, migration areas, water temperature, salinity, estuaries, wetlands, and other typical ecosystems and habitats can be observed well only in large-scale sea areas, because these factors stay relatively stable over small-scale sea areas. Hence, when selecting a small-scale research area, such as the Meizhou Bay chosen here, the boundaries of the considered marine ecological characteristics should include the distribution of distinct physical characteristics, such as channel trends, tidal currents, ecosystem or protected area boundaries, and catchment lines. These elements have notable variability over small-scale sea areas such as Meizhou Bay. Consequently, they can better support the zoning of the subregions’ boundaries of the small-scale research areas.
4.2. Indicator Framework Based on Evaluation of Land and Sea Pressures
Our research differs from previous functional zoning processes of MMFOZ in that earlier studies have only focused on the sea area [56], using a marine factor-based indicator system for the determination of the functional zones of MMFOZ, while notably ignoring the connectivity and openness of marine environments, as well as the land-based pressure on the coastal environments. Under the global background that land-based pollution accounts for >70% of the total input in marine pollutants [57,58], a more accurate marine management and planning framework [59,60,61] is required to help alleviate the detrimental pressures placed upon sea areas exerted by intensive population growth and industrial agglomerations. Therefore, it is vital to consider integrated land- and sea-based influencing factors throughout the planning process [57]. Here, the ecological impacts of adjacent catchment units were included, and land-based activities were considered one of the driving factors impacting coastal ecosystems. Accordingly, diverse evaluation indicators were adopted that embodied land-based impacts, including: C3, marine environmental quality; C4, marine environmental capacity; I2, adjacent land developmental intensity; I4, adjacent land regional economy level; P2, adjacent land transportation superiority; P3, innovation ability of marine science and technology; and P4, ability to control land-based pollutants entering into the sea (Table 2). Subsequently, a new indicator system considering land–sea integration and ecosystem integrity was constructed through comprehensively accounting for the social, economic, and environmental values of coastal zones. It is posited here that an improved evaluation system for the assessment of marine functional zones was achieved, and an MMFOZ determination framework was conducted accordingly.
This zoning approach based on ecological characteristics and the indicator system considering land–sea integration formed the basis for the construction of the novel MMFOZ framework coupled with EBM. This coupling addresses the notable deficiencies in the existing MMFOZ, and provides a new practical tool for the novel paradigm of sea governance based on an EBM–MSP coupling framework.
4.3. Tools for the Formulation of Differentiated Management Objectives
A “one size fits all” marine management policy cannot be applied to all coastal areas [1]; thus, it is necessary to take targeted intervention measures across smaller-scale sea areas. Policy makers must therefore set more flexible and suitable goals to meet the development needs of different functional zones. The improved MMFOZ framework proposed here provides a quantitative tool to serve as a basis for designing differentiated management objectives across different zones. Based on the results, differential development directions and control schemes are proposed here for the nine functional zones of Meizhou Bay:
- (1)
- In marine optimized development zones, the local governments should: improve the spatial layout of coastal areas; actively develop a modern port service industry; promote the transformation of marine industrial structure to a high-end, high-efficiency, and high-added value stage; and develop green industries, as well as circular economic systems.
- (2)
- In marine significant development zones, the local petrochemical and port logistics industries should adopt net zero emissions policies throughout the entire production process (raw materials to finished products). They should also promote links between up- and downstream industrial chains, support the construction of port logistics infrastructure, enhance the port storage and transportation capacity, as well as construct intelligent (digital) ports.
- (3)
- In marine restricted development zones, local governments should promote the integration of marine industrial structural, limit the scale of industrial and urban construction, and restore marine ecology while enhancing leisure spaces for coastal tourism.
- (4)
- No prohibited marine development zones were identified in the present study area; however, several recommendations can still be provided here as reference for other marine areas: Strict limitations on pollutant discharge are necessary, in addition to providing guidance on the discharge of land-based pollutants into far-shore areas outside of the bay. Activities that have a significant impact on the reproduction and growth of marine organisms should be prohibited, so as to protect coastal wetlands, mangroves, and other vital biological habitats. Changes to the topography and geomorphology of the coast, seabed, and other natural environments must similarly be prohibited without authorization.
When examining coupled anthropogenic impacts on ecosystems, the novel improved framework based on ecosystem management here not only helps to expand the methods presently employed in this field, but provides a useful foundation for policymaking as well, including ecosystem service maintenance, environmental management, in addition to land and sea planning [62,63].
4.4. Limitations and Future Directions
The primary limitations of the present study are related to data availability and the difficulty of implementing ecosystem-based MMFOZ planning. Firstly, some indicators (i.e., C82, P11, P21, P22, P31, P32, P41, and P42) were counted by local governments based on administrative boundaries; therefore, the values for each subregion could only be acquired through statistical data. Thus, values were calculated based on equal proportions of area, population, GDP, or other related subregion data compared to that of their affiliated upper administrative region. Consequently, indicator values obtained in such instances may differ from the true values. Secondly, ecosystem-based MMFOZ planning can only be implemented under a premise of a transboundary management. Although China’s recent institutional reform has brought land and sea areas under a centralized jurisdiction, it remains difficult to completely break free of administrative boundaries. Similarly, many local authorities in other coastal countries or regions are reluctant to take responsibility for managing the cross boundary zones with unclear legal obligations and ramifications [30].
Revising the existing administrative MMFOZ zoning approach requires further studies on the relationships and coordination among administrative and physical geographical boundaries of MMFOZ. Moreover, it is vital to improve indicator screening for practical applications, which should be a central focus of future research. Such efforts could promote the implementation of ecosystem-based MMFOZ planning, and reinforce the link between scientific research and policymaking [64].
5. Conclusions
The sustainable development of coastal areas requires a systematic and scientific system for marine zoning and ecological governance. Thus, an improved MMFOZ evaluation framework was constructed here based on ecological integrity and land–sea integration from the perspective of coupling anthropogenic impacts and ecosystems. A research area containing the sea and adjacent land catchment units, characterized by intensive marine development activities, was selected for ecosystem-based management. Subregion boundaries were divided according to ecosystem characteristics; an evaluation system with 16 indicators, consisting of 24 sub-indicators, was constructed based on three criterion layers—marine resources and environmental carrying capacity, marine exploitation intensity, and marine developmental potential. Subsequently, the evaluation and discrimination of MMFOZ were performed. Here, EBM was integrated into the MSP process to address two primary concerns, including the “split” between land and sea as well as insufficient consideration of relevant environmental, social, and economic values to assess ecological pressures from land- and sea-based activities. This framework could be applied for those coastal regions that require an ecosystem-based management. This is especially relevant for transboundary areas, including bays under the jurisdiction of two or more administrative bodies, and for those areas which are managed across land and sea boundaries.
The evaluation system was applied to the Meizhou Bay, which was divided into nine functional zones. Subregion S1 represented a marine optimized development zone, with an area of 358.11 km2 (24.63% of the total study area); whereas S6 and S9 represented marine significant development zones, with a total area of 605.95 km2 (41.69%). S2, S3, S4, S5, S7, and S8 represented marine restricted development zones, with an overall area of 489.54 km2 (33.68%). Based on this subregion zonation, differentiated management objectives were developed, thus forming a scientific basis for management activities that benefit the effective utilization of marine resources. This zoning approach based on ecological characteristics and the indicator system of land–sea factors can assist elsewhere with the development of improved zoning schematics from marine ecosystem-based perspectives, thereby optimizing marine zoning patterns, and corresponding management actions.
Author Contributions
Conceptualization, Y.L., F.H. and J.H.; data curation, Y.L., Y.Z. and Q.C.; formal analysis, F.H. and Q.W.; funding acquisition, F.H. and X.X.; investigation, Y.L. and Q.C.; methodology, Y.L., Y.Z., Q.W. and J.H.; project administration, X.X.; resources, X.X.; software, Y.L.; supervision, F.H. and X.X.; writing—original draft, Y.L.; writing—review and editing, F.H. All authors have read and agreed to the published version of the manuscript.
Funding
This research was funded by the Ministry of Natural Resources, People’s Republic of China (grant no. HD01-190501).
Informed Consent Statement
Not applicable.
Acknowledgments
The authors express their sincere gratitude to Chao Liu from Xiamen University, China, who provided invaluable input into this research.
Conflicts of Interest
The authors declare no conflict of interest.
References
- Xu, K.; Wang, J.; Wang, J.; Wang, X.; Chi, Y.; Zhang, X. Environmental function zoning for spatially differentiated environmental policies in China. J. Environ. Manag. 2020, 255, 109485. [Google Scholar] [CrossRef] [PubMed]
- Agardy, T. Information needs for marine protected areas: Scientific and societal. Bull. Mar. Sci. 2000, 66, 875–888. [Google Scholar]
- Agardy, T. Marine Protected Areas and Ocean. Conservation; R. E. Landes Co.: Austin, TX, USA, 1997. [Google Scholar]
- Day, V.; Paxinos, R.; Emmett, J.; Wright, A.; Goecker, M. The Marine planning framework for South Australia: A new ecosystem-based zoning policy for marine management. Mar. Pol. 2008, 32, 535–543. [Google Scholar] [CrossRef]
- Allison, G.W.; Lubchenco, J.; Carr, M. Marine reserves are necessary but not sufficient for marine conservation. Ecol. Appl. 1998, 8, S79–S92. [Google Scholar] [CrossRef]
- Borja, A.; Elliott, M.; Snelgrove, P.V.R.; Austen, M.C.; Berg, T.; Cochrane, S.; Carstensen, J.; Danovaro, R.; Greenstreet, S.; Heiskanen, A.-S.; et al. Bridging the gap between policy and science in assessing the health status of marine ecosystems. Front. Mar. Sci. 2016, 3, 175. [Google Scholar] [CrossRef] [Green Version]
- Douvere, F. Marine Spatial Planning: Concepts, Current Practice and Linkages to Other Management Approaches. Ph.D. Thesis, Political Science, Ghent University, Ghent, Belgium, May 2010. [Google Scholar]
- Ehler, C. Two decades of progress in Marine Spatial Planning. Mar. Policy. 2020, 132, 104134. [Google Scholar] [CrossRef]
- Arbo, P.; Thủy, P.T.T. Use conflicts in marine ecosystem-based management—The case of oil versus fisheries. Ocean. Coast. Manag. 2016, 122, 77–86. [Google Scholar] [CrossRef] [Green Version]
- Ehler, C.; Douvere, F. Marine Spatial Planning: A Step-By-Step Approach toward Ecosystem-Based Management, Intergovernmental Oceanographic Commission and Man and the Biosphere Programme. IOC Manual and Guides, No 53, ICAM Dossier, No 6. Paris: UNESCO. 2009. Available online: https://unesdoc.unesco.org/ark:/48223/pf0000186559 (accessed on 1 May 2009).
- Rempis, N.; Tsilimigkas, G. Marine spatial planning on Crete Island, Greece: Methodological and implementation issues. J. Spat. Sci. 2021, 2, 1–20. [Google Scholar] [CrossRef]
- Rempis, N.; Alexandrakis, G.; Tsilimigkas, G.; Kampanis, N. Coastal use synergies and conflicts evaluation in the framework of spatial, development and sectoral policies. J. Manag. 2018, 166, 40–51. [Google Scholar] [CrossRef]
- Kyriazi, Z. From identification of compatibilities and conflicts to reaching marine spatial allocation agreements. Review of actions required and relevant tools and processes. Ocean. Coast. Manag 2018, 166, 103–112. [Google Scholar] [CrossRef]
- Ehler, C.; Douvere, F. Visions for a Sea Change. Report of the First International Workshop on Marine Spatial Planning. Intergovernmental Oceanographic Commission and Man and the Biosphere Programme; IOC Manual and Guides: Paris, France, 2006. [Google Scholar] [CrossRef]
- Foley, M.M.; Halpern, B.S.; Micheli, F.; Armsby, M.H.; Caldwell, M.R.; Crain, C.M.; Prahler, E.; Rohr, N.; Sivas, D.; Beck, M.W.; et al. Guiding ecological principles for marine spatial planning. Mar. Policy 2010, 34, 955–966. [Google Scholar] [CrossRef]
- Depellegrin, D.; Galparsoro, I.; Pınarbaşı, K. Operationalizing ecosystem services in support of ecosystem-based marine spatial planning. Ocean. Coast. Manag. 2020, 198, 105346. [Google Scholar] [CrossRef]
- Brown, M.G.; Quinn, J.E. Zoning does not improve the availability of ecosystem services in urban watersheds. A case study from Upstate South Carolina, USA. Ecosyst. Serv. 2018, 34, 254–265. [Google Scholar] [CrossRef]
- Fanny, D.; Charles, N.E. International workshop on marine spatial planning, UNESCO, Paris, 8–10 November 2006. Mar. Policy 2007, 31, 582–583. [Google Scholar] [CrossRef]
- Manea, E.; Bianchelli, S.; Fanelli, E.; Danovaro, R.; Gissi, E. Towards an ecosystem-based marine spatial planning in the deep Mediterranean Sea. Sci. Total Environ. 2020, 715, 136884. [Google Scholar] [CrossRef]
- Domínguez-Tejo, E.; Metternicht, G.; Johnston, E.; Hedge, L. Marine spatial planning advancing the ecosystem-based approach to coastal zone management: A review. Mar. Pol. 2016, 72, 115–130. [Google Scholar] [CrossRef]
- Domínguez-Tejo, E.; Metternicht, G. An ecosystem-based approach and Bayesian modelling to inform coastal planning: A case study of Manly, Australia. Environ. Sci. Pol. 2019, 101, 72–86. [Google Scholar] [CrossRef]
- Douvere, F. The importance of marine spatial planning in advancing ecosystem-based sea use management. Mar. Pol. 2008, 32, 762–771. [Google Scholar] [CrossRef]
- Gilliland, P.M.; Laffoley, D. Key elements and steps in the process of developing ecosystem-based marine spatial planning. Mar. Pol. 2008, 32, 787–796. [Google Scholar] [CrossRef]
- Meng, W.; Hu, B.; Liu, B.; Zhou, J. Marine ecosystem-based management: Definition, principles, framework and practice. Adv. Earth Sci. 2016, 31, 461–470. (In Chinese) [Google Scholar]
- Wei, D.; Feng, A.; Huang, J. Analysis of ecological protection effect based on functional zoning and spatial management and control. Int. J. Geoheritage Parks 2020, 8, 166–172. [Google Scholar] [CrossRef]
- Sas, E.; Fischhendler, I.; Portman, M.E. The demarcation of arbitrary boundaries for coastal zone management: The Israeli case. J. Environ. Manag. 2010, 91, 2358–2369. [Google Scholar] [CrossRef]
- Foley, M.M.; Armsby, M.H.; Prahler, E.E.; Caldwell, M.R.; Erickson, A.L.; Kittinger, J.N.; Crowder, L.B.; Levin, P.S. Improving ocean management through the use of ecological principles and integrated ecosystem assessments. BioScience 2013, 63, 619–631. [Google Scholar] [CrossRef] [Green Version]
- Crowder, L.; Norse, E. Essential ecological insights for marine ecosystem-based management and marine spatial planning. Mar. Pol. 2008, 32, 772–778. [Google Scholar] [CrossRef]
- Liu, Y.; Li, T.; Zhao, W.; Wang, S.; Fu, B. Landscape functional zoning at a county level based on ecosystem services bundle: Methods comparison and management indication. J. Environ. Manag. 2019, 249, 109315. [Google Scholar] [CrossRef]
- O’Hagan, A.M.; Paterson, S.; Le Tissier, M. Addressing the tangled web of governance mechanisms for land-sea interactions: Assessing implementation challenges across scales. Mar. Pol. 2020, 112, 103715. [Google Scholar] [CrossRef]
- Giebels, D.; Buuren, A.V.; Edelenbos, J. Ecosystem-based management in the Wadden Sea: Principles for the governance of knowledge. J. Sea Res. 2013, 82, 176–187. [Google Scholar] [CrossRef]
- Kelly, C.; Gray, L.; Shucksmith, R.; Tweddle, J.F. Review and evaluation of marine spatial planning in the Shetland Islands. Mar. Policy 2014, 46, 152–160. [Google Scholar] [CrossRef] [Green Version]
- Xu, W.; Li, X.; Pimm, S.L.; Hull, V.; Zhang, J.; Zhang, L.; Xiao, Y.; Zheng, H.; Ouyang, Z. The effectiveness of the zoning of China’s protected areas. Biol. Conserv. 2016, 204, 231–236. [Google Scholar] [CrossRef]
- Luan, W.; Wang, H.; Yang, Y. Implementation system of Marine function zoning version 4.0. China Ocean. News 2017, 002. (In Chinese) [Google Scholar]
- Chung, L.L.W. The economics of land-use zoning: A literature review and analysis of the work of Coase. Town Plan. Rev. 1994, 65, 77–98. [Google Scholar] [CrossRef]
- Munroe, D.K.; Croissant, C.; York, A.M. Land use policy and landscape fragmentation in an urbanizing region: Assessing the impact of zoning. Appl. Geogr. 2005, 25, 121–141. [Google Scholar] [CrossRef]
- Fan, J. Draft of major function-oriented zoning of China. Acta Geogr. Sin. 2015, 70, 186–201. (In Chinese) [Google Scholar]
- Fang, C.; Liu, K.; Wan, C. The connotation of marine spatial planning system building in Chinese ecological civilization. Mar. Develop. Manag. 2017, 34, 89–93. (In Chinese) [Google Scholar]
- Zhu, C.; Ma, X.; Meng, Z.; Qiu, F. Regional Major Function Oriented Zoning-Theory, Method; Empirical; Science Press: Beijing, China, 2007; p. 18. (In Chinese) [Google Scholar]
- Xu, H.; Ding, D.; Ye, S.; Shi, H. Some key issues on marine major function- oriented zone planning. Ocean. Dev. Manag. 2008, 25, 52–54. (In Chinese) [Google Scholar]
- He, G.; Wang, X.; Zhao, R.; Xu, C.; Song, W. Research on the method of China’s marine major function-oriented zoning. Mar. Sci. Bull. 2010, 29, 334–341. (In Chinese) [Google Scholar]
- Li, D.; Zhao, R.; Song, W. Research on the technical method of offshore marine major function- oriented zoning. Mar. Environ. Sci. 2010, 29, 939–944. (In Chinese) [Google Scholar]
- Shi, H.; Zheng, W.; Ding, D. Indicator system and model of marine major function-oriented zoning of coastal zone. Ocean. Dev. Manag. 2009, 26, 88–96. (In Chinese) [Google Scholar]
- Zhao, Z.; Liu, R.; Ma, Y.; Sun, W. Remote sensing monitoring and analysis of coastline changes in Meizhou Bay since the last 30 years. Coast. Eng. 2013, 32, 19–27. (In Chinese) [Google Scholar]
- Mu, R. Principal Coastal Functional Zoning Based on Multidimensional Decision Making (MDDM). Ph.D. Thesis, Xiamen University, Xiamen, China, 2013. (In Chinese). [Google Scholar]
- Technical Regulation for Division of Marine Major Function-Oriented Zone; State Oceanic Administration [SOA]: Beijing, China, 2011. (In Chinese)
- PEMSEA. Partnerships in Environmental Management for the Seas of East Asia (1994–2010): A Regional Mechanism Facili-tating Sustainable Environmental Benefits in River Basins, Coasts, Islands and Seas. PEMSEA IEC Material; Global Environment Facility/United Nations Development Program/International Maritime Organization Regional Program on Building Partnerships for the Seas of East Asia (PEMSEA): Quezon City, Philippines, 2007. [Google Scholar]
- Environmental Protection Department, The Government of the Hong Kong Special Administrative Region, Annual Marine Water Quality Reports in Hongkong. 2020. Available online: https://www.epd.gov.hk/epd/english/environmentinhk/water/hkwqrc/waterquality/marine-2.html (accessed on 28 December 2021).
- Asian Development Bank (ADB). Key Indicators for Asia and the Pacific. 2021. Available online: https://www.adb.org/publications/key-indicators-asia-and-pacific-2021 (accessed on 28 December 2021).
- United Nations. The 2030 Agenda for Sustainable Development. 2018. Available online: https://sdgs.un.org/goals (accessed on 25 September 2015).
- Research Group of Institute of Land and Regions; Institute of Macroeconomic Research; National Development and Reform Commission. Preliminary study on the division and classification policy of major function-oriented zone in China. Macroecon. Res. 2007, 4, 3–10. (In Chinese) [Google Scholar]
- Li, S.; Jay, S. Transboundary marine spatial planning across Europe: Trends and priorities in nearly two decades of project work. Mar. Pol. 2020, 118, 104012. [Google Scholar] [CrossRef]
- Chinese Communist Party Central Committee. The Deepening Reform Program for Party and State Institutions. 3rd Plenary Meeting of the 19 th Central Committee. 2018. Available online: http://www.gov.cn/zhengce/2018-03/04/content_5270704.htm (accessed on 8 January 2020). (In Chinese)
- Gu, Y.; Wu, Y.; Liu, J.; Xu, M.; Zuo, T. Ecological civilization and government administrative system reform in China. Resour. Conserv. Recycl. 2020, 155, 104654. [Google Scholar] [CrossRef]
- Day, J. The need and practice of monitoring, evaluating and adapting marine planning and management—lessons from the Great Barrier Reef. Mar. Pol. 2008, 32, 823–831. [Google Scholar] [CrossRef]
- Li, Z. Constructing the pattern of marine development of “one-belt, nine-zones and multi-shot”—Interpretation of “National Planning for Marine Major Function-Oriented Zone”. China Econ. Trade Herald J. 2015, 28, 39. (In Chinese) [Google Scholar]
- Tallis, H.; Ferdana, Z.; Gray, E. Linking terrestrial and marine conservation planning and threats analysis. Conserv. Biol. 2007, 22, 120–130. [Google Scholar] [CrossRef]
- Yang, Y. Research on the Mechanism of Integrated Control for Land-Sea Transboundary Pollution in China. Ph.D. Thesis, Dalian Maritime University, Dalian, China, 2020. (In Chinese). [Google Scholar]
- Alam, W.; Xiangmin, X.; Ahamed, R. Protecting the marine and coastal water from land-based sources of pollution in the northern Bay of Bengal: A legal analysis for implementing a national comprehensive act. Environ. Chall. 2021, 4, 100154. [Google Scholar] [CrossRef]
- Görgün, E.; Aydın, A.F.; Çitil, E.T.; Kınacı, C. National sectoral plans aiming to control land based sources of pollution for the Mediterranean Sea coast in Turkey. Desalination 2007, 226, 56–65. [Google Scholar] [CrossRef]
- Vo, S.T.; Pernetta, J.C.; Paterson, C.J. Lessons learned in coastal habitat and land-based pollution management in the South China Sea. Ocean. Coast. Manag. 2013, 85B, 230–243. [Google Scholar] [CrossRef]
- Kroll, F.; Mueller, F.; Haase, D.; Fohrer, N. Rural-urban gradient analysis of ecosystem services supply and demand dynamics. Land Use Pol. 2012, 29, 521–535. [Google Scholar] [CrossRef]
- Pan, Z.; He, J.; Liu, D.; Wang, J.; Guo, X. Ecosystem health assessment based on ecological integrity and ecosystem services demand in the middle reaches of the Yangtze River. Sci. Total Environ. 2021, 774, 144837. [Google Scholar] [CrossRef]
- Hassler, B.; Gee, K.; Gilek, M.; Luttmann, A.; Morf, A.; Saunders, F.; Stalmokaite, I.; Strand, H.; Zaucha, J. Collective action and agency in Baltic Sea marine spatial planning: Transnational policy coordination in the promotion of regional coherence. Mar. Pol. 2018, 92, 138–147. [Google Scholar] [CrossRef]
Publisher’s Note: MDPI stays neutral with regard to jurisdictional claims in published maps and institutional affiliations. |
© 2022 by the authors. Licensee MDPI, Basel, Switzerland. This article is an open access article distributed under the terms and conditions of the Creative Commons Attribution (CC BY) license (https://creativecommons.org/licenses/by/4.0/).