Article

Joined Efficiency and Productivity Evaluation of Tunisian Commercial Seaports Using DEA-Based Approaches

1
Laboratoire d’Economie de Developpement (LED), Faculty of Economics and Management of Sfax, University of Sfax, Airport Road Km 4 Sfax, Sfax 3018, Tunisia
2
OLID Laboratory, Higher Institute of Industrial Management Sfax, University of Sfax, Technopole of Sfax, Sfax 3021, Tunisia
3
Department of Industrial Engineering, College of Engineering, Taif University, P.O. Box 11099, Taif 21944, Saudi Arabia
*
Author to whom correspondence should be addressed.
J. Mar. Sci. Eng. 2022, 10(5), 626; https://doi.org/10.3390/jmse10050626
Submission received: 22 February 2022 / Revised: 23 April 2022 / Accepted: 27 April 2022 / Published: 4 May 2022
(This article belongs to the Special Issue Decision Support Systems and Tools in Coastal Areas)

Abstract

:
Seaports are important infrastructures to support international trade. Therefore, it is vital that port efficiency and productivity are continuously evaluated and improved. In this context, the objective of this article is to evaluate both the technical efficiency and the change in productivity of the six most important Tunisian commercial seaports, Bizerte, Rades, Sousse, Sfax, Gabes, and Zarzis, over a period of twelve years from 2005 to 2016. To achieve this objective, the data envelopment analysis (DEA) method is applied. The first output-oriented DEA application is about efficiency evaluation, which, for each seaport, allows the estimation of overall technical efficiency, pure technical efficiency, and scale efficiency. The second application concerns the evolution of the productivity of Tunisian seaports during the study period using the Malmquist DEA-based productivity index. The productivity analysis is performed according to the year (period) and according to each studied seaport. The first output-oriented DEA method provides that the overall technical efficiency in the above-mentioned ports is 69.4% while the pure technical efficiency is 83.3%. Furthermore, the average scale efficiency is about 82.6%, which implies that the decreasing type of returns to scale dominates in this study. Regarding the second DEA application for productivity evolution, the obtained results from the data analysis revealed that it fell by 6.7%, mainly due to the degradation of the technological change (8.3%). The results obtained provide useful basic criteria for establishing efficiency improvement strategies for each studied seaport.

1. Introduction

1.1. Background and Research Motivation

Sustainable development and operations have become a central point of strategic and operational management in seaport operations [1]. In particular, maritime transport is vital for the ever-increasing globalized economy and the international trade system [2]. For these reasons, it is imperative that port efficiency and productivity are continuously evaluated and improved [3].
Maritime transport in Tunisia plays a key role in the consolidation of the country’s economic activity, as more than 98% of Tunisian foreign trade is carried out by sea. The volume of cargo exchanged with the outside world is processed by the following eight ports: Bizerte-Menzel Bourguiba, Goulette, Rades, Sousse, Sfax, Skhira, Gabes, and Zarzis. Actually, all these ports, except Skhira, are placed under the Tunisian direction of the Office of Merchant Marine and Ports (OMMP). Therefore, each seaport is an area of industrial and commercial activities and even considered by some, mainly that of Zarzis, which has a free zone, an attractive zone for foreign investors.
Traditional economics, efficiency, and productivity are important concepts, especially in commercial seaport performance [4,5]. Generally, they consist of a relationship between an income and an expense. They can also be viewed as a relationship between an input and an output or between a resource and a product [4]. In this context, Lebenstein [6] explicitly stated that the efficiency concept is at the heart of economics. Forsund and Sarafoglou [7] have stated that “productivity and efficiency are two fundamental concepts of economics”. Regarding Lovell [8], he suggested two reasons why it is important to measure efficiency and productivity; the first is that they are indicators of success by which production units can be evaluated while the second is that they enable us to explore the hypotheses about the sources of their deficiencies; therefore, their identification is essential for the implementation of public and private policies to improve performance.
On the other hand, the literature suggested two approaches to measuring efficiency and productivity. The first is based on regression techniques to construct the best practice frontier, while the second, which is non-parametric, uses mathematical techniques. However, the data envelopment analysis (DEA) method is the most widely used non-parametric method in the literature in the measurement of the port efficiency, as stated by Emrouznejad et al. [9].
DEA has been used to evaluate the relative performance of organizational units, called decision-making units (DMUs). These DMUs convert multiple inputs into multiple outputs. The aim of the DEA approach is to select a set of efficient and inefficient units [3]. Therefore, the DEA method is actually popular because of its ability to represent complex production technologies without imposing a particular relationship between the different components of the production process.

1.2. Objective of the Study

The concept of port sustainability is a multidimensional problem that encompasses the economic, environmental, and social dimension of sustainability. Based on a detailed analysis of the evolution of the productivity of the Tunisian ports, there is lack of theoretical and empirical approaches concerning the sustainable development of Tunisian commercial seaports. To overcome this research gap, this study intended to identify the issues, including the estimation of technical efficiency and the evolution of productivity, at six Tunisian commercial seaports (Bizerte, Rades, Sousse, Sfax, Gabes, and Zarzis) during the 2005–2016 period, using the DEA method and the Malmquist productivity index (MPI) based on the DEA. Furthermore, the period during 2005–2016 was chosen to study the impact of the financial crisis of (2008–2009), the Tunisian 2011 revolution, and before the coronavirus disease 2019 (COVID-19).
This research starts from the theoretical concept that supports the logical connection between developing seaports and sustainable development goals reflecting the importance of the social dimension of sustainability. In fact, this research presents three contributions that have been made to the empirical literature on technical efficiency and port productivity in Tunisia. First, to the best of our knowledge, this is the first study to provide a detailed analysis of the evolution of the productivity of the Tunisian seaports using the Malmquist productivity index before and after the 2011 revolution. Second, this study considerably enhances existing knowledge about the different approaches, namely, DEA and MPI, to measure the technical efficiency and productivity in the Tunisian port sector. Finally, the results of the empirical analysis could help policy makers understand the factors that contribute to the overall performance of the Tunisian seaports and the areas they should focus on to improve them, especially after the financial crisis of 2008–2009 and the Tunisian revolution (2011).

2. Materials and Methods

2.1. Theoretical Frameworks

Productivity and efficiency are the two most important concepts for measuring performance and are frequently used interchangeably. The productivity of a firm is defined either as the ratio of output to input or as total factor productivity. Efficiency represents either the ability of a firm to minimize the inputs used in production for a given output vector or the ability of the firm to maximize output from a given input vector [10].
The literature on the measurement of the port efficiency and productivity using frontier models has considerably grown since the first empirical studies were published in the 1990s. As a consequence, these studies can be divided into two main categories with respect to the methods used to estimate the frontier. In fact, the first category uses non-parametric methods, in particular the DEA method, while the second uses parametric techniques, such as the stochastic frontier analysis (SFA).
The DEA method was first tried in the port industry by Roll and Hayuth [11] where, to measure the efficiency of twenty ports in two regions, they used three inputs, such as number of workers, capital, and cargo homogeneity, and four outputs, including the handled tonnage, the level of service, the satisfaction of the users, and the number of ship calls. There are principally two DEA models frequently used in the literature, which are the DEA-CCR (or Charnes, Cooper, and Rhodes) model proposed by Charnes et al. [12], and the DEA-BCC (or Banker, Charnes, and Cooper) model proposed by Banker et al. [13].
For instance, Martinez-Budria et al. [14] estimated the efficiency of 26 Spanish ports over the 1993–1997 period, which they classified into three harmonized groups (large, medium, and small) by applying complexity criteria and taking into account the size of the seaport and the types of the handled goods. More precisely, they examined the efficiency of these ports using the DEA-BCC to evaluate pure technical efficiency under the assumption of variable returns to scale (VRS). The results found showed that large ports are the most efficient and have the largest efficiency improvements. On the other hand, Tongzon [15] used both the DEA-CCR and the DEA-additive models to estimate and compare the efficiency of four Australian container ports and twelve other international container ports for 1996. He argued that port size is not the main determinant of port efficiency. However, these results contradict those of Bonilla et al. [16] and Gonzalez and Trujillo [17], who reported that the most efficient ports include both large and small ports, and that they are similar to the least efficient ones.
For his part, Barros [18] applied the DEA-CCR and DEA-BCC models to assess the efficiency achieved by some Portuguese ports in order to get an idea of the role of the incentives established by the Portuguese regulations. He came to the conclusion that the improvements made by the Portuguese port authorities have positioned these ports beyond the efficiency frontier. However, he acknowledged that due to the small sample size and the heterogeneity of the ports in the study, the results should be taken with caution. For their part, Barros and Athanassiou [19] also recognized the same problem in their research when they used the DEA-CCR and DEA-BCC models to assess the efficiency of two Greek and four Portuguese ports. Their study ranked ports and identified the ones that achieved remarkable improvements in efficiency. They suggested that scale efficiency is a primary objective for the defined ports.
Rodriguez-Alvarez et al. [20] evaluated the technical and allocative efficiency of the three main container terminals in the port of Las Palmas in Spain. On the other hand, Alonso and Bofarull [21] applied the DEA method to measure the efficiency of the ports of Bilbao and Valencia in Spain in order to find out to what extent investments have improved efficiency and whether this improvement has enhanced the attractiveness of the ports. In fact, their results revealed that investment is not the only factor that can improve the technical efficiency of ports.
Regarding Hung et al. [22], they used the DEA method to examine the overall technical efficiency (pure technical and scale efficiency) of 31 Asian container ports. For this reason, they used 4 inputs, such as the terminal area, the container gantries on the quay, the number of berth and the terminal length, and 1 output, which is the container throughput. Their conclusion can be summarized as follows: (1) the technical inefficiency of the Asian container ports is due to pure technical inefficiency rather than to scale inefficiency caused by inefficient management practices; (2) in terms of increasing returns to scale (IRS), the container ports need to consider their expansion; and (3) the East Asian container ports are more efficient than the ports in other Asian regions (Northeast Asia and Southeast Asia). Furthermore, Choi [23] presented an empirical analysis on the efficiency of 13 container ports in Northeast Asia during the 2005–2007 period. Their study analyzed empirical results on the efficiency of major ports using the DEA-CCR, DEA-BCC, Malmquist index, and Tobit regression models. The obtained results revealed that most ports have higher scores in pure technical efficiency but low scores in scale efficiency. Furthermore, the study concluded that investments in infrastructure do not improve efficiency. On the other hand, Fu et al. [24] applied the Malmquist DEA-based productivity index to measure the relative efficiency of ten major container ports in China between 2001 and 2006.
In contrast, Barros [25] used DEA models and the Malmquist index to assess the changes in efficiency and productivity in seaports located in Angola, Nigeria, and Mozambique during the period 2004–2010, while Wilmsmeier et al. [26] analyzed and compared, for the period 2005–2011, the evolution of port productivity and efficiency for 20 terminals in ten countries in Latin America, the Caribbean, and Spain, using the Malmquist productivity index.
In another study, Yuen et al. [27] examined the effect of intraport and interport competition on the efficiency of container terminals in China and neighboring countries. In fact, the technical efficiency of the sampled container terminals was measured using the DEA method for the period from 2003 to 2007. Furthermore, regression analysis was used to examine the elements that affect the efficiency of container terminals. The study concluded that the Chinese port ownership could improve the efficiency of the container terminals. Furthermore, it was found that intra- and interport competition could improve the efficiency of these container ports.
On the other hand, Schøyen and Odeck [28] applied the Malmquist productivity index to measure productivity changes in the UK Nordic container ports and the six largest container ports in Norway. For their part, Shaheen and Elkalla [29] conducted an efficiency analysis of Middle Eastern container ports using both the DEA-CCR and BCC models and found that 80% of the ports considered showed increasing returns to scale. As for Seth and Feng [30], they applied the DEA method to calculate the efficiency scores of 15 U.S. container ports by comparing them to better ones.
Wang et al. [3] applied a hybrid approach that combines the DEA Malmquist method and the epsilon-based measure to assess the efficiency of a sample of 14 seaport companies in Vietnam during 2015–2020. Jeh et al. [1] applied DEA and a Malmquist index analysis to study 21 global terminal operators to determine the characteristic that showed the highest efficiency and productivity. Very recently, some researchers have integrated the environmental analysis aspect, as a basic component of sustainable development, into the evaluation of seaport performance, such as in He et al. [2], Gan et al. [31], and Castelló-Taliani et al. [32].
The above literature review shows that the DEA method is a technique used to measure efficiency and productivity in the port industry. All these authors have emphasized the advantages of this approach. Nevertheless, several authors have proposed a combination of the DEA axiom with other parametric techniques such as Tobit regression. These combinations allow us to highlight the determinants of port performance or the influence of environmental variables. Noting the need to measure changes in productivity over time and to analyze the influence of policy changes, several authors have also combined the DEA method with Malmquist indices. With these, it is possible to see how total port productivity changes over a period of time and which factors influence this movement (technological progress, improvements in technical efficiency or scale efficiency). As far as developing countries are concerned, our literature review shows that studies dealing with the port system and the DEA method are still rare or very recent. Other studies have investigated the differences in efficiency between ports in different countries.
Most studies measuring efficiency and productivity in the port sector have been conducted in container terminals in Asian, European, and Latin American countries. There is a need to explore these aspects further in Africa and especially in Tunisia, as there are no published studies that have examined the efficiency of Tunisian seaports with both DEA and IPM-DEA methods. In fact, Tunisia is one country located in North Africa that is accessible via Mediterranean Sea. Like many other developing countries, Tunisia’s economic situation is in a fragile state. In January 2011, after a 28-day civil resistance campaign, a revolution took place in Tunisia. This manifestation, also called the Jasmine revolution, was to replace the longtime president Zine El Abidine Ben Ali by a democratic political state.

2.2. The Proposed Approach

In the present research, the application of the DEA method provides various efficiency scores to measure the relative efficiency of all seaports. DEA allows the estimation of the overall technical efficiency and decomposes it into two mutually exclusive and non-additive components, namely, pure technical efficiency and scale efficiency. The main objective is to identify the seaports that operate with decreasing or increasing VRS.
The research contains two main studies. The first study is about efficiency evaluation, which is composed of two DEA models applications. The second study concern the productivity evaluation. The flowchart of the proposed approach is presented in the Figure 1.
The results of the proposed approach can be classified in two main parts. The first part is about the identification of which seaport ports are efficient and what are the best practices. The second part concerns the identification of inefficient seaports and the causes of such inefficiency. The main results are to propose improvement suggestions. The managerial implication provides a useful guideline for practitioners in the maritime sector to improve their operational efficacy and productivity and helps customers in selecting the best seaport companies given the outsourcing strategy.

2.3. Data Envelopment Analysis (DEA)

Unlike the regression analysis, which gives us the average profile of the DMUs, the DEA method involves using linear programming to construct a piecewise frontier, which represents, in economic terms, the revolved frontier (or envelope) of the best production practices. By projecting each DMU onto the frontier, it is possible to determine the level of inefficiency by comparing a single reference DMU or a convex combination to other reference DMUs. The projection refers to a “virtual DMU”, which is a convex combination of one or more efficient DMUs. Therefore, the projected point may not itself be an initial DMU.
The non-parametric approach relies on linear programming to construct the production frontier. This approach imposes no restrictions on the functional form of the production frontier. In fact, the most common method is the DEA developed by Charnes et al. [12] in 1978 and Banker et al. [13] in 1984. This method estimates the frontier of a set of production units and is applied in a multi-input, multi-output technology framework.
Unlike a regression analysis, which gives us an average profile of DMUs, the DEA method consists of using linear programming to construct a piecewise frontier, which represents in economic terms the revolved (or enveloped) frontier of best production practices. By projecting each DMU onto the frontier, it is possible to determine the level of inefficiency by comparing a single reference DMU or a convex combination with other reference DMUs. The projection refers to a “virtual DMU”, which is a convex combination of one or more efficient DMUs. Thus, the projected point may not itself be an initial DMU.
More specifically, the DEA method calculates the efficiency of a DMU with respect to resource allocation among alternative uses. When one wants to determine the minimum possible level of inputs needed to produce a given set of outputs, this is an input orientation, or to determine the maximum possible level of outputs by consuming a given set of inputs, this is an output orientation. Thus, the DEA method identifies relationships between inputs and outputs, single or multiple, from the perspective of relative efficiency. The latter term is used because the efficiency of each DMU is estimated relative to the other DMUs in the sample. In the literature, the two most widely used DEA models are the CCR model presented by Charnes et al. [12], which assumes constant returns to scale (CRS), and the BCC model proposed by Banker et al. [13], which assumes variable returns to scale (VRS). The evaluation of returns to scale can occur in three situations: constant returns to scale, increasing returns to scale (IRS), and decreasing returns to scale (DRS). The first refers to the case where the output increases in line with the input levels, the second refers to the case where the output production increases above the input levels, and the third represents the case where the output production increases below the input levels.
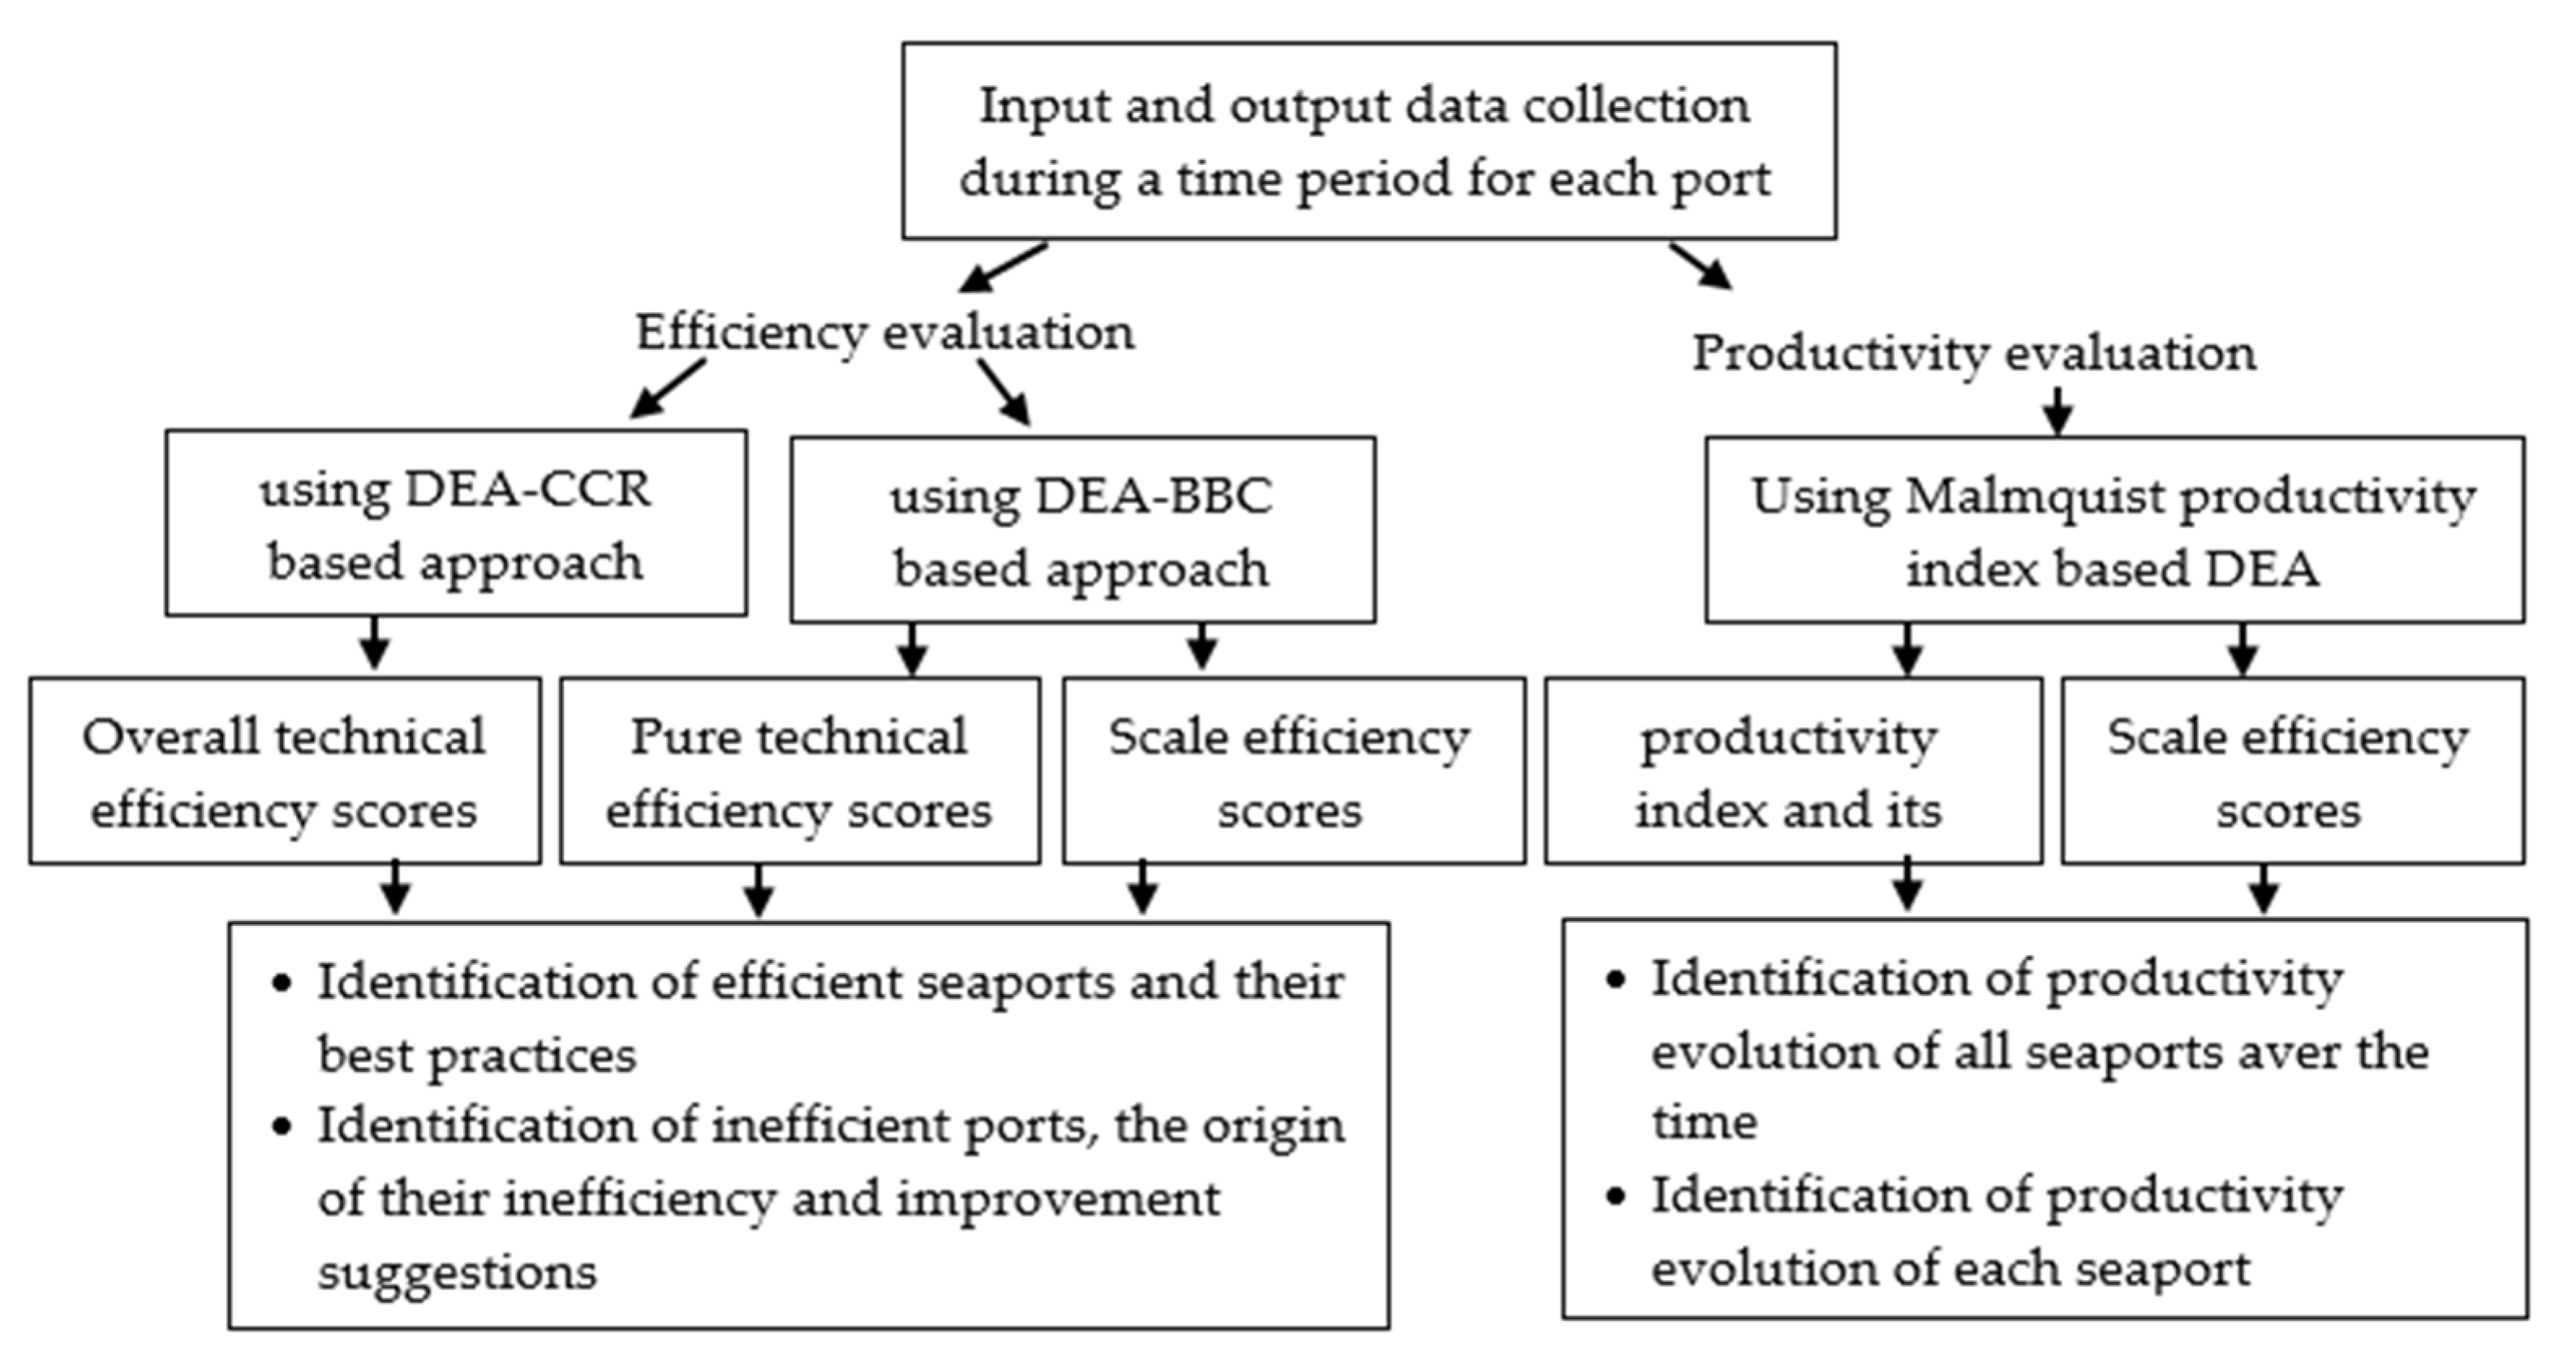
In this study, the two models DEA-CCR and DEA-BCC were selected to measure the technical efficiency of the Tunisian ports. The choice in favor of these two types of models is justified by the fact that the CCR model enables us to visualize the overall technical efficiency of the sample, while the BCC model helps us divide the overall efficiency into pure technical efficiency and scale efficiency.
The following parameters and variables are used in the following models.
ϕ: efficiency score;
yr0: the observed quantities of output “r” from the port, the efficiency of which is measured, with r = 1;
xi0: the observed quantities of input “i” from the port whose efficiency is measured, with i = 1, 2, 3;
yrj: the observed quantities of output r from port “j”, with j = 1, 2 ,… n;
xij: the observed quantities of input “i” from port “j”;
λj: the weighting coefficients;
OSr: the difference variables in output “r”;
ISi: the difference variables in input “i”.
The two output-oriented models that we have retained in our analysis are the DEA-CCR output-oriented model and DEA-BCC output-oriented model. Note that all λj, OSr, ISi, and ϕ should be positives.

2.3.1. The DEA-CCR Output-Oriented Model

The output-oriented model aims to maximize the outputs while not exceeding the observed input levels.
Max   Z 0 = ϕ +   ε   ( s   1   OS +   m   1   IS )
subject to
ϕ   y r 0 j = 1 n   λ j   y rj +   OS r = 0 ,
  x i 0 + j = 1 n   λ j   x ij +   IS i = 0 ,

2.3.2. The DEA-BCC Output-Oriented Model

The objective in the BCC model is to maximize the output production while not exceeding the actual input level. It has the same formulation as the CCR model with a supplementary constraint indicated in Equation (4):
N 1 λ = 1 ,

2.4. The Malmquist Productivity Index

In fact, ports generally have different outputs (container handling, liquid bulk, dry bulk, general cargo, etc.) and inputs (cranes, labor, terminal facilities, etc.). Therefore, a simple ratio between an output and an input may not correctly represent the reality of a port. For this reason, we need to use methodologies that take into account all the inputs needed to produce one or more outputs, which is called total factor productivity (TFP). Thus, a wide range of methodologies have been implemented in recent decades, mainly based on the estimation of a production frontier, to determine the TFP, which is a methodology that enables decomposing the TFP into different components through panel data on different ports.
The main advantage of this approach is that it reveals exactly where the differences in impact on productivity and efficiency changes over time can be found for the six Tunisian ports. In addition, although efficiency is a short-term concept evaluated each year, productivity evaluates changes over time and therefore is more like a long-term concept.
Furthermore, the Malmquist Productivity Index (MPI) can be used to measure changes in the total factor productivity between two points by calculating the ratio of the distances of each data point from a common technology. As a result, the MPI has become a standard approach in measuring productivity over time. Being first introduced by Malmquist [33] in 1953 and later developed by other authors, such as Caves et al. [34] and Fare et al. [35], this index has been widely used over the past decade in the literature dealing with ports.
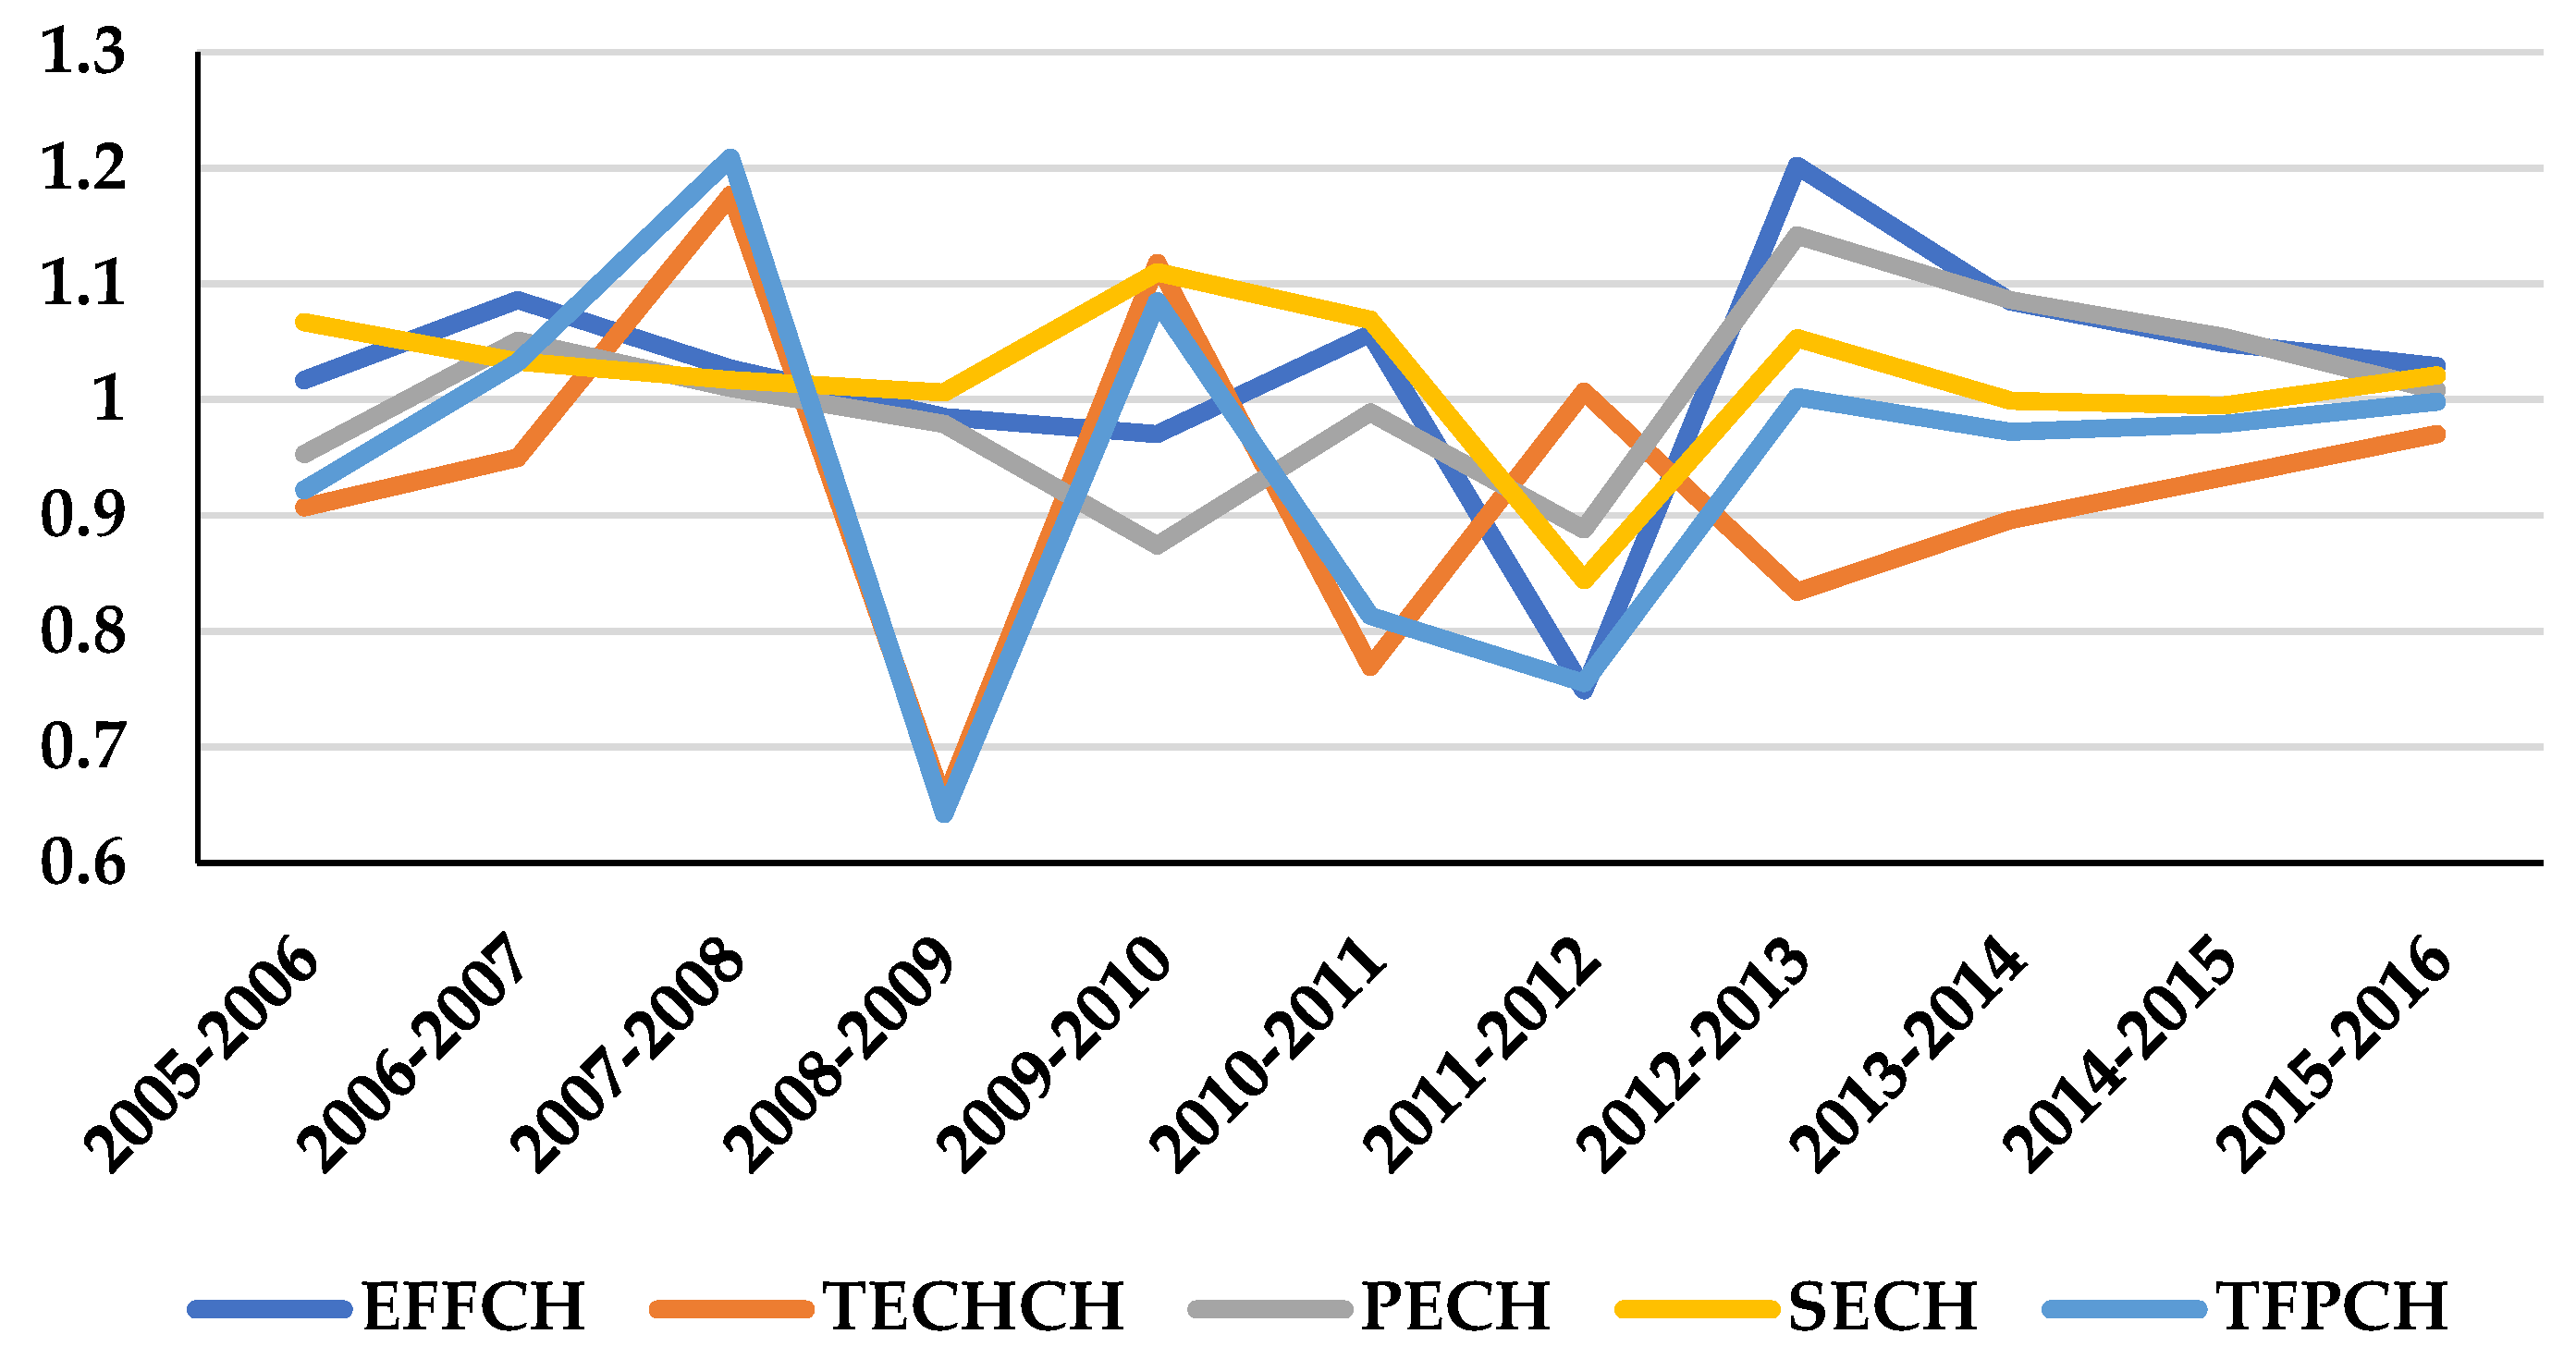
Furthermore, the main merit of the MPI is its ability to decompose the change in productivity into the total technical efficiency change (EFFCH), which captures the catch-up effect (i.e., the movement towards or away from the best practice frontier), and the technological change (TECHCH), which reflects the frontier shift effect over time. In addition, EFFCH can be further decomposed into pure technical efficiency change (PECH) and scale efficiency change (SECH). The former term is related to the optimal use of resources by managers, while the latter refers to the appropriate size of the ports.
For their part, Fare et al. [35] specify such output-oriented Malmquist indices as presented in Equation (5):
M 0   t   ( x t ,   y t   , x t + 1 ,   y t + 1 ) = D 0   t ( x t + 1 ,   y t + 1 ) D 0   t   ( x t ,   y t ) ,
where
yt, yt+1: the vectors of the observed quantities of outputs, respectively in periods t and t + 1;
xt, xt+1: the vectors of the observed quantities of inputs respectively in periods t and t + 1;
D 0   t ( x t ,   y t ) : the output-oriented distance function in period t;
D 0   t ( x t + 1 ,   y t + 1 ) : the distance function that measures the maximum proportional change in output required to make, relative to the technology of period t.
On the other hand, if the period technology is used as a reference, the Malmquist total productivity index can be written as presented in Equation (6):
M 0   t + 1   ( x t ,   y t ,   x t + 1 ,   y t + 1 ) = D 0   t   + 1 (   x t + 1 ,   y t + 1 ) D 0   t   + 1   ( x t ,   y t ) ,
where:
D 0   t   + 1 ( x t ,   y t )   : the distance function, which measures the maximum proportional change in the output required to make relative to the technology in period t + 1;
D 0   t   + 1 ( x t + 1 ,   y t + 1 ): the output-oriented distance function in period t + 1.
Therefore, a value of the Malmquist total productivity index greater than 1 indicates a percentage improvement in the total factor productivity in both periods t and t + 1, while a value less than 1 shows a regression in the TFP. However, in order to avoid arbitrarily choosing a benchmark, Fare et al. [35] proposed an index, which is the geometric mean value of the two Malmquist productivity indices as mentioned in Equation (7) and equivalently in Equation (8).
M 0 ( x t ,   y t ,   x t   + 1 ,   y t   + 1 ) = [ D 0   t   (   x t   + 1   ,   y t   + 1   ) D 0   t   ( x t   ,   y t   ) × D 0   t   + 1   (   x t   + 1   ,   y t   + 1   ) D 0   t   + 1   ( x t   ,   y t   ) ] 1 / 2 ,
M 0 ( x t ,   y t ,   x t   + 1 ,   y t   + 1 ) = D 0   t   + 1   (   x t   + 1   ,   y t   + 1   ) D 0   t   ( x t   ,   y t   )   [ D 0   t   (   x t   + 1   ,   y t   + 1   ) D 0   t   + 1   ( x t   + 1   ,   y t   + 1   ) × D 0   t   (   x t   ,   y t   ) D 0   t   + 1   ( x t   ,   y t   ) ] 1 / 2 ,
From Equation (8), we observe that the ratio outside the square brackets measures the change in the output-oriented technical efficiency between periods t and t + 1, while the geometric mean of the two ratios between the brackets reflects the technological change represented by a change in the production frontier in period t + 1 relative to period t.
Fare et al. [35] subsequently proposed a decomposition to measure scale efficiency. They reuse the technical efficiency term (EFFCH), which represents the ratio of two distance functions at constant returns to scale (CRS), and decompose it into a pure technical efficiency change term (PECH), measured relative to the frontier assuming variable returns to scale (VRS), and a scale efficiency change term (SECH). The index of change of pure technical efficiency (PECH) is expressed as shown in Equation (9).
PECH = D 0 , vrs   t   + 1 (   x t + 1   ,   y t + 1   ) D 0 , vrs   t ( x t   ,   y t   ) ,
By utilizing both CRS and VRS, the DEA frontiers to estimate the distance functions in Equation (8), the technical efficiency can be decomposed into scale efficiency and pure technical efficiency components. A scale efficiency change (SECH) is given in Equation (10).
SECH = D 0 , vrs   t + 1 ( x t   + 1 ,   y t   + 1   ) / D 0 , crs   t + 1 ( x t   + 1 ,   y t   + 1 )   D 0 , vrs   t + 1 ( x t ,   y t ) / D 0 , crs   t ( x t ,   y t ) × [   D 0 , vrs   t ( x t   + 1 ,   y t   + 1   ) / D 0 , crs   t ( x t   + 1 ,   y t   + 1 )   D 0 , vrs   t ( x t ,   y t ) / D 0 , crs   t ( x t ,   y t ) ] 1 / 2

3. Results

3.1. Input and Outut Data Collection

The Tunisian port chain is made up of eight ports open to international trade. It extends over a 1300 km coastline. The diversity of the activities of these ports, their complementarity, and their exceptional locations make it possible to accommodate all types of ships and to handle all kinds of goods.
In fact, in this document, six Tunisian seaports were selected, namely, Bizerte, Rades, Sousse, Sfax, Gabes, and Zarzis, to assess their technical efficiency and productivity during a period from 2005 to 2016, which is characterized by the onset of the global financial and economic crisis (2008–2009) and also the Tunisian revolution of 2011. The reasons of choice for these six ports are (i) the ports managed by OMMP form a group with almost similar activities; (ii) the port of Skhira, which is under the management of the national oil company, is a port purely specialized in liquid bulk, namely, crude oil; and (iii) the port of La Goulette is a port specialized in passenger and cruise traffic.
The Bizerte port is a commercial and industrial port because it contains oil refineries and fish-canning factories. The port exports various types of commercial goods, textiles, food industries, leather, and auto spare parts, in addition to oil and cement. The port of Sfax is the second largest port in Tunisia and an important commercial and industrial center. It is the main port for the export of phosphate in Tunisia. It also exports sponge, grain, olive oil, and esparto grass due to its proximity to agricultural areas. The port of Rades is the main port in the country for container traffic, as it accommodates 80% of the volume of containers coming to Tunisian ports. It also receives more than 1500 ships and handles about 5.9 million tons of cargo each year. It contains 10 marine berths, including a petroleum berth, a grain berth, and a berth for iron and chemicals. The port of Gabes is a commercial and industrial port characterized by its proximity to the industrial zone, witnessing a large flow of traffic. It is mainly concerned with the export of chemical products (such as phosphate fertilizers and phosphoric acid) and the import of sulfur and ammonia. Port of Sousse is a small port founded in 1928. It is located in the city of Sousse near Monastir International Airport. It works on importing and exporting various types of goods (grains, hydrocarbons, and solid and liquid goods). The port of Zarzis is located in the far south of Tunisia. It was established in 1988. It mainly works on the export of crude oil, in addition to that it exports some agricultural and fish products and sea salt, and it also imports pure petroleum products.
Since the promulgation of the law of 1 April 2008, relating to the regime of concessions, and the law of 8 July 2009, relating to the new code of maritime ports, the OMMP provides public services (management, maintenance, preservation, and conservation of public property) in addition to the activities of piloting and mooring. In turn, commercial activities such as handling, stevedoring, and towing are now provided by subcontractors (public or private).
The overall traffic of goods through Tunisian seaports increased by 2.2% at the end of December compared to the same period of 2015, going from 22 million tons to 22.5 million tons, according to the latest statistics on port activity published by the Office of Merchant Marine and Ports (OMMP). The distribution of traffic by port and by category of goods is showed in Table 1.
In addition, the collection of accurate data for all ports is essential for the reliability of the results and for the data used to truly represent the operations of the Tunisian seaports. Data were collected from the annual reports and official websites of the OMMP and confidential documents of port operators, including the STAM, STUMAR, GMC, GMS, GMGA, and GMZ.
The study used three input variables and one output variable. The input variables are the total number of berths, the total number of gears, and the total number of workers in each port, while the output variable used is the total volume of cargo. In fact, the description of the input and output variables selected for the analysis is presented in Table 2.
The choice of total cargo volume (total tonnage throughput) as an output variable stems from the wide acceptance of the variable as an indicator of port production. Most studies of port efficiency have treated it as a production variable, as it is closely related to the need for facilities for cargo handling and other services. Furthermore, it provides the basis against which ports are compared in terms of relative size, scale of investment, and level of activity. Most importantly, it forms the basis for revenue generation. Consequently, the DMU can be defined in this research as the total cargo throughput.
Input variables include the various resources used to produce the output, such as land, labor, and capital. Economic theory implies that effective management of cargo volumes depends primarily on the efficient use of land, labor, and capital in the port [36]. In port operations, the number of terminals, the total number of quays or their length, the area of land, the total number of warehouses or their area, number of workers, and handling equipment (gantry cranes, quay cranes, stackers, forklifts, etc.) are taken into account as possible input variables in the production of a port. Other inputs that could be taken into account for efficiency estimates include quay occupancy, accessibility, proximity to main trade routes, and crane operating hours. As well as different crane handling speeds, the capital invested in a terminal and associated equipment, the age of the equipment, and the draught. The Herculean task of obtaining practical data on each of these variables in the six ports for a period of twelve years (2005–2016) proved to be insurmountable. Therefore, we use three input variables: the total number of berths has been chosen for the land factor, the total number of gears for the capital factor, while the total number of workers (only related to the stevedoring activity) employed by each port represents the labor factor. The descriptive statistics relating to these different variables are summarized in Table 3.
An essential element in the estimation of a DEA model lies in the choice of the number of variables (inputs and outputs). For the model to be valid, the sample size must be three times greater than the sum of inputs and outputs [37]. The reason this is an important issue is that failure to include a sufficient number of DMUs can lead to over specification of the efficiency. In this case, to increase the discriminatory power of the DEA, we applied in this analysis panel data; i.e., the particular unit of analysis is port-year (which is regarded as a distinct DMU), thus bringing the number of DMUs for the analysis to 72 (6 ports × 12 years).

3.2. Analysis of Efficiency

Overall technical efficiency, which is the efficiency calculated under the constant returns to scale (CRS) assumption, is decomposed into a pure technical efficiency measure (under the variable return to scale (VRS) assumption) and a scale efficiency measure (Scale). These decompositions show whether the source of inefficiency is due to inefficient management activities. Indeed, the difference between the technical efficiency score obtained through the DEA-CCR model and that of the same port obtained through the DEA-BCC model is a good measure of the scale efficiency of this port. To obtain such a measure, Coelli et al. [10] suggest using both DEA models on the same database. If for a given port there is a difference in the efficiency scores measured by these two DEA-CCR and DEA-BCC models; this indicates that the port is not operating at an optimal scale. Therefore, the scale inefficiency is given by the difference between the overall technical inefficiency and the pure technical inefficiency.
All obtained results were obtained via the DEAP v 2.1 software, which was developed by Tim Coelli [38]. This program was used to construct the DEA frontiers for the calculation of technical efficiencies and also for the Malmquist TFP Indices calculation.

3.2.1. Overall Technical Efficiency Scores

Table 4 (and Figure 2) shows the technical efficiency of each port using the DEA-CCR-based approach. From this table, it is concluded that both the Rades and Gabes ports were at least once efficient during the study period (2005–2016), with scores of 100% from the point of view of the combination of the used factors of production, and thus were located on the efficiency frontier and constitute a reference “best practices” for inefficient ports.
In the case of the Rades port, it is the processing of containers that enabled it to achieve higher efficiency outputs in 2007 and 2016. As for the port of Gabes, the exploitation and processing of chemicals, which is the most important sector in the Tunisian economy, also enabled this port to achieve very high efficiency scores, especially before the Tunisian revolution and social tensions (strikes) that caused a fall in their traffic. On the other hand, the ports of Bizerte, Sousse, Sfax, and Zarzis did not manage to reach optimal technical efficiency levels (100%) throughout the period and, therefore, they contributed to the overall inefficiency of all ports. We also found that, for the study period, the port of Zarzis has lower efficiency scores, ranging from 23% to 61.2%, which may be due to a lower market share, a lower annual throughput, the non-use of modern equipment that facilitates handling operations, and also to a poor or weak quality of the inferior infrastructure and hinterland.

3.2.2. Pure Technical Efficiency Scores

Table 5 (and Figure 3) shows the pure technical efficiency scores of each port using the DEA-BCC-based approach. The efficiency scores under the VRS assumption measure the pure technical efficiency by excluding the effect of returns to scale, which means that this technique assumes that the ports operate at a non-optimal size and are more encouraging. The pure technical efficiency results (DEA-BCC) show that the Tunisian ports have quite different average scores (see Table 4). In fact, they are higher than the technical efficiency scores under the CRS hypothesis, which indicates the existence of scale inefficiency in the Tunisian port sector. The pure technical efficiency score (DEA-BCC) is 83.3% for the whole sample, which means that a better management of the resources used, such as berths, machinery, and workers, could improve production of outputs by 16.7% while keeping the same level of inputs.

3.2.3. Scale Efficiency Scores

Then, after discussing the overall technical efficiency scores (DEA-CCR) and those of pure technical efficiency (DEA-BCC) of the various Tunisian ports in our sample, we will deal in what follows with a third measure, which is that of scale efficiency, reflecting the ability of the Tunisian ports to operate at an optimal scale. In other words, the efficiency of scale enables us to define the best overall size that offers a minimization of the average consumption of inputs and/or maximization of port output. In fact, Table 6 shows the estimated scale efficiency scores of the Tunisian ports over the 2005–2016 period, which is also illustrated in Figure 4.
The results indicate that the ports of Rades, Gabes, and Bizerte are relatively efficient because they have, on average, scale efficiency scores of more than 90% (99.8%, 99.8%, and 94.3%, respectively). On the other hand, the Sfax and Sousse ports have scores as high as 82.9% and 70.6%, respectively. On the other hand, Zarzis port appears to be the least efficient during the study period, with an average score of 48.2%, which implies that it should increase its production volume to reach higher levels of scale efficiency.
Moreover, we can see that the Rades and Gabes ports have scale efficiency scores of 100%; i.e., they operate at their optimal capacity (or optimal size). However, despite their performance, in terms of scale efficiency, they are declared technically inefficient, especially during the following years: 2012, 2013, 2014, and 2015 for the Rades port and 2007, 2008, 2009, 2011, and 2012 for Gabes port; i.e., their overall technical inefficiencies are explained by pure technical inefficiencies.
Moreover, the analysis of the scaling situations of the ports in the sample is useful for the examination of the scale effect. In fact, Table 7 presents the types of scales (returns to scale) of the Tunisian ports. It shows that the ports of Sousse, Gabes, and Zarzis operated with increasing returns to scale over the study period, while the ports of Bizerte, Rades, and Sfax operated with decreasing returns to scale. However, only the ports of Rades and Gabes recorded constant returns to scale for 6 and 8 years, respectively, over the 12 years under review.
In other words, the ports of Rades and Gabes are operating at their optimal capacity. Therefore, the objective of ports operating at increasing returns to scale would have been to increase their budgets, or increase their input capacity, in order to increase the output levels. Conversely, for ports with decreasing returns to scale, they would have to outsource some of their operations in order to achieve optimal output levels.

3.3. Analysis of Productivity Changes

This section of the analysis applies the MPI-based approach to assess the variation in the productivity of the Tunisian ports between the pre- and post-Tunisian revolutionary periods. The productivity analysis is composed of two parts. The first part is about analysis of the productivity index and its components according to the year (period). The second analysis concerns the productivity index and its components according to the port.

3.3.1. Productivity Analysis According to the Year (Period)

First, the results of the Malmquist Total Factor Productivity Change index (TFPCH) and its components are presented in Table 7. It is noted that, in this research, TFPCH coincide exactly with MPI. It emerges from the results obtained from the 2005–2016 period that the average productivity of the ports in the sample fell by 6.7% (TFPCH = 0.933), mainly due to technological change, which dropped by 8.3% (TECHCH = 0.917), whereas the average change in the overall technical efficiency rose by 1.7% (EFFCH = 1.017).
In fact, Table 8 shows the significant effect during the financial and economic crisis of 2008–2009 (0.642), and also during the Tunisian revolution, with a sharp decline in the TFPCH index (0.755) from 2011 to 2012. However, this is not due to the effect of the technological change but mainly to a reduction in changes in total technical efficiency (0.749), which was caused by the fall of changes in pure technical efficiency (0.888) as well as that of the scale efficiency (0.844). Knowing the facts, this period was marked by political, social, and economic instability (Tunisian revolution), which reduced the level of the traffic and therefore affected the productivity of the Tunisian ports. Therefore, to enrich the discussion, we calculated the averages of the MPI and its decompositions during the pre-and post-revolutionary period to explore its effects on the overall factor productivity growth.
Furthermore, it appears from Table 8 that the TFPCH and its decompositions, on average, have shown a negative change both before and after the revolution, except for the change in the overall technical EFFCH (=1.028). On the other hand, the technological change fell by 4% and 9.9%, respectively, during both periods, which implies that the operators of the Tunisian ports have not invested in the information and communication technologies and other technologies, including modern cargo-handling equipment, which are capable of accelerating the development of ports and reducing turnaround times. However, the gains in total technical efficiency are due, on the one hand, to the change in pure technical efficiency, which increased by 2.7 percent in the post-revolution period, and on the other hand, to the change in scale efficiency with a growth rate of 4.6 percent in the pre-revolution period. There was deterioration of the components of the overall technical efficiency (PECH = 0.973 in the pre-revolutionary period, and SECH = 0.996 during the post-revolutionary period). This could be justified by several reasons, such as the poor management of the existing inputs and the fact that most ports operate with non-optimal sizes (under-utilization of available resources), as well as by the decline in the cargo traffic due to the Tunisian revolution.
In fact, Figure 5 shows the changes in the Malmquist average productivity (MAFP) and its components over the whole study period. It also shows that the technological change (TECHCH) and the overall factor productivity change (TFPCH) show almost identical patterns of peaks and troughs. The highest peak of the TFPCH (1.209) and the TECHCH (1.177) occurred in 2007–2008 while they registered sharp deteriorations during the periods 2008–2009 and 2011–2012 (periods of the financial and economic crisis and the Tunisian revolution). However, the changes in the overall technical efficiency (EFFCH) and its two components, the PECH and the SECH, in relation to the abovementioned indices, showed a different trend during the study period. For example, Figure 5 shows that the change of pure technical efficiency (PECH) started with fluctuations and almost stabilized from 2012–2013 to the end of the study period.
As for the change in the scale efficiency (SECH), it has experienced a sharp decline by (−15.6%) during the period 2011–2012, where most Tunisian ports have experienced a deterioration in the traffic levels due to the Tunisian revolution.

3.3.2. Productivity Analysis According to the Port

Table 9 shows that the port industry in Tunisia has experienced an overall decline in the overall factor productivity of 6.7% for the study period. According to these results, among the other ports, only the Rades port has achieved a gain in productivity (TFPCH = 1025) over the study period. This growth is mainly attributable to technological change with a rate of 2.5%, which indicates that this port has a better infrastructure and benefits from a significant share of investment in technology by the port authorities. Moreover, this port has recently put into operation a terminal management system port, which cost 76 million dinars. Furthermore, the results of the decomposition of the TFPCH show that the Bizerte, Rades, Gabes, and Zarzis ports have experienced stability in their change of pure technical efficiency (PECH = 1); in particular, the Rades port has also experienced stability in the change in scale efficiency (SECH = 1). Therefore, this port has no change in the overall technical efficiency (EFFCH). In fact, the explanation that can be provided is that this port faces the problem of using excessive inputs, namely, the machinery and the workers, in the production of its outputs (cargoes), which has exposed it to inefficiencies resulting from production under decreasing returns to scale.
The results also showed that the operators of these ports have not made the necessary investment in modern cargo-handling equipment, which is needed to improve the performance of these ports and reduce turnaround times. In contrast, the decomposition of the change if technical efficiency showed that the overall progress of technical efficiency was dominated by improvements in the scale efficiency (1.7 percent for the entire period) rather than that of the pure technical efficiency. Note that this point that is related to operators is very important to achieve the social dimension of sustainability goals [39,40].

4. Discussion

The results of a port analysis using the two models (DEA-CCR and DEA-BCC) indicated that the gap in overall technical efficiency found by Tunisian commercial seaports during the period 2005–2016 is due to pure technical inefficiency (83.3%) and scale (82.6%). The first can be partially interpreted as the lack of technical and management skills at the level of workers and the managers (in other words, it is due to waste of the inputs used, as technical efficiency is a measure of how the port allocates its resources to maximize its outputs), while the second is related to the overuse or underuse of inputs.
Furthermore, during the 2005–2016 period, two ports were considered the most efficient ports, as they achieved overall technical efficiency scores close to one. These ports are those of Rades (91.8%) and Bizerte (85%). However, the other ports studied are considered relatively inefficient. In this context, lack of management skills and scale are considered important sources of inefficiency for them.
On the other hand, in terms of productivity changes, the results obtained from the data analyses showed that the overall factor productivity fell by 6.7%. They also revealed that this drop is mainly due to the decline in technological change (8.3).
Furthermore, the levels of technical efficiency and productivity were significantly affected by the financial and economic crisis, as well as by the Tunisian revolution, which corroborates with the finding of Wilmsmeier et al. [26]. In fact, we have observed that these two periods of economic recession are characterized by relatively lower levels of technical efficiency and productivity. Our possible explanation for this finding is related to the decrease in international traffic levels and thus of the demand for port services.
To increase efficiency and productivity pf Tunisian port, we should deeply study sustainability development and in particular the digitalization concepts in ports, such as the concept of digitalization as a basis of the sustainable development of seaports. Furthermore, the digital transformation should be considered critical, which accounts for a significant proportion of the country’s Gross Domestic Product. Some of the techniques that should be involved in the digitalization process include adoption of a learning culture, roadmap to development, creation of awareness, collaboration, and support [41]. Furthermore, the concept of digitalization is based on the dominance of digital ecosystems and on the widespread introduction of artificial intelligence systems, including the physical distribution within the trade networks [42].
As with all research studies, this study also has some limitations: First, the two input variables used in this research, such as the berths and gear. In fact, these variables provide the necessary information about port operations but cannot capture the different physical configurations of the ports. Second, the lack of data about the input prices does not help with the measurement of the allocative and economic efficiency. Therefore, this research focused only on measuring the technical efficiency of Tunisian ports. As a consequence, to gain more in-depth knowledge about these Tunisian ports, future studies would include the use of other inputs, such as the land, tugs, stores, etc., and outputs, namely, the number of ships. In addition, monetization of the used inputs would be a potentially fruitful way to extend this research to measure allocative and economic efficiency.

5. Conclusions

The scientific novelty of the research is to apply an empirical study to evaluate the technical efficiency and productivity change of a number of Tunisian commercial seaports—Bizerte, Rades, Sousse, Sfax, Gabes, and Zarzis—using the data envelopment analysis method and the Malmquist productivity index based on the output-oriented DEA over a period of twelve years, from 2005 to 2016. It is assumed that all seaports studied used three inputs, such as the number of berths, the number of gears, and the number of workers, to produce a single output, which is the cargo volume.
The first output-oriented DEA application is about efficiency evaluation, which, for each seaport, allows the estimation of the overall technical efficiency, pure technical efficiency, and scale efficiency. The first output-oriented DEA method provides that the overall technical efficiency in the abovementioned ports is 69.4% while the pure technical efficiency is 83.3%. Furthermore, the average scale efficiency is about 82.6%, which implies that the decreasing type of returns to scale dominates in this study. The second application concerns the evolution of the productivity of Tunisian seaports during the study period using the Malmquist DEA-based productivity index. The productivity analysis is performed according to the year (period) and according to each studied seaport. Regarding the second DEA application for productivity evolution, the obtained results revealed from the data analysis that it fell by 6.7%, mainly due to the degradation of the technological change (8.3%).
The results obtained provide useful basic criteria for establishing efficiency improvement strategies for each studied seaport. To improve their operational efficiency and productivity. Additionally, the results of our research are important because they provide detailed information for policy makers.
This research may provide some reasonable insight into current efficiency and productivity evaluation of Tunisian seaports. Some future research perspectives should be addressed:
  • In the first output-oriented DEA application, efficiency evaluation is a priority, which allows, for each seaport, the estimation of the overall technical efficiency, pure technical efficiency, and scale efficiency. However, that dimension is being ignored. Therefore, it is assumed that there is only one frontier for all years. One way to use the DEA method in the time series model is the DEA window analysis. Extending the current research in this direction is the first of our interesting perspective.
  • DEA methodology assumes that DMU should be homogeneous entities. In this research, the study concerns the six most similar Tunisian seaports, which have approximatively the same port operations. Therefore, this study can be extended to other seaports using the stochastic frontier analysis (SFA) method. Extending this research in this direction is the second of our most interesting perspectives.
  • Finally, the third of our perspective is about the impact of COVID 19 on the efficiency and productivity of Tunisian commercial seaports.

Author Contributions

Conceptualization, M.B.M., M.E. and S.H.; methodology, M.B.M., A.M.A. and W.H.; software, M.B.M.; validation, M.B.M., M.E. and S.H.; formal analysis, M.B.M., W.H. and A.M.A.; investigation, M.B.M. and M.E.; resources, M.B.M.; data curation, M.E. and W.H.; writing—original draft preparation, M.B.M. and M.E.; writing—review and editing, W.H., A.M.A. and S.H.; visualization, M.B.M. and A.M.A.; supervision, W.H. and S.H.; project administration, W.H. and A.M.A.; funding acquisition, A.M.A. All authors have read and agreed to the published version of the manuscript.

Funding

This research was supported and funded by Taif University Researchers Supporting Project number (TURSP-2020/229), Taif University, Taif, Saudi Arabia. The authors are grateful for this financial support.

Institutional Review Board Statement

Not applicable.

Informed Consent Statement

Not applicable.

Data Availability Statement

Data is contained within the article.

Acknowledgments

This research was supported by Taif University Researchers Supporting Project number (TURSP-2020/229), Taif University, Taif, Saudi Arabia. First, we are grateful for this financial support. Second, the authors would like to thank all seaport managers studied for their help and availabilities. Third, this work is dedicated to the memory of our beloved friend and unforgettable colleague, Riyadh Hamza, at the Higher Institute of Industrial Management Sfax (Tunisia). Finally, the authors thank the editors and the four anonymous reviewers for their helpful and constructive comments. Their time is precious and number and the relevance of the comments on our manuscript mean that they have dedicated a significant portion of it to help us improve our work.

Conflicts of Interest

The authors declare no conflict of interest.

Abbreviations

The following acronyms are used in this manuscript:
CRSConstant Returns to Scale
DEAData Envelopment Analysis
DEA-BCCDEA model developed by Banker, Charnes, and Cooper (1984)
DEA-CCRDEA model developed By Charnes, Cooper and Rhodes (1978)
DMUDecision-Making Unit
DRSDecreasing Returns to Scale
EFFCHTotal technical efficiency change
IRSIncreasing Returns to Scale
MAFPMalmquist average productivity (MAFP)
MPIMalmquist Productivity Index
OMMPOffice of Merchant Marine and Ports (in Tunisia)
PECHPure technical efficiency
SECHScale efficiency change
SFAStochastic Frontier Analysis
TECHCHTechnological change
TFPTotal Factor Productivity
TFPCHMalmquist Total Factor Productivity Change index
VRSVariable Returns to Scale

References

  1. Jeh, J.; Nam, J.; Sim, M.; Kim, Y.; Shin, Y. A Study on the Efficiency Analysis of Global Terminal Operators Based on the Operation Characteristics. Sustainability 2022, 14, 536. [Google Scholar] [CrossRef]
  2. He, X.; Liu, W.; Hu, R.; Hu, W. Environmental Regulations on the Spatial Spillover of the Sustainable Development Capability of Chinese Clustered Ports. J. Mar. Sci. Eng. 2021, 9, 301. [Google Scholar] [CrossRef]
  3. Wang, C.-N.; Nguyen, N.-A.-T.; Fu, H.-P.; Hsu, H.-P.; Dang, T.-T. Efficiency Assessment of Seaport Terminal Operators Using DEA Malmquist and Epsilon-Based Measure Models. Axioms 2021, 10, 48. [Google Scholar] [CrossRef]
  4. Parra Santiago, J.I.; Camarero Orive, A.; González Cancelas, N. DEA-Bootstrapping Analysis for Different Models of Spanish Port Governance. J. Mar. Sci. Eng. 2021, 9, 30. [Google Scholar] [CrossRef]
  5. Tongzon, J.L. Port choice and freight forwarders. Transp. Res. Part E Logist. Transp. Rev. 2009, 45, 186–195. [Google Scholar] [CrossRef]
  6. Leibenstein, H. Allocative Efficiency vs. ‘X-efficiency’. Am. Econ. Rev. 1966, 56, 392–415. [Google Scholar]
  7. Forsund, F.R.; Sarafoglou, N. On the Origins of Data Envelopment Analysis. J. Product. Anal. 2002, 17, 23–40. [Google Scholar] [CrossRef]
  8. Lovell, C. Production Frontiers and Productive Efficiency. In The Measurement of Productive Efficiency: Techniques and Applications; Fried, H.O., Lovell, C.A.K., Schmidt, S.S., Eds.; Oxford University Press: Oxford, UK, 1993; pp. 3–67. [Google Scholar]
  9. Emrouznejad, A.; Parker, B.R.; Tavares, G. Evaluation of research in efficiency and productivity: A survey and analysis of the first 30 years of scholarly literature in DEA. Socio-Econ. Plan. Sci. 2008, 42, 151–157. [Google Scholar] [CrossRef]
  10. Coelli, T.; Prasada-Rao, D.S.; Battese, G.E. An Introduction to Efficiency and Productivity Analysis, Boston; Kluwer Academic Publishers: Dordrecht, The Netherlands; London, UK, 1998. [Google Scholar]
  11. Roll, Y.; Hayuth, Y. Port Performance Comparison Applying Data Envelopment Analysis (DEA). Marit. Policy Manag. 1993, 20, 153–161. [Google Scholar] [CrossRef]
  12. Charnes, A.; Cooper, W.W.; Rhodes, E. Measuring the Efficiency of Decision Making Units. Eur. J. Oper. Res. 1978, 2, 429–444. [Google Scholar] [CrossRef]
  13. Banker, R.D.; Charnes, A.; Cooper, W.W. Some Models for Estimating Technical and Scale Inefficiencies in Data Envelopment Analysis. Manag. Sci. 1984, 30, 1078–1092. [Google Scholar] [CrossRef] [Green Version]
  14. Martinez-Budria, E.; Diaz-Armas, R.; Navarro-Ibanez, M.; Ravelo-Mesa, T. A study of the Efficiency of Spanish Port Authorities Using Data Envelopment Analysis. Int. J. Transp. Econ. 1999, XXVI, 237–253. [Google Scholar]
  15. Tongzon, J.L. Efficiency Measurement of Selected Australian and Other International Ports Using Data Envelopment Analysis. Transp. Res. Part A 2001, 35, 113–128. [Google Scholar] [CrossRef]
  16. Bonilla, M.; Medal, A.; Casasus, T.; Sala, R. The Traffic in Spanish Ports: An Efficiency Analysis. Int. J. Transp. Econ. 2002, 29, 215–230. [Google Scholar]
  17. González, M.I.M.; Trujillo, L. Reforms and infrastructure efficiency in Spain’s container ports. Transp. Res. Part A Policy Pract. 2008, 42, 243–257. [Google Scholar] [CrossRef] [Green Version]
  18. Barros, C.P. The measurement of efficiency of Portuguese sea port authorities with DEA. Int. J. Transp. Econ. (Riv. Internazionale Di Econ. Dei Trasp.) 2003, 30, 335–354. [Google Scholar]
  19. Barros, C.P.; Athanasiou, M. Efficiency in European seaports with DEA: Evidence from Greece and Portugal. Marit. Econ. Logist. 2004, 6, 122–140. [Google Scholar] [CrossRef]
  20. Rodriguez-Alvarez, A.; Tovar, B.; Trujillo, L. Firm and Time Varying Technical and Allocative Efficiency: An Application to Port Cargo Handling Firms. Int. J. Prod. Econ. 2007, 109, 149–161. [Google Scholar] [CrossRef]
  21. Alonso, L.G.; Bofarull, M.M. Impact of port investment on efficiency and capacity to attract traffic in Spain: Bilbao versus Valencia. Marit. Econ. Logist. 2007, 9, 254–267. [Google Scholar] [CrossRef]
  22. Hung, S.W.; Lu, W.M.; Wang, T.P. Benchmarking the operating efficiency of Asia container ports. Eur. J. Oper. Res. 2010, 203, 706–713. [Google Scholar] [CrossRef]
  23. Choi, Y. The Efficiency of Major Ports under Logistics Risk in Northeast Asia. Asia-Pac. J. Oper. Res. 2011, 28, 111–123. [Google Scholar] [CrossRef]
  24. Fu, B.X.; Song, X.Q.; Guo, Z.J. DEA-based Malmquist Productivity Index Measure of Operating Efficiencies: New Insights with an Application to Container Ports. J. Shanghai Jiaotong Univ. 2009, 14, 490–496. [Google Scholar] [CrossRef]
  25. Barros, C.P. Productivity assessment of African seaports. Afr. Dev. Rev. 2012, 24, 67–78. [Google Scholar] [CrossRef]
  26. Wilmsmeier, G.; Tovar, B.; Sanchez, R.J. The evolution of container terminal productivity and efficiency under changing economic environments. Res. Transp. Bus. Manag. 2013, 8, 50–66. [Google Scholar] [CrossRef]
  27. Yuen, A.; Anming, Z.; Waiman, C. Foreign participation and competition: A way to improve the container port efficiency in China? Transp. Res. Part A 2013, 49, 220–231. [Google Scholar] [CrossRef]
  28. Schøyen, H.; Odeck, J. The technical efficiency of Norwegian container ports: A comparison to some Nordic and UK container ports using Data Envelopment Analysis (DEA). Marit. Econ. Logist. 2013, 15, 197–221. [Google Scholar] [CrossRef]
  29. Shaheen, A.A.; Elkalla, M.A. Assessing the Middle East top container ports relative technical efficiency. Pomor. Zb. 2019, 56, 59–72. [Google Scholar] [CrossRef]
  30. Seth, S.; Feng, Q. Assessment of port efficiency using stepwise selection and window analysis in data envelopment analysis. Marit. Econ. Logist. 2020, 22, 536–561. [Google Scholar] [CrossRef]
  31. Gan, G.-Y.; Lee, H.-S.; Tao, Y.-J.; Tu, C.-S. Selecting Suitable, Green Port Crane Equipment for International Commercial Ports. Sustainability 2021, 13, 6801. [Google Scholar] [CrossRef]
  32. Castelló-Taliani, E.; Giralt Escobar, S.; da Rosa, F.S. Environmental Disclosure: Study on Efficiency and Alignment with Environmental Priorities of Spanish Ports. Sustainability 2021, 13, 1791. [Google Scholar] [CrossRef]
  33. Malmquist, S. Index numbers and indifference surfaces. Trab. Estat. 1953, 4, 209–242. [Google Scholar] [CrossRef]
  34. Caves, D.W.; Christensen, L.R.; Diewert, W.E. Multilateral comparisons of output, input, and productivity using superlative index numbers. Econ. J. 1982, 92, 73–86. [Google Scholar] [CrossRef]
  35. Fare, R.; Grosskopf, S.; Norris, M.; Zhang, Z. Productivity growth, technical progress, and efficiency change in industrialized countries. Am. Econ. Rev. 1994, 84, 66–83. [Google Scholar]
  36. Dowd, T.J.; Leschine, T.M. Container Terminal Productivity: A Perspective. Marit. Policy Manag. 1990, 17, 107–112. [Google Scholar] [CrossRef]
  37. Alamoush, A.S.; Ballini, F.; Ölçer, A.I. Revisiting port sustainability as a foundation for the implementation of the United Nations Sustainable Development Goals (UN SDGs). J. Shipp. Trade 2021, 6, 19. [Google Scholar] [CrossRef]
  38. Coelli, T. A Guide to DEAP; Version 2.1; A Data Envelopment Analysis (Computer) Program; University of New England: Armidale, NSW, Australia, 1996; Available online: https://www.owlnet.rice.edu/~econ380/DEAP.PDF (accessed on 20 December 2020).
  39. Cooper, W.W.; Seiford, L.M.; Tone, K. Data Envelopment Analysis: A Comprehensive Text with Models, Applications, References and DEA-Solver Software; Kluwer Academic Publishers: Boston, MA, USA, 2000. [Google Scholar]
  40. Stanković, J.J.; Marjanović, I.; Papathanasiou, J.; Drezgić, S. Social, Economic and Environmental Sustainability of Port Regions: MCDM Approach in Composite Index Creation. J. Mar. Sci. Eng. 2021, 9, 74. [Google Scholar] [CrossRef]
  41. Khalid, B.; Naumova, E. Digital transformation SCM in view of Covid-19 from Thailand SMEs perspective. Glob. Chall. Digit. Transform. Mark. 2021, 49–66. Available online: https://pesquisa.bvsalud.org/global-literature-on-novel-coronavirus-2019-ncov/resource/pt/covidwho-1472929 (accessed on 2 February 2022).
  42. Barykin, S.Y.; Kapustina, I.V.; Sergeev, S.M.; Kalinina, O.V.; Vilken, V.V.; de la Poza, E.; Putikhin, Y.Y.; Volkova, L.V. Developing the physical distribution digital twin model within the trade network. Acad. Strateg. Manag. J. 2021, 20, 1–18. [Google Scholar]
Figure 1. Flowchart of the proposed approach.
Jmse 10 00626 g001
Figure 2. Overall technical efficiency (DEA-CCR) of the Tunisian ports (2005–2016).
Jmse 10 00626 g002
Figure 3. Pure technical efficiency (DEA-BCC) of the Tunisian ports (2005–2016).
Jmse 10 00626 g003
Figure 4. Scale efficiency of Tunisian ports (2005–2016).
Jmse 10 00626 g004
Figure 5. Evolution of the overall factor productivity index and its components.
Jmse 10 00626 g005
Table 1. Structure of Tunisian seaports traffic in 2016 (tons).
Categories/PortsBizerteRadesSousseSfaxGabesZarzis
Liquid bulks3,071,924952,56469,232130,398556,803134,415
Solid bulks1,532,6261,688,9361,217,8122,914,0292,076,366497,016
General goods (containers, non-unitised goods)688,3034,263,022977,1641,467,372140,01144,682
Table 2. Input and output variables definition.
VariablesTypeDescription of VariablesMeasurement Unit Inputs Measurement
The total number of berths (X1),InputIt contains the number of specialized berths and the number of ordinary berths.Unit
Total number of gears (X2)InputIt measures the number of gears provided for handling cargo in each port.Unit
The total number of workers (X3)InputIt is composed of the number of managers, number of supervisors and number of operatives.Unit
Total volume of cargo (Y):OutputIt measures the total quantity of goods processed for import and export.1000 tons
Table 3. Descriptive statistics of the inputs and output.
PortsDescriptive
Statistic
Variables
Volume of CargoNumber of BerthsNumber of GearsNumber of Workers
BizerteMean5062.0831326.33375.166
SD598.225010.44739.737
Min398913834
Max60811341124
RadesMean5940.16712114.666598.333
SD567.2113061.214180.907
Min51801236414
Max693212181811
SousseMean2034.000717.7593
SD259.19607.84033.212
Min15927559
Max2402724134
SfaxMean4571.9171528.916137.666
SD371.67609.54866.021
Min4006151173
Max51451538223
GabesMean3533.4171016.91655.916
SD891.30306.62529.484
Min220110528
Max4773102693
ZarzisMean860.000610.00019.333
SD202.10003.9547.164
Min6786312
Max135561628
Table 4. Overall technical efficiency scores (DEA-CCR) of Tunisian ports.
Ports/Year200520062007200820092010201120122013201420152016Average
Bizerte0.7940.8910.9370.9880.7570.6410.7350.9770.8560.8990.8860.8380.850
Radès0.8670.9201.0000.9680.8750.9840.8520.7570.9180.9140.9651.0000.918
Sousse0.5260.5400.6710.7590.5280.6570.5860.5390.5820.5990.6990.6590.612
Sfax0.6820.6750.7520.7840.6300.6960.5560.5680.5840.6550.6000.6190.650
Gabès1.0001.0000.9480.9620.8621.0000.4930.6360.6880.5750.4590.5740.766
Zarzis0.3980.3580.3430.4200.4340.6120.4990.2840.2580.2370.2570.2700.364
Average (Grand mean)0.694
Table 5. Pure technical efficiency scores (DEA-BCC) of Tunisian ports.
Ports/Years200520062007200820092010201120122013201420152016Average
Bizerte0.9480.9020.9491.0000.8540.7210.8261.0000.8760.9290.9200.8700.900
Radès0.8680.9211.0000.9700.8780.9910.8610.7570.9180.9140.9651.0000.920
Sousse0.8040.7210.9061.0000.7620.9500.8490.7740.8360.8581.0000.9430.867
Sfax0.8440.8160.9031.0000.7590.8470.6750.6720.6910.7740.7120.7350.786
Gabès1.0001.0000.9480.9620.8621.0000.4930.6360.6910.5770.4610.5780.767
Zarzis1.0000.8930.8541.0000.7591.0000.8150.6000.5450.5000.5440.5730.757
Average (Grand mean)0.833
Table 6. Scale efficiency scores for the Tunisian ports (2005–2016).
Ports/Years200520062007200820092010201120122013201420152016Average
Bizerte0.8380.9880.9880.9880.8870.8890.8900.9770.9770.9680.9640.9640.943
Radès0.9990.9991.0000.9980.9970.9930.9901.0001.0001.0001.0001.0000.998
Sousse0.6540.7490.7410.7590.6930.6920.6910.6970.6960.6980.6990.6980.706
Sfax0.8090.8270.8320.7840.8300.8210.8240.8450.8450.8470.8430.8420.829
Gabès1.0001.0001.0001.0001.0001.0001.0001.0000.9960.9960.9960.9920.998
Zarzis0.3980.4010.4010.4200.5720.6120.6120.4730.4730.4730.4730.4720.482
Average (Grand mean)0.826
Table 7. Types of returns to scale of the selected ports.
Ports/Years200520062007200820092010201120122013201420152016
BizerteDRSDRSDRSDRSDRSDRSDRSDRSDRSDRSDRSDRS
RadèsDRSDRS-DRSDRSDRSDRS-----
SousseIRSIRSIRSIRSIRSIRSIRSIRSIRSIRSIRSIRS
SfaxDRSDRSDRSDRSDRSDRSDRSDRSDRSDRSDRSDRS
Gabès--------IRSIRSIRSIRS
ZarzisIRSIRSIRSIRSIRSIRSIRSIRSIRSIRSIRSIRS
DRS: Decreasing Returns to Scale; IRS: Increase Returns to Scale.
Table 8. Total factor productivity index and its components by period.
PeriodEFFCHTECHCHPECHSECHTFPCH
2005–20061.0170.9070.9531.0670.922
2006–20071.0860.9501.0511.0331.032
2007–20081.0271.1771.0101.0171.209
2008–20090.9850.6520.9791.0060.642
2009–20100.9701.1180.8741.1101.085
2010–20111.0570.7690.9891.0690.813
2011–20120.7491.0070.8880.8440.755
2012–20131.2020.8341.1421.0531.002
2013–20141.0850.8961.0860.9990.972
2014–20151.0490.9331.0540.9950.979
2015–20161.0290.9701.0081.0210.998
Geometric mean1.0170.9171.0001.0170.933
Pre-Revolution
(2005–2010)
1.0170.9600.9731.0460.978
Post-Revolution (2011–2016)1.0280.9011.0270.9960.919
Table 9. Overall factor productivity index and its components per port (2005–2016).
PortsEFFCHTECHCHPECHSECHTFPCH
Bizerte1.0200.9231.0001.0200.941
Radès1.0001.0251.0001.0001.025
Sousse1.0370.9111.0061.0310.945
Sfax1.0240.9270.9941.0300.949
Gabès0.9830.8511.0000.9830.837
Zarzis1.0420.8761.0001.0420.913
Geometric mean1.0170.9171.0001.0170.933
Publisher’s Note: MDPI stays neutral with regard to jurisdictional claims in published maps and institutional affiliations.

