Article

Comparative Analysis on the Evolution of Seepage Parameters in Methane Hydrate Production under Depressurization of Clayey Silt Reservoir and Sandy Reservoir

1
Key Laboratory of Groundwater Resources and Environment, Ministry of Education, Jilin University, Changchun 130021, China
2
Key Laboratory of Gas Hydrate, Ministry of Natural Resources, Qingdao Institute of Marine Geology, Qingdao 266071, China
3
Laboratory for Marine Mineral Resources, Pilot National Laboratory for Marine Science and Technology-Qingdao, Qingdao 266071, China
*
Author to whom correspondence should be addressed.
J. Mar. Sci. Eng. 2022, 10(5), 653; https://doi.org/10.3390/jmse10050653
Submission received: 24 March 2022 / Revised: 5 May 2022 / Accepted: 6 May 2022 / Published: 11 May 2022

Abstract

:
Gas hydrates are likely to become an important strategic resource with commercial development prospects. It is therefore of great significance to realize the long-term and efficient production of methane hydrate reservoirs. Previous studies have shown that the lithological characteristics of hydrate reservoirs have a significant impact on reservoir productivity by influencing the evolution of seepage parameters in the process of hydrate production. The porosity (Φ) and initial hydrate saturation (SH) affect the amount of hydrate decomposition and pressure transfer, and also indirectly affect the reservoir temperature field. The permeability (k) directly affects the rate of pressure-drop transmission and methane gas discharge. Due to the differences in seepage parameters caused by different reservoir lithology, a sandy hydrate reservoir (SHR) in Japan and a clayey silt hydrate reservoir (CHR) in China were found to have different gas production rates and the spatial evolution characteristics of the temperature and pressure fields varied in gas hydrate production tests. Therefore, to ensure the long-term and efficient production of the CHR in China, two models were established for a comparative analysis based on a numerical simulation. The two models were depressurizing models of the CHR of the W11 drilling site in the Shenhu Sea area of the South China Sea and the SHR of the AT1 drilling site in the Eastern Nankai Trough of Japan. Both models considered the heterogeneity of seepage parameters, and the TOUGH+HYDARATE (T+H) code was used in subsequent calculations. Four key results were obtained: (a) The order of the significance levels of the lithological parameters on productivity was k > SH > Φ in the CHR and SH > k > Φ in the SHR. (b) The heat conduction and heat convection in the CHR were weaker than in the SHR, which made it difficult to recover the low-temperature area caused by hydrate decomposition. (c) The exploitation of a high k hydrate reservoir should be given priority when the other initial conditions were the same in both the CHR and SHR. (d) The exploitation of both the CHR and SHR should not only rely on the hydrate content or seepage capacity to determine the reservoir exploitation potential, but the combined effect of the two parameters should be fully considered.

1. Introduction

Natural gas hydrates (NGHs) are considered to be an important new and clean energy source [1]. They are clathrate, ice-like compounds, in which the gas molecules occupy a cage structure composed of hydrogen-bonded water molecules under a high pressure (>0.6 MPa) and low temperature (<27 °C) [2]. Natural gas hydrates are likely to become a strategic resource with commercial development prospects in the 21st century and represent a revolutionary alternative to the third energy transition. It’s therefore critical to study the long-term and efficient production of NGHs [3,4].
The lithology of hydrate reservoirs differs among countries. It can be seen from Table 1 that, the lithology of hydrate reservoirs is mainly in the form of a clayey silt hydrate reservoir (CHR), as in the South China Sea, or a sandy hydrate reservoir (SHR), as in the Nankai Trough of Japan. Due to the different lithological characteristics of Japanese and Chinese Hydrate-bearing sediment, different hydrate decomposition behaviors and gas production characteristics have been observed in hydrate production tests.
Previous studies have shown that main factors affecting the productivity of NGHs reservoir are the occurrence features of the hydrate deposits and production methods, and fundamentally it is determined by lithological features of the hydrate reservoir. The most important lithological parameters are reservoir porosity(Φ), initial hydrate saturation (SH) and formation permeability (k) [12]. The decrease of pressure leads to the decomposition of NGHs, which is an endothermic reaction, the temperature of the decomposition zone decreases significantly and the decomposition front continues to expand into the reservoir with the pressure-drop transmission. Due to the restriction of permeability and pressure-drop, methane gas at the dissociation front cannot flow into production well in a timely way, which would maintain certain pressure inside the reservoir. As a key factor, permeability directly affects the discharge velocity of methane gas and the propagation velocity of pressure-drop [13,14]. The porosity and initial hydrate saturation affect the production of hydrate decomposition, which determine the change of temperature field and pressure field. Therefore, it’s vital to discuss the influence of the change of lithological parameters on the gas production process in order to chronically and efficiently exploit NGHs in the sea [15].
Many researchers have considered the influence of the lithological parameters of hydrate reservoirs on reservoir productivity, and the temperature and pressure fields using numerical simulations. Li et al. [16] studied the sensitivity of parameters in the process of exploiting a CHR by a depressurization method, and found that the larger k and production pressure-drop, the smaller the SH and the faster the production speed. The analysis only started from the position of the dissociation front without considering the amount of hydrate decomposition and methane gas emission. Matthew et al. [17] studied an SHR in the Tigershark area in the Gulf of Mexico and developed a model of both class 2 and class 3 hydrate reservoirs. The study found that the gas production rate increased with an increase in Φ and a decrease in well spacing, and there was little relationship with the anisotropy of k. However, the study did not consider the relative degree of influence of each factor on the gas production rate. Jiang et al. [18] did consider the lithology of hydrate reservoirs and established a three-phase and three-component depressurization numerical model of a class 1 hydrate reservoir. The study found that the higher the initial temperature, the larger the k and decomposition rate constant and the quicker the decomposition rate of hydrate. However, the study did not consider the effect of ice on hydrate decomposition. Huang et al. [12] considered the relative importance of difference seepage parameters on cumulative gas production (VP) through an experiment with an orthogonal design, and found the order of importance was k > Φ > SH > temperature > pressure > thickness of layer. The study did not consider the difference in the influence of each parameter on productivity with changes in the time scale. The studies referred to above did not consider the differences in the influence of seepage parameters on production for different hydrate reservoir lithology. The spatial heterogeneity of the hydrate reservoir was not considered when using the numerical simulation method.
The hydrate reservoir in the Shenhu Sea area of the South China Sea is a low k clayey silt reservoir with slow heat convection and heat conduction velocity, and the hydrate reservoir in the Nankai Trough in Japan is a sandy reservoir with high Φ, k and SH, and its heat convection and heat conduction velocity are fast [19]. Therefore, from the experience of hydrate production tests projects in other countries and considering the lithological characteristics and spatial heterogeneity of the reservoirs, we established two models of the depressurized production of horizontal wells in layered heterogeneous reservoirs. The models were based on the CHR at the W11 drilling site in the Shenhu Sea area of the South China Sea and the SHR at the AT1 drilling site in the Eastern Nankai Trough of Japan. The TOUGH+HYDRATE code was used to simulate the reservoirs to acquire the characteristics of gas and water production under various Φ, k and SH conditions. In combination with a comparative analysis of the evolution of the seepage parameters of hydrate reservoirs in different lithology in the simulation process, a sensitivity analysis of the lithological parameters affecting the productivity of different lithological reservoir was conducted. The results can be uesd to provide theoretical guidance for efficient long-term hydrate production from argillaceous siltstone reservoirs in the South China Sea.

2. Model Setup

2.1. Geological Background in the Research Area

The Shenhu Sea is located near the southeast area of Shenhu Shoal in the middle part of the northern continental slope of the South China Sea and is part of the northern continental margin of the South China Sea (Figure 1). The area is bordered to the north by the Shenhu Uplift and Panyu Low Uplift, and to the south by the Southeastern Uplift, and is part of the ZhuⅡ depression in the Pearl River Mouth Basin [20,21]. Due to the high sedimentation rate of the Cenozoic Layer, rich oil and gas resources and active deep fluid activities in the area, a hydrate accumulation system unique that is to the South China Sea has formed, and has become a key target area for marine hydrate exploration and development in China [22,23]. Since 2007, China has completed four drilling campaigns in this area, i.e., GMGS1 (2007), GMGS2 (2013), GMGS3 (2015), and GMGS4 (2016), which acquired data regarding hydrate reservoir characteristics and a large number of in-situ hydrate samples [24].
The drilling and logging results at well site W11 indicated that the hydrate layer is located 117–197 m below the seafloor (mbsf), with a water depth of 1312 m. The lithology of the hydrate reservoir is a low k clayey silt reservoir. The logging data and core samples showed that there were no significant changes in the lithology of the sedimentary section extending nearly 230 m. Therefore, the hydrate reservoir was overlain and underlain by permeable layers, which have the same lithology as the hydrate reservoir but lack hydrates [25].
The Nankai Trough of Japan is located in the southwest of the Japan Island Arc (Figure 2), the trough was formed by the subduction of the Philippine plate to the Eurasian plate since the Pliocene [27]. The Nankai Trough east of Japan is considered to be the target site for Japan to obtain natural gas from hydrate deposits in the future [28,29]. The wireline logging and sampling results at site AT1 indicated that there were around 60 m thick highly saturated methane hydrate-bearing layers approximately 300 m below the seafloor. Specifically, the hydrate reservoir with an interbedded sand-shale structure could be divided into three regions: upper alternate layers of sand and silt (about 20 m), middle silt-dominated layer (about 10 m), and lower sand-dominated layer (about 30 m). The hydrate reservoir was overlain by a silt-dominated zone with a thickness of 30 m, and the underburden layer is a sand-dominated zone saturated with water [30,31]. Table 2 shows the difference of some basic data between CHR and SHR.

2.2. Numerical Simulation Model of Hydrate Exploitation

2.2.1. Model Geometry and Spatial Discretization

The CHR model was based at the W11 site of the GMGS3 drilling expedition in the Shenhu area of the South China Sea. The thickness of the hydrate reservoir was 80 m and the lithology was a low k argillaceous siltstone. Both the overburden and underburden layers had a thickness of 20 m, and the lithology was the same as that of the hydrate reservoir. The reservoir was completely closed and had a constant temperature, with only heat exchanged between the hydrate reservoir and other layers [33]. The SHR model was based at the AT1 site of the Nankai Trough in Japan. The methane hydrate concentrated zones were located at the bottom of the sea at a depth of 845–1405 m. The thickness of the SHR was 60 m, and the lithology was a high k sandy reservoir with an interbedded sand-shale reservoir. The overburden was a thick clay sedimentary layer, with a thickness of 26 m. This layer was regarded as an effective impervious boundary. The thickness of the underburden layer was 14 m. It was a sandy sedimentary layer with high k and SH [34]. Both the CHR and SHR models are class Ⅱ hydrate reservoirs. According to the decomposition gas test results, the main component of the gas was methane, with a volume fraction of more than 99% [35].
A cube with a length of 1000 m, breadth of 1000 m, and thickness of 120 m was used for the CHR model (Figure 3a). A cube with a length of 1000 m, breadth of 1000 m, and thickness of 100 m was used for the SHR model (Figure 3b). In both the CHR and SHR models, along the X-coordinate (direction of vertical horizontal well extension), ΔX = 2, 3, 5, 20, 30, and 40 m. The Y-coordinate was the extension direction of the horizontal well with a length of 1000 m. It was assumed that there was equal pressure throughout the well, and therefore a thickness of 1 m was adopted in the Y-coordinate during the simulation calculation. Along the Z-coordinate, a refined grid design was adopted to improve the simulation accuracy. The separation precision of the hydrate reservoir was 0.5 m, the accuracy of separation in the overburden and underburden layers of the CHR model was 4.0 m, and a total of 170 grids were established in the Z-coordinate. The whole CHR model was discretized into 60 × 1 × 170 = 10,200 grids. In the SHR model, the overburden layer was divided into five grids of 5.0 m and one grid of 1.0 m from the top to bottom, the underburden layer was divided into one grid of 4.0 m and two grids of 5.0 m from the top to bottom, and a total of 129 grids were established in Z-coordinate. The whole SHR model was discretized into 60 × 1 × 129 = 7740 grids.
A horizontal well was used to extract hydrates in this simulation. On the one hand the layout of the horizontal well should consider the actual geological conditions of the reservoir to accurately describe the process of hydrate dissociation caused by pressure drawdown, on the other hand it should consider the problems that may be faced in actual exploitation based on the reservoir structure. Therefore, in the CHR model the horizontal well was located in the 11th layer, the center of the hydrate reservoir, which was the area with the best k and highest SH in the whole model. In the SHR model the location of the well took into account both k and SH, and also the presence of a highly permeable, water-saturated sandstone reservoir. Therefore, a resistive water layer was placed between the horizontal well and the bottom of the hydrate reservoir. The 19th layer was regarded as a resistive water layer due to its extremely low k and low SH. In the SHR model the horizontal well was located 63.5 m below the model, below the hydrate reservoir, which was the area with the best k and high SH in the whole model. The horizontal well length was 500 m in both models.

2.2.2. Reservoir Properties and Parameters

Table 3 shows the main properties and model parameters of the hydrate reservoirs at the W11 and AT1 sites. The clayey silt hydrate reservoir at W11 had only a clayey silt formation, and therefore there was no sandy formation data. Some of the parameters in the table were derived from analyses of well-logging data and core samples from each site. Other data were derived from relevant empirical values of hydrate reservoirs. The relative k was calculated using the Stone model. The specific parameters were determined in combination with the measured values at different CHR and SHR sites around the world. The geothermal gradients of the two reservoirs were very different. The geothermal gradient of W11 was reported by Qian et al. [36] by combining the logging-while-drilling (LWD) data of the GMGS3 expedition and high-resolution image data. The geothermal gradient of AT1 was reported by Suzuki et al. [37] by combining LWD data and core analysis data, both of which accorded with the actual site conditions [38]. The Φ is the ratio of the pore volume in the rock to the rock’s volume, including its pores, k is a parameter that characterizes a reservoir’s ability to transport water or other fluids, and SH is the ratio of the volume of gas hydrates in the reservoir pores to the total pore volume. Those were hierarchical value.

2.2.3. Initial and Boundary Conditions

Figure 4 shows the initial spatial distribution of the seepage parameters at the W11 drilling site. The initial temperature distribution was calculated according to the reported seafloor temperature (4.82 °C) and the corresponding geothermal gradient (54.9 °C/km) in the CHR model, and the pore pressure was calculated by means of the hydrostatic equilibrium. The calculated temperature and pressure at the bottom of the hydrate stability zone were 15.15 °C and 16.15 MPa, respectively. In this simulation, the hydrate reservoir was characterized as a layered heterogeneous porous media, and divided into thin (4 m) layers. Each layer of the model was considered to be isotropically homogenous, i.e., the same Φ, k and SH was assumed in each layer. The average value of the corresponding thickness according to the logging curve was taken. The Φ and k of the overburden and underburden layers was 0.38 and 1 mD, respectively, and they did not contain hydrate [33].
Figure 5 shows the initial spatial distribution of the seepage parameters at the AT1 drilling site. The initial temperature distribution was calculated according to the reported seafloor temperature (3.75 °C) and the corresponding geothermal gradient (30 °C/km) in the SHR model, and the pore pressure was calculated by means of the hydrostatic equilibrium. The calculated temperature and pressure at the bottom of the hydrate stability zone were 14.1 °C and 14.59 MPa, respectively. In this simulation, the hydrate reservoir was characterized as a layered heterogeneous porous media, and divided into thin (3 m) layers. Each layer of the model was considered to be isotropically homogenous. The average value of the corresponding thickness according to the logging curve was taken. The Φ and k of the overburden and underburden layers was 0.38 and 59.9 mD, respectively, and they did not contain hydrate [5].
The horizontal wells in the both the CHR and SHR models were designed to have no fluid flows and heat exchange boundary to avoid boundary effects. They could be considered constant pressure boundaries for mining with constant depressurization at 8 MPa.

2.2.4. The Numerical Simulation Code

In this study, the TOUGH+HYDARATE v1.5 (T+H) code was used to study the depressurization of the two models in the horizontal wells. The T+H code considers the hydrate formation and dissociation process of four phases (water, gas, ice and hydrate) and four components (hydrate, methane, water and water-soluble inhibitors such as salt) and can simulate the non-isothermal hydration reaction, multiphase flow and heat flow under a wide range of conditions that are typically encountered in geologic media containing gas hydrates. It has been widely used in numerical investigations related to the exploitation of NGHS [40,41].

3. Results and Analysis

3.1. Simulation Scheme

Previous studies have shown that the lithological properties of hydrate reservoirs had a large influence on the cumulative volume of methane produced from a well. The order of the significance of geologic conditions on VP has been reported to be k > Φ > SH > initial temperature > initial pressure > thickness of the hydrate-bearing layer [4]. Therefore, this study focused on the three factors (k, Φ and SH) that had the greatest influence on reservoir productivity.
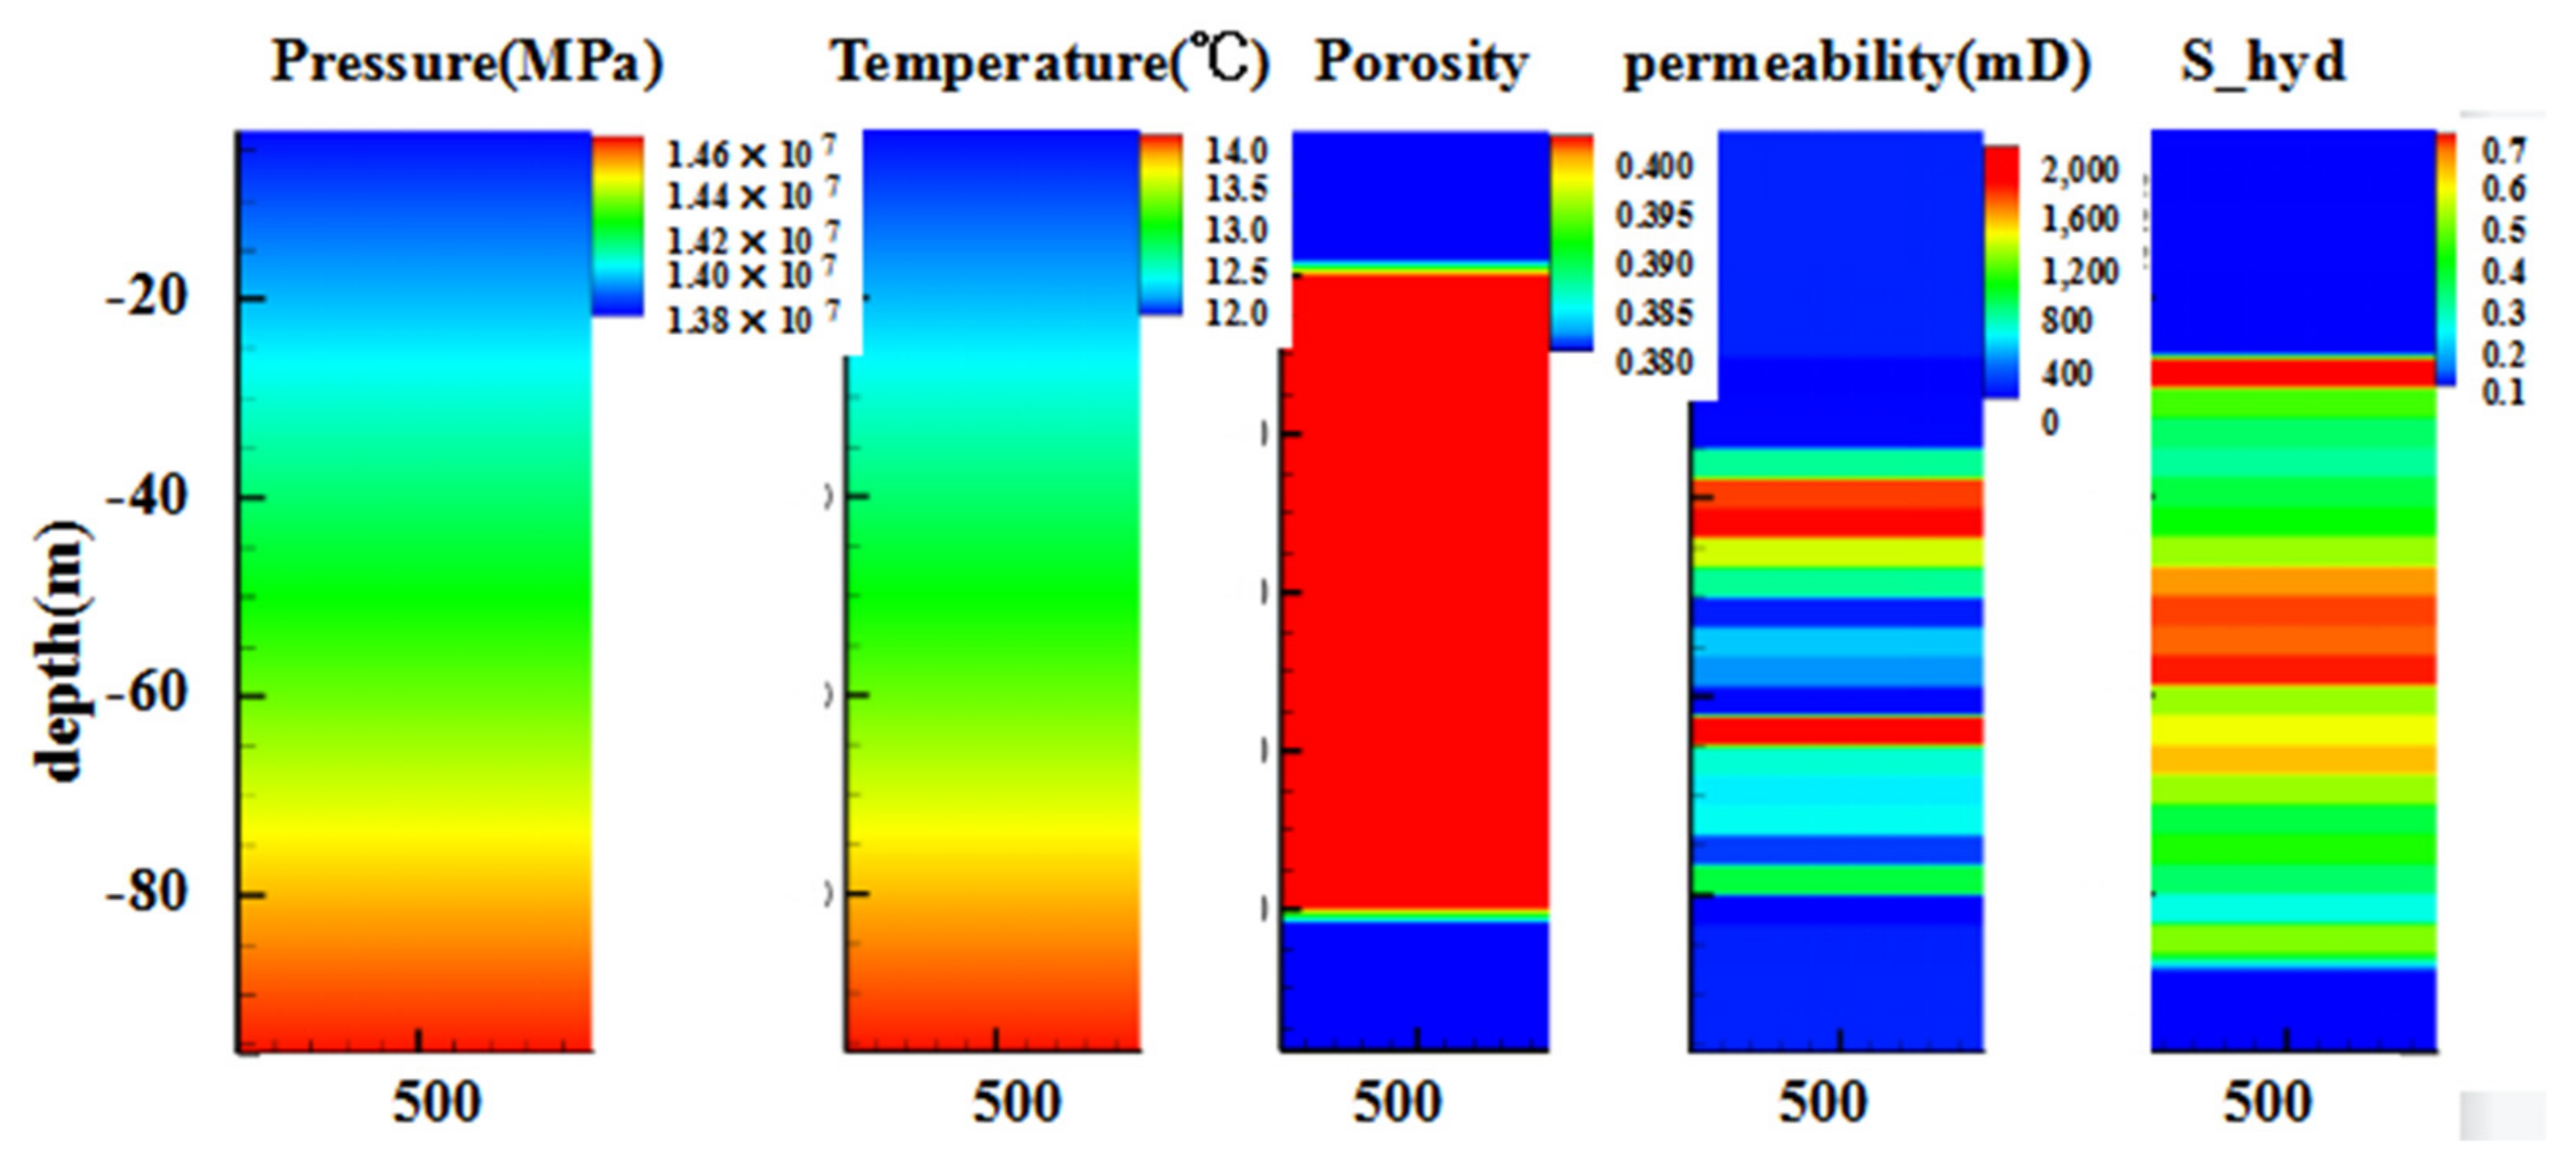
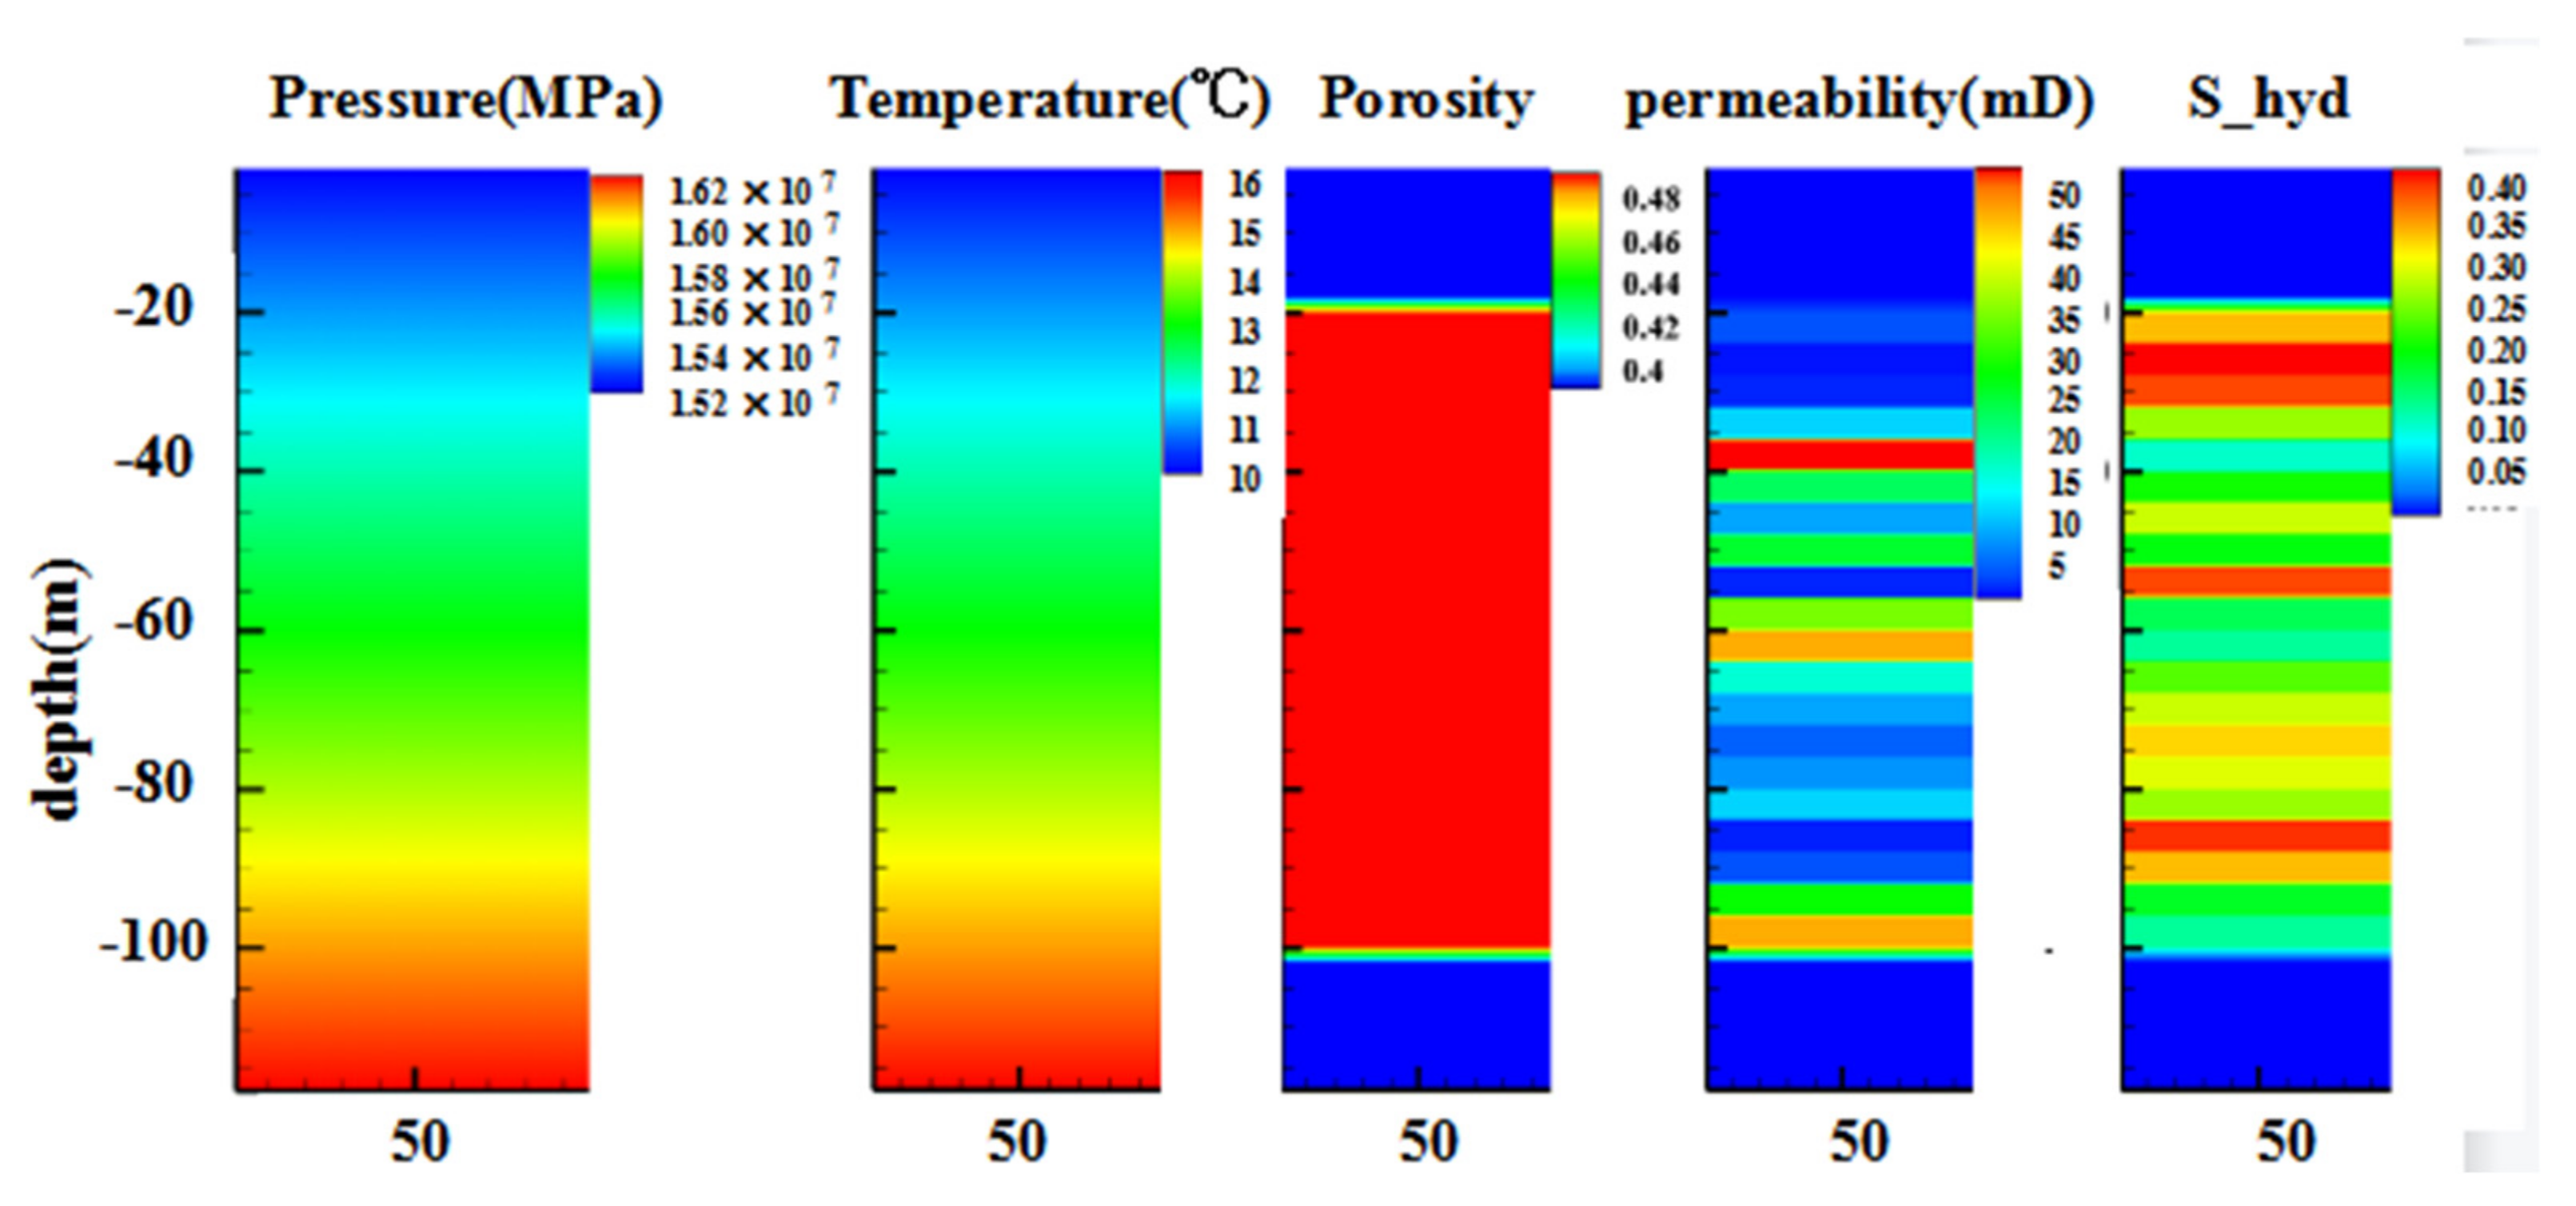
The initial values of the three lithological parameters were stratified and assigned according to the analyses of the well-logging date. Porosity was based on the logging density ( ρ b ) curve and calculated according to the equation: φ = ( ρ s ρ b ) / ( ρ s ρ ω ) , where ρ S is grain density (2.65 g/cm3) and ρ ω is water density (1.03 g/cm3). The SH was based on the logging resistivity curve and was calculated according to the Archie equation. Permeability was calculated based on the Kozeny-Carman model. In the calculation, the CHR model used 4 m as the depth of a layer, while the SHR model used 3 m. The average value of each layer was taken to form the basic scheme. On this basis, according to the logging curve and actual geological characteristics (high Φ, low k, high SH) of the CHR model and actual geological characteristics (high k, high SH) of the SHR model, two schemes with the minimum and maximum values of each factor in each layer of the two models were determined respectively. The two schemes were obtained by an equal-scale interpolation. A total of 15 modeling schemes were designed for each model. Table 4 and Table 5 list the values of each factor under different schemes.
According to logging curve, the Φ of the W11 and AT1 sites varied slightly in the vertical direction. The Φ of the base scheme (A0) was 0.50 based on the logging curve in the CHR model, and considering the high Φ of the hydrate reservoir at W11, the Φ of the minimum scheme (A2) was 0.35 and the Φ of the maximum scheme (A4) was 0.65. Through equal-scale interpolation, the Φ of the A1 and A2 schemes was determined to be 0.42 and 0.58, respectively. The Φ of the base scheme(B0) was 0.40 based on the logging curve in the SHR model. Because the size range of hydrate reservoir rocks at AT1 was large and small particles would fill in the pores of large particles, the Φ could not be large. The Φ of the minimum scheme (B2) was 0.30 and the Φ of the maximum scheme (B4) was 0.55. Through equal-scale interpolation, the Φ of the B1 and B3 schemes was 0.35 and 0.50, respectively.
The simulation lasted for 1 year, and the T+H code was used to calculate the VP under each scheme at any time. The sensitivity coefficient of each lithological parameter was obtained by calculating the average value through the formula S i = Δ V p / V p / Δ X i / X i . In the formula, V P is the cumulative gas production, and X i is the value of each lithological parameter. The larger the value of S i , the more sensitive the V P was to the lithological parameter. Finally, combined with the simulation process, the evolution of seepage parameters in the depressurizing production of the hydrate reservoirs under different lithology was compared and analyzed.

3.2. Effect of Hydrate Reservoir Φ on Productivity

The Φ is the ratio of the pore volume in the rock to the rock’s volume, including its pores. 
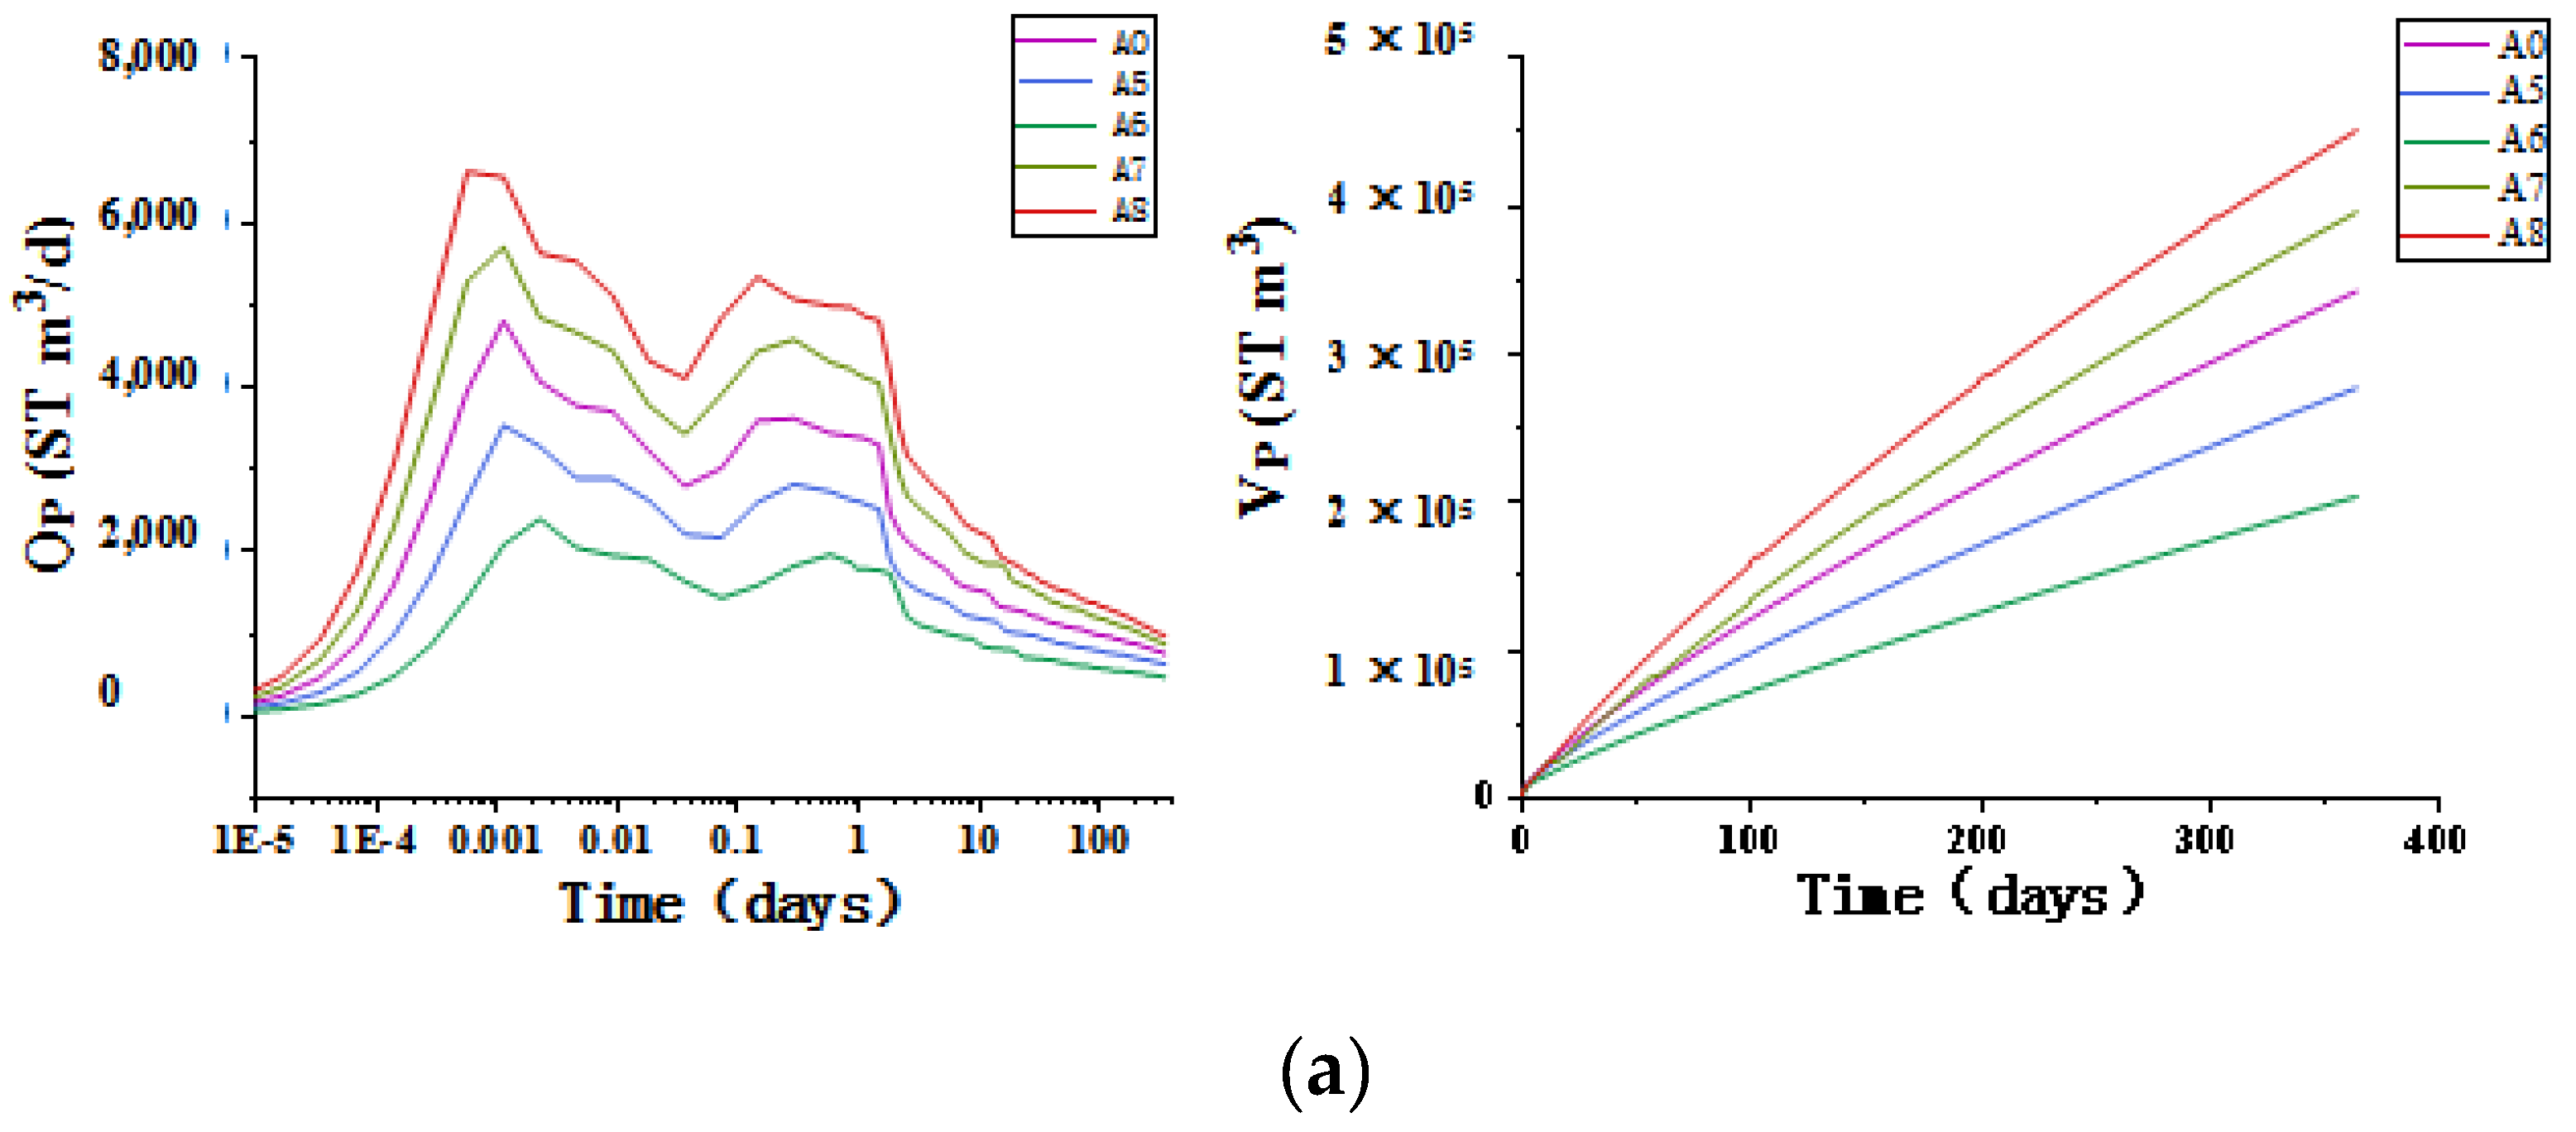
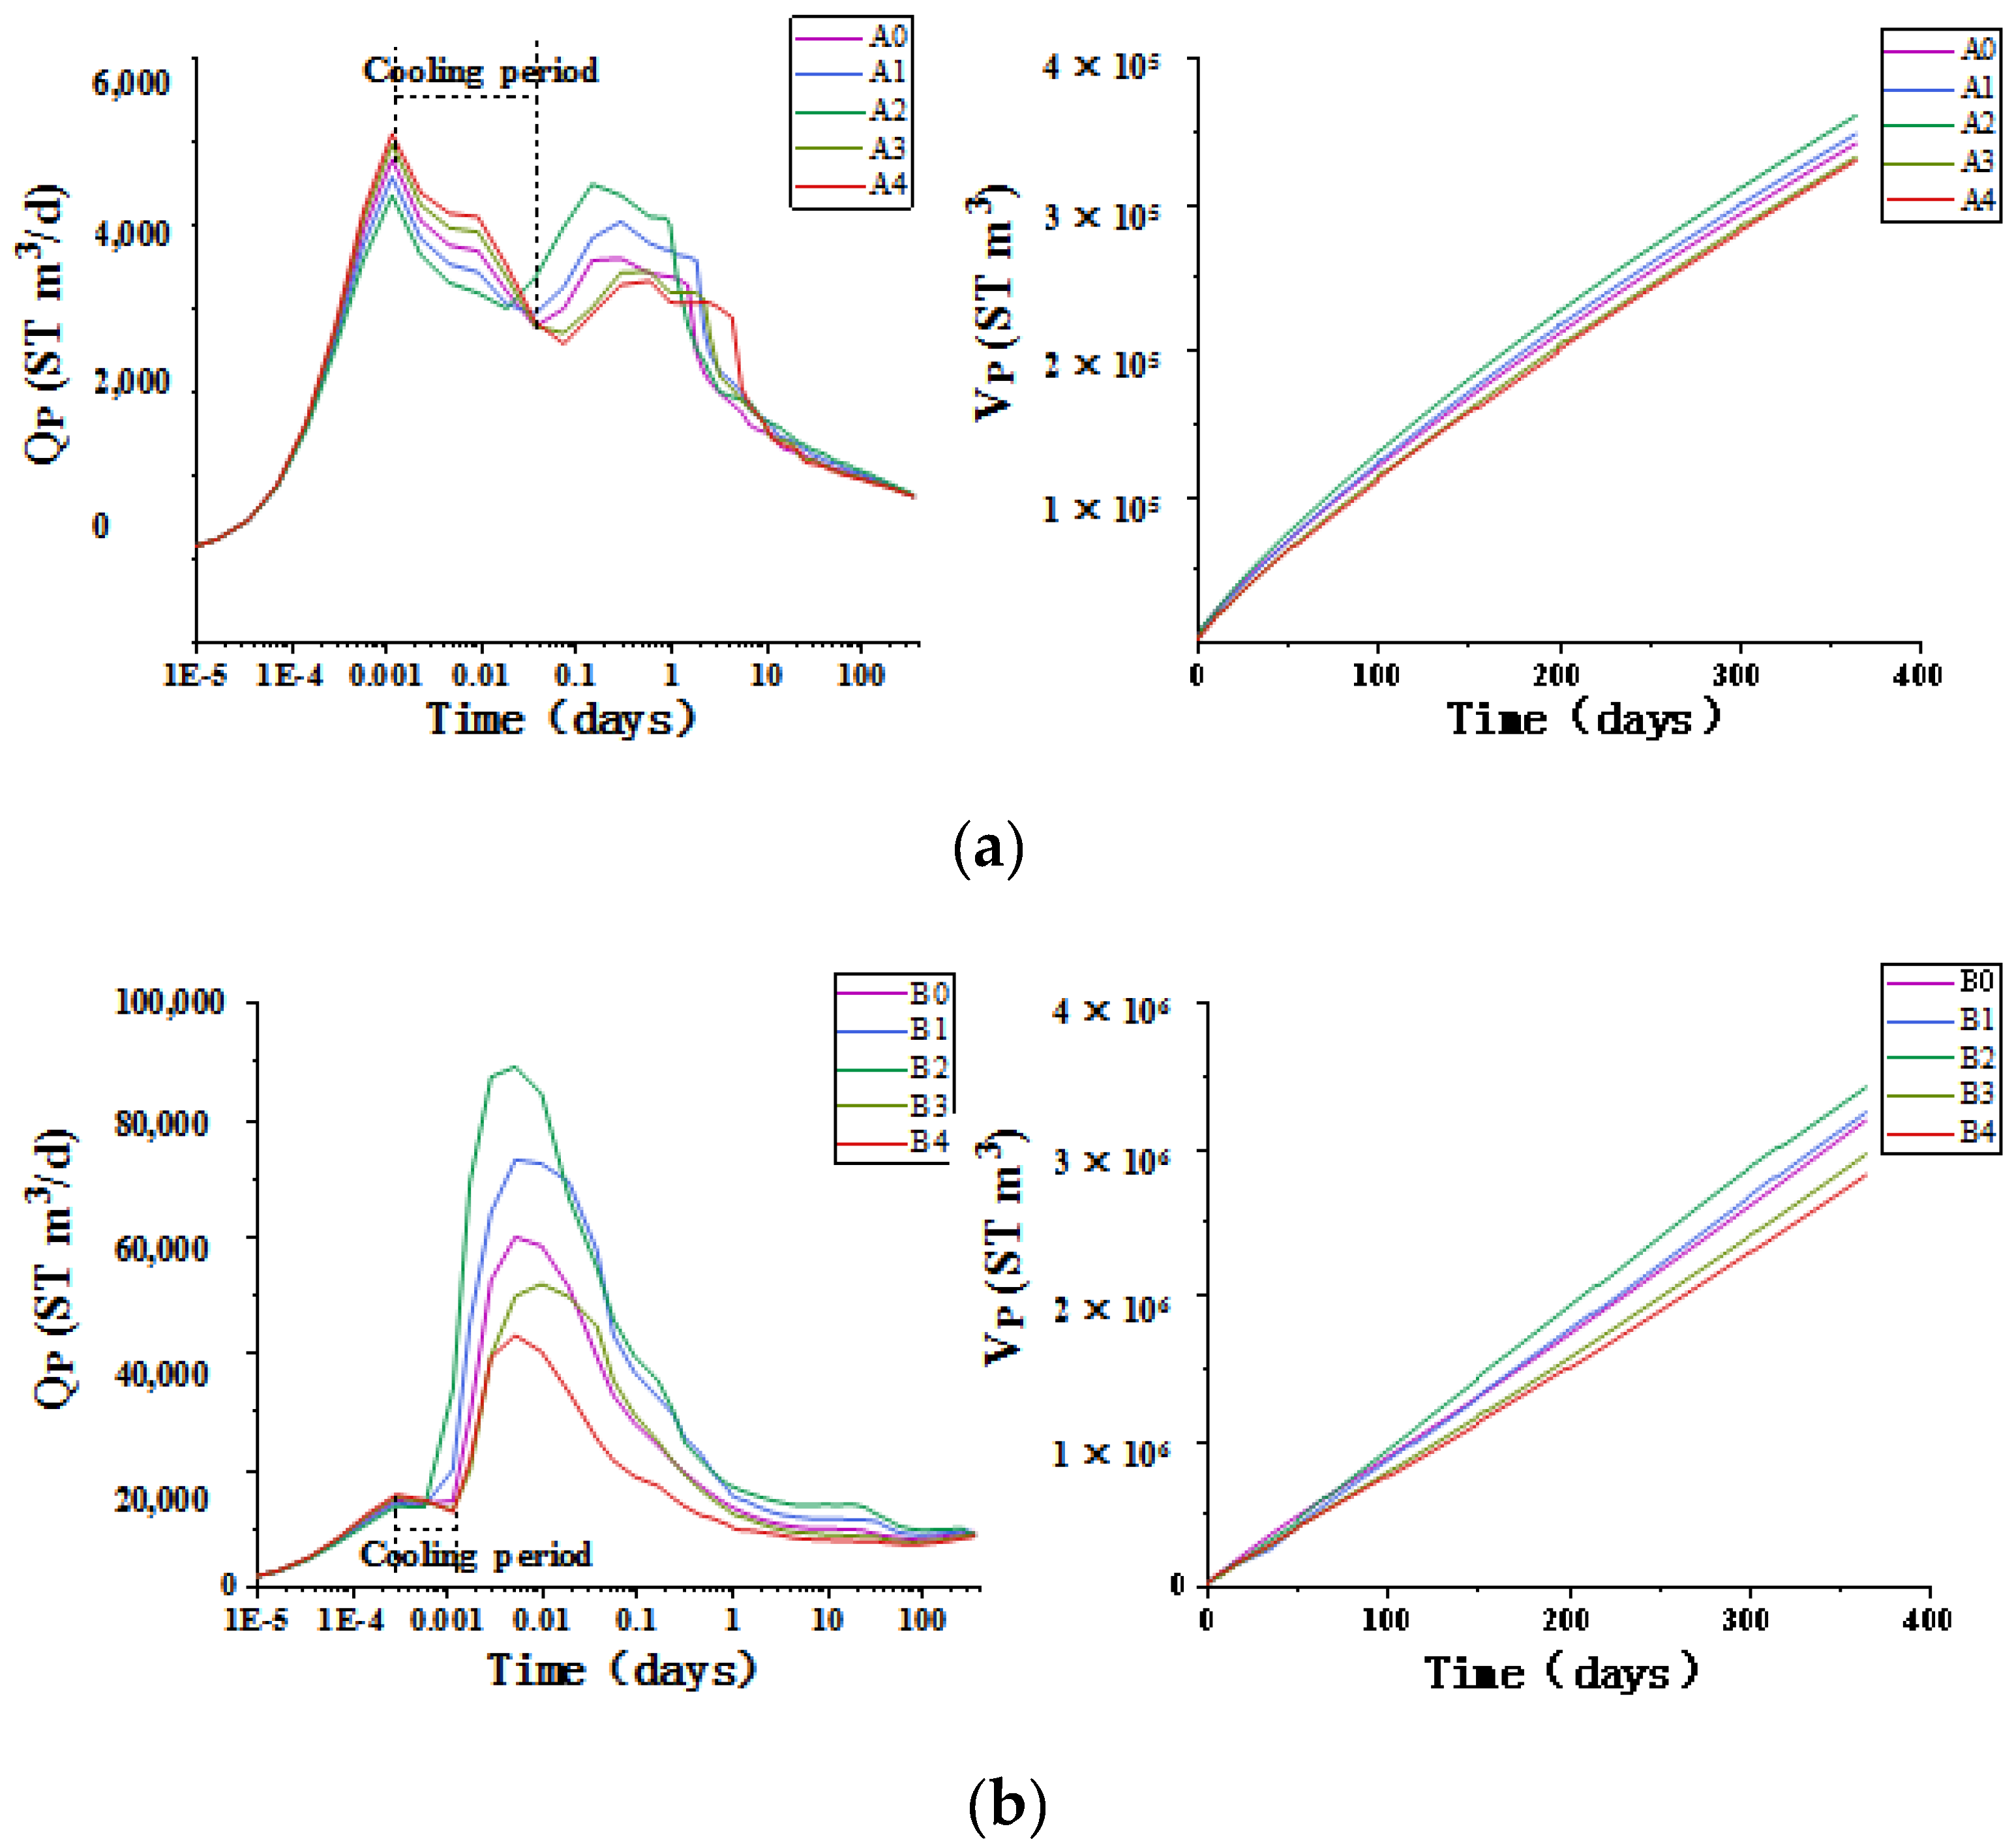
Figure 6 shows that the trend in the volumetric rate of methane (QP) obtained by the different schemes was similar. In the early stage of depressurization, the huge pressure-drop made a large amount of hydrate decompose quickly, and the QP soon reached first peak. Due to the decrease of temperature around the well, hydrate exploitation was limited, and the QP first time declined. As the temperature in the cooling area recovered, there is enough heat to supply hydrate decomposition, the QP rose to second peak. Because of the pressure-drop transmission and the decomposition of hydrate around the well, the QP decreased sharply to reach a steady value. With the exploitation of hydrate, the VP increased monotonically increasing. There was a rapid increase in the early stage, but it tended to increase at a uniform speed in the later stage.
The trend of VP depends on the decomposition process of hydrate. The SHR has larger the sensible heat and the heat conduction velocity, and the hydrate decomposition is less limited by heat supply, so the VP of SHR following straight. The sensible heat and the heat conduction velocity of CHR is weaker, and the heat supply becomes more and more difficult, the growth of the hydrate exploitation slows down, so the VP of CHR following convex curve.
Porosity impacts on reservoir productivity by affecting both the solid framework and hydrate content per unit volume. In the CHR model, taking 1 h as the dividing line, the greater the Φ was before this time point, the great the hydrate content per unit volume. More hydrate decomposed due to the pressure-drop at the higher QP and VP values. A large hydrate decomposition would lead to a sharp drop in the temperature around the mining well, which would not be conducive to subsequent hydrate exploitation. A cooling period (the period in Figure 6 in which the QP first declined and then increased) would occur. The heat absorbed was mainly the sensible heat of the reservoir and heat transferred from the overburden and underburned layers. A reservoir with low Φ can provide more heat to replenish the cooling zone and encourage the pressure-drop to spread more rapidly. Therefore, at the end of the simulation the lowest Φ was associated with the highest QP and VP. On the basis of the A0 base case, the VP of each Φ scheme A1–A4 changed by +2.0%, +5.6%, −2.7%, and −3.4%, respectively. In the SHR, because there was rapid heat conduction and convection, a low Φ was always associated with a high QP and VP in the simulation period. At the end of the simulation, on the basis of the B0 base case, the VP of each Φ scheme B1–B4 changed by +1.8%, +5.1%, −7.1%, and −11.6%, respectively. Table 6 shows the sensitivity of productivity to Φ.
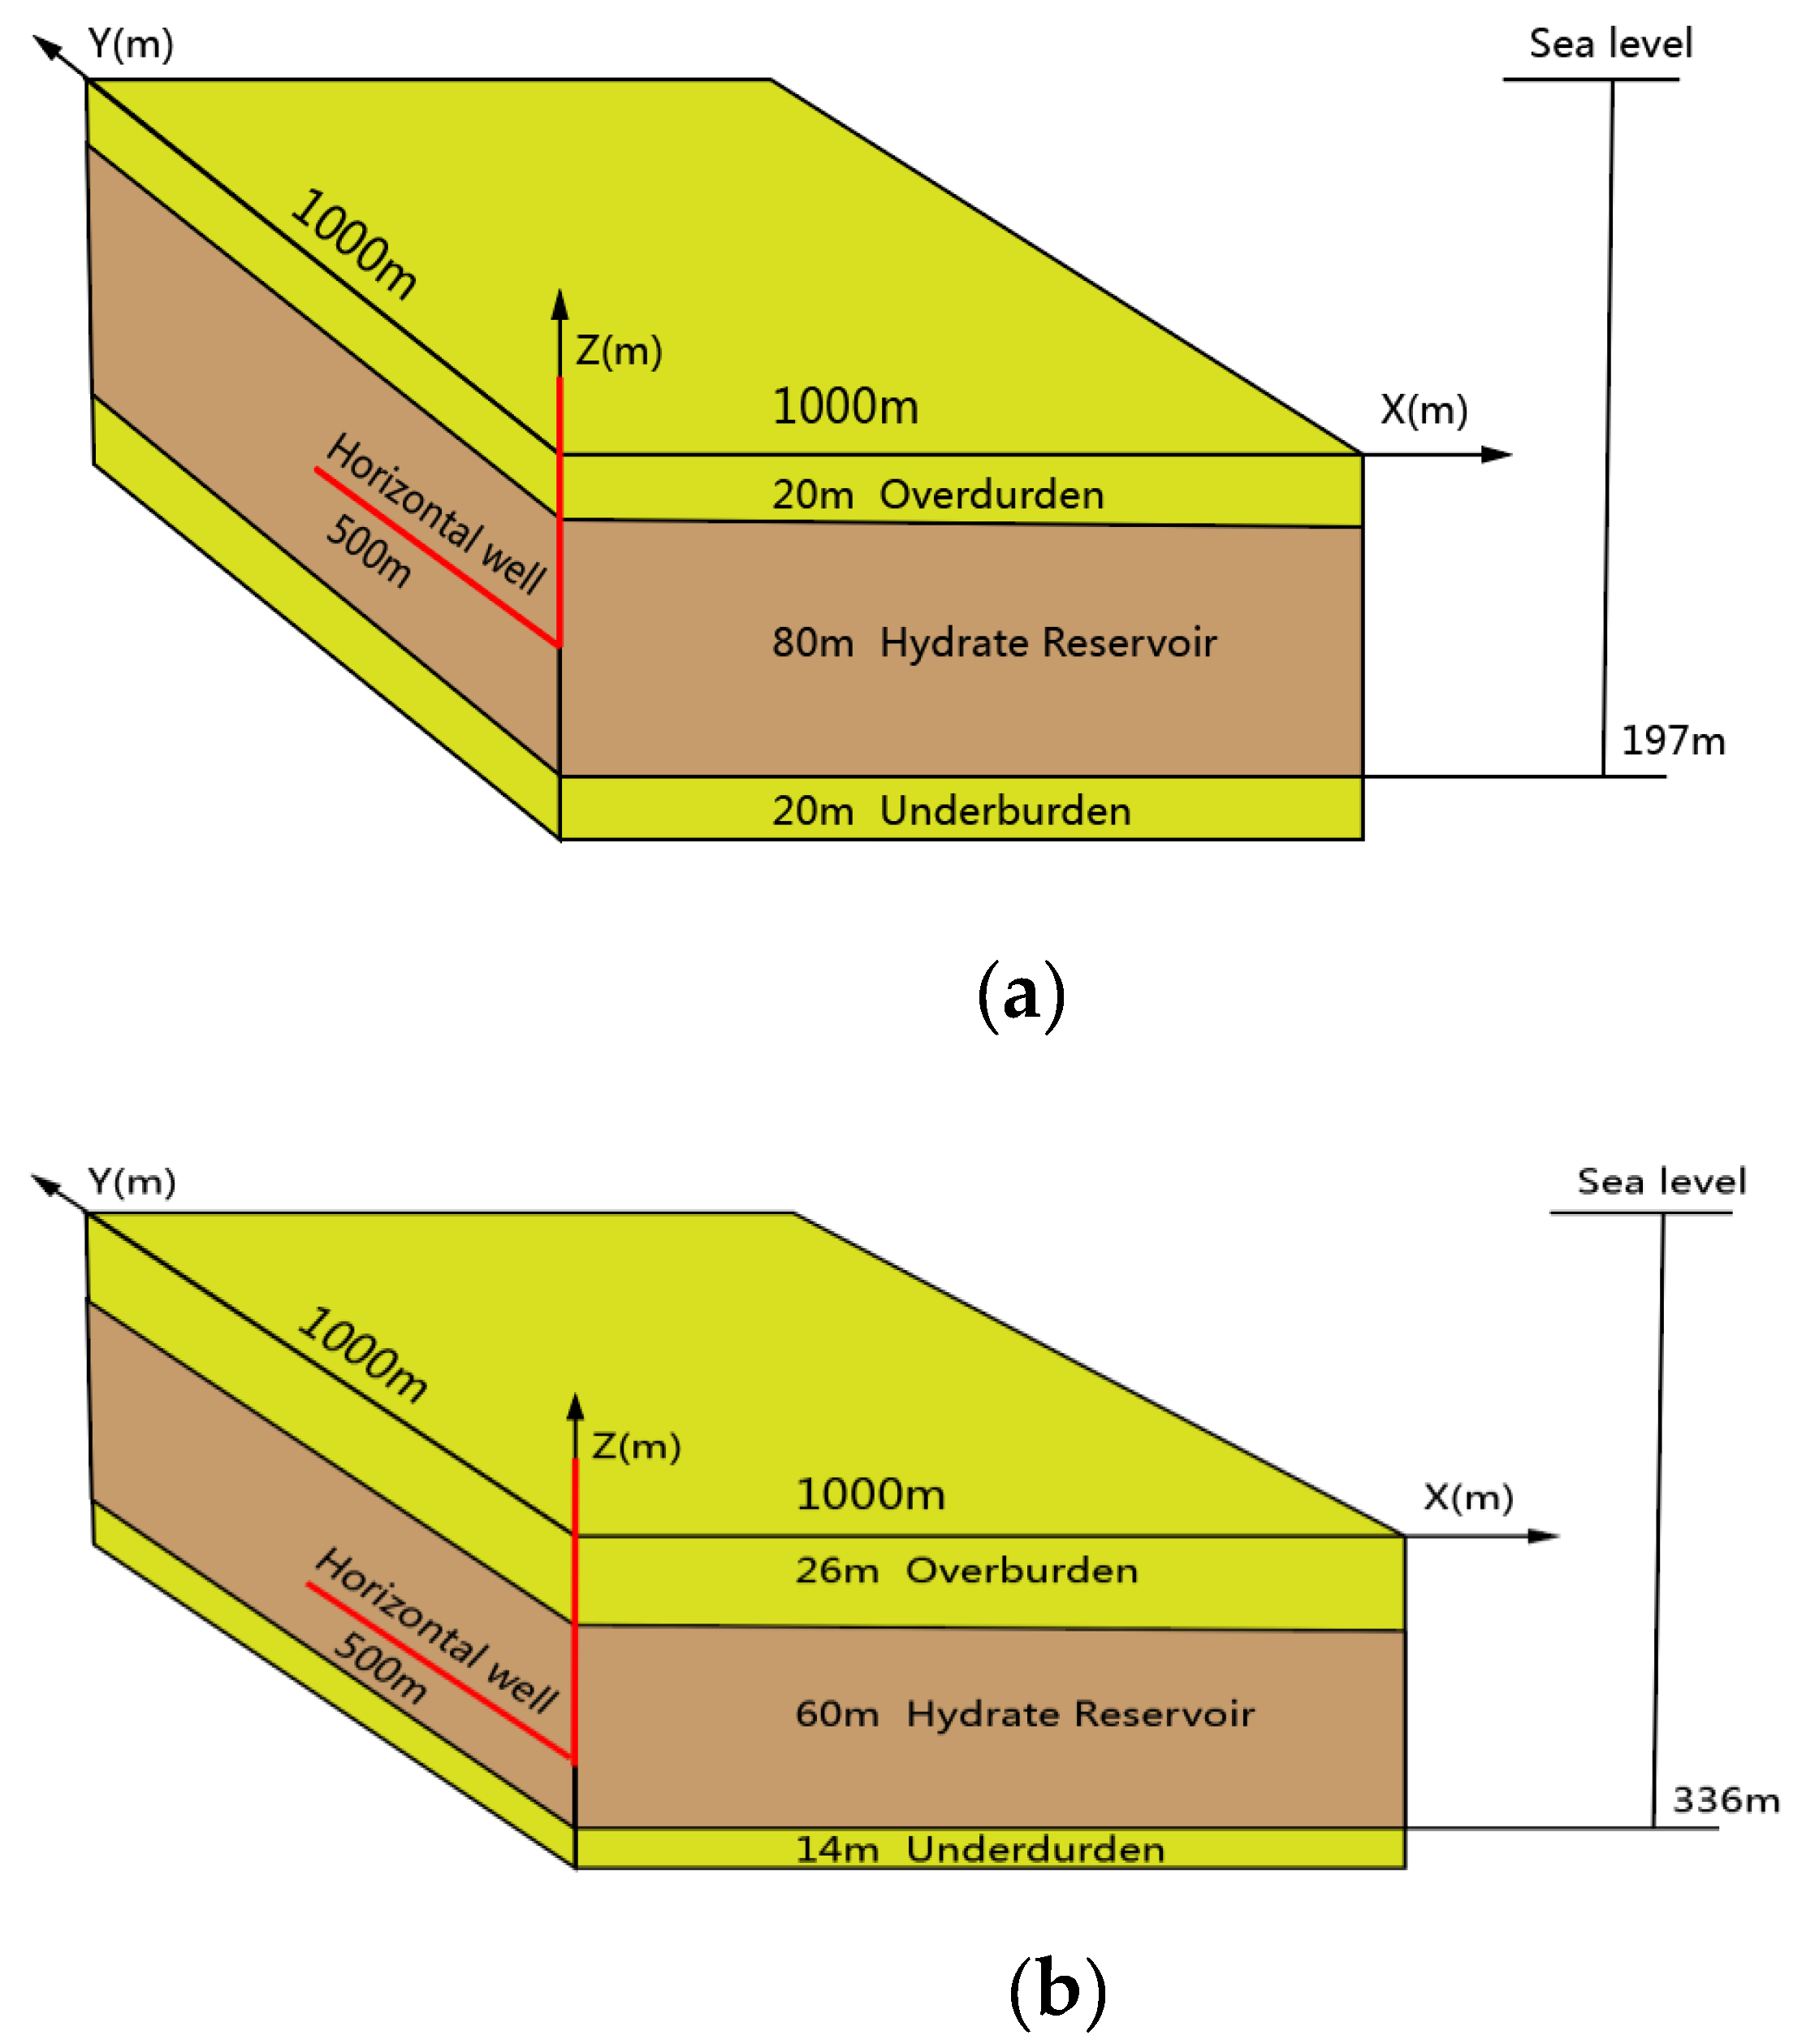
At W11 in the South China Sea, the CHR was characterized by high Φ, with an average Φ of about 0.5. The average Φ of the SHR in Nankai Trough in Japan was about 0.4. The Φ of the SHR was relatively smaller than the Φ of CHR, and therefore the SHR provided more sensible heat, and had the characteristics of rapid heat conduction and convection. The problem of the rapid decrease of temperature inhibiting hydrate production was therefore less serious in the SHR. This phenomenon is shown in Figure 6, which indicated that the cooling period was longer in the CHR than in the SHR. Overall, the heat conduction and convection ability of the CHR were weaker than for the SHR, which made it difficult to recover the low-temperature area caused by hydrate decomposition in a timely manner. Therefore, technical methods need to be considered to ensure the formation of warming around the well.

3.3. Effect of Hydrate Reservoir k on Productivity

Permeability is a parameter that characterizes a reservoir’s ability to transport water or other fluids. It depends only on the rock’s characteristics and not dependent on the properties of the liquid flowing through it.
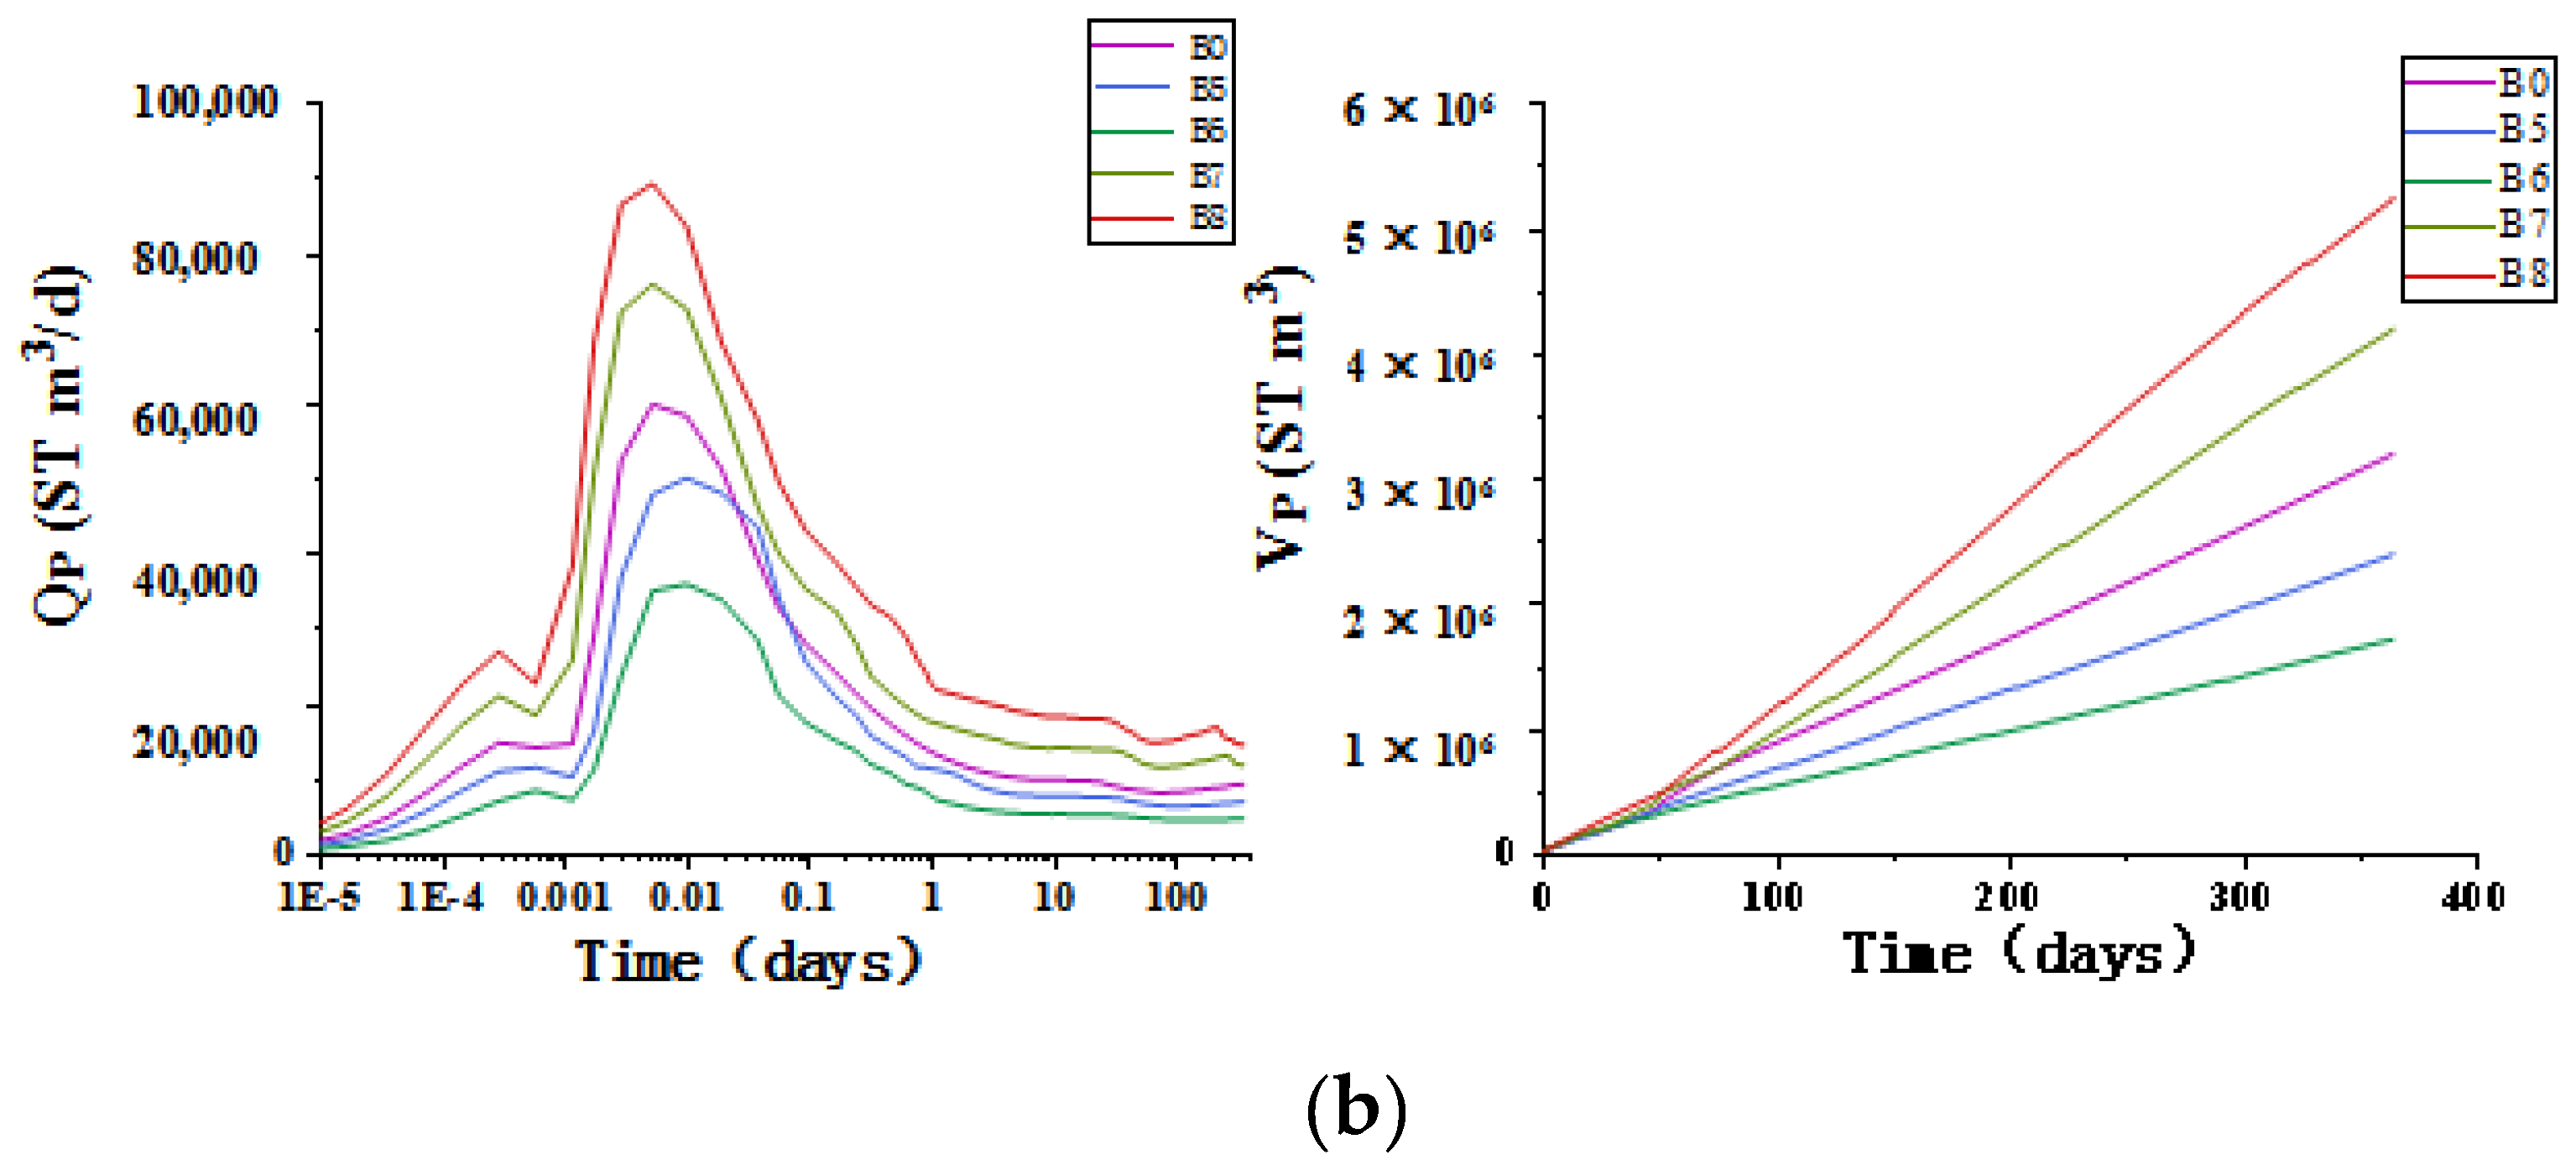
Permeability affects reservoir productivity by affecting both the propagation velocity of the pressure-drop and the discharge velocity of methane gas. On the one hand, the larger the k, the larger the spatial extent of the pressure-drop will be, and the more hydrates will be decomposed. On the other hand, with an increase in k, the decomposed methane gas can be discharged more quickly. Otherwise, the increase in the free gas concentration would maintain a certain pressure inside the reservoir. This would reduce the actual pressure difference between the reservoir and the producing well, which is not conducive to hydrate decomposition. A high k was always associated with high QP and VP in both the CHR and SHR. As shown in Figure 7, on the basis of the A0 base case, the VP of each k scheme A5–A8 changed by −19.1%, −40.6%, +15.7%, and +31.9% in the CHR, respectively. On the basis of the B0 base case, the VP of each k scheme B5–B8 changed by −25.0%, −46.3%, +31.5%, and +64.3% in the SHR, respectively. Table 7 shows the sensitivity of productivity to k.
The k of the CHR at W11 in the South China Sea ranged from serval to tens of mD, which resulted in a slow thermal convection and heat conduction velocity. When the k was high, the sensible heat supply from the distant reservoir reached the area around the production well, which then rapidly cooled due to the large amount of hydrate decomposition. These conditions were conducive to hydrate recovery. The k of the SHR in the Nankai Trough in Japan ranged from tens to thousands of mD. The gas production of the hydrate reservoir in the South China Sea was therefore more severely restricted by k. This was the main reason why the VP of W11 in China was far less than that of AT1 in Japan in the same period. Therefore, during the exploitation of the clayey silt hydrate reservoir in the South China Sea, some measures of reservoir reconstruction that could greatly increase the k of the hydrate reservoir were required.

3.4. Effect of Reservoir SH on Productivity

Hydrate saturation is the ratio of the concentrations of gas hydrate’s and saturated gas hydrates, and is also expressed as the ratio of the volume of gas hydrates in the reservoir pores to the pore volume. It reflects the abundance of hydrates in the pores of the reservoir.
The S
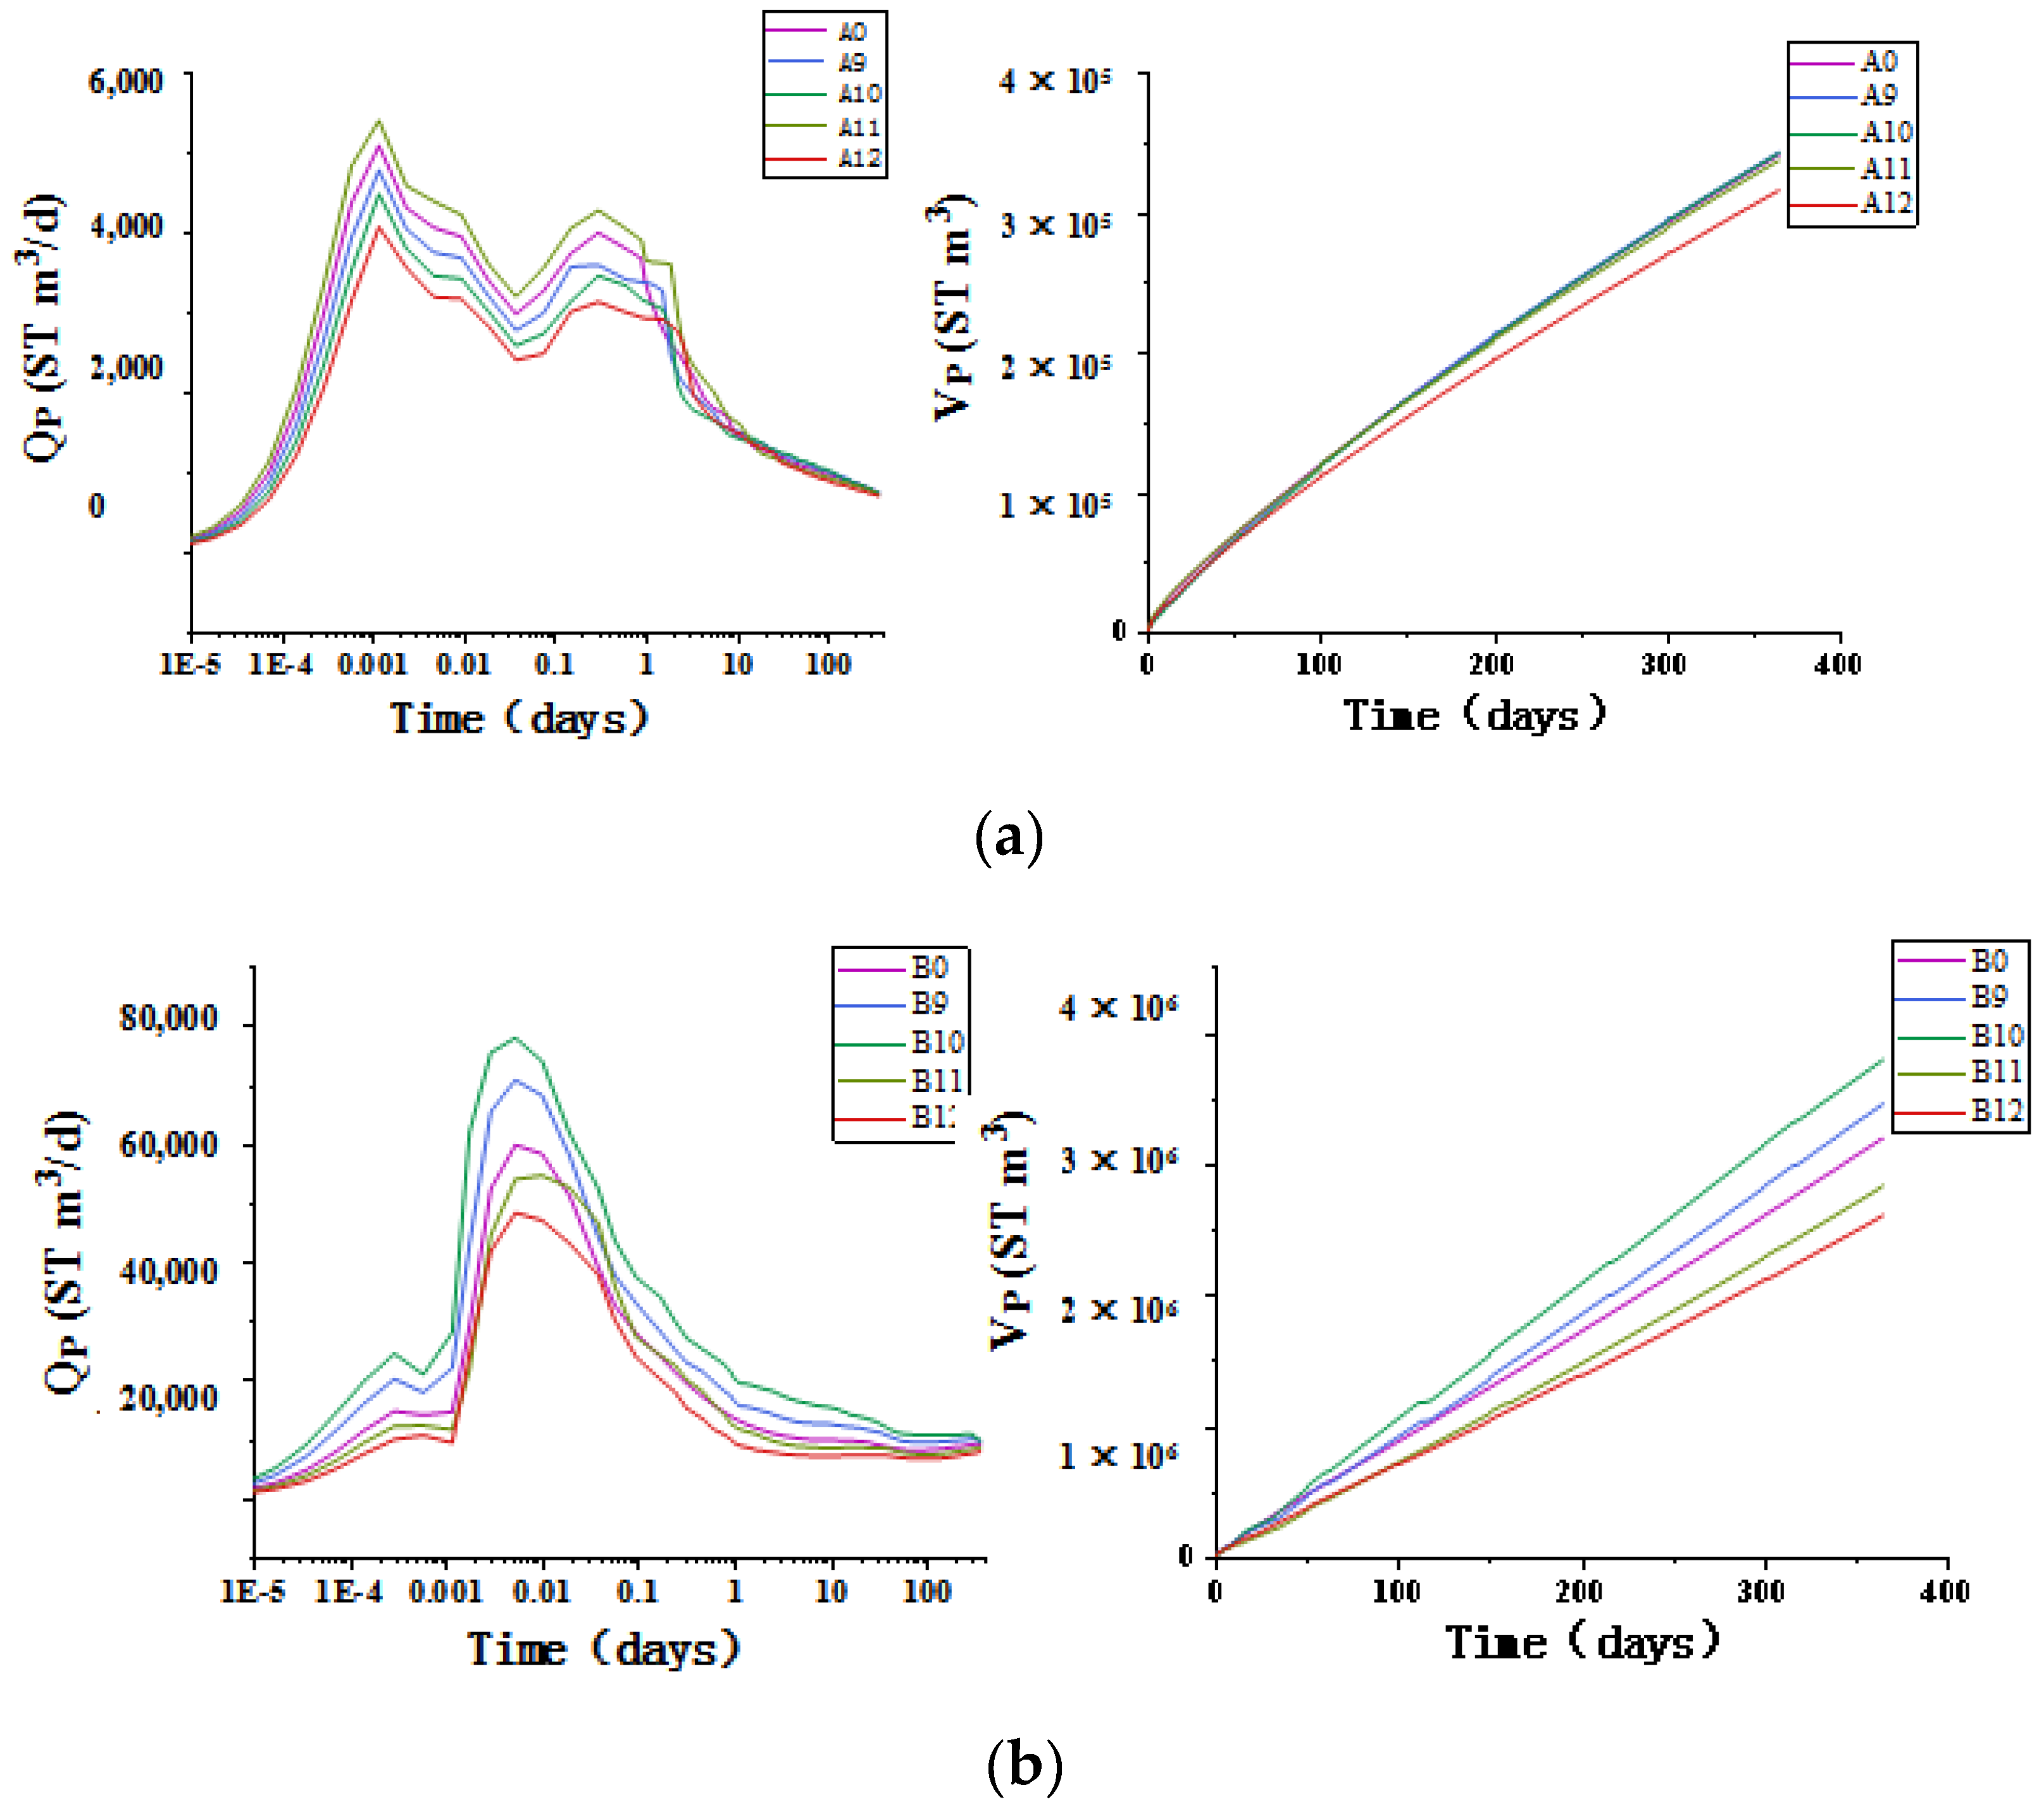
H affects reservoir productivity by impacting on both the hydrate content per unit volume and the seepage capacity. As shown in Figure 8, taking 125 days as the dividing line in the CHR, the higher the SH is before this time point, the more hydrates were decomposed around the wellbore. The decomposed gas could be discharged more rapidly at higher QP and VP values. However, led to a significant decrease in the temperature around the wellbore, resulting in a larger cooling period. It is not therefore conducive to subsequent hydrate exploitation. When more of the effective pores were occupied the k decreased, which was not conducive to a further pressure-drop transmission, and the methane gas could not be discharged rapidly in the later stage. The lower the k in the undecomposed zone of hydrates, the more unfavorable the transmission of the pressure-drop and gas discharge. Therefore, at the end of the simulation the lowest SH was associated with the highest QP and VP values. On the basis of the A0 base case, the VP of each SH scheme A9–A12 changed by +0.6%, +0.3%, −1.2%, and −7.4%, respectively. In the SHR, due to the high SH, there was enough hydrate in the reservoir for production during the simulation period. The seepage capacity had large influence on hydrates decomposition, and therefore the lowest SH was always associated with the highest QP and VP. At the end of the simulation, on the basis of the B0 base case, the VP of each SH scheme B9–B12 changed by +8.3%, +18.9%, −11.3%, and −18.3%, respectively. Table 8 shows the sensitivity of productivity to SH.
The higher SH in the early stage of exploitation was conducive to the greater QP and VP in the CHR, but the VP under the A12 scheme with the highest SH was always the lowest among all schemes. This was because a SH that was too large would severely reduce the seepage capacity of the reservoir and slow down the rate of the pressure-drop transmission and methane gas discharge. Therefore, the SH had an influence on productivity only over a certain SH range.
The SH of the CHR at W11 in the South China Sea was about 0.28, while the SH of the SHR in the Nankai Trough in Japan was about 0.51. The SH of the CHR was smaller than that of the SHR. Therefore, when the SH decreased in the CHR, the amount of hydrate decomposition decreased within 125 days, and therefore the productivity was still low despite the timely heat supply. Due to the rapid supply of sensible heat, the cooling period become shorter, and therefore the reservoir productivity of the CHR improved after 125 days. The SH of the SHR was high, and even if it decreased, there would still be enough hydrate for exploitation. The heat transfer was improved at a lower SH. Therefore, a low SH was always associated with a high QP and VP in the SHR. In summary, to assess the reservoir exploitation potential of both the CHR in the Shenhu Sea area of the South China Sea and the SHR in the Eastern Nankai Trough of Japan there is a need to not only rely on the hydrate content or seepage capacity to judge the reservoir exploitation potential, but also to fully consider the combined effect of the two.
In addition, considering that the significance of the SH was related to the total amount of hydrate in the reservoir, and the amount of hydrate decomposed in the simulation period was small compared with the total amount of hydrate in the reservoir, the SH mainly affected productivity by affecting the k and thermal performance of the reservoir. Over a long time-scale, as hydrate was gradually exhausted, the SH mainly affected the productivity of the hydrate reservoir by determining the hydrate content of the reservoir. At this point, its degree of influence increased significantly, but on the other hand the higher SH could increase reservoir productivity.

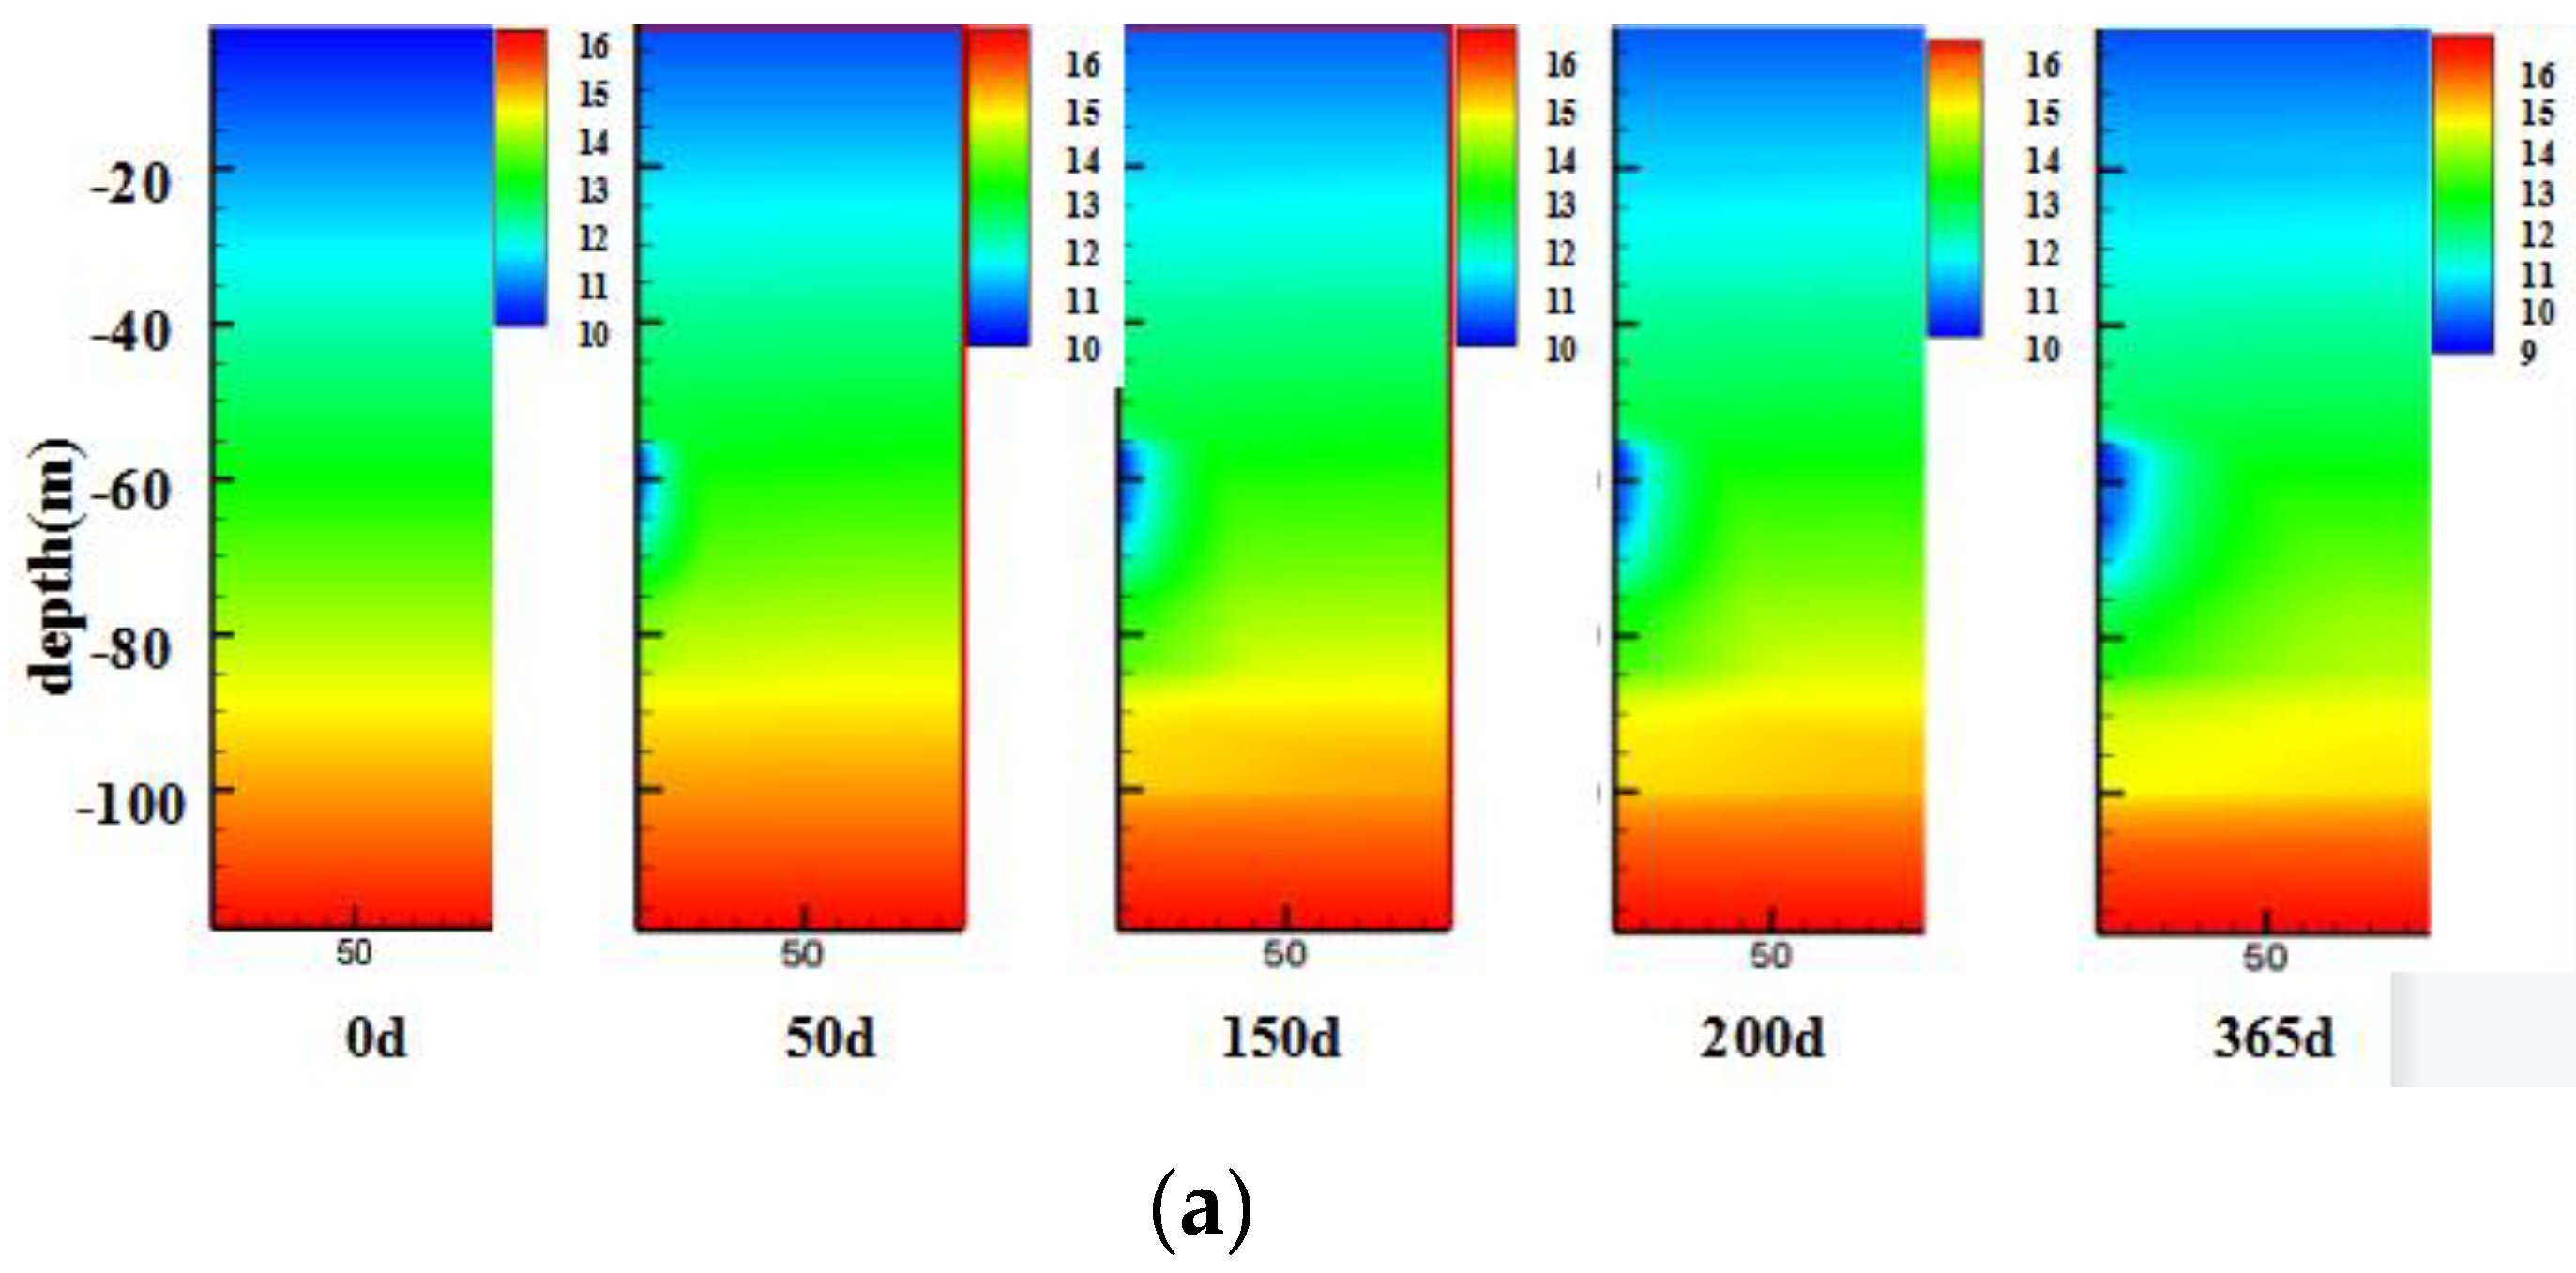
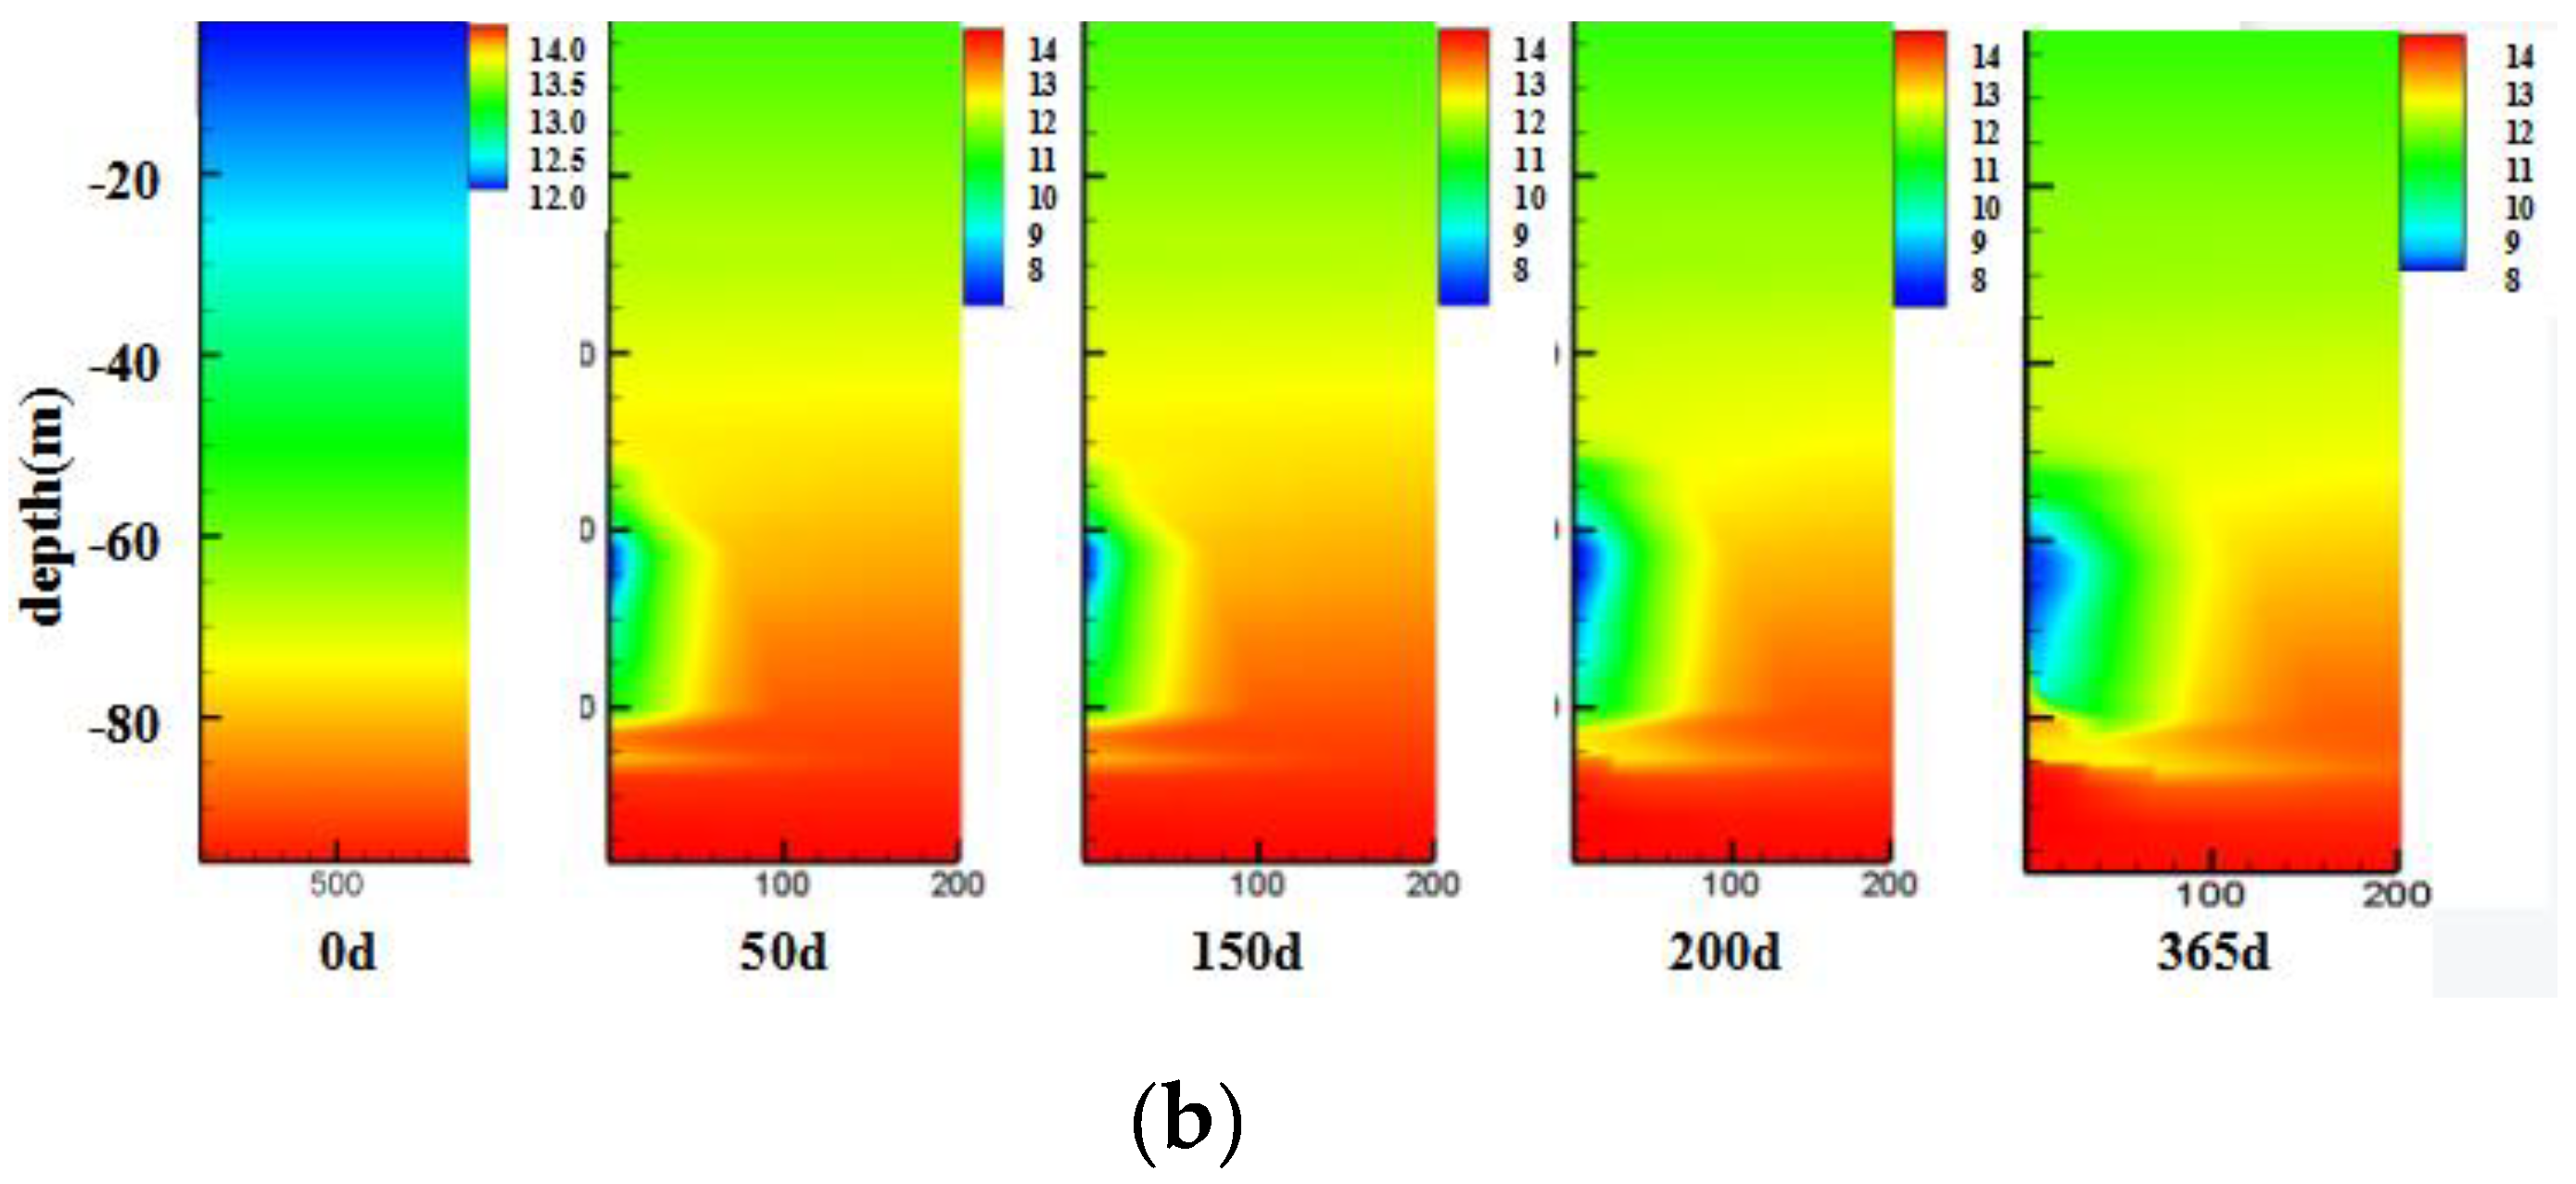
3.5. Spatial Evolution of Seepage Parameters in the Process of Production

Unlike a homogeneous simulation model, in which all geological parameters are averaged, a heterogeneous simulation model can better describe the heterogeneous structure of the formation and reflect the actual characteristics of the parameters [42]. In an actual hydrate reservoir, there are areas with relatively good k and other areas with relatively poor k. The rapid transmission of the pressure drawdown in the areas with good k will caused a large amount of hydrate decomposition and a significant decrease in reservoir temperature. In the areas with relatively poor k, the pressure drawdown 
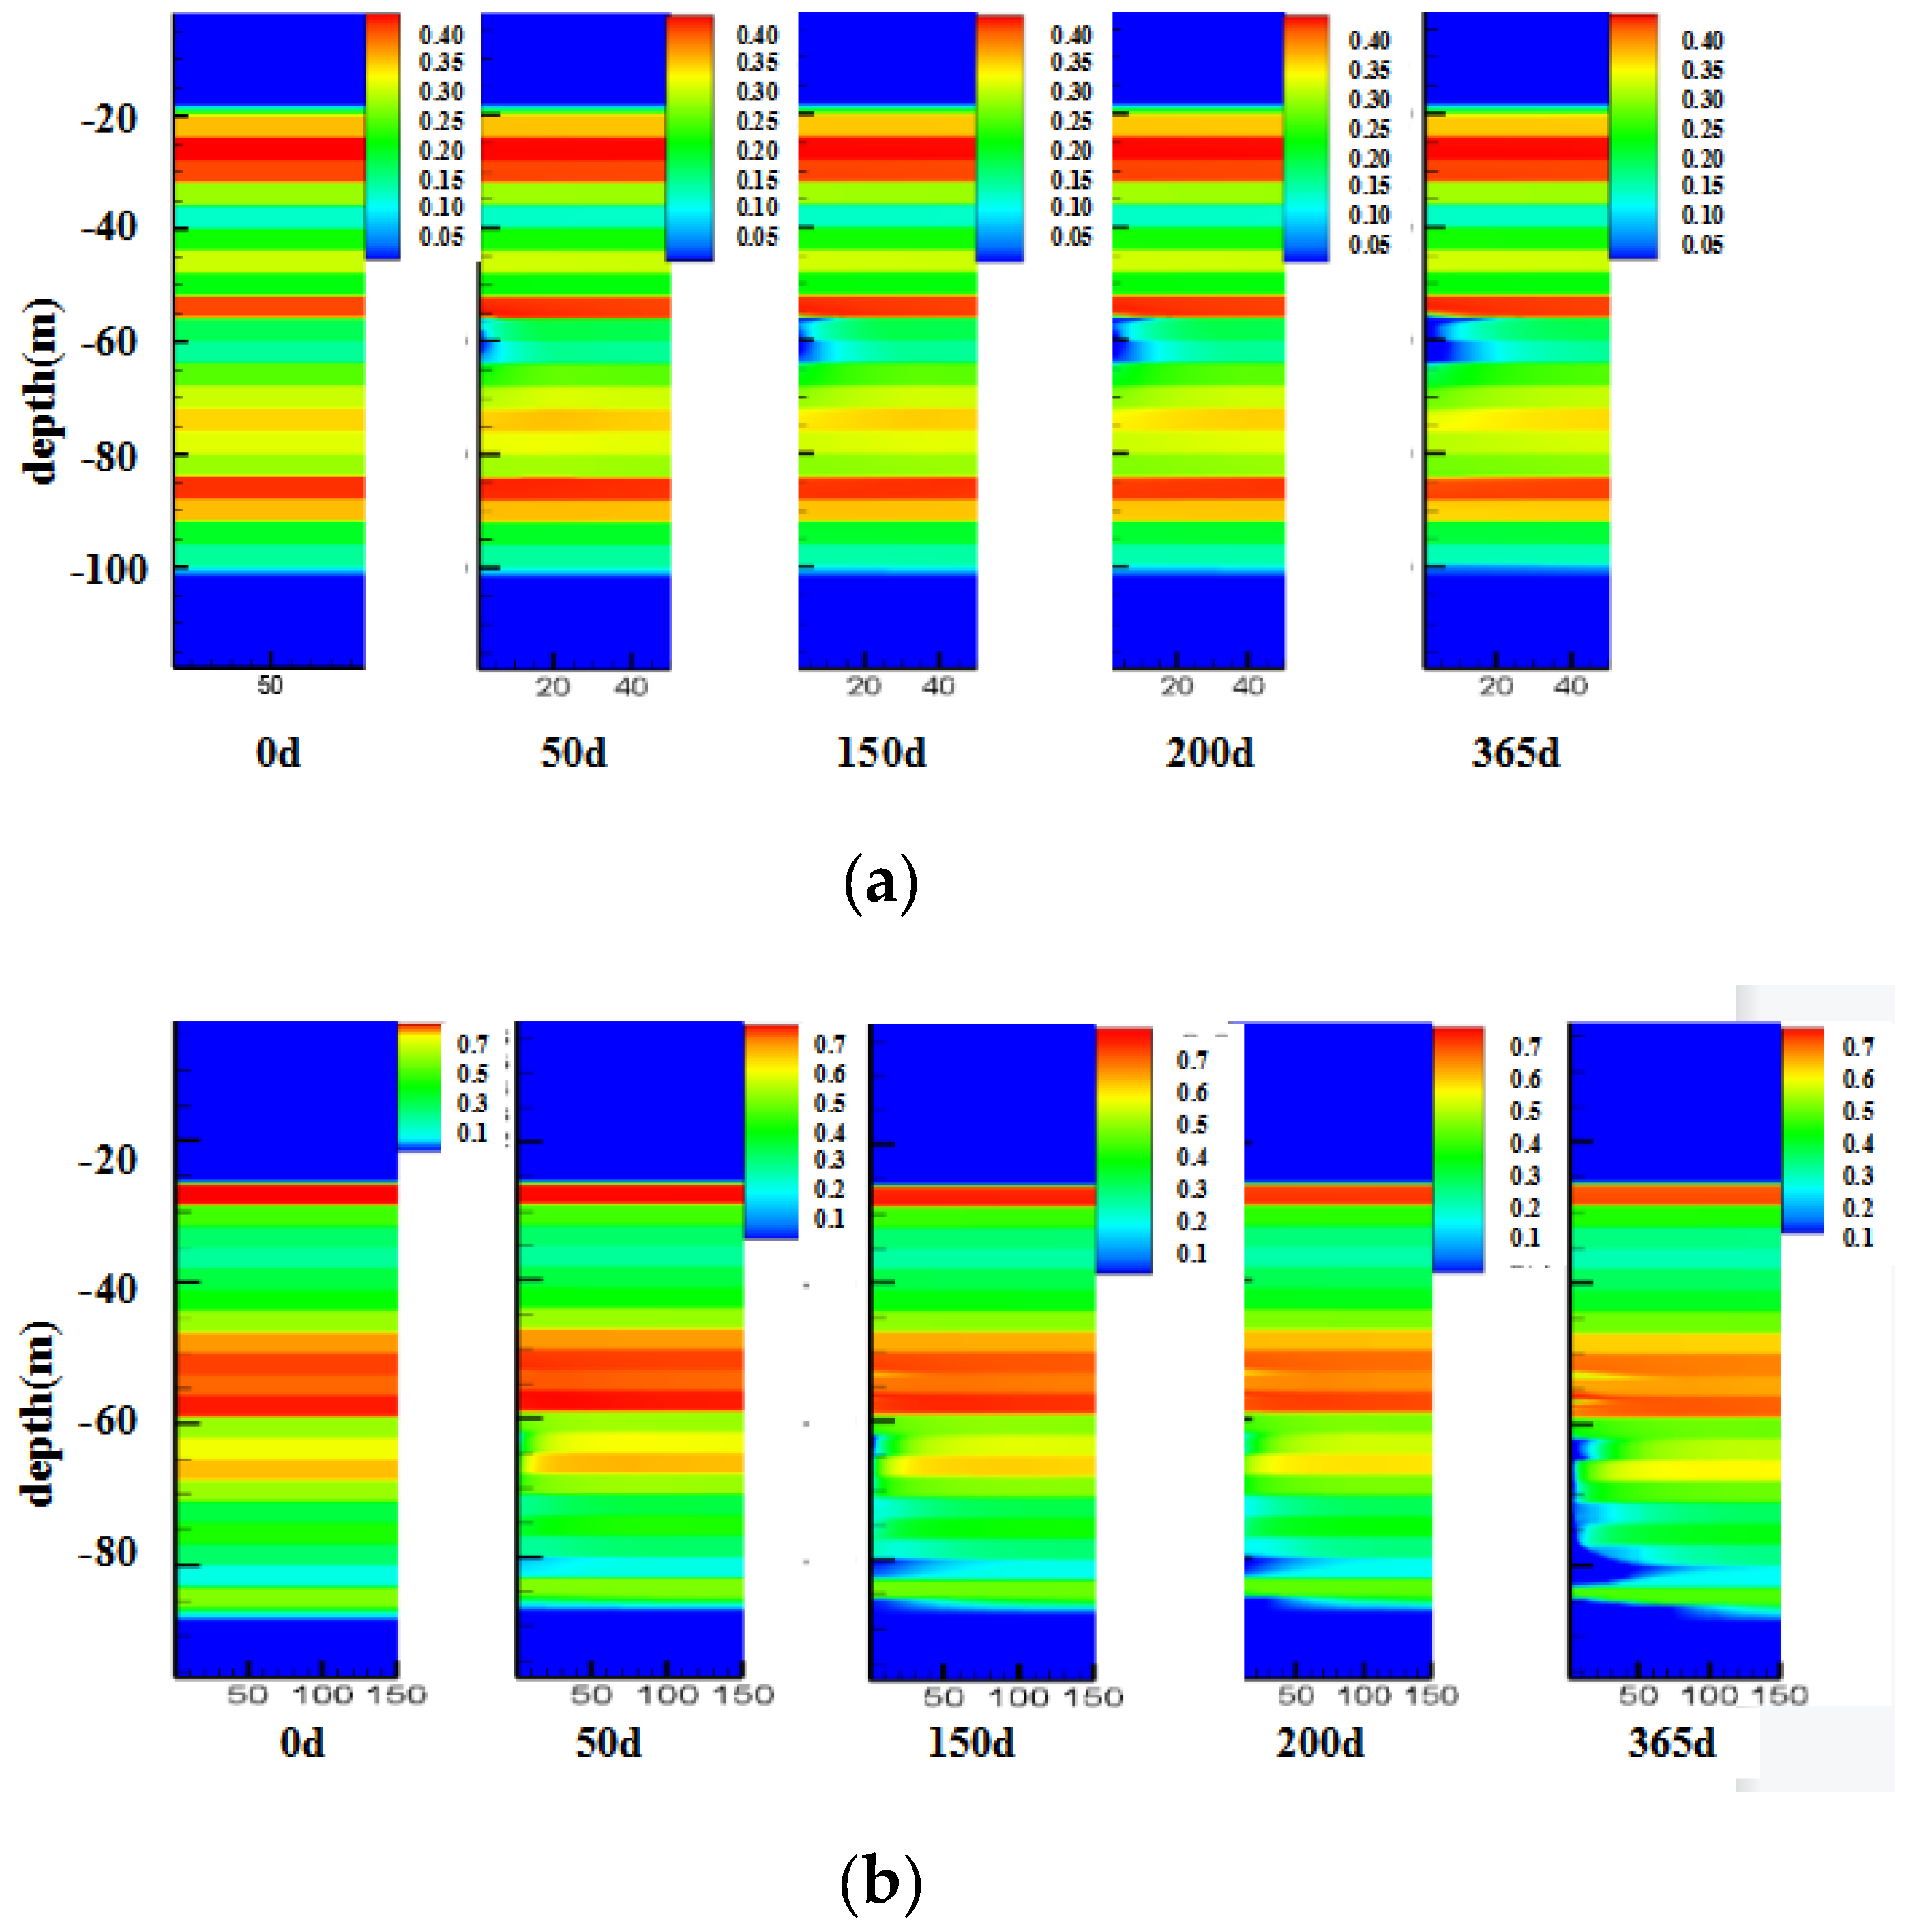
transmission was slower, and the hydrate decomposition was lower. The rock maintained higher temperature, and then the heat in the areas with relatively poor k is transferred to areas with relatively high k, which further promoted hydrate decomposition in areas with high k. Therefore, as shown in Figure 9, hydrate decomposition mainly occurred along the radial direction in the perforated zone.
Both of the reservoirs had an obvious heterogeneous dissociation front of SH, which was caused by the non-uniform hydrate decomposition due to the different propagation velocities of the pressure-drop in areas with a different k. The k of the CHR varied over a small range, while the SHR was an interbedded sand-shale reservoir, with the k even reaching about 2000 mD in some sandstone areas. In some mudstone areas the k was about 5 mD, and therefore it varied by up to two orders of magnitude. The heterogeneous decomposition of hydrate caused by the non-uniform transmission of pressure drawdown was therefore more prominent in the CHR. This was apparent from the diagram showing the changes in SH. Taking Figure 9 as an example, the areas of hydrate decomposition in the CHR were relatively uniform, while the areas of hydrate decomposition in the SHR had a stronger heterogeneity, and the front of hydrate decomposition extended for more than 100 m in some layers at the end.
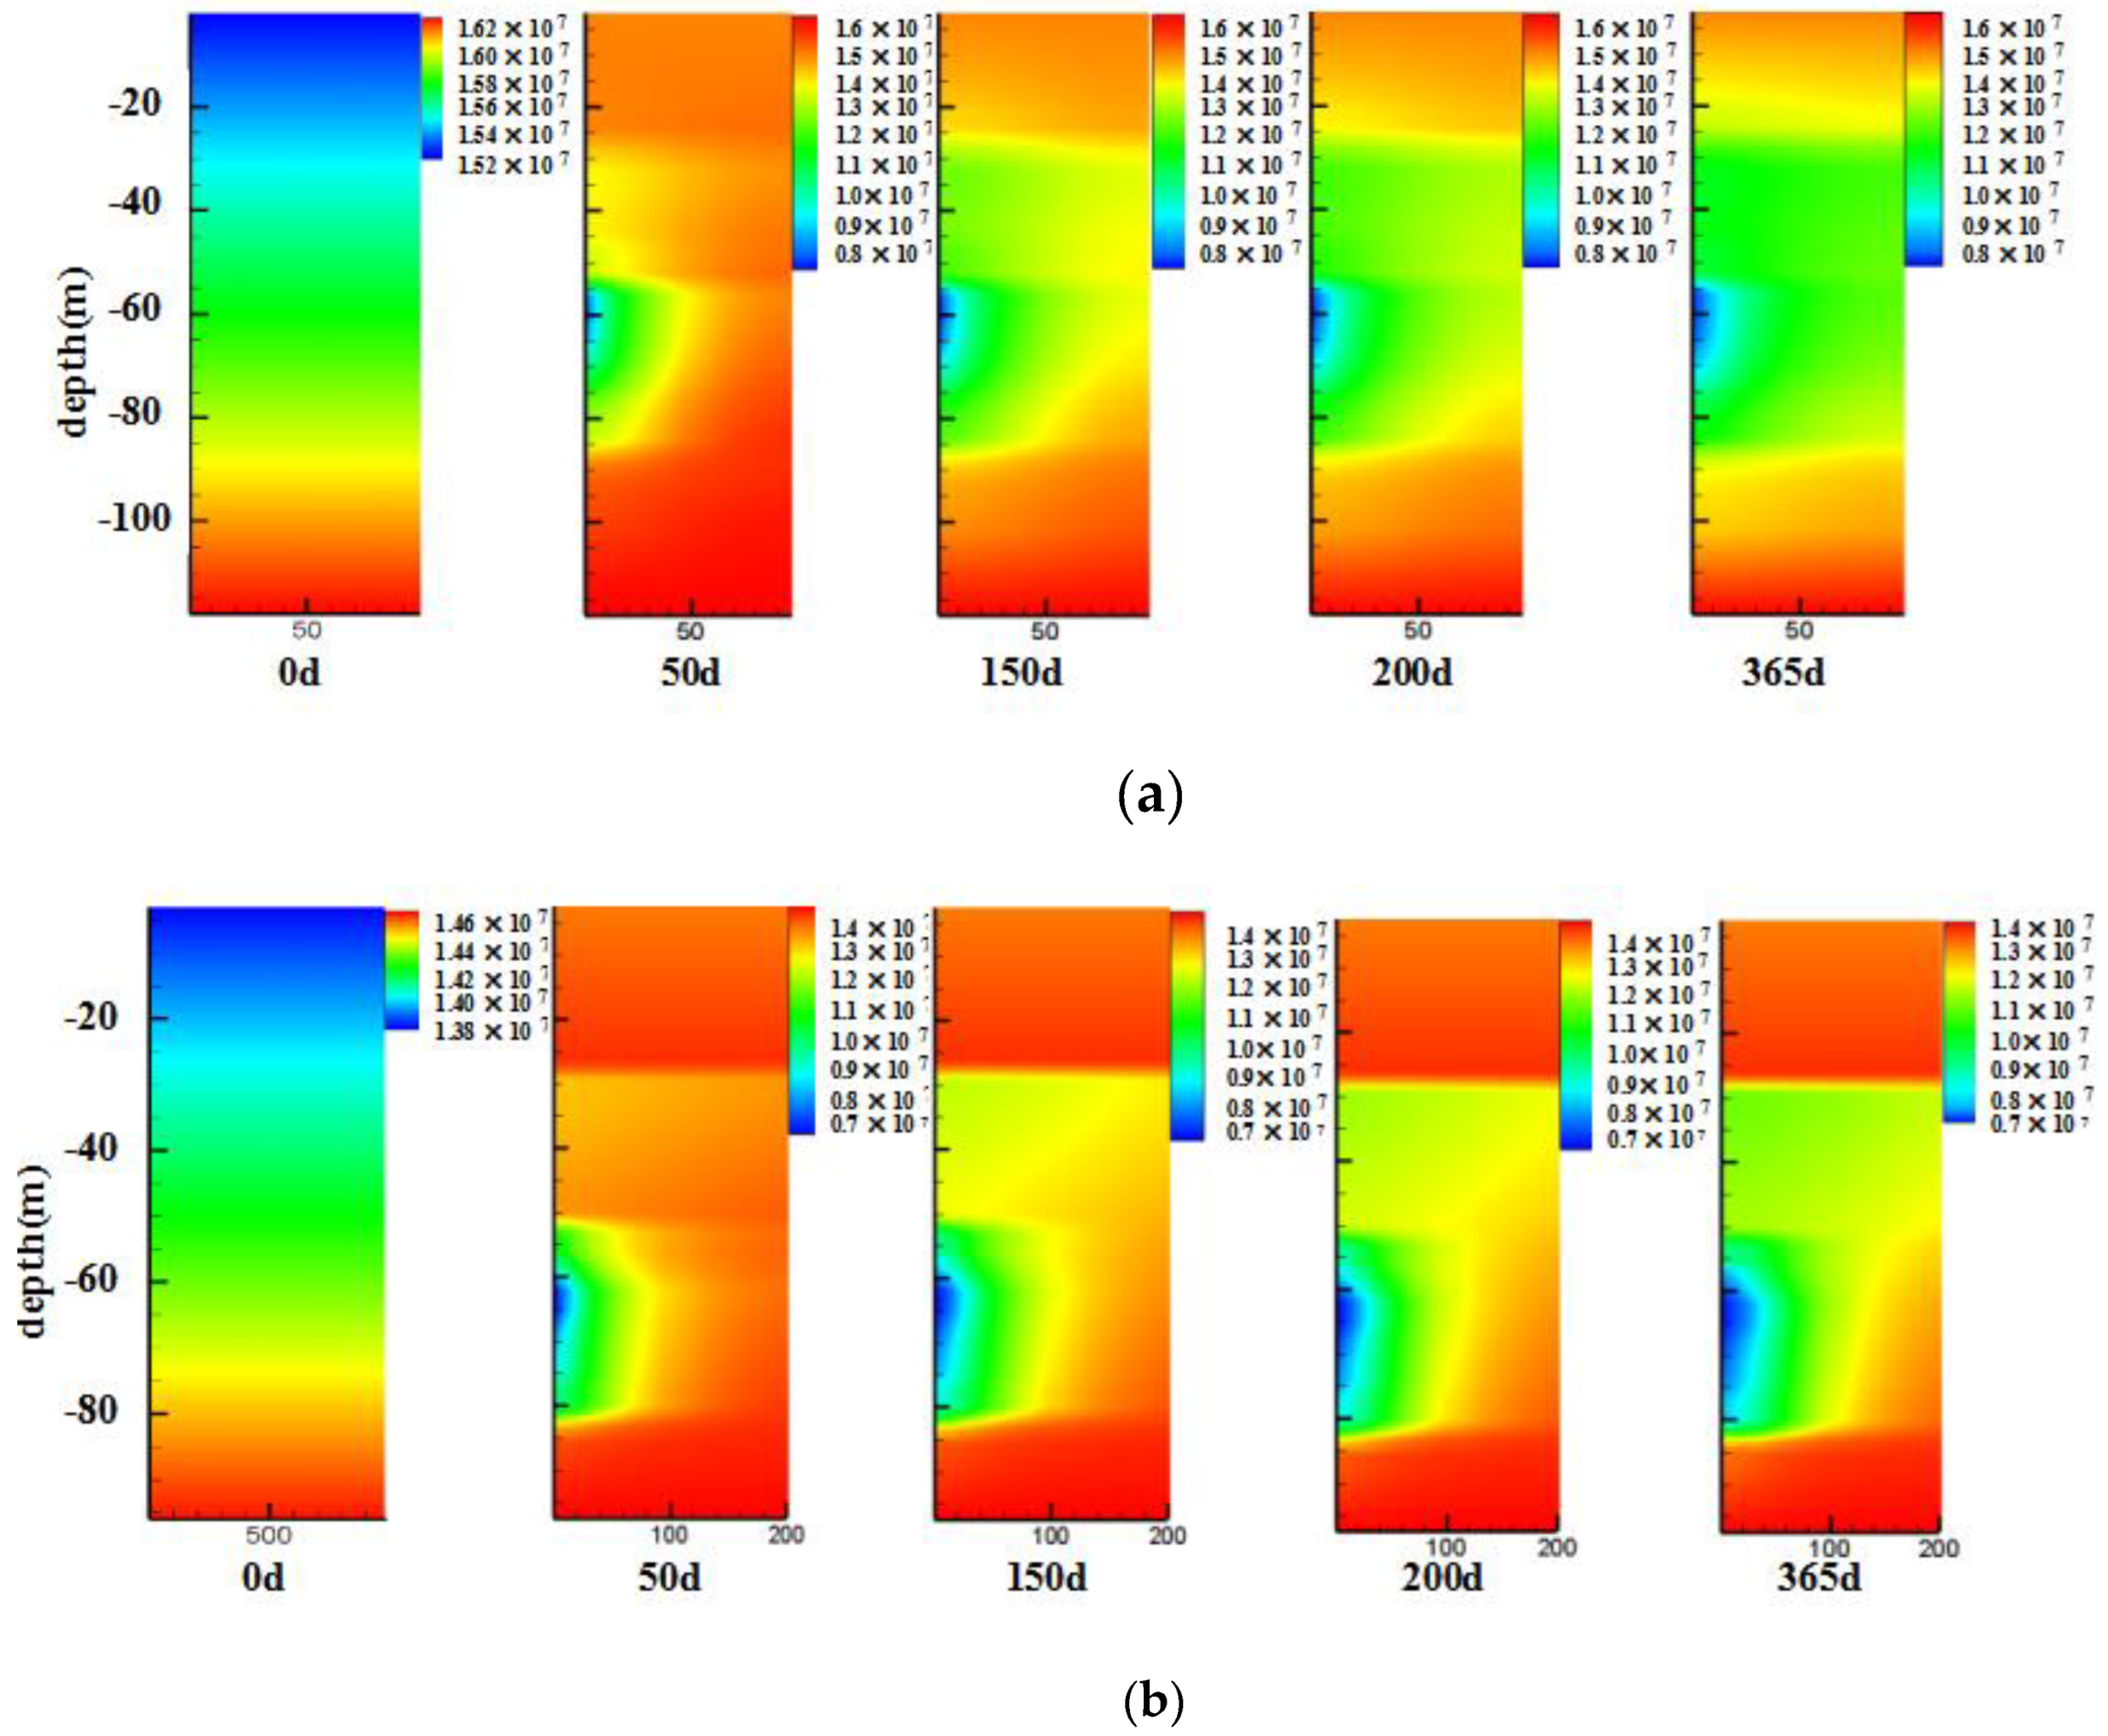
As shown in Figure 10 and Figure 11, the temperature and pressure reduction zones in the two heterogeneous hydrate reservoirs had uneven distribution characteristics, and the reservoir cooling was mainly due to the heat absorption of hydrate decomposition. This also confirmed that the hydrate decomposition front mainly extended in the reservoir along the radial direction. This was because in the heterogeneous reservoirs, areas with relatively high k and SH rapidly formed an effective pressure drawdown and propagate along the radial direction under the hydraulic restriction of relatively low k areas. The hydrate decomposition further promoted the propagation of the pressure drawdown in the relatively high k area by increasing the k of the hydrate decomposition area. Therefore, in these layered heterogeneous reservoirs, temperature and pressure transfer and hydrate decomposition were concentrated in areas with relatively a large k.
At the same time, it was found that the temperature and pressure change area of the CHR was concentrated in the 11th layer, in the vicinity of the area where the horizontal well was laid. The temperature and pressure change area of the SHR was concentrated in the 13th layer, in the vicinity of the area where the horizontal well was laid, which was an area with a high k, although the changes in the distant areas were small. Taking Figure 9 as an example, combined with the analysis of the spatial variation of SH, it can be seen that the SH also changed in these areas, whereas there was almost no change in SH in the remaining areas. This was because two horizontal wells were laid in the highest k areas of the reservoirs. The k of the 11th layer in the CHR was 47 mD, while the k in the 9th and 13th layers suddenly changed to less than 10 mD. The k of the 13th layer in the SHR was 1700 mD, while the k in the 12th and 19th layers suddenly changed to less than 10 mD. Therefore, the pressure drawdown could quickly spread in the area with high k, causing hydrate decomposition. The pressure drawdown was restricted when it underwent a vertical transmission to low k areas. On the one hand, the hydraulic restriction further promoted the radial transmission of pressure drawdown in the area with a relatively high k. On the other hand, the pressure drawdown in the relatively low k area spread slowly, and even beyond the areas with relatively low k there were areas with high k or SH. Due to the limited pressure drawdown transmission, it was difficult for large-scale hydrate decomposition to occur in these areas. Therefore, the variations in the area of the temperature and pressure fields and SH were concentrated near the layer of horizontal wells.
Permeability affected the productivity of the hydrate reservoir by impacting on the discharge rate of methane gas and the transfer rate of pressure drawdown. A heterogeneous reservoir can better reflect the advantages of pressure drawdown transfer in areas with a relatively good k. The changes in Φ directly affected the sensible heat of the reservoir from the solid skeleton. The SH determined the amount of hydrate decomposition in the early stage and then determined the changes in the temperature field of the reservoir. The supply of sensible heat to the decomposition zone mainly occurs at the decomposition front in homogeneous reservoirs, but in heterogeneous reservoirs the sensible heat exchange occurs not only at the decomposition front, but also between interbedded structures, which is also advantageous for the exploitation of hydrate. Therefore, the heterogeneous model better described the heat compensation mechanism of the reservoir and the processes by which lithological parameters influenced hydrate decomposition under depressurization. When studying the process of hydrate exploitation, it is therefore necessary to build a numerical simulation model that considers reservoir heterogeneity.

3.6. Effect of Water Salinity on Productivity

Water salinity is used to express the mass fraction of salts in seawater. Previous study have shown that the salinity affects the phase equilibrium of hydrate, and the increase of salinity makes the hydrate phase equilibrium curve shift to the left. As the same temperature, the higher the salinity is, the larger the phase equilibrium pressure of hydrate is [43,44]. Therefore, the initial water salinity of hydrate reservoir affects the reservoir productivity.
The formation of hydrate absorbs water molecules, resulting in the increase of water salinity. The initial salinity of CHR is generally higher than that of SHR [45], the initial salinity of site W11 in the South China Sea is 3.15%, and that of site AT1 in Japan is 3.0%. Based on this data, the schemes of the two models were designed respectively(as shown in Table 9), and then the effect of water salinity on the gas production of hydrate reservoirs with different lithology was studied.
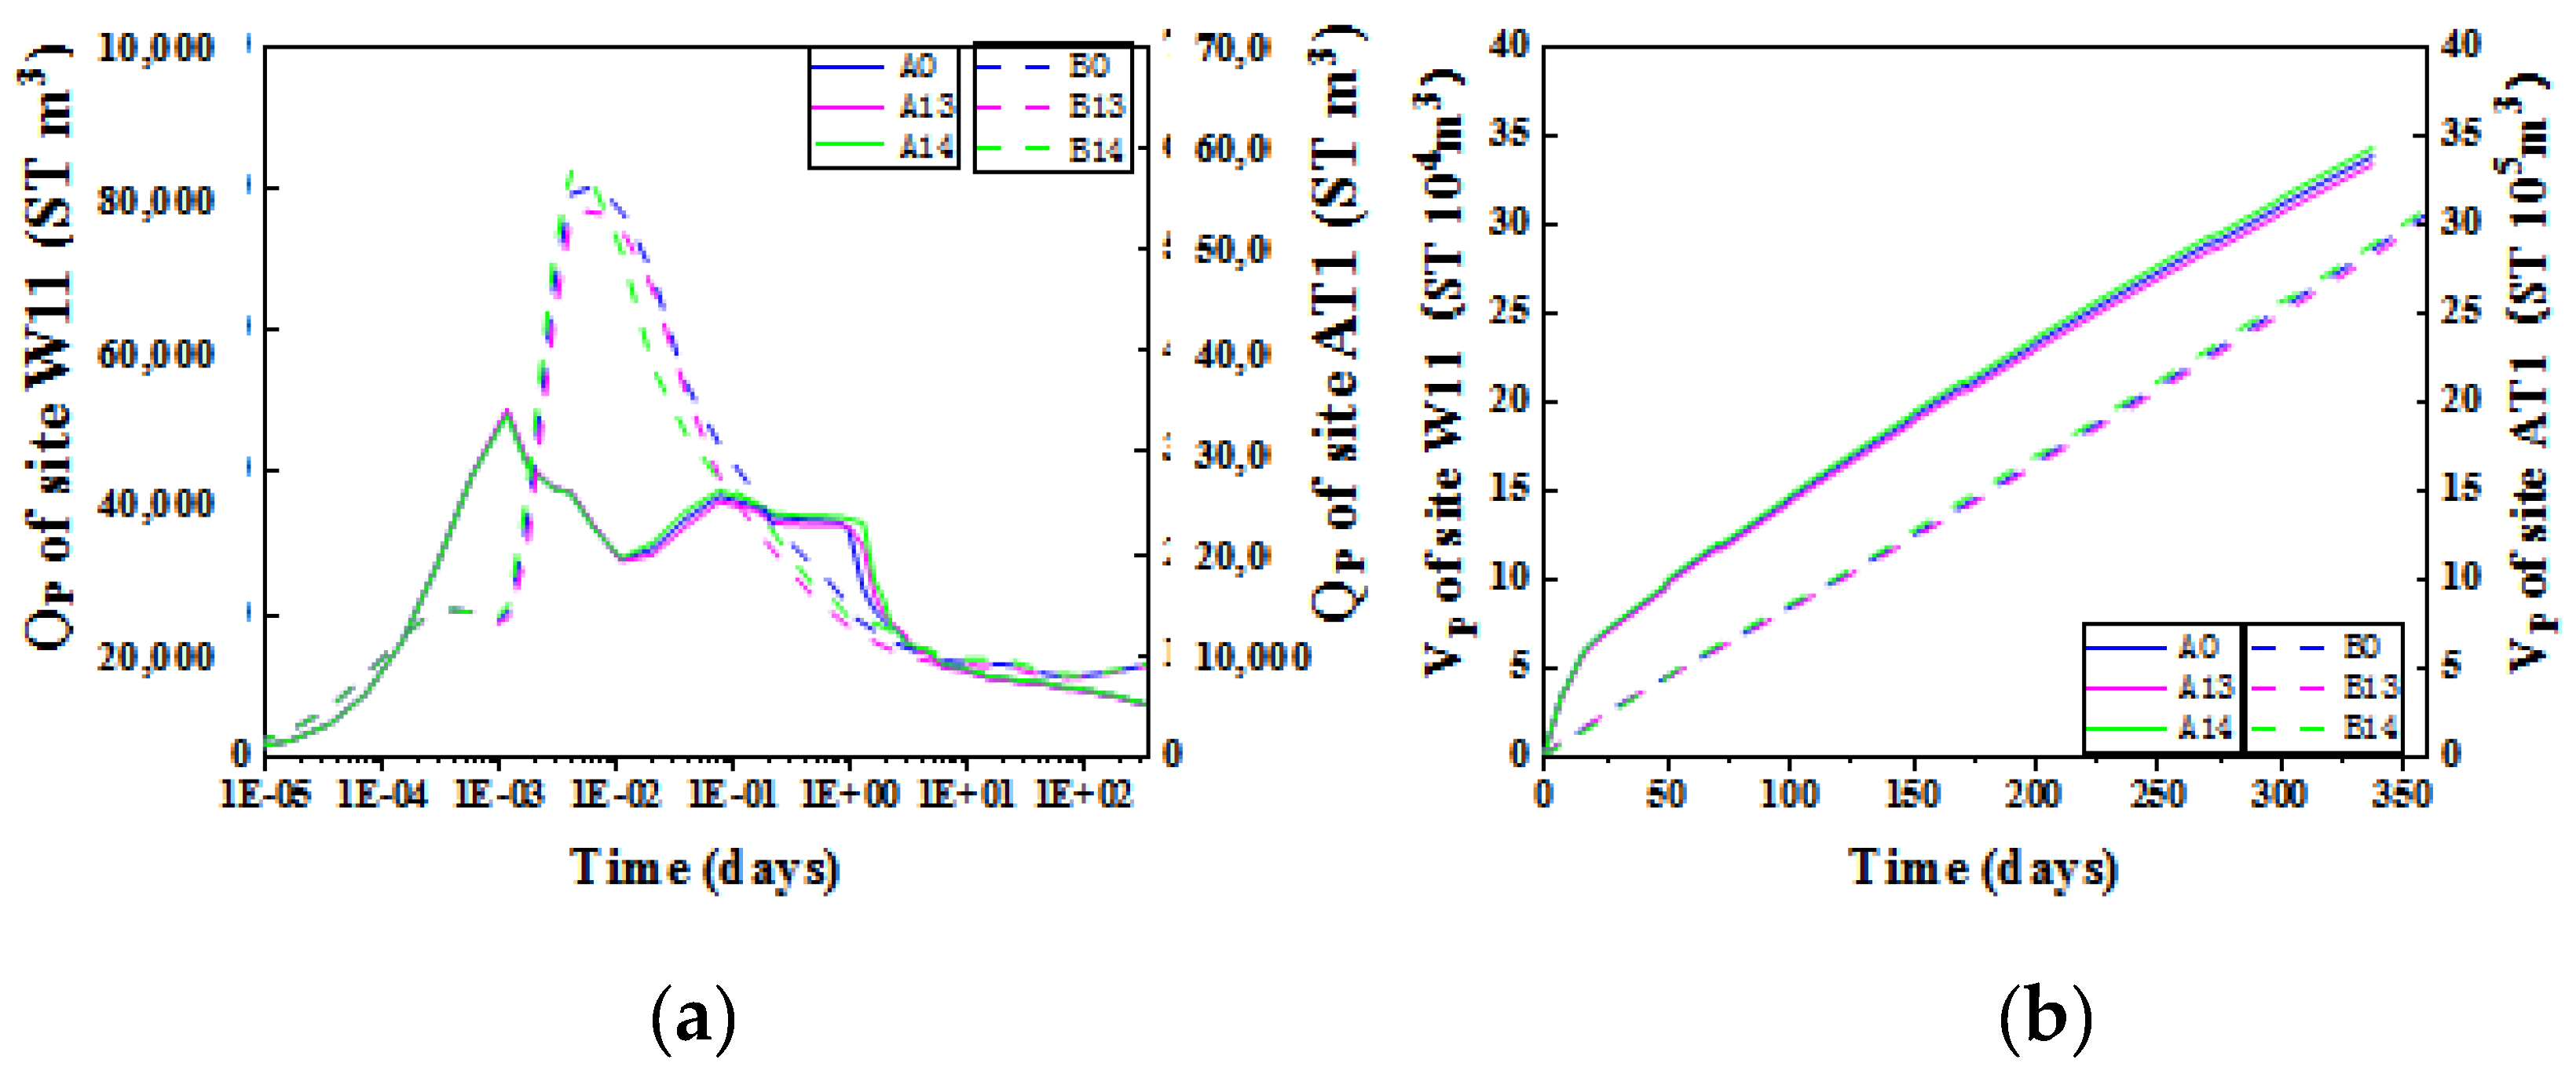
Figure 12 shows that the trend in the QP and VP was similar to the previous analysi, and a high water salinity always associated with high QP and VP in the CHR and SHR. On the basis of the base case (A0), the VP of the scheme A13-14 changed by −1.37% and +1.38% in the CHR, respectively. On the basis of the base case (B0), the VP of the scheme B13-14 changed by −1.45% and +1.03% in the SHR, respectively. This is because under the high salinity, the phase equilibrium temperature of hydrate is low, the decomposition of hydrate was less limited by heat supply. Therefore, the high initial water salinity is conducive to gas hydrate decomposition.
Table 10 shows that the water salinity has a great impact on reservoir productivity, and Ssalinity is similar to Sk. The water salinity of the China four seas ranges from 3.0–3.5%, and the variation range is small. Therefore, considering the actual situation, the effect of water salinity on reservoir productivity is limited.

4. Conclusions

  • The order of the significance levels of the lithological parameters on productivity was k > SH > Φ in the CHR and SH > k > Φ in the SHR. Permeability should therefore be the priority when considering the potential production from a CHR and SHR. The effect of the SH should be considered in the production from a SHR.
  • The heat conduction and convection ability of the CHR were weaker than for the SHR, which make it difficult to recover the low-temperature area caused by hydrate decomposition in a timely manner. In the exploitation of a CHR, more attention should therefore be given to the spatial evolution of the temperature field during the production process and the application of technical methods to warm the formation around the well should be considered.
  • There was a positive correlation between k and reservoir productivity in the both the CHR and SHR. Therefore, the exploitation of a high k hydrate reservoir can be given priority when the other initial conditions are the same.
  • It makes no sense to purse a high hydrate content and ignore the role of pressure transmission and heat supply. The hydrate exploitation potential of both a CHR and SHR should not only rely on the hydrate content or seepage capacity, but rather the combined effect of the two factors should be considered.
  • The heterogeneous model better described the heat compensation mechanism of the reservoir and the processes by which lithological parameters influence hydrate decomposition. It is therefore necessary to build a numerical simulation model that considers reservoir heterogeneity to study the process of hydrate exploitation.
  • The initial water salinity of hydrate is sensitive to the reservoir productivity, and there was a positive correlation between water salinity and reservoir productivity in the both the CHR and SHR.

Author Contributions

Conceptualization, X.X. and T.X.; methodology, Y.L. and H.Z.; software, T.X. and H.W.; validation, H.Z.; formal analysis, Y.L. and H.Z.; investigation, Q.C.; resources, X.X.; data curation, Y.L. and Q.C.; writing—original draft preparation, Y.L.; writing—review and editing, X.X., T.X. and H.Z; visualization, H.W. and B.Y.; supervision, T.X.; project administration, X.X.; funding acquisition, X.X. All authors have read and agreed to the published version of the manuscript.

Funding

This work was supported by the Jilin Scientific and Technological Development Program (No. 20190303083SF), the National Natural Science Foundation of China (No. 41877185), the International Cooperation Key Laboratory of Underground Energy Development and Geological Restoration (No. YDZJ202102CXJD014), and the National Key Research and Development Program of China (No. 2017YFC0307304).

Data Availability Statement

Not applicable.

Acknowledgments

We thank the support from above fundings.

Conflicts of Interest

The authors declare no conflict of interest.

References

  1. Konno, Y.; Fujii, T.; Sato, A.; Akamine, K.; Naiki, M.; Masuda, Y.; Yamamoto, K.; Nagao, J. Key findings of the world’s first offshore methane hydrate production test off the coast of Japan: Toward future commercial production. Energy Fuels 2017, 31, 2607–2616. [Google Scholar] [CrossRef]
  2. Ning, F.; Liang, J.; Wu, N.; Zhu, Y.; Wu, S.; Liu, C.; Wei, F.; Wang, D.; Zhang, Z.; Xu, M.; et al. Reservoir characters of natural gas hydrates in China. Nat. Gas Ind. 2020, 40, 1–24. [Google Scholar]
  3. Ma, X.; Wang, Y.; Feng, X. Energy system optimization of natural gas hydrate mining platform. Adv. New Renew. Energy 2022, 41, 1667–1676. [Google Scholar]
  4. He, J.; Zhong, C.; Yao, Y.; Yan, P.; Wang, Y.; Wang, Z.; Guan, J.; Zhang, J. Progress and prospect of gas hydrate exploration and exploration in the northern South China Sea. Mar. Geol. Front. 2020, 36, 1–14. [Google Scholar]
  5. Yuan, Y. Numerical Simulation on Gas Production Potential and The Geo-Mechanical Stability from Marine Natural Gas Hydrate through Depressurization. Ph.D. Thesis, Jilin University, Changchun, China, 2019. [Google Scholar]
  6. Zhang, W.; Bai, F.; Shao, M.; Tian, Q. Progress of offshore natural gas hydrate production tests in Japan and implication. Mar. Geol. Quat. Geol. 2017, 37, 27–33. [Google Scholar]
  7. He, T.; Lu, H.; Lin, J.; Dong, Y.; He, J. Geophysical techniques of reservoir monitoring for marine gas hydrate exploitation. Earth Sci. Front. 2017, 24, 368–382. [Google Scholar]
  8. Xiao, H.; Zhang, Z. A review on gas hydrates research progress of global main countries. Ocean Dev. Manag. 2021, 38, 36–41. [Google Scholar]
  9. Zhang, J.; Fan, B.; Liu, R. Current status and technology of natural gas hydrate drilling. Sci. Technol. Eng. 2020, 20, 14343–14351. [Google Scholar]
  10. Chen, Q.; Hu, G.; Li, Y.; Wan, Y.; Liu, C. A prospect review of new technology for development of marine gas hydrate resources. Mar. Geol. Front. 2020, 36, 44–55. [Google Scholar]
  11. Ye, J.; Qin, X.; Xie, W.; Lu, H.; Ma, B.; Qiu, H.; Liang, J.; Lu, J.; Kuang, Z.; Lu, C.; et al. Main progress of the second gas hydrate production tests in the South China Sea. Geol. China 2020, 47, 557–568. [Google Scholar]
  12. Huang, L.; Su, Z.; Wu, N.; Cheng, J. Analysis on geologic conditions affecting the performance of gas production from hydrate deposits. Mar. Pet. Geol. 2016, 77, 19–29. [Google Scholar] [CrossRef]
  13. Jin, G.; Xu, T.; Liu, X.; Xin, X.; Liu, C. Optimization of gas production from hydrate deposit using joint depressurization and thermal stimulation. J. Cent. South Univ. Sci. Technol. 2015, 46, 1534–1543. [Google Scholar]
  14. Yin, Z.; Wan, Q.; Gao, Q.; Linga, P. Effect of pressure draw down rate on the fluid production behavior from methane hydrate-bearing sediments. Appl. Energy 2020, 271, 115195. [Google Scholar] [CrossRef]
  15. Cai, J.; Xia, Y.; Xu, S.; Tian, H. Advances in multiphase seepage characteristics of natural gas hydrate sediments. Chin. J. Theor. Appl. Mech. 2020, 52, 208–223. [Google Scholar]
  16. Li, S.; Chen, Y.; Du, Q. Sensitivity analysis in numerical simulation of natural gas hydrate production. Geoscience 2005, 19, 108–112. [Google Scholar]
  17. Reagan, M.; Moridis, G.; Zhang, K. Sensitivity Analysis of Gas Production from Class 2 and Class 3 Hydrate Deposits; Lawrence Berkeley National Laboratory: Berkeley, CA, USA, 2008. [Google Scholar]
  18. Jiang, X.; Li, S.; Zhang, L. Sensitivity analysis of gas production from Class I hydrate reservoir by depressurization. Energy 2012, 39, 281–285. [Google Scholar] [CrossRef]
  19. Yang, Z.; He, T.; Zhu, H.; Lan, K.; Lu, H. Experimental study of the ultrasonic velocity of methane hydrate-bearing unconsolidated sediments. Acta Sci. Nat. Univ. Pekin. 2020, 56, 271–282. [Google Scholar]
  20. Meng, D.; Wen, P.; Zhang, J.; Zhang, R.; Li, Y.; Zhao, B.; Shen, S. Gas hydrate reservoir inversion and saturation prediction. Mar. Geol. Front. 2019, 35, 43–51. [Google Scholar]
  21. Guan, H.; Wu, N.; Mao, S.; Zhu, X.; Wu, D.; Yang, S. Hopanoid acids and geochemistry significance detected in seep carbonates from the South China Sea continental slope. Earth Sci.-J. China Univ. Geosci. 2013, 38, 1014–1022. [Google Scholar]
  22. Yang, K.; Chu, F.; Zhao, J.; Han, X.; Ye, L.; Zhang, W. Sedimentary environment of the cold-seep carbonate chimneys, north of the South China Sea. Acta Oceanol. Sin. 2013, 35, 82–89. (In Chinese) [Google Scholar]
  23. Zhang, B.; Yu, Y.; Jin, K.; Wu, Q.; Gao, X.; Wu, Q.; Liu, C. Influence of depressurization amplitude and saturation in loose sediments on the dissociation process of natural gas hydrates. Nat. Gas Ind. 2020, 40, 133–140. [Google Scholar]
  24. Wang, X.; Jin, J.; Guo, Y.; Li, J.; Li, Y.; Qian, J.; Wang, H.; Zhou, J. The characteristic of gas hydrate accumulation and quantitative estimation in the north slope of South China Sea. Earth Sci. 2021, 46, 1038–1057. [Google Scholar]
  25. Guo, Y.; Yang, S.; Liang, J.; Lu, J.; Lin, L.; Kuang, Z. Characteristics of high gas hydrate distribution in the Shenhu area on the northern slope of the South China Sea. Earth Sci. Front. 2017, 24, 24–31. [Google Scholar]
  26. Li, J.; Ye, J.; Qin, X.; Qiu, H.; Wu, N.; Lu, H.; Xie, W.; Lu, J.; Peng, F.; Xu, Z.; et al. The first offshore natural gas hydrate production test in South China Sea. China Geol. 2018, 1, 5–16. [Google Scholar] [CrossRef]
  27. Zhao, K. Occurrence and accumulation characteristics of natural gas hydrate in the eastern Nankai Trough, Japan. Pet. Geol. Exp. 2019, 41, 831–837+864. [Google Scholar]
  28. Japan Completes First Offshore Methane Hydrate Production Test e Methane Successfully Produced from Deep Water Hydrate Layers Fire in the Ice Methane Hydrate Newsletter; National Energy Technology Laboratory, U.S Department of Energy: Pittsburgh, PA, USA, 2013; Volume 13.
  29. Zhao, T.; Ran, H.; Xu, J.; Sha, Z.; Jiang, Y.; Wang, K. Research and development progress as well as technical orientation of the natural gas hydrate in Japan. Acta Geosci. Sin. 2021, 42, 196–202. [Google Scholar]
  30. Jiang, Y.; Zhang, T.; Li, X. Study on the latest research and development of methane hydrates in Japan. Land Resour. Inf. 2020, 6, 20–27. [Google Scholar]
  31. Li, S.; Sun, Y.; Chen, W.; Yu, Z.; Zhou, Z.; Liu, L.; Hao, J.; Zhao, Z.; Li, X. Analyses of gas production methods and offshore production tests of natural gas hydrates. J. Eng. Geol. 2019, 27, 55–68. [Google Scholar]
  32. Zhu, H.; Xu, T.; Yuan, Y.; Xia, Y.; Xin, X. Numerical investigation of natural gas hydrate production tests in the Nankai Trough by incorporating sand migration. Appl. Energy 2020, 275, 115384. [Google Scholar] [CrossRef]
  33. Xin, X.; Wang, H.; Luo, J.; Yu, H.; Yuan, Y.; Xia, Y.; Zhu, H.; Chen, Q. Simulation–optimization coupling model for the depressurization production of marine natural gas hydrate in horizontal wells based on machine learning method. Nat. Gas Ind. 2020, 40, 149–158. [Google Scholar]
  34. Fujii, T.; Suzuki, K.; Takayama, T.; Tamaki, M.; Komatsu, Y.; Konno, Y.; Yoneda, J.; Vamamoto, K.; Nagao, J. Geological setting and characterization of a methane hydrate reservoir distributed at the first offshore production test site on the Daini-Atsumi Knoll in the eastern Nankai Trough, Japan. Mar. Pet. Geol. 2015, 66, 310–322. [Google Scholar] [CrossRef]
  35. Feng, Y.; Chen, L.; Suzuki, A.; Kogawa, T.; Okajima, J.; Komiya, A.; Maruyama, S. Numerical analysis of gas production from reservoir-scale methane hydrate by depressurization with a horizontal well: The effect of permeability anisotropy. Mar. Pet. Geol. 2019, 102, 817–828. [Google Scholar] [CrossRef]
  36. Qian, J.; Wang, X.; Collett, T.; Guo, Y.; Kang, D.; Jin, J. Downhole log evidence for the coexistence of structure Ⅱ gas hydrate and free gas below the bottom simulating reflector in the South China Sea. Mar. Pet. Geol. 2018, 98, 662–674. [Google Scholar] [CrossRef]
  37. Suzuki, K.; Schultheiss, P.; Nakatsuka, Y.; Ito, T.; Egawa, K.; Holland, M.; Yamamoto, K. Physical properties and sedimentological features of hydrate-bearing samples recovered from the first gas hydrate production test site on Daini-Atsumi Knoll around eastern Nankai Trough. Mar. Pet. Geol. 2015, 66, 346–357. [Google Scholar] [CrossRef]
  38. Cai, J.; Jin, T.; Kou, J.; Zou, S.; Xiao, J.; Meng, Q. Lucas-Washburn equation-based modeling of capillary-driven flow in porous systems. Langmuir ACS J. Surf. Colloids 2021, 37, 1623–1636. [Google Scholar] [CrossRef]
  39. Hu, Y.; Cai, J.; Xu, C.; Li, X. Research progress on phase change heat of gas hydrates. Chem. Ind. Eng. Prog. 2016, 35, 2021–2032. [Google Scholar]
  40. Moridis, G.; Reagan, M.; Zhang, K. Evaluation of the gas production potential of some particularly challenging types of oceanic hydrate deposits. Transp. Porous Media 2011, 90, 269–299. [Google Scholar] [CrossRef]
  41. Li, C.; Zhao, Q.; Xu, H.; Feng, K.; Liu, K. Relation between relative permeability and hydrate saturation in Shenhu area, South China Sea. Appl. Geophys. 2014, 2, 207–214. [Google Scholar] [CrossRef]
  42. Yin, Z.; Moridis, G.; Linga, P. On the importance of phase saturation heterogeneity in the analysis of Laboratory Studies of Hydrate Dissociation. Appl. Energy 2019, 255, 113861. [Google Scholar] [CrossRef] [Green Version]
  43. Tausif, A.; Santiago, A.; Mert, A. An experimental study on doubly salt effect for methane hydrate inhibition. J. Nat. Gas Sci. Eng. 2019, 72, 103015. [Google Scholar]
  44. Wang, S.; Song, H.; Yan, W. The change of external conditions effects on the phase equilibrium curve of gas hydrate and the thickness of hydrate stability zone. Prog. Geophys. 2005, 20, 761–768. [Google Scholar]
  45. Zhu, H.; Xu, T.; Zhu, Z.; Yuan, Y.; Tian, H. Numerical modeling of methane hydrate accumulation with mixed sources in marine sediments: Case study of Shenhu Area, South China Sea. Mar. Geol. 2020, 423, 106142. [Google Scholar] [CrossRef]
Figure 1. Location for the offshore methane hydrate production test in the Shenhu area of the South China Sea (modified from Li et al. [26]).
Jmse 10 00653 g001
Figure 2. (a) Location of the 2013 and 2017 offshore production test sites in the Eastern Nankai Trough; (b) locations of production and monitoring wells (from Huixing Zhu et al. [32]).
Jmse 10 00653 g002
Figure 3. (a) Conceptual model of the CHR; (b) conceptual model of the SHR.
Jmse 10 00653 g003
Figure 4. The initial spatial distribution of the hydrate reservoir at the W11 drilling site.
Jmse 10 00653 g004
Figure 5. The initial spatial distribution of the hydrate reservoir at the AT1 station.
Jmse 10 00653 g005
Figure 6. (a) The effect of Φ on Qp and Vp in the CHR model; (b) The effect of Φ on Qp and Vp in the SHR model.
Jmse 10 00653 g006
Figure 7. (a) The effect of k on QP and VP in the CHR model; (b) The effect of k on QP and VP in the SHR model.
Jmse 10 00653 g007aJmse 10 00653 g007b
Figure 8. (a) The effect of SH on QP and VP in the CHR model; (b) The effect of SH on QP and VP in the SHR model.
Jmse 10 00653 g008
Figure 9. (a) Spatial variation of the SH field at each time point at the W11 drilling site; (b) spatial variation of the SH field at each time point at the AT1 station.
Jmse 10 00653 g009
Figure 10. (a) Spatial variation of the temperature field at each time point at the W11 drilling site; (b) spatial variation of the temperature field at each time point at the AT1 station.
Jmse 10 00653 g010aJmse 10 00653 g010b
Figure 11. (a) Spatial variation of the pressure field at each time point at the W11 drilling site; (b) spatial variation of the pressure field at each time point at the AT1 station.
Jmse 10 00653 g011
Figure 12. (a) The effect of salinity on QP in the CHR and SHR model; (b) The effect of salinity on VP in the CHR and SHR model.
Jmse 10 00653 g012
Table 1. Summary of global gas hydrate production tests [5,6,7,8,9,10,11].
CanadaAmericaJapanChina
AreaMackenzie DeltaNorth Slope of AlaskaNankai TroughMuli BasinSouth China Sea
LithologySandySandySandySandySandySandySandy|Clayey siltClayey silt
Production time125 h12.5 h6 days30 days6 days12|24 days101 h23 days60 days30 days
Stop reasonNo dataSand productionNo dataSand production|Initiative endingNo dataNo dataInitiative ending
Table 2. Basic details of the CHR and SHR.
InformationCHRSHR
Site locationThe Shenhu Sea areaThe Nankai Trough
Water depth (m)1312845–1405
Seafloor temperature (°C)4.823.75
Depth of hydrate reservoir (m)117–197276–336
The lithology of overburdenclayey siltclay
The lithology of underburdenclayey siltsandy
Class of hydrate reservoirClass Ⅱ
Table 3. Parameters of the hydrate deposits.
ParameterValue
CHRSHR
Hydrate deposits thickness (m)8060
Overburden thickness (m)2026
Underburden thickness (m)2014
Bottom temperature (°C)16.2514.5
Bottom pressure (MPa)16.3514.71
Porosity0.500.40
Permeability (mD)hierarchical value
Initial hydrate saturationhierarchical value
Geothermal gradient (°C/km)54.930
Rock grain density (kg/m3)26002650 [39]
Dry thermal conductivity (W/m/K)1.0
Wet thermal conductivity (W/m/K)2.9173.10
Phase change heat of hydrate (kJ/mol [39])53.5
Gas composition100%CH4
Water salinity0.030.03
Liquid phase relative permeability k r A = max 0 , { min S A S i r A 1 S i r A n A , 1 }
Sandy|Clayey silt irreducible water saturation, S i r A −|0.600.20|0.40
Sandy|Clayey silt Liquid phase attenuation index, n A −|4.53.5|5.0
Gas phase relative permeability k r G = max 0 , { min S G S i r G 1 S i r A n G , 1 }
Sandy|Clayey silt irreducible gas saturation, S irG −|0.020.02|0.05
Sandy|Clayey silt gas phase attenuation index, n G −|3.52.5|3.0
Table 4. Simulation scheme of the CHR model.
k(mD)SHk (mD)SH
LayerA0A5A6A7A8A9A10A11A12
15.50.354.12.86.98.20.310.260.390.44
22.00.431.51.02.53.00.370.320.480.54
33.00.402.21.53.84.50.360.300.450.50
412.50.289.46.215.618.00.240.210.320.35
556.50.1342.428.070.684.80.110.100.150.16
623.70.2217.811.829.635.60.190.160.250.28
710.00.307.55.012.515.00.260.220.340.38
826.20.2119.613.132.839.30.180.160.240.26
93.00.402.21.53.84.50.350.300.450.50
1035.30.1826.517.644.153.00.160.140.200.22
1147.00.1535.223.558.870.50.130.110.170.19
1217.30.2513.08.621.626.00.220.190.280.31
1310.00.307.55.012.515.00.260.220.340.38
146.250.344.73.17.89.40.300.260.380.42
159.00.316.84.511.313.50.270.230.350.39
1612.50.289.46.215.618.00.240.210.320.35
172.60.412.01.33.33.90.360.310.460.51
185.50.354.12.86.98.20.310.260.390.44
19290.2021.814.536.243.50.180.150.220.25
20470.1535.223.558.570.50.130.110.170.19
Table 5. Simulation scheme of the SHR model.
k(mD)SHk (mD)SH
LayerB0B5B6B7B8B9B10B11B12
13.00.802.31.54.560.750.700.860.83
25.30.4542.7810.60.420.390.480.47
3100.327.5515200.300.280.340.33
46000.2845030090012000.260.240.300.29
516000.351200800240032000.330.310.380.36
617000.401275850250034000.380.350.430.42
712000.52900600180024000.490.460.560.54
86000.6845030090012000.640.600.730.70
9500.7537.525751000.700.660.810.78
103400.722551705106800.680.630.770.75
112500.78187.51253755000.730.680.840.81
12100.527.5515200.490.460.560.54
1317000.591275850250034000.550.520.630.61
145000.6537525075010000.610.570.700.67
154000.523002006008000.490.450.560.54
164500.35337.52256759000.330.310.380.36
171000.4275501502000.390.370.450.44
187500.32562.5375112515000.300.280.340.33
193.10.222.31.64.66.20.210.190.240.23
20520.503926781040.470.440.540.52
Table 6. Sensitivity of reservoir productivity to Φ.
S1S2S3S4Sn
CHR0.1310.1880.1810.1130.153
SHR0.1470.2020.5700.4630.346
Table 7. Sensitivity of reservoir productivity to k.
S5S6S7S8Sk
CHR0.7660.8131.0560.6380.818
SHR0.9990.9260.6300.6430.799
Table 8. Sensitivity of reservoir productivity to SH.
S9S10S11S12SsH
CHR0.0440.0140.0950.2970.113
SHR1.3341.5083.012.4432.073
Table 9. Simulation scheme of the water salinity.
Base CaseCase 13Case 14
CHR0.03150.03000.0330
SHR0.03000.02850.0315
Table 10. Sensitivity of reservoir productivity to water salinity.
S13S14Ssalinity
CHR0.9140.9240.919
SHR0.9660.6900.828
Publisher’s Note: MDPI stays neutral with regard to jurisdictional claims in published maps and institutional affiliations.

