
Microcosmic Characteristics of Hydrate Formation and Decomposition in the Different Particle Size Sediments Captured by Cryo-SEM

 ,
,  ,
, 
Abstract
:1. Introduction
2. Experimental Apparatus and Process
2.1. Experimental Apparatus
2.2. Experimental Material
2.3. Experimental Procedure
3. Experimental Results and Discussion
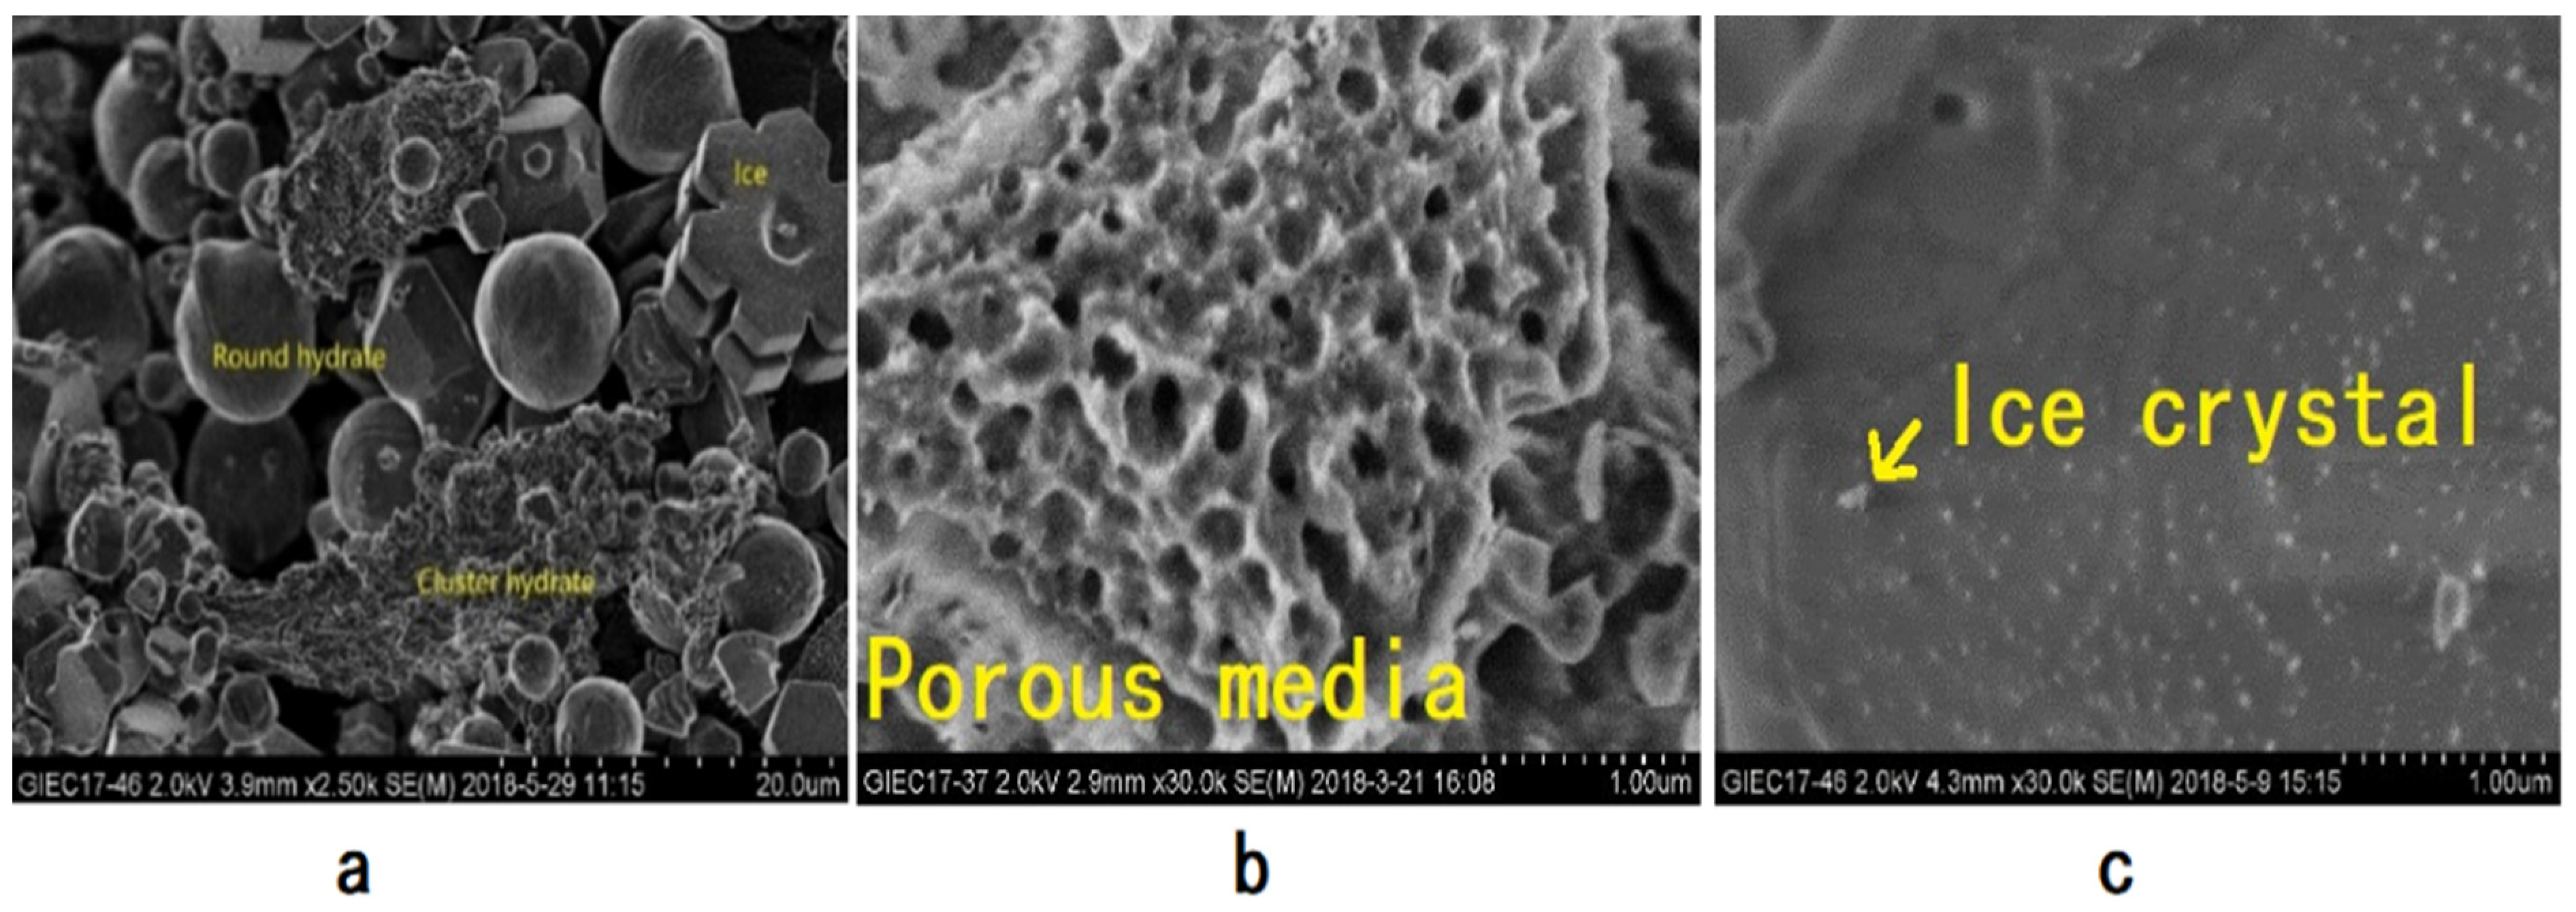
3.1. Morphological Characteristics of NGH in Sediments
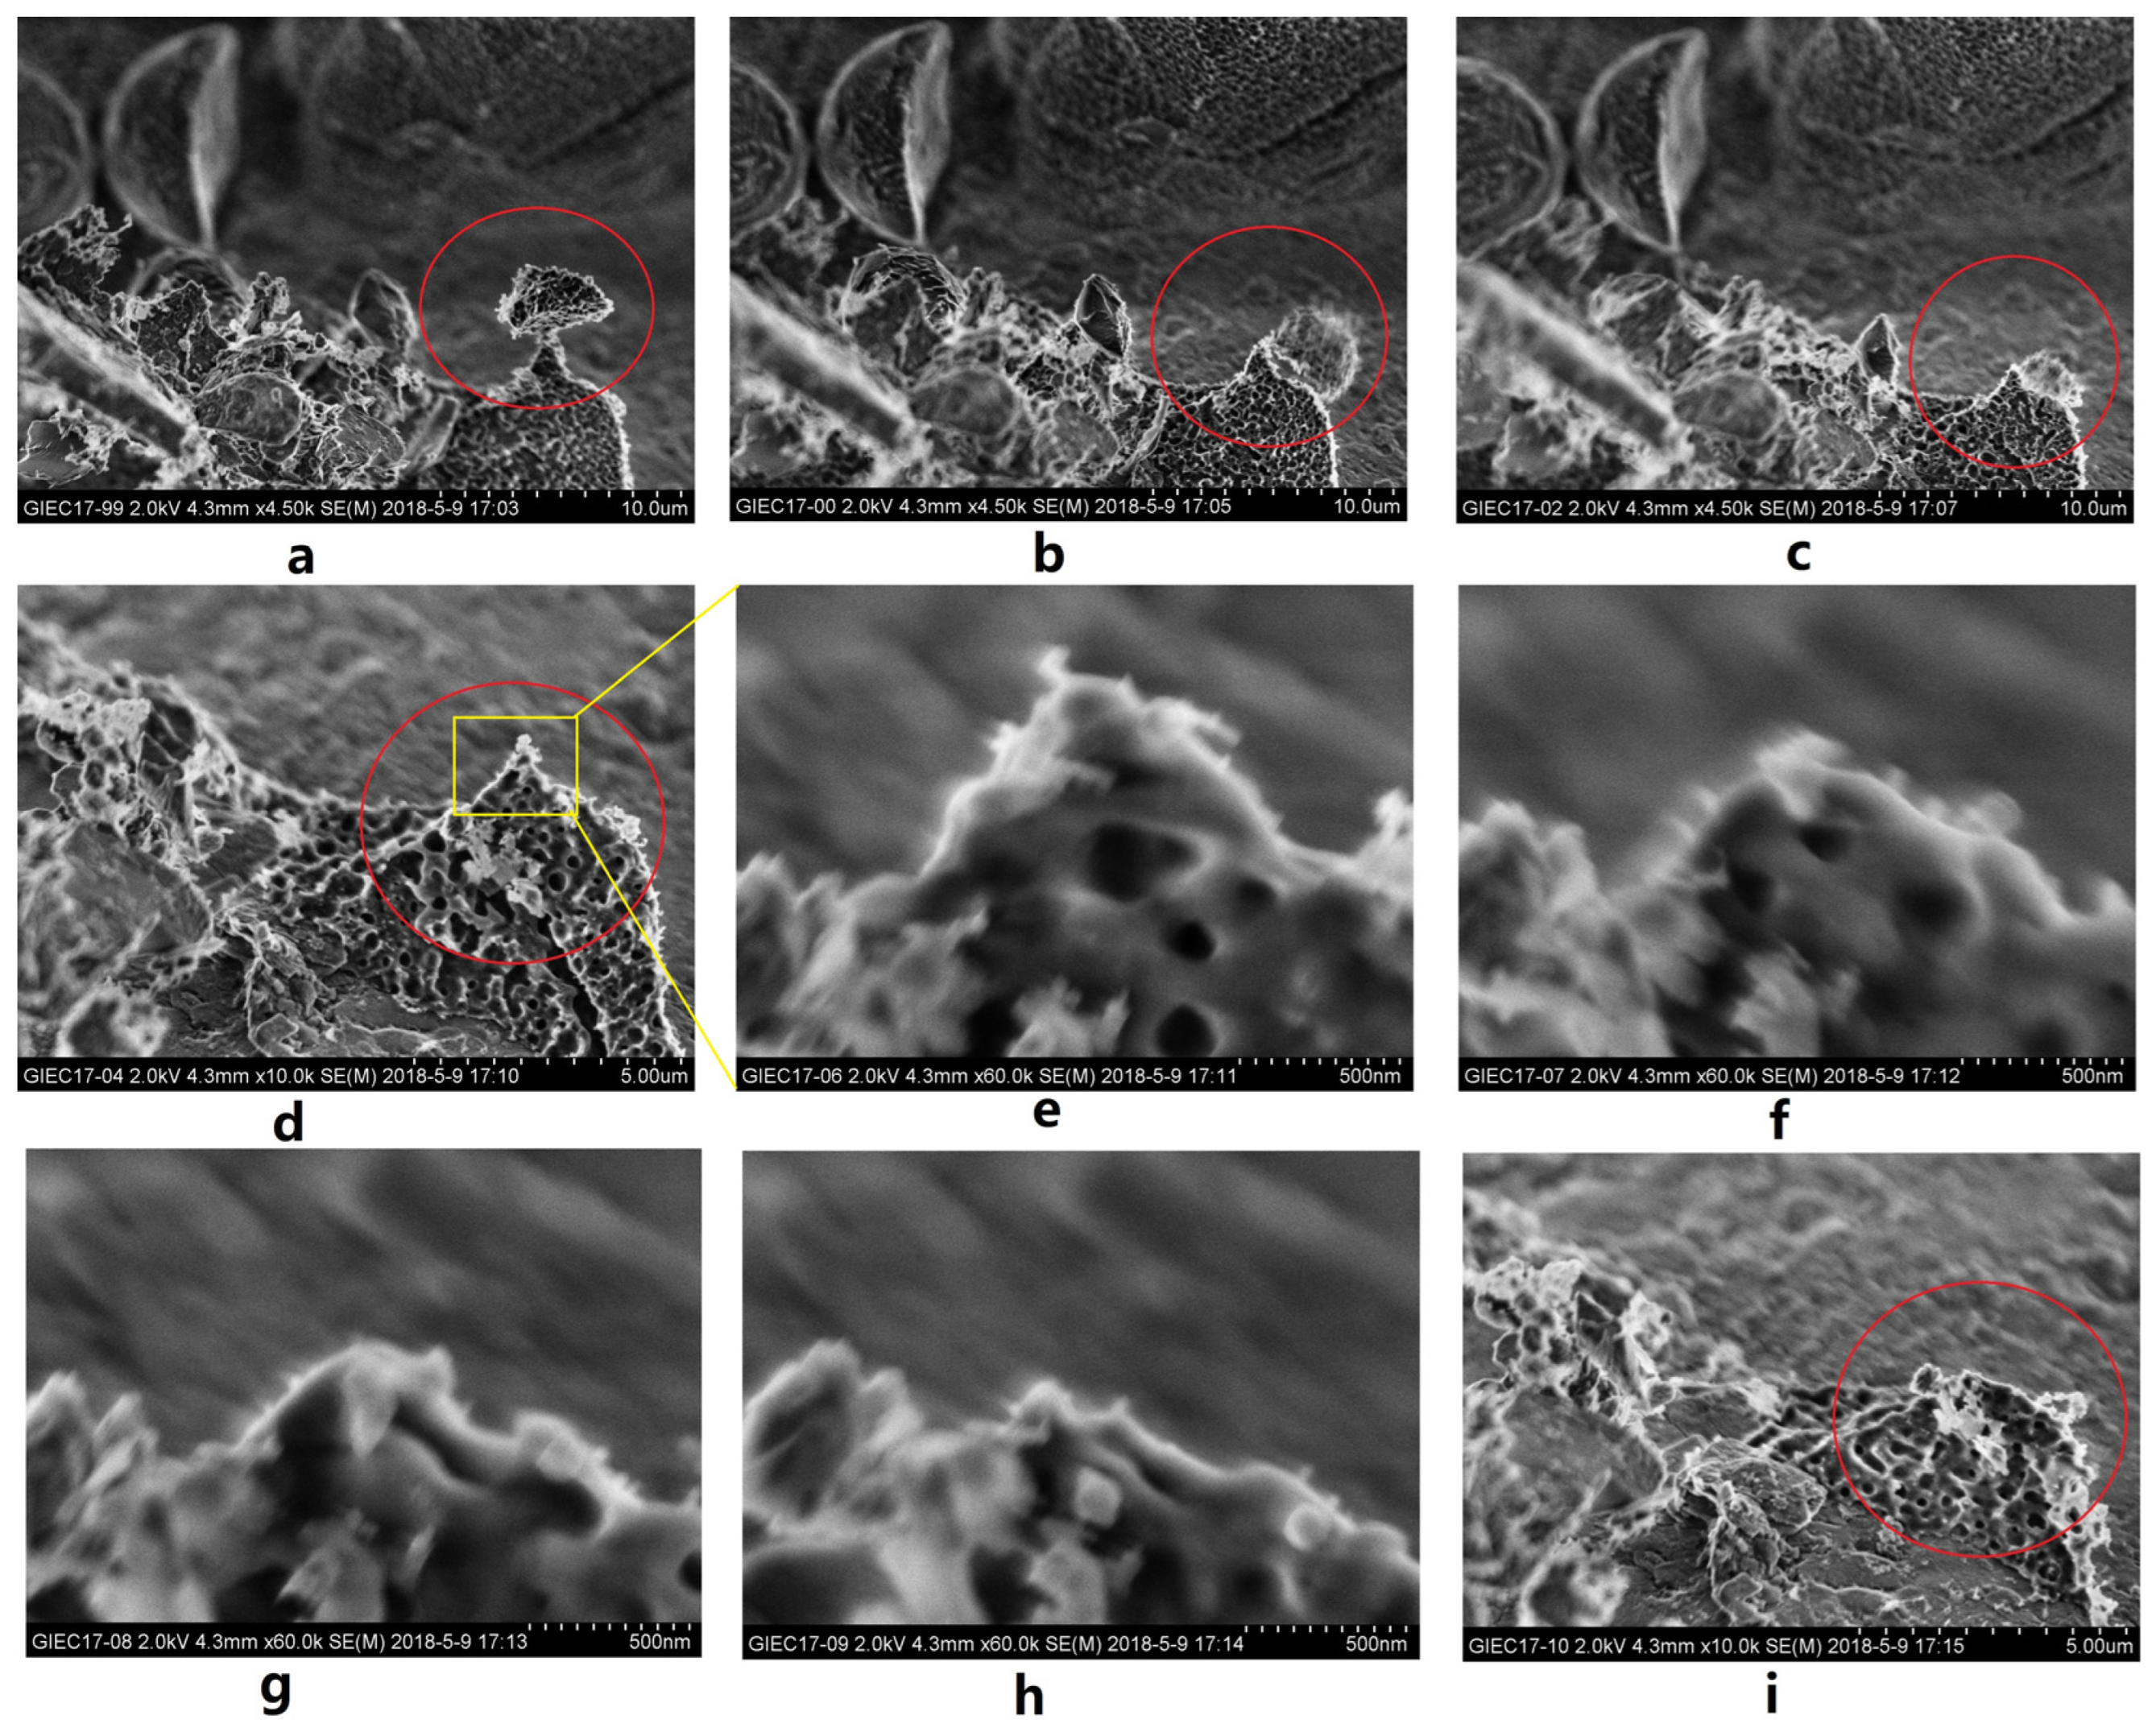
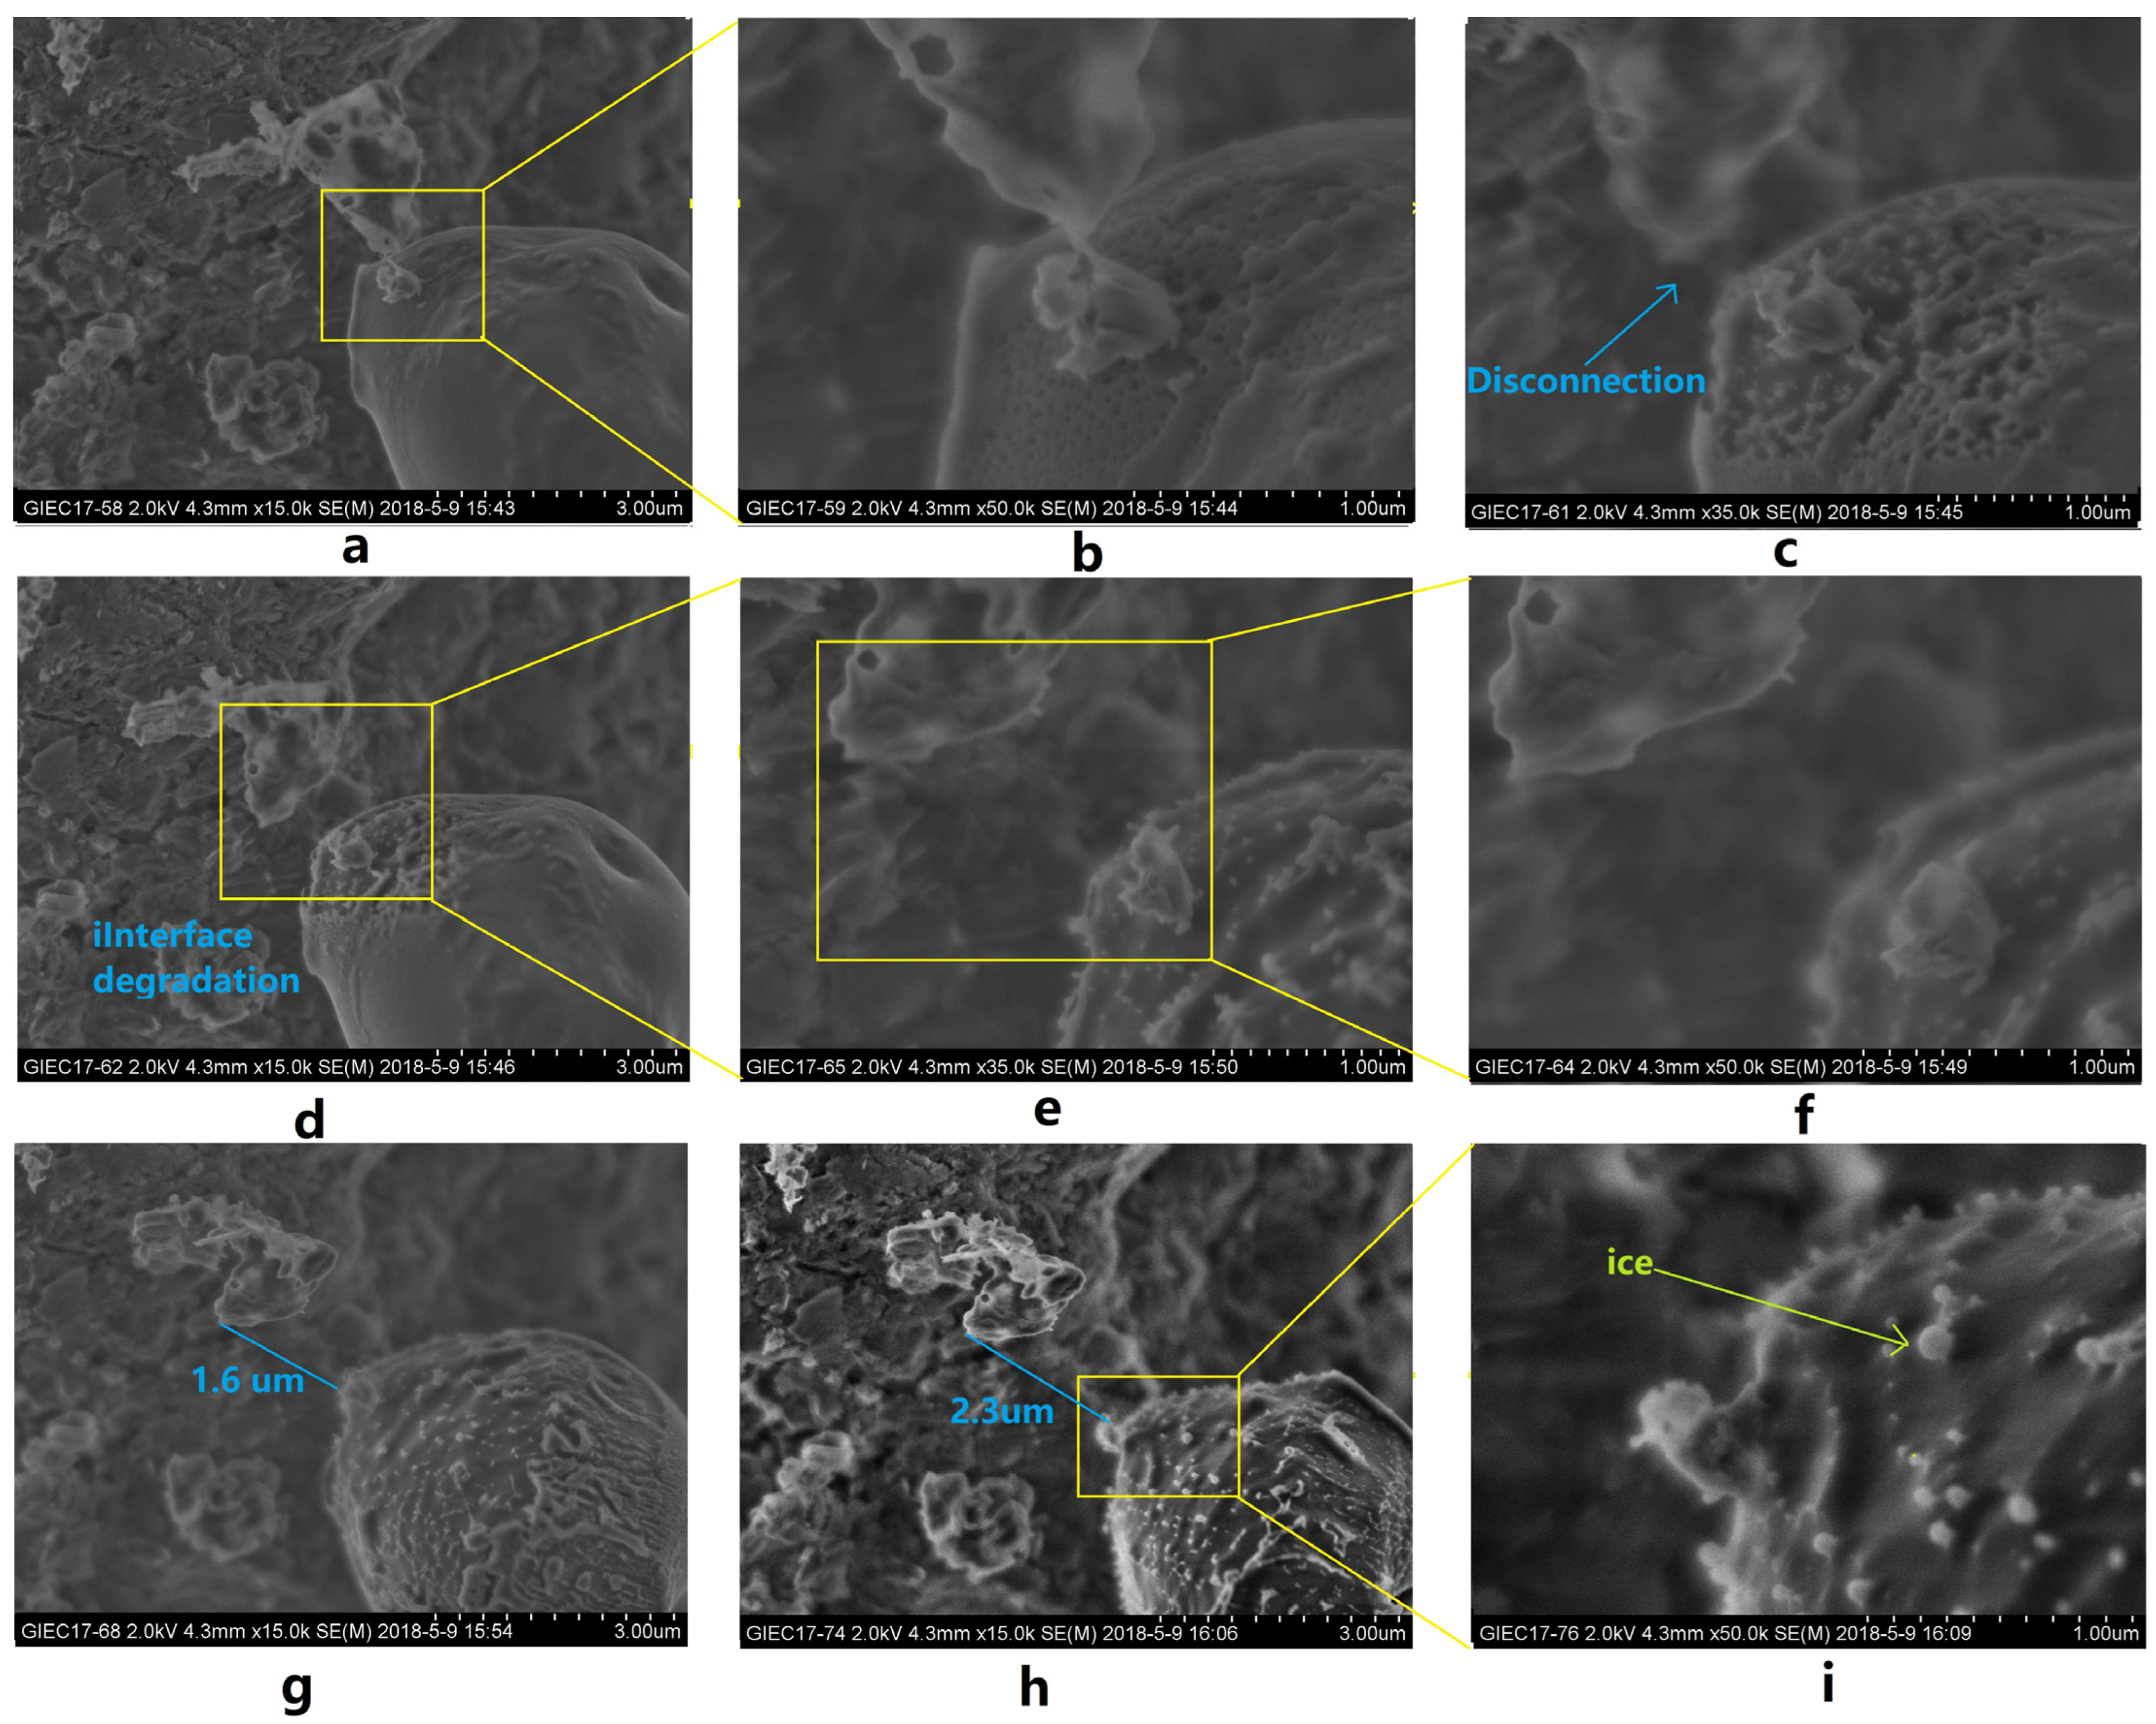
3.2. Characteristics of Microscopic Morphology during the NGH Decomposition Process in Sediments
4. Discussion
- (1)
- Solid NGH dissipation
- (2)
- Decomposed fluids from NGH.
- (2.1)
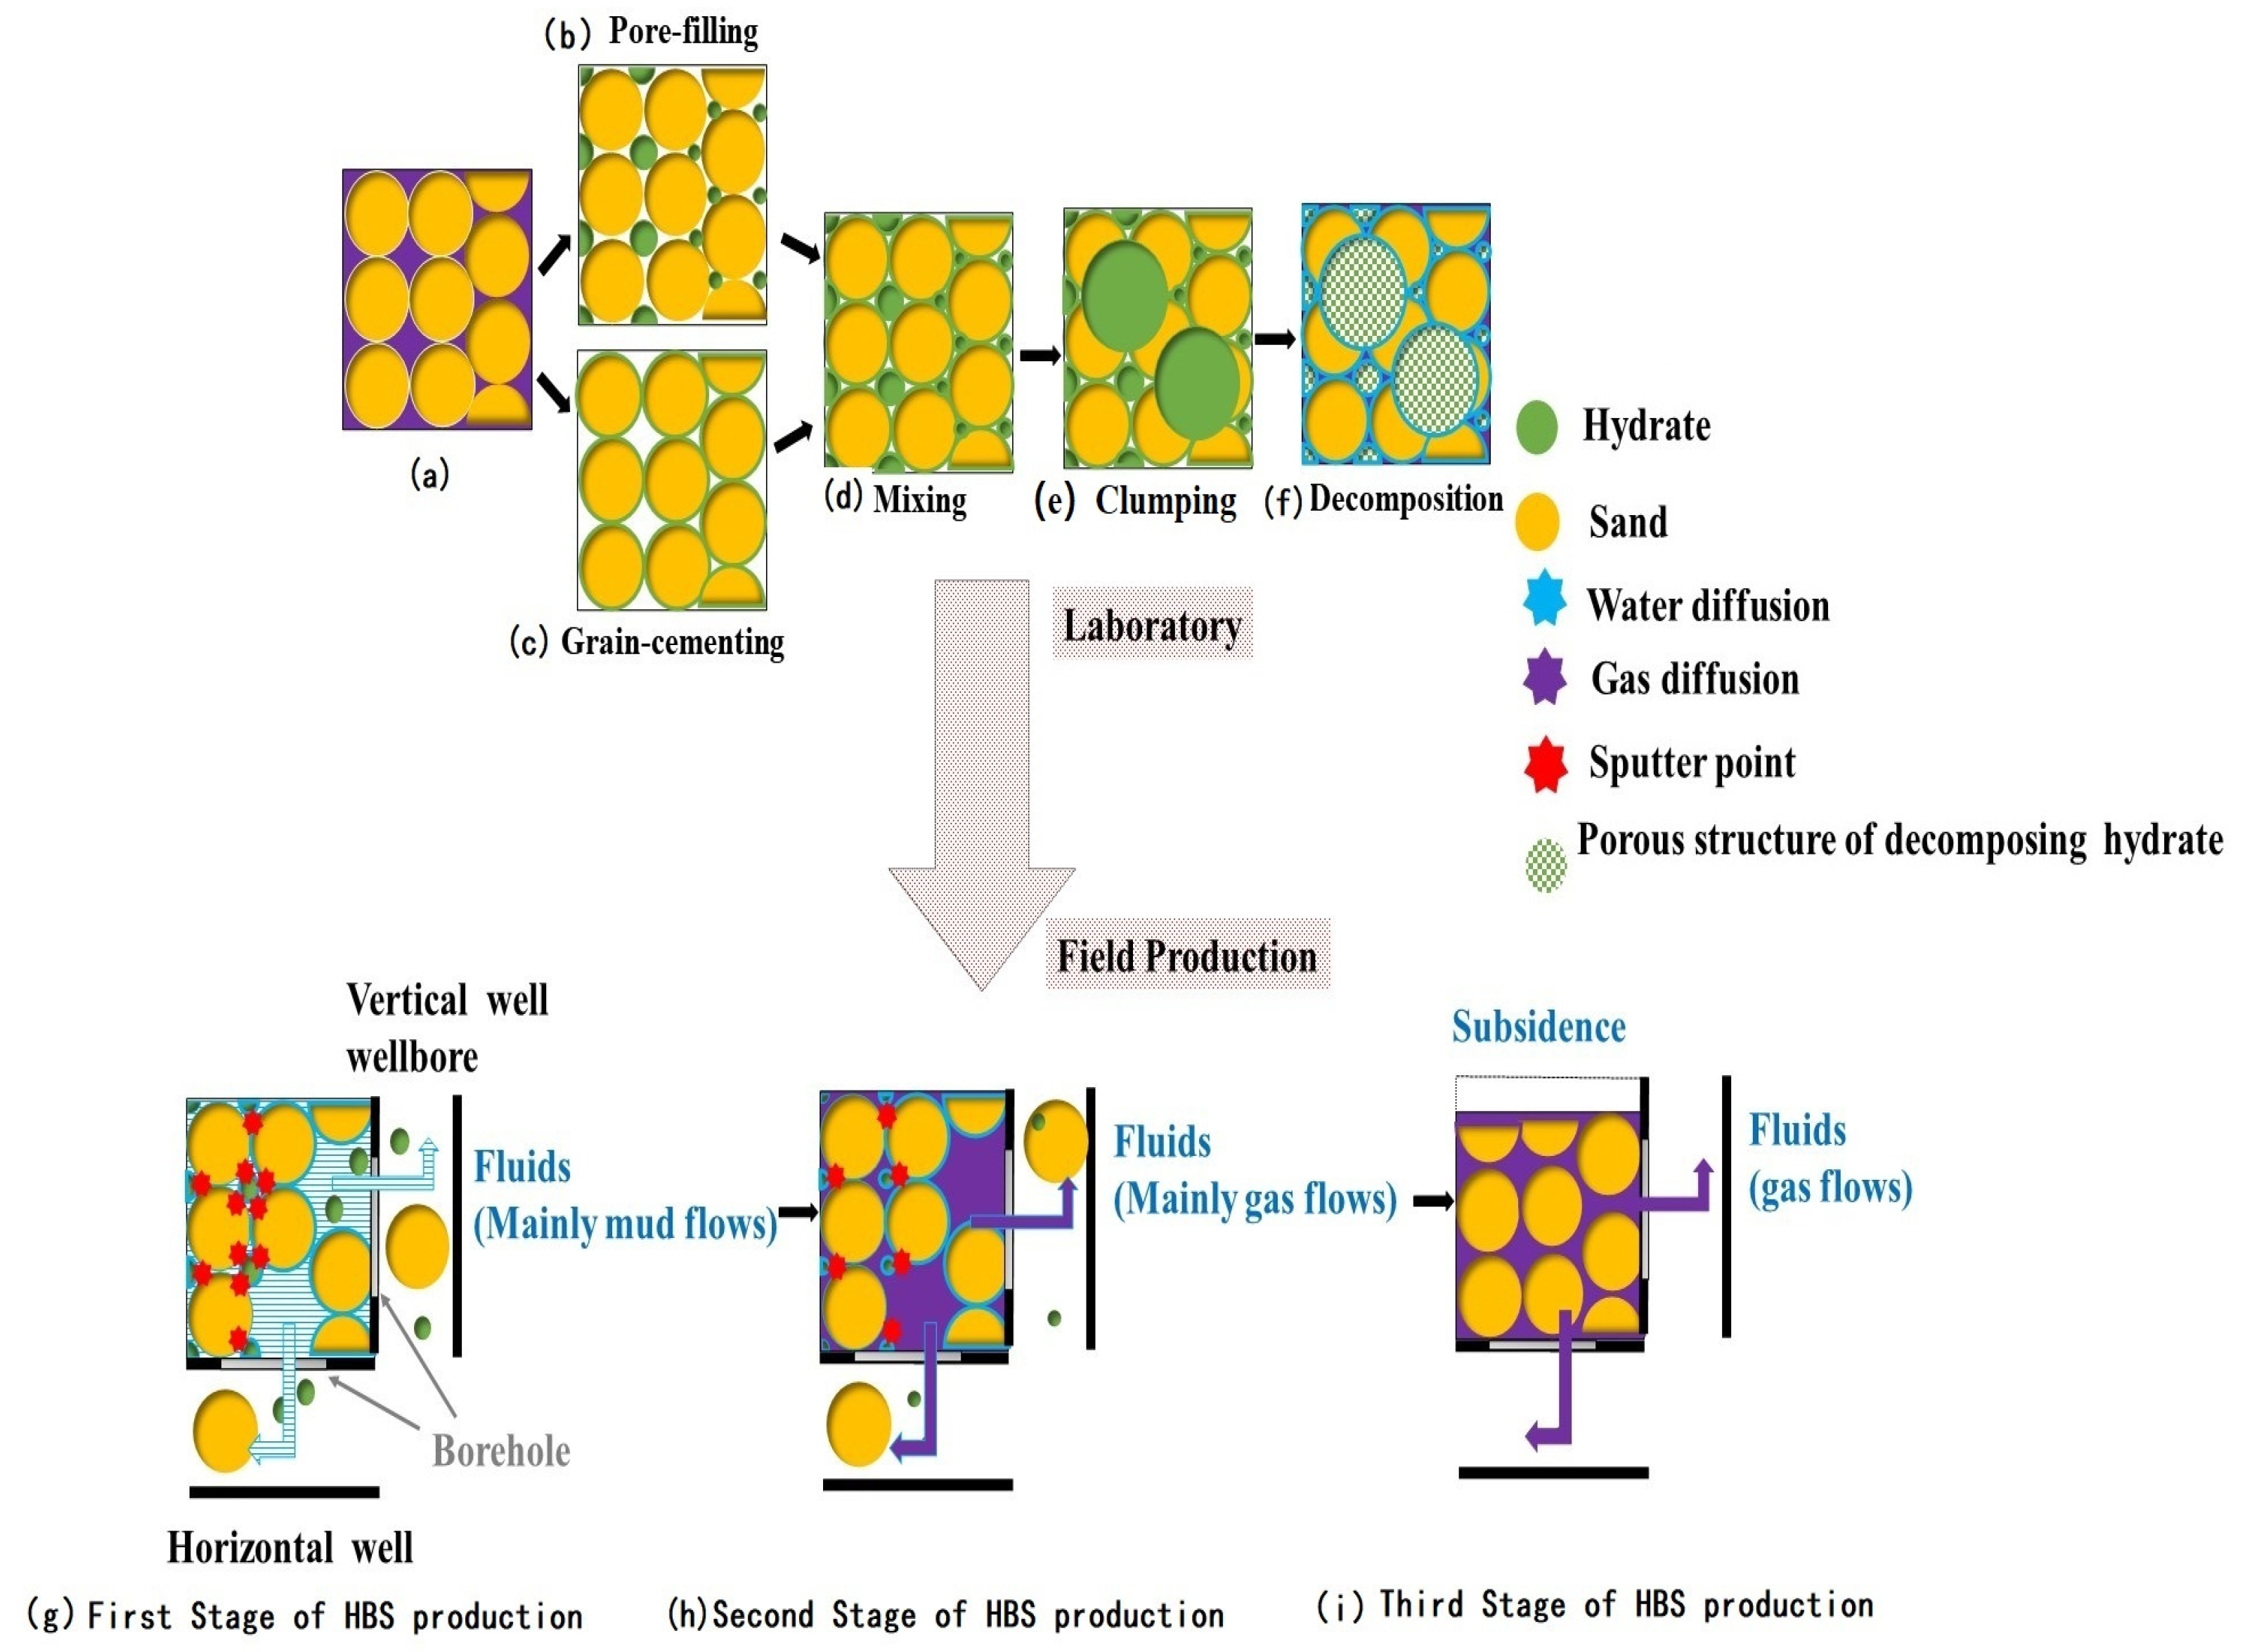
- The rapid expansion of the decomposed gas and decomposed water in space and the generation of expansion thrusts may have had a pushing effect on the surrounding solid particles (Figure 13a), while the fluid produced by NGH decomposition contributed to the driving force and displacement of sediment particles.
- (2.2)
- The decomposed water from the NGH may reduce the strength between the particles, soften the reservoir, and reduce the strength of the reservoir.
- (3)
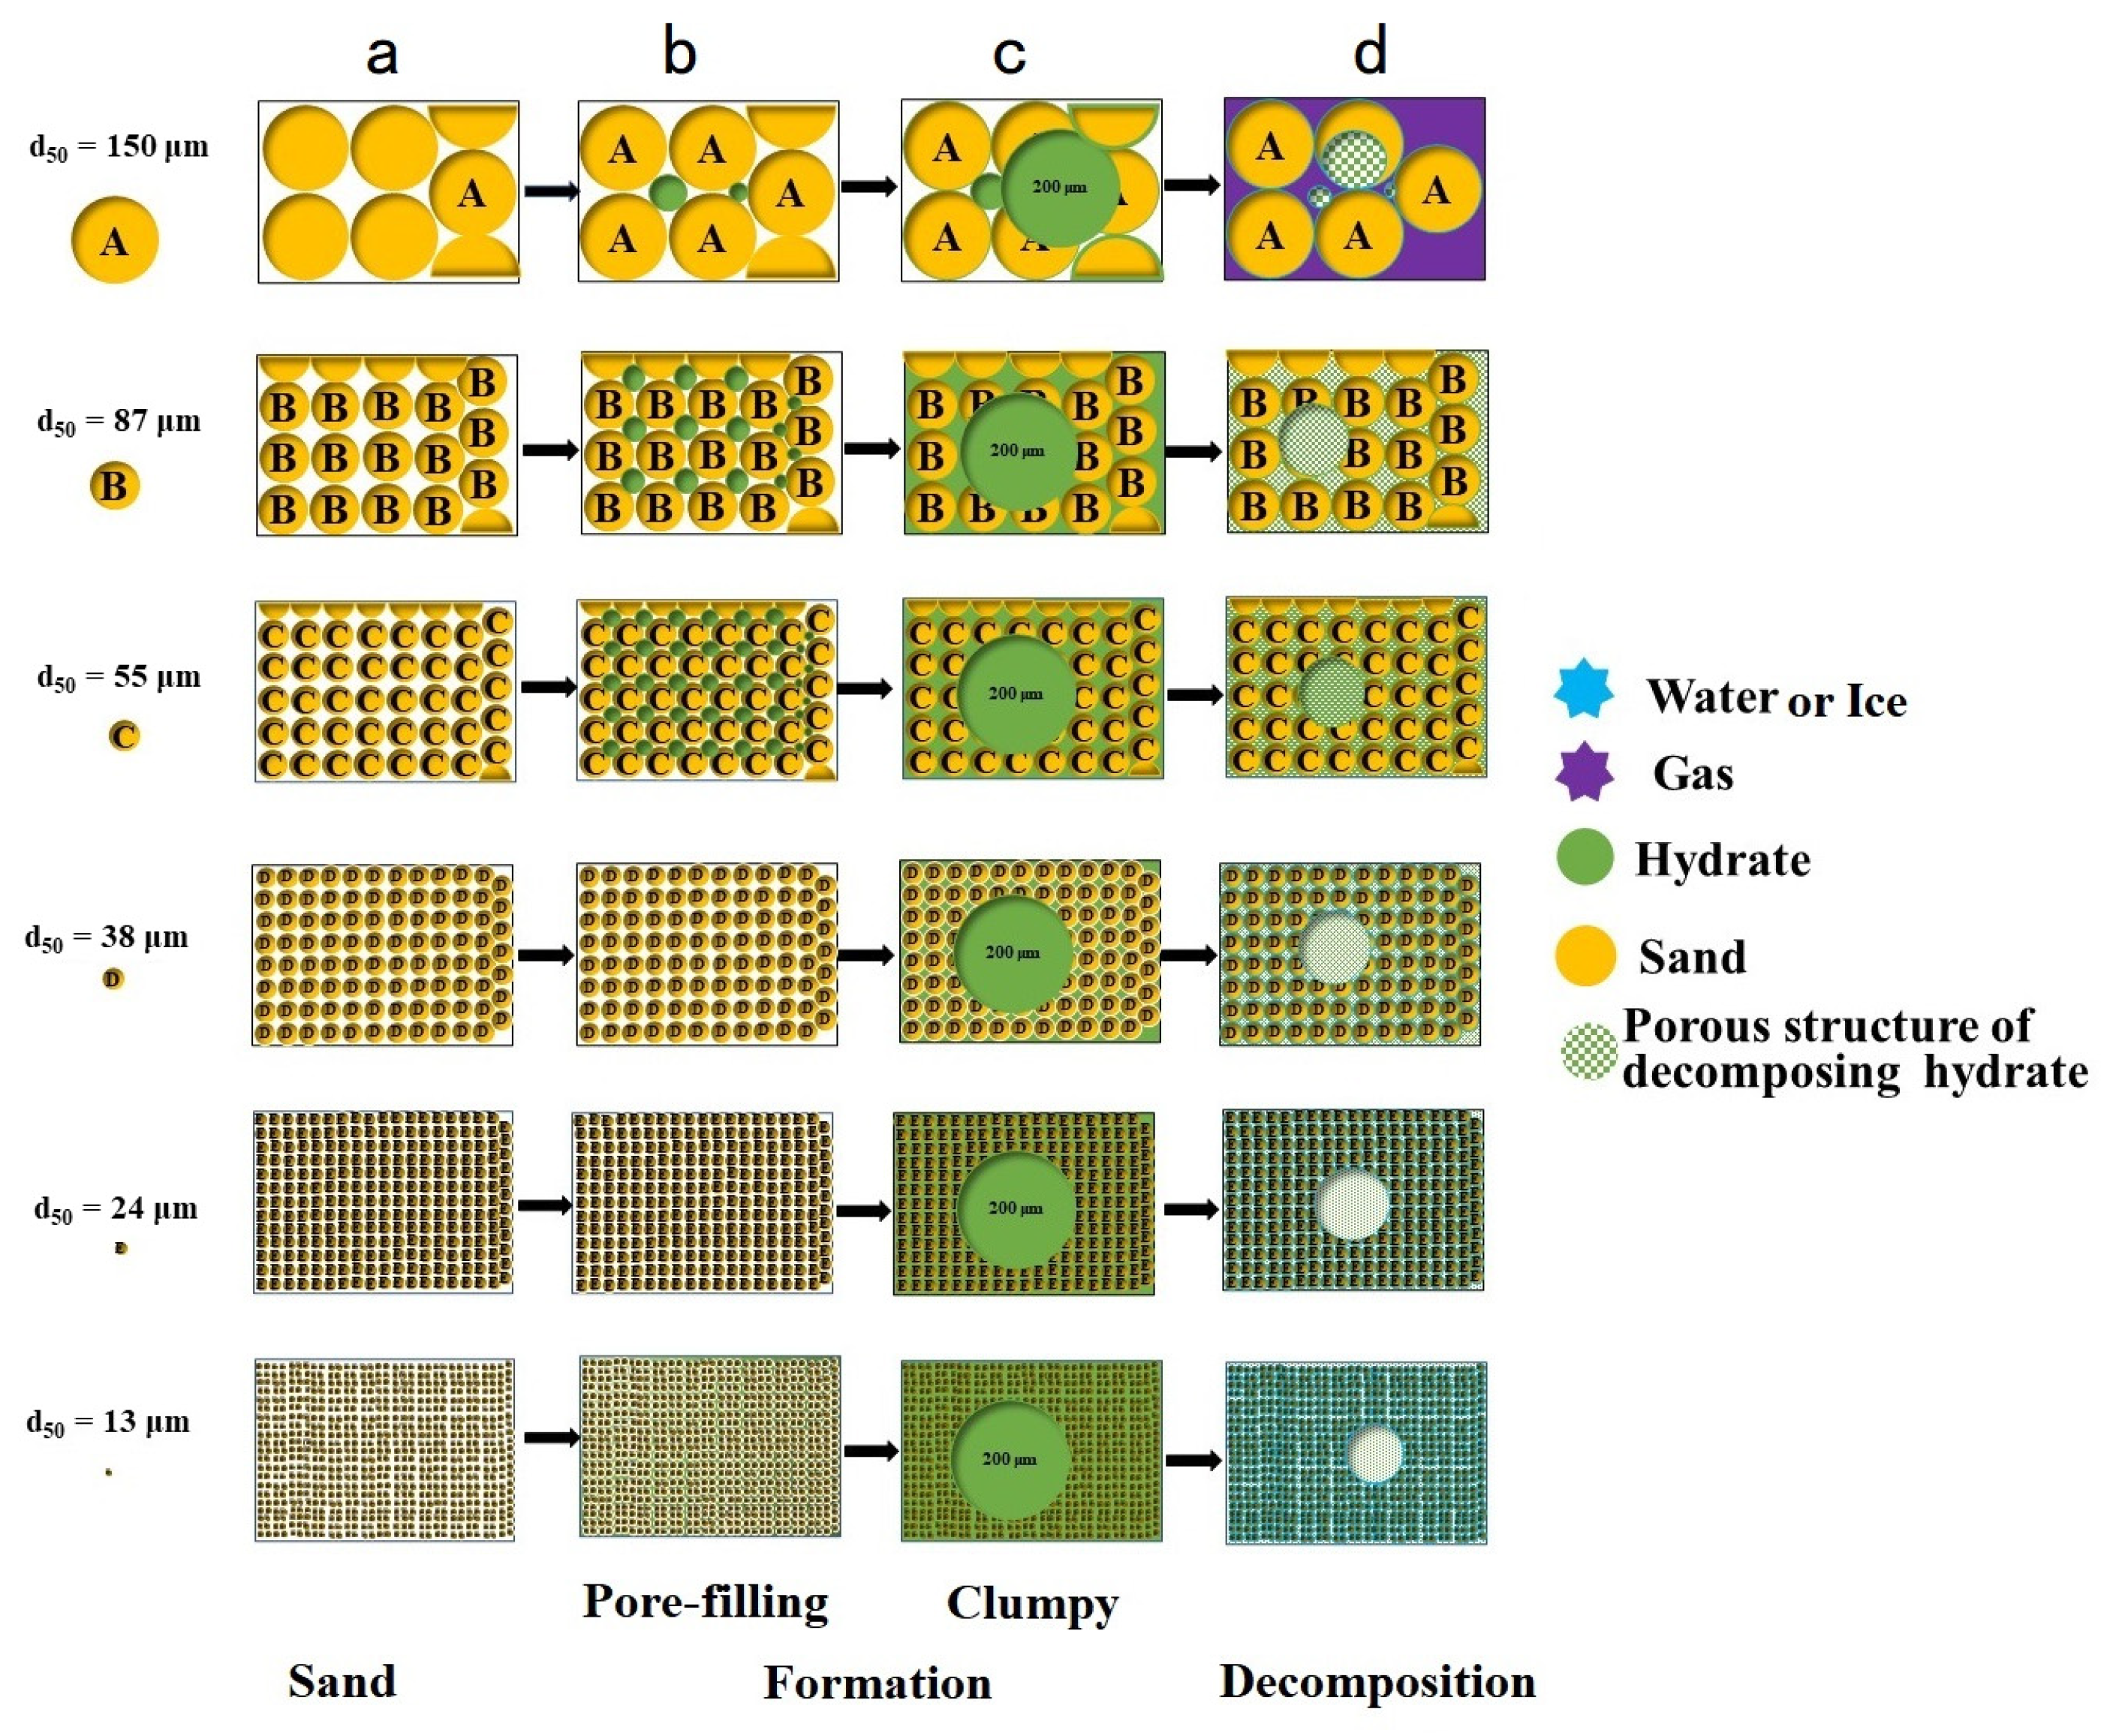
- The formation and decomposition of NGH have different effects on sediments with different particle sizes.
- (3.1)
- The volume proportion of NGH generated in small grain sediments was relatively large. Small grain sediments have stronger cementing and adhesion to (Figure 12a) NGH.
- (3.2)
- When the hydrate particles were larger than the sediment particles, the hydrate particles acted as “gravel packing” with the effect of sediment blocking, which may affect the sand control design accuracy (Figure 12b,c).
- (3.3)
- (4)
- The unique sand production mechanism of NGH
5. Conclusions
- (1)
- The solid gas hydrates decomposition increased pore space and decreased reservoir strength. The sand production, deformation, and subsidence of the NGH reservoir can be promoted jointly under the action of water decomposition and gas expansion, as well as the softening of water decomposition and overburden stress (crustal stress).
- (2)
- NGH decomposition had a more significate influence on small size sediments, which provides a reference for the selection of hydrate production target areas.
- (3)
- The gas hydrate particle size may be larger than the mud sand particle size in the reservoir and act as the “gravel” role, so the gas hydrate particle size cannot be ignored in the sand control design.
- (4)
- The complex coupling of the thermal-hydrological-mechanical-phase change in HBS would be affected by the different sizes of sand and hydrate. Rapid volume expansion, by decomposed gas and water from NGH, caused the solid particle sputtering (splashing). This is a unique process of sand production in gas hydrate wells, which is different from that in gas and oil wells.
Author Contributions
Funding
Institutional Review Board Statement
Informed Consent Statement
Data Availability Statement
Acknowledgments
Conflicts of Interest
References
- Sloan, E.D.; Koh, C.A. Clathrate Hydrates of Natural Gases; CRC Press: Boca Raton, FL, USA, 2007. [Google Scholar]
- Makogon, Y.F. Natural Gas Hydrates–A Promising Source of Energy. J. Nat. Gas Sci. Eng. 2010, 2, 49–59. [Google Scholar] [CrossRef]
- Yamamoto, K.; Wang, X.X.; Tamaki, M.; Suzuki, K. The Second Offshore Production of Methane Hydrate in the Nankai Trough and Gas Production Behavior from a Heterogeneous Methane Hydrate Reservoir. RSC Adv. 2019, 9, 25987–26013. [Google Scholar] [CrossRef] [PubMed] [Green Version]
- Zhang, Y.; Wang, W.; Zhang, P.; Li, G.; Tian, S.; Lu, J.; Zhang, B. A Solution to Sand Production from Natural Gas Hydrate Deposits with Radial Wells: Combined Gravel Packing and Sand Screen. J. Mar. Sci. Eng. 2022, 10, 71. [Google Scholar] [CrossRef]
- Hornbach, M.J.; Saffer, D.M.; Holbrook, W.S. Critically Pressured Free-Gas Reservoirs below Gas-Hydrate Provinces. Nature 2004, 427, 142–144. [Google Scholar] [CrossRef]
- Wu, Y.; Li, N.; Hyodo, M.; Gu, M.; Cui, J.; Spencer, B.F. Modeling the Mechanical Response of Gas Hydrate Reservoirs in Triaxial Stress Space. Int. J. Hydrogen Energy 2019, 44, 26698–26710. [Google Scholar] [CrossRef]
- Li, Y.; Liu, W.; Zhu, Y.; Chen, Y.; Song, Y.; Li, Q. Mechanical Behaviors of Permafrost-Associated Methane Hydrate-Bearing Sediments under Different Mining Methods. Appl. Energy 2016, 162, 1627–1632. [Google Scholar] [CrossRef]
- Li, B.; Chen, L.-L.; Wan, Q.-C.; Han, X.; Wu, Y.-Q.; Luo, Y.-J. Experimental Study of Frozen Gas Hydrate Decomposition towards Gas Recovery from Permafrost Hydrate Deposits below Freezing Point. Fuel 2020, 280, 118557. [Google Scholar] [CrossRef]
- Wang, Y.; Feng, J.C.; Li, X.S.; Zhang, Y.; Chen, Z.Y. Fluid Flow Mechanisms and Heat Transfer Characteristics of Gas Recovery from Gas-Saturated and Water-Saturated Hydrate Reservoirs. Int. J. Heat Mass Transf. 2018, 118, 1115–1127. [Google Scholar] [CrossRef]
- Fan, S.; Yu, C.; Lang, X.; Wang, Y.; Chen, J. Micro-Nano-Scale Studies on Occurrence and Gas Production and Storage Technology of Marine Gas Hydrates. Diqiu Kexue–Zhongguo Dizhi Daxue Xuebao/Earth Sci. J. China Univ. Geosci. 2018, 43, 1542–1548. [Google Scholar] [CrossRef]
- Wang, S.; Fan, S.; Lang, X.; Wang, Y.; Wang, P. Particle Size Dependence of Clathrate Hydrate Particle Cohesion in Liquid/Gaseous Hydrocarbons. Fuel 2020, 259, 116201. [Google Scholar] [CrossRef]
- Li, S.; Sun, C.; Chen, G. Review on Hydrate Film Growth Kinetics. Sci. Sin. Chim. 2014, 44, 864. [Google Scholar] [CrossRef]
- Wu, N.; Liu, C.; Hao, X. Experimental Simulations and Methods for Natural Gas Hydrate Analysis in China. China Geol. 2018, 1, 61–71. [Google Scholar] [CrossRef]
- Stern, L.A.; Kirby, S.H.; Durham, W.B. Peculiarities of Methane Clathrate Hydrate Formation and Solid-State Deformation, Including Possible Superheating of Water Ice. Science 1996, 273, 1843–1848. [Google Scholar] [CrossRef]
- Wadham, J.L.; Arndt, S.; Tulaczyk, S.; Stibal, M.; Tranter, M.; Telling, J.; Lis, G.P.; Lawson, E.; Ridgwell, A.; Dubnick, A.; et al. Potential Methane Reservoirs beneath Antarctica. Nature 2012, 488, 633–637. [Google Scholar] [CrossRef] [PubMed]
- Klapp, S.A.; Hemes, S.; Klein, H.; Bohrmann, G.; MacDonald, I.; Kuhs, W.F. Grain Size Measurements of Natural Gas Hydrates. Mar. Geol. 2010, 274, 85–94. [Google Scholar] [CrossRef]
- Kuhs, W.F.; Klapproth, A.; Gotthardt, F. The Formaiton of Meso- and Macroporous Gas Hydrates. Geophys. Res. Lett. 2000, 27, 2929–2932. [Google Scholar] [CrossRef]
- Stern, L.A.; Kirby, S.H.; Durham, W.B. Scanning Electron Microscope Imaging of Grain Structure and Phase Distribution within Gas-Hydrate-Bearing Intervals from JAPEX/JNOC/GSC et al. Mallik 5L-38: What Can We Learn from Comparisons with Laboratory-Synthesized Samples? Geol. Surv. Canada Bull. 2005, 585, 19. [Google Scholar]
- Kou, X.; Li, X.-S.; Wang, Y.; Wan, K.; Chen, Z.-Y. Microscale Experiment and Pore-Network Modeling Analysis of Growth Habit, Pore Structure, and Permeability of Hydrate-Bearing Sediments. Energy Fuels 2021, 35, 8773–8785. [Google Scholar] [CrossRef]
- Kou, X.; Li, X.-S.; Wang, Y.; Liu, J.-W.; Chen, Z.-Y. Heterogeneity of Hydrate-Bearing Sediments: Definition and Effects on Fluid Flow Properties. Energy 2021, 229, 120736. [Google Scholar] [CrossRef]
- Klapp, S.A.; Klein, H.; Kuhs, W.F. First Determination of Gas Hydrate Crystallite Size Distributions Using High-Energy Synchrotron Radiation. Geophys. Res. Lett. 2007, 34, 1–5. [Google Scholar] [CrossRef]
- Li, Y.; Ning, F.; Wu, N.; Chen, Q.; Nouri, A.; Hu, G.; Sun, J.; Kuang, Z.; Meng, Q. Protocol for Sand Control Screen Design of Production Wells for Clayey Silt Hydrate Reservoirs: A Case Study. Energy Sci. Eng. 2020, 8, 1438–1449. [Google Scholar] [CrossRef]
- Lu, J.; Xiong, Y.; Li, D.; Shen, X.; Wu, Q.; Liang, D. Experimental Investigation of Characteristics of Sand Production in Wellbore during Hydrate Exploitation by the Depressurization Method. Energies 2018, 11, 1673. [Google Scholar] [CrossRef] [Green Version]
- Dong, C.; Wang, L.; Zhou, Y.; Huang, F.; Song, Y.; Zhou, B.; Xu, H. Microcosmic Retaining Mechanism and Behavior of Screen Media with Highly Argillaceous Fine Sand from Natural Gas Hydrate Reservoir. J. Nat. Gas Sci. Eng. 2020, 83, 103618. [Google Scholar] [CrossRef]
- Lu, J.S.; Li, D.L.; He, Y.; Shi, L.L.; Liang, D.Q.; Xiong, Y.M. Experimental Study of Sand Production during Depressurization Exploitation in Hydrate Silty-Clay Sediments. Energies 2019, 12, 4268. [Google Scholar] [CrossRef] [Green Version]
- Lu, J.; Li, D.; Liang, D.; Shi, L.; He, Y.; Xiong, Y. Experimental Research on the Dynamic Permeability of Hydrate Silty-Clay Reservoirs during Water Driven and Exploitation. J. Nat. Gas Sci. Eng. 2021, 94, 104071. [Google Scholar] [CrossRef]
- Chen, Y.; Sun, X.; Yan, T.; Yao, D.; Duan, R. Experimental Study on Micron-Sized Sand Particles Transport in the Water Flow Path of Hydrates Production Wellbore. J. Nat. Gas Sci. Eng. 2020, 73, 103088. [Google Scholar] [CrossRef]
- Wen, L.; Zhou, X.; Liang, D. Microscopic Measurements on the Decomposition Behaviour of Methane Hydrates Formed in Natural Sands. RSC Adv. 2019, 9, 14727–14735. [Google Scholar] [CrossRef] [Green Version]
- Stern, L.A.; Lorenson, T.D. Grain-Scale Imaging and Compositional Characterization of Cryo-Preserved India NGHP 01 Gas-Hydrate-Bearing Cores. Mar. Pet. Geol. 2014, 58, 206–222. [Google Scholar] [CrossRef] [Green Version]
- Lei, L.; Santamarina, J.C. Physical Properties of Fine-Grained Sediments with Segregated Hydrate Lenses. Mar. Pet. Geol. 2019, 109, 899–911. [Google Scholar] [CrossRef]
- Xu, C.G.; Yan, R.; Fu, J.; Zhang, S.H.; Yan, K.F.; Chen, Z.Y.; Xia, Z.M.; Li, X. Sen Insight into Micro-Mechanism of Hydrate-Based Methane Recovery and Carbon Dioxide Capture from Methane-Carbon Dioxide Gas Mixtures with Thermal Characterization. Appl. Energy 2019, 239, 57–69. [Google Scholar] [CrossRef]
- Kou, B.; Cao, Y.; Li, J.; Xia, C.; Li, Z.; Dong, H.; Zhang, A.; Zhang, J.; Kob, W.; Wang, Y. Granular Materials Flow like Complex Fluids. Nature 2017, 551, 360–363. [Google Scholar] [CrossRef] [PubMed] [Green Version]
- Lei, L.; Santamarina, J.C. Laboratory Strategies for Hydrate Formation in Fine-Grained Sediments. J. Geophys. Res. Solid Earth 2018, 123, 2583–2596. [Google Scholar] [CrossRef]
- Santamarina, J.C. Soils and Waves; Wiley: Hoboken, NJ, USA, 2001; Volume 1, ISBN 047149058X. [Google Scholar]
- Lu, J.; Xiong, Y.; Li, D.; Liang, D.; Jin, G.; He, Y.; Shen, X. Experimental Study on Sand Production and Sea Bottom Subsidence of Non-Diagenetic Hydrate Reservoirs in Depressurization Production. Mar. Geol. Quat. Geol. 2019, 39, 13. [Google Scholar] [CrossRef]


| Index | Key Parameters |
|---|---|
| Resolution ratio | 1 nm (15 kV), 2 nm (1 kV) |
| Acceleration voltage | 0.5–30 kV |
| Amplification factor | x20–x800000 |
| 3-axis motor drive sample table: | moving range: X: 0–50 mm; Y: 50 mm; Z: 1.5–30 mm; T: −5–+70°; R: 360° |
| Maximum sample size: | 100 mm |
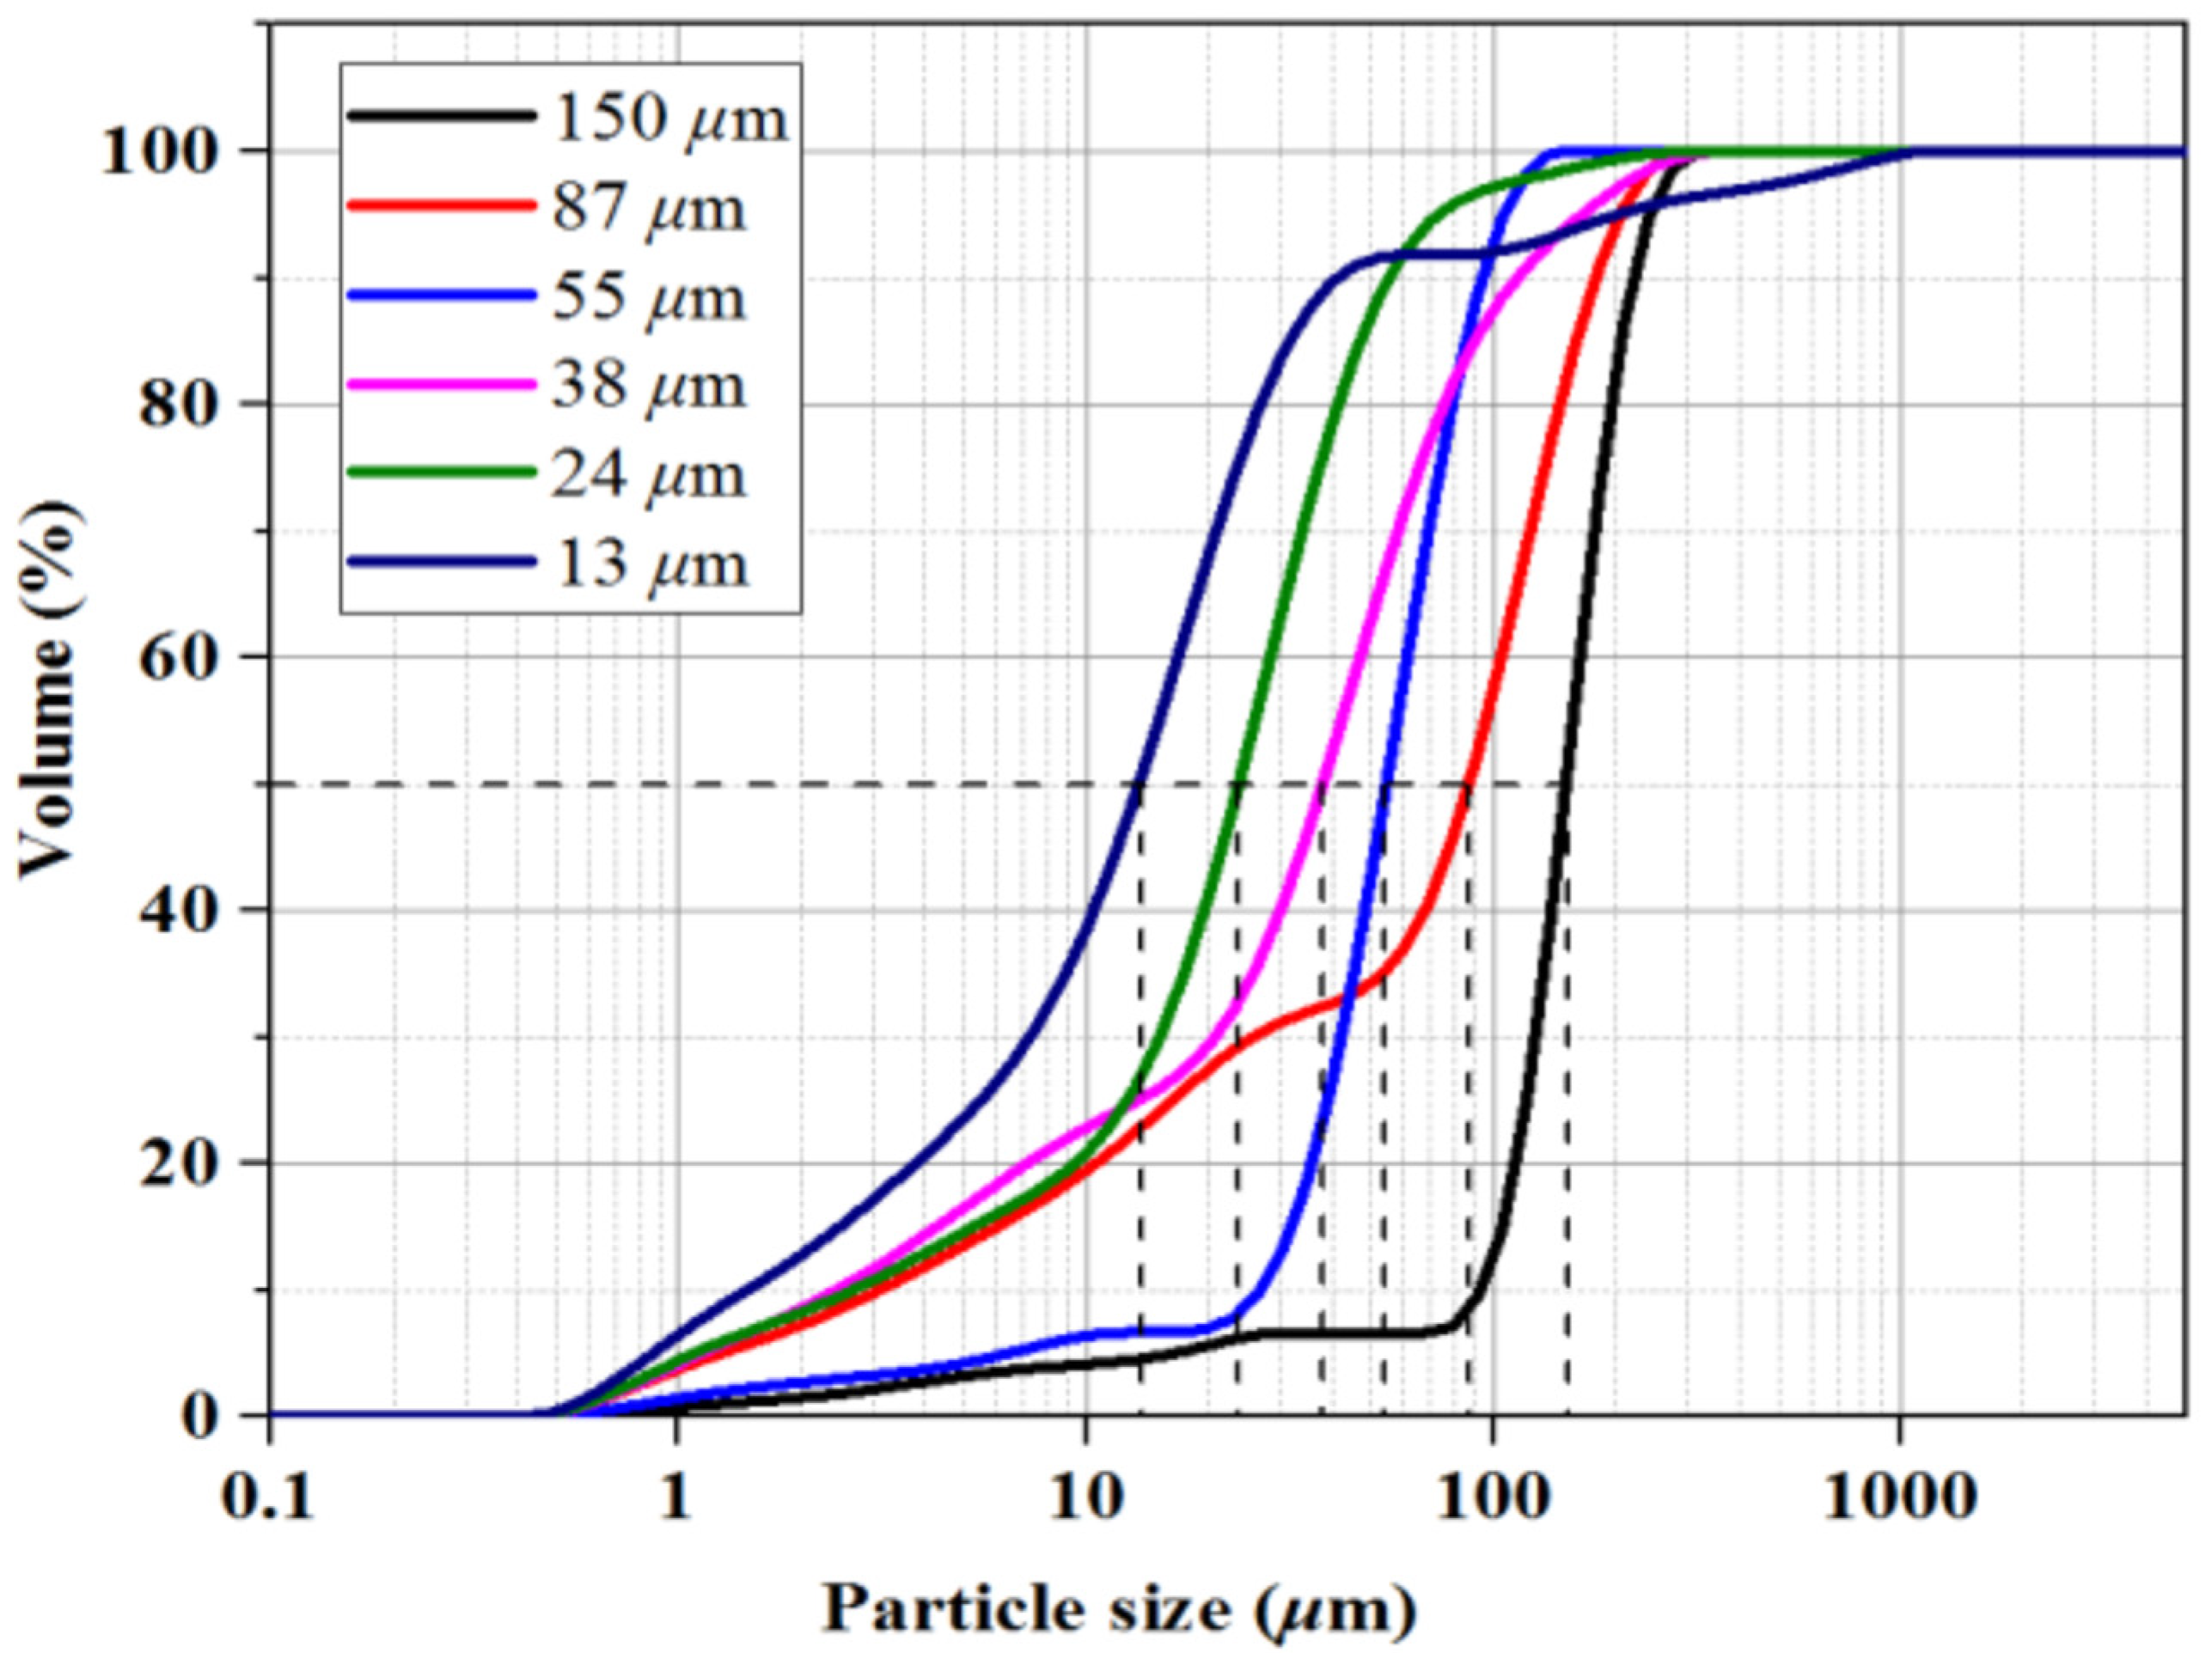
| Type | Screen (Mesh) | Sediments d50 (µm) | Sediment Classification | Initial Porosity (%) | Hydrate Saturation (%) |
|---|---|---|---|---|---|
| A | 100–150 | 150 | fine sand | 42.11 | 35.61 |
| B | 150–200 | 87 | very fine sand | 41.91 | 34.32 |
| C | 200–300 | 55 | coarse silt | 38.13 | 36.25 |
| D | 300–500 | 38 | coarse silt | 38.66 | 35.01 |
| E | 500–1000 | 24 | medium silt | 38.04 | 33.22 |
| F | 1000–2000 | 13 | fine silt | 37.84 | 32.43 |
Publisher’s Note: MDPI stays neutral with regard to jurisdictional claims in published maps and institutional affiliations. |
© 2022 by the authors. Licensee MDPI, Basel, Switzerland. This article is an open access article distributed under the terms and conditions of the Creative Commons Attribution (CC BY) license (https://creativecommons.org/licenses/by/4.0/).
Share and Cite
Lu, J.; Lin, D.; Li, D.; Liang, D.; Wen, L.; Wu, S.; Zhang, Y.; He, Y.; Shi, L.; Xiong, Y. Microcosmic Characteristics of Hydrate Formation and Decomposition in the Different Particle Size Sediments Captured by Cryo-SEM. J. Mar. Sci. Eng. 2022, 10, 769. https://doi.org/10.3390/jmse10060769
Lu J, Lin D, Li D, Liang D, Wen L, Wu S, Zhang Y, He Y, Shi L, Xiong Y. Microcosmic Characteristics of Hydrate Formation and Decomposition in the Different Particle Size Sediments Captured by Cryo-SEM. Journal of Marine Science and Engineering. 2022; 10(6):769. https://doi.org/10.3390/jmse10060769
Chicago/Turabian StyleLu, Jingsheng, Decai Lin, Dongliang Li, Deqing Liang, Long Wen, Siting Wu, Yiqun Zhang, Yong He, Lingli Shi, and Youming Xiong. 2022. "Microcosmic Characteristics of Hydrate Formation and Decomposition in the Different Particle Size Sediments Captured by Cryo-SEM" Journal of Marine Science and Engineering 10, no. 6: 769. https://doi.org/10.3390/jmse10060769
APA StyleLu, J., Lin, D., Li, D., Liang, D., Wen, L., Wu, S., Zhang, Y., He, Y., Shi, L., & Xiong, Y. (2022). Microcosmic Characteristics of Hydrate Formation and Decomposition in the Different Particle Size Sediments Captured by Cryo-SEM. Journal of Marine Science and Engineering, 10(6), 769. https://doi.org/10.3390/jmse10060769