Article

Characteristics of Economic and Environmental Benefits of Shore Power Use by Container-Ship Size

Korea Institute of Maritime and Fisheries Technology, Busan 49111, Korea
J. Mar. Sci. Eng. 2022, 10(5), 622; https://doi.org/10.3390/jmse10050622
Submission received: 20 March 2022 / Revised: 27 April 2022 / Accepted: 29 April 2022 / Published: 2 May 2022
(This article belongs to the Special Issue Marine Alternative Fuels and Environmental Protection II)

Abstract

:
To combat climate change, efforts to reduce greenhouse gas (GHG) emissions are being made in all industries. The shipping sector is also one of the industries that emits GHG, including carbon. One way to reduce GHG emissions in the shipping sector is to use shore power (SP) rather than auxiliary engines during berthing. Port authorities are actively expanding SP facilities because it is possible to achieve the long-term goals of environmental benefits and green ports. However, the low economic feasibility of SP is a stumbling block for ship operators. Therefore, in this study, an economic analysis of SP use was conducted by container-ship size from the perspective of ship operators in consideration of benefits from differences in fuel oil and electricity prices, benefits through carbon emission reduction, and incentives from the port authorities. The result of the analysis showed that the benefit from the price of oil as well as the converted benefit from carbon emission reduction increased according to the size of the vessels. The economic analysis of a single port confirmed that small ships providing feeder services presented economic feasibility due to low installation costs and increased number of calls, while insufficient economic feasibility was presented for large ships above the old Panamax class due to the increased costs for installation. However, economic feasibility differs widely depending on whether port incentives are provided, and it was estimated that even large ships will be able to secure the economic feasibility of using SP if additional calls are made to ports that provide similar policy advantages.

1. Introduction

One of the recent global concerns is the reduction of GHG (greenhouse gas) emissions. It was analyzed that in order to keep the global average temperature rise within 2 °C, global GHG emissions should be reduced by 40~70% by 2050 compared to 2010, and the level should be maintained close to 0 by 2100 [1]. This scenario with GHG emissions requires the enforcement of strong emission regulations across all industries. The shipping industry is also one of the representative industries reducing GHG emissions. Based on the BAU (business as usual) scenario, which is implemented under the assumption that there are no new regulations affecting energy efficiency and carbon intensity, the CO2 emissions in the shipping sector will increase from 1000 Mt in 2018 to 1000–1500 Mt in 2050, increasing by 0–50% [2].
Accordingly, the International Maritime Organization (IMO) aims to reduce the carbon intensity of international shipping in order to reduce GHG emissions. Ships are required to change their technologies and operational measures to meet IMO’s requirements for carbon emission reduction. However, most carbon emission reduction methods are greatly affected by sea conditions, routes, and sailing patterns [3]. One way to reduce these effects and reduce carbon emissions from ships in a relatively consistent manner is to reduce the carbon generated during berthing. One such method is to limit carbon dioxide emissions during berthing through shore-based use. Shore power or onshore power supply (OPS) is known as AMP (alternative maritime power), cold ironing, shore-side electricity, etc., and refers to the use of onshore electric facilities, not the diesel auxiliary engine of the ship for generating electricity in port [4]. In general, when a ship is in port, an auxiliary diesel engine must be operated to supply electricity to machinery such as lighting, ventilation, pumps, cranes, etc., and these engines generally use fuel oil such as HFO, MGO, or MDO and discharge pollutants into the atmosphere [5].
Since shore power is an alternative method to reduce emissions in port, it is not compulsory but has already been applied in major ports in the United States, Europe, and Asia. It was analyzed that if one-quarter to two-thirds of US ports are installed onshore, the economic benefit from air quality improvement can increase by USD 70–150 million every year [6]. When shore power is applied to EU ports, the health benefit is expected to be about EUR 2.94 billion in 2020, and it is expected that carbon emissions can be reduced by 800,000 tons [7]. IMO resolved that such efforts are also necessary by port authorities in light of the overall efforts for environmental benefits and reducing carbon emissions being made across the shipping industry [8]. According to these changes, port authorities have been installing shore power facilities gradually. However, the ship operator, the final decision-maker for shore power use, has a different opinion. They might not use shore power unless adequate economic feasibility is guaranteed. Therefore, to actively use shore power, it is necessary to analyze the benefits that ship operators can obtain. These benefits may also vary depending on the composition of the fleet held by the ship operator. Therefore, in this study, the characteristics of the benefits from the difference in fuel oil and electricity prices using shore power and the benefits through carbon emission reduction are identified by container-ship size. In addition, it is intended to improve the decision-making on the use of shore power and installation of onboard facilities by ship operators by performing economic analysis considering the incentives provided by ports. Port authorities will also be able to set the direction of policies that can be provided to ship operators through these results.
This study is divided into six sections. In Section 2, after the Introduction, major precedent studies related to the use of shore power are reviewed to confirm the major factors under consideration. Section 3 analyzes the basic information and status regarding ports and ships and presents an analytical method that can confirm the benefits that shipping operators can achieve. In Section 4, based on the analysis results, the characteristics of the benefits by container size and the economic feasibility of shore power use in a single port were evaluated by container ship size. Section 5 summarizes the significance of the results presented in Section 4, followed by Section 6, with a final conclusion and description of the study’s limitations.

2. Literature Review

2.1. Environmental Benefit

Air pollutants from ships are very diverse. The IMO and governments of each country are implementing various regulations for each air pollutant. These regulations affect a range of areas; for example, the Sulfur Emission Control Area (SECA), which is set up to limit sulfur emission, is reported to affect biological ecosystems, cultural heritage, health, and the economic feasibility of shipping companies and ports [9]. Such far-reaching effects also include unintended consequences in addition to the purpose of the regulations. The ECA regulations recommend reducing the speed of ships to reduce CO2 and SO2 emissions within the ECA, but analyses showed that global CO2 emissions increased due to the increase in speed outside the ECA section [10]. Another analysis showed that restrictive regulations such as “IMO 2020”, which was implemented to reduce sulfur content, has caused CO2 emissions to increase by 30% due to the limited sulfur content in the fuel oil [11]. At times, alternatives to respond to such regulations have practical drawbacks. An analysis by the experts using the Fuzzy Analytic Hierarchy Process (FAHP) and Višekriteri-jumsko kompromisno rangiranje (VIKOR) method discussed the use of liquefied natural gas (LNG) as a measure to reduce air pollutant emissions originating from ships, with consideration of the technological, economic, environmental, and socio-political aspects [12]. However, the methane slip problem caused by the use of LNG showed that it is only a short-term solution for reducing GHG [13].
On the other hand, shore power is one of the ways to achieve environmental benefits related to air pollution relatively consistently, beyond the limitations of regulations and alternatives. An analysis for container ships at major ports in the United States, Britain, Australia, Greece, and Germany showed that, by using shore power, emissions of CO2, SO2, NOx, and BC (black carbon) by grid power were reduced by 48 to 70%, 3 to 60%, 40 to 60%, and 57 to 60%, respectively [14]. A result of simulating the international shipping container ships at Kaohsiung Port, the average reduction rates of NOx and SO2 were analyzed to be about 8.7% and 11.74%, respectively, when using shore power [15]. In the results of an analysis based on China’s Dalian Port, it was determined that environmental benefits of USD 128 million would be obtained if shore power facilities were used from 2020 to 2035 [16]. If all ships used shore power at all ports in China, this savings could be converted to 9.468 billion kWh, and SO2, NOx, and CO2 emissions would be reduced by 16 thousand tons, 128 thousand tons, and 1.4 million tons, respectively; improved air quality was also predicted to occur under such a scenario [17].
However, there is still a need for improvement in shore power use because ship delays caused by the use of shore power can become a factor that increases the speed of ships. An analysis showed that, for large ships, the carbon emissions caused by the increase in the ship speed—due to the delays in connecting to shore power—cause greater carbon emissions [18]. However, it is believed that the improvement in operational capability and mechanical progress from shore power can reduce several of these shortcomings in a short period of time.
Shore power use is estimated to be effective, in particular, in responding to GHG reduction regulations, which are implemented with long-term goals, unlike the immediate regulations for major air pollutants such as NOx and SOx. This is because, compared to other response measures, shore power can be implemented immediately and can achieve high efficiency in reducing GHG while berthing. An analysis using data from the European Economic Area (EEA) and the United Kingdom showed that carbon emissions of 3 Mt per year could be avoided through using shore power, and this effect becomes more pronounced in the countries with higher ratios of renewable energy, such as Iceland, Norway, and Sweden [19]. Additionally, there is a difference in the amount of carbon emission reduction depending on the type of grid electricity generation facility used to provide shore power in port, as shown in the previous study. In the research data from the period when shore power was insufficient, it was analyzed that the use of shore power increased carbon emissions in some ports. It was determined that carbon emissions in countries such as China, which relied on fossil fuels, increased when shore power was used, but in most other countries, CO2 emissions were reported to decrease [5]. However, contrary to the results of this initial analysis, interest in shore power is increasing, even in large-scale ports in Asia, such as those in China. This is because the use of shore power has expanded to environmental issues such as PM (particulate matter), beyond simply reducing carbon emissions. In the case of China, as China’s air pollution prevention and control law was amended, new ports developed after 2016 are required to install shore power facilities so that diesel engines can be stopped in port [20].
In particular, the current situation calling for all measures to achieve the target to reduce CO2 emissions from ships may further accelerate the expansion of shore power facilities. An analysis of various emission reduction methods—based on the six categories of hull design, power and propulsion systems, alternative fuels, alternative energy sources, and operations—showed that carbon emissions could be reduced by 33 to 77% by 2050, but no single action alone could reach a significant level of reduction [21]. In addition, in the case of Los Angeles, even when renewable energy sources (such as wind and solar power) are used, it is estimated that achieving the port’s legal reduction target by 2030 will be difficult, although life-cycle GHG emissions will be reduced [22]. That is, the use of shore power is indispensable for port authorities to achieve their environmental goals. Therefore, it is likely to become an irresistible option for port authorities who want to maintain port competitiveness against neighboring ports while reducing air pollutant emissions.

2.2. Economic Benefit

When shore power facilities are used, both the environmental benefits in terms of carbon emission reductions as well as the economic benefits are main factors supporting the expansion the use of shore power. Typical problems in marine engines using fuel oil are CO2 and SOx. Among them, SOx is a factor that affects the respiratory system of the human body [23]. Therefore, the IMO regulation has been strengthened and since January 1, 2020, the regulation of SOx emissions in ocean-going vessel is less than 0.5% [24]. Due to these regulatory changes, as the price of ship fuel oil changes, the economic effect of shore power is also attracting attention. In other words, it can be estimated that the use of shore power is economically affected by the level of fuel oil prices and grid electricity cost.
From the perspective of the port authorities, the impact of changes in electricity prices was more significant. A simulation of a shore power system strategy for a container port in China, considering the perspective of the ports in terms of the balance between carbon emissions and the costs of the shore power system, showed that environmental benefits are realized when the electricity rate is less than $0.30/kWh, and shore power capacity needs to be reduced when the rate is above this [25]. As a result of analyzing the use of shore power by RORO, Cruise, UCLV, and PANAMAX, port authorities had to increase the unit price of electricity for economic motivation [26]. On the other hand, fuel oil price fluctuations and berthing time were major factors in the economic decisions of the ship operators. When the carbon price in the market was high, it was advantageous for ships to increase their profits by choosing shore power, and when the carbon price was low, the opposite was the case [26,27]. As a result of confirming the economic feasibility of shore power use for four representative sample vessels using net present value, in the case of ships using shore power electricity, the longer the port period, the greater the economic cost effect and the shorter the payback time [28].
As confirmed above, various factors such as the inconsistency in the common economic interests of ports and ships, as well as volatility in fuel and electricity costs, are obstacles to the use of shore power. In fact, the operators of Kaohsiung Port saw that shore power use had economic and environmental benefits in the long term, but there are still some existing problems, such as the installation and operation costs of shore power facilities, the need for additional onshore electric facilities according to the various types of ships and ship sizes, the lack of standardization, and insufficient international regulations [29].
Therefore, carbon-credit trading is considered a way to overcome this economic volatility and misalignment of interests. According to the analysis of cost reduction measures through carbon-credit trading by shipping companies within the scenarios of shipping growth rates, it is possible to realize profits by purchasing carbon credits and increasing ship speed during a prosperous scenario and by reducing speed and realizing profits through carbon credits during a sluggish scenario [30,31]. In some cases, it was possible to achieve profits by introducing a carbon credit even in investment strategies with negative net present value (NPV) due to the carbon emission reduction efforts implemented by shipping companies [32]. However, precedent studies showed that the size of the transaction income as related to the carbon credit was small from the port authorities’ point of view. According to the analysis of the economic feasibility of shore power at the Port of Shanghai, the NPV was negative without increasing the unit price of electricity or additional subsidies, and the transaction income due to carbon emission reductions accounted for a very small portion [33].
As shown in the aforementioned results, difficulties in general exist for port authorities to achieve economic benefits by using shore power. Nevertheless, shore power is an essential element for future smart ports. Shore power also contributes to the design of Harbor Area Smart Grid (HASG) models, which can facilitate battery charging for future hybrid and electric ships [34]. In particular, ports in Western Europe, with a relatively open geopolitical culture, were analyzed as having a very high influence on green port policies such as shore power use [35]. Indeed, it is estimated that all ports in Europe will provide shore power by the end of 2025 [26]. Moreover, many Asian ports, such as those in China and South Korea, are also adopting a very proactive strategy to utilize shore power. Such active movements by ports can lead to changes in shipping company management. Shipping companies can also save fuel by changing the operational aspects through education on energy-efficient operation and awareness [36]. However, once they are confident about the economic benefits, they will also be active in reducing fuel and carbon emissions through the use of shore power. In particular, the reduction of carbon emissions in the shipping sector should be economically and technically viable, encompassing both operational and market solutions [37]. Therefore, port authorities are likely to provide various incentives and expand shore power utilization strategies to ensure the economic feasibility for shipping companies.
An analysis of the environmental and economic benefits of shore power use showed that, while the environmental benefits are agreed upon, the economic benefits differ between shipping companies and ports. However, the use of shore power is an essential element in the upcoming green port. As such, ports are likely to offer various incentives to or impose regulations on shipping companies in relation to utilizing developed shore power. Additionally, it is estimated that highly competitive ports with high transshipment volumes are more likely to use incentives rather than strict regulations.
Therefore, this study was conducted on the Port of Busan, which has a large transshipment volume and is in high competition with Chinese ports. Recently, the Port of Busan has significantly expanded its shore power facilities and presented various incentive policies to shipping companies. The vessels subject to this study are container ships that mainly use the shore power facilities of the Port of Busan. Air pollutant emissions from container ships, based on the analysis at the Port of Incheon in the Republic of Korea, were found to be the 4th highest after tanker, general cargo ships, and cruise ships [38]. In order to obtain a detailed understanding of the economic benefits for shipping companies, in particular, container ships are classified by size. At the same time, the actual load curve of the pure car and truck carrier (PCTC) with a similar auxiliary engine usage pattern is used. Considering that most environmental benefits of reducing carbon emissions are obtained by the port and the surrounding areas, it was assumed that shipping companies would have the benefits of the carbon credits gained through carbon emission reductions in the ports. Incentives such as taxes are considered at the same time, in view of assisting the decision-making of shipping companies on the use of shore power as well as the policy-making of the port authorities.

3. Materials and Methods

3.1. Vessel Information

Vessels subject to this study were limited to ocean-going, full container vessels using berths installed with high-voltage shore power facilities in the Port of Busan. Although the amount of carbon emissions generated in port by container ships was analyzed to be relatively small among the total operation of the container ships, fuel oil consumption through auxiliary engine use was determined to be the highest among all ship types [2]. This is because most container ships use additional electricity consumption facilities, such as reefer containers, and this is the same while in port. These electricity usage characteristics are similar to cruise ships and RORO ships, which must continuously generate electricity, even while staying in a port. In fact, in the analysis of scope including indirect emissions of machinery, vehicles, ships, and electricity, container and cruise traffic was responsible for almost 40% of the CO2 eq emissions at the Valencia ports [39] Therefore, container ships are one of the target ship types for which shore power is being actively pursued. To identify the economic and environmental effects of each ship size to be analyzed, ship size was divided into six segments, as shown in Table 1.
On TEU capacity and hull dimension, container vessels are divided into six segments [41]. In order to analyze container ship size, Equation (1) between GT and TEU obtained in [42] was used. Port-MIS [40] data were used for container port call data. In the case of the individual container ships to be analyzed, the average hoteling time was less than 1 day, which is a relatively short hoteling time compared to other ship types. However, the sum of the total hoteling time for container ships accounts for the fourth rank across all ship types in South Korean ports. This can be seen as a large part of port operation performance using shore power. In recent years, it was determined that the average hoteling time of a ultra-large container ships such as UCLVs increases as the size of the ship increases, as required to maintain the cost-effectiveness of these container ships. Since vessel enlargement according to such cost-efficiency is actively progressing, especially with container ships, there is the possibility that the utility of shore power will increase.
GT = 1097.4 + 11.049 · TEU ,

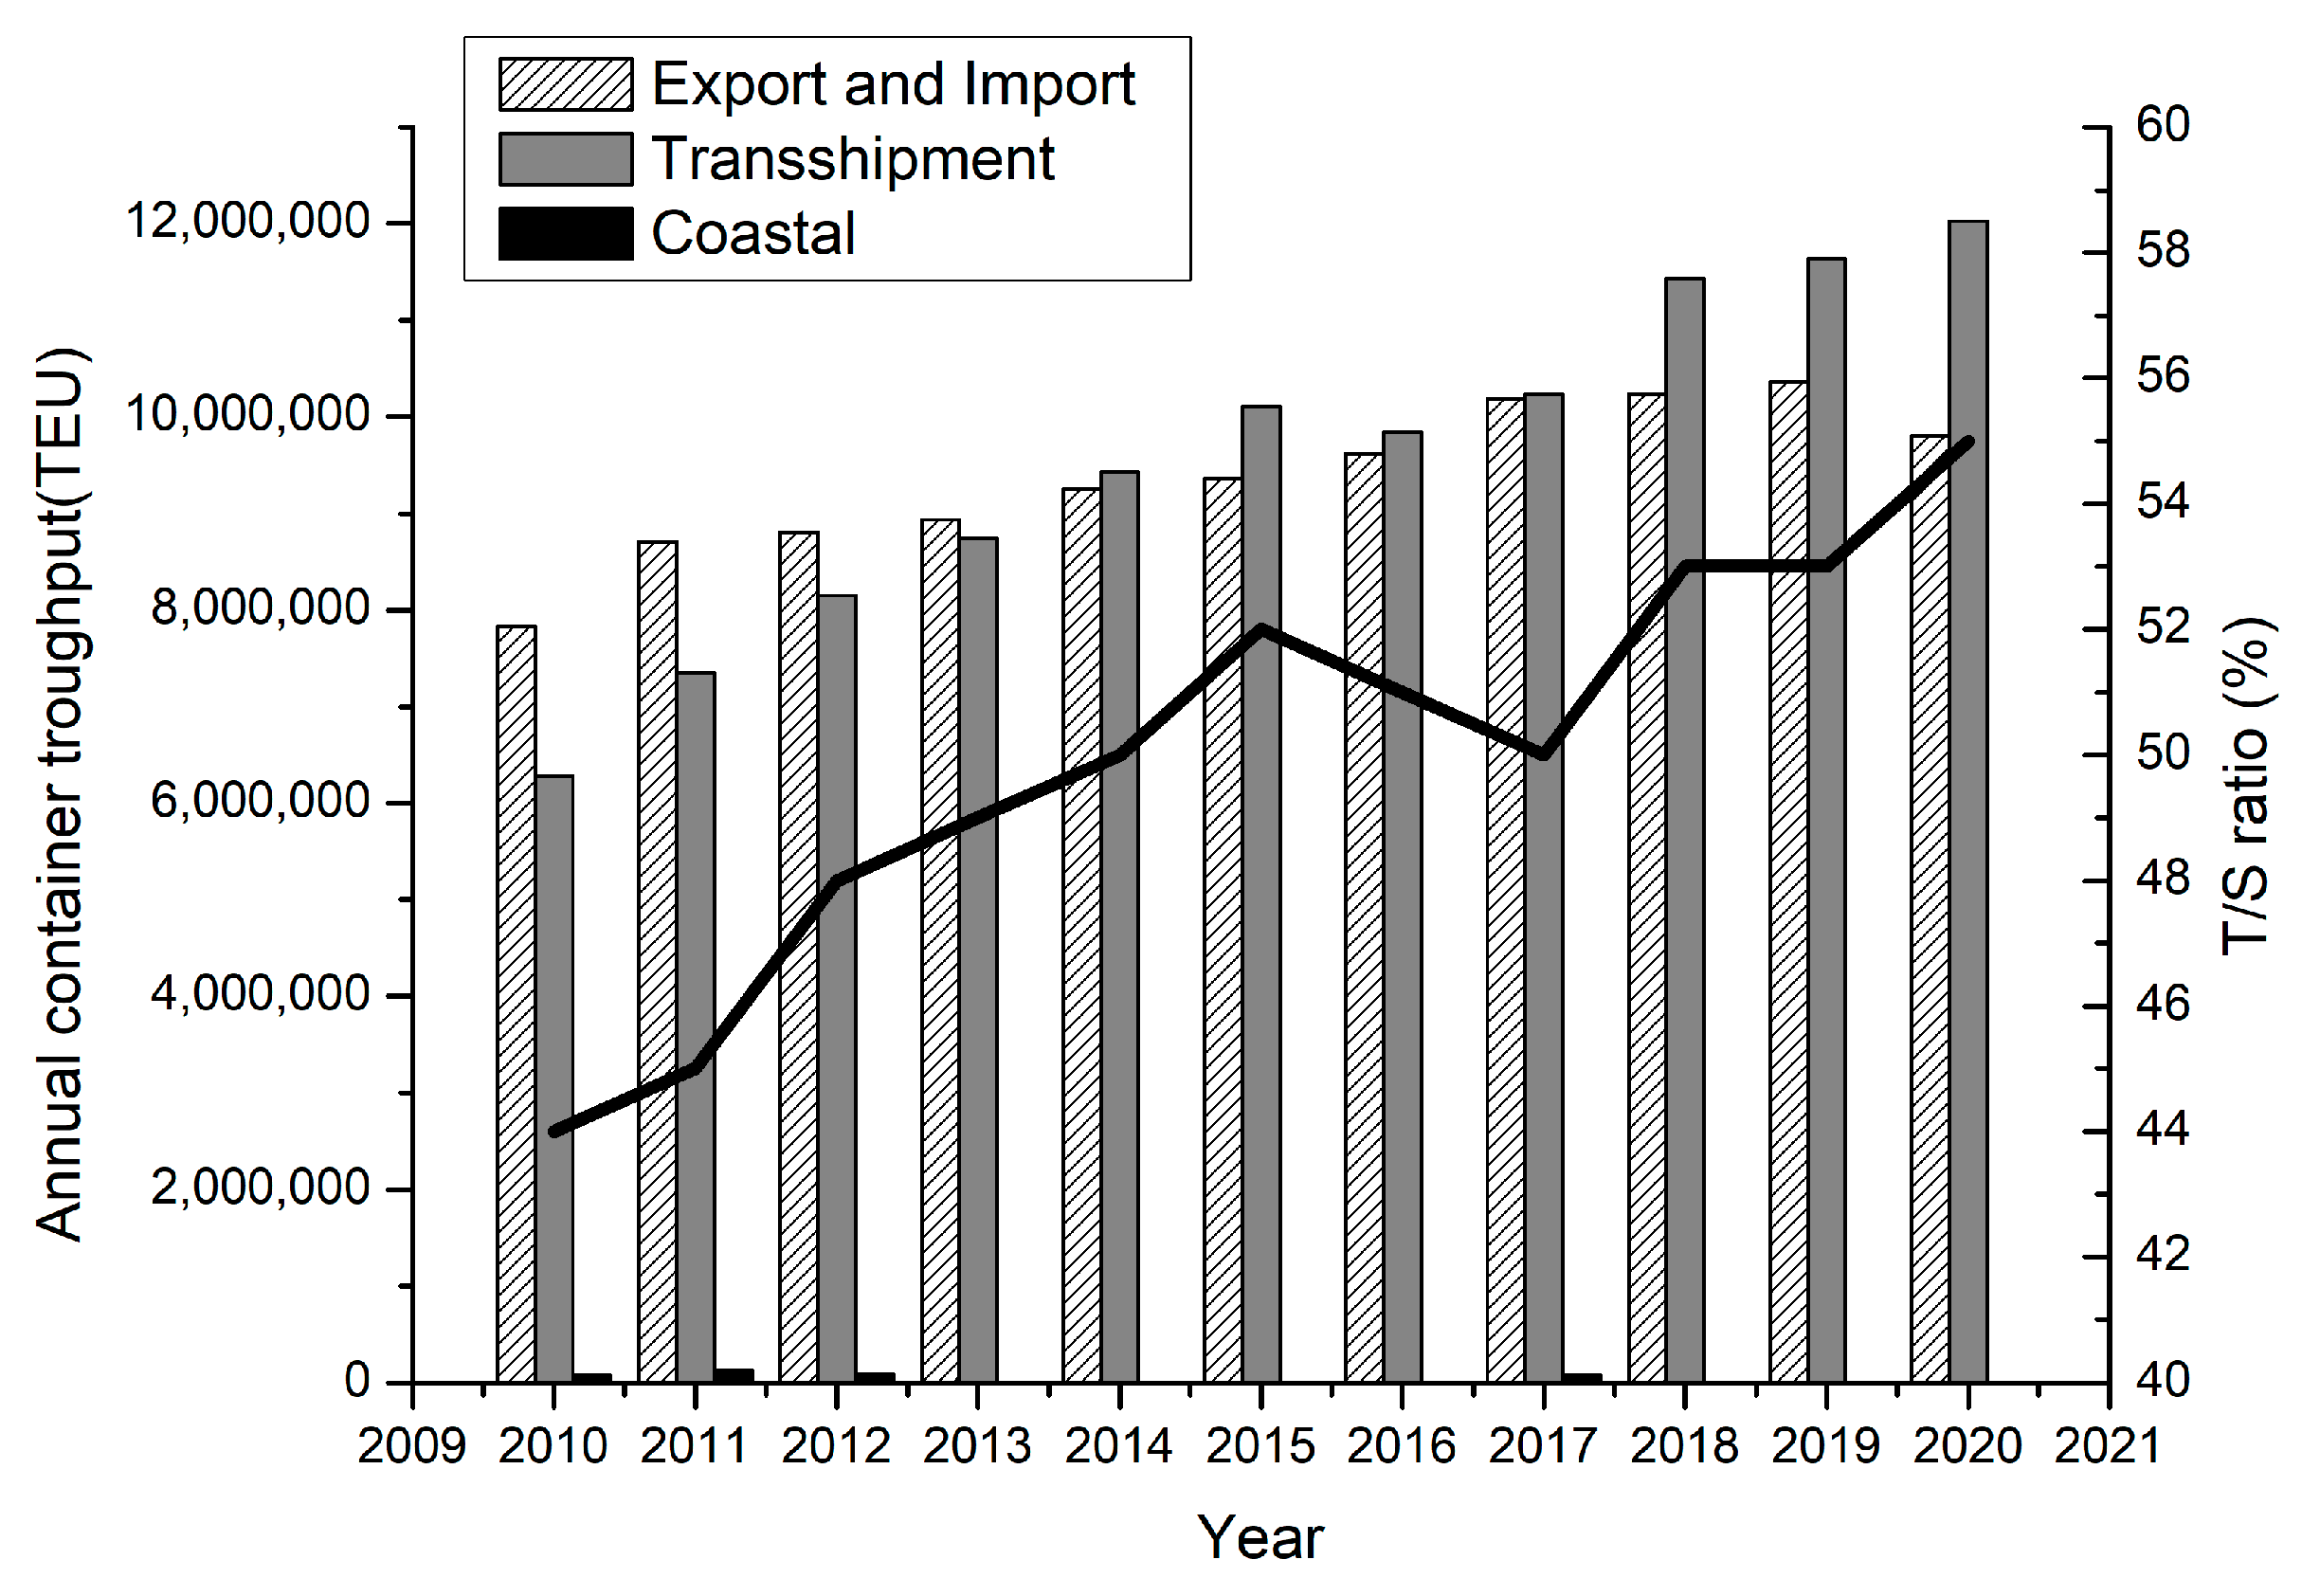
3.2. Port Information

The Port of Busan possessesd the world’s seventh largest processing capacity in 2020 based on container volume, as shown in Table 2 [43]. The characteristics of the container operations to be analyzed are the implementation of trans-oceanic service and coastal feeder service centered on hub ports. The Port of Busan is a representative hub port that provides these services, and transshipment cargo accounts for more than 50% of the port’s total cargo, as shown Figure 1. Therefore, the Port of Busan is estimated to be a suitable port for the study of shore power use by container ships by size. In particular, South Korea is one of the countries making active efforts to reduce GHG emissions. In the case of South Korea, total national GHG emissions amounted to 701.4 million tons, as of 2019, a 140% increase compared to 1990 [44]. In addition, the container port, located relatively near the city, tends to be easily affected by air pollutants emitted from ships, which requires a lot of policies to reduce air pollution. Due to these policy demands, shore power facilities are being built in major ports in South Korea, and in fact, high-voltage shore power facilities are starting to operate at some berths in the Port of Busan. To thrive in these environmental demands and in the high level of port competition in Asia, the Port of Busan is implementing incentives for electricity and tax-relief for the use of shore power.
Therefore, in this study, data for 2019, 2020, and 2021 were analyzed before and after 2020, when the fuel oil price rapidly changed due to the start of sulfur oxide regulations targeting ships that had returned to the berths of the Port of Busan where high-voltage land-based facilities were installed.

3.3. Benefit Evaluation

The stakeholder who gains substantial economic benefits from shore power installation is the ship owner, and the benefits are considered as the difference between the fuel oil cost when using auxiliary engines and the electricity cost when using the grid electricity provided by shore power at the port. Therefore, in order to obtain data for the fuel consumption at port, the kW, SFOC (specific fuel oil consumption), load profile, and the specifications of the auxiliary engines of ships representative of the average for each segment were checked. In order to use a relatively accurate load factor at port, the electric energy per unit hour(kWh) at port for each segment was calculated as in Equation (2) by using the load profile at port of an actual RORO vessel similar to a container ship.
O P i j = 1 t 0 t K W j · L o a d · d t
where, O P i j means the hourly output of the j segment of year i . K W j is the maximum output of the representative vessel in the j segment, Load is the load change of the sample vessel’s port time t , and t is the port time of the sample vessel. Using the obtained O P i j , the cost when fuel was used and cost of electricity when using shore power facilities were calculated as in Equations (3) and (4).
C S T _ s h p i j = O P i j · S F O C j · F P i · H R i j
C S T _ g r i d i j = O P i j · E P · H R i j
where, C S T _ s h p i j is the cost of fuel consumption of j segment in year i . S F O C j is the fuel consumption per kWh of segment j , and H R i j is the hoteling time of segment j in year i . For the fuel used in the analysis, the annual fuel oil price based on the Singapore port of HSFO 380CST and MGO was used in for the analyses before and after the sulfur oxide emission regulations. C S T _ g r i d i j is the cost of grid electricity used while at berth of the j segment in year i . EP stands for electricity cost per kWh. In the case of electric power unit price, the industrial electricity unit price using high-voltage electricity was used. In general, the basic power unit price is set in consideration of the maximum output for domestic industrial electricity, but the calculation of the appropriate basic power requires a considerable amount of time empirically. Therefore, in this study, calculations were made based on only the unit price of electricity that increased according to usage. Based on the economic benefit as determined by the unit price of electricity, it may be helpful to set additional basic electricity. The unit price of electricity, according to the amount of electricity, is adjusted differently by season and time of day. Therefore, the average price per kWh was calculated by weighted average of the electricity unit price for each season and hour. The annual average data provided by Clarkson Research [46] was used for the used fuel oil price and the won–dollar exchange rate for electricity unit price conversion. The difference between the two costs obtained above becomes B e n _ e c o i j in Equation (5), which is the economic benefit obtained from segment j in year i when shore power is actually used.
B e n _ e c o i j = C S T _ s h p i j C S T _ g r i d i j
In general, when ships use electricity by using shore power, it is possible to reduce emissions such as SOx, NOx, PM, and carbon [6,7,15,23,28,29,47]. Among them, emissions that can have a fatal effect on people are SOx, NOx, and PM. To reduce these emissions, the IMO limited the sulfur content to 0.5% for ocean-going vessels from January 1, 2020, and ships built after January 1, 2016 have a NOx emission limitation(Tier II) [24]. In the case of carbon emissions, compared to 2008, the goal is to reduce these emissions by 40% by 2030 and by at least 70% by 2050 [48]. Among them, carbon emission reductions through shore power may differ depending on the type of power generation, as seen in the previous study on grid electricity. However, in the case of countries with low carbon emissions due to the use of nuclear energy, such as South Korea, Spain, Germany, and Belgium, the amount of the CO2 reduction using shore power from grid electricity was determined to be high [5].
In fact, as shown in Table 3, in South Korea, electricity production–related CO2 emissions per kWh are gradually decreasing. These changes can be expected to increase CO2 emission reductions through shore power in the long term. Therefore, based on the output for each ship’s size obtained above, the amount of CO2 emissions that can occur from ships and from shore power are represented by the following, Equations (6) and (7).
E S _ s h p i , j = O P i , j · E F _ s h p j · H R i , j
E S _ g r i d i , j = O P i , j · E F _ g r i d · H R i , j
In the above formula, E S _ s h p i j and E S _ g r i d i j are carbon emissions emitted when using marine fuel oil and grid electricity, respectively. E F _ s h p j is a carbon emission factor per kWh of the auxiliary engine of the j segment. E F _ g r i d is the carbon emission factor that can be emitted from grid electricity when the same electricity used by ships is used for shore power. Here, it was estimated based on 424 g CO2/kWh under the regulations on the operation of the carbon point system in South Korea. Based on this, the reduction of CO2 emissions due to the use of shore power is shown in Equation (8) below.
E R i j = E S _ s h p i j E S _ g r i d i j
In the above equation, E R i j is the amount of carbon emission reduction due to the use of shore power for the j segment in year i . Since CO2 emission reduction can trade carbon credits in a limited form, the economic value can be appropriately estimated. In particular, the average transaction price of carbon credits traded in South Korea is analyzed to increase, as shown in Table 4, so the economic effect of reduction can also increase. Moreover, if accompanied by a policy decision that allows the port authorities to pass on these economic benefits to shipping companies, this can provide economic justification for decisions made on the use of shore power.
Therefore, with the ease of estimating the economic value of CO2 emissions, we estimated the economic benefit through carbon emission reduction with the following Equation (9), using the amount of carbon emissions reduced by use of shore power electricity.
B e n _ E n v i j = E R i j · C R i
In the above formula, B e n _ E n v i j means the economic benefit through carbon emission reduction in the j segment of year i . C R i is the average unit price of KAU19, KAU20, KAU21 and KOC20-22 traded in the Korean carbon credit market [51] in year i .
Ship operators are concerned about not only the benefit from differences in fuel oil prices, electricity costs, and environmental benefits through carbon emission reductions, but are also concerned about the benefits of the additional incentives provided by the port authorities. The Port of Busan (the subject of this study) is exempting port facility usage fees, such as port due and dockage fees, until the end of 2023, but only for ships using shore power. Therefore, the final benefit B e n _ I n c i j that can be obtained by a ship operator, which includes the incentives for tax reduction and the other factors mentioned, is as shown in Equation (10) below:
B e n _ a l l i j = B e n _ E c o i j + B e n _ E n v i j + B e n _ I n c i j

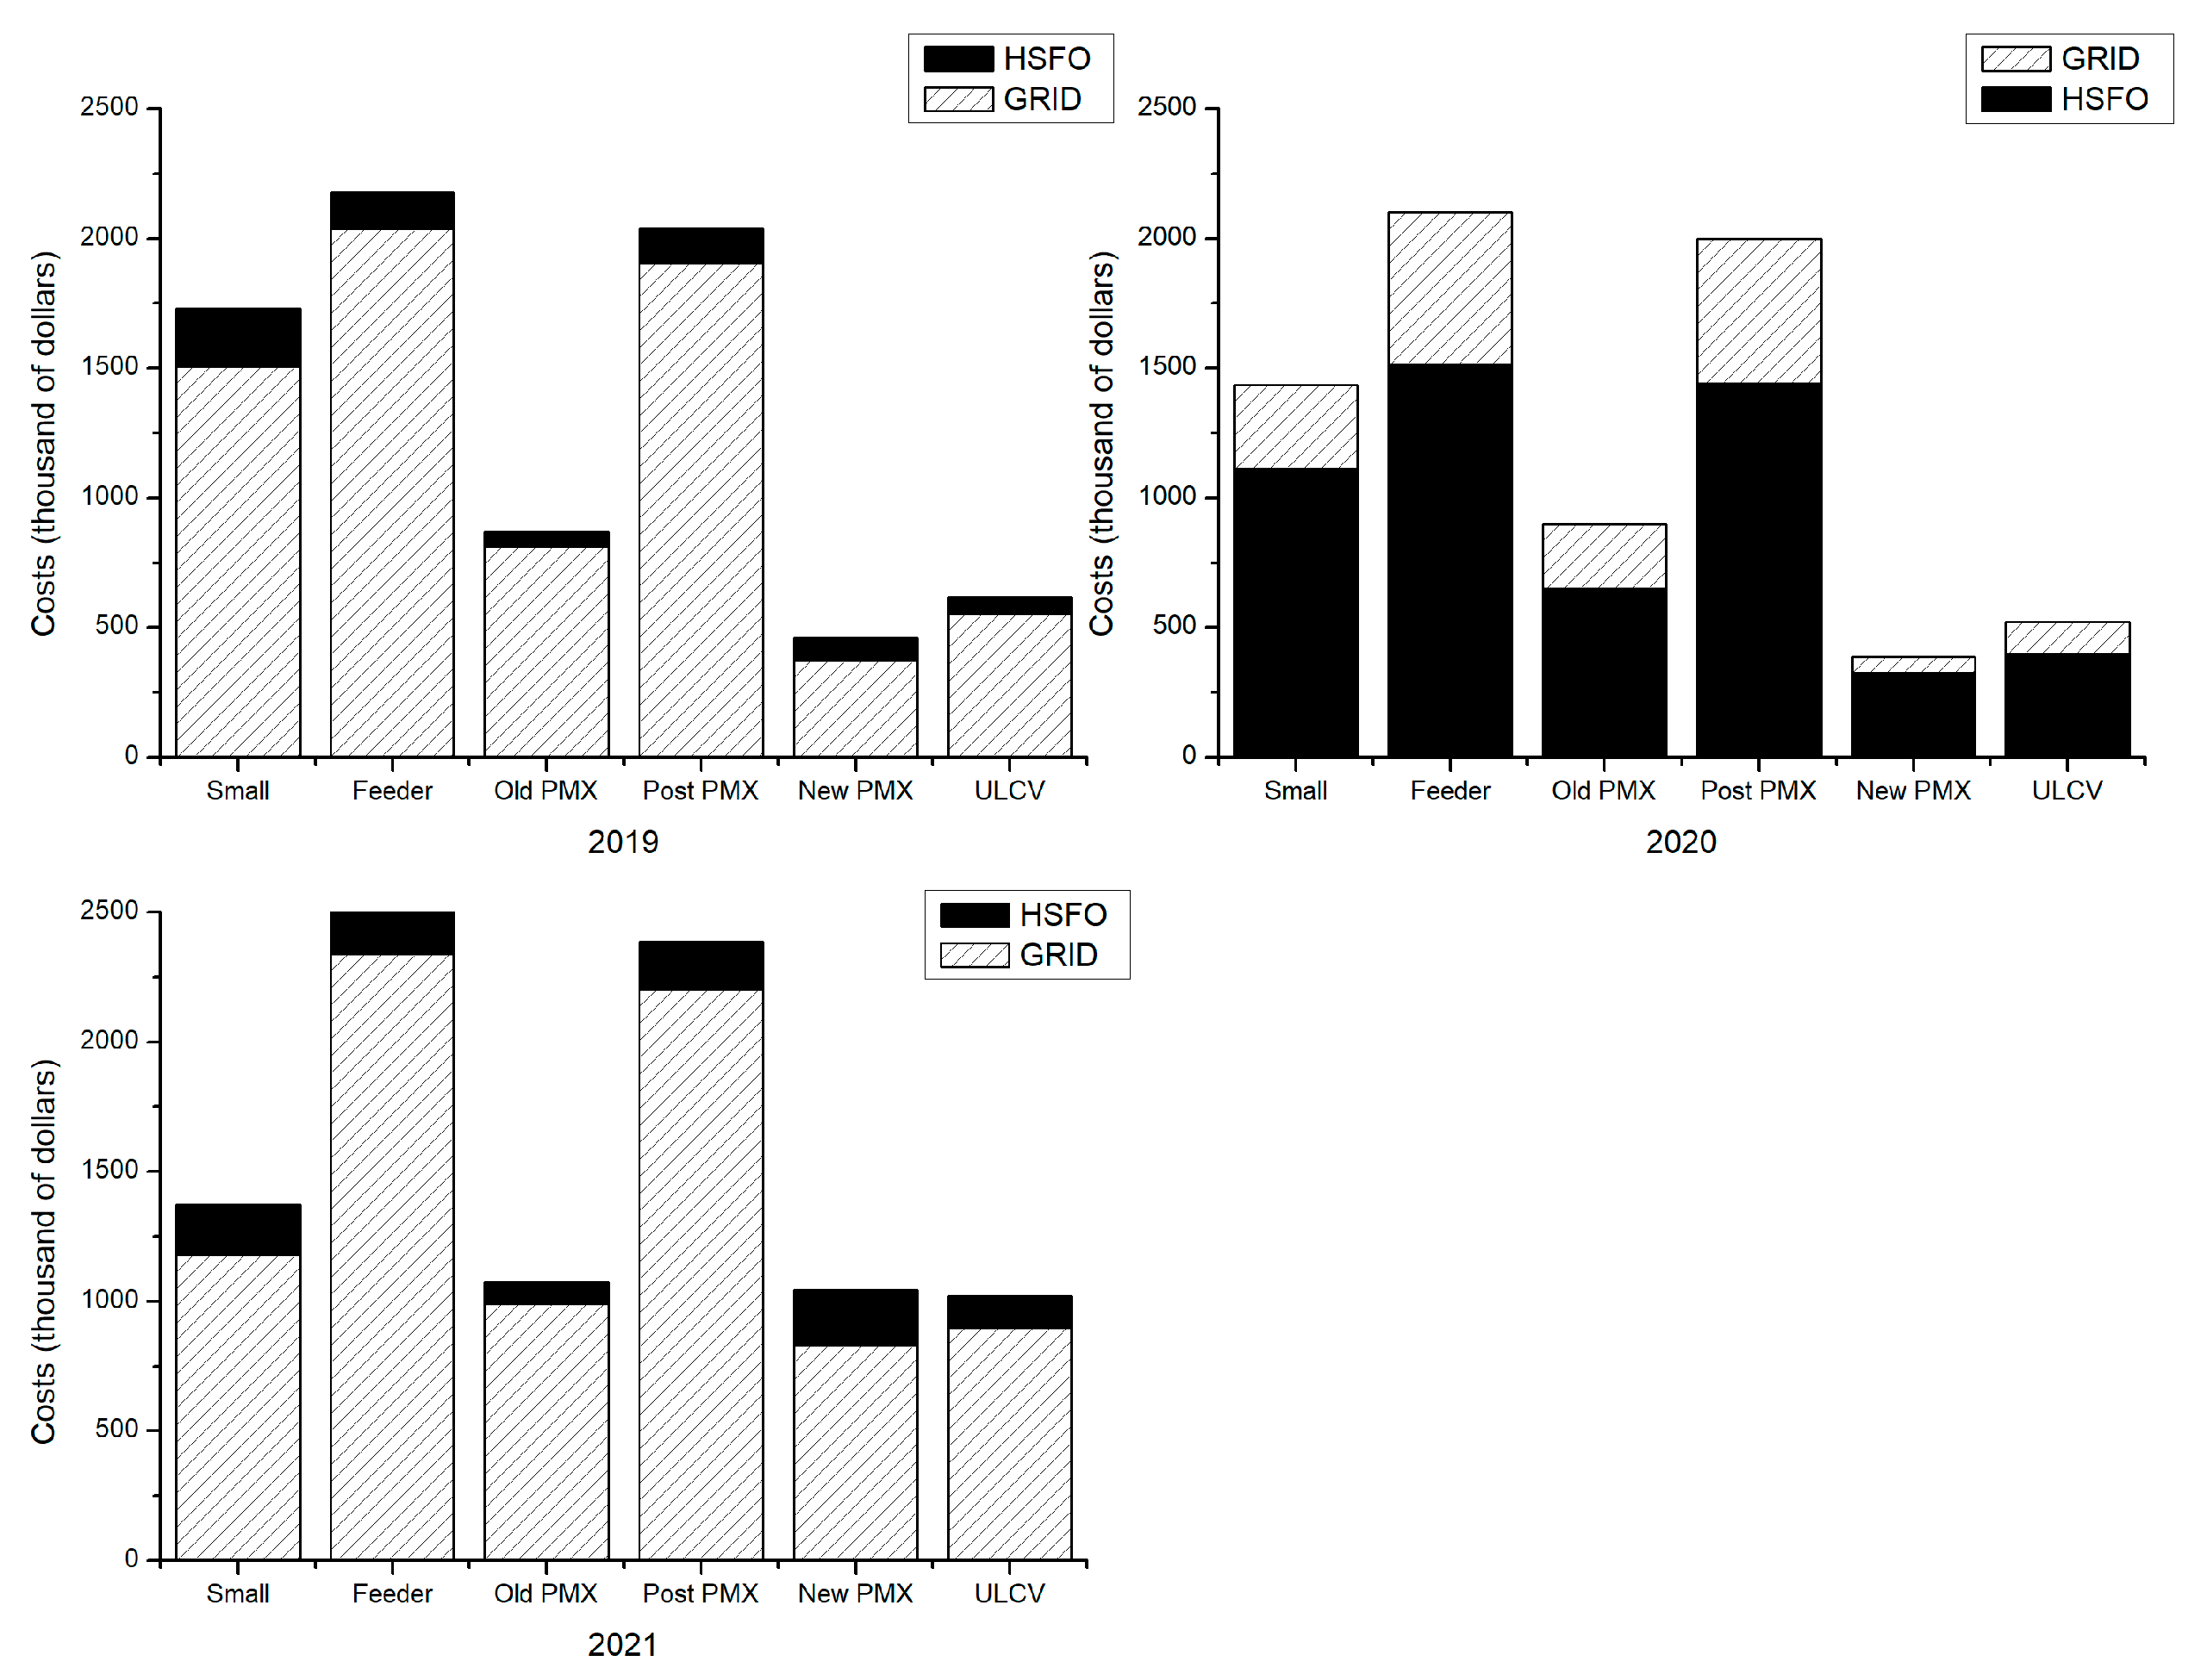
3.4. Cost Evaluation

From the ship operator’s point of view, the costs associated with shore power use include the onboard installation costs. It may also include the cost of increasing the vessel speed for operation management due to delays in the port incurred by the use of shore power [18]. However, this delay effect has been greatly improved and lacks clear probability; above all, considering that the unlocking operation takes time for the container ship to unload cargo after berthing, it is difficult to believe that an excessive increase in speed is required to offset delays due to shore power use. Therefore, this study expresses the total cost T C i j , as shown in Equation (11), referring to GloMEEP’s cost data [52]. I C i j and O C i j refer to the installation and operation costs, respectively, based on the data, and the operating expenses are assumed to be 1% of the annual installation costs.
T C i j = I C i j + O C i j

3.5. Economic Analysis

The benefits and costs obtained above were broken down by the number of calls for each segment during the analysis period, and then multiplied by the average of the calls of the segment berth used, referred to as the segment average benefit and cost. In order to examine the differences in profit, the NPV of each segment was analyzed based on three scenarios, by varying the range included in the benefits, as shown below. The most recent year’s analysis data were used in the analysis. Profits on carbon credits were assumed to increase by 10% annually, and tax incentives were assumed to be provided for the first 2 years. The discount rate was based at 4.5%. The analysis period was set for 26 years, which is the average age of container scrapping for the past 20 years [46].
  • Scenario I: when ship operators acquire benefits from differences in fuel oil prices and electricity costs;
  • Scenario II: when ship operators acquire benefits from trading carbon credits through carbon emission reduction, including the benefit in scenario I;
  • Scenario III: when ship operators acquire benefits from a tax incentive, including the benefit in scenario II.

4. Results

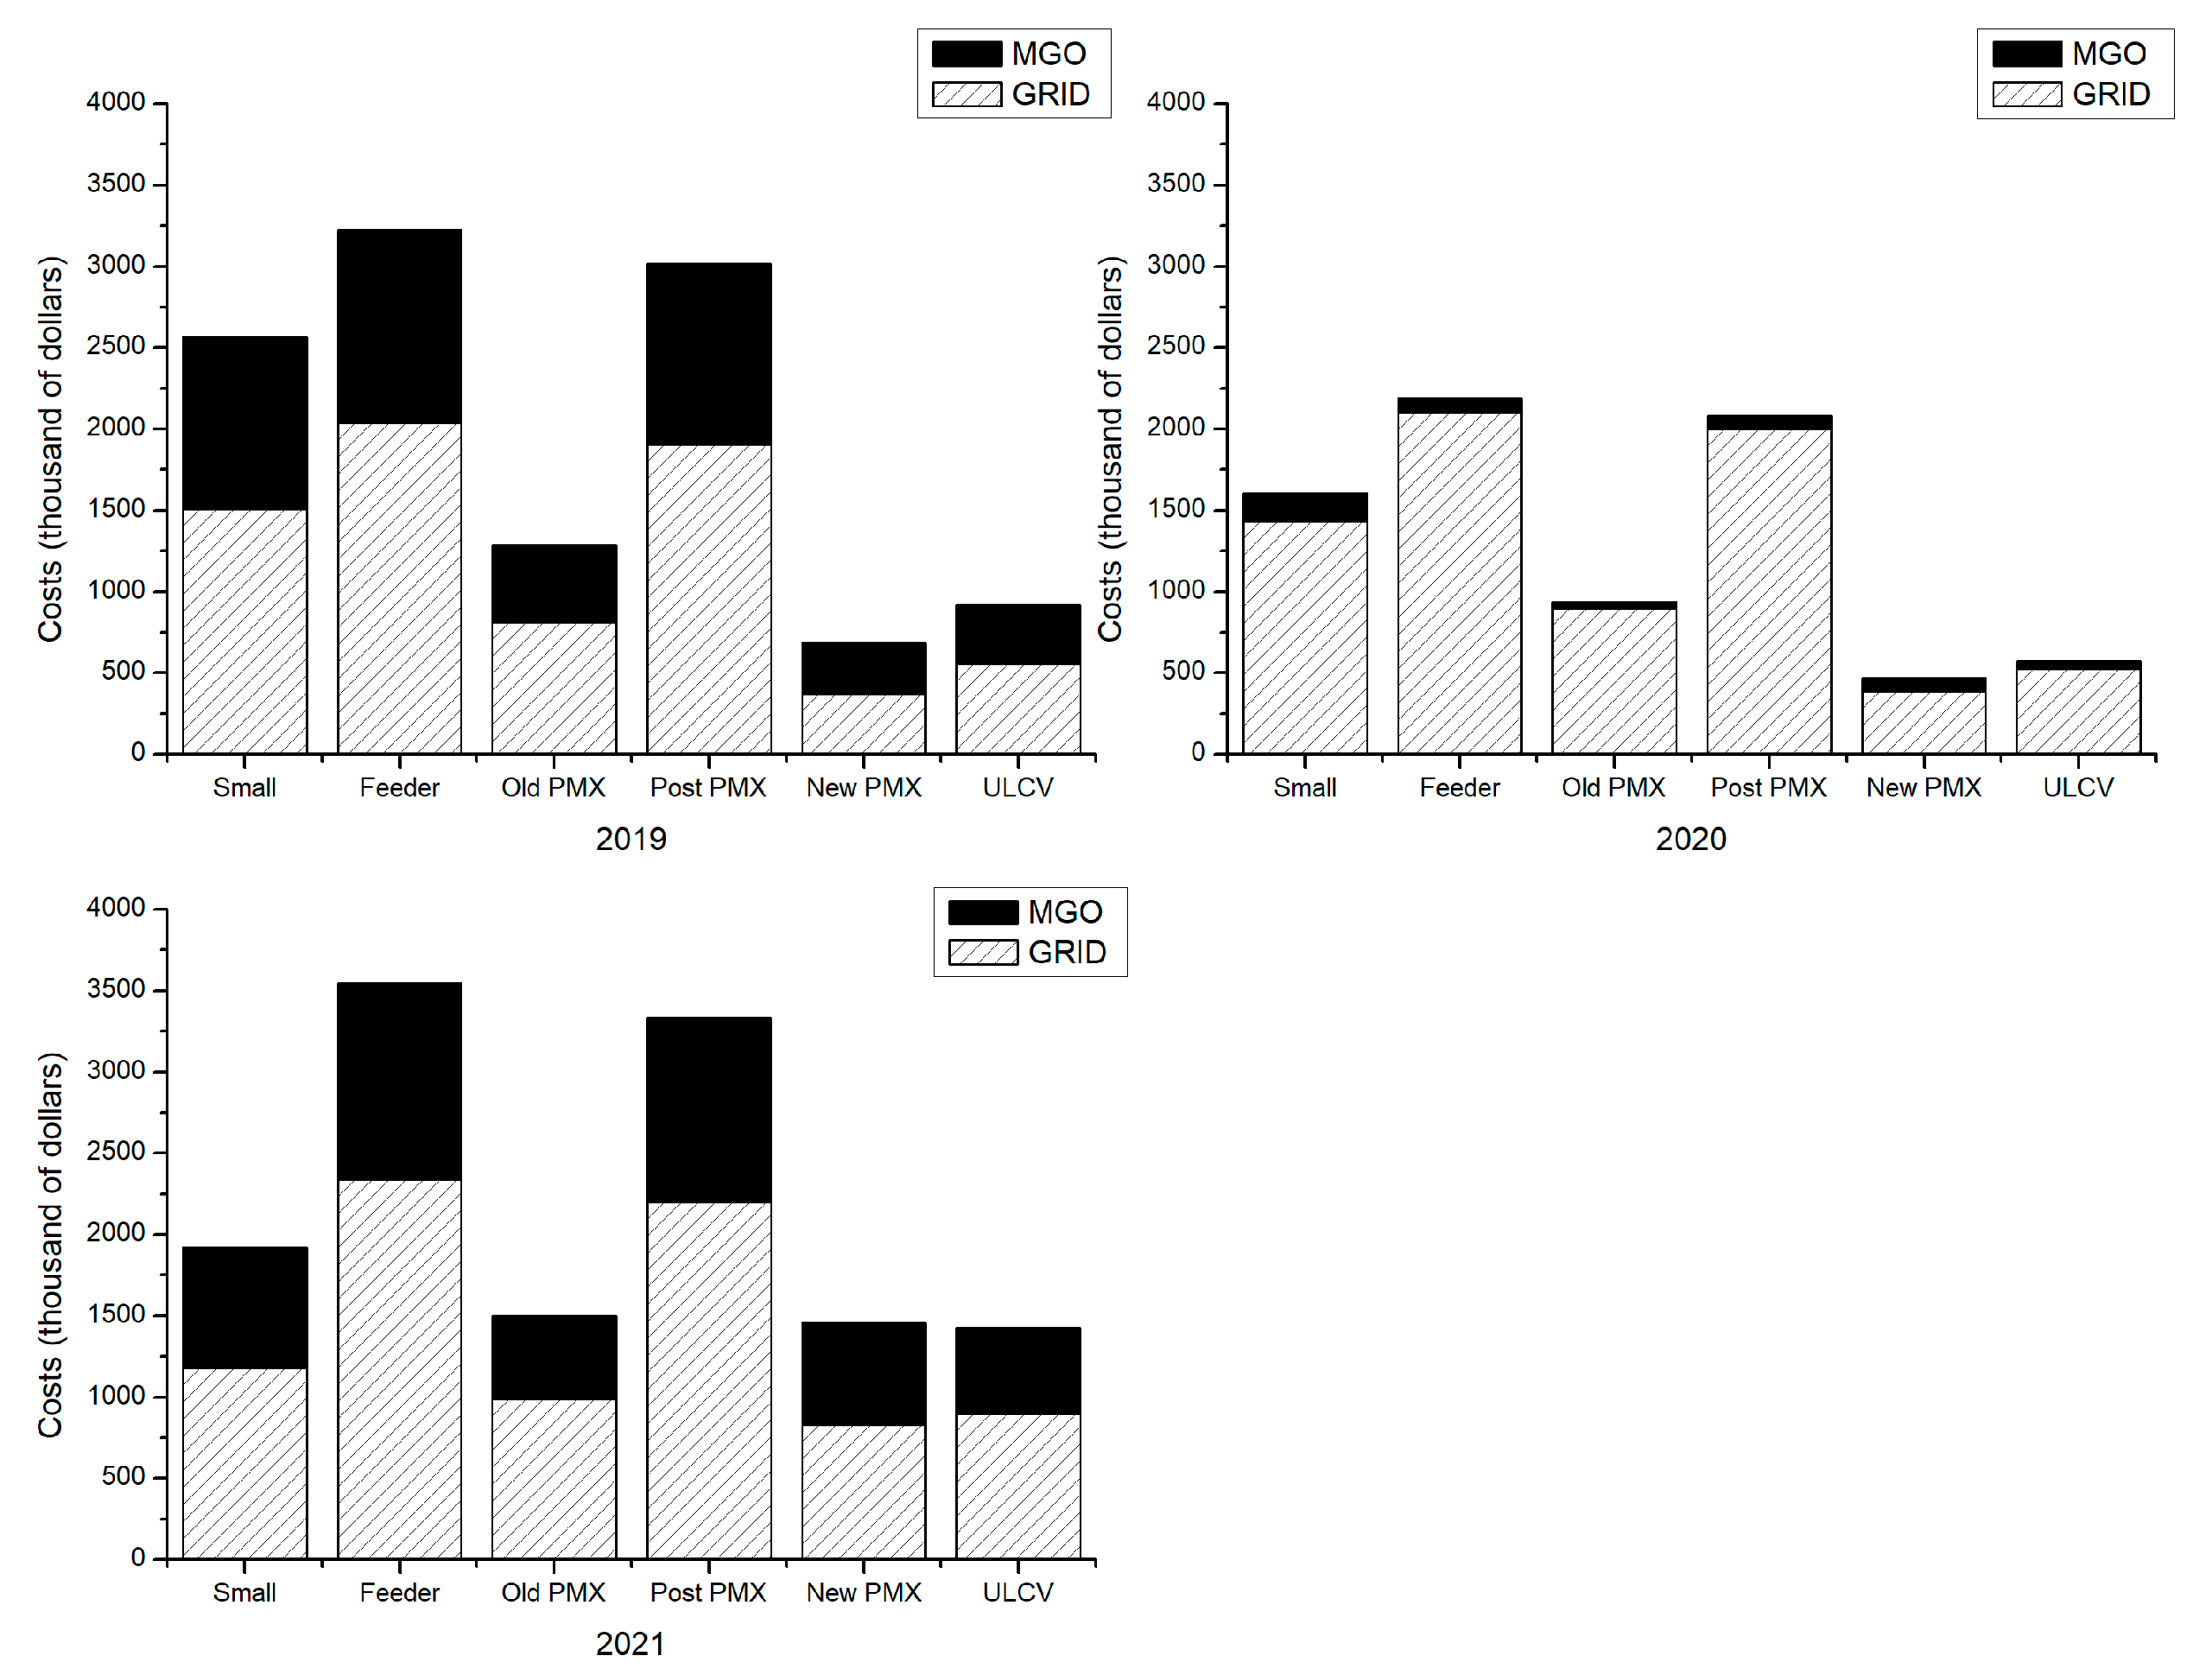
4.1. Economic Benefits from Differences in Fuel Oil and Electricity Prices

The results of analyzing cost differences in fuel oil and electricity prices by oil type are shown in Figure 2 and Figure 3. Based on the MGO of Figure 2, it was confirmed that the economic effect of using shore power was high in all periods before and after the 2020 sulfur oxide regulations. However, in the case of 2020, which showed relatively low fuel oil prices due to large fluctuations in fuel oil unit prices due to the application of sulfur oxide regulations, it was determined that economic benefits were very low compared to other periods. The analysis results of HSFO in this period when fuel oil prices were low is shown in Figure 3; the use of fuel oil was also determined to have greater economic benefits. As a result, the economic effect of shore power use is closely influenced by fuel oil prices, and these results are in line with previous studies [26,27]. Therefore, the carrier is considered to be a part that can offset the advantages of using shore power, unless there is a compulsory regulation by the port authority.
Figure 4 presents the level of benefit per ship’s call for each segment. In general, from small to Post Panamax, a similar level of benefit per ship’s call was recorded, but in ships of New Panamax size and above, the level of benefit per ship’s call was shown to increase. In the case of using high-priced fuel oil such as MGO, it was calculated that the benefit per ship’s call was about three times higher than using HSFO.

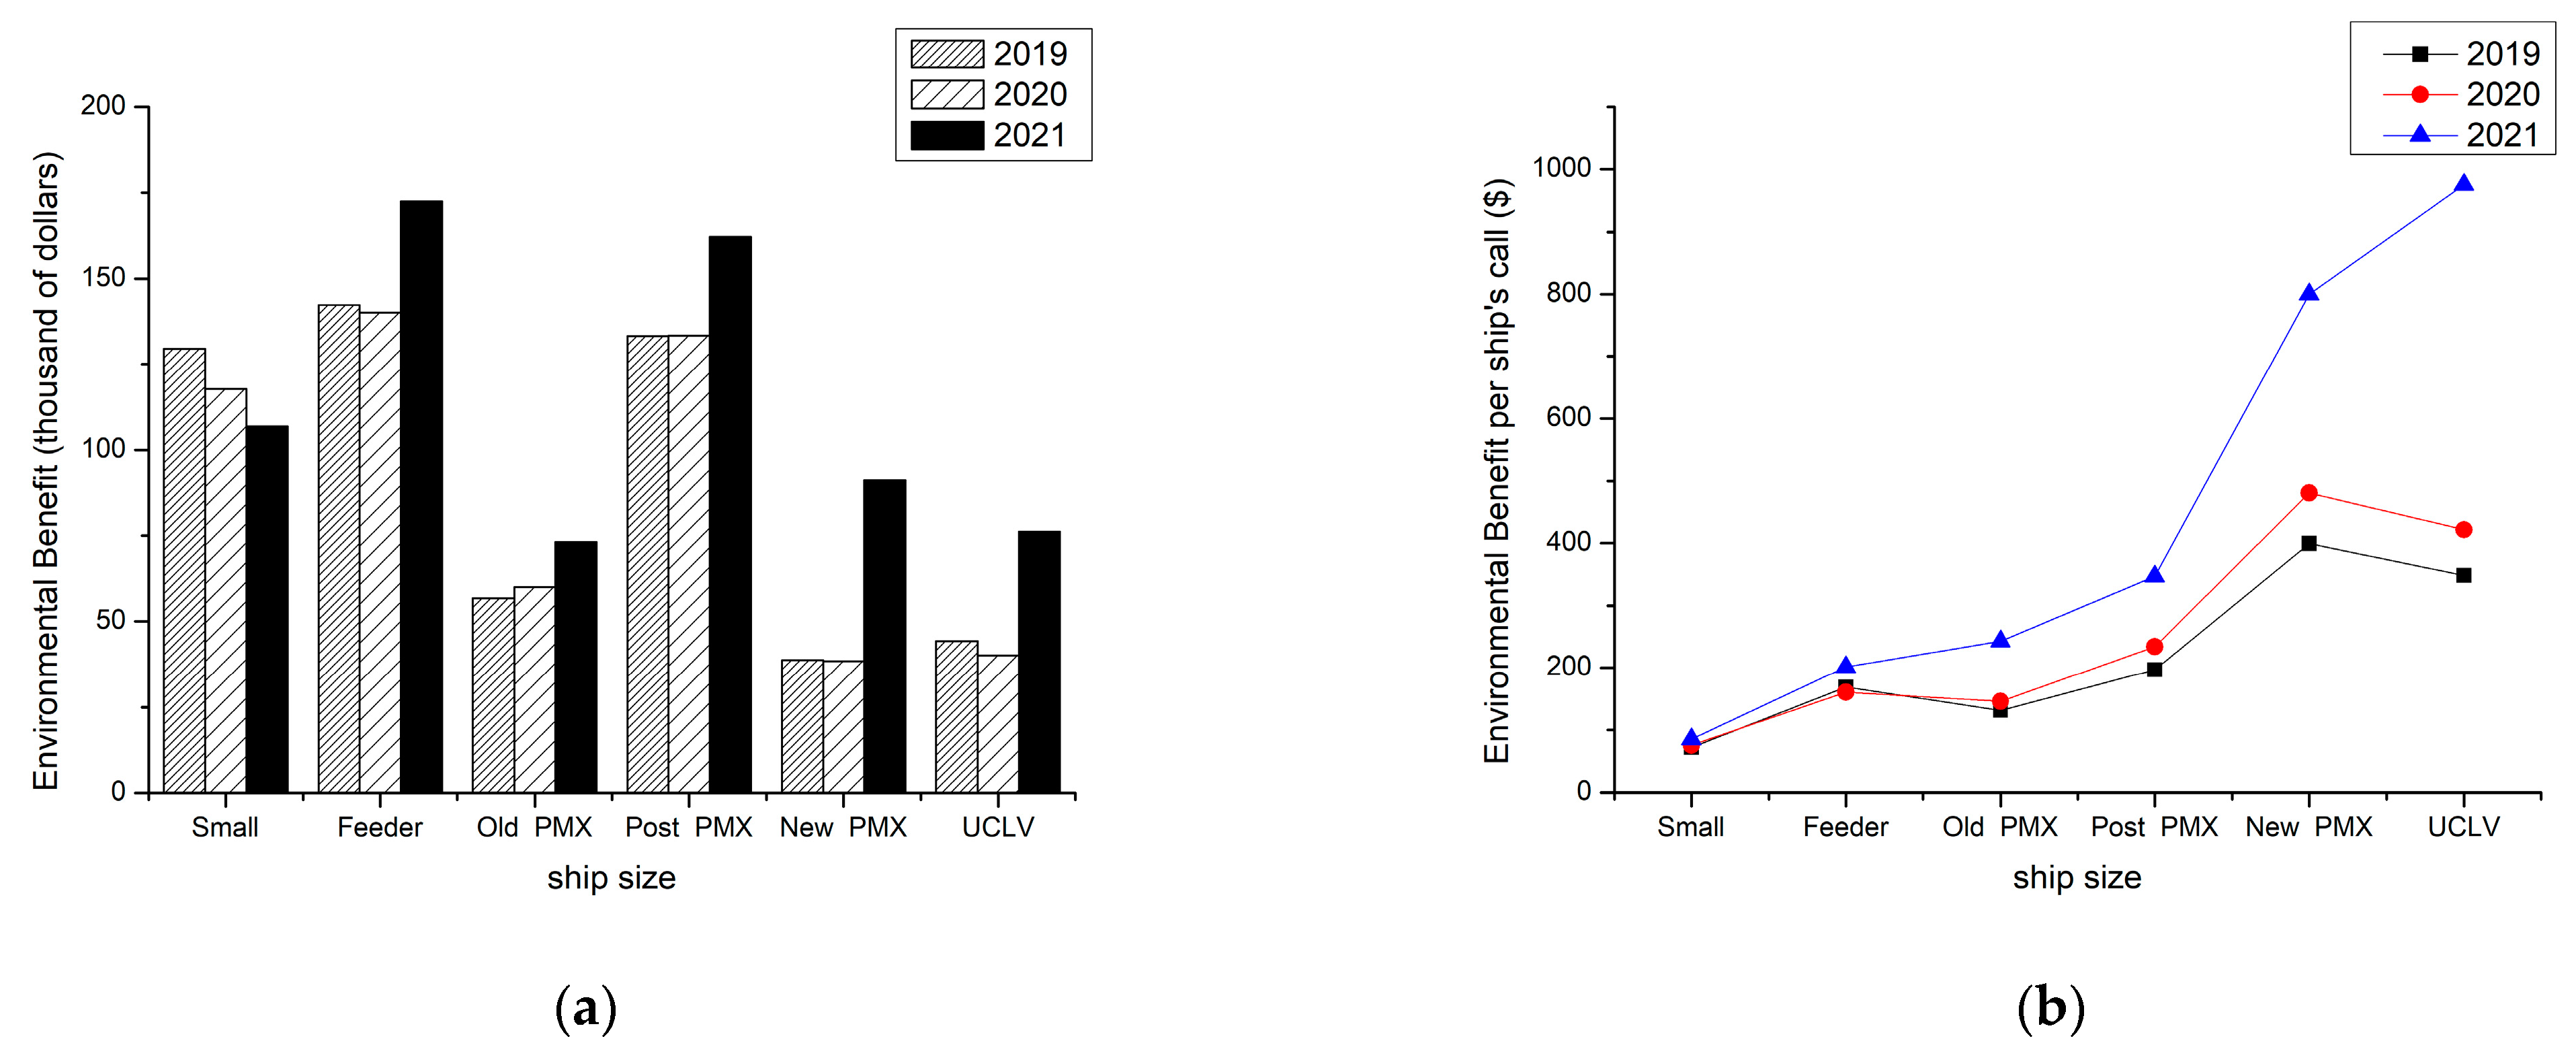
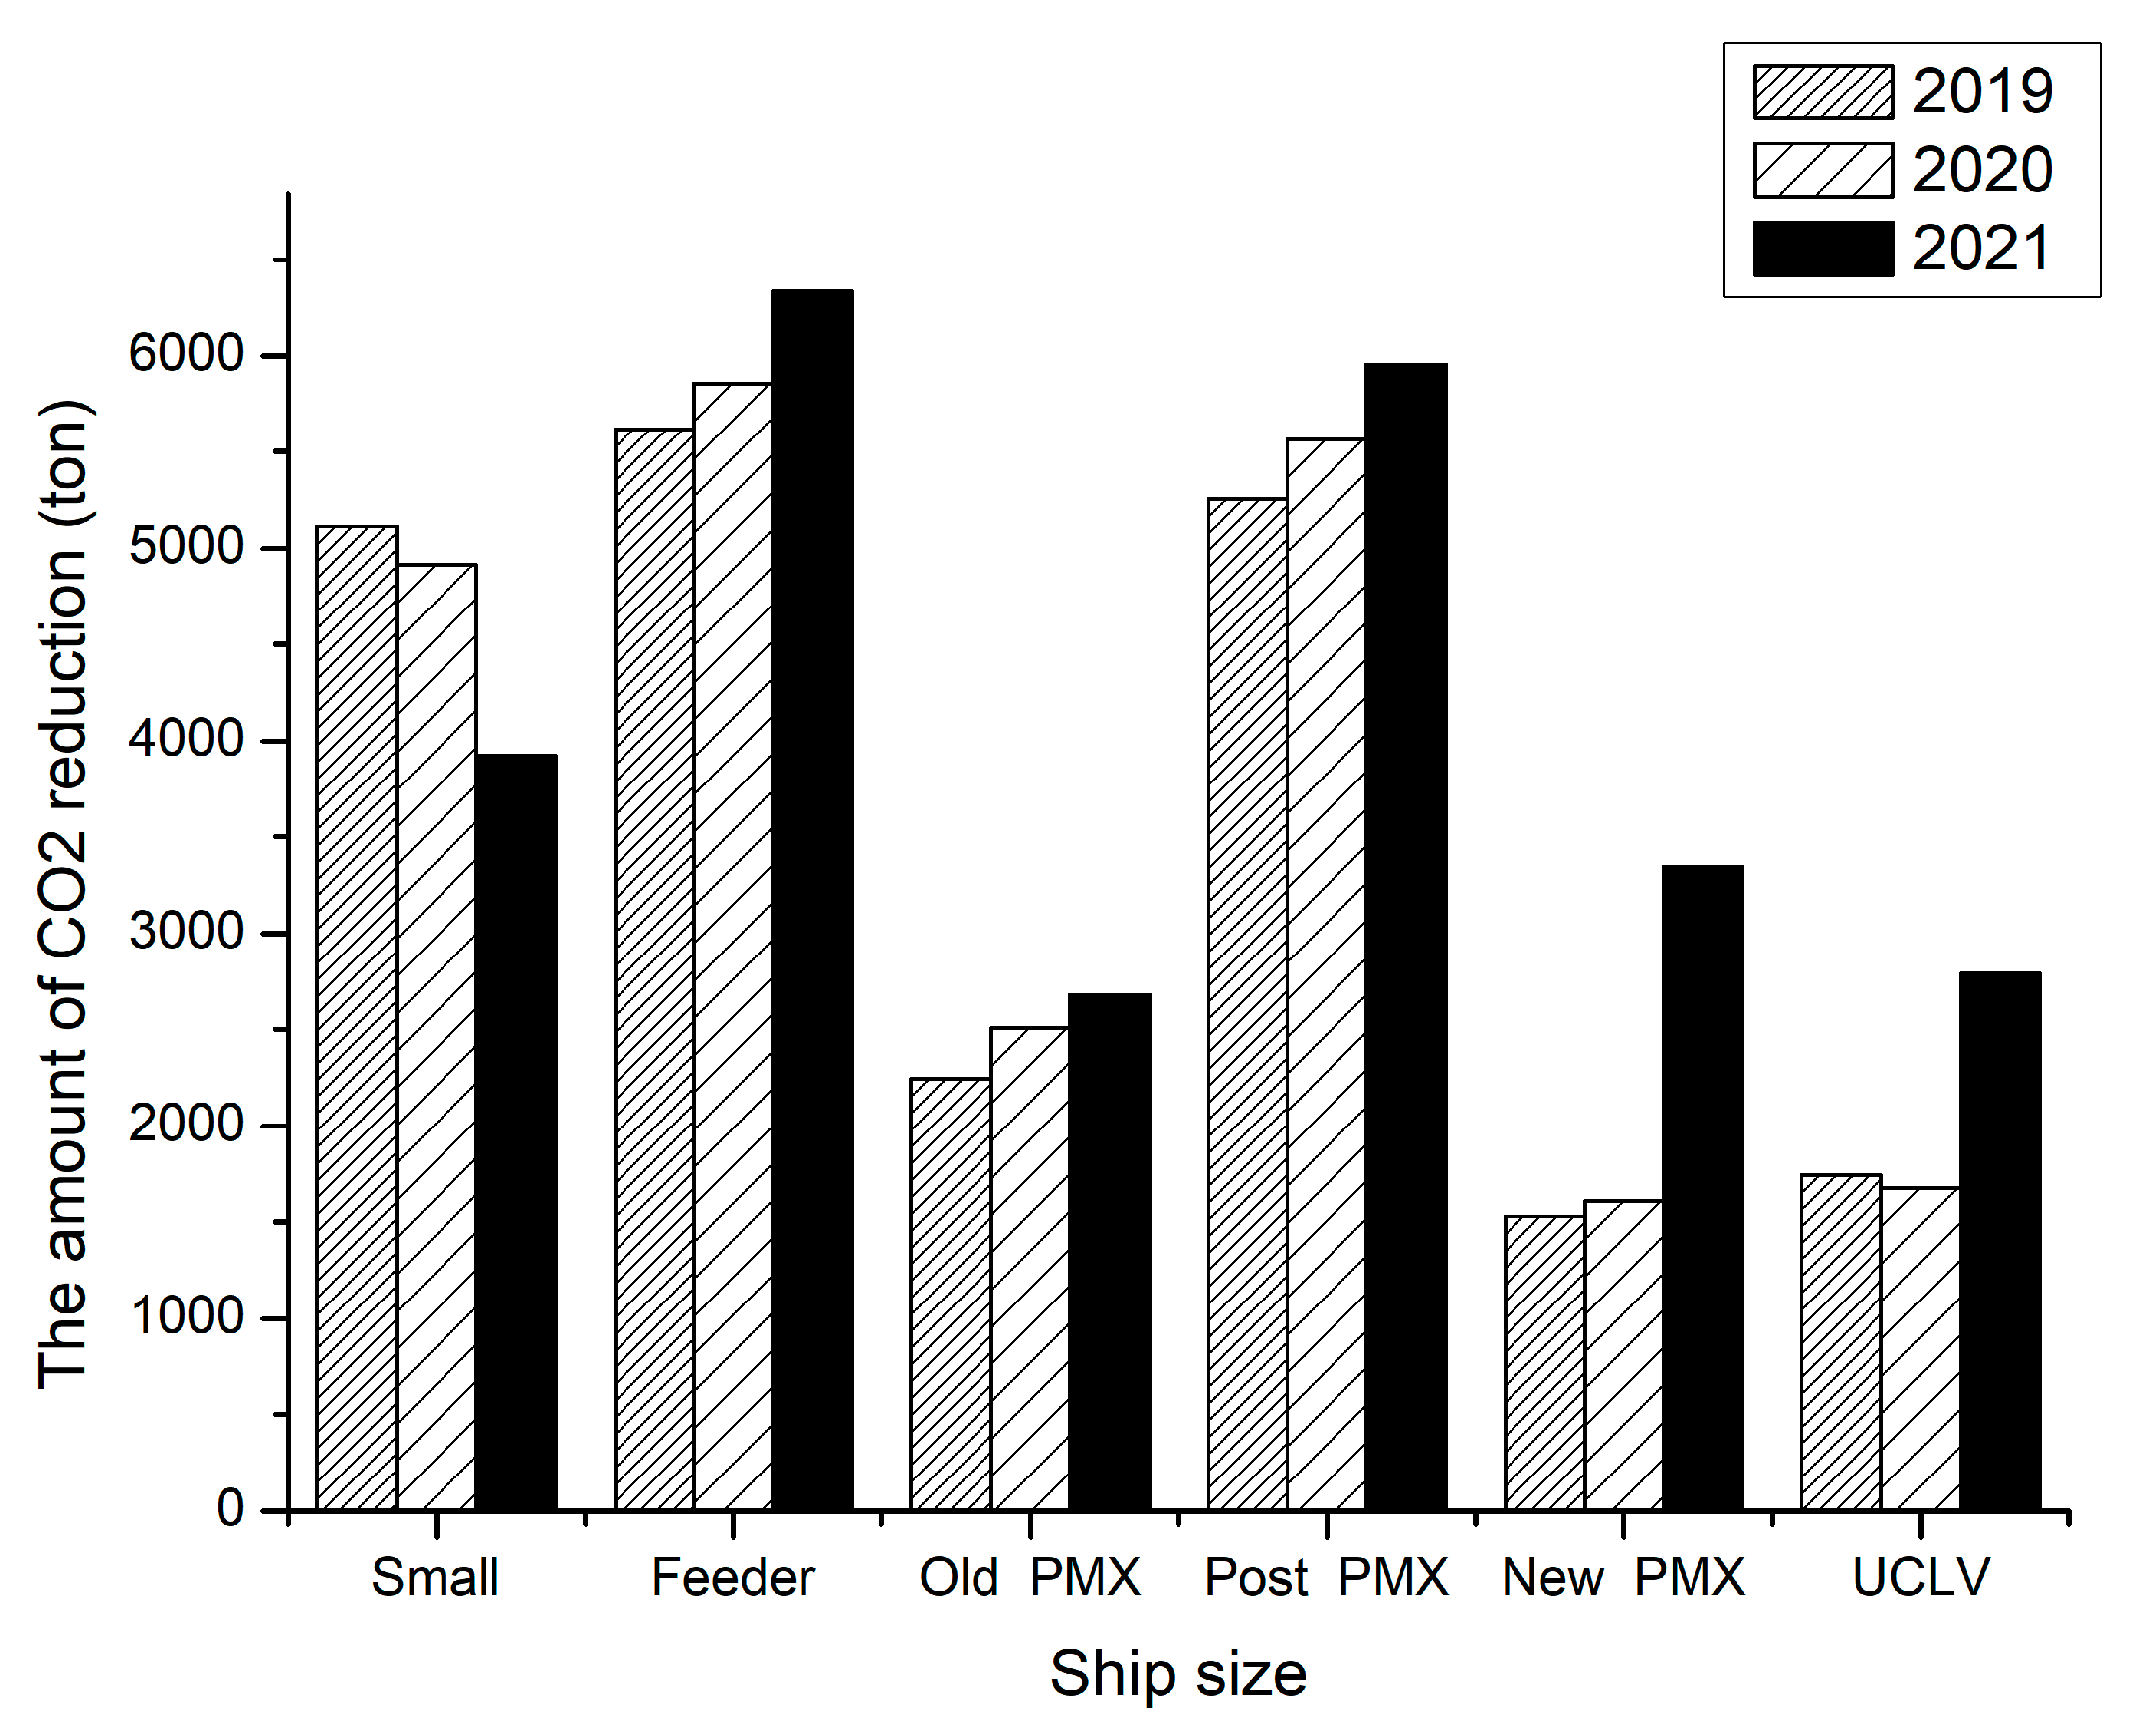
4.2. The Quantity of Carbon Dioxide Reduction and Its Economic Valuation

The effects of reducing CO2 emissions through shore power are shown in Figure 5. The amount of CO2 emission reduction was found to increase over time in all segments, except for the small segment. In 2021, New Panamax and UCLV were determined to have CO2 emission reductions of more than about twice the previous one. This was analyzed to be due to the fact that, due to the increase in cargo volume, the hoteling time of exceptionally large ships is significantly longer. This shows which segment the port authorities will focus on in the future to reduce CO2 emissions.
Figure 6a shows the results of analyzing the benefits of using carbon credits in order to obtain the economic value of the environmental impact caused by carbon emission reductions. It was determined that the reduction of carbon emissions had a greater effect on super-large ships and it was confirmed that high profits were achieved in 2021. The results of analyzing the economic value of carbon emission reductions using carbon credits based on individual ship segments are shown in Figure 6b. Even when the number of ships was taken into account, the economic value of the carbon emission reductions was still high for large ships. The economic benefit per ship obtained from the cost difference between fuel oil (HSFO) and shore power use, shown in Figure 4, was one to two times higher than the environmental benefit from carbon emission reductions, except for in 2020. However, based on MGO, there was a seven- to eightfold difference in all segments, and the difference decreased in 2021 compared to 2019. Therefore, it is estimated that the economic value of carbon emission reductions is increasing relatively for high-priced fuel oil such as MGO. Therefore, port authorities can prioritize reducing carbon emission reductions in ports by increasing incentives for ships that use high-priced fuel oil such as MGO.

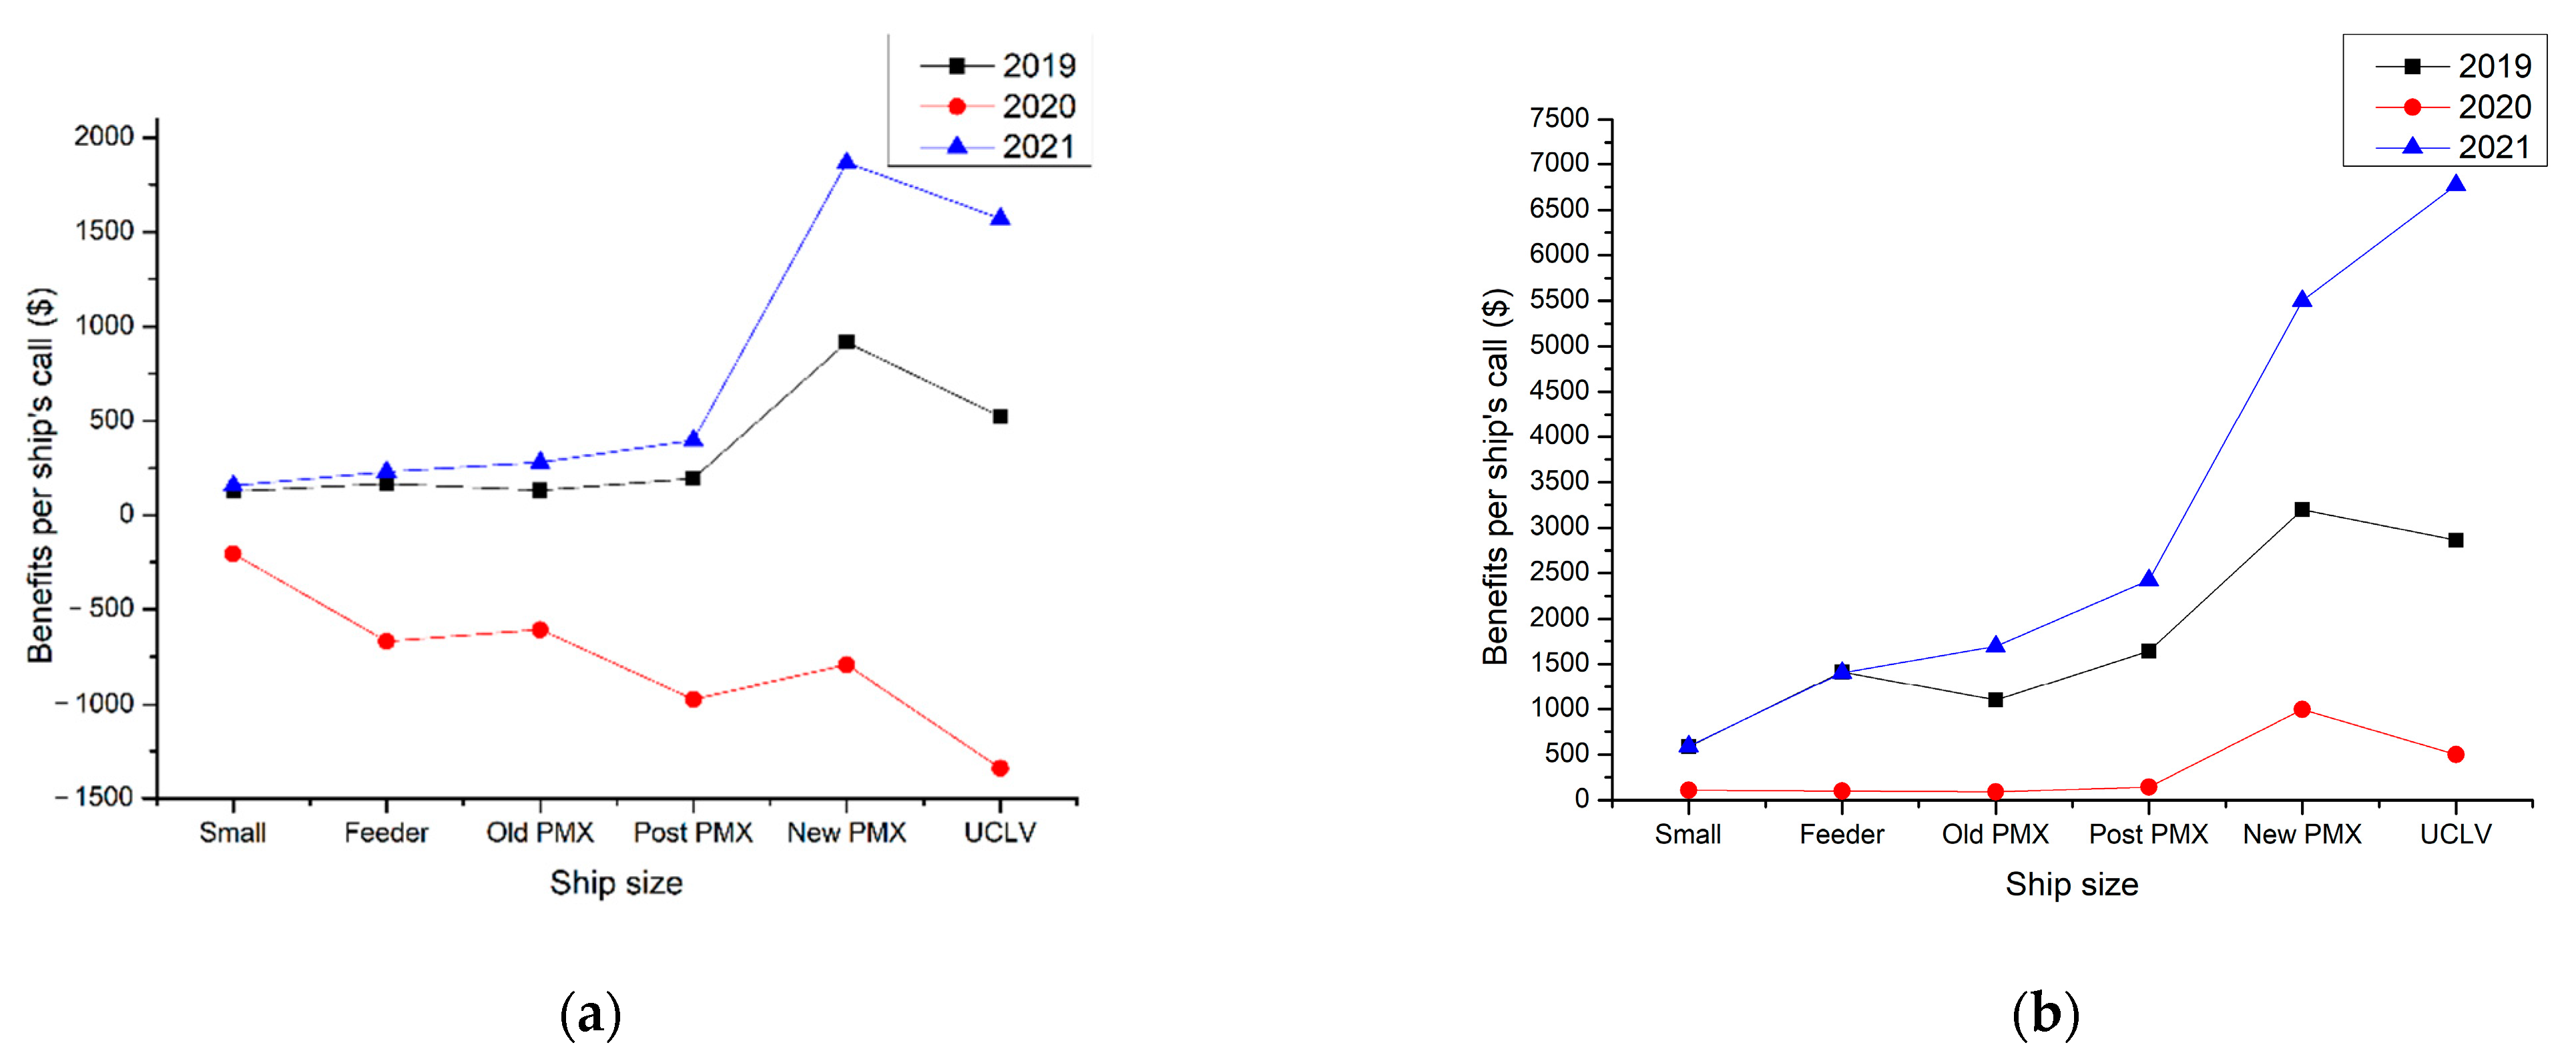
4.3. Economic Analysis by Container Size and Fuel Type

Table 5 shows the NPV by each segment and fuel oil type. The result of the analysis showed that segments with low shore power installation costs and relatively frequent arrivals, such as the small and feeder segments, had positive NPVs. Most ships above the Old Panamax class showed negative NPVs, except for the case of UCLVs (scenario III). For a single port, it was found to be difficult for large ships in the segments of Old Panamax and beyond to have positive NPVs due to the excessive onboard installation costs. However, ULCVs benefit from relatively high tax incentives as well as the difference in fuel oil prices. Thus, it can be assumed that sufficient economic feasibility exists for very large container ships such as ULCVs if there is a port that provides policy incentives similar to the analysis target port in the operating route.

5. Discussion

The effects that can be obtained through the use of shore power are divided into the economic and the environmental, and at the same time, it is possible to divide each ship and port authority by stakeholder.
Concerns for the environmental benefits of shore power use are generally those of port authorities rather than ship operators. This is because the reduction in air pollutants has a significant effect on the health of residents in the area around the port and the surrounding ecosystem [6,7,14,15,16,17,19,21]. Therefore, many ports are expanding their shore power facilities and encouraging their use through regulations or incentives. On the other hand, the environmental benefits from the point of the ship operators are fewer than those of the ports. This is especially true because reductions in air pollutants, excluding carbon emissions, only concern the extent to which they comply with existing regulations. However, carbon presents the possibility to achieve economic benefits through further emissions reductions, which may be of interest to ship operators.
Therefore, ship operators are highly likely to evaluate the economic benefits to determine whether or not to use shore power on the premises, assuming that regulations on the use of shore power are not enforced. Essential factors in such a decision are, first, the margin generated by the difference between the unit price of electricity and the price of ship fuel oil. Consistent with precedent studies, the analysis showed that, when the price of fuel oil is lowered due to high volatility, as opposed to relatively fixed electricity rates, economic benefits were lost with some oil types. Nevertheless, it was determined that the extent of the profits generated by container ships significantly increased when the size of the vessel increased. Meanwhile, this margin, generated by the volatility of fuel oil prices alone, may not be sufficient to incentivize ship operators to use shore power.
Second, an option that ship operators can consider is to secure the economic benefits obtained by carbon-credit trading as much as carbon emission reductions from using shore power. Such economic conversion is not being fully implemented in general, but it is likely to be established in the near future. It is believed that the achievement of these economic benefits is given to port authorities [33]. However, there is a possibility that these benefits will naturally return to ship operators as a way for port authorities to encourage the active use of shore power. Therefore, ship operators may consider whether to use shore power in consideration of the additional margin due to carbon emission reductions. Although the benefit of carbon-credit trading is low in previous studies from the perspective of port authorities [33], the margin for reducing carbon emissions through shore power use has been increasing over time, and similar to the margin of the difference in fuel oil prices, it is prominent for large vessels. Therefore, ship operators are in a position to consider this option as well.
Finally, if regulations are not enforced, some highly competitive ports may offer additional incentives which are highly likely to be sufficient enough for ship operators to consider using shore power. The tax incentives of the Port of Busan analyzed in this study were found to result in positive NPVs for small and feeder-sized vessels that frequently use the port, providing sufficient justification for shore power use for vessels of those sizes, without considering other ports. This is due to the high number of calls for container ships of these sizes and the relatively low installation cost of the vessels’ shore power facilities. In the cases of large ships, however, negative NPVs were derived from this analysis, which targeted a single port; this is because long-distance voyages make such incentives from the number of ports of call relatively small, and the unit price for the vessels’ shore power facilities is comparatively high [29]. However, even on large vessels of Old Panamax class and beyond, when tax incentives are considered, the NPV can be converted to approximately that of the case of the UCLV, or the loss can be reduced by about one-fifth. Such a reduction is a very high number compared with incentives offered by a single port, which could be sufficient incentive for ship operators to use shore power. Especially in ports where transshipment is mainly performed, the provision of such services may also affect the selection of ports of call for large ships, leading to an increase in cargo volume for the selected ports. It can again lead to an active incentive policy of the port authorities.
Most of the precedent economic analysis research related to the use of shore power was analyzed based on port authorities [7,16,26,29,33]. Even in the case of analysis from the view of ship operators, the analysis of carbon credit or benefits by size was not considered [26,27,28]. However, carbon credit can be considered in relation to the economic analysis of ships [10,30,31]. Therefore, in this study, economic analysis was conducted for each ship size based on the abovementioned benefits from the perspective of ship operators. The analysis from this point of view allows the ship operator to determine the use of shore power that reflects his fleet composition and routes. It can also help port authorities implement appropriate policies.

6. Conclusions

In this study, based on the Port of Busan, one of the representative hub ports in Asia, the economic and environmental benefits of using shore power were analyzed by container ship size. Based on these results, an economic analysis was conducted from the perspective of the ship operator. Through the study, port authorities and ship operators can consider whether to use shore power or not.
First, the use of shore power was generally better than the use of fuel oil at the port in terms of economics, but it was determined that the opposite was possible when the fuel oil price was extremely low. In particular, if an additional basic electricity fee is imposed on each ship according to the power system of the country to be analyzed, then the effect of volatility may increase, so careful calculation of basic electricity costs by the port authorities and an appropriate level for the shore power unit price of electricity may be required.
Second, in the case of container ships, the larger the size of the ship, the more remarkable the reduction in carbon emissions as well as the economic benefits of using shore power. This difference can be caused by an increase in hoteling time due to vessel size increase and improvement in relative hull efficiency due to vessel enlargement. In other words, container shipping companies are at an incentive for container enlargement, for both economic and environmental aspects.
Third, carbon emission reductions due to shore power usage showed a tendency to gradually increase in the container ports that were analyzed. This can meet not only the national environmental goals but also provide economic benefits by expanding the implementation of the carbon trading system. In particular, the supply of shore power through renewable energy generation, which is gradually increasing, is a factor that can accelerate this trend. Therefore, port authorities need various incentives and institutional reforms to motivate ship operators to use shore power.
Fourth, the active provision of incentives by port authorities for shore power use could be an option for ship operators to consider shore power use in practice. Given that the ports obtain the majority of the environmental benefits from shore power use, the provision of incentives at a sustainable level could encourage ship operators to choose the port, which could also lead to an expansion of the economic benefits. Assuming there is no regulation, it was calculated that there is little room for most container ships to actively use shore power, except for small container ships.
As this study was conducted on a single port for the analysis of the economic factors, the limitation exists that the NPVs may be low when the number of calls to the port is small. However, the results can contribute to the selection of ports that provide similar policy incentives and shore power environments through the partial economic analysis of a representative transshipment port. Therefore, future research may discuss the portfolio composition for a variety of cases to help ship operators make decisions through the integrated comparisons of the incentives of several ports of different sizes.

Funding

This research received no external funding.

Institutional Review Board Statement

Not applicable.

Informed Consent Statement

Not applicable.

Data Availability Statement

The data presented in this study are openly available at https://new.portmis.go.kr/ (accessed on 3 February 2022) reference number [40], https://www.busanpa.com/kor/Contents.do?mCode=MN1004 (accessed on 13 March 2022) reference number [45], https://kosis.kr/statHtml/statHtml.do?orgId=310&tblId=DT_31002N_A001&vw_cd=MT_ZTITLE&list_id=U_15&scrId=&seqNo=&lang_mode=ko&obj_var_id=&itm_id=&conn_path=MT_ZTITLE&path=%252FstatisticsList%252FstatisticsListIndex.do (accessed on 13 March 2022) reference number [49], and https://ets.krx.co.kr/ (accessed on 1 March 2022) reference number [51].

Acknowledgments

I express my deep gratitude to the editors and reviewers for their valuable reviews and thoughtful recommendations.

Conflicts of Interest

The authors declare no conflict of interest.

References

  1. IPCC Climate Change 2014: Synthesis Report. Contribution of Working Groups I, II and III to the Fifth Assessment Report of the Intergovernmental Panel on Climate Change, 2014th ed.; Pachauri, R., Meyer, L., Eds.; IPCC: Geneva, Switzerland, 2015; ISBN 978-92-9169-143-2. [Google Scholar]
  2. IMO Fourth IMO GHG Study 2020—Full Report. Available online: https://www.imo.org/en/OurWork/Environment/Pages/Fourth-IMO-Greenhouse-Gas-Study-2020.aspx (accessed on 10 March 2022).
  3. Yuan, J.; Ng, S.H.; Sou, W.S. Uncertainty Quantification of CO2 Emission Reduction for Maritime Shipping. Energy Policy 2016, 88, 113–130. [Google Scholar] [CrossRef]
  4. IMO MEPC.1/Circ.794; On-Shore Power Supply. IMO: London, UK, 2012.
  5. Hall, W.J. Assessment of CO2 and Priority Pollutant Reduction by Installation of Shoreside Power. Resour. Conserv. Recycl. 2010, 54, 462–467. [Google Scholar] [CrossRef]
  6. Vaishnav, P.; Fischbeck, P.S.; Morgan, M.G.; Corbett, J.J. Shore Power for Vessels Calling at U.S. Ports: Benefits and Costs. Environ. Sci. Technol. 2016, 50, 1102–1110. [Google Scholar] [CrossRef] [PubMed]
  7. Winkel, R.; Weddige, U.; Johnsen, D.; Hoen, V.; Papaefthimiou, S. Shore Side Electricity in Europe: Potential and Environmental Benefits. Energy Policy 2016, 88, 584–593. [Google Scholar] [CrossRef]
  8. IMO Resolution MEPC.323(74); Invitation to Member States to Encourage Voluntary Cooperation between the Port and Shipping Sectors to Contribute to Reducing GHG Emissions from Ships. IMO: London, UK, 2019.
  9. Lähteenmäki-Uutela, A.; Repka, S.; Haukioja, T.; Pohjola, T. How to Recognize and Measure the Economic Impacts of Environmental Regulation: The Sulphur Emission Control Area Case. J. Clean. Prod. 2017, 154, 553–565. [Google Scholar] [CrossRef]
  10. Sheng, D.; Meng, Q.; Li, Z.C. Optimal Vessel Speed and Fleet Size for Industrial Shipping Services under the Emission Control Area Regulation. Transp. Res. Part C Emerg. Technol. 2019, 105, 37–53. [Google Scholar] [CrossRef]
  11. Kontovas, C.A. Integration of Air Quality and Climate Change Policies in Shipping: The Case of Sulphur Emissions Regulation. Mar. Policy 2020, 113, 103815. [Google Scholar] [CrossRef]
  12. Ren, J.; Lützen, M. Fuzzy Multi-Criteria Decision-Making Method for Technology Selection for Emissions Reduction from Shipping under Uncertainties. Transp. Res. Part D Transp. Environ. 2015, 40, 43–60. [Google Scholar] [CrossRef]
  13. Daniel, H.; Trovão, J.P.F.; Williams, D. Shore Power as a First Step toward Shipping Decarbonization and Related Policy Impact on a Dry Bulk Cargo Carrier. eTransportation 2022, 11, 100150. [Google Scholar] [CrossRef]
  14. Zis, T.; North, R.J.; Angeloudis, P.; Ochieng, W.Y.; Bell, M.G.H. Evaluation of Cold Ironing and Speed Reduction Policies to Reduce Ship Emissions near and at Ports. Marit. Econ. Logist. 2014, 16, 371–398. [Google Scholar] [CrossRef]
  15. Nguyen, D.-H.; Lin, C.; Cheruiyot, N.K.; Hsu, J.-Y.; Cho, M.-Y.; Hsu, S.-H.; Yeh, C.-K. Reduction of NOx and SO2 Emissions by Shore Power Adoption. Aerosol Air Qual. Res. 2021, 21, 210100. [Google Scholar] [CrossRef]
  16. Yu, J.; Voß, S.; Tang, G. Strategy Development for Retrofitting Ships for Implementing Shore Side Electricity. Transp. Res. Part D Transp. Environ. 2019, 74, 201–213. [Google Scholar] [CrossRef]
  17. Jieling, C.; Haibo, L. Analysis of Environmental Benefits of Shore Power for Preventing and Controlling Air Pollution Caused by Vessels at Berth. E3S Web Conf. 2018, 53, 04036. [Google Scholar] [CrossRef]
  18. Dai, L.; Hu, H.; Wang, Z. Is Shore Side Electricity Greener? An Environmental Analysis and Policy Implications. Energy Policy 2020, 137, 111144. [Google Scholar] [CrossRef]
  19. Stolz, B.; Held, M.; Georges, G.; Boulouchos, K. The CO2 Reduction Potential of Shore-Side Electricity in Europe. Appl. Energy 2021, 285, 116425. [Google Scholar] [CrossRef]
  20. Wang, H.; Mao, X.; Rutherford, D. Costs and Benefits of Shore Power at the Port of Shenzen; ICCT: Washington DC, USA, 2015. [Google Scholar]
  21. Bouman, E.A.; Lindstad, E.; Rialland, A.I.; Strømman, A.H. State-of-the-Art Technologies, Measures, and Potential for Reducing GHG Emissions from Shipping – A Review. Transp. Res. Part D Transp. Environ. 2017, 52, 408–421. [Google Scholar] [CrossRef]
  22. Kim, J.; Rahimi, M.; Newell, J. Life-Cycle Emissions from Port Electrification: A Case Study of Cargo Handling Tractors at the Port of Los Angeles. Int. J. Sustain. Transp. 2012, 6, 321–337. [Google Scholar] [CrossRef]
  23. Silaksanti, D.; Sudarmo, S.T. Cost and Environmental Benefit in the Use of Shore Connection in Bjti Port. Adv. Transp. Logist. Res. 2020, 3, 38–45. [Google Scholar] [CrossRef]
  24. IMO Resolution MEPC.328(76); Amendments to the Annex of the Protocol of 1997 to Amend the International Convention for the Prevention of Pollution from Ships, 1973, As Modified by the Protocol of 1978 Relating Thereto. IMO: London, UK, 2021.
  25. Peng, Y.; Li, X.; Wang, W.; Wei, Z.; Bing, X.; Song, X. A Method for Determining the Allocation Strategy of On-Shore Power Supply from a Green Container Terminal Perspective. Ocean Coast. Manag. 2019, 167, 158–175. [Google Scholar] [CrossRef]
  26. Zis, T.P.V. Prospects of Cold Ironing as an Emissions Reduction Option. Transp. Res. Part A Policy Pract. 2019, 119, 82–95. [Google Scholar] [CrossRef] [Green Version]
  27. Jiao, Y.; Wang, C. Shore Power vs. Low Sulfur Fuel Oil: Pricing Strategies of Carriers and Port in a Transport Chain. Int. J. Low-Carbon Technol. 2021, 16, 715–724. [Google Scholar] [CrossRef]
  28. Cao, D.; Ma, Z.; Zheng, W.; Xu, K.; Ma, Z.; Song, C. Research on Energy Efficiency Economy and Environmental Benefit Evaluation Method of Ship Shore Electricity Technology. In Proceedings of the 2017 4th International Conference on Information Science and Control Engineering (ICISCE); IEEE: Changsha, China, 2017; pp. 1636–1640. [Google Scholar]
  29. Tseng, P.H.; Pilcher, N. A Study of the Potential of Shore Power for the Port of Kaohsiung, Taiwan: To Introduce or Not to Introduce? Res. Transp. Bus. Manag. 2015, 17, 83–91. [Google Scholar] [CrossRef] [Green Version]
  30. Chang, C.C.; Huang, P.C.; Hsieh, C.C. Carbon Allowance Allocation in the Shipping Industry under Different Economic Activities. Procedia Manuf. 2019, 30, 112–119. [Google Scholar] [CrossRef]
  31. Chang, C.C.; Huang, P.C. Carbon Allowance Allocation in the Shipping Industry under EEDI and Non-EEDI. Sci. Total Environ. 2019, 678, 341–350. [Google Scholar] [CrossRef]
  32. Schwartz, H.; Gustafsson, M.; Spohr, J. Emission Abatement in Shipping – Is It Possible to Reduce Carbon Dioxide Emissions Profitably? J. Clean. Prod. 2020, 254, 120069. [Google Scholar] [CrossRef]
  33. Dai, L.; Hu, H.; Wang, Z.; Shi, Y.; Ding, W. An Environmental and Techno-Economic Analysis of Shore Side Electricity. Transp. Res. Part D Transp. Environ. 2019, 75, 223–235. [Google Scholar] [CrossRef]
  34. Kumar, J.; Kumpulainen, L.; Kauhaniemi, K. Technical Design Aspects of Harbour Area Grid for Shore to Ship Power: State of the Art and Future Solutions. Int. J. Electr. Power Energy Syst. 2019, 104, 840–852. [Google Scholar] [CrossRef]
  35. Lam, J.S.L.; Notteboom, T. The Greening of Ports: A Comparison of Port Management Tools Used by Leading Ports in Asia and Europe. Transp. Rev. 2014, 34, 169–189. [Google Scholar] [CrossRef]
  36. Jensen, S.; Lützen, M.; Mikkelsen, L.L.; Rasmussen, H.B.; Pedersen, P.V.; Schamby, P. Energy-Efficient Operational Training in a Ship Bridge Simulator. J. Clean. Prod. 2018, 171, 175–183. [Google Scholar] [CrossRef] [Green Version]
  37. Wan, Z.; el Makhloufi, A.; Chen, Y.; Tang, J. Decarbonizing the International Shipping Industry: Solutions and Policy Recommendations. Mar. Pollut. Bull. 2018, 126, 428–435. [Google Scholar] [CrossRef] [Green Version]
  38. Lee, H.; Park, D.; Choo, S.; Pham, H.T. Estimation of the Non-Greenhouse Gas Emissions Inventory from Ships in the Port of Incheon. Sustainability 2020, 12, 8231. [Google Scholar] [CrossRef]
  39. Cloquell Ballester, V.; Lo-Iacono-Ferreira, V.G.; Artacho-Ramírez, M.Á.; Capuz-Rizo, S.F. The Carbon Footprint of Valencia Port: A Case Study of the Port Authority of Valencia (Spain). Int. J. Environ. Res. Public Health 2020, 17, 8157. [Google Scholar] [CrossRef] [PubMed]
  40. Minstry of Ocean and Fisheries Port-MIS. Available online: https://new.portmis.go.kr/ (accessed on 3 February 2022).
  41. MAN Energy Solution Propulsion Trends in Container Vessels. Available online: https://www.man-es.com/docs/default-source/marine/tools/propulsion-trends-in-container-vessels.pdf?sfvrsn=c48bba16_12 (accessed on 19 March 2022).
  42. Abramowski, T.; Cepowski, T.; Zvolenský, P. Determination of Regression Formulas for Key Design Characteristics of Container Ships at Preliminary Design Stage. New Trends Prod. Eng. 2018, 1, 247–257. [Google Scholar] [CrossRef] [Green Version]
  43. Lloyd’s List One Hundred Ports 2021. Available online: https://lloydslist.maritimeintelligence.informa.com/-/media/lloyds-list/images/top-100-ports-2021/top-100-ports-2021-digital-edition.pdf (accessed on 18 March 2022).
  44. Ministry of Environment Greenhouse Gas Invetory and Research Center National GHG Inventory Report(1990–2019). Available online: https://www.gir.go.kr/home/board/read.do;jsessionid=jAmEAKEqQGqXTjaGXI2KkLLuHLcnEeifwYbVe9bnr698GlTU7BrH9jVuFkCk0as1.og_was1_servlet_engine1?pagerOffset=0&maxPageItems=10&maxIndexPages=10&searchKey=&searchValue=&menuId=36&boardId=54&boardMasterId=2&boardC (accessed on 13 March 2022).
  45. Busan Port Authority Container Statistics. Available online: https://www.busanpa.com/kor/Contents.do?mCode=MN1004 (accessed on 13 March 2022).
  46. Clarkson Research Shipping Intelligence Network. Available online: https://sin.clarksons.net/ (accessed on 17 March 2022).
  47. EPA Shore Power Technology Assessment at U.S. Ports. Available online: https://www.epa.gov/sites/default/files/2017-05/documents/420r17004-2017-update.pdf (accessed on 9 March 2022).
  48. IMO Resolution MEPC.304(72); Initial IMO Strategy On Reduction of GHG Emissions From Ships. IMO: London, UK, 2018.
  49. Statistics Korea KOSIS. Available online: https://kosis.kr/statHtml/statHtml.do?orgId=310&tblId=DT_31002N_A001&vw_cd=MT_ZTITLE&list_id=U_15&scrId=&seqNo=&lang_mode=ko&obj_var_id=&itm_id=&conn_path=MT_ZTITLE&path=%252FstatisticsList%252FstatisticsListIndex.do (accessed on 13 March 2022).
  50. Greenhouse Gas Inventory and Research Center 2019 Korean Emissions Trading System Report. Available online: https://ors.gir.go.kr/home/board/read.do?menuId=2&boardMasterId=4&boardId=46 (accessed on 17 March 2022).
  51. KRX ETS Market Information Platform. Available online: https://ets.krx.co.kr/ (accessed on 1 March 2022).
  52. GloMEEP Shore Power. Available online: https://glomeep.imo.org/technology/shore-power/ (accessed on 10 March 2022).
Figure 1. Container throughput and transshipment ratio in the Port of Busan (adapted from https://www.busanpa.com/kor/Contents.do?mCode=MN1004, accessed on 15 March 2022) [45].
Jmse 10 00622 g001
Figure 2. Cost differences in fuel oil and electricity prices (MGO).
Jmse 10 00622 g002
Figure 3. Costs differences in fuel oil and electricity prices (HSFO).
Jmse 10 00622 g003
Figure 4. (a) Benefits per ship’s call (HSFO) and (b) benefits per ship’s call(MGO).
Jmse 10 00622 g004
Figure 5. The trends for CO2 emission reductions when using shore power.
Jmse 10 00622 g005
Figure 6. (a) Environmental benefit and (b) environmental benefit per ship’s call.
Jmse 10 00622 g006
Table 1. Data on ships at berth equipped with shore power facilities in the Port of Busan (adapted from Port-MIS) [40].
YearShip SizeNo. of Port CallsAverage Quantity
(TEU)
Average
GT (t)
Average Hoteling Time (Hrs)
2019Small1802828.78044.719.6
Feeder8411511.115,598.720.9
Old Panamax4313241.334,715.219.0
Post Panamax6757276.379,298.018.9
New Panamax9713,214.6144,911.019.9
UCLV12716,485.7181,053.119.2
2020Small1561855.08325.821.7
Feeder8721499.815,473.521.0
Old Panamax4113206.934,335.522.3
Post Panamax5707219.478,670.223.8
New Panamax8013,169.0144,407.425.3
UCLV9517,316.8190,236.224.6
2021Small1253877.88597.121.6
Feeder8571525.315,755.223.1
Old Panamax3013049.432,595.132.5
Post Panamax4677332.279,915.931.0
New Panamax11413,200.0144,749.037.1
UCLV7818,243.4200,473.750.1
Table 2. The top 10 ports by throughput in 2020 (adapted from One Hundred Port 2021) [43].
RankPortCountryRegion2020 Annual
Throughput (teu)
1ShanghaiChinaAsia43,503,400
2SingaporeSingaporeAsia36,870,900
3Ningbo-ZhoushanChinaAsia28,720,000
4ShenzhenChinaAsia26,550,000
5GuangzhouChinaAsia23,505,300
6QingdaoChinaAsia22,010,000
7BusanSouth KoreaAsia21,824,400
8TianjinChinaAsia18,353,100
9Hong KongChinaAsia17,953,000
10RotterdamThe NetherlandsNorthern Europe14,349,446
Table 3. The status of annual carbon dioxide–equivalent emissions in South Korea (adapted from national GHG inventory report and South Korean electric power statistics.) [44,49].
YearCO2eq. Emissions (kg/kWh)
2010504.12
2011495.26
2012489.58
2013495.29
2014463.08
2015458.50
2016448.68
2017454.14
2018470.27
2019441.79
Table 4. The trends of the South Korean emission trading market (adapted from Korean emission trading system report.) [50].
20152016201720182019
Volume (millions of tons)5.712.026.647.338.0
Average price
(in dollars)
9.7314.7018.5520.1120.96
Trading value
(in millions of dollars)
55.1176.0487.2952.2928.9
Table 5. Net present value by each segment and fuel oil type (in dollars).
SmallFeederOld PMXPost PMXNew PMXUCLV
HSFOScenario I−35,400−90,684−328,962−245,114−301,864−305,950
Scenario II5450−18,826−280,750−204,908−239,233−223,683
Scenario III 31,88918,123−232,366−137,088−149,581−68,712
MGOScenario I26,71734,393−245,114−245,114−217,037−175,238
Scenario II67,567106,250−196,902−204,908−154,406−92,972
Scenario III 94,006143,200−148,519−137,088−64,75461,999
Publisher’s Note: MDPI stays neutral with regard to jurisdictional claims in published maps and institutional affiliations.

