Abstract
This observational study is concerned with the seasonal variability of near-inertial internal waves (NIWs) in the central part of the Black Sea. Rotary spectral analysis of the nearly year-long time series of the sea current velocity measurements at 100 m and 1700 m revealed the prevailing anticyclonic component of the motions near the local inertial frequency f. Both the rotary spectra and the visual exploration of the time series showed that the peaks of NIWs were blue-shifted to higher frequencies. The monthly average blue-shift was stronger up to 1.038f in the summer. It was found that the minimum intensification of the NIWs occurred in summertime and the maximum intensification was characteristic of the autumn-winter period when the NIW packets included up to 16 waves with pronounced clockwise rotation of the velocity vectors.
1. Introduction
Ocean internal gravity waves propagate through the stratified interior of the ocean. As waves propagate, they interact with each other, producing an internal gravity wave continuum consisting of energy in many frequencies. The propagation of NIW energy can lead to mixing due to wave breaking in the thermocline [1,2]. It is well known that the average annual contribution of inertial internal waves (IWs) to the global energy flux in the upper mixed layer in the ocean is comparable to that of internal tides [3]. Among possible generation mechanisms of inertial internal waves are wind forcing [4,5] and nonlinear interactions of IWs (which likely leads to the generation of inertial waves of higher modes), the formation of lee waves by geostrophic flow over the seabed topography, and generation due to the interaction of mesoscale and submesoscale motions [1]. An analytical solution for inertial internal waves in the boundary layers was given in [6]. In particular, the boundary layers were shown to be dependent on the horizontal extension of the wind forcing: the smaller the scale is, the sharper the boundary layer and the stronger the localization of inertial oscillations at the Ekman layer boundary. For inertial oscillations that propagate over regions of a horizontal size of baroclinic Rossby radius and larger, the boundary layers are significantly thicker and develop more slowly, and the fluctuations can reach the bottom.
Using an extensive moored current-meter database it was shown that the winter enhancement by a factor of 4–5 in the Northern Hemisphere for latitudes 25°–45° at all depths less than 4500 m is in good agreement with the seasonal cycle of wind-forced mixed-layer energy flux [7]. The IWs were typically observed in short packets, so it was often difficult to define the wave frequency with a high degree of accuracy [1]. Below we study the seasonal change of IW during almost year-long observations using the current meter mooring data in the Black Sea.
The semi-enclosed Black Sea is a bowl-shaped and deep (>2000 m) basin, where inertial motions dominate the dynamics at time scale < 1 day throughout the water column [8]. In the Black Sea, the effect of near-inertial internal waves on the generation of turbulence and vertical mixing in the pycnocline is of a great importance [9,10]. The Black Sea tides are so small [11] that the tidal waves do not interfere with IWs. The significance of IWs in hydrophysical studies of the Black Sea is primarily determined by the role as an energy source for internal waves in a higher frequency range, which is important for mixing.
Instrumental observations of inertial motions in the Black Sea have been conducted since the 1960s [12,13,14]. Measurements of the IWs in the Black Sea were carried out using moorings equipped with temperature sensors and acoustic Doppler current profilers [15,16,17]. Observations were often conducted in the sea coastal zone during the summer-autumn season, although some data were obtained under winter stratification conditions. Measurements were rare at the continental slope due to difficulties with setting up the oceanographic instruments in the strong boundary current named the Rim Current (for the Black Sea circulation, see observational and modeling studies [18,19,20,21]). Recently, the IWs of the second mode were recorded [15]. These and other studies [22,23] were also concerned with the manifestation of abnormal inertial motions in the Black Sea, such as cyclonic rotation of hodographs of inertial currents, similar to those observed on the ocean shelf in the Northern Hemisphere [24]. Over the Black Sea, the IWs were also observed by remote sensing methods using radars, spectrometers, and radiometers onboard of Envisat, ASAR, ERS-2 SAR, and Landsat-5, 7, and 8 satellites [25,26].
The inertial motions can be identified in the frequency spectra by a peak close to the local inertial frequency f [27,28]. Due to the shift relative to f, IWs are called near-inertial waves (NIWs) [29]. In the Black Sea, the frequency of near-inertial motions’ peak in the energy spectrum was found to be 4–5% higher than f [8], which is a so-called blue-shift of frequency [30]. In the Black Sea the magnitude of this shift was consistent with theoretical and experimental values obtained in other regions of the World Ocean [31,32]. In addition, the blue-shift increased with depth, which did not contradict the theory. For the Black Sea, the share of NIWs energy in the total kinetic energy increases from 10% at a depth of 50 m to 30% at 350 m [16]. This estimation was obtained for the averaged profile of the vertical stratification observed in the autumn, when the buoyancy frequency maxima were located in the seasonal pycnocline at a depth of 35 m, in the cold intermediate layer (CIL) at 50 m, and in the main pycnocline at 105 m [33,34]. It should be noted that the seasonal thermocline isolates the CIL and the underlying water masses from atmospheric impact in the warm period of the year. Above the core of the CIL, there is a stable stratification both in temperature and salinity; deeper, the stratification is unstable in temperature and stable in salinity.
Although there have been collected various data about inertial motions in the Black Sea, most of the observations were limited to the coastal areas and the summer season. For the central part of the sea, the observations were of short duration and for the summer–autumn period only. The data analyzed in this study is based on frequent nearly year-long measurements in the CIL layer (the upper part of the main pycnocline) and in the deep layer (approximately 100 m above the sea bottom). Our study region is suitable for NIW observations for several reasons: the basin is microtidal, the study point is far from the continental shelf and coast, where the bottom is almost flat, and there is no sea breeze activity. Specific examples of the manifestations of NIWs are considered to compare the variability in different seasons. Additionally, an analysis of near-inertial fluctuations is presented for the annual series of sea temperature at 265 m depth in the northeastern part of the deep basin of the Black Sea (see Appendix B).
2. Materials and Methods
The anchored buoy station (ABS) was deployed in the northwestern part of the central basin of the Black Sea in 2016–2017. The mooring (ABS No. 1 in Figure 1) was deployed at ~1800 m depth at 43°47′ N 32°04′ E. The top buoy of the mooring was located at a depth of 50–60 m in order to avoid the effect of waves and strong near-surface currents. The mooring was equipped with the acoustic Doppler current meters at fixed depths as follows: a Sontek Argonaut at 100 m and a Nortek Aquadopp at 1700 m. We analyzed Sontek data from 1 December 2016 to 5 October 2017 and Nortek data from 1 December 2016 to 30 November 2017.The temperature was recorded at 100 m. The measurement interval was 15 min and the internal instrumental averaging was 5 min. Noticeably, the measurement interval of 15 min is part of the local inertial period at the ABS No. 1 mooring site. Additionally, to get the time series of the sea temperature, the northeastern station (ABS No. 2) was deployed at the 2160 m depth at 43°26′ N 36°22′ E from 18 December 2017 to 4 December 2018 (results are discussed in the Appendix B). It was equipped with RBR Duet instrument fixed at a depth of 265 m. The sampling interval for the temperature was set to 30 s.
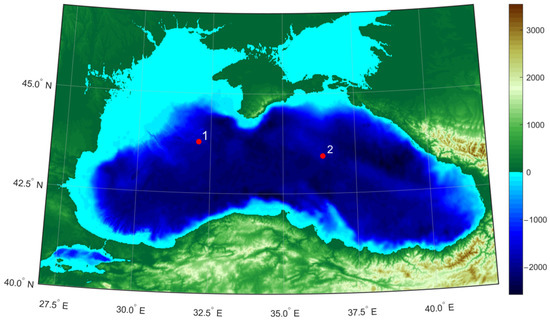
Figure 1.
The anchored buoy stations (ABS) locations in 2016–2018. Bathymetry of the Black Sea according to ETOPO1 data doi:10.7289/V5C8276M. 1—is for ABS No. 1, 2—is for ABS No. 2.
The de-trended time series of the current velocity were processed using rotary spectral analysis, or the method of rotational components, which has become widespread in oceanography since the 1970s [35,36] in particular, in applications to tidal [37] and inertial currents [38]. The method is based on a representation of the horizontal velocity vector as a complex number:
where is time, and are zonal and meridional components, and . The velocity vector can be decomposed for each frequency into two oppositely rotating motions, each with its amplitude (A+, A−) and phase (θ+, θ−). Counterclockwise rotations correspond to movements with positive frequencies, and clockwise rotations correspond to negative ones. The components of the two-dimensional velocity vector at the inertial frequency make periodic elliptic orbits in the hodograph plane. Energy spectra are determined for both the negative and positive frequencies. The total energy spectrum , where is the frequency, can be represented as the sum of the clockwise and counterclockwise components of the spectra ranges in the following form:
As follows from the classic theory (for example, [28,35]) for the Northern Hemisphere, inertial oscillations appear in the clockwise component. One of the characteristics of a random vector process is the rotary coefficient r(ω), proposed in [35]:
For clockwise movements, the rotary coefficient is positive and for inertial oscillations ; in this case, the rotation of the velocity vector is observed as a circular orbit. When , the orbit approaches an ellipse.
For the rotary spectral analysis we used the software package jLab v.1.7.1 [39] http://www.jmlilly.net/software, accessed on 1 March 2022. The availability of nearly year-long measurements of the currents with a 15-min sampling rate makes it possible to carry out a frequency spectral analysis that is statistically rigorous and reveals the seasonal variability of the observed NIWs. At the first stage of data processing, the energy spectra of the clockwise (anticyclonic) and counterclockwise (cyclonic) components of the current velocity were estimated for the entire observation period. Then, the rotary energy spectra were calculated for each month, and the annual variability of the NIWs was analyzed.
To assess the thermohaline stratification conditions near the ABS No. 1, the vertical profiles of the density and buoyancy frequency (Brunt–Väisäla) were calculated from the temperature and salinity data of the Argo floats (Nos. 6901832, 6901833, and 6901834) [40] for 2017. Notice that the Argo floats are the primary research tools for contemporary oceanography of the Black Sea [41,42,43,44,45,46].
To assess the atmospheric forcing condition, the correlation analysis between the surface wind vector and the current vector was performed. The wind data were taken from the ERA-5 meteorological reanalysis data, which combine model data and observations on a grid with 0.25° latitude and longitude spacing. The hourly data of the near-surface wind at the height of 10 m from the sea surface at a grid point close to the ABS No. 1 site were used. To find the correlations between the time series and , the complex correlation method proposed by [47] was used. The complex correlation coefficient was defined as the normalized inner product of two vector time series:
where the asterisk (*) is the complex conjugate operator, denotes the ensemble-average operator, is the the magnitude of the correlation, and gives the mean counterclockwise rotation angle of the current velocity vector relative to the wind velocity vector.
To estimate the correlation coefficient with a time lag (), we have:
Before calculating the correlations, the time series and were de-trended. Since the reanalysis wind data included diurnal breeze signal (which is somewhat atypical for a point in the central part of the sea), the wind data were filtered. The fourth-order Butterworth bandpass filter was applied to extract near diurnal velocities. The cutoff frequency band was [0.916, 1.083] , where the diurnal wind frequency 0.0416 cph. For the correlation calculation, time windows of 96–100 h and lags h were selected.
The estimates of the NIW period based on the results of spectral analysis of relatively short (1 month) time series may possess large uncertainty. This could be due to the phase modulation of NIWs generated by successive atmospheric storms, which might occur occasionally. Thereby, the total number of NIW crests in the time series of the velocity components for the identified NIW packets for each month was calculated manually. To do this, we visually identified the NIW packets and estimated the time interval between the crests of two adjacent waves in the packet. The average period of waves was determined for each month as the arithmetic means of the sum of the average periods of identified packets. Taking into account the measurement interval of 15 min, the error of the individual estimate of the distance between two inertial waves was 1.45% of the local inertial period. The NIW intermittency was calculated as the ratio of the duration of the identified NIWs to the total observation time for each month.
3. Results
3.1. Vertical Stratification and Near-Inertial Currents
The vertical stratification was obtained from the Argo float data available in the observation region for 2017 (Figure 2). In the warm season, the vertical stratification was characterized by seasonal and main pycnoclines. The upper quasi-homogeneous layer began to form in April due to the warming of surface waters and could be observed until October. The seasonal pycnocline was sharpest in June at depths of 30–40 m. In autumn, the position of its lower boundary gradually shifted to a depth of 50 m. Two maxima characterized the buoyancy frequency profile: subsurface = 23 cph and deep maximum > 10 cph in the main pycnocline that was located usually below 80 m.
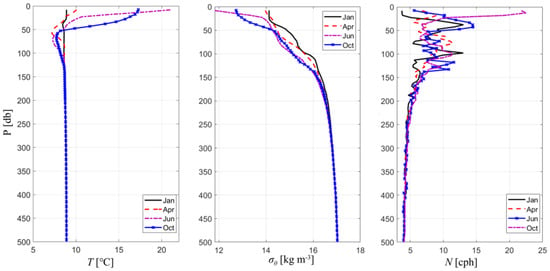
Figure 2.
Vertical profiles of the temperature , potential density , and the Brunt-Väisäla frequency near to ABS No. 1 for 11 January, 13 April, 13 June, and 11 October 2017, based on data from Argo floats Nos. 6901832, 6901833, and 6901834. Profiles are given to a depth of 500 m to show the changes in the upper layer of the sea in more detail.
According to ABS No. 1 observations at a depth of 100 m, the average current velocity was ms−1, the standard deviation was ms−1, and the current was oriented mainly to the southwest (207°). Seasonal changes in the current velocity were observed: the highest values were noted in winter, mainly in December (maximum of 0.28 ms−1), and the minimum occurred in summer. At this depth, the temperature varied from 8.35 °C (in December) to 8.5 °C (in March and May) at a depth of 100 m (Figure 3). The range of the temperature variations was small because the measurement depth was located under the CIL core at the top of the main pycnocline. At 1700 m depth, ms−1, ms−1, the average direction was eastward (167°).
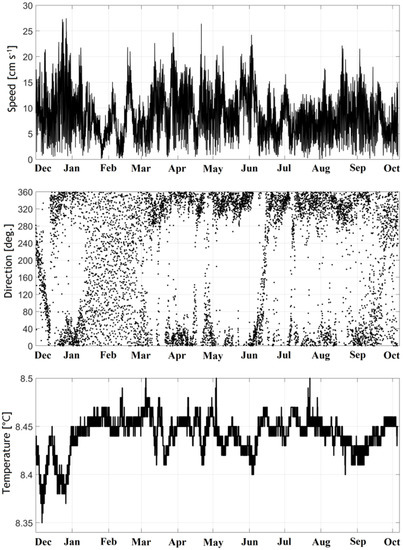
Figure 3.
Time series of current speed (top) and direction (middle) and temperature (bottom) at the 100 m depth at ABS No. 1 from 1 December 2016 to 5 October 2017. The graphs are based on data averaged over 1 h.
During winter months, mainly in January–February, strong inertial motions were distinguished by the rotation of the vector with near-inertial frequency (Figure 4). At 100 m depth, the inertial orbital motion was of 0.5–1.5 km diameter. At 1700 m depth, the hodograph orbits were not closed. Instead, the hodographs were arc-shaped with a typical horizontal scale of 0.5–0.7 km. Note that the baroclinic Rossby radius for the deep-water part of the Black Sea could be 15–25 km [48].
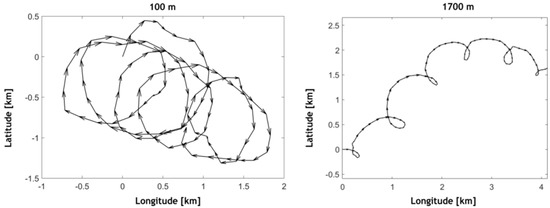
Figure 4.
Progressive vector diagram of the currents at 100 m and 1700 m depths of ABS No. 1 from 00:00 20 January 2017 to 03:00 24 January 2017. The data were averaged over 1 h. The horizontal and vertical axes show the distances in longitude and latitude from the starting points of the data ensembles.
3.2. Rotary Spectra of the Currents
In the power spectra, a peak close to the local inertial frequency (f = 0.058 cph) and clockwise rotation indicate the frequent presence of NIW at 100 m in the central basin of the Black Sea (Figure 5a). At frequencies close to the local inertial one, the value of the rotary coefficient approached 1, which indicates that clockwise rotation dominated at the inertial frequency, and the velocity vector made an ellipse-like turn (Figure 5b).
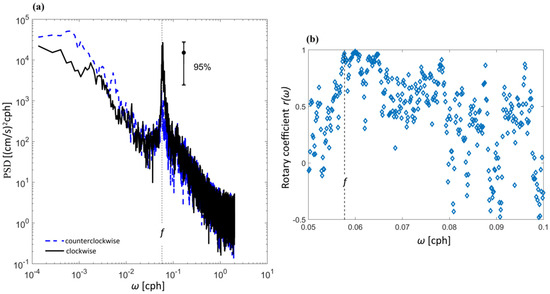
Figure 5.
(a) Rotary spectra of the clockwise and counterclockwise current vector rotation motions at 100 m at ABS No. 1. In the left plot, the vertical dotted line indicates the local inertial frequency at the mooring site. (b) Rotary coefficient in the range of near-inertial frequencies.
The clockwise power spectra of the current velocity at 100 m for each month are shown in Figure 6. A distinct peak was found at a frequency of 0.058–0.061 cph (in the range of periods 17.24–16.39 h) every month. At 100 m depth, the energy peak was highest in February and lowest in July (inset in Figure 6). The ratio of the peaks in February and in July was about 8.5.
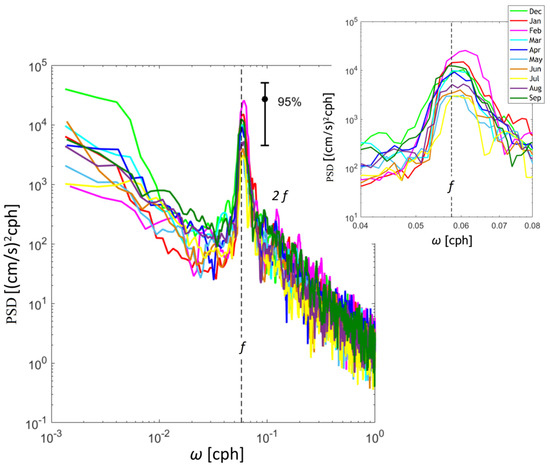
Figure 6.
The rotary spectra of clockwise rotation motion at 100 m at ABS No. 1 in different months. The dashed line indicates the local inertial frequency in the study area. The small image in the upper right corner is an enlargement of the figure to better visualize the peaks close to the inertial periods.
In the deep layer at 1700 m, there was also a significant peak near the inertial frequency (Figure 7), and the anticyclonic velocity component prevailed over the cyclonic. The NIWs were most energetic in January and weakest in June. The ratio between the local spectral peak maximum and the local spectral peak minimum was as high as 14.0. A comparison of the spectra at 100 m and 1700 m shows that the energy level in the upper layer was an order of magnitude higher than that in the deep layer. In addition, the smaller maximum at the superinertial frequency 2f was observed in winter (December–February), spring (March–May), and September.
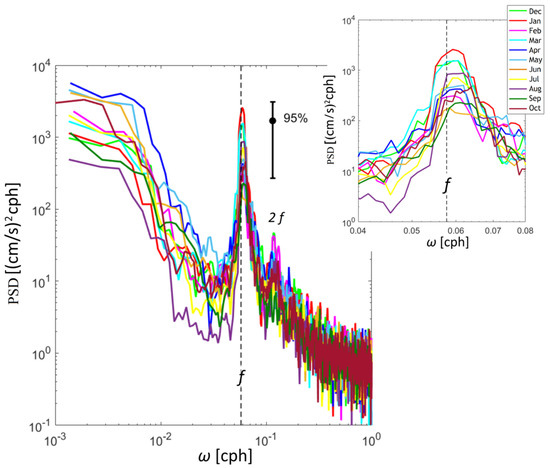
Figure 7.
The rotary spectra of clockwise rotation motion at 1700 m at ABS No. 1 in different months. The dashed line indicates the local inertial frequency in the study area. The small image in the upper right corner is an enlargement of the figure to better visualize the peaks close to the inertial periods.
3.3. Seasonal Variation of Near-Inertial Waves
3.3.1. Winter Season
At the beginning of the winter season, the intensification of NIWs alternated with periods of calm at a 100 m depth. Strong intermittence or enhanced temporal variability of wave packets was observed (Figure 8a). From 1 to 4 December, near-inertial oscillations weakened, and then modulation occurred, possibly caused by a sharp change in the near-surface wind direction. A time shift of 36–40 h between the wind action and the response was noted (Figure 8b). From 8 to 13 December, the NIWs decreased, due to a stabilizing effect of the southwestern wind blowing for more than 100 h (Figure 8a). The current speed was reduced, although the hodographs rotation with the inertial frequency persisted. The next packet of near-inertial motions developed again after 13 December and continued until 20 December (Figure 8a). During these episodes, 10 crests of inertial waves passed. This wave packet was preceded by increased speed of the southeastern wind up to 8 m s−1 on 12–13 December. For this observation ensemble, the maximum correlation between wind and current vectors was at the time lag 45–48 h. On 21 December, the current direction changed. Then the new packet of regular and intense near-inertial oscillations of an increased period arrived. In the first wave packet in the second part of December, the period was about 15.81 h. The wave period extended to 17.73 h in the second wave packet and then turned to 16.94 h in the third packet.
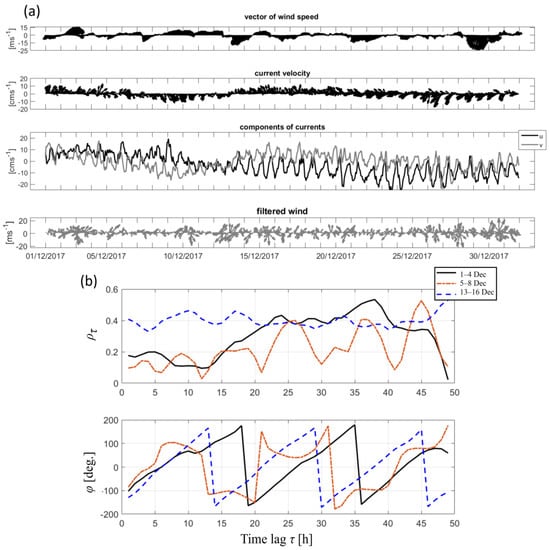
Figure 8.
(a) Top—wind speed vector plot from the ERA-5 meteorological reanalysis data. The second plot from the top is the current velocity at 100 m at ABS No. 1 in December 2016, and the third plot from the top shows the - and -components of the current velocity. Bottom—wind speed after band-pass filtering for 22–26 h. (b) Top—lagged correlations between the wind and current vectors for 1–4, 5–8, and 13–16 December 2016, bottom—the angle of rotation of the current velocity vector relative to the wind velocity vector.
An intensification of NIWs was observed on 6–10 January 2017 (Appendix A, Figure A1). This amplification was preceded by a sharp increase in the north wind speed. Another intense NIW packet was observed on 11–16 January, when five waves were recorded. Starting from 17 January, a well-defined sequence of 13 waves with a period of 16.79 h arrived. The wave amplitude gradually decreased by 25 January. The correlation maxima between the wind and current velocity vectors for 12–16 January and 20–24 January were and , with time lags of 30–37 and 30–43 h, respectively. The rotation angle between the current velocity and wind vector varied from −165°–170° to 160°–180°.
As noted above, persistent long-term forcing by intense wind could suppress inertial oscillations, such as those observed in February 2017 (Figure 9). There were no inertial oscillations during the period of the northeastern wind on 8–14 February. The intensification of inertial fluctuations happened again after 14 February and could be observed for almost 14 days. These oscillations could originate due to changes in the strength and direction of the wind. The packet of 15 inertial internal waves was recorded during this period, reaching the maximum amplitude on 18–19 February. During the passage of the NIW packets, positive correlations were noted between the wind and current velocity vector at 31–36 h. Notably, NIWs were developed during the prevailing southeasterly. The intensification of NIWs peaked after 5–6 periods, and then a slow decay followed (Figure 9). The inertial fluctuations dissipated after the wind direction changed to the northeastern.
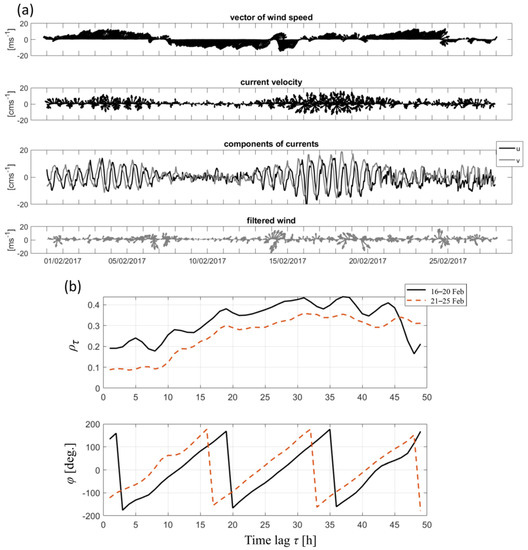
Figure 9.
(a) Top—wind speed vector plot from the ERA-5 meteorological reanalysis data. The second plot from the top is the current velocity at 100 m at ABS No. 1 in February 2017, and the third plot from the top shows the - and -components of the current velocity. Bottom—wind speed after band-pass filtering for 22–26 h. (b) Top—lagged correlations between the wind and current vectors for 16–20 and 21–25 February 2017, bottom—the angle of rotation of the current velocity vector relative to the wind velocity vector.
3.3.2. Spring–Summer Period
In the spring–summer period of 2017, the NIW energy was getting lower than that in the winter season (Figure 6 and Figure 7). NIWs were observed more clearly in the current speed data, and the velocity hodographs underwent significant changes. In March, there were certain periods of intensification of inertial oscillations with a maximum after 27 March (Figure A2). The wind was usually weak 3 m s−1 or less increasing to 8 m s−1 on some days. The most intense NIWs were observed just after such an intensification of the wind forcing. The maximum correlation between the surface wind and current vectors was relatively low with a time lag 31–45 h.
In the summer conditions of June 2017 (Figure 10), the NIW energy at 100 m depth was at the annual minimum. Four short packets of NIWs appeared during this month. Each event consisted of 3–7 oscillations. At the beginning of June, the strong NIWs () were of a period 16.33 h. Later the current speed in the NIWs diminished to 0.05–0.10 m s−1. In June, the values of were insignificant; only on 16–20 June, at = 38–48 h (Figure 10b).
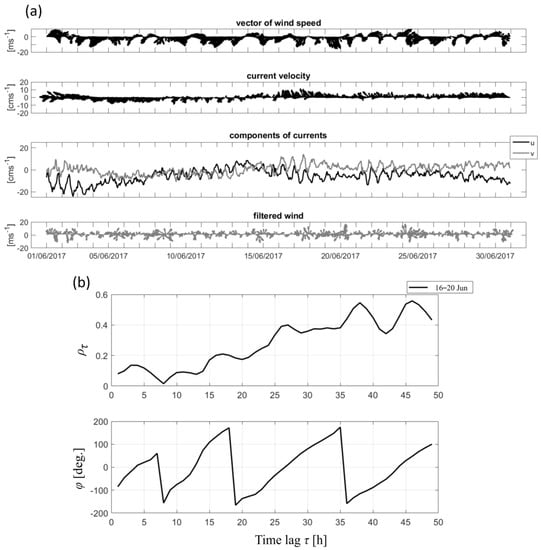
Figure 10.
(a) Top—wind speed vector plot from the ERA-5 meteorological reanalysis data. The second plot from the top is the current velocity at 100 m at ABS No. 1 in June 2017, and the third plot from the top shows the - and -components of the current velocity. Bottom—wind speed after band-pass filtering for 22–26 h. (b) Top—lagged correlations between the wind and current vectors for 16–20 June 2017, bottom—the angle of rotation of the current velocity vector relative to the wind velocity vector.
In the warm season as compared with winter conditions, the orbits of near-inertial motions significantly changed (Figure 11). The hodographs did not close and had the shape of an arc elongated to the southwest in March and northwest in June, which indicated the main direction of the water mass transport. The rotation of the hodographs was insignificant at the 1700 m depth.
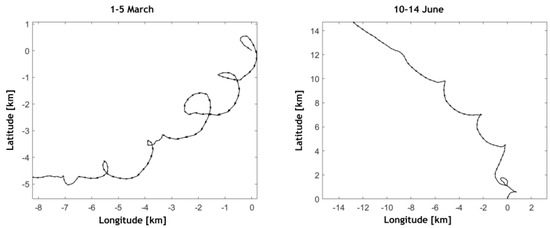
Figure 11.
Progressive vector diagrams of currents at 100 m depth for selected periods in March (left) and June (right) of 2017.
3.3.3. Autumn Season
As shown in above Figure 6 and Figure 7, the energy level at the inertial frequency in September was close to the January values. The inertial oscillations of the velocity components underwent temporal variations in September (Figure 12). Long packets of 3–13 inertial cycles were observed. In the longer packets, the intensification happened at the 4th–6th oscillation. The maximum amplitudes of the current velocity fluctuations reached 0.2 m s−1. Then the NIWs slowly dissipated. The results of the correlation analysis between the wind and current velocity vectors show significant positive correlations maximum for the NIW packets during 1–4 and 16–20 September (Figure 12b) at the time lags of 25 h and 28 h, respectively. In September, meteorological conditions were characterized by a frequent change in the wind direction with a frequency close to inertial (Figure 12a).
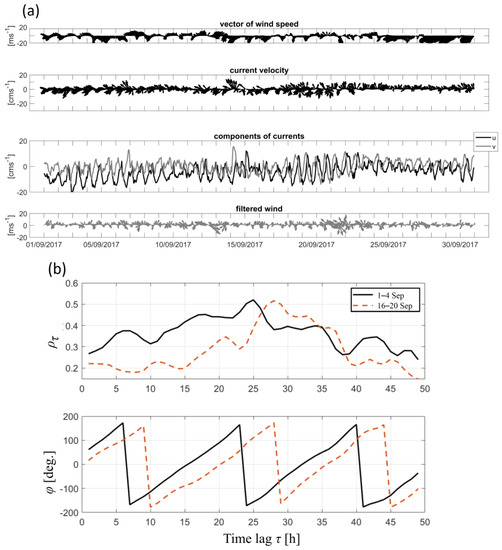
Figure 12.
(a) Top—wind speed vector plot from the ERA-5 meteorological reanalysis data. The second plot from the top is the current velocity at 100 m at ABS No. 1 in September 2017, and the third plot from the top shows the - and -components of the current velocity. Bottom—wind speed after band-pass filtering for 22–26 h. (b) Top—lagged correlations between the wind and current vectors for 1–4 and 16–20 September 2017, bottom—the angle of rotation of the current velocity vector relative to the wind velocity vector.
3.4. The Seasonal Variability of the Blue-Shift in the Near-Inertial Frequency
The spectral analysis revealed the blue-shift frequency of NIWs (see Section 3.2 above). This was confirmed by visual identification of the NIW periods, which showed that the average periods were mainly shorter than the inertial ones (Table 1). The shortest periods varied from 14.8 h in January to 15.3 h in August, while the largest varied more broadly from 19.25 h to 20.8 h in April. The monthly average periods were almost the same as the local inertial period in March and April. In May and June, the observed NIW’s periods became shorter ~16.6 h. In July and September, these were nearly 16.8 h and later in December, they shortened again to 16.6 h. In terms of frequency, the monthly average shift was in the range from 1.002f to 1.038f, i.e., 0.2–3.8%. The high temporal intermittency was a remarkable feature of NIWs. The modulation time scale increased in winter (~11.3 days in December, 10.5 days in February) and shortened in the spring–summer period (1.4 days in May, 1.3 days in August). The maximum number of NIWs was observed in December and September (39 and 34 fluctuations, respectively), and the minimum, in June and July (21 and 25 fluctuations, respectively). The intermittency was at maximum of 87% in December and at minimum of 48% in June.

Table 1.
Near-inertial waves at 100 m depth for individual months, 2016–2017.
The thermohaline stratification was modified in spring and autumn. These transformations occurred with delay from the astronomical seasons. For example, the stratification was not yet of a winter type in December. It was established in January and persisted until the end of April. During this period, the modulation time scales of NIWs were the longest. The seasonal pycnocline began to develop in May, and the strongest shifts of near-inertial frequency and shortest modulation time scales were observed. Also from the spectral analysis, it was found that during transitional seasons, the power spectra peaks were also found at frequency ~2f. The overtones of inertial oscillation could be associated with the observed shortness of the NIW packets.
4. Discussion
The rotary spectral analysis of the velocity vectors revealed a peak at the inertial frequency with clockwise rotation. These features indicate the predominant influence of inertial oscillations in the study area. Similar results for the deep-water part of the Black Sea were obtained previously based on a short time series of observation data [14]. The power spectra maxima were basically shifted toward frequencies higher than the local inertial frequency. The analysis of the current measurement data in the Black Sea showed a frequency shift of 1.002f–1.038f (0.2–3.8%). The power spectra analyses indicated relatively broader peaks. An apparent reason for this was the phase modulation of NIWs. However, both the spectral estimates and ad-hoc intuitive analysis showed the tendency of increase in the NIW’s period during the most stable vertical stratification in the sea. The blue-shift of the inertial motions was often observed in the World Ocean [29]. The blue-shift was observed in many areas of the World Ocean, for example, in the South China Sea [32], where the meandering of the Kuroshio Current caused this shift. A frequency shift of NIWs to the low-frequency band (“red-shift”) was also noted, which could be associated with the Doppler shift in the flow [49] or by negative background vorticity, such as mesoscale eddy [49,50].
Based on our data analysis, the peaks of the power spectra of NIWs were more pronounced in September–February. Noteworthy that according to the results of global observations at moored stations, the energy of NIWs in the Northern Hemisphere middle latitudes also varies with season, with a maximum in winter [7].
There could be several reasons for the blue-shift in the NIW frequency in the Black Sea study site. The seasonal variation in the wind stress over the Black Sea could be characterized by an increase in cyclonic vorticity in winter, which peaked in February [51], while in summer, the atmospheric forcing change most likely resulted in the anticyclonic vorticity of the wind stress. The seasonal variation of atmospheric forcing contributed to the intensification of the Rim Current (cyclonic vorticity) in winter and its weakening in summer. In turn, the Rim Current instability could serve as a source of generation of NIWs [14]. The horizontal vorticity of the background currents affected inertial oscillations [52]. If the background vorticity was cyclonic (anticyclonic), then the frequency of inertial oscillations increased (decreased). Previous observations showed a strong impact of mesoscale vorticity on the NIW propagation in the ocean [53,54]. The observed variation in the blue-shift magnitude could be due to the change of the background flow and the development of mesoscale anticyclones [55]. In particular, the Rim Current weakens during the spring–summer period [55,56]. The seasonal change of the Rim Current was shown by the Black Sea Forecasting System ocean model, which assimilated near real time, in-situ and satellite observational products [57]. The seasonal variation of the mesoscale eddies was discussed in [55,58], in particular, the maximum anticyclone eddies were shown to appear often during summer in the Black Sea.
Analysis of the velocity data at 100 m depth and the near-surface wind suggested that the development of inertial motions was prompted by an increase in the wind speed magnitude over the study area, regardless of its direction. Furthermore, at 100 m depth, the NIW packets occur with a time lag of 25–45 h with respect to the wind forcing. Significant correlations were usually obtained for the winter and autumn seasons when the winds were much stronger. In the spring–summer period, there were practically no stable correlations (except for a few events). This could be associated with the formation of a barrier layer involving a seasonal pycnocline above the main pycnocline [14,33]. Perhaps, more intense inertial motions could develop at shallower depths in the seasonal pycnocline in the summer, similar to those reported for the Gulf of Lion in the Mediterranean Sea [59]. However, the wind reanalysis sometimes did not accurately represent actual wind over the deep part of the basin.
In analytical solutions, Ref. [60] noticed that the amplitude of inertial motions increases during the passage of atmospheric storm and later slowly decreases. Sometimes the storm results in rapid decay of the inertial oscillations that existed before it. Recently, similar results were obtained using the general ocean circulation models [61]. The inertial motions were generated as a sea response to a sharp change in wind speed. Under the steady wind, the ocean current speed in the inertial motions gradually weakened [60,61]. However, studies only dealt with variability at the 30 m depth and argued that inertial motions decay with the depth and are unlikely to appear at greater depths [61]. Our observations demonstrated strong near-inertial oscillations at a depth of 100 m. There was also a correlation between the direction of the wind and the generation of the NIWs. Based on the data analysis, Ref. [62] argued that high-frequency fluctuations in the wind speed enhance inertial oscillations of the currents in the upper ocean layer. According to our data, such intensification occurred in September when the sea current velocity rotated in accord with changes in the direction of sea surface wind. This feature of wind forcing most likely leads to resonant excitation of inertial oscillations of ocean currents, e.g., the generation of inertial motions, as discussed in [63]. In particular, the highest resonant response to the effect of wind occurs when the wind rotates along with inertial oscillations. In this case, the frequency of the wind action must be close to the local effective Coriolis frequency to generate the near-inertial motions.
Unfortunately, there is not enough data to quantitatively relate the moments of generation of inertial internal waves packets at a depth of 100 m (and even more so at 265 m) with the variability of the near-surface wind. It can be suggested that the observed waves generated owing to the wind intensification propagate throughout the entire water column. These are most likely vertical standing waves, similar to those found previously in the Black Sea [13]. The inertial motion generation could be a result of a combination of forcing factors, such as the wind strength, the mean current speed, and the ocean eddy activity at the observation site. As noted by [64], the variety of mechanisms of generation and levels of excitation of IWs make any attempts to interpret the properties of the spectrum of oceanic IWs within the assumption of a single mechanism meaningless. In addition, it is not easy to substantiate the possible generation of the observed internal waves with available data on the deep-water depth only. It is necessary to have data on the sea current speed and temperature throughout the water column, which requires particular experimental study.
5. Conclusions
The observations from 2016–2017 analyzed above were unique, since they were based on more than 10-month-long measurements with a high sampling rate in the CIL layer of the main pycnocline and at a depth of 1700 m, i.e., 100 m above the sea bottom. This study made it possible to supplement the existing knowledge about NIWs in the Black Sea and reveal their seasonal variability in its deep-water part.
The analysis showed that NIWs dominate over the internal-wave continuum of in the Black Sea. The horizontal scales of the inertial rotation can be as large as 0.5–1.5 km and 0.5–0.7 km at 100 m and 1700 m depths, respectively. During the autumn–winter period, pronounced rotation of the current velocity vectors was observed. The hodographs appeared as ellipses with closed orbits. In the spring, inertial motions became infrequent and weak so that the hodographs of inertial currents strongly elongated in a slow current direction of subinertial time scales. An analysis of wind activity and the intensification of inertial motions suggested that each period of generation of internal waves was preceded by a change in wind speed and direction.
The maximum NIW energy occurred in the winter and the minimum in the summer. The blue-shift of the NIW’s frequency was in the range 1.002f–1.038f. The shift tended to be more significant in the summer season. The NIWs occurred more frequently in the months of transient weather in March and September, also in December and January, when the wind forcing was the strongest. During the winter, intermittency of the NIWs was 67–87%, and long packets consisting of up to 11–16 near-inertial oscillations were observed at a depth of 100 m. In the winter, the NIW’s packets had the longest modulation time scale, so the current speed grew during initial 3–6 fluctuations, i.e., by the mid of a wave packet. The duration of the longest NIW’s packet was close to the time scale of ~10 days, which is expected to be consistent with the frontal-geostrophic adjustment [65]. By contrast, short packets of 1.3–9 oscillations were typical for the summer. The relatively short time scales may indicate that the ocean fronts are rare at the intermediate depths in the central part of the Black Sea in the summer.
The preliminary results we presented look promising and raise new questions. For future investigations to identify the space-time propagation of the NIWs, it is necessary to obtain data from several points and for the entire water column. This could be a challenge for the problems of internal wave propagation and generation, which remain open for the Black Sea. Further progress requires continuing such investigations using the slab model [4,66] to directly calculate the near-inertial energy flux input into the sea by the wind.
Author Contributions
Conceptualization, A.O., E.K. and L.P.; methodology, A.O., A.K., E.K. and L.P.; data analysis, E.K., A.O. and L.P.; investigation, A.K., A.O. and E.K.; writing—original draft preparation, E.K. and A.O.; writing—review and editing, E.K., A.O., A.K. and L.P. All authors have read and agreed to the published version of the manuscript.
Funding
The research was conducted by the assignment of the Ministry of Science and Higher Education of Russian Federation (No. FMWE-2021-0016). Data processing and analysis were partly supported by Russian Foundation for Basic Research grant No. 19-05-00459 as well as with the support of the science grant of the President of the Russian Federation MK-5064.2021.1.5.
Institutional Review Board Statement
Not applicable.
Informed Consent Statement
Not applicable.
Data Availability Statement
Experimental data are archived at the Ocean Acoustics Laboratory (Shirshov Institute of Oceanology, Russian Academy of Sciences) and are available upon request.
Conflicts of Interest
The authors declare no conflict of interest.
Appendix A

Figure A1.
Top—wind speed vector plot from the ERA-5 meteorological reanalysis data. The second plot from the top is the current velocity at 100 m at ABS No. 1 in January 2017, and the third plot from the top shows the - and -components of the current velocity.

Figure A2.
Top—wind speed vector plot from the ERA-5 meteorological reanalysis data. The second plot from the top is the current velocity at 100 m at ABS No. 1 in March 2017, and the third plot from the top shows the - and -components of the current velocity.
Appendix B
Near-Inertial Fluctuations of the Deep Sea Temperature in the Northeastern Part of the Black Sea Basin
The RBR Duet instrument for observations of temperature and pressure was deployed at 265 m, i.e., much deeper than the main pycnocline in the northeastern Black Sea basin, from 18 December 2017 to 4 December 2018. At this depth, temperature and pressure fluctuations with a time scale close to the inertial period were also identified. Figure A3 shows an excerpt of the record for January 2018. The most intense fluctuations were observed on 12–18 January. Over the near-inertial period, the temperature changed by only 0.02 °C, and the pressure sensor readings changed up to 1 dbar due to the wave passage. In such a way, oscillations with a near-inertial period were observed every month. The fluctuations were within 0.01–0.015 °C, and the pressure amplitude did not exceed 1.5 dbar. Notice that inertial oscillations were clear-cut mostly in autumn and winter and almost decayed in summer.
The estimates of the power spectra of the time series for each month show the peak at a near-inertial frequency of 0.059–0.06 cph (16.95–16.67 h) (Figure A4). At this mooring site, the local inertial frequency f was 0.057 cph (17.54 h). Alike the sea current oscillations in the central part of the Black Sea (see the main body of this paper above), the analysis of the temperature variability also revealed the seasonal intensification of near-inertial fluctuations in December–January and, surprisingly, in June. The ratio of the maximum and minimum spectral energy of near-inertial oscillations was ~9.5. In the spring and autumn seasons, the power of near-inertial fluctuations was approximately the same.
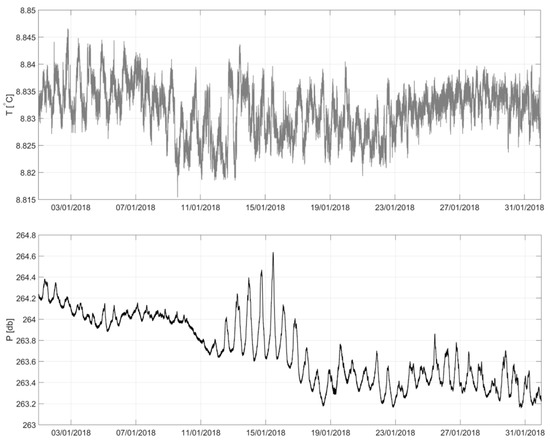
Figure A3.
Temporal variability of sea temperature and pressure at 265 m in January, 2018, from the observations of ABS No. 2.
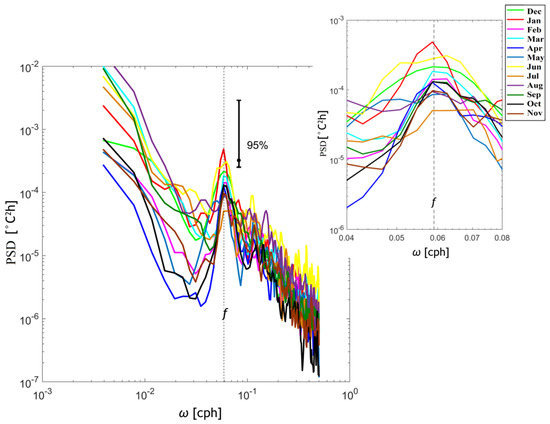
Figure A4.
Power spectra of temperature fluctuations at 265 m depth at ABS No. 2 for different months. The dashed line indicates the local inertial frequency at the mooring site. The small image in the upper right corner is an enlargement of the figure to better visualize the peaks close to the inertial periods.
References
- Alford, M.H.; Mackinnon, J.A.; Simmons, H.L.; Nash, J.D. Near-Inertial Internal Gravity Waves in the Ocean. Ann. Rev. Mar. Sci. 2016, 8, 95–123. [Google Scholar] [CrossRef] [PubMed]
- MacKinnon, J.A.; Zhao, Z.; Whalen, C.B.; Waterhouse, A.F.; Trossman, D.S.; Sun, O.M.; St Laurent, L.C.; Simmons, H.L.; Polzin, K.; Pinkel, R.; et al. Climate process team on internal wave-driven ocean mixing. Bull. Am. Meteorol. Soc. 2017, 98, 2429–2454. [Google Scholar] [CrossRef]
- Watanabe, M.; Hibiya, T. Global estimates of the wind-induced energy flux to inertial motions in the surface mixed layer. Geophys. Res. Lett. 2002, 29, 2–5. [Google Scholar] [CrossRef]
- D’Asaro, E. The Energy Flux from the Wind to Near-Inertial Motions in the Surface Mixed Layer. J. Phys. Oceanogr. 1985, 15, 1043–1059. [Google Scholar] [CrossRef]
- Skyllingstad, E.D.; Smyth, W.D.; Crawford, G.B. Resonant Wind-Driven Mixing in the Ocean Boundary Layer. J. Phys. Oceanogr. 2000, 30, 1866–1890. [Google Scholar] [CrossRef]
- Reznik, G.M. Wave boundary layers in rotating stratified fluid and near-inertial oscillations. Ocean Dyn. 2018, 68, 987–1000. [Google Scholar] [CrossRef]
- Alford, M.H.; Whitmont, M. Seasonal and spatial variability of near-inertial kinetic energy from historical moored velocity records. J. Phys. Oceanogr. 2007, 37, 2022–2037. [Google Scholar] [CrossRef]
- Klyuvitkin, A.; Ostrovskii, A.; Lisitzin, A.; Konovalov, S. The Energy Spectrum of the Current Velocity in the Deep Part of the Black Sea. Dokl. Earth Sci. 2019, 488, 1222–1226. [Google Scholar] [CrossRef]
- Lozovatsky, I.D.; Dillon, T.M.; Erofeev, A.Y.; Nabatov, V.N. Variations of thermohaline structure and turbulent mixing on the Black Sea shelf at the beginning of autumn cooling. J. Mar. Syst. 1999, 21, 255–282. [Google Scholar] [CrossRef]
- Lozovatsky, I.D.; Fernando, H.J.S. Mixing on a shallow shelf of the Black Sea. J. Phys. Oceanogr. 2002, 32, 945–956. [Google Scholar] [CrossRef]
- Medvedev, I.P. Tides in the Black Sea: Observations and numerical modelling. Pure Appl. Geophys. 2018, 175, 1951–1969. [Google Scholar] [CrossRef]
- Yampolsky, A.D. Internal waves in the Black Sea as observed at a multi-day anchor station. Proc. IOAS USSR 1960, 39, 111–126. [Google Scholar]
- Blatov, A.S.; Ivanov, V.A.; Titov, V.B. Vertical structure of mesoscale motions in the Black Sea. In Complex Hydrophysical and Hydrochemical Studies of the Black Sea; Marine Hydrophysical Institute, AN USSR: Sevastopol, Russia, 1980; pp. 14–21. [Google Scholar]
- Blatov, A.S.; Bulgakov, N.P.; Ivanov, V.A.; Kosarev, A.N.; Tujilkin, V.S. Variability of Hydrophysical Fields in the Black Sea; Hydrometeoizdat: Leningrad, Russia, 1984. [Google Scholar]
- Khimchenko, E.E.; Serebryany, A.N. Internal waves on the Caucasian and Crimean shelves of the Black Sea (according to summer-autumn observations 2011–2016). J. Oceanol. Res. 2018, 46, 69–87. [Google Scholar] [CrossRef]
- Morozov, A.N.; Mankovskaya, E.V.; Fedorov, S. Inertial Oscillations in the Northern Part of the Black Sea Based on the Field Observations. Fundam. I Prikl. Gidrofiz. 2021, 14, 43–53. [Google Scholar] [CrossRef]
- Serebryany, A.N.; Khymchenko, E.E. Observations of Internal Waves at Caucasian and Crimean Shelves of the Black Sea in Summer 2013. Sovrem. Probl. Distantsionnogo Zondirovaniya Zemli Iz Kosm. 2014, 11, 88–104. [Google Scholar]
- Stanev, E.V. On the mechanisms of the Black Sea circulation. Earth Sci. Rev. 1990, 28, 285–319. [Google Scholar] [CrossRef]
- Oguz, T.; Malanotte-Rizzoli, P.; Aubrey, D. Wind and thermohaline circulation of the Black Sea driven by yearly mean climatological forcing. J. Geophys. Res. Ocean. 1995, 100, 6845–6863. [Google Scholar] [CrossRef]
- Staneva, J.V.; Stanev, E.V. Cold Intermediate Water Formation in the Black Sea. Analysis on Numerical Model Simulations. In Sensitivity to Change: Black Sea, Baltic Sea and North Sea; Özsoy, E., Mikaelyan, A., Eds.; NATO ASI Series; Kluwer Academic Publishers: Dordrecht, The Netherlands, 1997; pp. 375–393. [Google Scholar]
- Korotaev, G.; Oguz, T.; Nikiforov, A.; Koblinsky, C. Seasonal, interannual, and mesoscale variability of the Black Sea upper layer circulation derived from altimeter data. J. Geophys. Res. Ocean. 2003, 108, 3122. [Google Scholar] [CrossRef]
- Bondur, V.G.; Sabinin, K.D.; Grebenuk, U.V. Characteristics of Inertial Oscillations Based on the Data of Experimental Measurements of Currents on the Russian Shelf of the Black Sea. Izv. Russ. Acad. Sci. Phys. Atmos. Ocean 2017, 53, 135–142. [Google Scholar] [CrossRef]
- Serebryany, A.N.; Khimchenko, E.E. Internal Waves of Mode 2 in the Black Sea. Dokl. Earth Sci. 2019, 488, 1227–1230. [Google Scholar] [CrossRef]
- Bondur, V.G.; Sabinin, K.D.; Grebenuk, U.V. Anomalous Variability of Inertial Oscillations of Ocean Waters on the Hawaiian Shelf. Dokl. Earth Sci. 2013, 450, 100–104. [Google Scholar] [CrossRef]
- Lavrova, O.Y.; Mityagina, M.I.; Serebryany, A.N.; Sabinin, K.D.; Kalashnikova, N.A.; Krayushkin, E.V.; Khymchenko, I. Internal waves in the Black Sea: Satellite observations and in-situ measurements. Proc. SPIE-Int. Soc. Opt. Eng. 2014, 9240, 924016. [Google Scholar]
- Lavrova, O.; Mityagina, M. Satellite survey of internal waves in the Black and Caspian Seas. Remote Sens. 2017, 9, 892. [Google Scholar] [CrossRef]
- Garrett, C.; Munk, W. Space-time scales of internal waves: A progress report. J. Geophys. Res. 1975, 80, 291–297. [Google Scholar] [CrossRef]
- Konyaev, K.V.; Sabinin, K.D. Waves Inside the Ocean; Hydrometeoizdat: Leningrad, Russia, 1992. [Google Scholar]
- Garrett, C. What is the “Near-inertial” band and why is it different from the rest of the internal wave spectrum? J. Phys. Oceanogr. 2001, 31, 962–971. [Google Scholar] [CrossRef]
- Richman, J.G.; Wunsch, C.; Hogg, G. Space and time scales of mesoscale motion in the western North Atlantic. Rev. Geophys. 1977, 15, 385–420. [Google Scholar] [CrossRef]
- Novotryasov, V.V. On the blue shift of the inertial oscillation frequency in the ocean. Oceanology 1998, 38, 59–62. [Google Scholar]
- Le Boyer, A.; Alford, M.H.; Pinkel, R.; Hennon, T.D.; Yang, Y.J.; Ko, D.; Nash, J. Frequency shift of near-inertial waves in the South China sea. J. Phys. Oceanogr. 2020, 50, 1121–1135. [Google Scholar] [CrossRef]
- Ivanov, V.A.; Belokopytov, V.N. Oceanography of the Black Sea; Marine Hydrophysical Institute, NAS of Ukraine: Sevastopol, Ukraine, 2011. [Google Scholar]
- Piotukh, V.B.; Zatsepin, A.G.; Kazmin, A.S.; Yakubenko, V.G. Impact of the Winter Cooling on the Variability of the Thermohaline Characteristics of the Active Layer in the Black Sea. Oceanology 2011, 51, 221–230. [Google Scholar] [CrossRef]
- Gonella, J. A rotary-component method for analysing meteorological and oceanographic vector time series. Deep. Res. Oceaogr. Abstr. 1972, 19, 833–846. [Google Scholar] [CrossRef]
- Mooers, C.N.K. A technique for the cross spectrum analysis of pairs of complex-valued time series, with emphasis on properties of polarized components and rotational invariants. Deep. Res. Oceanogr. Abstr. 1973, 20, 1129–1141. [Google Scholar] [CrossRef]
- Rabinovich, A.B.; Thomson, R.E. Evidence of diurnal shelf waves in satellite-tracked drifter trajectories off the Kuril Islands. J. Phys. Oceanogr. 2001, 31, 2650–2668. [Google Scholar] [CrossRef]
- Mihaly, S.F.; Thomson, R.E.; Rabinovich, A.B. Evidence for nonlinear interaction between internal waves of inertial and semidiurnal frequency. Geophys. Res. Lett. 1998, 25, 1205–1208. [Google Scholar] [CrossRef]
- Lilly, J.M. jLab: A data Analysis Package for Matlab; Version 1.7.1. 2021. Available online: https://www.jmlilly.net/software (accessed on 11 February 2022).
- Argo. Argo Float Data and Metadata from Global Data Assembly Centre (Argo GDAC). SEANOE. 2000. Available online: http://www.coriolis.eu.org/Observing-the-Ocean/ARGO (accessed on 11 February 2022).
- Korotaev, G.; Oguz, T.; Riser, S. Intermediate and deep currents of the Black Sea obtained from autonomous profiling floats. Deep. Res. Part II Top. Stud. Oceanogr. 2006, 53, 1901–1910. [Google Scholar] [CrossRef]
- Stanev, E.V.; He, Y.; Staneva, J.; Yakushev, E. Mixing in the black sea detected from the temporal and spatial variability of oxygen and sulfide–Argo float observations and numerical modelling. Biogeosciences 2014, 11, 5707–5732. [Google Scholar] [CrossRef]
- Stanev, E.V.; He, Y.; Grayek, S.; Boetius, A. Oxygen dynamics in the Black Sea as seen by Argo profiling floats. Geophys. Res. Lett. 2013, 40, 3085–3090. [Google Scholar] [CrossRef]
- Stanev, E.V.; Peneva, E.; Chtirkova, B. Climate Change and Regional Ocean Water Mass Disappearance: Case of the Black Sea. J. Geophys. Res. Ocean. 2019, 124, 4803–4819. [Google Scholar] [CrossRef]
- Stanev, E.V.; Chtirkova, B.; Peneva, E. Geothermal Convection and Double Diffusion Based on Profiling Floats in the Black Sea. Geophys. Res. Lett. 2021, 48, e2020GL091788. [Google Scholar] [CrossRef]
- Palazov, A.; Ciliberti, S.; Peneva, E.; Gregoire, M.; Staneva, J.; Lemieux-Dudon, B.; Masina, S.; Pinardi, N.; Vandenbulcke, L.; Behrens, A.; et al. Black sea observing system. Front. Mar. Sci. 2019, 6, 315. [Google Scholar] [CrossRef]
- Kundu, P.K. Ekman veering observed near the Ocean Bottom. J. Phys. Oceanogr. 1976, 6, 238–242. [Google Scholar] [CrossRef]
- Zhurbas, V.M.; Zatsepin, A.G.; Grigor’eva, Y.V.; Eremeev, V.N.; Kremenetskii, V.V.; Motuzhev, S.V.; Poyarkov, S.G.; Pulein, P.-M.; Stanichny, S.V.; Soloviev, D.M. Water circulation and characteristics of different scale currents in the Black Sea upper layer based on drifter data. Oceanology 2004, 44, 34–48. [Google Scholar]
- Yang, B.; Hu, P.; Hou, Y. Variation and Episodes of Near-Inertial Internal Waves on the Continental Slope of the Southeastern East China Sea. J. Mar. Sci. Eng. 2021, 9, 916. [Google Scholar] [CrossRef]
- Yang, B.; Hou, Y.; Hu, P.; Liu, Z.; Liu, Y. Shallow ocean response to tropical cyclones observed on the continental shelf of the northwestern South China Sea. J. Geophys. Res. Ocean. 2015, 120, 3817–3836. [Google Scholar] [CrossRef]
- Shokurov, M.V.; Shokurova, I.G. Wind stress curl over the Black Sea under different wind regimes. Phys. Oceanogr. 2017, 6, 12–23. [Google Scholar] [CrossRef][Green Version]
- Morozov, E.G. Horizontal variability of inertial oscillations in the eastern part of the Pacific Ocean. Okeanol. Issled. 1990, 43, 83–84. [Google Scholar]
- Kunze, E. Near-inertial wave propagation in geostrophic shear. J. Phys. Oceanogr. 1985, 15, 544–565. [Google Scholar] [CrossRef]
- Jaimes, B.; Shay, L. Near-Inertial Wave Wake of Hurricanes Katrina and Rita over Mesoscale Oceanic Eddies. J. Phys. Oceanogr. 2010, 40, 1320–1337. [Google Scholar] [CrossRef]
- Kubryakov, A.A.; Stanichny, S.V. Seasonal and interannual variability of the Black Sea eddies and its dependence on characteristics of the large-scale circulation. Deep. Res. Part I Oceanogr. Res. Pap. 2015, 97, 80–91. [Google Scholar] [CrossRef]
- Zatsepin, A.G.; Kremenetskii, V.V.; Stanichnyi, S.V.; Burdyugov, V.M. Basin circulation and mesoscale dynamics of the Black Sea affected by wind. In Current State of ocean And Atmosphere Dynamics; Frolov, A.V., Resnyansky, Y.D., Eds.; Triada: Moscow, Russia, 2010; pp. 347–368. [Google Scholar]
- Ciliberti, S.A.; Jansen, E.; Coppini, G.; Peneva, E.; Azevedo, D.; Causio, S.; Stefanizzi, L.; Creti’, S.; Lecci, R.; Lima, L.; et al. The Black Sea Physics Analysis and Forecasting System within the Framework of the Copernicus Marine Service. J. Mar. Sci. Eng. 2022, 10, 48. [Google Scholar] [CrossRef]
- Kubryakov, A.A.; Stanichny, S.V.; Zatsepin, A.G.; Kremenetskiy, V.V. Long-term variations of the Black Sea dynamics and their impact on the marine ecosystem. J. Mar. Syst. 2016, 163, 80–94. [Google Scholar] [CrossRef]
- Shrira, V.; Forget, P. On the Nature of Near-Inertial Oscillations in the Uppermost Part of the Ocean and a Possible Route toward HF Radar Probing of Stratification. J. Phys. Oceanogr. 2015, 45, 2660–2678. [Google Scholar] [CrossRef]
- Gill, A.E. Atmosphere-Ocean Dynamics; Academic Press: Orlando, FL, USA, 1982; p. 662. [Google Scholar]
- Diansky, N.A.; Fomin, V.V.; Grigoriev, A.V.; Chaplygin, A.V.; Zatsepin, A.G. Spatial-Temporal Variability of Inertial Currents in the Eastern Part of the Black Sea in a Storm Period. Phys. Oceanography. 2019, 35, 147–159. [Google Scholar] [CrossRef]
- Pollard, R.T. On the Generation by Winds of Inertial Waves in the Ocean. Deep. Sea Res. 1970, 17, 795–812. [Google Scholar] [CrossRef]
- Mihanović, H.; Pattiaratchi, C.; Verspecht, F. Diurnal sea breezes force near-inertial waves along rottnest continental shelf, Southwestern Australia. J. Phys. Oceanogr. 2016, 46, 3487–3508. [Google Scholar] [CrossRef]
- Phillips, O.M. The Dynamics of the Upper Ocean; Cambridge University Press: New York, NY, USA, 1977. [Google Scholar]
- Maksimova, E.V. A conceptual view on inertial internal waves in relation to the subinertial flow on the central west Florida shelf. Sci. Rep. 2018, 8, 1–8. [Google Scholar] [CrossRef]
- Pollard, R.T.; Millard, R.C. Comparison between observed and simulated wind-generated inertial oscillations. Deep. Res. 1970, 17, 813–821. [Google Scholar] [CrossRef]
Publisher’s Note: MDPI stays neutral with regard to jurisdictional claims in published maps and institutional affiliations. |
© 2022 by the authors. Licensee MDPI, Basel, Switzerland. This article is an open access article distributed under the terms and conditions of the Creative Commons Attribution (CC BY) license (https://creativecommons.org/licenses/by/4.0/).