Article

Characterizing Gas Hydrate-Bearing Marine Sediments Using Elastic Properties—Part 2: Seismic Inversion Based on a Pore-Filling–Solid Matrix Decoupling Scheme

1
College of Geoexploration Science and Technology, Jilin University, Changchun 130021, China
2
BGP Inc., CNPC, Zhuozhou 072750, China
*
Author to whom correspondence should be addressed.
J. Mar. Sci. Eng. 2022, 10(10), 1497; https://doi.org/10.3390/jmse10101497
Submission received: 28 August 2022 / Revised: 11 October 2022 / Accepted: 13 October 2022 / Published: 14 October 2022
(This article belongs to the Special Issue Properties of Gas Hydrate-Bearing Sediments)

Abstract

:
Characterizing gas hydrate-bearing marine sediments using seismic methods is essential for locating potential hydrate resources. However, most existing pre-stack seismic inversion methods estimate the properties of sediments containing gas hydrates without considering specific characteristics associated with gas hydrate occurrences. In the present study, a pore-filling–solid matrix decoupling amplitude variation with offset (AVO) formula is proposed to represent seismic reflectivity in terms of properties associated with gas hydrates. Based on the rock physics relationships of solid substitution, the parameters introduced into the decoupling AVO equation estimate the concentration of gas hydrates with different occurrences, including pore fillings mixed with water and solid components forming part of the dry sediment frame. A theoretical model test indicates that seismic attributes obtained with the decoupling AVO inversion are superior to the conventional wave velocities-related properties in predicting gas hydrate saturations. A realistic model test further validates the applicability of the proposed method in characterizing a gas hydrate system with varying concentrations and layer thickness. By adjusting the tuning parameters, the configurations and concentrations of the gas hydrate system can be identified using the obtained attributes. Therefore, the presented method provides a useful tool for the characterization of gas hydrate-bearing sediments.

1. Introduction

In the accompanying paper (Part 1) [1], we have addressed the rock physics model that quantifies the relationships between gas hydrate occurrence and concentration and the elastic properties of gas hydrate-bearing marine sediments. Using log data, we utilized the proposed model to predict wave velocities and quantitatively estimate the amount of gas hydrate in marine sediments. The model-based method yields results that fit core measurement data well. Nevertheless, identifying gas hydrate deposits with an adequate concentration using seismic methods is essential for locating potential gas hydrate resources over a large area.
Bottom-simulating reflectors (BSRs) represent seismic events generated at the bottom of a gas hydrate formation overlying a partially saturated gas zone [2]. The BSR identified on post-stack seismic profiles is usually used to discriminate the presence of the gas hydrate stability zones [3]. Carcione and Tinivella [4] investigated the amplitude variation with offset (AVO) effects of the BSR by incorporating rock physics modeling for gas hydrate formation. The reflection coefficients of the BSR versus offset were computed and analyzed for varied gas hydrate concentrations. Ecker et al. [5] estimated porosity and hydrate saturation from seismic velocities. Based on stratigraphic interpretation and rock physics modeling, seismic AVO attributes and pre-stack elastic inversion methods have been widely used for the characterization of hydrate formations [6,7,8,9,10,11,12]. Meanwhile, the spectral decomposition method was incorporated to improve the identification of the gas hydrate and free gas formations [13]. Seismic attenuation of BSR associated with free gas saturated in the underlying layer has also been used to characterize gas hydrate deposits [14,15]. In addition, Ehsan et al. [16] found that gas hydrate-bearing sediments can simultaneously exhibit high P-wave velocity and anomalously low S-wave velocity, suggesting that Poisson’s ratio can be used as an indicator for gas hydrate identification.
Despite these successful applications of seismic methods for the characterization of gas hydrate-bearing formations, more sophisticated seismic methods that consider specific occurrences of gas hydrates are required to improve the estimation of hydrate concentration. As suggested in Part 1, occurrence statuses associated with the dynamic process of gas hydrate accumulation account for particular elastic behaviors of the sediments containing hydrates. However, most existing methods are based on the traditional AVO equations that estimate the properties of the entire rock, which may be inadequate for the estimation of the gas hydrate-related properties. Meanwhile, the AVO equations represented by fluid terms may be workable for oil and gas-bearing reservoirs [17,18,19,20,21,22] but may be inapplicable for gas hydrate systems. It is because gas hydrates cannot be considered pore fluids. The gas hydrates may exist as pore fillings mixed with water at a relatively low concentration while forming part of the solid phase of the dry sediment frame during the accumulation process with an increasing concentration, as discussed in Part 1.
Therefore, in the present study, we propose a new seismic method for the improved estimation of gas hydrate concentrations. Based on the rock physics relationships of the solid substitution, we propose a pore-filling–solid matrix decoupling AVO formula by extending the conventional reflection coefficients expressed in terms of the fluid term. The decoupling AVO equation is used to represent seismic reflectivity associated with the properties of gas hydrates. Then, the responses of the introduced parameters to gas hydrate saturation are analyzed using the rock physics model proposed in Part 1. Next, seismic attributes obtained based on the decoupling equation are tested for improved characterization of gas hydrate sediments. The accuracy of the decoupling AVO equation and the applicability of the proposed seismic attributes for gas hydrate identification are discussed using a theoretical model. Finally, the sensitivity of the obtained attributes for gas hydrate characterization is investigated using a realistic model of the gas hydrate system.

2. Methods

2.1. Pore-Filling–Solid Matrix Decoupling AVO Equation

As discussed in Part 1 [1], during the accumulation process, gas hydrates exist as pore fillings at low concentrations while forming part of the solid phase of marine sediments with increasing concentrations, as illustrated in Figure 1. Meanwhile, the rock physics model presented in Part 1 suggests that the gas hydrate/water mixture filled in pores of marine sediments can exhibit non-zero rigidity. Therefore, the generalized solid substitution theory [23] was used to model the elastic bulk and shear moduli of gas hydrate-bearing sediment (Ksat and μsat) from those of a dry frame (Kdry and μdry) and gas hydrate/water mixture (Kmix and μmix) as follows:
K s a t = K d r y + K m i x ( K d r y K 0 ) 2 K 0 2 φ K d r y K m i x + K 0 K m i x K 0 K m i x φ = K d r y + M k
μ s a t = μ d r y + μ m i x ( μ d r y μ 0 ) 2 μ 0 2 φ μ d r y μ m i x + μ 0 μ m i x μ 0 μ m i x φ = μ d r y + M μ
where K0 and μ0 denote the bulk and shear moduli of the solid matrix, respectively. As illustrated in Figure 1, the solid phase composes minerals below critical gas hydrate saturation Sc and consists of minerals and gas hydrates simultaneously beyond Sc. φ represents the pore space occupied by the gas hydrate/water mixture. Russell et al. [19] proposed the use of the fluid term to describe the difference between the bulk moduli of the saturated rock and the dry frame. Accordingly, we introduced two parameters, Mk and Mμ, to quantify the contribution of gas hydrate/water mixture to the bulk and shear moduli of sediment, respectively.
Then, elastic P-wave (VP) and S-wave (VS) velocities of the sediment containing gas hydrates can be expressed as follows, referring to Russell et al. [19]:
V P = ( K d r y + 4 3 μ s a t + M k ) / ρ
V S = ( μ d r y + M μ ) / ρ
where ρ is the bulk density of sediment.
According to Equations (1)–(4), the two parameters for gas hydrate characterization can be represented as follows:
M k = K s a t K d r y = ρ V P 2 4 3 ρ V S 2 ( γ d r y 2 4 3 ) μ d r y
M μ = μ s a t μ d r y = ρ V S 2 μ d r y
where γdry represents the P- and S-wave velocity ratio of the dry frame.
Aki and Richards [24] derived the PP-wave reflection coefficient under the assumption of small changes in the elastic properties across an interface between two elastic media:
R P P ( θ ) = ( 1 + tan 2 θ ) Δ V P 2 V P + ( 8 sin 2 θ γ s a t 2 ) Δ V S 2 V S + ( 1 4 sin 2 θ γ s a t 2 ) Δ ρ 2 ρ
where VP, VS, and ρ are the averaged velocities and bulk density across the boundary, respectively; ∆VP, ∆VS, and ∆ρ denote the differences in velocities and bulk density across the interface; γsat represents the P- and S-wave velocity ratio for saturated rock; and θ is the average of the incidence and transmission angles.
Applying the chain rule of the multivariable calculus to Equations (5) and (6) and treating γdry as a constant can obtain:
Δ M k = M k V P Δ V P + M k V S Δ V S + M k ρ Δ ρ + M k μ d r y Δ μ d r y
Δ M μ = M μ V S Δ V S + M μ ρ Δ ρ + M μ μ d r y Δ μ d r y
Subsequently, we reparameterized Equation (7) to a new linearized equation using Equations (8) and (9), as follows:
R P P ( θ ) = [ 1 4 ( 1 γ d r y 2 γ s a t 2 ) sec 2 θ 1 + 4 N / 3 γ d r y 2 N ] Δ M k M k + [ ( N 3 γ d r y 2 N 4 ) ( 1 γ d r y 2 γ s a t 2 ) sec 2 θ 1 + 4 N / 3 γ d r y 2 N ] Δ M μ M μ + ( γ d r y 2 4 γ s a t 2 sec 2 θ 2 γ s a t 2 sin 2 θ ) Δ μ μ + [ 1 2 1 4 sec 2 θ ] Δ ρ ρ
where N = M μ / M k = ( μ s a t μ d r y ) / ( K s a t K d r y ) indicates the contribution ratio of the gas hydrate/water mixture to the shear to bulk modulus of sediment; ΔMk/Mk and ΔMμ/Mμ denote the reflectivity terms associated with the contribution of the gas hydrate/water mixture to the bulk and shear moduli of sediment; Δμ/μ and Δρ/ρ denote the terms associated with shear modulus and bulk density of sediment, respectively.
Details on the derivations of Equation (10) are illustrated in Appendix A.

2.2. AVO Inversion Based on the Pore-Filling–Solid Matrix Decoupling Scheme

Denoting weighting coefficients in Equation (10) as:
A ( θ ) = 1 4 ( 1 γ d r y 2 γ s a t 2 ) sec 2 θ 1 + 4 N / 3 γ d r y 2 N B ( θ ) = ( N 3 γ d r y 2 N 4 ) ( 1 γ d r y 2 γ s a t 2 ) sec 2 θ 1 + 4 N / 3 γ d r y 2 N C ( θ ) = γ d r y 2 4 γ s a t 2 sec 2 θ 2 γ s a t 2 sin 2 θ D ( θ ) = 1 2 1 4 sec 2 θ
we simplified Equation (10) as follows:
R P P ( θ ) = A ( θ ) Δ M k M k + B ( θ ) Δ M μ M μ + C ( θ ) Δ μ μ + D ( θ ) Δ ρ ρ
For a pre-stack seismic gather with n incident angles, Equation (12) can be expressed in the matrix as follows:
[ R P P ( θ 1 ) R P P ( θ 2 )                                 R P P ( θ n ) ] = [ A ( θ 1 ) B ( θ 1 ) C ( θ 1 ) D ( θ 1 ) A ( θ 2 ) B ( θ 2 ) C ( θ 2 ) D ( θ 2 ) A ( θ n ) B ( θ n ) C ( θ n ) D ( θ n ) ] [ Δ M k / M k Δ M μ / M μ Δ μ / μ Δ ρ / ρ ]
Equation (13) can be simplified as:
R = C [ Δ M k / M k Δ M μ / M μ Δ μ / μ Δ ρ / ρ ]
where R denotes the reflection coefficient matrix, and C is the weighting coefficient matrix in Equation (13).
Finally, the terms in Equation (14) can be estimated using the least-squares method:
[ Δ M k / M k Δ M μ / M μ Δ μ / μ Δ ρ / ρ ] = ( C T C + ε 2 I ) 1 C T R
where ε represents the damping factor, and I is the identity matrix.

3. Results

3.1. Elastic Properties and Seismic Responses of Gas Hydrate-Bearing Sediments

Based on the rock physics model in Part 1, we computed the elastic properties of the gas hydrate-bearing layer in Figure 1. Volumetric fractions of minerals were set to 0.60, 0.35, and 0.05 for quartz, clay, and calcite, respectively. Critical gas hydrate saturation Sc was assumed to be 0.1. Other properties used for modeling were the same as those in Part 1.
Figure 2 illustrates the modeled elastic properties of VP, VS, and ρ, varying with porosity φ and gas hydrate saturation Sgh. As shown in Figure 2a,b, VP and VS exhibit subtle variation with Sgh for the case of φ lower than ~ 0.2 while rising considerably with Sgh for φ higher than ~ 0.2. Since shallow marine sediments are usually unconsolidated and have much higher porosity than 0.2, VP and VS are applicable to estimate hydrate concentration. In contrast, ρ of the hydrate deposit is not sensitive to the variation in Sgh at all porosity but drops significantly with increasing φ regardless of any Sgh (Figure 2c). It implies that density can provide porosity information of gas hydrate deposits, which is significant in estimating hydrate concentration from the saturation value.
Meanwhile, Figure 3a,b shows the values of Mk and Mμ computed using the relationships presented in Equations (5) and (6). The shear modulus μ of hydrate sediments (Figure 3c) and elastic moduli of the dry frame for computing Mk and Mμ were obtained with the rock physics model presented in Part 1. As illustrated in Figure 3a,b, the variations of Mk and Mμ with Sgh and φ are distinct from those of VP and VS Mk is sensitive to Sgh for φ lower than ~ 0.5, decreasing dramatically with increasing Sgh (Figure 3a). At the same time, Mμ increases with Sgh at all φ, especially for φ higher than ~ 0.3 (Figure 3b). It implies that Mk and Mμ can provide additional constraints for hydrate characterization besides VP, VS, and ρ.
According to the mathematical representations of Mk and Mμ in Equations (5) and (6), the results in Figure 3a,b show that for increasing Sgh, pore-filling gas hydrates show less contribution to the bulk modulus of sediments while exhibiting an enhanced influence on shear modulus of sediments. These results deserve further investigation based on petrophysical analyses and laboratory measurements on the accumulation process of gas hydrates formed in ocean bottom sediments. In addition, as can be expected, the shear modulus μ of sediments (Figure 3c) exhibits similar responses to Sgh and φ as VS (Figure 2b).
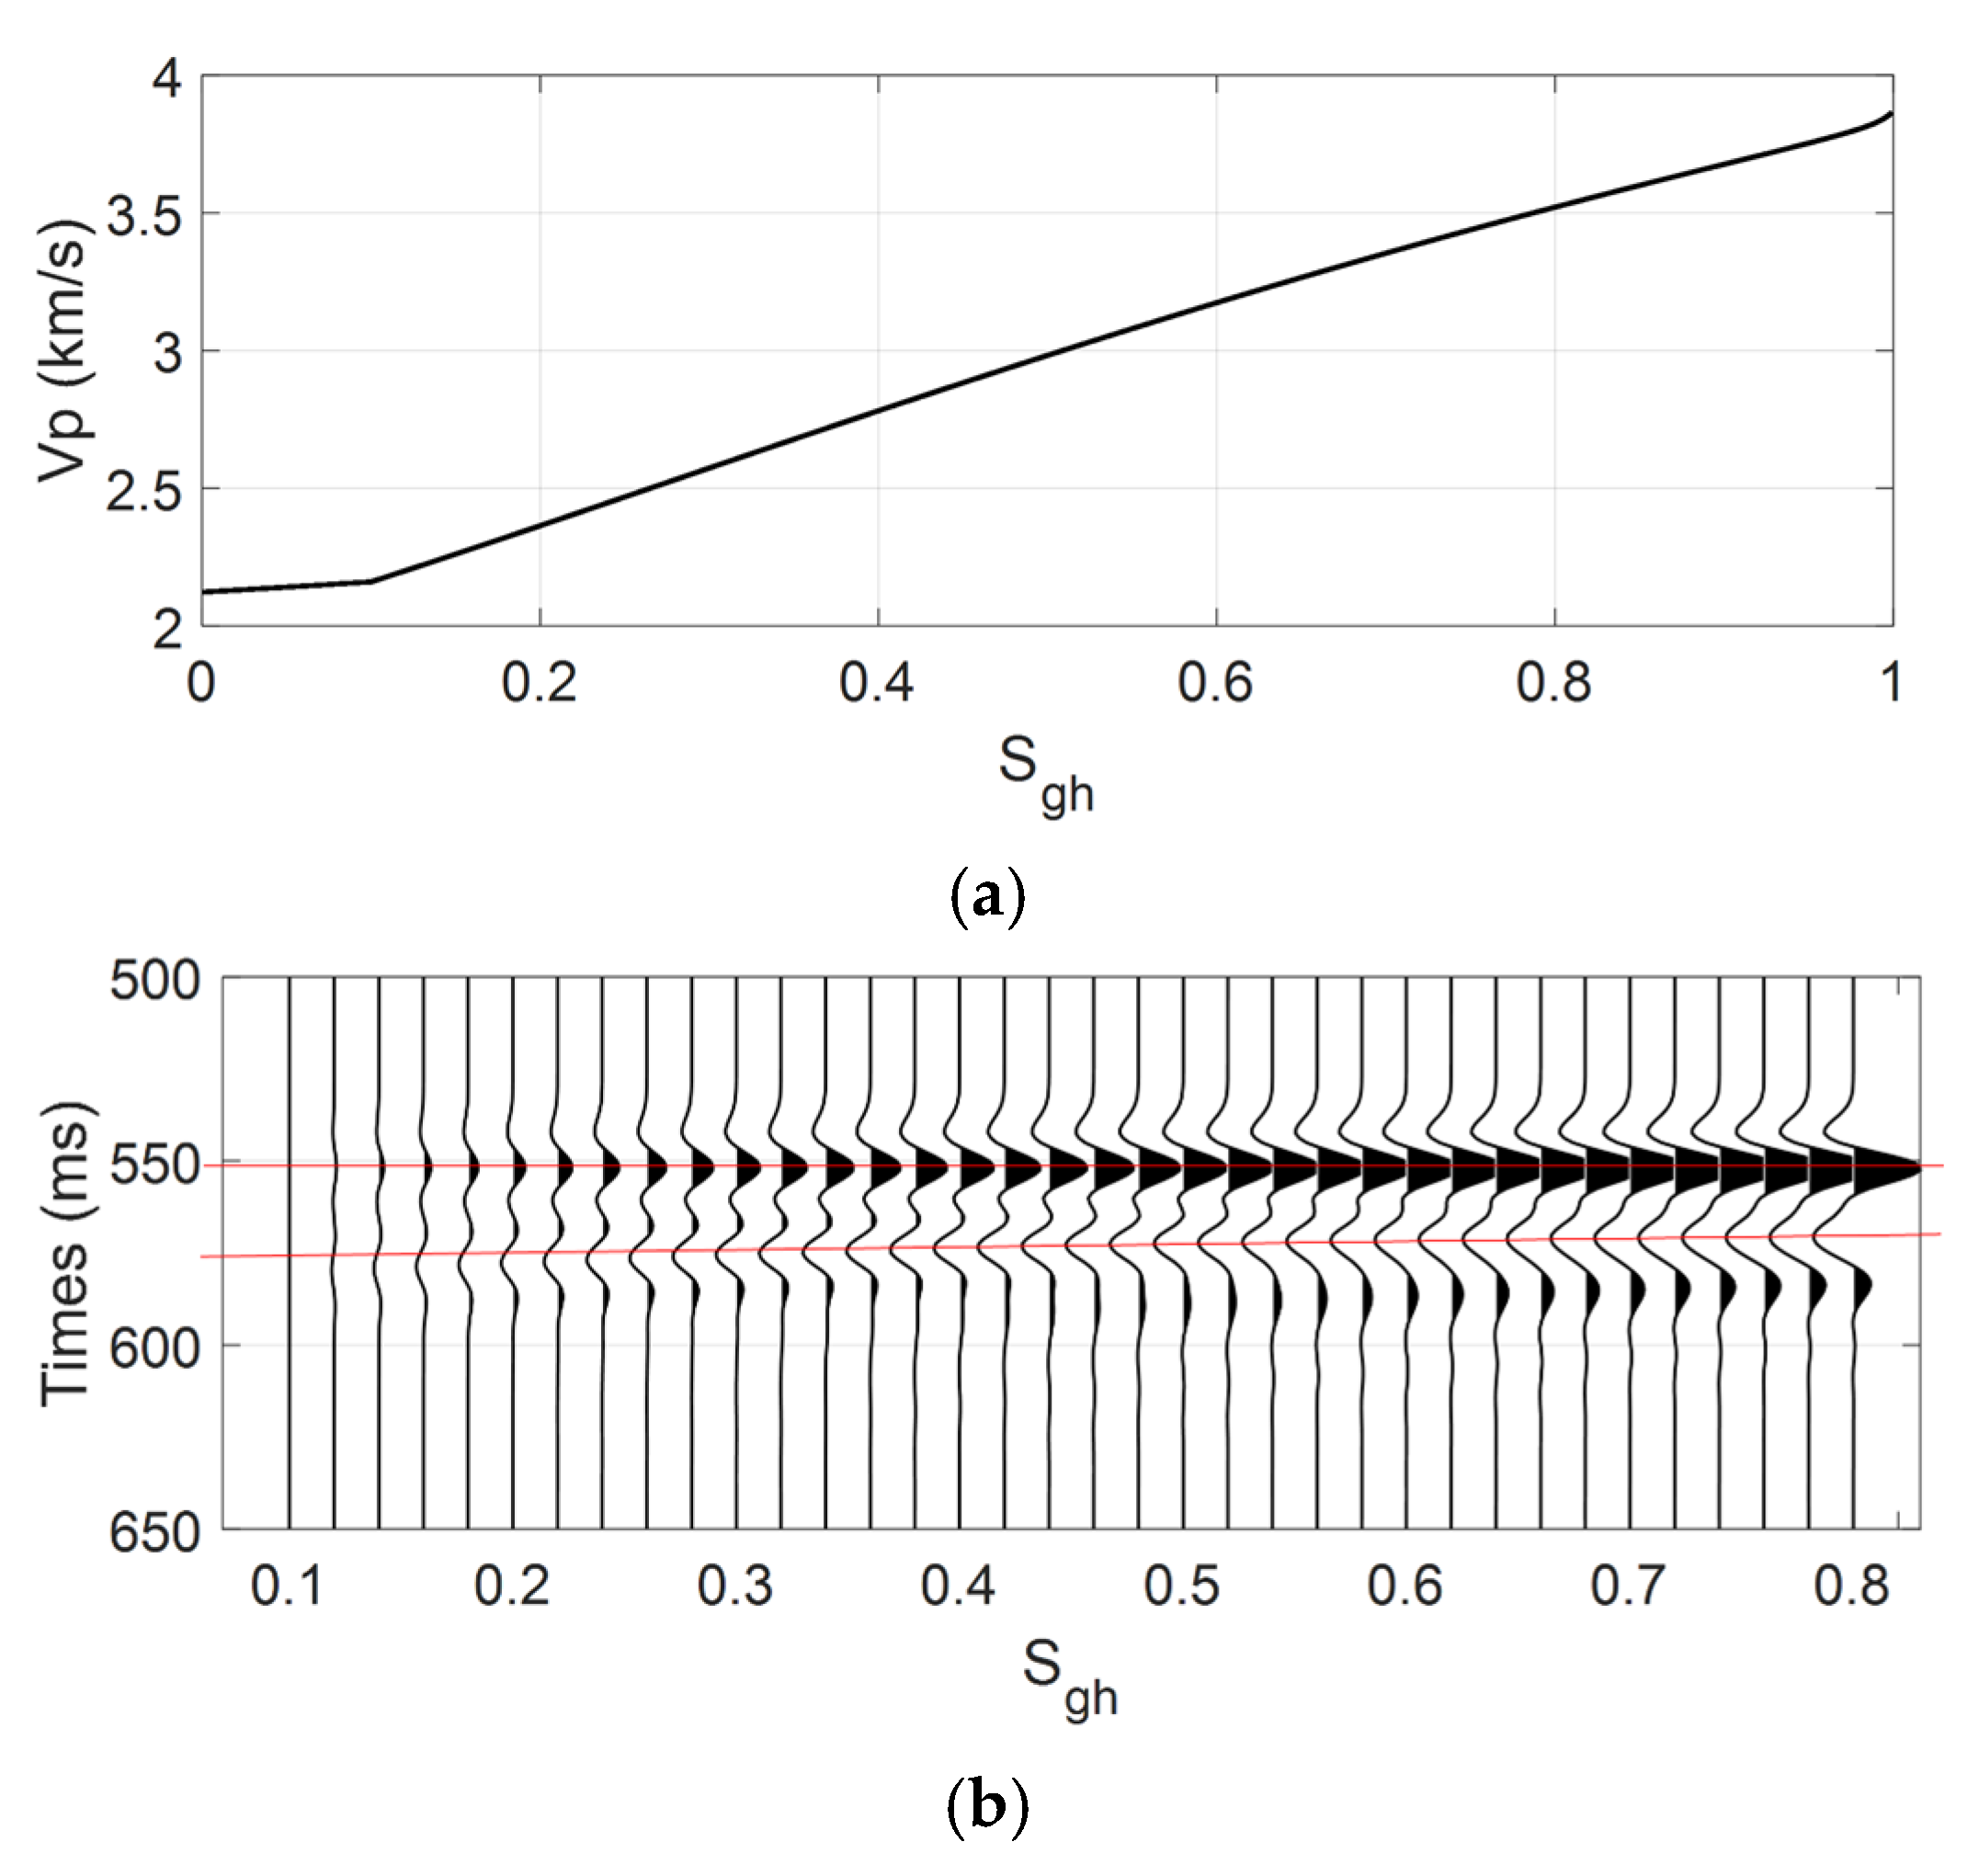
Then, we compute the seismic responses of the model in Figure 1 for the gas hydrate layer with varied Sgh. The thickness of the gas hydrate layer was set to 40 m. Porosity is assumed to be 0.4. Other reservoir properties of the gas hydrate sediment are the same as those for rock physics modeling in Figure 2 and Figure 3. Figure 4a illustrates the correlation between VP and Sgh extracted from Figure 2. The surrounding sandstone was assumed to have Sgh = 0.1 (equal to the critical hydrate saturation), mimicking the smooth transition of gas hydrate saturation at the boundaries of the gas hydrate layer.
We used the propagator matrix method (PMM) as a modeling tool to generate synthetic data. The PMM based on Carcione [25] was extended to integrate the rock physics model and compute reflected waveforms, with the details presented by Guo et al. [26,27]. The source Ricker wavelet has a dominant frequency of 40 Hz. The incidence angle ranges from 0° to 30°. The computed AVO gathers were stacked to obtain seismic traces in Figure 4b, showing amplitude variations for Sgh varying from 0.1 to 0.8. The computed synthetic seismograms were used to test the proposed pore-filling–solid matrix decoupling AVO inversion method.

3.2. Theoretical Model Test of the Decoupling AVO Inversion

We tested the accuracy of the proposed decoupling AVO equation and its applicability for hydrate characterization using the synthetics of the theoretical model shown in Figure 4. In Equation (10), two parameters, γdry and N, were introduced into the decoupling AVO formula. Russell et al. [19] treated γdry as a tuning parameter whose values can best identify gas sands.
Here, to give the initial estimates of γdry and N in the theoretical model test, the two parameters were simultaneously determined based on the reflection coefficients that were computed by incorporating rock physics modeling. Specifically, we determined the (γdry, N) values that provide the best accuracy of the decoupling AVO equation for both the top and bottom interfaces of the hydrate layer in Figure 1. The objective function searching for (γdry, N) is as follows:
f T o p + B o t t o m ( γ d r y , N ) = 1 n i = 1 n [ |   R P P _ D e c o u p l e d ( γ d r y , N , θ i ) R P P _ Z o e p p r i t z ( γ d r y , N , θ i )   | T o p + |   R P P _ D e c o u p l e d ( γ d r y , N , θ i ) R P P _ Z o e p p r i t z ( γ d r y , N , θ i )   | B o t t o m ]
where the objective function was defined as the absolute differences in the PP-wave reflection coefficients between the proposed decoupling AVO equation and the exact Zoeppritz equation at the top and bottom interfaces simultaneously. The incidence angles range from 0° to 30°.
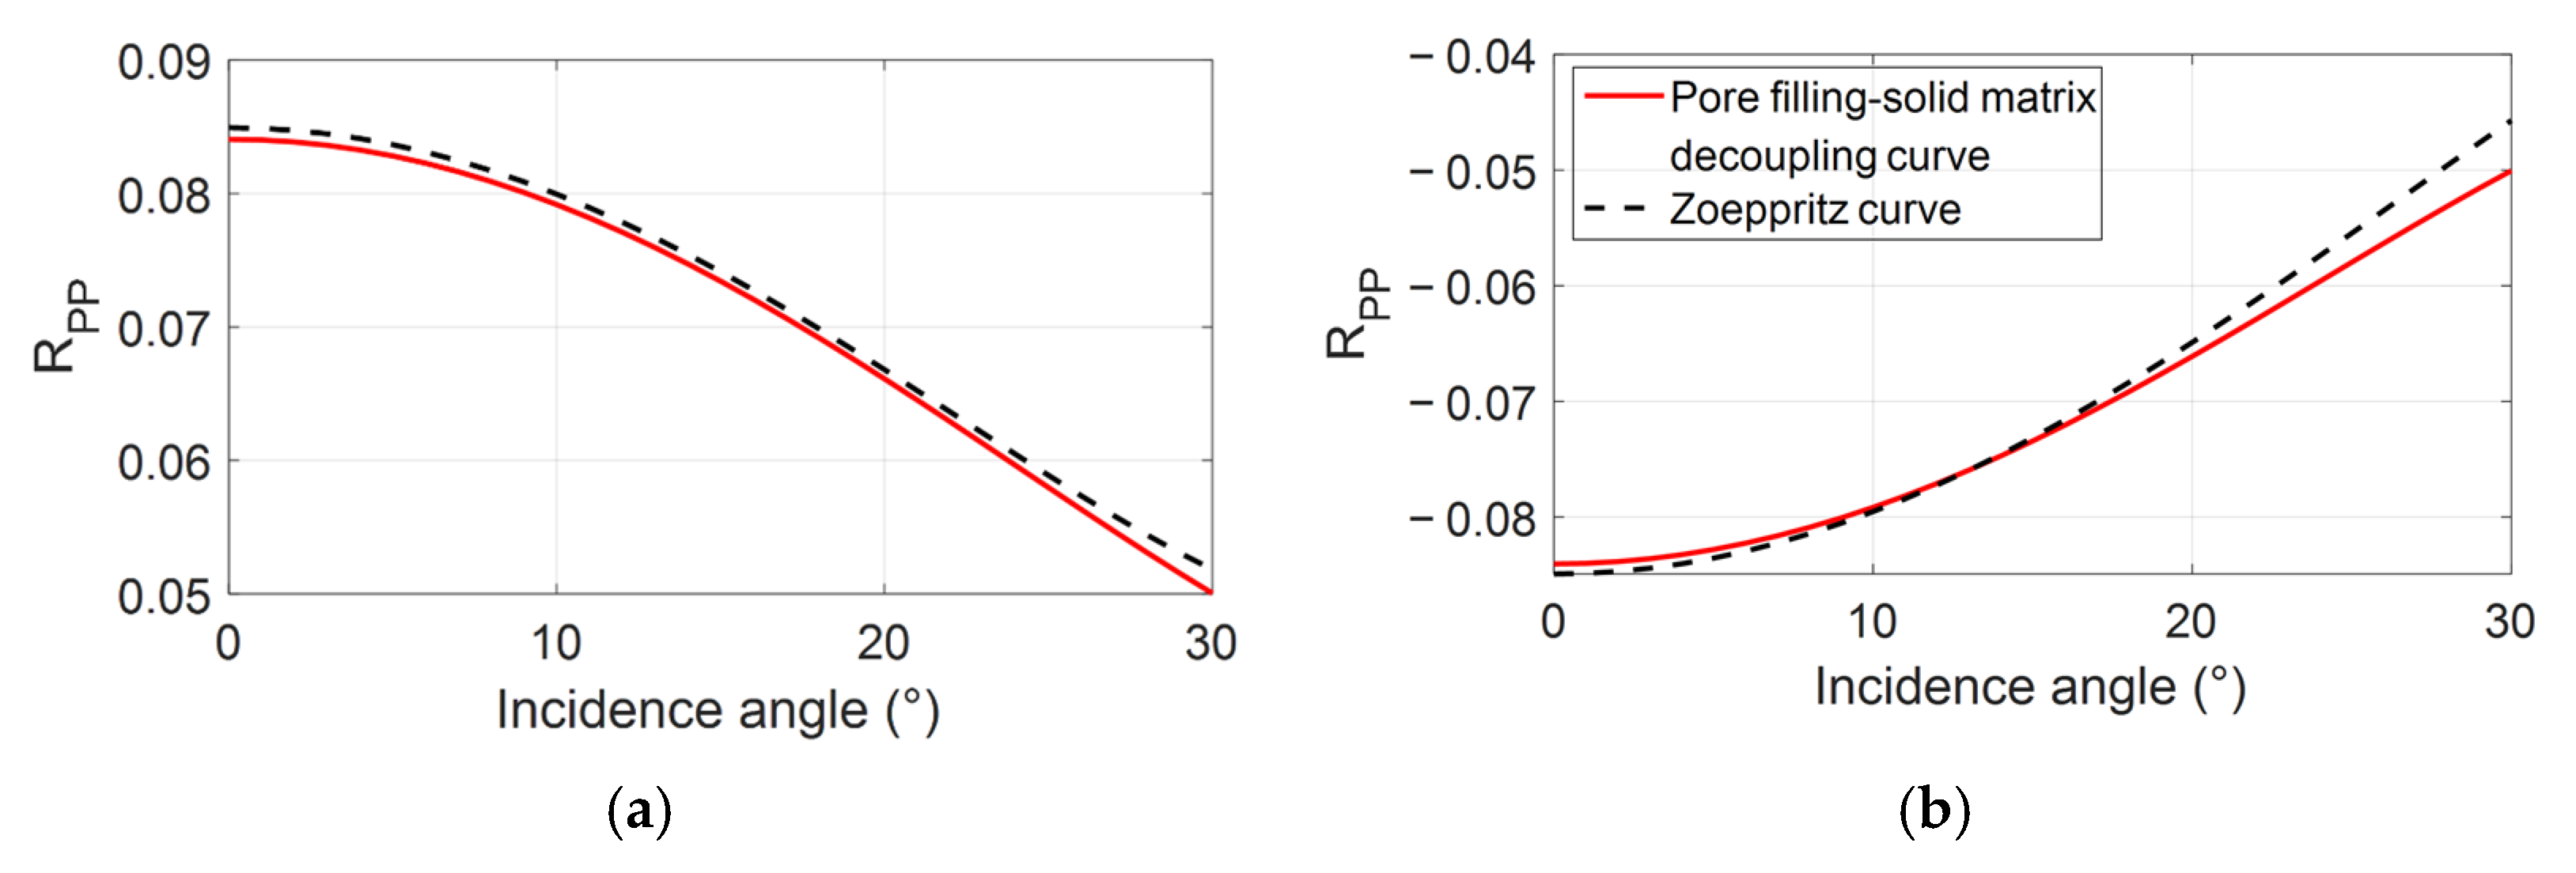
The straightforward grid-search approach was used to find (γdry, N) in Equation (16). For the model where Sgh of the hydrate layer was set to have a typical value of 0.3 and other properties were given in Section 3.1, we had the estimated (γdry, N) values of (1.70, 0.02). Corresponding curves for analyzing the accuracy of the decoupling AVO equation is shown in Figure 5. The results indicate the obtained (γdry, N) values can provide AVO curves with reasonable accuracy for the model.
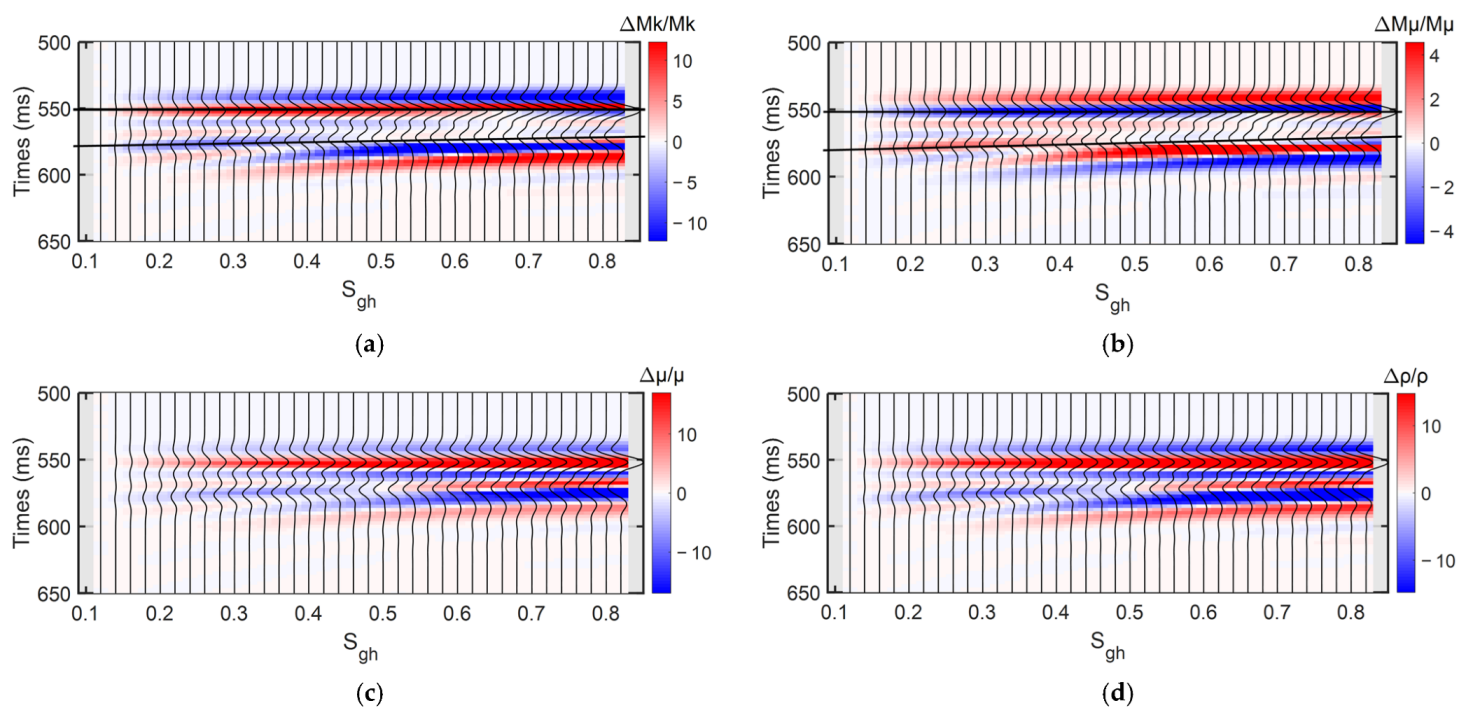
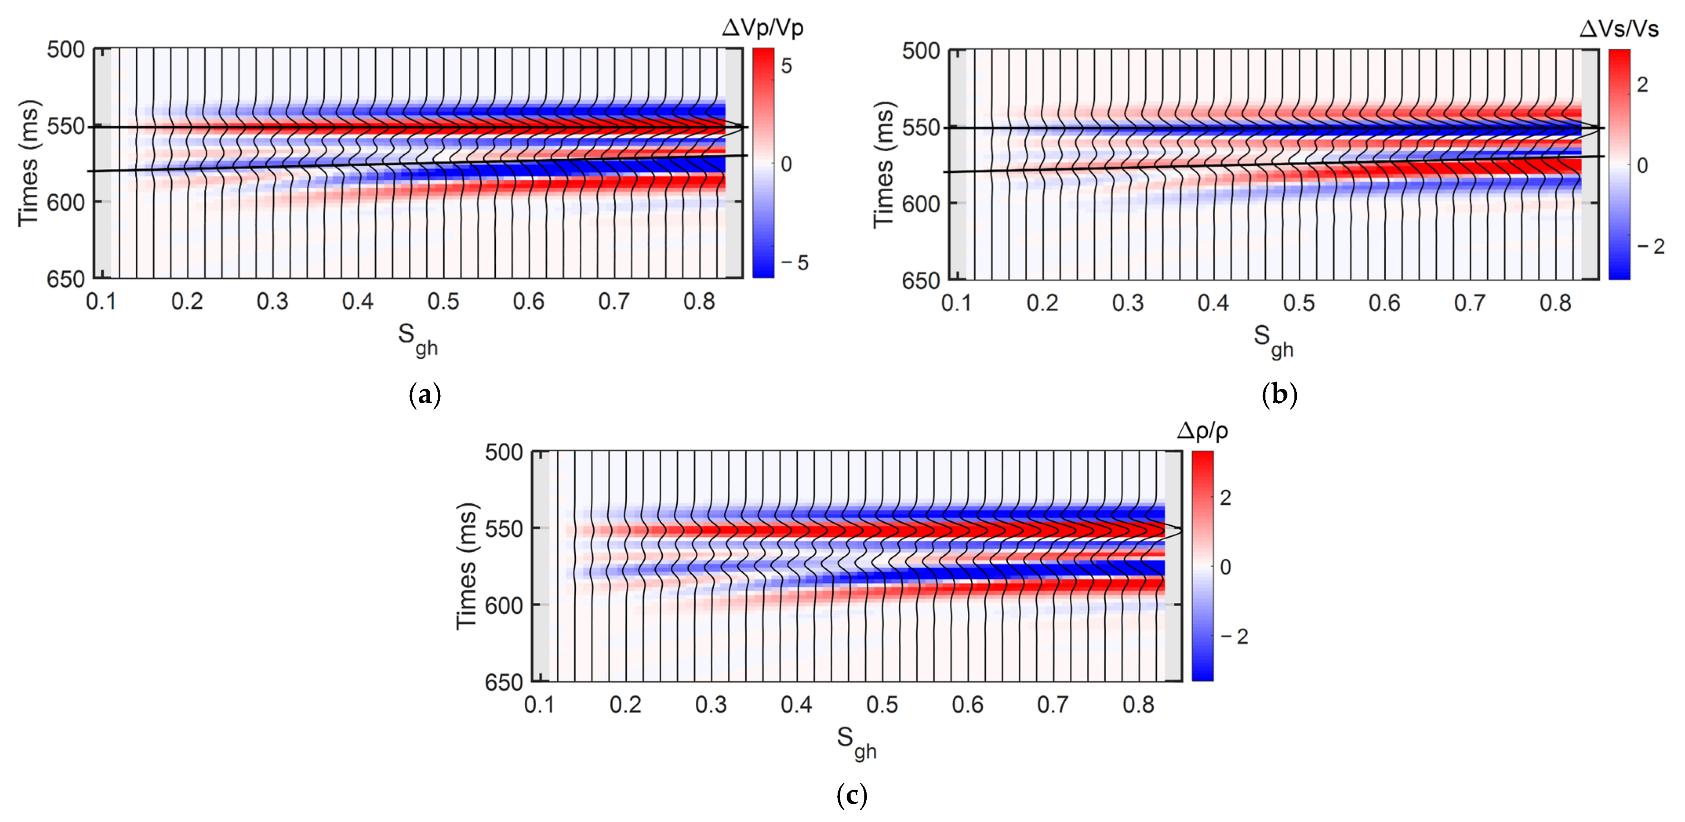
Then, using the synthetic data in Figure 4b and the estimated values of (γdry, N), we performed AVO inversion and compared the results obtained using the proposed decoupling method with those computed based on the Aki and Richards formula in Equation (7). Figure 6 illustrates ΔMk/Mk, ΔMμ/Mμ, Δμ/μ, and Δρ/ρ computed using the straightforward AVO inversion based on the decoupling scheme presented in Section 2.2. For comparison, as shown in Figure 7, we displayed ΔVP/VP, ΔVS/VS, and Δρ/ρ inverted based on Equation (7), following the scheme similar to that in Section 2.2.
Compared to ΔVP/VP and ΔVP/VS (Figure 7a,b), ΔMk/Mk and ΔMμ/Mμ (Figure 6a,b) show similar anomaly responses to the increase in Sgh at the top and bottom interfaces of the gas hydrate layer. Most importantly, ΔMk/Mk and ΔMμ/Mμ exhibit fewer ambiguities irrelevant to Sgh variations within the gas hydrate layer. The results suggest that the hydrate-related attributes (ΔMk/Mk and ΔMμ/Mμ) exhibit the potential to provide more reliable estimates of gas hydrate saturation than the traditional wave velocities-related properties (ΔVP/VP and ΔVS/VS).
Meanwhile, Δμ/μ (Figure 6c) shows the anomalies comparable to those provided by ΔVS/VS (Figure 7b) for increasing Sgh, revealing gas hydrates existing as part of the solid component can enhance the rigidity of sediments. In addition, Δρ/ρ obtained with the two methods (Figure 6d and Figure 7c) show consistent responses, suggesting the robustness of the inversion based on the decoupling AVO equation.

3.3. Realistic Model Test of the Decoupling AVO Inversion

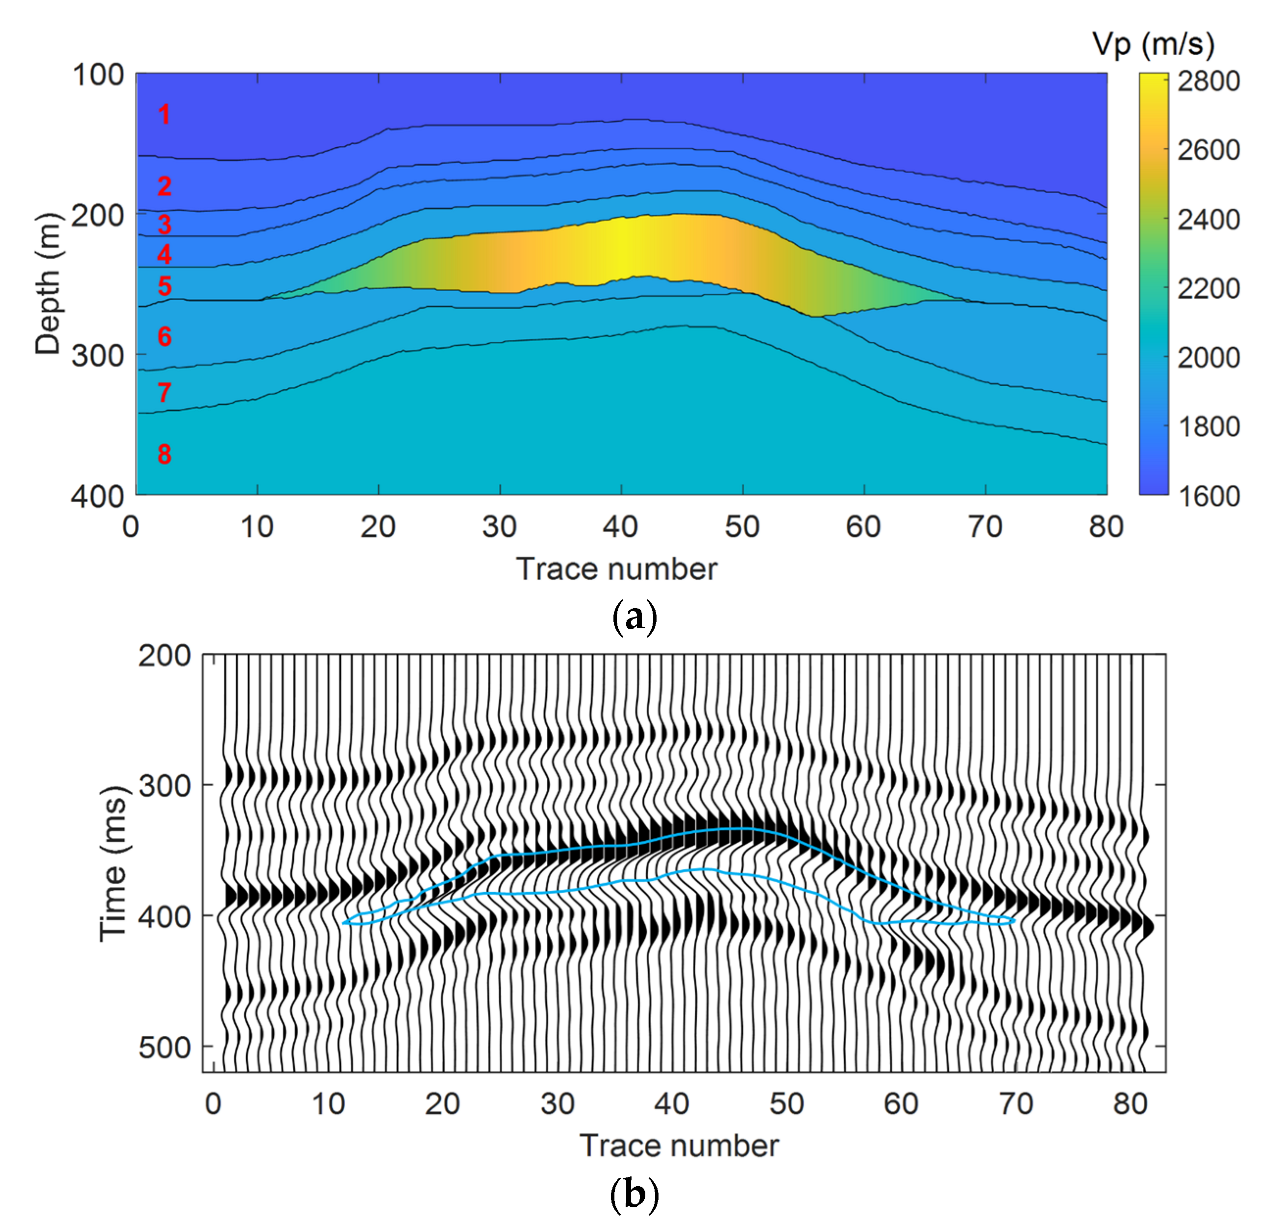
As illustrated by the VP profile in Figure 8a, a realistic model of the gas hydrate system was designed referring to the seismic interpretation in Yang et al. [28], where a gas hydrate deposit with higher wave velocities is formed in shallow ocean-bottom sediments. In the model, the gas hydrate-bearing sediment has a relatively larger thickness centered at trace number 40 and pinching towards two sides. Meanwhile, Sgh of gas hydrate sediment is set to 0.6 in the center and linearly drops to 0.2 at the two edges laterally. Thus, the model delineates the gas hydrate formation with varied thicknesses and gas hydrate concentrations. φ and Sc of the gas hydrate deposit were set to 0.5 and 0.1, respectively. Based on the properties used in Section 3.1, elastic properties of the gas hydrate sediment for varied Sgh values were computed based on the rock physics model proposed in Part 1.
The elastic properties of the shallow marine formations are given in Table 1, according to Yang et al. [28]. Meanwhile, shear wave velocities of the marine sediments were estimated using a constant VP/VS ratio of 3. The source Ricker wavelet has a dominant frequency of 20 Hz. The incidence angle ranges from 0° to 30°. Using the PMM as a modeling tool, we computed the synthetic AVO data for the model in Figure 8a, with the corresponding post-stack seismic section illustrated in Figure 8b. The boundary of the gas hydrate formation was outlined, characterized by the positive and negative reflections at the top and bottom interfaces, respectively. The reflection amplitude strength fades from the center towards the two ends of the gas hydrate layer, interpreted by the decrease in wave velocities of the gas hydrate formation owing to the decrease in Sgh. Limitations of seismic resolution and interferences associated with the layered sediments may increase uncertainty in structural interpretation and Sgh estimations for the gas hydrate deposits.
Figure 9 demonstrates three pre-stack AVO gathers for the models at different trace numbers in Figure 8. The red lines denote the top and bottom of the gas hydrate formation. It is evident that AVO signatures vary considerably with Sgh and layer thickness. Phase reversal is observed for the bottom reflection of the gas hydrate formation at trace numbers 40 and 50, which may explain the relatively weak seismic responses at these locations on the post-stack profile (Figure 8b). Most importantly, it implies that we may expect additional information not revealed in the post-stack section but can be obtained with pre-stack inversion. Next, the synthetics are used to test the decoupling AVO inversion.
We then applied the proposed decoupling AVO inversion method to the synthetic AVO data of the gas hydrate model in Figure 8. Based on the procedure presented in Section 3.2 and using the gas hydrate layer with Sgh = 0.3 as the reference model, we obtained the (γdry, N) values of (1.90, 0.06) as initial estimates of the adjusting parameters, which were used in the decoupling AVO inversion.
Figure 10a,b illustrate the sections of ΔVP/VP and ΔVS/VS that were computed based on Equation (7), respectively. The values of ΔVP/VP were normalized to the range between −1 and 1. In Figure 10b, ΔVS/VS shows a relatively higher magnitude than ΔVP/VP while retaining the relative difference between them, which is consistent with the analysis of the reflectivity across interfaces of the model. Meanwhile, the responses of ΔVP/VP and ΔVS/VS to the hydrate system are similar.
Results indicate that the boundary of the gas hydrate layer can be approximately discriminated on the ΔVP/VP section (Figure 10a). Compared with the post-stack section (Figure 8b), the bottom of the hydrate layer exhibits more visibility in the ΔVP/VP section, indicating the seismic attributes obtained from AVO effects can improve the characterization of the hydrate system. Meanwhile, the decrease in Sgh from the center to the two sides can be identified by the decrease in ΔVP/VP for both the top and bottom interfaces. However, the ΔVP/VP anomalies tend to weaken dramatically to the two edges of the gas hydrate layer with a smaller thickness and lower Sgh, which may account for the uncertainty in the gas hydrate interpretation.
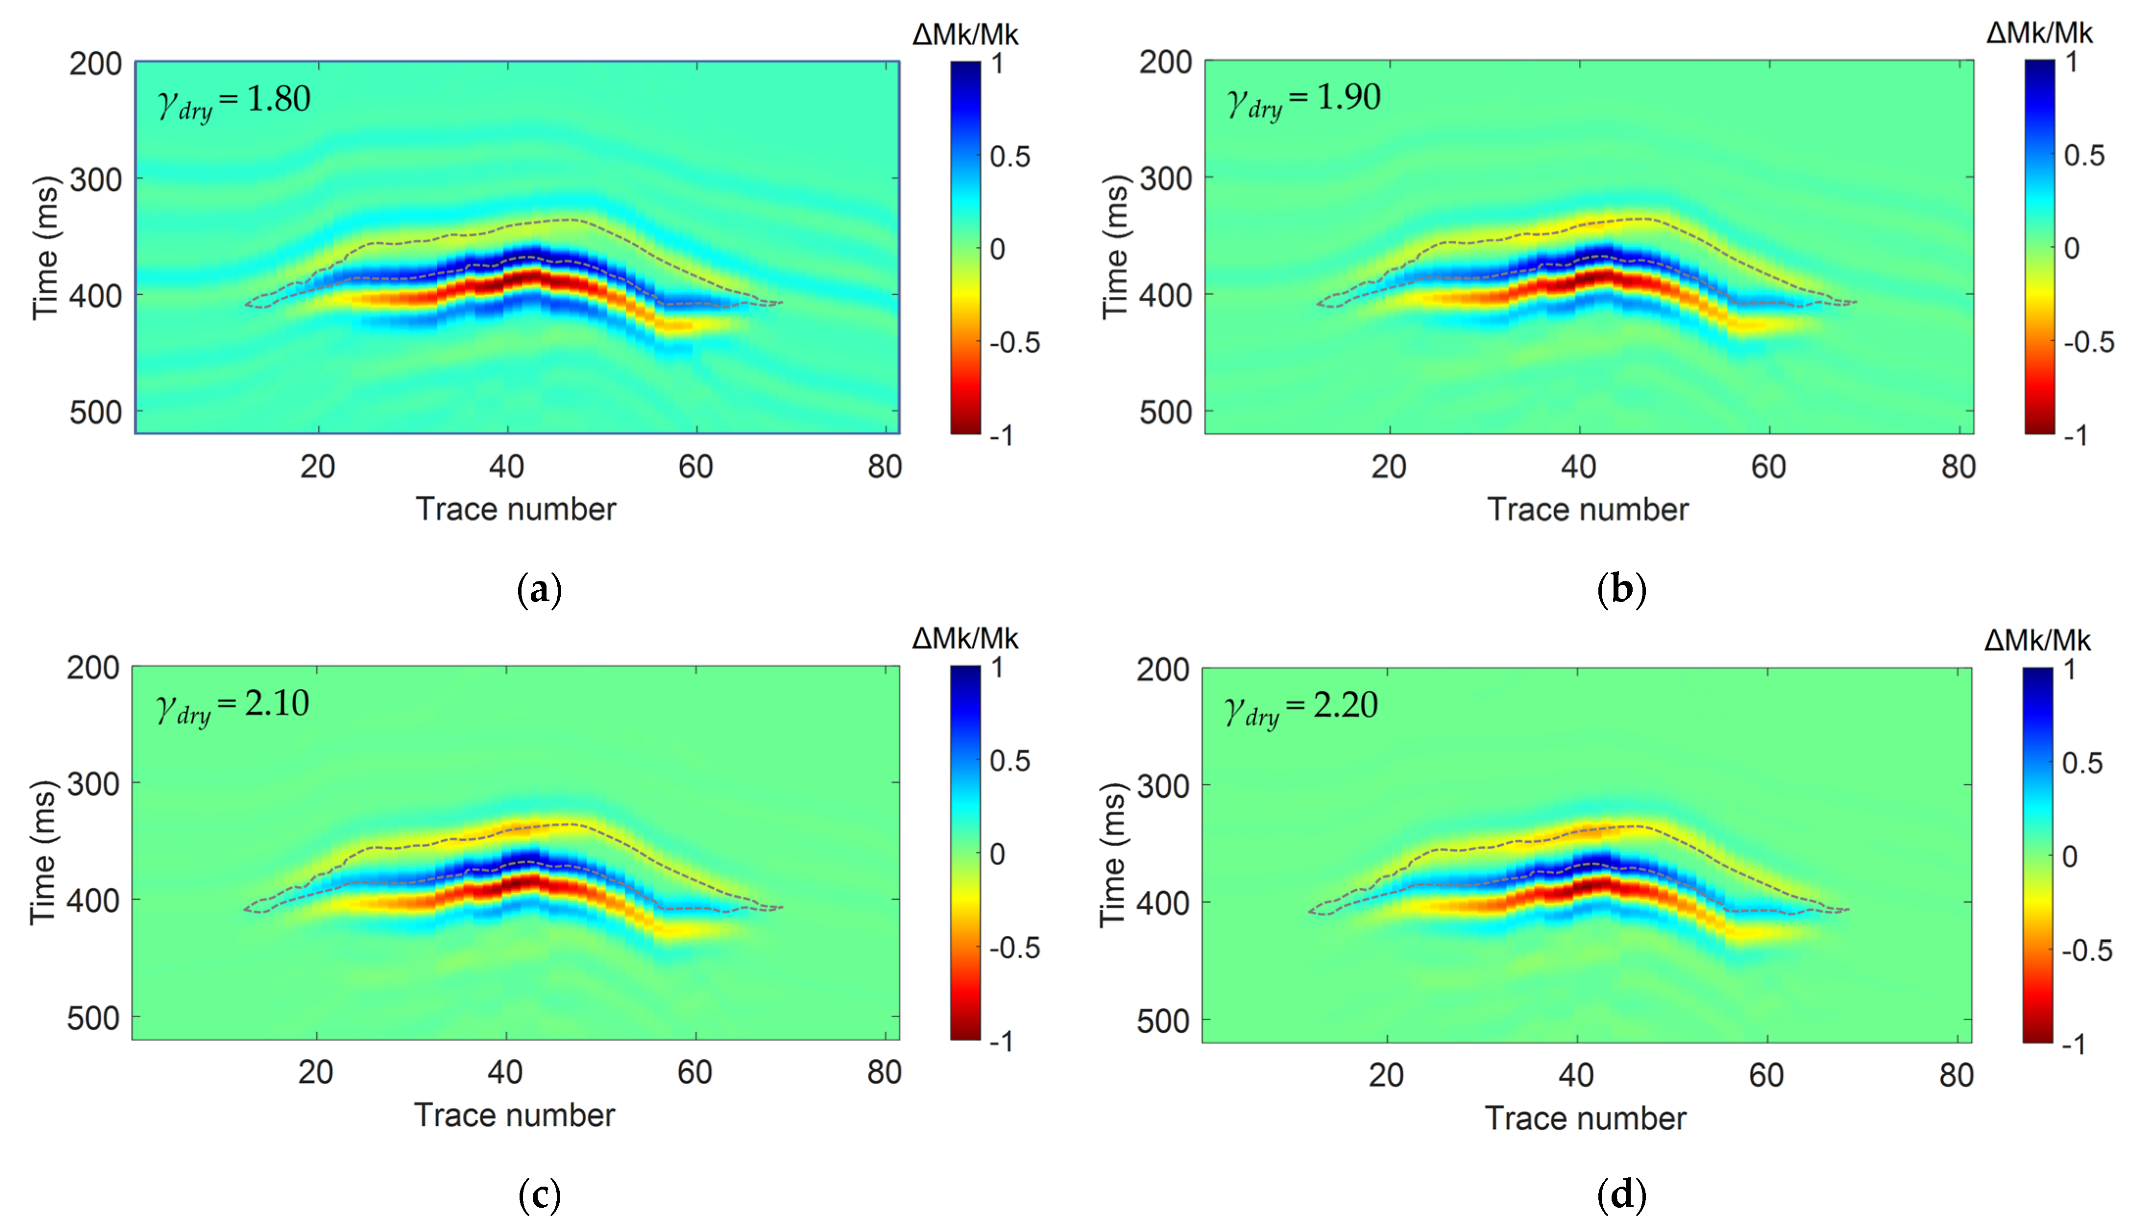
In comparison, Figure 11 shows the sections of ΔMk/Mk obtained with the decoupling AVO scheme. We focused on analyzing ΔMk/Mk while not displaying the sections of ΔMμ/Mμ for simplicity since they show similar distributions for the gas hydrate system. In practice, we found that for similar values of N within the magnitude of the value estimated above, the influence of the parameter N is not significant, primarily influencing the magnitude of the obtained results. Therefore, we kept N at the value of 0.06, as estimated for the reference model. Subsequently, we regarded γdry as a tuning parameter and tested its impact on the obtained results. As shown in Figure 11, for γdry increasing from 1.80, 1.90, 2.10, to 2.20, the visibility of the top interface on the ΔMk/Mk section was enhanced. For γdry at 2.20 (Figure 11d), it achieves a result comparable to that given by ΔVP/VP.
Comparing Figure 10 and Figure 11, ΔMk/Mk can delineate the bottom of the hydrate layer more clearly than ΔVP/VP, especially at the lower γdry values. In contrast, ΔVP/VP cannot reveal the base of the gas hydrate layer at the two edges with a smaller thickness and lower concentration. Meanwhile, lateral variation of the ΔMk/Mk value positively correlates with Sgh. Therefore, by adjusting the tuning parameter γdry, ΔMk/Mk acts as a superior indicator for identifying the configurations and concentrations of the gas hydrate system. However, the implications of the tradeoff between the performance of ΔMk/Mk for characterizing the top and bottom boundaries of the gas hydrate layer have not been fully understood.

4. Discussion

We have proposed a pore-filling–solid matrix decoupling AVO formula to represent seismic reflectivity in terms of properties associated with gas hydrates. The proposed equation can be regarded as the generalization of the popular AVO expressions in terms of fluid factors [19,20,21,22]. One of the advantages of the proposed decoupling formula in the present study is to model seismic signatures associated with the pore-filled mixture of gas hydrate and water that exhibit non-zero rigidity, which is not considered by most existing methods. Moreover, inversion of the introduced parameters with the decoupling AVO equation enables direct estimations of gas hydrate concentrations with different occurrences, including pore fillings and solid components of the sediment frame.
The results of a theoretical model test suggest that the gas hydrate-related attributes (ΔMk/Mk and ΔMμ/Mμ) exhibit more evident anomalies to the variation in Sgh for a gas hydrate model than the traditional wave velocities-related properties (ΔVP/VP and ΔVS/VS), therefore improving the characterization of gas hydrate-bearing sediments (Figure 6 and Figure 7). The test using a realistic model further confirms the superiority of the decoupling AVO inversion in the characterization of a gas hydrate system with heterogeneous concentrations and varied layer thickness (Figure 10 and Figure 11).
The modeling results of synthetic data (Figure 8b and Figure 9) indicate that the gas hydrate system exhibits particular AVO effects. Phase reversal can be observed in the events of bottom reflections in the computed pre-stack angle gathers, especially for the gas hydrate layer with a larger thickness and higher concentrations (Figure 9b,c). Such phase reversal accounts for the weak seismic responses at corresponding locations on the post-stack profile (Figure 8b), challenging the accurate identification of the gas hydrate system. However, the proposed decoupling inversion can capture properties of the gas hydrate system revealed by such AVO effects, with the gas hydrate distribution identified in the ΔMk/Mk section (Figure 11).
Nevertheless, the successful identification of gas hydrate depends on appropriate tuning parameter values. We used the approach demonstrated in Section 3.2 to obtain the initial estimates of the tuning parameters (γdry, N). Test results indicate that γdry is a critical tuning parameter that determines the performance of the gas hydrate-related attributes. By adjusting the tuning parameters, the proposed attributes can delineate the configurations and concentrations of the hydrate system. However, the tradeoff features of the proposed attributes in characterizing the top and bottom boundaries of the hydrate layer (Figure 11) have not been thoroughly understood. It deserves further investigation based on laboratory measurement and rock physics modeling. Meanwhile, owing to the particular characteristics of the gas hydrate-bearing marine sediments, the range of the γdry value should be determined based on future rock physics studies.
As illustrated in Section 2.2, we have performed straightforward inversion using the least-squares method using the decoupling AVO equation without the constraints from log data. It can mimic the marine seismic survey at the predrilling exploration stage with no boreholes drilled. Meanwhile, accurate estimations of gas hydrate-related properties remain challenging even in the presence of adequate log data, owing to the insufficient understanding of the rock properties of hydrate sediments.
The merit of the present study is proposing a pore-filling–solid matrix decoupling AVO equation, which is applicable for hydrocarbon reservoirs where pore fillings should be regarded as solid components. The decoupling method can be further extended based on the elastic impedance inversion scheme while using log data as constraints. At the same time, based on a better understanding of the seismic attenuation of BSR [14,15] and poroelastic behaviors of the gas hydrate layer [29,30,31,32,33], the decoupling AVO equation can be transformed into the frequency domain to estimate dispersion attributes for improved gas hydrate characterization. Meanwhile, based on appropriate rock physics modeling methods, the influence of free gas should be considered for better descriptions of the poroelastic behaviors of the gas hydrate-bearing sediments and corresponding seismic signatures. In addition, the decoupling equation and its potential extensions can be further applied when real seismic data are available.

5. Conclusions

A pore-filling–solid matrix decoupling AVO method was proposed to represent seismic reflectivity in terms of properties associated with gas hydrates. Based on the rock physics relationships of solid substitution, the decoupling AVO equation was established by extending the popular reflection coefficients represented by fluid terms. The decoupling AVO method estimates gas hydrate concentrations with various occurrences through the introduced parameters that evaluate the effect of pore-filled gas hydrates and the gas hydrates as part of the dry frame on elastic moduli of marine sediments. Therefore, the presented method provides a way to estimate the gas hydrate concentration directly while considering the occurrences. A theoretical model test indicates that seismic attributes obtained with the decoupling AVO inversion exhibit superiority in estimating gas hydrate saturations compared to the conventional seismic properties associated with wave velocities. Furthermore, a realistic model test validates the applicability of the decoupling method for the characterization of a gas hydrate system with heterogeneous concentrations and varied layer thickness. The proposed attributes can delineate the configurations and concentration variations of the gas hydrate system by adjusting the tuning parameters. Therefore, the presented method provides a useful seismic method for improved characterization of gas hydrate-bearing marine sediments using elastic properties.
Future studies may include extending the decoupling AVO formula based on the elastic impedance inversion scheme and using rock physics modeling results from log data as constraints in the inversion. Meanwhile, the decoupling AVO equation can be transformed into the frequency-dependent formula to estimate associated dispersion attributes. Finally, the decoupling AVO method and its potential extensions can be generalized for the characterization of other hydrocarbon resources when pore fillings in reservoirs should be treated as solid components and described using the solid substitution model accordingly.

Author Contributions

Conceptualization, Z.G.; methodology, Z.G. and X.L.; software, X.L.; validation, Z.G. and X.L.; formal analysis, Z.G. and X.L.; investigation, Z.G. and H.C.; resources, C.L.; data curation, H.C. and L.M.; writing—original draft preparation, Z.G.; writing—review and editing, Z.G.; visualization, X.L.; project administration, Z.G.; funding acquisition, Z.G. All authors have read and agreed to the published version of the manuscript.

Funding

This research was funded by the National Natural Science Foundation of China (grant numbers 42074153 and 42274160) and the CNPC Science Research and Technology Development Project (grant number 2021DJ3503).

Institutional Review Board Statement

Not applicable.

Informed Consent Statement

Not applicable.

Data Availability Statement

All data have been provided in the paper.

Conflicts of Interest

The authors declare no conflict of interest.

Appendix A

We presented the derivation of the pore-filling–solid matrix decoupling AVO equation in detail. First, we rewrite the Aki–Richards equation, Equation (7), with a common denominator of ρVP2:
R P P ( θ ) = [ 1 2 Δ ρ V P 2 + 1 2 ρ V P Δ V P sec 2 θ 2 ( Δ ρ V S 2 + 2 ρ V S Δ V S ) sin 2 θ ] / ρ V P 2
here, we rewrote the two proposed parameters Mk and Mμ in Equations (5) and (6):
M k = K s a t K d r y = ρ V P 2 4 3 ρ V S 2 ( γ d r y 2 4 3 ) μ d r y
M μ = μ s a t μ d r y = ρ V S 2 μ d r y
and corresponding chain rules in Equations (8) and (9) as follows:
Δ M k = M k V P Δ V P + M k V S Δ V S + M k ρ Δ ρ + M k μ d r y Δ μ d r y
Δ M μ = M μ V S Δ V S + M μ ρ Δ ρ + M μ μ d r y Δ μ d r y
Applying Equations (A4) and (A5) in Equations (A2) and (A3) generates:
Δ M k = 2 ρ V P Δ V P + V P 2 Δ ρ 4 3 ( Δ ρ V S 2 + 2 ρ V S Δ V S ) ( γ d r y 2 4 3 ) Δ μ d r y
Δ M μ = Δ ρ V S 2 + 2 ρ V S Δ V S Δ μ d r y
We rearranged Equations (A6) and (A7) as:
Δ ρ V S 2 + 2 ρ V S Δ V S = Δ M μ + Δ μ d r y
ρ V p Δ V P = 1 2 ( Δ M k V P 2 Δ ρ + 4 3 Δ M μ + γ d r y 2 Δ μ d r y )
and substituted Equations (A8) and (A9) into Equation (A1) to obtain:
R P P ( θ ) = ( 1 4 sec 2 θ ) Δ M k ρ V P 2 + ( 1 3 sec 2 θ 2 sin 2 θ ) Δ M μ ρ V P 2 + ( 1 4 γ d r y 2 sec 2 θ 2 sin 2 θ ) Δ μ d r y ρ V P 2 + ( 1 2 1 4 sec 2 θ ) Δ ρ ρ
We have µdry = µsat − Mµ according to Equation (A3) and then rearranged Equation (A10) by setting µ = µsat (neglecting the subscript “sat” for simplicity) as follows:
R P P ( θ ) = ( 1 4 sec 2 θ ) Δ M k ρ V P 2 + [ ( 1 3 γ d r y 2 4 ) sec 2 θ ] Δ M μ ρ V P 2 + ( γ d r y 2 4 sec 2 θ 2 sin 2 θ ) Δ μ ρ V P 2 + ( 1 2 1 4 sec 2 θ ) Δ ρ ρ
Dividing both sides of Equations (A2) and (A3) by ρVP2 produces:
M k ρ V P 2 = 1 4 V S 2 3 V P 2 ( γ d r y 2 4 3 ) μ d r y ρ V P 2 = 1 4 3 γ s a t 2 ( γ d r y 2 4 3 ) μ d r y ρ V P 2
M μ ρ V P 2 = V S 2 V P 2 μ d r y ρ V P 2 = 1 γ s a t 2 μ d r y ρ V P 2
Substituting Equation (A13) into Equation (A12) gives
M k ρ V P 2 = 1 4 M μ 3 ρ V P 2 γ d r y 2 μ d r y ρ V P 2
Using µdry = µsat − Mµ = ρVS2 − Mµ, we rearranged Equation (A14) as:
M k ρ V P 2 = 1 4 M μ 3 ρ V P 2 γ d r y 2 ρ V S 2 ρ V P 2 + γ d r y 2 M μ ρ V P 2 = 1 γ d r y 2 γ s a t 2 + ( γ d r y 2 4 3 ) M μ ρ V P 2
and further rearranged Equation (A15) as:
1 ρ V P 2 = [ 1 γ d r y 2 γ s a t 2 ] / [ M k + 4 3 M μ γ d r y 2 M μ ]
Substituting Equation (A16) into the Mk and Mμ terms in Equation (A11) gives
R P P ( θ ) = [ ( 1 γ d r y 2 γ s a t 2 ) 1 4 sec 2 θ ] Δ M k M k + 4 3 M μ γ d r y 2 M μ + [ ( 1 3 γ d r y 2 4 ) ( 1 γ d r y 2 γ s a t 2 ) sec 2 θ ] Δ M μ M k + 4 3 M μ γ d r y 2 M μ + ( γ d r y 2 4 sec 2 θ 2 sin 2 θ ) Δ μ ρ V P 2 + [ 1 2 1 4 sec 2 θ ] Δ ρ ρ
Equation (A17) can be further rearranged using ρVP2 = γsat2ρVS2 = γsat2μ as follows:
R P P ( θ ) = [ ( 1 γ d r y 2 γ s a t 2 ) 1 4 sec 2 θ ] Δ M k M k + 4 3 M μ γ d r y 2 M μ + [ ( 1 3 γ d r y 2 4 ) ( 1 γ d r y 2 γ s a t 2 ) sec 2 θ ] Δ M μ M k + 4 3 M μ γ d r y 2 M μ + ( γ d r y 2 4 γ s a t 2 sec 2 θ 2 γ s a t 2 sin 2 θ ) Δ μ μ + [ 1 2 1 4 sec 2 θ ] Δ ρ ρ
By introducing a factor N = Mμ/Mk to rearrange Equation (A18), we obtained the final form of the proposed pore-filling–solid matrix decoupling AVO equation:
R P P ( θ ) = [ 1 4 ( 1 γ d r y 2 γ s a t 2 ) sec 2 θ 1 + 4 N / 3 γ d r y 2 N ] Δ M k M k + [ ( N 3 γ d r y 2 N 4 ) ( 1 γ d r y 2 γ s a t 2 ) sec 2 θ 1 + 4 N / 3 γ d r y 2 N ] Δ M μ M μ + ( γ d r y 2 4 γ s a t 2 sec 2 θ 2 γ s a t 2 sin 2 θ ) Δ μ μ + [ 1 2 1 4 sec 2 θ ] Δ ρ ρ
We have Mµ = 0 for the case of fluid saturation (µdry = µsat) according to Equation (A3). In this case, the factor N = Mμ/Mk becomes zero, making Equation (A19) rigorously limited to the form given by Russell et al. [19]:
R P P ( θ ) = [ 1 4 ( 1 γ d r y 2 γ s a t 2 ) sec 2 θ ] Δ M k M k + ( γ d r y 2 4 γ s a t 2 sec 2 θ 2 γ s a t 2 sin 2 θ ) Δ μ μ + [ 1 2 1 4 sec 2 θ ] Δ ρ ρ
where the term ΔMk/Mk is the same as the fluid term Δf/f in Russell et al. [19].

References

  1. Guo, Z.Q.; Lv, X.Y.; Liu, C.; Chen, H.F.; Cai, Z.G. Characterizing gas hydrate–bearing marine sediments using elastic properties—Part 1: Rock physical modeling and inversion from well logs. J. Mar. Sci. Eng. 2022, 10, 1379. [Google Scholar] [CrossRef]
  2. Andreassen, K.; Hogstad, K.; Berteussen, K.A. Gas hydrate in the southern Barents Sea indicated by a shallow seismic anomaly. First Break 1990, 8, 235–245. [Google Scholar] [CrossRef]
  3. Andreassen, K.; Hartb, P.E.; MacKayc, M. Amplitude versus offset modeling of the bottom simulating reflection associated with submarine gas hydrates. Mar. Geol. 1997, 137, 25–40. [Google Scholar] [CrossRef]
  4. Carcione, J.M.; Tinivella, U. Bottom simulating reflectors: Seismic velocities and AVO effects. Geophysics 2000, 65, 54–67. [Google Scholar] [CrossRef]
  5. Ecker, C.; Dvorkin, J.; Nur, A.M. Estimating the amount of gas hydrate and free gas from marine seismic data. Geophysics 2000, 65, 565–573. [Google Scholar] [CrossRef]
  6. Chen, M.P.; Riedel, M.; Hyndman, R.D.; Dosso, S.E. AVO inversion of BSRs in marine gas hydrate studies. Geophysics 2007, 72, C31–C43. [Google Scholar] [CrossRef]
  7. Dai, J.; Snyder, F.; Gillespie, D.; Koesoemadinata, A.; Dutta, N. Exploration for gas hydrates in the deepwater northern Gulf of Mexico: Part I. A seismic approach based on geologic model, inversion and rock physics principles. Mar. Petr. Geol. 2008, 25, 830–844. [Google Scholar] [CrossRef]
  8. Dai, J.; Banik, N.; Gillespie, D.; Dutta, N. Exploration for gas hydrates in the deepwater, northern Gulf of Mexico: Part II. Model validation by drilling. Mar. Petr. Geol. 2008, 25, 845–859. [Google Scholar] [CrossRef]
  9. Dutta, N.C.; Dai, J. Exploration for gas hydrates in a marine environment using seismic inversion and rock physics principles. Lead. Edge 2009, 28, 792–802. [Google Scholar] [CrossRef]
  10. Shelander, D.; Dai, J.; Bunge, G. Predicting saturation of gas hydrates using pre-stack seismic data, Gulf of Mexico. Mar. Geophys. Res. 2010, 31, 39–57. [Google Scholar] [CrossRef]
  11. Shelander, D.; Dai, J.; Bunge, G.; Singh, S.; Eissa, M.; Fisher, K. Estimating saturation of gas hydrates using conventional 3D seismic data, Gulf of Mexico Joint Industry Project Leg II. Mar. Petr. Geol. 2012, 34, 96–110. [Google Scholar] [CrossRef]
  12. Fohrmann, M.; Pecher, I.A. Analysing sand-dominated channel systems for potential gas-hydrate-reservoirs using an AVO seismic inversion technique on the Southern Hikurangi Margin, New Zealand. Mar. Petr. Geol. 2012, 38, 19–34. [Google Scholar] [CrossRef]
  13. Zhang, Z.J.; McConnell, D.R.; Han, D.H. Rock physics-based seismic trace analysis of unconsolidated sediments containing gas hydrate and free gas in Green Canyon 955, Northern Gulf of Mexico. Mar. Petr. Geol. 2012, 34, 119–133. [Google Scholar] [CrossRef]
  14. Dewangan, P.; Mandal, R.; Jaiswal, P.; Ramprasad, T.; Sriram, G. Estimation of seismic attenuation of gas hydrate bearing sediments from multi-channel seismic data: A case study from Krishna-Godavari offshore basin. Mar. Pet. Geol. 2014, 58, 356–367. [Google Scholar] [CrossRef]
  15. Qadrouh, A.; Carcione, J.M.; Salim, A.M.; Harith, Z.Z.T. Attenuation effects on the seismic response of a bottom-simulating reflector. J. Nat. Gas Sci. Eng. 2015, 24, 510–517. [Google Scholar] [CrossRef]
  16. Ehsan, M.I.; Ahmed, N.; Khalid, P.; Liu, X.W.; Naeem, M. An application of rock physics modeling to quantify the seismic response of gas hydrate-bearing sediments in Makran accretionary prism, offshore, Pakistan. Geosci. J. 2016, 20, 321–330. [Google Scholar] [CrossRef]
  17. Han, D.; Batzle, M. Gain function and hydrocarbon indicators. In Proceedings of the SEG Annual Meeting, Dallas, TX, USA, 26–31 October 2003. [Google Scholar]
  18. Russell, B.H.; Hedlin, K.; Hilterman, F.J. Fluid-property discrimination with AVO: A Biot-Gassmann perspective. Geophysics 2003, 68, 29–39. [Google Scholar] [CrossRef] [Green Version]
  19. Russell, B.H.; Gray, D.; Hampson, D.P. Linearized AVO and poroelasticity. Geophysics 2011, 76, C19–C29. [Google Scholar] [CrossRef]
  20. Zong, Z.Y.; Yin, X.Y.; Wu, G. Direct inversion for a fluid factor and its application in heterogeneous reservoirs. Geophys. Prospect. 2013, 61, 998–1005. [Google Scholar] [CrossRef]
  21. Yin, X.Y.; Cao, D.P.; Wang, B.L.; Zong, Z.Y. Research progress of fluid discrimination with pre-stack seismic inversion. Oil Geophys. Prospect. 2014, 49, 22–34, 46. [Google Scholar] [CrossRef]
  22. Zhang, S.; Huang, H.D.; Dong, Y.P.; Yang, X.; Wang, C.; Luo, Y.N. Direct estimation of the fluid properties and brittleness via elastic impedance inversion for predicting sweet spots and the fracturing area in the unconventional reservoir. J. Nat. Gas Sci. Eng. 2017, 45, 415–427. [Google Scholar] [CrossRef]
  23. Ciz, R.; Shapiro, S.A. Generalization of Gassmann equations for porous media saturated with a solid material. Geophysics 2007, 72, 75–79. [Google Scholar] [CrossRef]
  24. Aki, K.; Richards, P.G. Quantitative Seismology, 2nd ed.; W. H. Freeman and Co: New York, NY, USA, 2002. [Google Scholar]
  25. Carcione, J.M. AVO effects of a hydrocarbon source-rock layer. Geophysics 2001, 66, 419–427. [Google Scholar] [CrossRef] [Green Version]
  26. Guo, Z.Q.; Liu, C.; Li, X.Y.; Lan, H.T. An improved method for the modeling of frequency-dependent amplitude-versus-offset variations. IEEE Geosci. Remote Sens. Lett. 2015, 12, 63–67. [Google Scholar] [CrossRef]
  27. Guo, Z.Q.; Liu, X.W. Seismic rock physics characterization of anisotropic shale-a Longmaxi shale case study. J. Geophys. Eng. 2018, 15, 512–526. [Google Scholar] [CrossRef] [Green Version]
  28. Yang, J.; Zhang, L.; Wang, J.S.; Xie, N.; Ma, N.; Zhang, H. Quantitative characterization of gas hydrate based on forward modeling. Oil Geophys. Prospect. 2020, 55, 419–425. [Google Scholar] [CrossRef]
  29. Ba, J.; Carcione, J.M.; Cao, H.; Du, Q.Z.; Yuan, Z.Y.; Lu, M.H. Velocity dispersion and attenuation of P waves in partially-saturated rocks: Wave propagation equations in double-porosity medium. Chin. J. Geophys. 2012, 55, 219–231. [Google Scholar] [CrossRef]
  30. Ba, J.; Xu, W.; Fu, L.; Carcione, J.M.; Zhang, L. Rock anelasticity due to patchy saturation and fabric heterogeneity: A double double-porosity model of wave propagation. J. Geophys. Res. Solid Earth 2017, 122, 1949–1976. [Google Scholar] [CrossRef]
  31. Ba, J.; Zhao, J.; Carcione, J.M.; Huang, H. Compressional wave dispersion due to rock matrix stiffening by clay squirt flow. Geophys. Res. Lett. 2016, 43, 6186–6195. [Google Scholar] [CrossRef] [Green Version]
  32. Sun, W.T.; Xiong, F.S.; Ba, J.; Carcione, J.M. Effects of ellipsoidal heterogeneities on wave propagation in partially saturated double-porosity rocks. Geophysics 2018, 83, 71–81. [Google Scholar] [CrossRef]
  33. Carcione, J.M. Wave Fields in Real Media: Wave Propagation in Anisotropic, Anelastic, Porous and Electromagnetic Media, 3rd ed.; Elsevier: Amsterdam, The Netherlands, 2015. [Google Scholar]
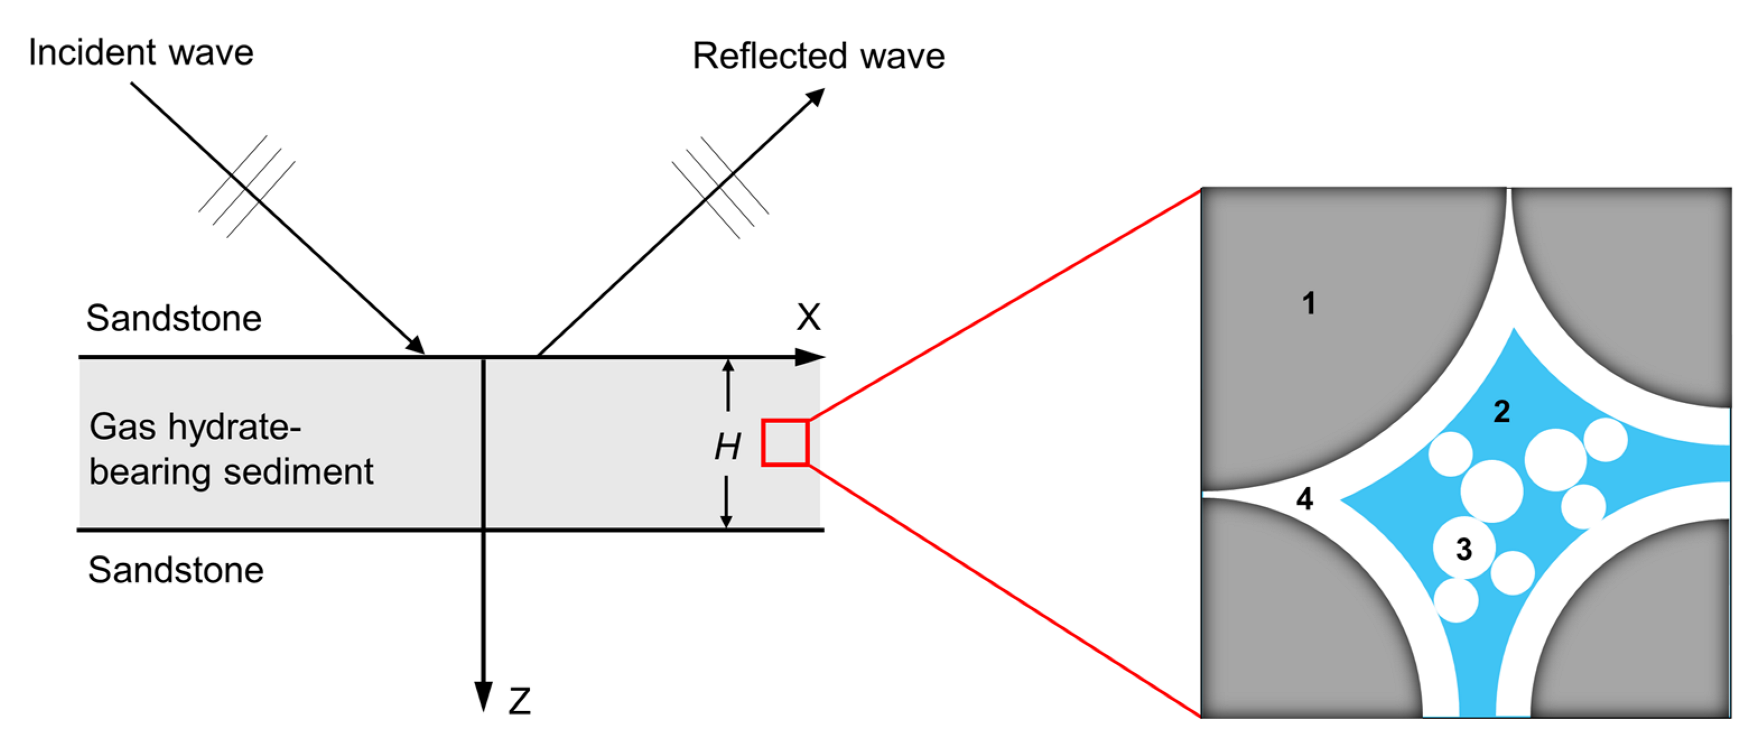
Figure 1. Model for rock physical and seismic modeling where a gas hydrate-bearing sediment is surrounded by sandstones. The rock physics model of the gas hydrate deposit is given in Part 1. 1—Solid frame composed of minerals. 2—Water. 3—Gas hydrates as pore fillings. 4—Gas hydrates as part of the solid frame.
Jmse 10 01497 g001
Figure 2. Properties of (a) Vp, (b) Vs, and (c) ρ of marine sediments for varied gas hydrate saturation (Sgh) and porosity (φ).
Jmse 10 01497 g002
Figure 3. Properties of (a) Mk, (b) Mμ, and (c) μ of marine sediments for varied gas hydrate saturation (Sgh) and porosity (φ).
Jmse 10 01497 g003
Figure 4. (a) Vp for varied Sgh in gas hydrate-bearing sediments and (b) synthetic seismograms for the model in Figure 1 with Sgh varying from 0.1 to 0.8. Two red lines indicate the top and bottom of the gas hydrate layer, respectively.
Jmse 10 01497 g004
Figure 5. Comparison between the PP-wave reflection coefficients obtained with the Zoeppritz equation (black dashed curves) and the pore-filling–solid matrix decoupling AVO equation (red solid curves) for the (a) top and (b) bottom interfaces of the gas hydrate layer in Figure 1.
Jmse 10 01497 g005
Figure 6. Inverted results of (a) ΔMk/Mk, (b) ΔMμ/Mμ, (c) Δμ/μ, and (d) Δρ/ρ for varied Sgh using the pore-filling–solid matrix decoupling method in Equation (10). Two black lines indicate the top and bottom of the gas hydrate layer, respectively.
Jmse 10 01497 g006
Figure 7. Inverted results of (a) ΔVP/VP, (b) ΔVS/VS, and (c) Δρ/ρ for varied Sgh using Aki and Richards formula in Equation (7). Two black lines indicate the top and bottom of the hydrate layer, respectively.
Jmse 10 01497 g007
Figure 8. (a) VP profile showing a geological model of gas hydrate system formed in the layered marine sediments, where Sgh decreases from the center to edges on both sides in the gas hydrate layer and (b) corresponding post-stack seismic section computed with the propagator matrix method, with the interpreted outline of the gas hydrate formation indicated in blue.
Jmse 10 01497 g008
Figure 9. Pre-stack AVO synthetics from the models in Figure 8 at traces with the numbers (a) 20, (b) 40, (c) 50, and (d) 60, respectively. The red lines indicate the top and bottom of the gas hydrate-bearing formation.
Jmse 10 01497 g009
Figure 10. Results of (a) ΔVP/VP and (b) ΔVS/VS inverted based on the conventional AVO formula in Equation (7) for the model of the gas hydrate system in Figure 8.
Jmse 10 01497 g010
Figure 11. Results of ΔMk/Mk inverted based on the pore-filling–solid matrix decoupling AVO formula in Equation (10) for the model of the gas hydrate system in Figure 8. The tuning parameter γdry is tested using the values of (a) 1.80, (b) 1.90, (c) 2.10, and (d) 2.20, respectively.
Jmse 10 01497 g011
Table 1. Elastic properties of the ocean-bottom formations in the realistic model in Figure 8a.
VP (m/s)ρ (kg/m3)
16001740
16801760
17401770
17901790
19351870
19401880
20001920
20401940
Publisher’s Note: MDPI stays neutral with regard to jurisdictional claims in published maps and institutional affiliations.