Article

Characterizing Gas Hydrate–Bearing Marine Sediments Using Elastic Properties—Part 1: Rock Physical Modeling and Inversion from Well Logs

1
College of Geoexploration Science and Technology, Jilin University, Changchun 130021, China
2
BGP Inc., CNPC, Zhuozhou 072750, China
*
Author to whom correspondence should be addressed.
J. Mar. Sci. Eng. 2022, 10(10), 1379; https://doi.org/10.3390/jmse10101379
Submission received: 28 August 2022 / Revised: 19 September 2022 / Accepted: 23 September 2022 / Published: 27 September 2022
(This article belongs to the Special Issue Properties of Gas Hydrate-Bearing Sediments)

Abstract

:
Gas hydrates are considered a potential energy source for the future. Rock physics modeling provides insights into the elastic response of sediments containing gas hydrates, which is essential for identifying gas hydrates using well-log data and seismic attributes. This paper establishes a rock physics model (RPM) by employing effective medium theories to quantify the elastic properties of sediments containing gas hydrates. Specifically, the proposed RPM introduces critical gas hydrate saturation for various modeling schemes. Such a key factor considers the impact of gas hydrates on sediment stiffnesses during the dynamic process of the gas hydrate accumulating as pore fillings and part of the solid components. Theoretical modeling illustrates that elastic characteristics of the sediments exhibit distinct variation trends determined by critical gas hydrate saturation. Numerical tests of the model based on the well-log data confirm that the proposed technique can be employed to rationally predict gas hydrate saturation using the elastic properties. The compressional wave velocity model is also developed to estimate the gas hydrate saturation, which gives reliable fit results to core measurement data. The proposed methods could improve our understanding of the elastic behaviors of gas hydrates, providing a practical approach to estimating their concentrations.

1. Introduction

Natural gas hydrates, which chiefly consist of water and methane, are believed to be a potential energy source that exhibits huge global reserves as hydrocarbon resources. The gas hydrates are extensively distributed in shallow marine sediments, permafrost areas, and polar regions, forming under conditions with the specific geological conditions of low temperature and high pressure [1,2,3,4].
Although exploration of gas hydrates has attracted considerable attention from the scientific and industrial communities worldwide for many years, accurate characterization of gas hydrate–bearing deposits based on geophysical methods remains a challenging problem. The main issues of challenges come from the limited understanding of the elastic properties of marine sediments, which affects the reliable interpretation of the elastic wave velocities from well-log and seismic data in estimating gas hydrate concentration and their mode of occurrence. The rock physics model (RPM) is commonly regarded as a powerful tool for describing physical relationships between elastic parameters and sedimentary properties. The RPM can be used to construct rock physics templates for quantitative seismic interpretation. At the same time, based on the modeling of wave velocities, the RPM can be appropriately extended to estimate gas hydrate concentrations using petrophysical parameters measured in boreholes, which is the primary objective of the current work.
So far, several models have been established to consider the relationships between gas hydrate concentration and seismic wave velocities for marine sediments. For instance, some early methodologies were developed based on various average equations to model elastic wave velocities for gas hydrate deposits, including the three-phase time average equation based on Wyllie’s equation [5,6,7,8]. Meanwhile, Lee et al. [9] proposed the three-phase Wood’s equation for gas hydrate deposits by extending Wood’s relation [10]. At the same time, based on Nobes et al. [11], Lee et al. [9] also suggested a combination of the three-phase time average equation and extended Wood’s equation by introducing adjustable parameters. Despite several successful applications in modeling the seismic wave velocities of marine sediments with gas hydrates, the main problem with the average models of various fashions is related to their empirical nature and thus cannot be readily generalized. Meanwhile, the determination of the adjustable parameters may be site specific. Most importantly, these average equations or their combinations offer little physical insight into the occurrence status of gas hydrates saturated in unconsolidated marine sediments.
On the other hand, Dvorkin et al. [12] established an effective medium model by extending the contact model via the bound theory for unconsolidated ocean bottom sediments [13,14]. Helgerud et al. [15] introduced a physics-based model by extending the work of Dvorkin et al. [12], which was extensively employed in subsequent explorations for characterizing gas hydrate sediments [16,17,18,19]. Additionally, other effective medium theories, such as the differential effective medium and self-consistent approximation models, were employed to evaluate the elastic properties of gas hydrate deposits and estimate gas hydrate saturation using well-log data [20,21]. In estimating the gas hydrate concentration with these models, the gas hydrate occurrence was commonly assumed to exhibit a particular distribution pattern. This assumption can be easily violated since the in situ gas hydrates may exhibit various distribution patterns.
Although it was noted that the presence of gas hydrates leads to an increase in seismic wave velocities according to the above explorations, the physical relationships between elastic parameters and gas hydrate concentrations and their modes of occurrence have not been adequately explored yet. Different modes of gas hydrate occurrence, such as pore fillings and part of solid components of dry sediment frame, may account for distinct elastic responses of gas hydrate-bearing sediments [22]. Therefore, to improve the estimation of gas hydrates using elastic properties, it is essential to establish a physics-based model that quantifies elastic responses of marine sediments associated with the various occurrence situations for gas hydrates.
Herein, an effective RPM is proposed to describe the elastic properties of gas hydrate deposits based on effective medium theories. To this end, the concept of critical gas hydrate saturation is introduced to consider the dynamic accumulation process of gas hydrates. After analyzing the impacts of gas hydrate saturation and porosity on the elastic properties of sediments, the proposed RPM model is calibrated using well-log data to interpret elevated wave velocities in marine sediments containing gas hydrates. Finally, the RPM is appropriately extended to rationally estimate the gas hydrate saturation in wellbores, and the predicted results are then validated using core measurement data.

2. Methods

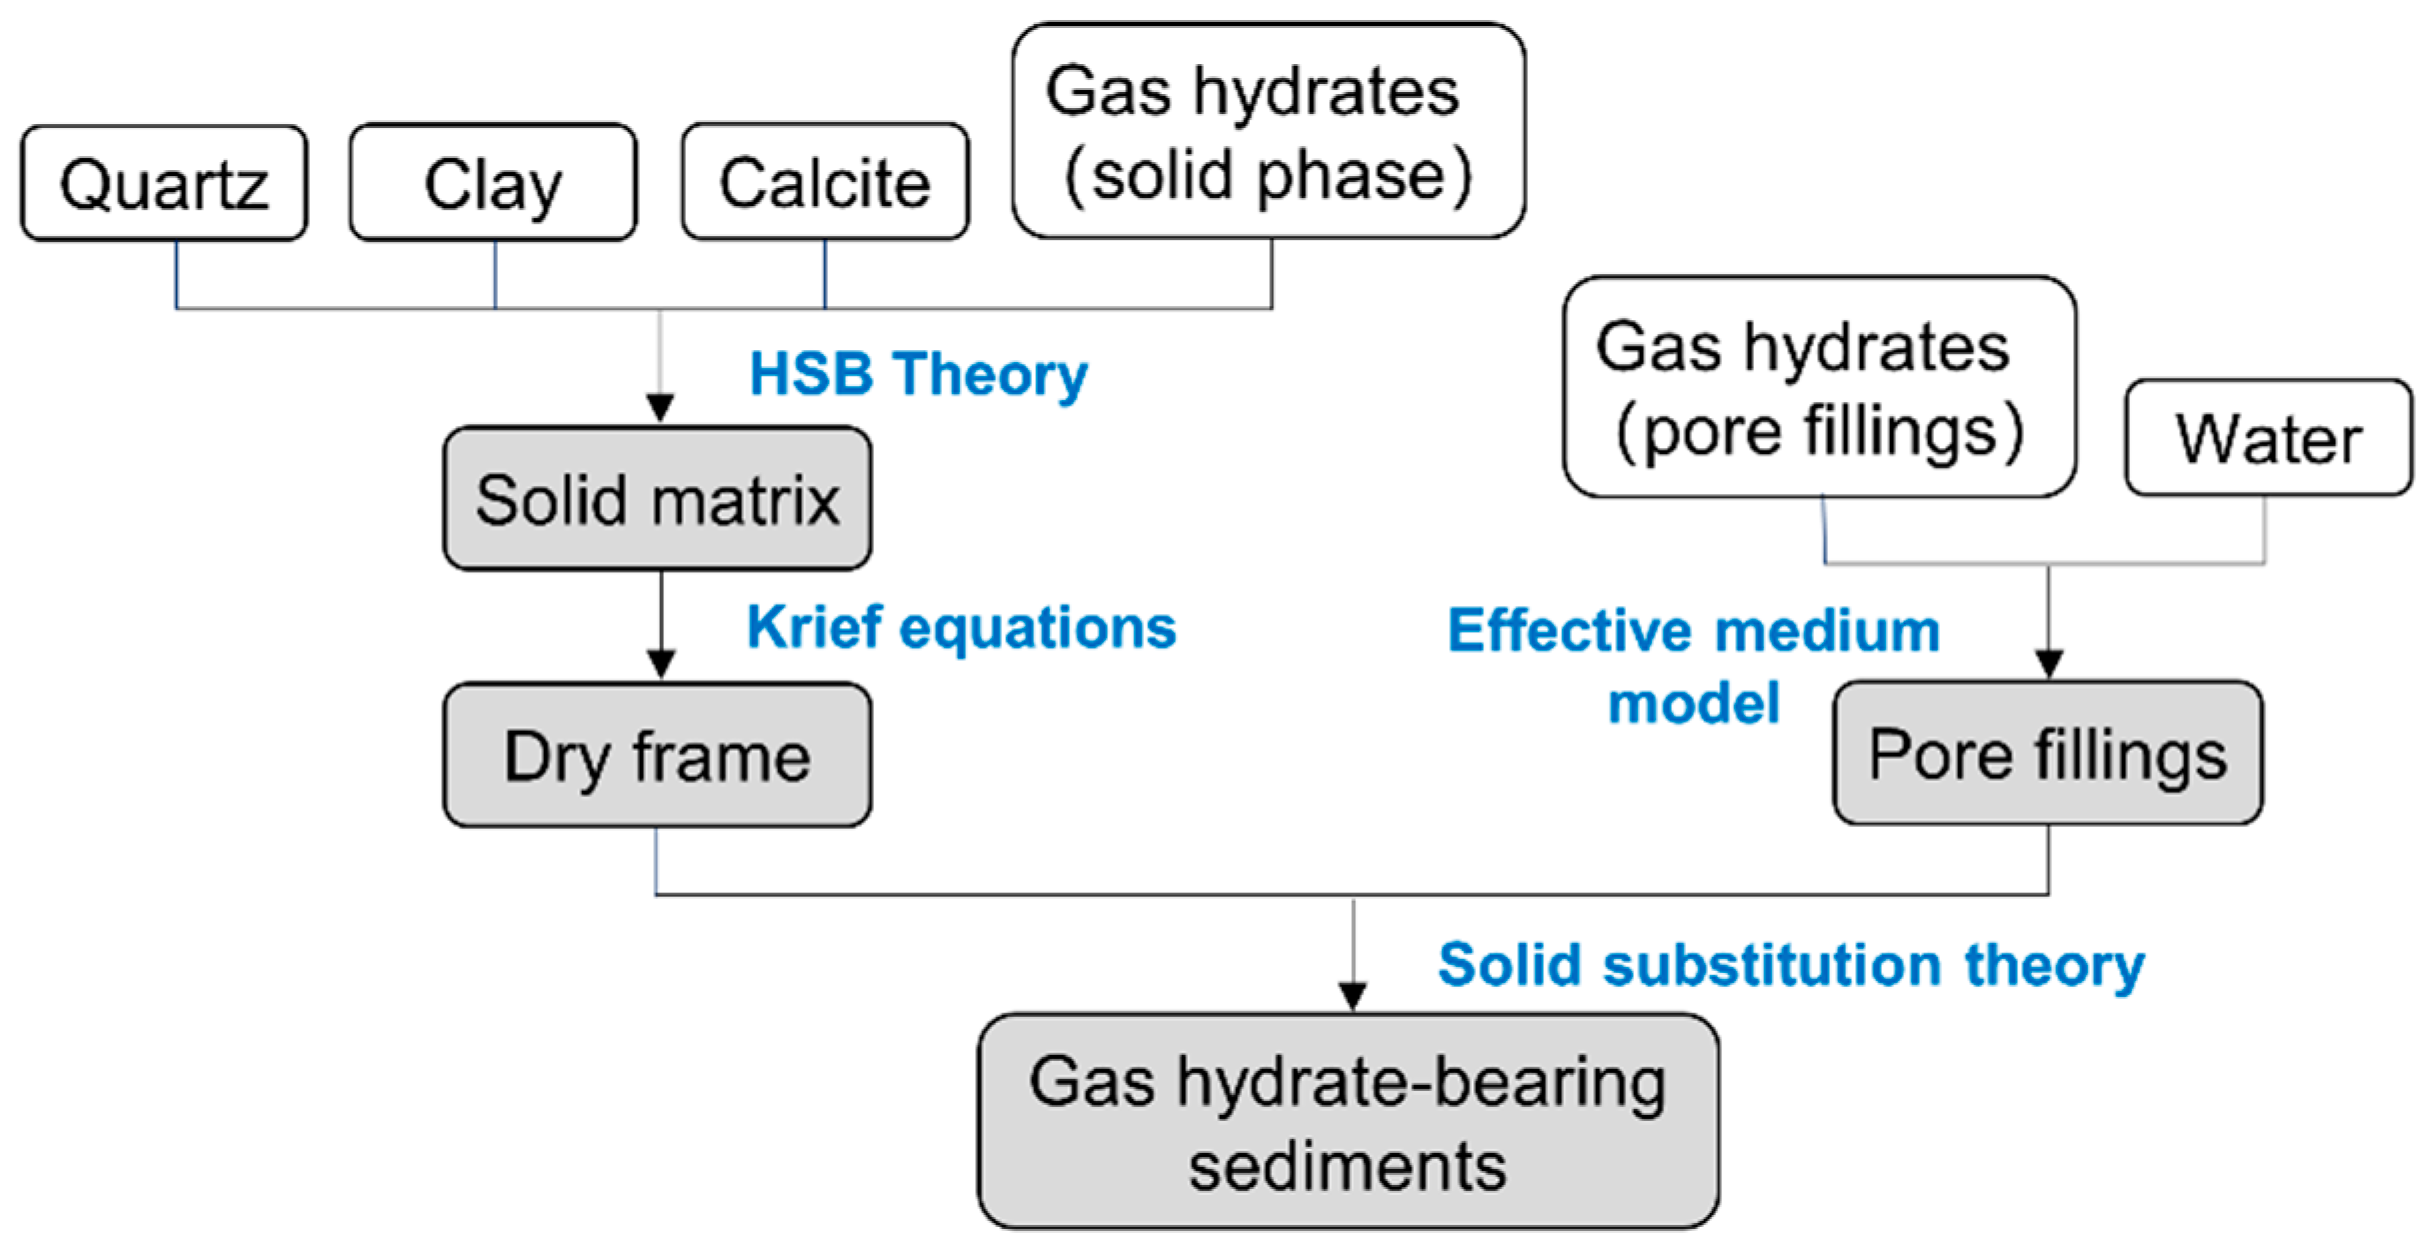
2.1. Rock Physic Models for Marine Sediments Containing Gas Hydrates

Figure 1 presents the model of marine sediment containing gas hydrates with various modes of occurrence during the accumulation of gas hydrates. Gas hydrates were assumed to be generated and distributed in the pore space of highly porous ocean bottom sediments at the appropriate pressure and temperature conditions. In this case, the gas hydrates exhibit relatively low concentration and are part of pore fillings without altering the elastic properties of the dry sediment frame (status A). By approaching the gas hydrate saturation (Sgh) to a critical value (i.e., critical gas hydrate saturation, denoted by Sc), the extra gas hydrates initiate to form a part of the solid phase (status B). By continuously increasing Sgh, the gas hydrates existing as the solid components modify the elastic stiffnesses of the dry sediment frame (status C). In this case, the water saturation constantly lessens with the growth of the gas hydrate concentration. Status D corresponds to the case that solid gas hydrates occupy all initial pore spaces.
In the present paper, an appropriate RPM was established to model the elastic moduli of the marine sediments with varying gas hydrate concentrations and various modes of occurrence, as demonstrated in Figure 1. The key parameter introduced in rock physics modeling is the critical gas hydrate saturation (Sc) described above. Different modeling schemes should be adopted for the two major cases (i.e., Sgh is lower and higher than Sc) due to the existence of different modes of occurrence of gas hydrates (see Figure 1). In particular, for status C, gas hydrate particles in pores could contact with each other or touch their counterparts in the solid frame, forming the pore-filled gas hydrate fabric with non-zero bulk and shear moduli. Consequently, the gas hydrates and water mixture should be considered solid pore-fillings saturated in the dry sediment frame. These features should be appropriately taken into account in rock physics–based modeling.
Accordingly, Figure 2 presents a general workflow for rock physics modeling of elastic properties of marine sediments with various models of gas hydrate occurrences illustrated in Figure 1. The first step involves estimating elastic moduli of the solid matrix composed of minerals with the averaged Hashin–Shtrikman bounds (HSB) [14]. Depending on the mode of occurrence, as displayed in Figure 1, gas hydrates are treated as part of pore fillings for the case of Sgh lower than Sc; otherwise, gas hydrates exist as part of pore fillings and configure a component of the solid phase simultaneously.
Krief’s equations [23] were used to estimate the elastic moduli of the dry sediment frame:
K d r y = K m ( 1 φ ) m ( φ )
μ d r y = μ m ( 1 φ ) m ( φ )
where Km and Kdry represent the bulk moduli of the solid matrix and dry frame, respectively. The factors μm and μdry denote the shear moduli of the solid matrix and dry frame, respectively. In addition, m(φ) = 3/(1 − φ), where porosity φ is defined as the volumetric fraction of pore-filled gas hydrates and water mixture. In the case of Sgh < Sc, porosity would be equal to φ0, and for the case of SghSc, porosity is given by φ = φ0 [1 − (SghSc)]. In this relation, φ0 is the initial porosity when gas hydrates only exit in pore spaces while not forming part of the solid components. Thus, φ0 has a constant value for a dry frame with given mineralogical fractions. The parameter Sc denotes the critical gas hydrate saturation beyond which the extra amount of gas hydrate becomes a component of the dry frame. Note that Sgh represents the gas hydrate saturation, defined in terms of the ratio of the total volumetric fraction of gas hydrates as pore fillings and part of the solid phase to the initial φ0. Therefore, φ lessens with increasing Sgh for SghSc, with the lessening of φ corresponding to the increased volumetric fraction of gas hydrates as part of the dry frame.
The effective medium model proposed by Dovrkin et al. [12] was implemented to predict the non-zero bulk and shear moduli of the gas hydrate fabric filled in pores. For the pore-filled mixture composed of gas hydrates and water, the corresponding bulk modulus Khf and shear modulus μhf of the gas hydrate fabric in the mixture can be computed in the following form:
K h f = { [ φ w / φ c K H M + 4 μ H M / 3 + 1 φ w / φ c K m + 4 μ H M / 3 ] 1 4 3 μ H M , φ w < φ c [ ( 1 φ w ) / ( 1 φ c ) K H M + 4 μ H M / 3 + ( φ w φ c ) / ( 1 φ c ) 4 μ H M / 3 ] 1 4 3 μ H M , φ w φ c
μ h f = { [ φ w / φ c μ H M + Z + 1 φ w / φ c μ m + Z ] 1 Z , φ w < φ c [ ( 1 φ w ) / ( 1 φ c ) μ H M + Z + ( φ w w φ c ) / ( 1 φ c ) Z ] 1 Z , φ w φ c
Z = μ H M 6 ( 9 K H M + 8 μ H M K H M + 2 μ H M )
where φw represents the volumetric fraction of water in the pore-filled mixture of gas hydrates and water. Additionally, φw is equal to 1 − Sgh in the case of Sgh < Sc, while it can be expressed as φw = (1 − Sgh)/[1 − (SghSc)] for the case of SghSc. The factor φc stands for the critical porosity in the Hertz–Mindlin contact theory [13]. KHM and μHM are the bulk and shear moduli at φc and can be stated by:
K H M = [ n 2 ( 1 φ c ) 2 μ m 2 18 π 2 ( 1 ν ) 2 P ] 1 3
μ H M = 5 4 ν 5 ( 2 ν ) [ 3 n 2 ( 1 φ c ) 2 μ m 2 2 π 2 ( 1 ν ) 2 P ] 1 3
where μm and ν represent the shear modulus and Poisson’s ratio of the solid gas hydrate matrix, respectively, and n denotes the average number of grains in contact at critical porosity. Furthermore, the effective pressure is provided by P = (ρbρw)/gh, where ρb indicates sediment bulk density, ρw stands for water density, g is the acceleration of gravity, and h denotes the depth below the sea floor.
Subsequently, the bulk modulus Kmix and shear modulus μmix of the pore-filled gas hydrates and water mixture were obtained from Gassmann’s equations [24] as follows:
K m i x = K h f + K f ( K h f K g h ) 2 K g h 2 φ w K h f K f + K g h K f K g h K f φ w
μ m i x = μ h f
where Kgh and Kf represent the bulk moduli of gas hydrates and water.
Finally, the elastic moduli Ksat and μsat of the sediments with gas hydrates were modeled with the generalized solid substitution theory [25]:
K s a t = K d r y + K m i x ( K d r y K 0 ) 2 K 0 2 φ K d r y K m i x + K 0 K m i x K 0 K m i x φ
μ s a t = μ d r y + μ m i x ( μ d r y μ 0 ) 2 μ 0 2 φ μ d r y μ m i x + μ 0 μ m i x μ 0 μ m i x φ
where K0 and μ0 are the bulk and shear moduli of the solid phase, which solely compose minerals in the case of Sgh < Sc, and consists of minerals and gas hydrates simultaneously for the case of SghSc.

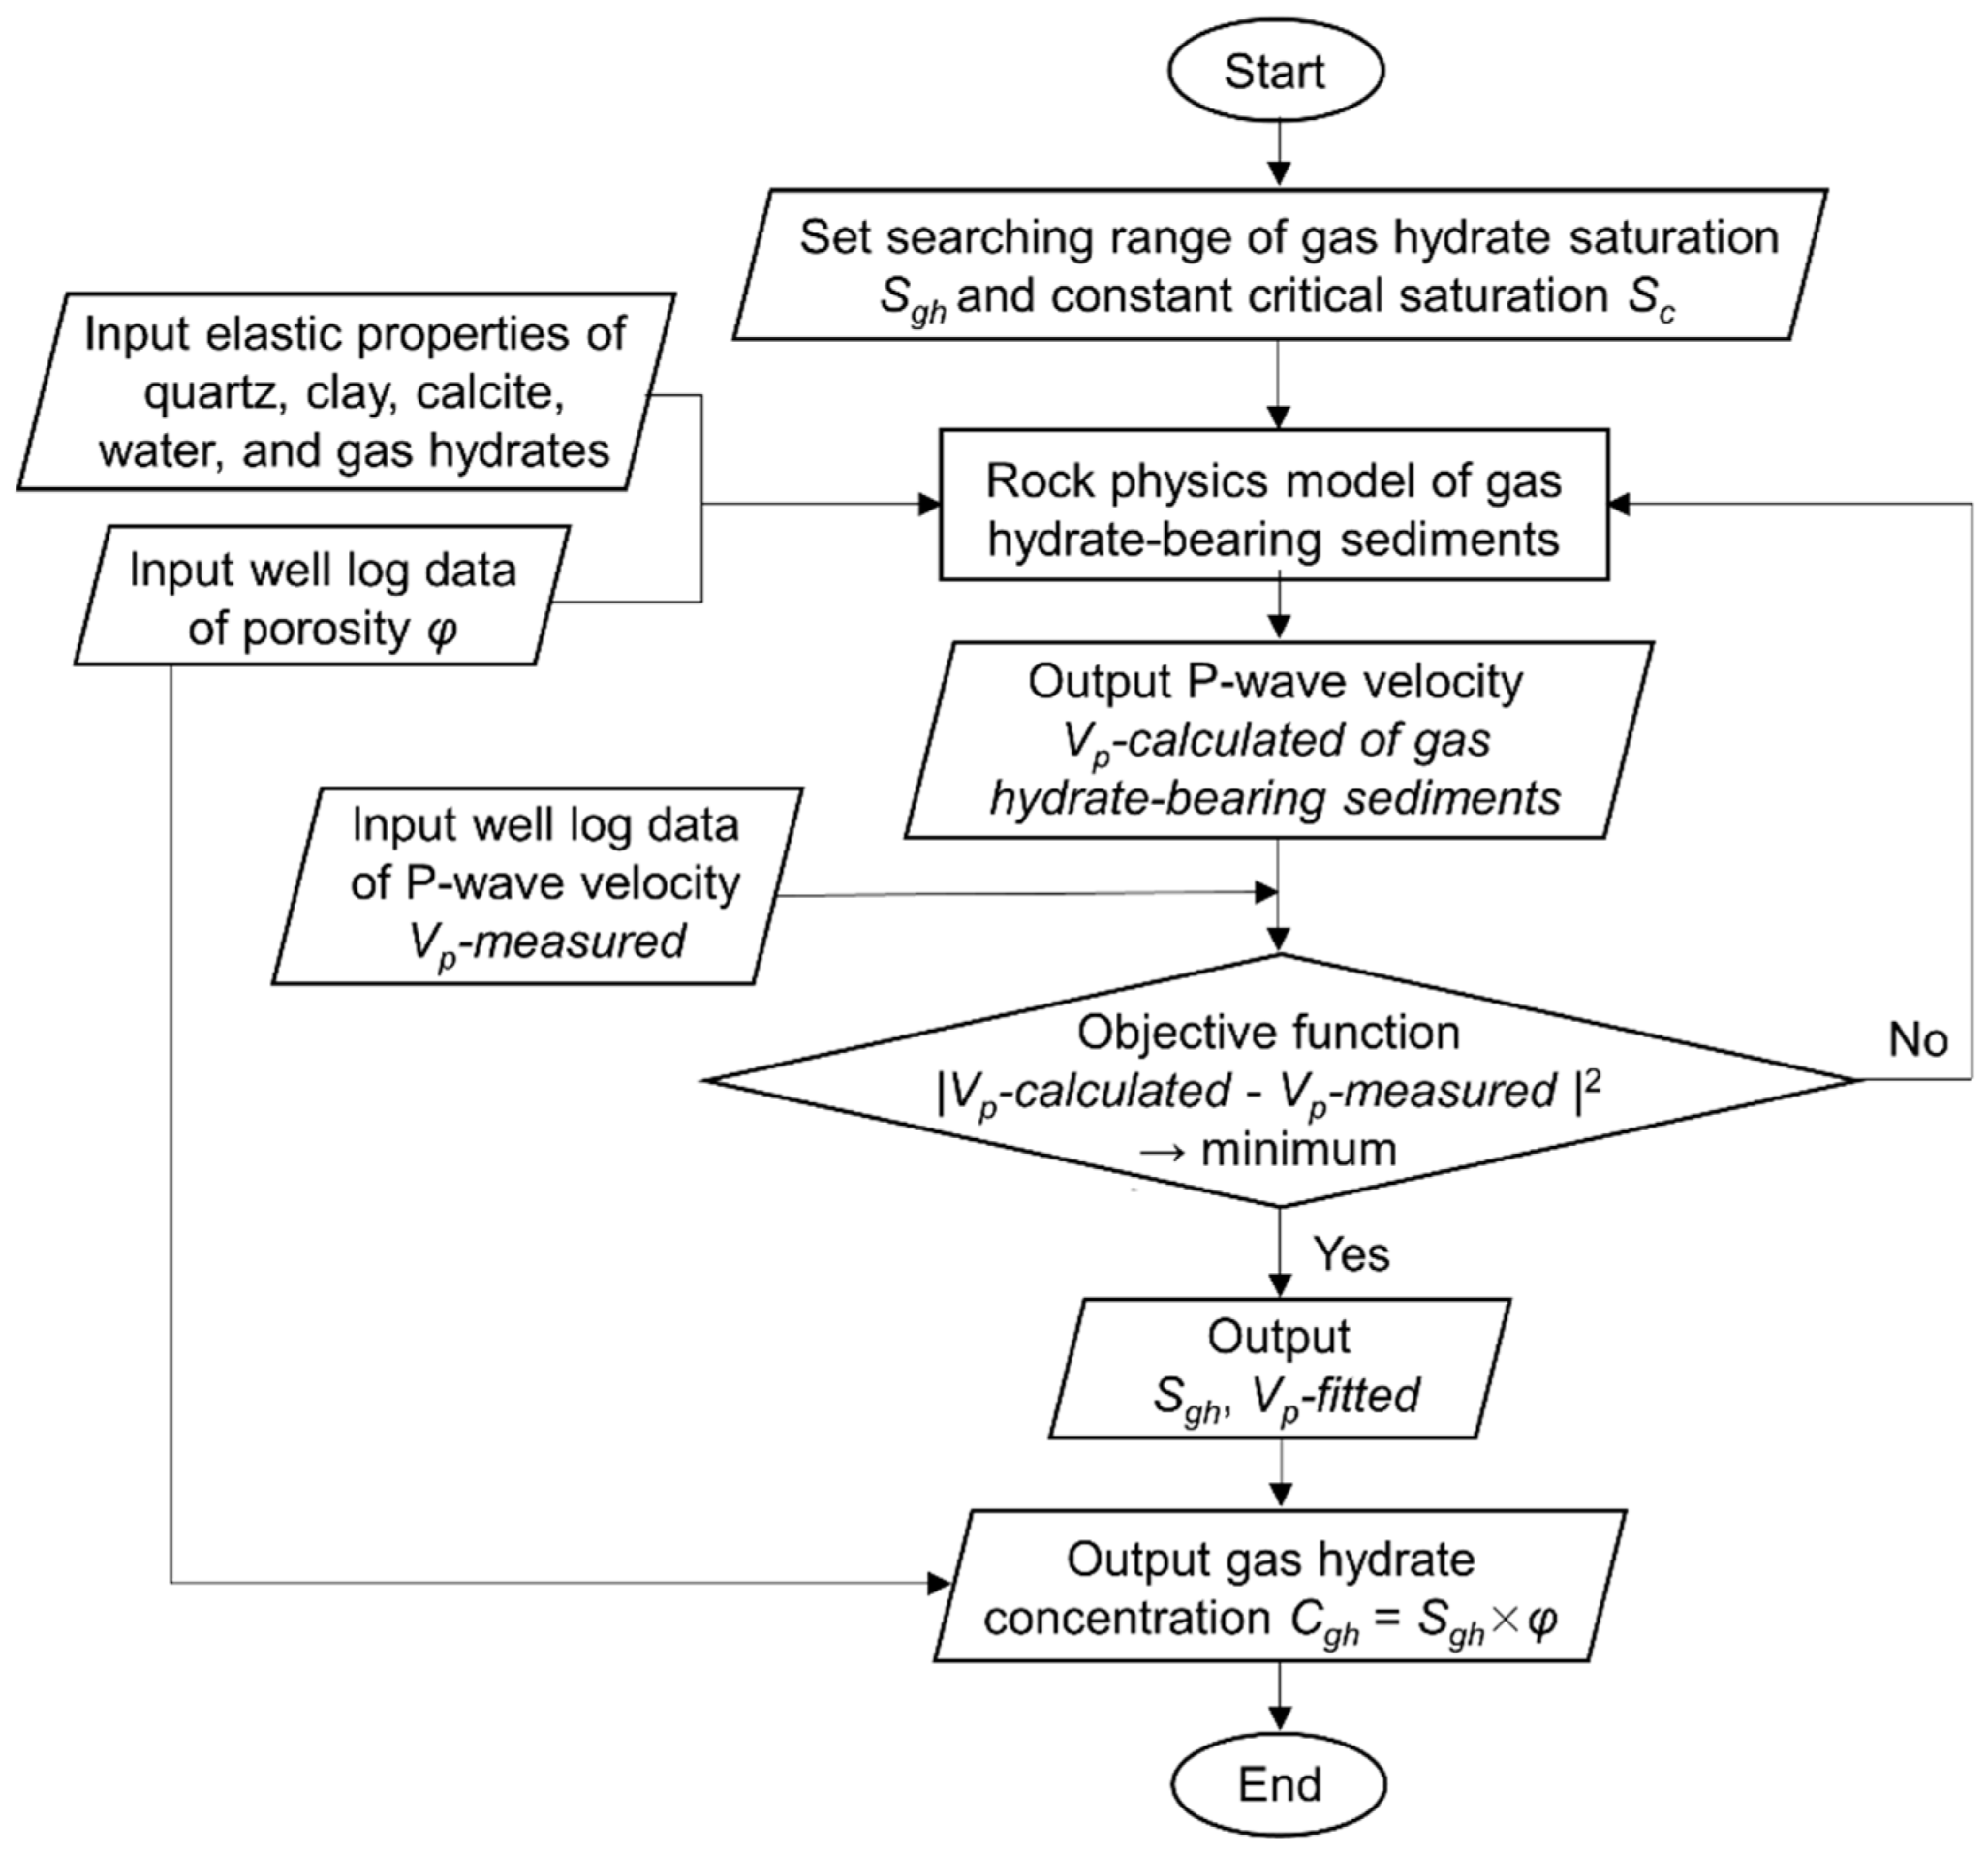
2.2. Model-Based Methodology for the Estimation of the Gas Hydrate Concentration from Well-Log Data

Using well-log data, we proposed a quantitative method to estimate gas hydrate saturation (Sgh) and concentration (Cgh) according to the flowchart given in Figure 3. The core of the method is the RPM for the gas hydrate sediments established in Figure 2. At each depth sampling interval in a wellbore, the values of P-wave velocity (VP-calculated) were computed with the RPM from volumetric fractions of minerals and porosity for the preset searching range of Sgh and assumed critical gas hydrate saturation (Sc). Subsequently, the objective function compares VP-calculated with the measured P-wave log data (VP-measured) to find a specific Sgh value that leads to the best matches between VP-calculated and VP-measured. The estimated Sgh and fitted P-wave velocity (VP-fitted) represent the outputs at this depth, and Cgh can be estimated by Cgh = Sgh × φ. By repeating this procedure for each depth, the plots of Sgh and Cgh can be produced for the depth interval of interest.

3. Results

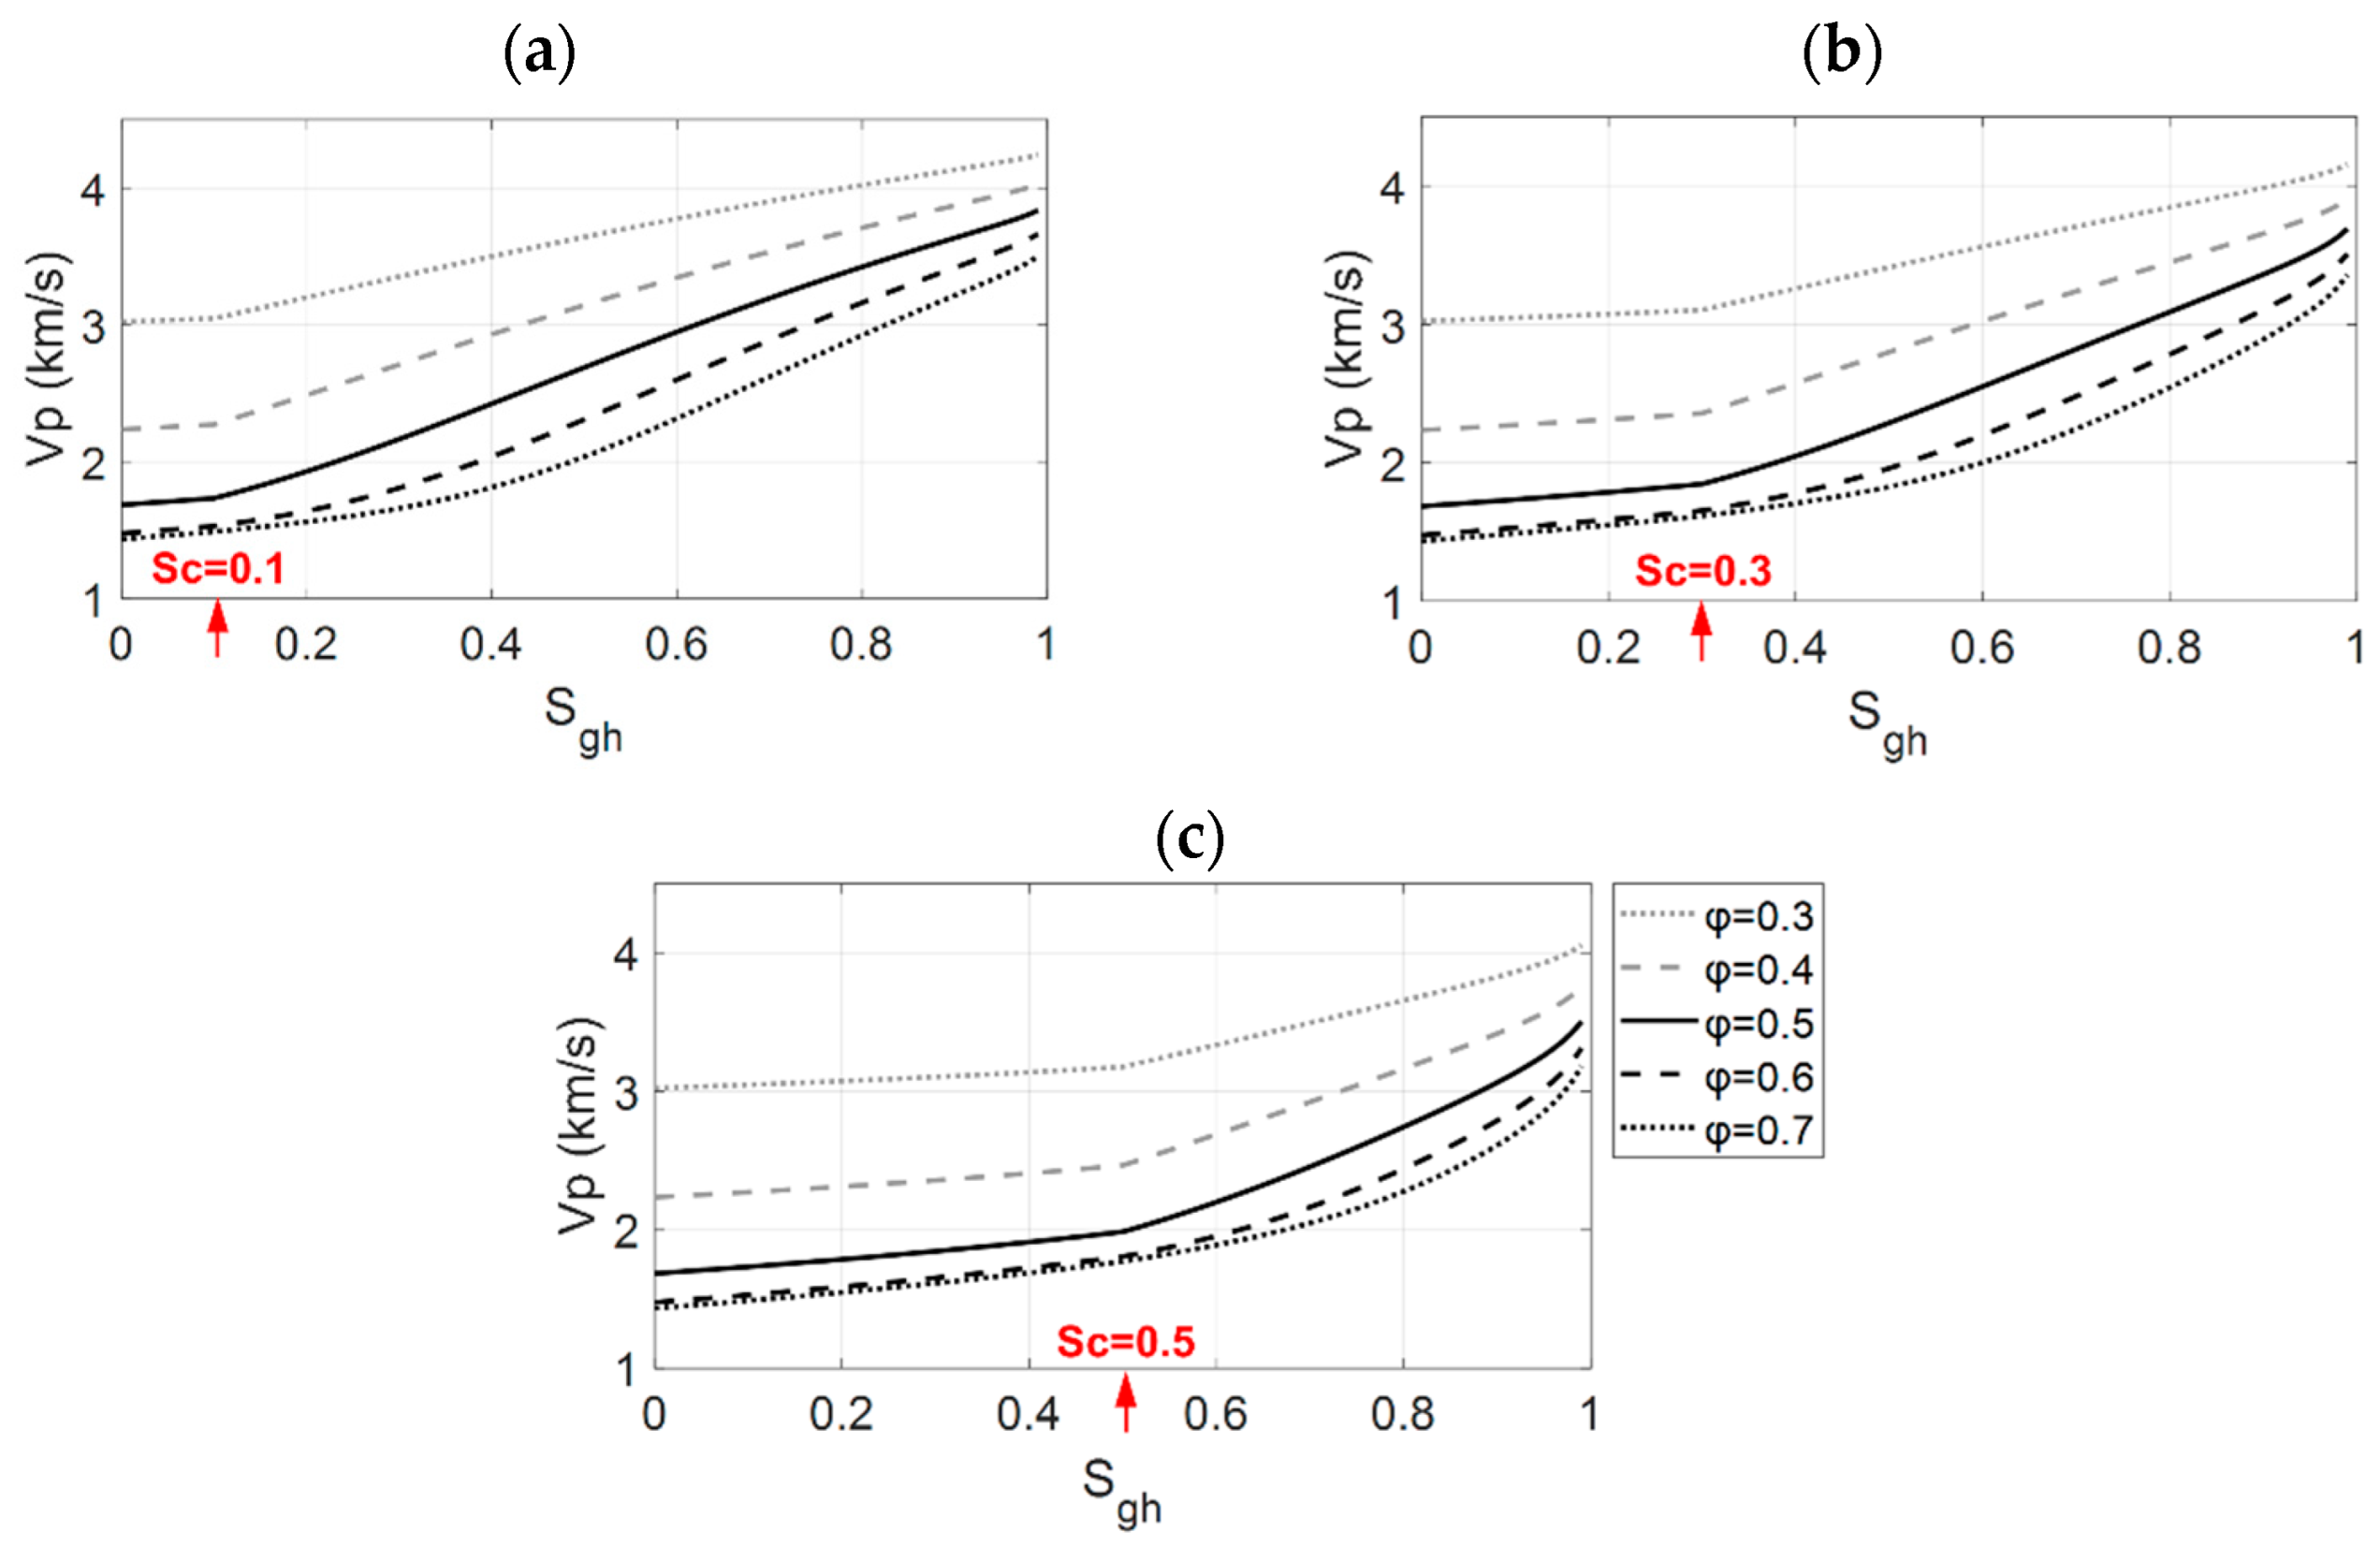
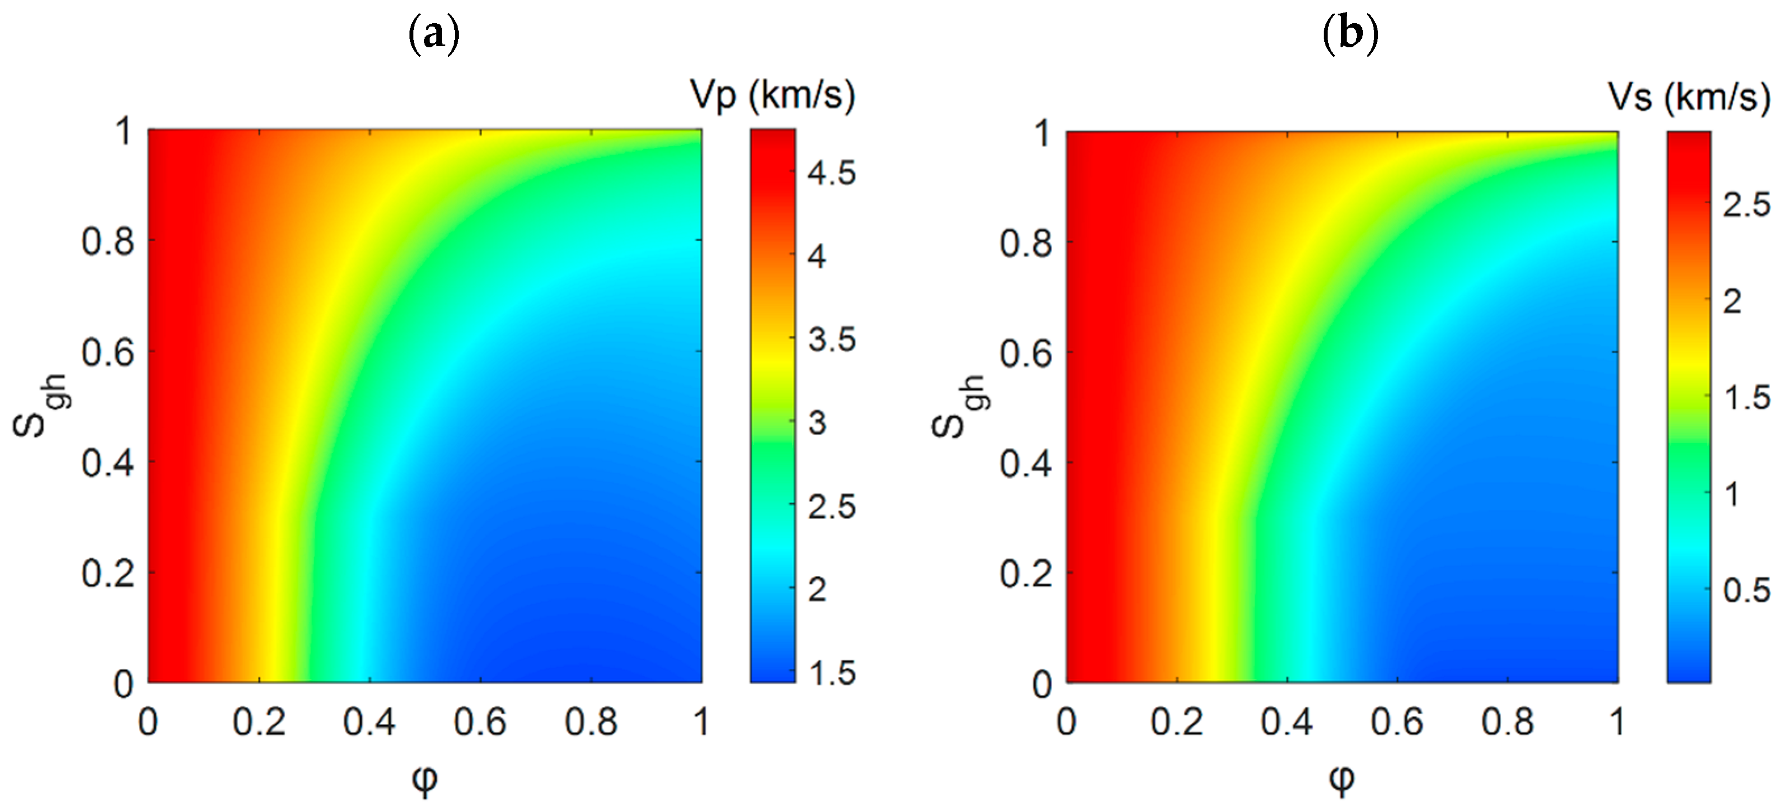
3.1. Modeling Analyses of Wave Velocities of Marine Sediments Associated with Gas Hydrates

Based on the constructed RPM presented in Figure 2, we analyzed the speed of passage of the wave through marine sediments associated with gas hydrate saturations. Figure 4 and Figure 5 illustrate the variations of P- and S-wave velocities (i.e., VP and VS) in terms of Sgh for three values of Sc (i.e., 0.1, 0.3, and 0.5). The Sc value is referred to the critical status where the gas hydrates become part of the dry sediment frame.
According to the plotted results in Figure 4, an increase in Sgh remarkably elevates the VP of sediments, with VP increasing more rapidly in the case of SghSc for the selected values of rock porosity (φ). As presented in Figure 1, this can be interpreted that gas hydrates begin to become part of the solid component of sediments for the saturation higher than Sc. In this case, the presence of the gas hydrates enhances the rigidity of the dry sediment frame; thus, it alters the elastic moduli of sediments more significantly than in the case where only the gas hydrates exist in the pores. For a given porosity, Figure 5 reveals that the plots of vs. exhibit variation trends similar to the plots of VP for various values of Sgh and Sc. However, as demonstrated in Figure 5, the sediments were also modeled to have non-zero VS, even for relatively high porosity (φ) and lower gas hydrate saturation (Sgh). Specifically, the sediments exhibit non-zero vs. that at a porosity higher than the critical value (~0.4). The obtained results are consistent with the investigations of Dvorkin et al. [12] and Helgerud et al. [15] for shallow marine sediments.
Because the gas hydrate concentration is simultaneously controlled by gas hydrate saturation (Sgh) and rock porosity (φ), we modeled VP and vs. for continuously varying Sgh and φ, as shown in Figure 6. For this purpose, the value of Sc was set equal to 0.3. For given ranges of Sgh and φ of the marine sediments containing gas hydrates, Figure 6 provides some insights for a better understanding of anomaly responses of the sediments in terms of elastic properties. In particular, for φ lower than ~0.35, VP and vs. present fewer variations in terms of Sgh. This fact reveals that sufficient anomaly responses of elastic properties for detecting gas hydrates should be expected for the sediments with relatively higher φ.

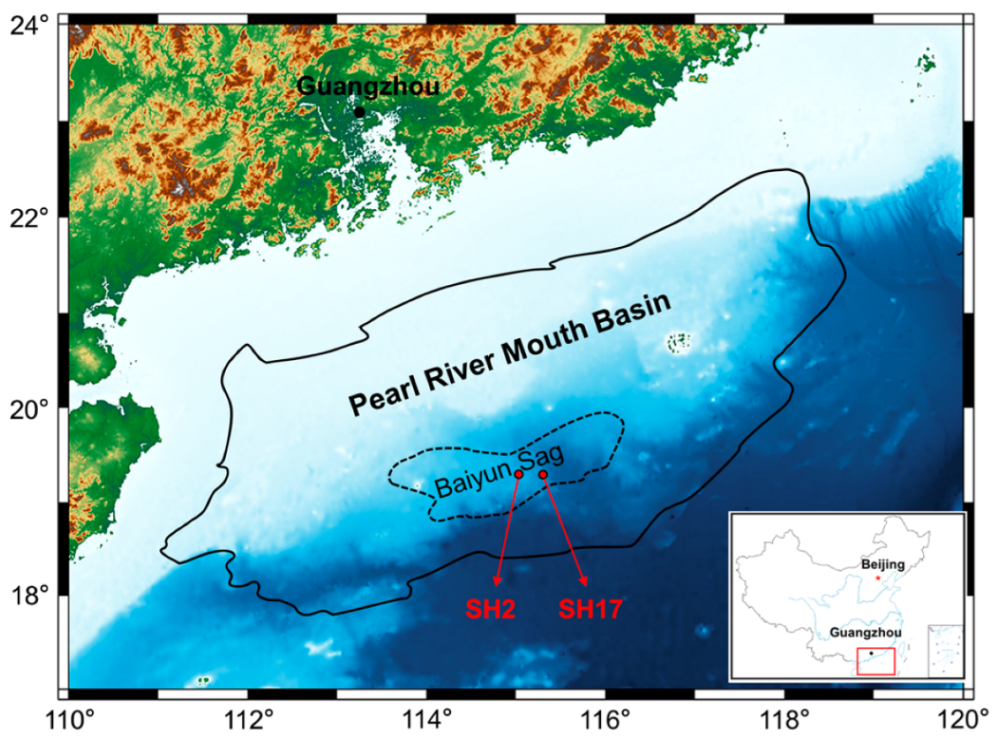
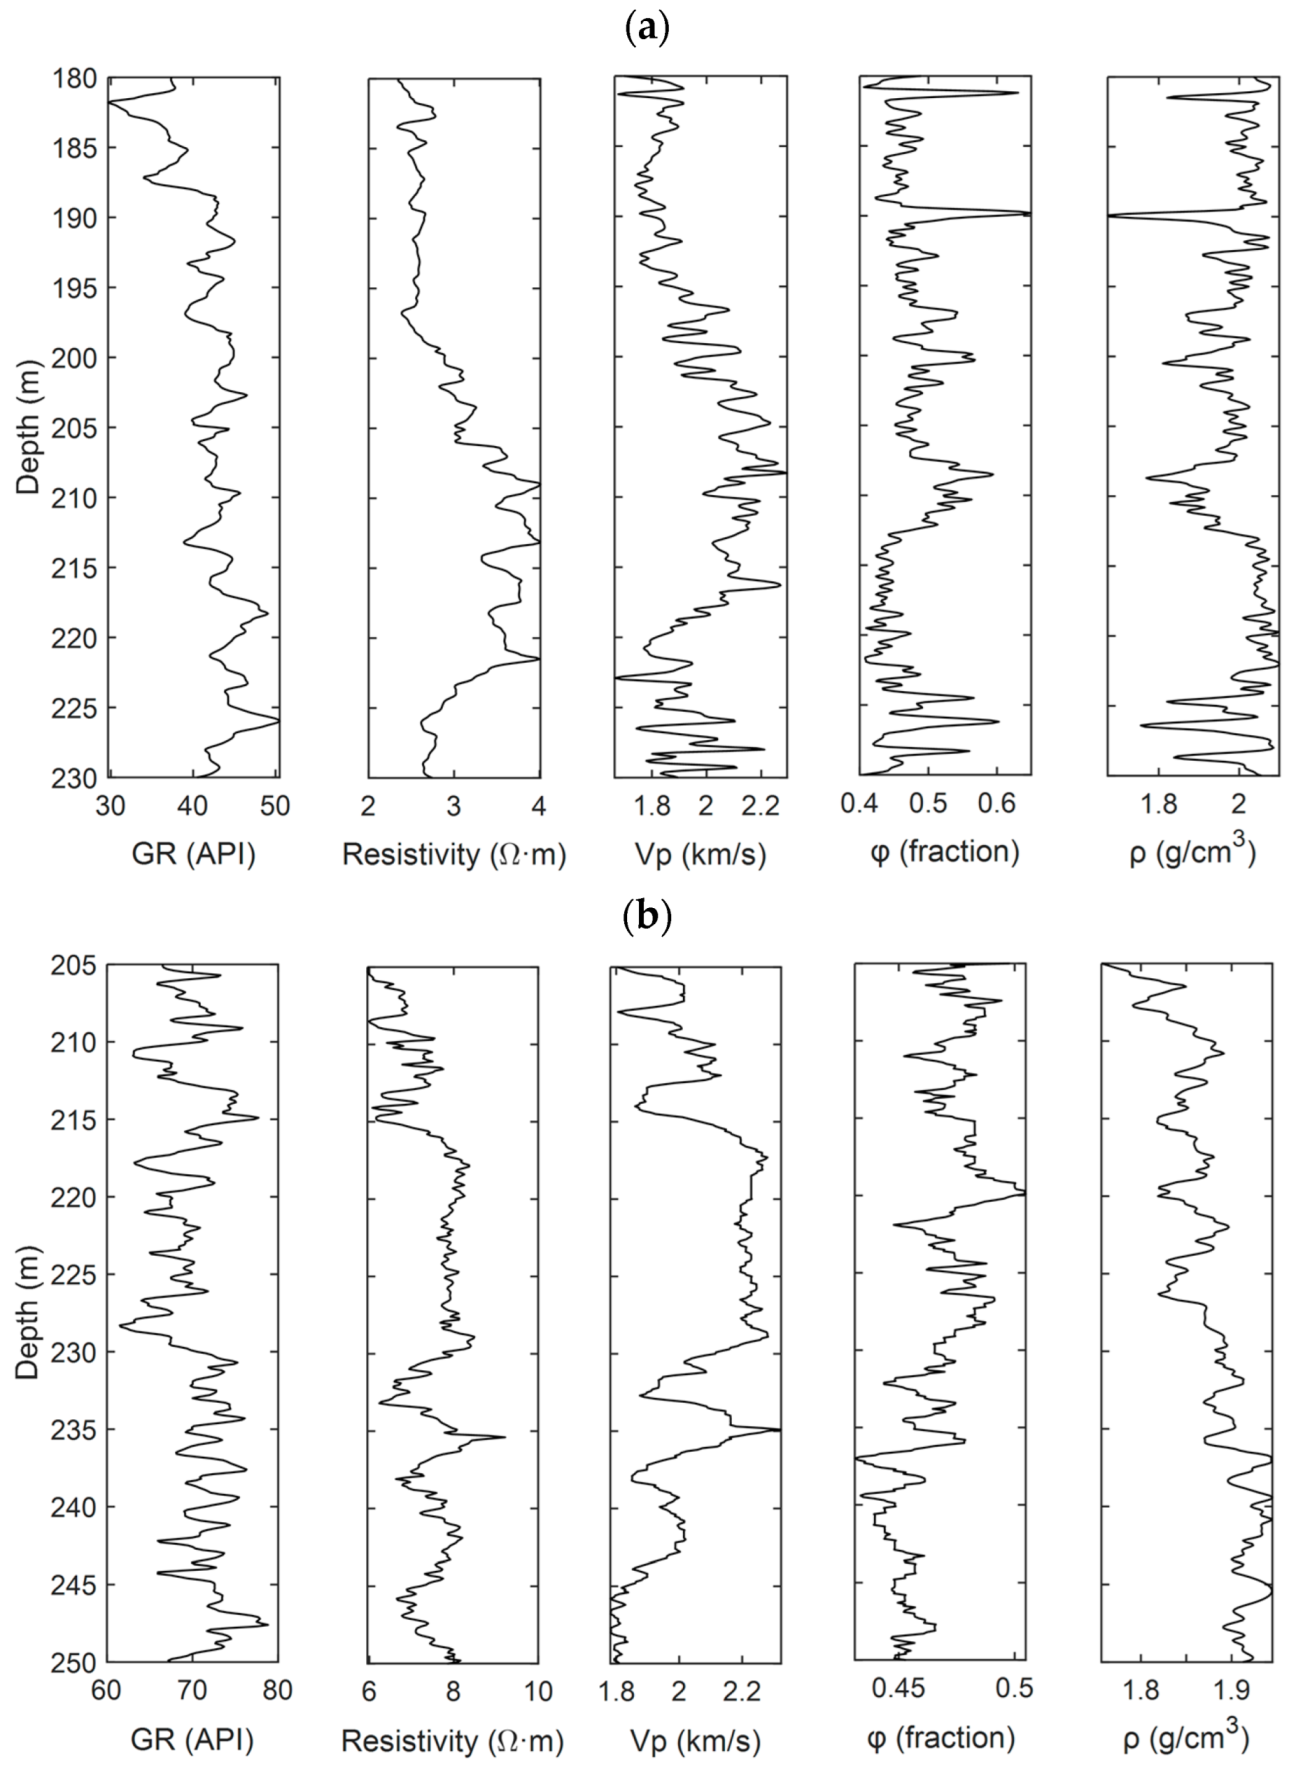
3.2. Log Data of Marine Sediments in the Shenhu Area in the Northern Part of the South China Sea

We applied the proposed methods to the well-log data from the Shenhu area in the northern part of the South China Sea. Located in the Baiyun Sag of the Pearl River Mouth Basin (see Figure 7), the Shenhu area covers an area of more than 20,000 km2 with a water depth of 200 to 2000 m [26]. It is located between the continental shelf and the continental slope, and the seabed slopes to the southwest. The results of gas hydrate drilling show that the seafloor temperature in the Shenhu area is about 4 °C, and the geothermal gradient is 44–67 °C/km [27,28]. The gravity flow on the continental slope leads to an increase in the sedimentation rate and is conducive to forming gas hydrate [29,30]. The primary sources of the gravity flow come from the sediments characterized as the facies of high porosity delta front, subaqueous fan, channel, and slump deposits [31]. The gas hydrates are chiefly accumulated in the unconsolidated mudstone silt of the late Miocene Pliocene sediments [32,33]. The gas-hydrate distribution has a general depth range from about 150 to 400 m below the sea floor (mbsf) [34,35].
In the regional geological map of the study area (see Figure 7), the locations of the two wells, SH2 and SH17, are indicated. Figure 8 illustrates well logs from the aforementioned two wells, including the curves of gamma-ray, resistivity, P-wave velocity (VP), porosity (φ), and bulk density (ρ), respectively. The interpreted gas hydrate-bearing intervals extend from approximately 190−230 mbsf in the SH2 well and approximately 205−245 mbsf in the SH17 well. The resistivity logging data provide qualitative estimates of the gas hydrate saturation, with higher resistivity values indicating more gas hydrate accumulated in sediments. As indicated by gamma-ray logging, the gas hydrate formations in the two wells exhibit lithological inhomogeneity, with the gas hydrate interval in the SH17 well presenting more heterogeneity than that in the SH2 well. The plot of VP reveals that the P-wave velocity is positively correlated with resistivity in the two wells, indicating higher elastic wave velocities in the presence of gas hydrates. The plot of the porosity represents the volumetric fraction of the pores saturated with gas hydrates and water, and the porosity is negatively correlated with ρ.

3.3. Modeling P-Wave Velocity of Marine Sediments Containing Gas Hydrates

As shown in Figure 9, the impact of gas hydrates on the VP of the marine sediments was investigated. A series of VP curves for constant Sgh values were modeled and plotted for the two wells based on the proposed model (schematically displayed in Figure 2). The core sample analyses suggest that the solid minerals of the marine formations in the two wells predominantly comprise quartz, clay, and calcite. The volume percentages of quartz, clay, and calcite were assumed to be 60%, 35%, and 5%, respectively, based on considerations of Liu et al. [36]. The porosity was obtained from Figure 8. The elastic moduli of constituents are given in Table 1. The value of Sc was adjusted to be 0.1 and 0.2 for the SH2 and SH17 wells, respectively. Here, Sc values were empirically determined to give more rational predictions of Sgh. The influence of Sc on Sgh estimation is discussed in detail in Section 3.5.
In Figure 9a, a nomogram of modeled VP curves for various levels of Sgh suggests that the presence of gas hydrates can notably elevate VP of the marine sediments. Moreover, in Figure 9a, the modeled VP at constant zero-Sgh in the SH2 well acts as a baseline to infer the depth interval with relatively higher gas hydrate content. According to Figure 9a, the constant zero-Sgh line intersects the measured VP log at depths ~190 and ~220 mbsf, respectively. The elevated VP values within this depth interval suggest the presence of gas hydrates. The measured VP values lie between the constant 0 and 0.4 Sgh lines and are consistent with the core measurements of gas hydrate saturation presented in Figure 9b.
Figure 9c,d reveals similar results obtained for the SH17 well. The VP curves at constant 0 and 0.2 Sgh can be regarded as the baselines to indicate gas hydrate accumulation for the depth intervals below and above ~236 mbsf. In Figure 9c, the constant 0.4 Sgh line perfectly agrees with the core measurement results in Figure 9d, validating our modeling method presented in Figure 2. However, the VP modeled for the constant 0.4 Sgh (see Figure 9c) is much higher than the measured results at the lower interval centered around 240 ~mbsf (see Figure 9d). As mentioned in the analysis of Figure 8, this discrepancy may be relevant to the lithological heterogeneity indicated by the gamma-ray logging.
Figure 10a,b illustrates the modeled VP of the marine sediments in the SH2 and SH17 wells, varying with Sgh for different φ. The core measured results in Figure 9 were color-coded by φ and overlaid in the plots with colorful dots. Similar to the case for modeling VP in Figure 9a,c, Sc values of 0.1 and 0.2 in Figure 10a,b can appropriately interpret core measurement data.

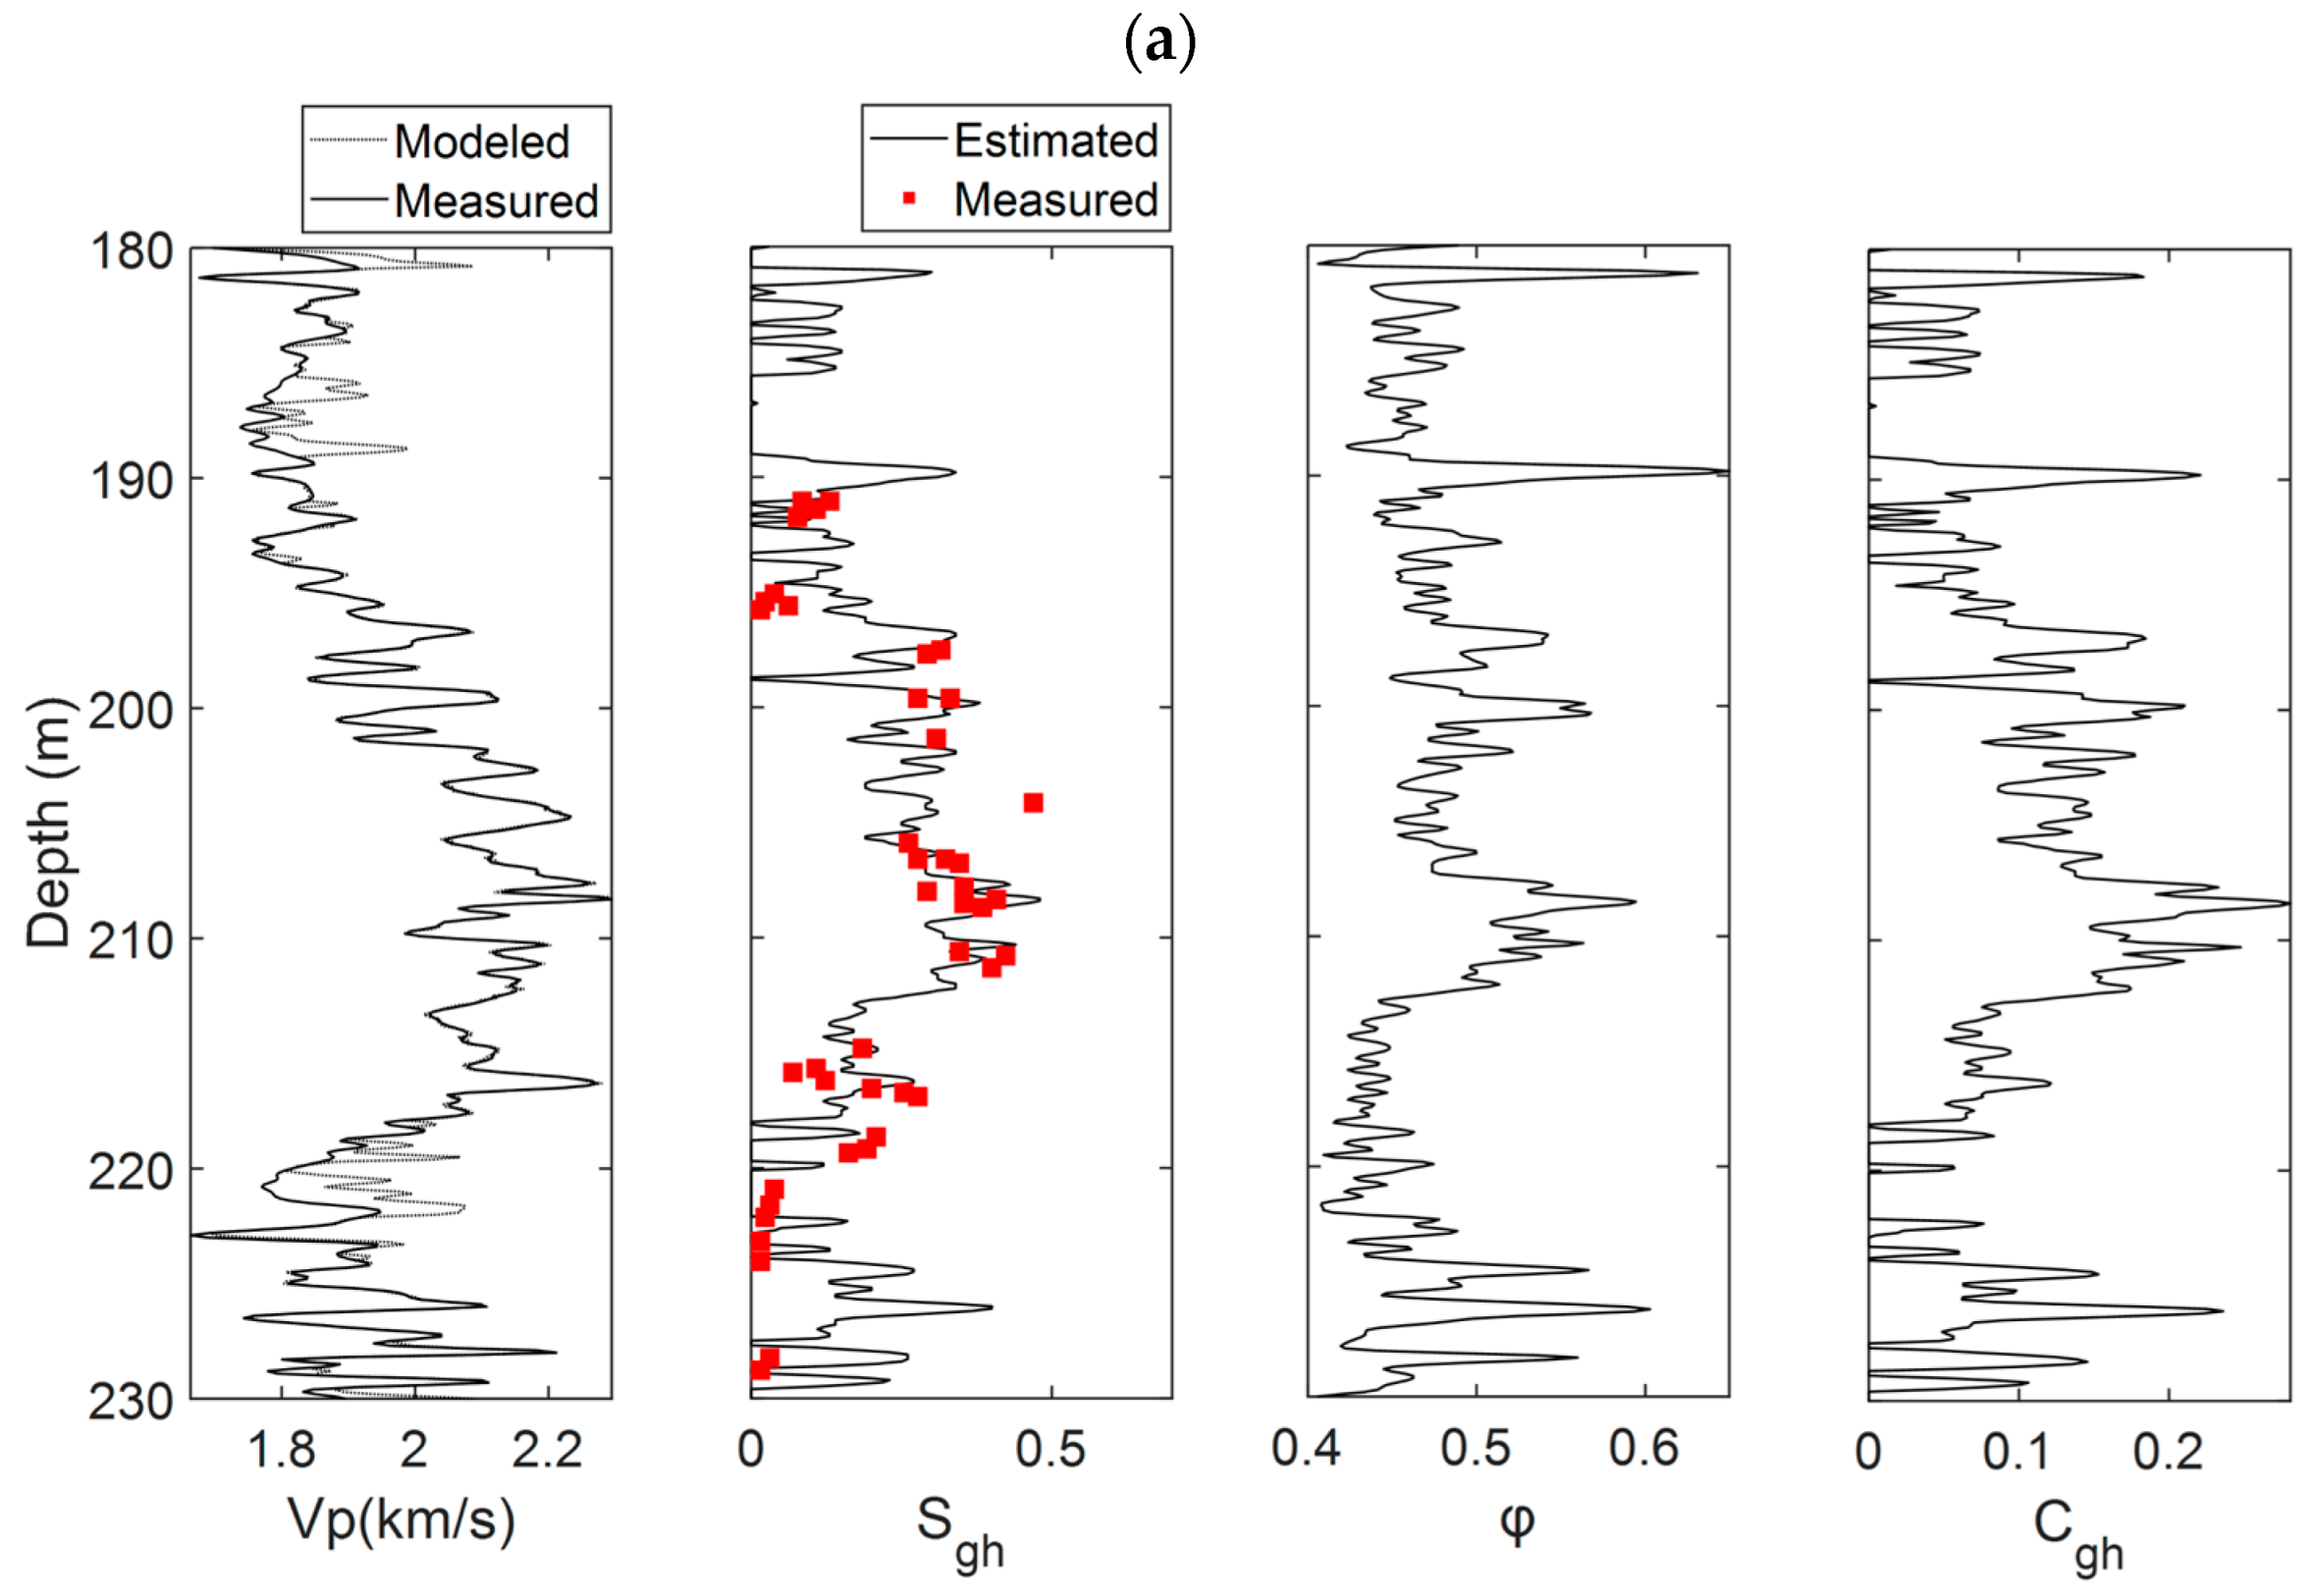
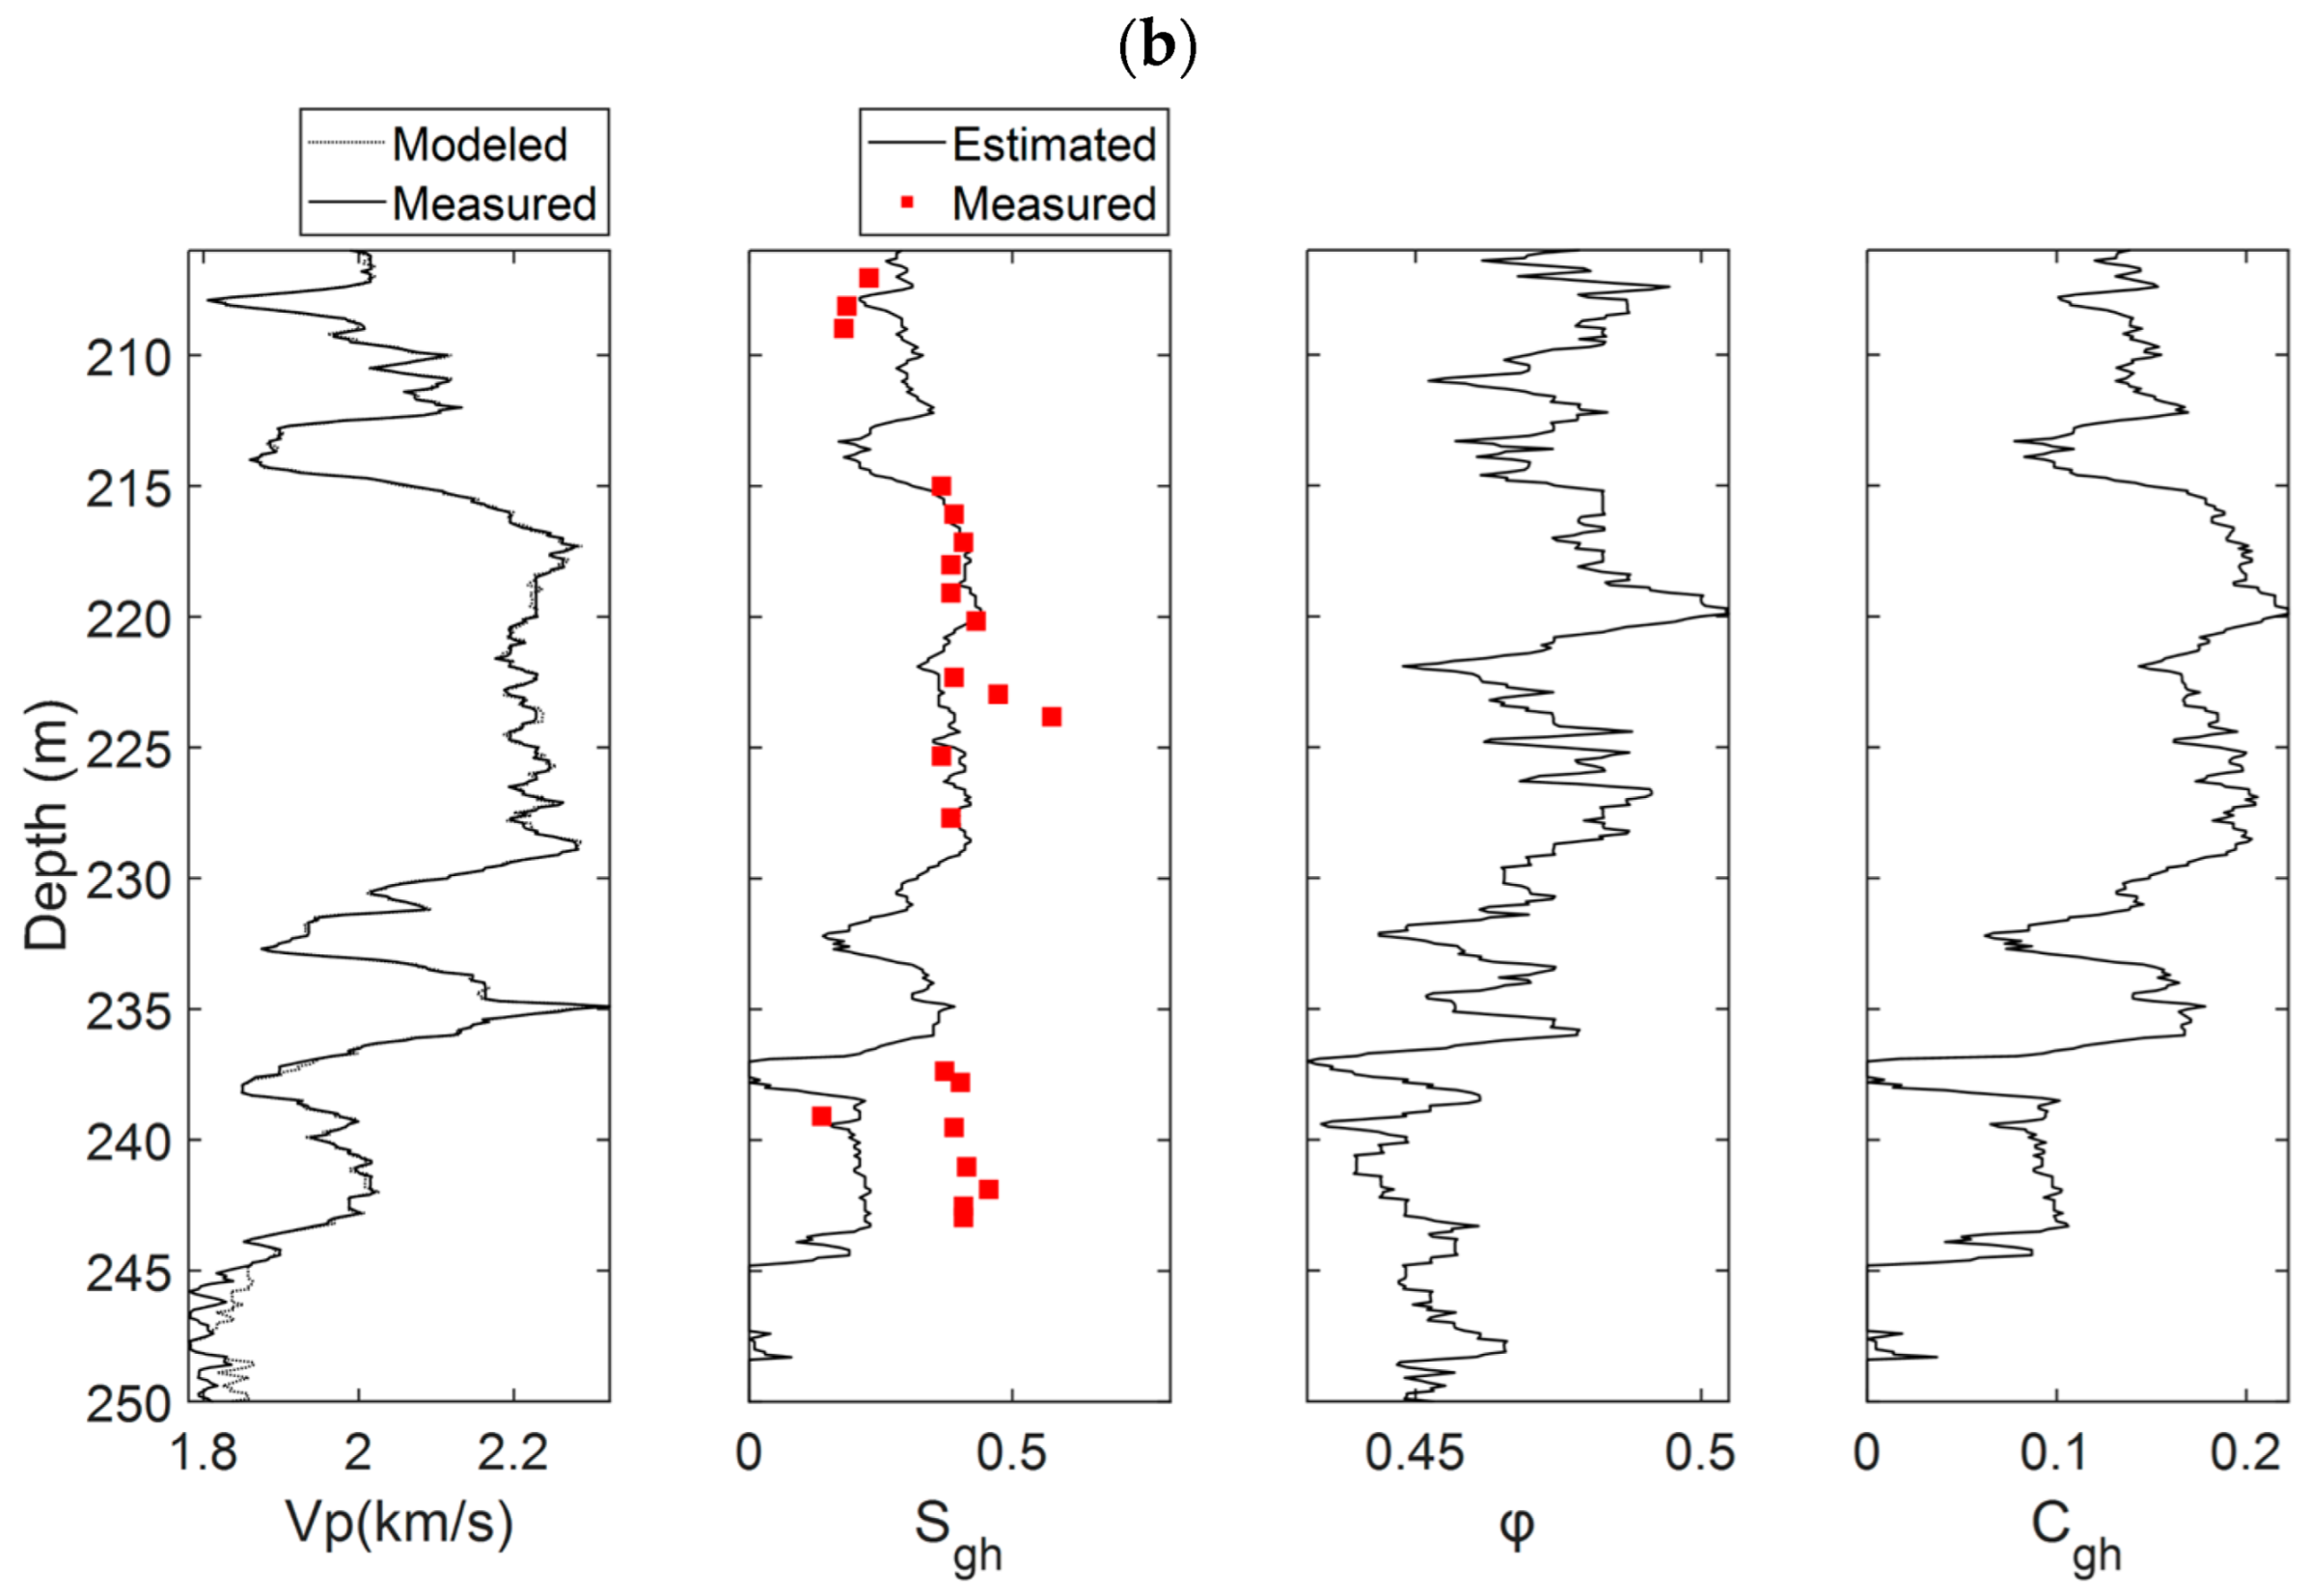
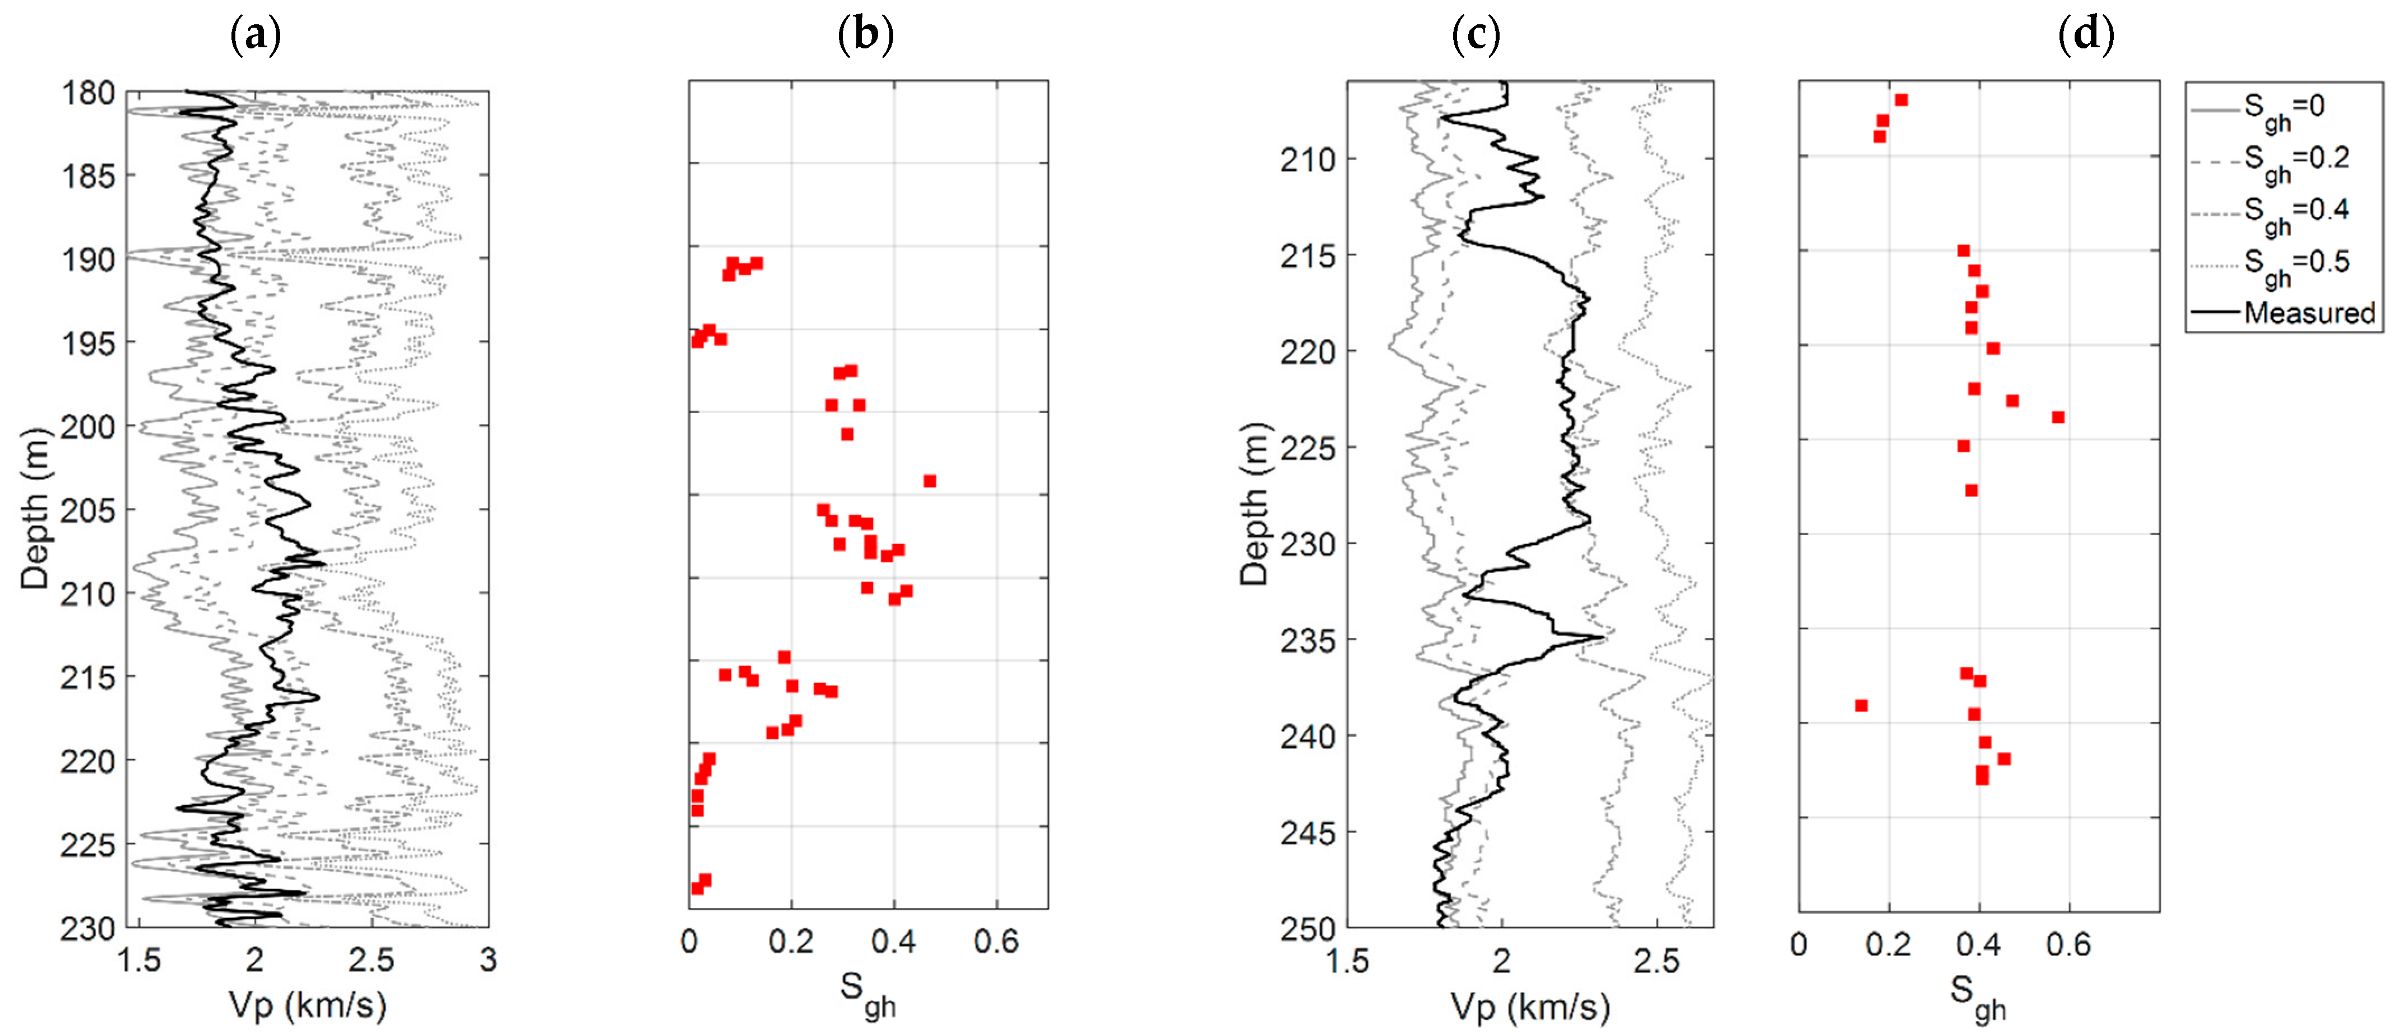
3.4. Estimation of the Gas Hydrate Concentration from the P-Wave Velocity Log

The modeling procedure in Section 3.3 somehow validated our proposed method in accounting for the P-wave velocity of sediments for varied gas hydrate saturation. Subsequently, using the method described in Figure 3, we can conduct the quantitative prediction of Sgh from well-log data of SH2 and SH17 wells, with estimated results presented in Figure 11a,b, respectively. The rock properties used here are the same as those in Section 3.3.
In Figure 11a, concerning the plotted results associated with the SH2 well, the modeled VP exhibits a good agreement with the measured VP log data, and the estimated Sgh curve almost perfectly matches the Sgh values measured from the core samples. Then, the gas hydrate concentration (Cgh) was evaluated by using Cgh = Sgh × φ. The same results were obtained for the SH17 well, as illustrated in Figure 11b. Well-fitted VP and a good match between estimated and measured Sgh validate our proposed methodology for accurate estimations of the gas hydrate concentration in marine sediments.
However, several discrepancies between the estimated Sgh results and the corresponding measured values can be observed at ~204 mbsf in the SH2 well (see Figure 11a), around ~223 mbsf, and centered at ~243 mbsf in the SH17 well (see Figure 11b). A source of such deviations may come from the heterogeneity in lithology, as explained in Section 3.2. Another reason for such discrepancy may be associated with the variation in Sc, which is discussed in the following Section 3.5.

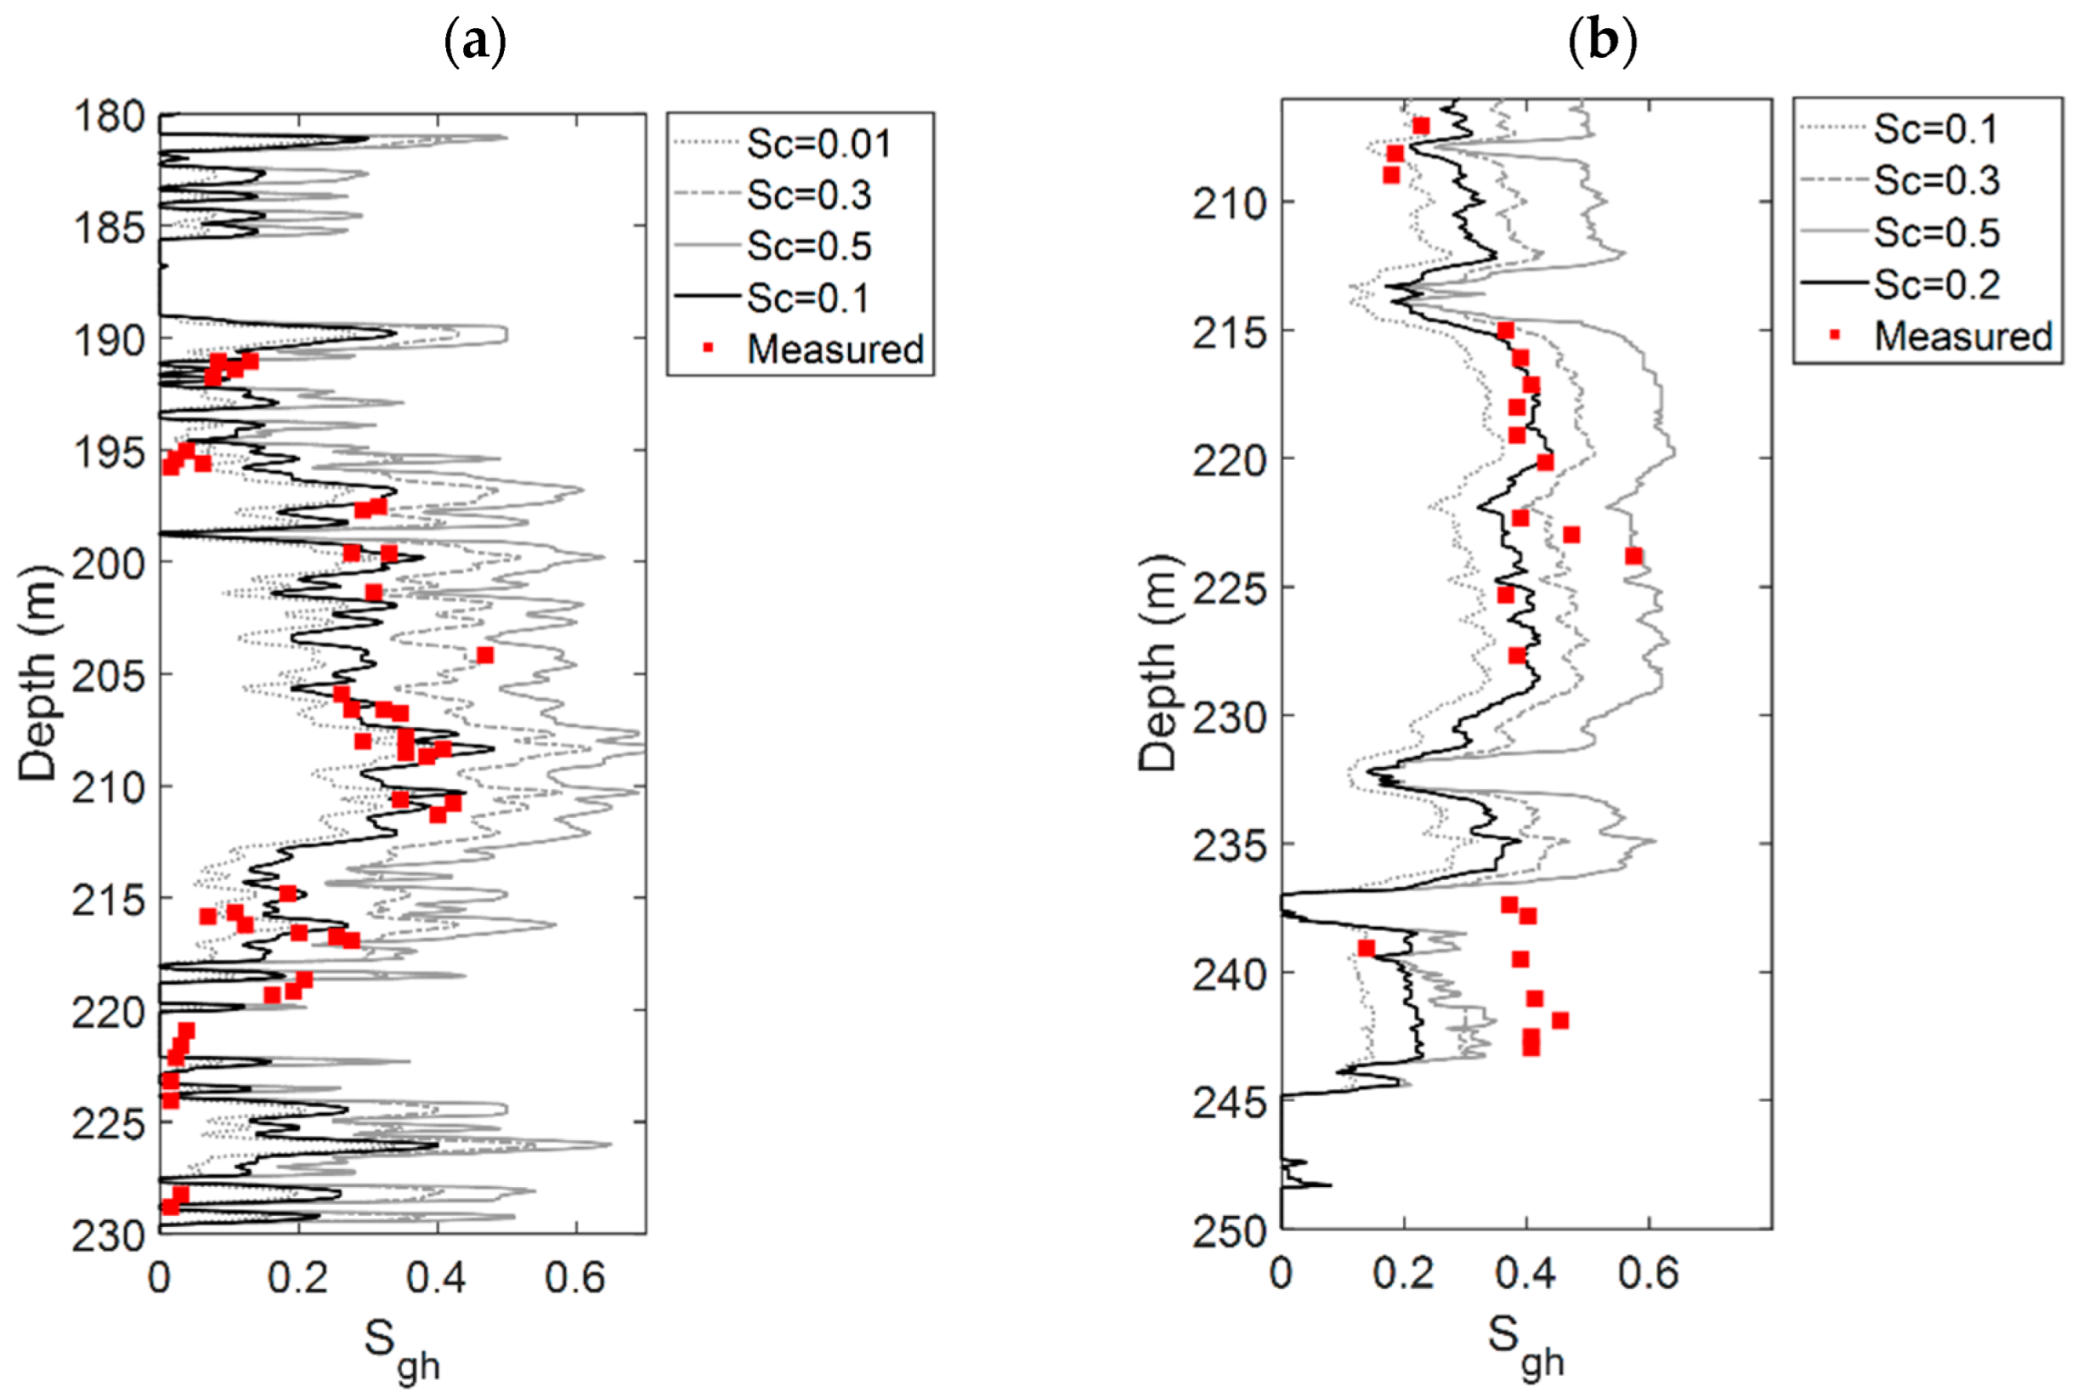
3.5. Influence of the Sc Value on Sgh Estimation

Figure 12 illustrates the impact of different prescribed Sc values on Sgh estimation. The Sc values of 0.1 and 0.2 can provide rational estimations of Sgh for the SH2 and SH17 wells, as mentioned in Section 3.3 and Section 3.4. However, several local deviations of the estimated curves from their corresponding core measured results, such as those at ~204 mbsf in the SH2 well, around ~223 mbsf, and centered at ~243 mbsf in the SH17 well, can be explained by the growth of Sc values. The obtained results indicate that the critical status described in Figure 1 may vary with burial depths in the gas hydrate formations. Note that the predicted Sgh values in an interval centered at ~243 mbsf in the SH17 well are still much lower than the core measurement results, even for a relatively higher Sc (i.e., Sc = 0.5). As discussed in Section 3.4, lithological heterogeneity may also be responsible for such discrepancies.
In the model-based workflow demonstrated in Figure 3, Sc can be regarded as another parameter ready to be predicted besides Sgh. Mathematically, however, it is impossible to reliably estimate two unknowns (Sgh and Sc) from the objective function involving only one source of information (VP). Simultaneous estimations of Sgh and Sc could be feasible in the case of the availability of the shear-wave velocity for wellbores.

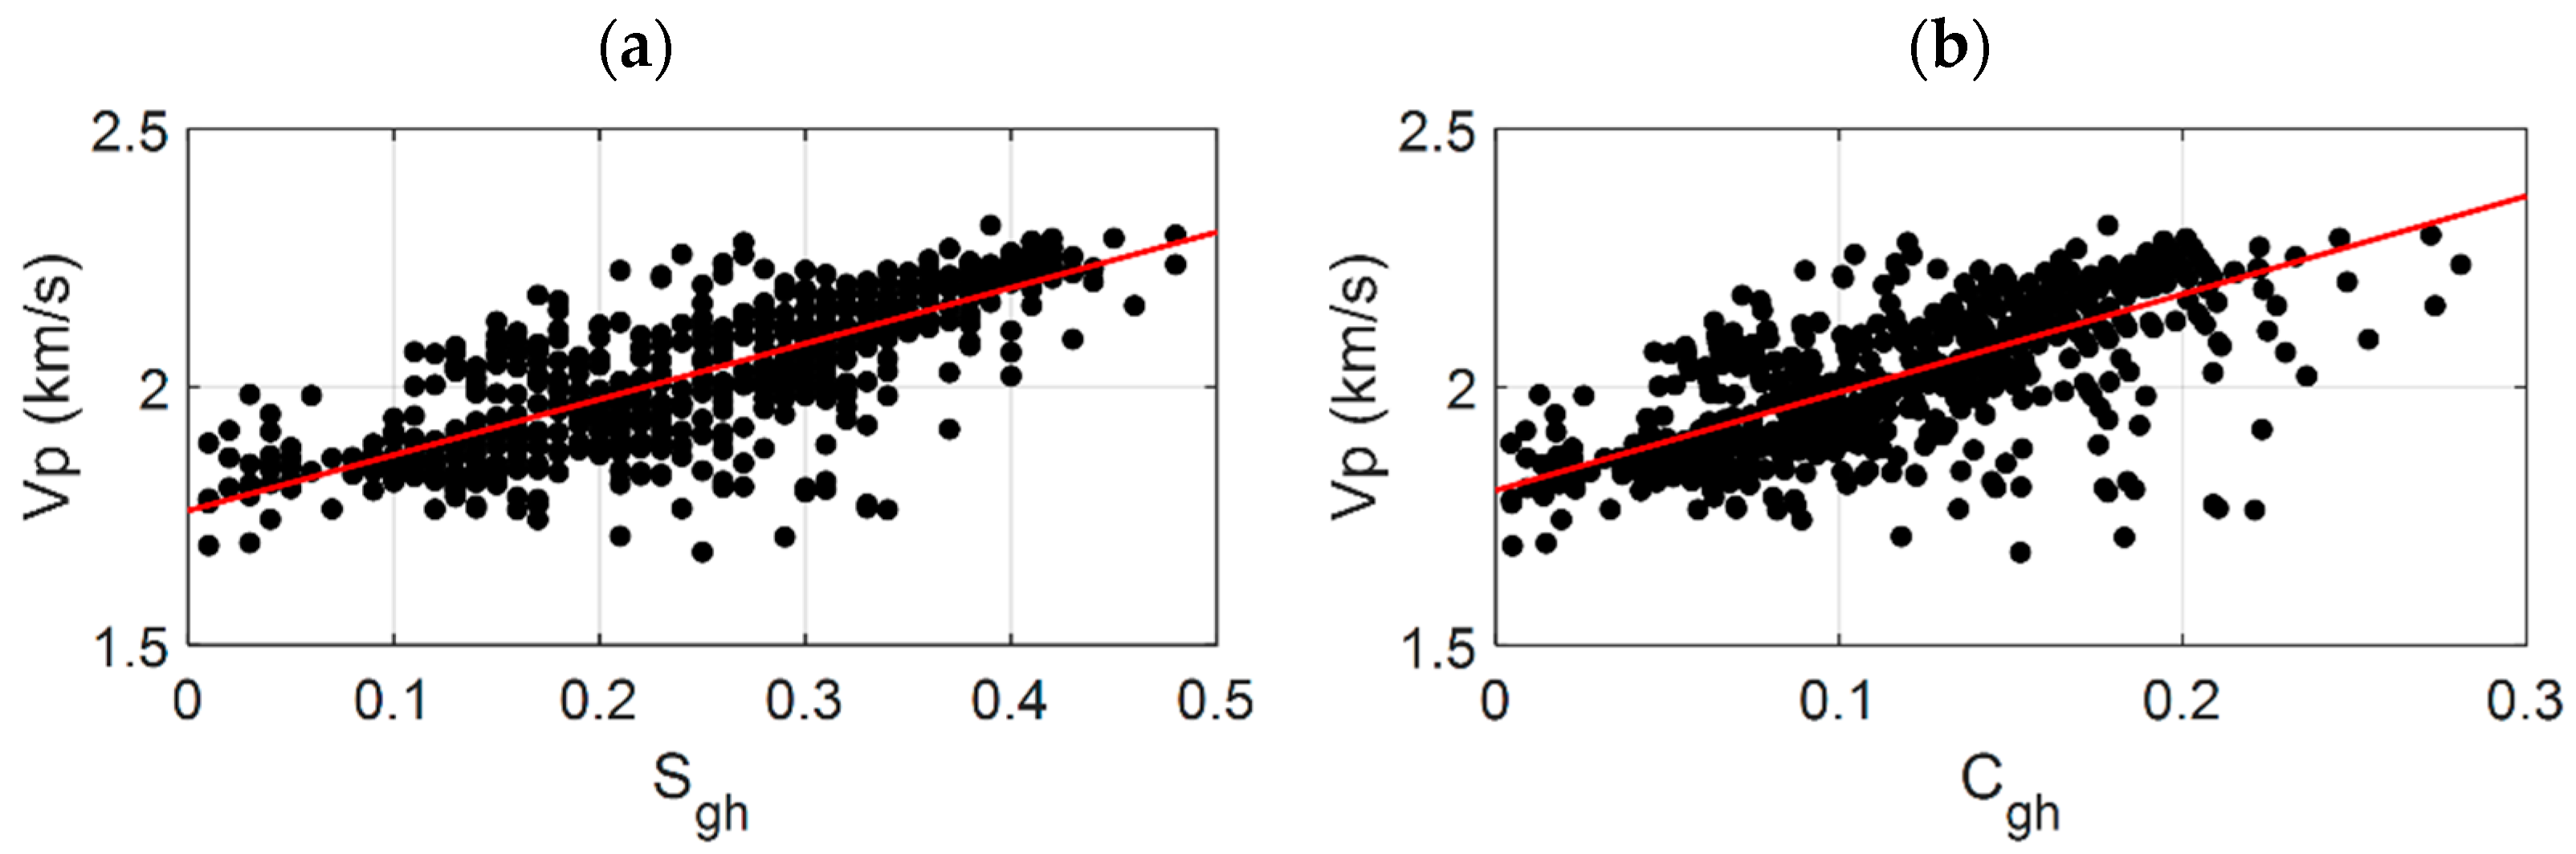
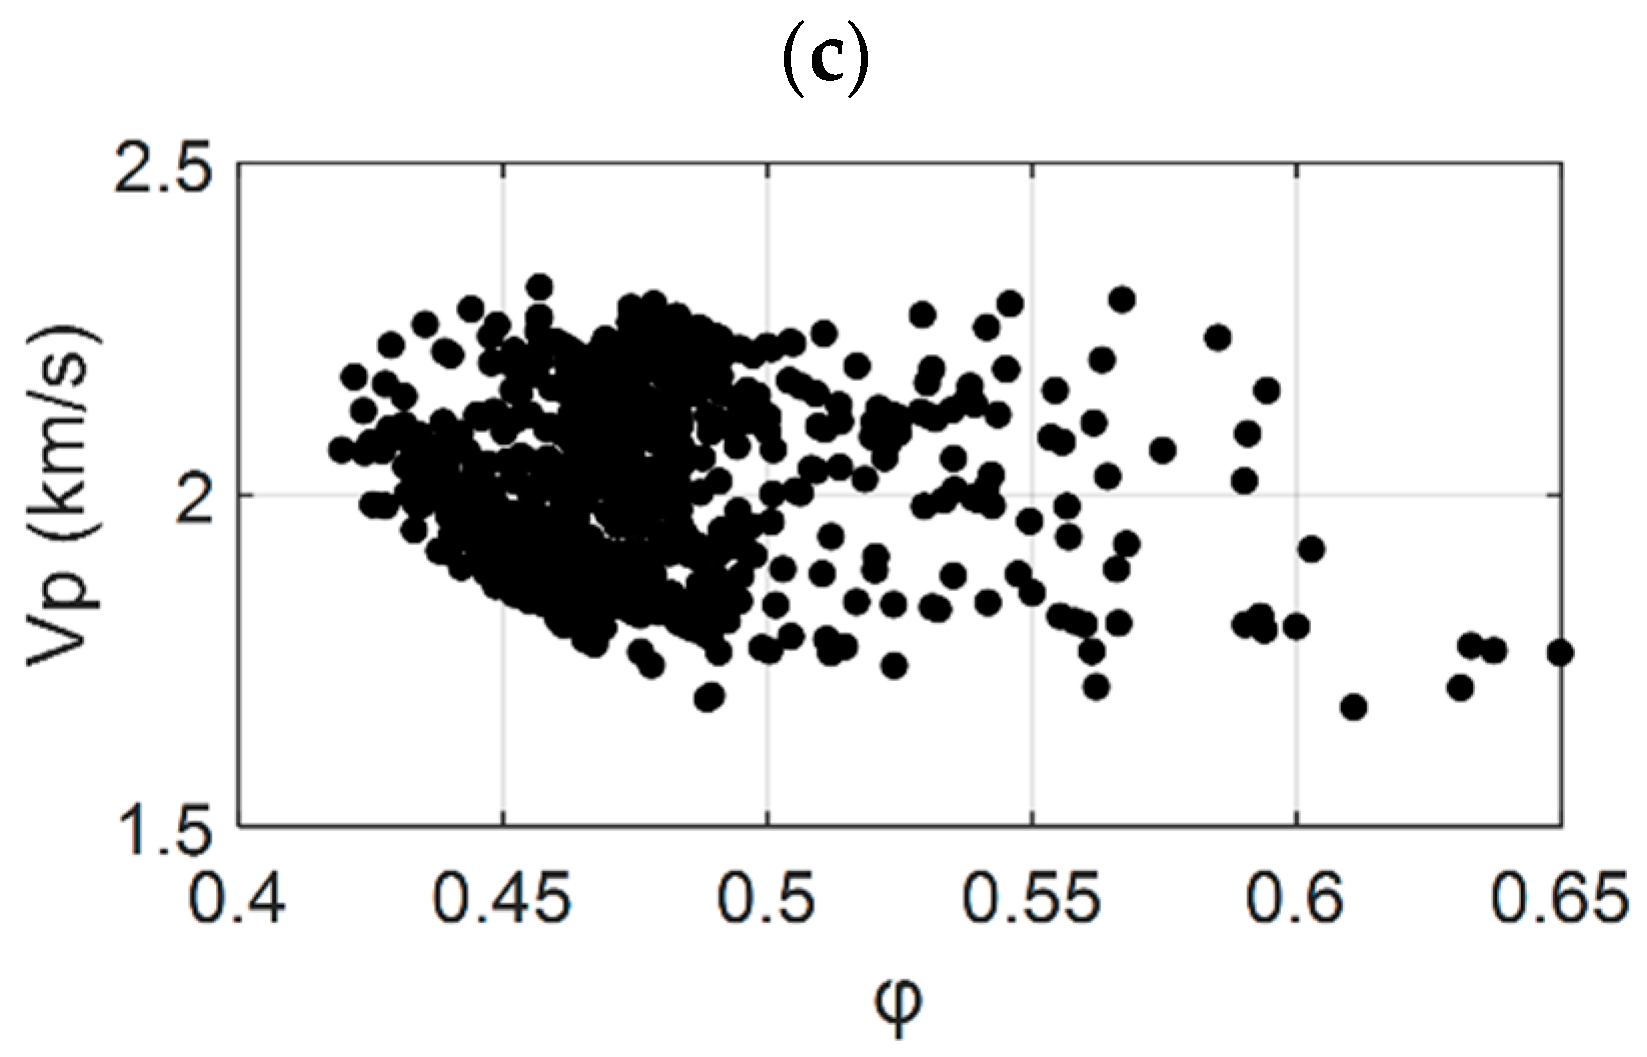
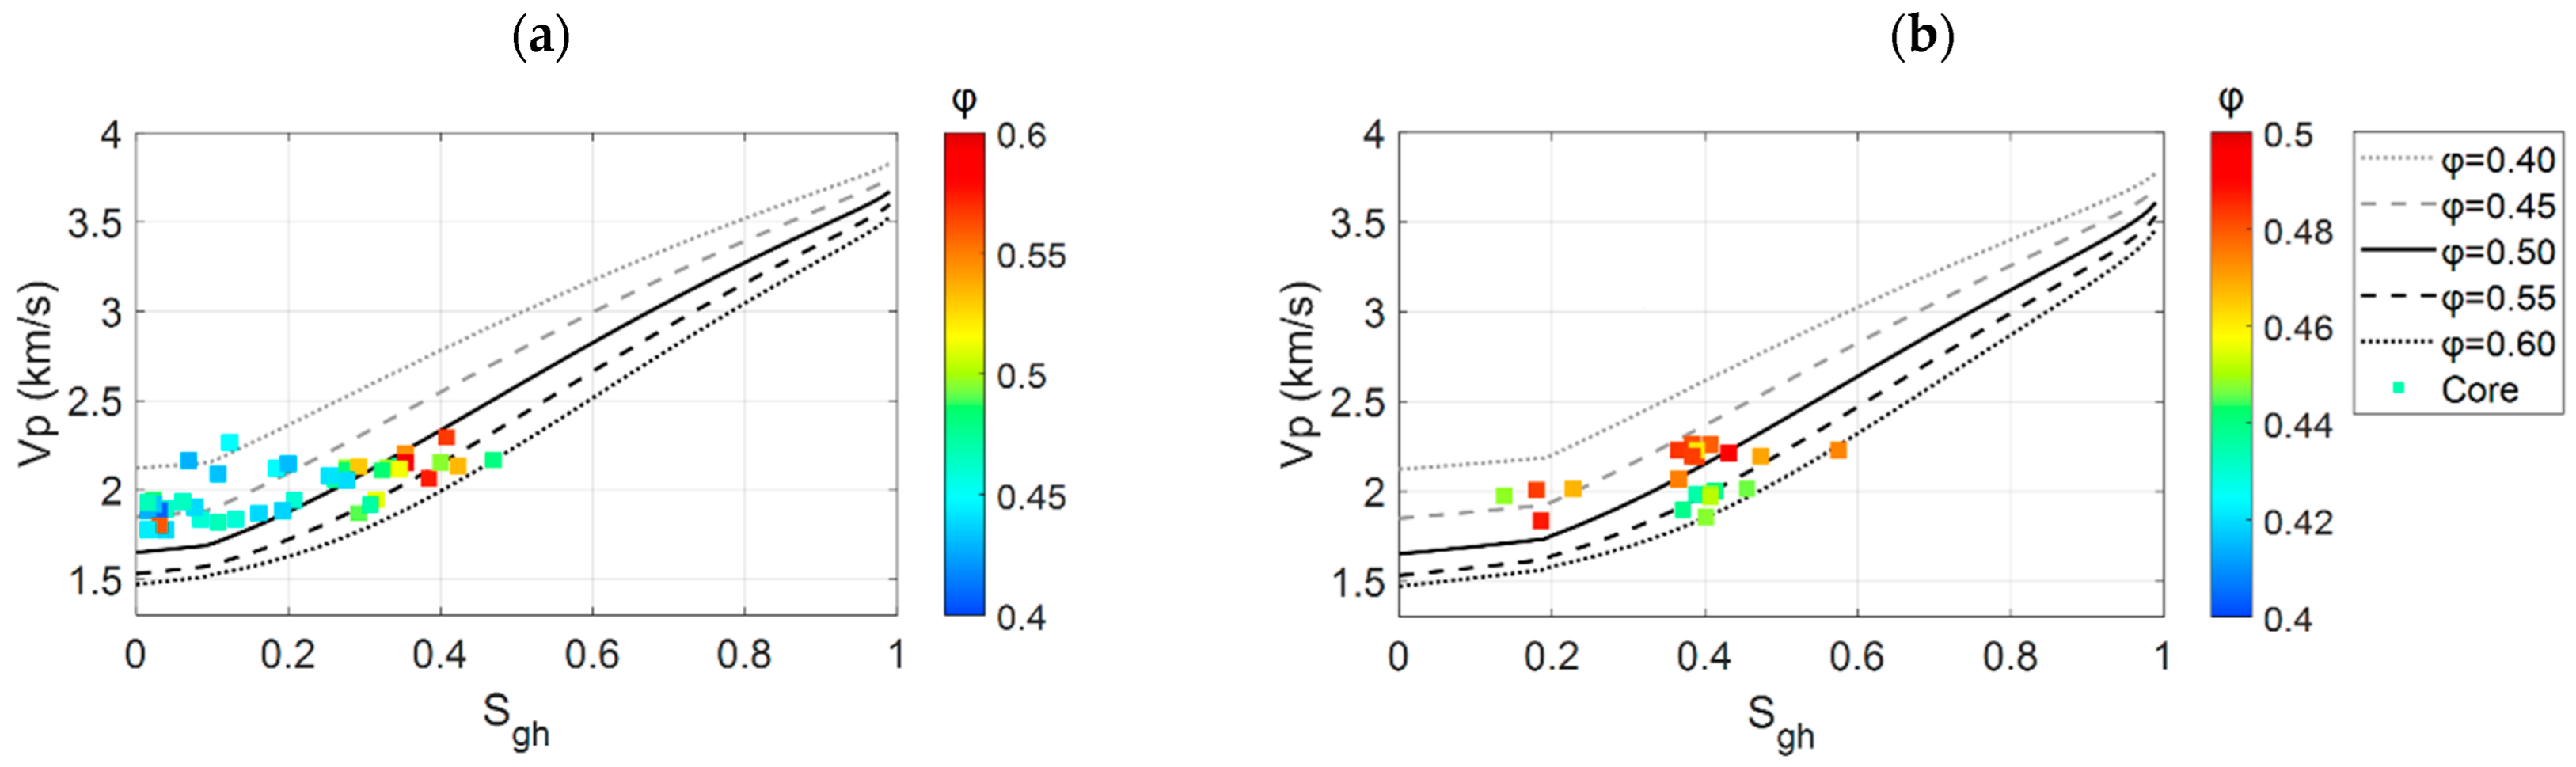
3.6. Correlation Analyses of VP versus Sgh, φ, and Cgh

In Figure 13, exploring the correlations between VP and Sgh, φ, and Cgh is of interest. The plotted results reveal that VP notably correlated with Sgh and Cgh (see Figure 13a,b), implying that P-wave velocity can be employed as a reliable indicator of the gas hydrate concentration in the study area. Accordingly, the linear correlation equations can be given as follows:
V P = 1.08 S g h + 1.76
V P = 1.90 C g h + 1.80
In contrast, VP shows no observable correlation with φ (see Figure 13c), which is different from the case in conventional oil and gas reservoirs.

4. Discussion

Due to specific occurrence status, marine sediments containing gas hydrates exhibit particular elastic responses different from oil- and gas-bearing hydrocarbon resources. Therefore, an appropriate RPM was established to describe the elastic characteristics of gas hydrate deposits. Accordingly, a method was developed to predict hydrate concentrations using the P-wave velocity of well-log data. The predicted results are encouraging where the estimated gas hydrate saturation rationally agrees with the core measured data.
The proposed model (see Figure 2) quantifies the elastic responses of marine sediments based on the assumption of the gas hydrate occurrence (see Figure 1). One of the advantages is estimating the elastic properties of gas hydrate deposits where the gas hydrates exist as pore fillings and form part of the solid matrix according to various occurrence statuses or concentrations. Thus, the model provides insights into the elastic properties of marine sediments associated with the accumulation process of gas hydrates. The other merit of the model is to evaluate the non-zero stiffnesses of the pore-filled mixture composed of gas hydrates and water. It is emphasized that the procedure for modeling the pore filling moduli should not be confused with the original applications of the corresponding methods in estimating the moduli of the entire unconsolidated rock, as presented by Helgerud et al. [15]. As demonstrated in Figure 2, the elastic properties of the gas hydrate deposits were obtained from the dry sediment frame (composed of minerals and gas hydrates) and pore fillings (mixture of water and gas hydrates) with the solid substitution theory [25]. In comparison, the elastic properties associated with the dynamic variation in gas hydrate occurrence cannot be described by commonly used average equations [6,9,11] or the original form of the effective medium model [15].
The modeling results (Figure 4 and Figure 5) indicate that wave velocities exhibit different variation trends with gas hydrate saturation (Sgh), where the introduced critical gas hydrate saturation (Sc) acts as a turning point. The P- and S-wave velocities (VP and VS) of the rock slowly grow with Sgh for values lower than Sc, while these velocities sharply magnify with Sgh for values greater than Sc. The obtained results coincide with the laboratory measurements observed by Berge et al. [39], justifying the assumption of the dynamic accumulation process of gas hydrates (see Figure 1). The dramatic rise in wave velocities with increasing Sgh beyond Sc can be explained such that the gas hydrates configure part of the dry sediment frame beyond the critical saturation and thus enhance the stiffnesses of the sediment.
In the calibration of the modeling results using realistic data, elevated VP in gas hydrate formations can be interpreted by the increased gas hydrate saturation in the sediments (see Figure 9), matching with the results in existing studies [15,17,18]. The merit of our study is incorporating appropriate physical parameters (Sgh and Sc) into the model for a detailed description of the dynamic accumulation process of gas hydrates. However, due to the lack of the shear wave velocity in the wellbores, only Sgh was estimated in the present study (see Figure 11), where Sc was treated as an adjusting factor and empirically chosen for better prediction results. When sufficient log data (VP and VS) is available in the future, both Sgh and Sc can be estimated simultaneously, providing more insights into the in situ properties of gas hydrates.
Our proposed method provides reasonable estimates for Sgh, agreeing with core measurement results in the SH2 and SH17 wells (see Figure 11). However, uniform lithology was considered for the involved depth intervals in the two wells because detailed information on mineralogical fractions is unavailable. In future investigations, the constraint of sufficient mineralogical information would reduce uncertainty in Sgh estimation. Meanwhile, further explorations on the petrophysical and geochemical properties that provide more in situ information on gas hydrate formations facilitate rock physics modeling and improve the estimation of the gas hydrate concentration. Meanwhile, correlation analyses of the obtained results indicate that the predicted VP is positively correlated with the gas hydrate saturation and corresponding concentration (see Figure 13a,b), indicating that compressional wave velocity is a useful indicator for gas hydrate identification. However, the VP of the gas hydrate formation exhibits a less obvious correlation with porosity (see Figure 13c), which is different from the case in oil and gas reservoirs.
Finally, the proposed model can be extended to investigate the attenuation and dispersion associated with gas hydrate occurrence by incorporating relevant poroelastic theories [22,40,41,42,43]. Another application is establishing rock physics templates based on the proposed model for quantitative seismic interpretation of gas hydrate reservoir properties [44]. Moreover, based on the improved understanding of the elastic responses of gas hydrate deposits, we can develop a new seismic inversion method specifically for the characterization of marine sediments containing gas hydrates, which will be explored in the accompanying paper (Part 2).

5. Conclusions

This study aimed to propose an efficient RPM to model the elastic wave velocities of marine sediments containing gas hydrates. The theoretical modeling based on the RPM examined the impact of the gas hydrate saturation and corresponding modes of occurrence on the elastic properties of marine sediments. The proposed RPM model was calibrated using well-log data to interpret elevated wave velocities in marine sediments. Finally, the RPM was extended to evaluate the gas hydrate concentration in boreholes, and the estimated results were successfully validated by employing the core measured data. The primary inclusions are as follows:
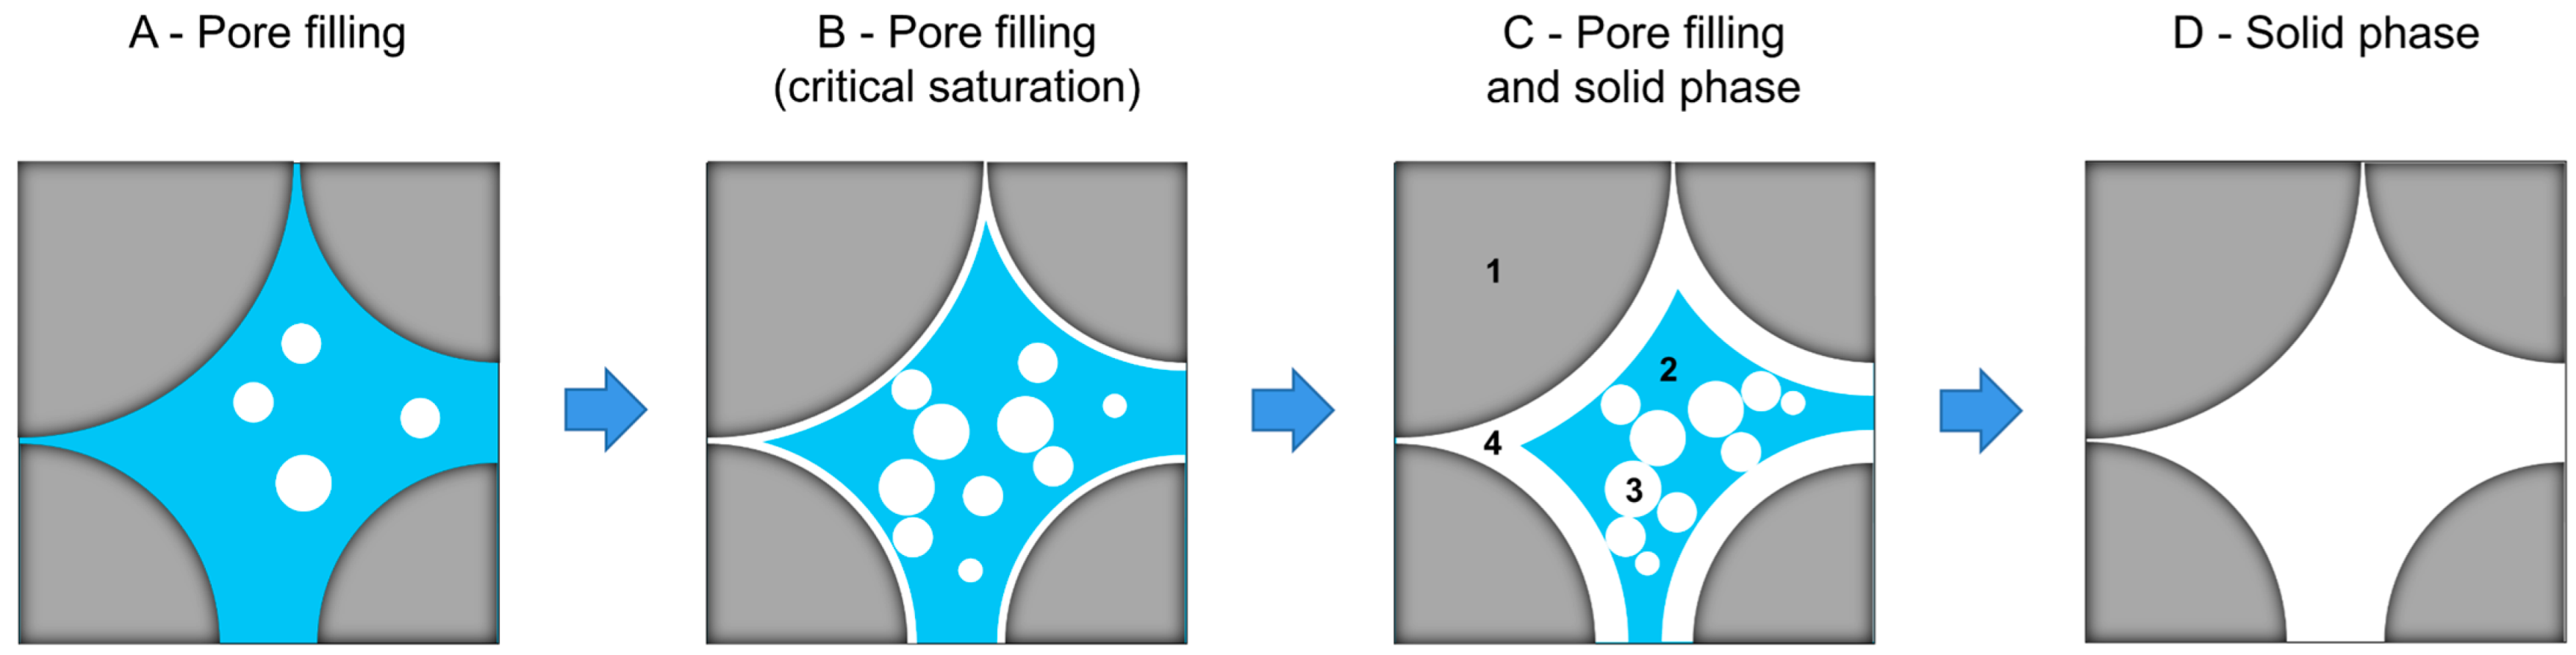
  • A critical value of the gas hydrate saturation was introduced to the proposed RPM as a key parameter for different modeling schemes. In this way, the proposed RPM is capable of considering the impact of gas hydrates on the sediment stiffnesses during the dynamic accumulation process of the gas hydrates, including being pore fillings and forming part of the solid components.
  • The proposed model takes into account the pore-filled gas hydrate fabric to exhibit non-zero bulk and shear moduli. Therefore, gas hydrates and water mixture was regarded as solid pore fillings saturated in the dry sediment frame.
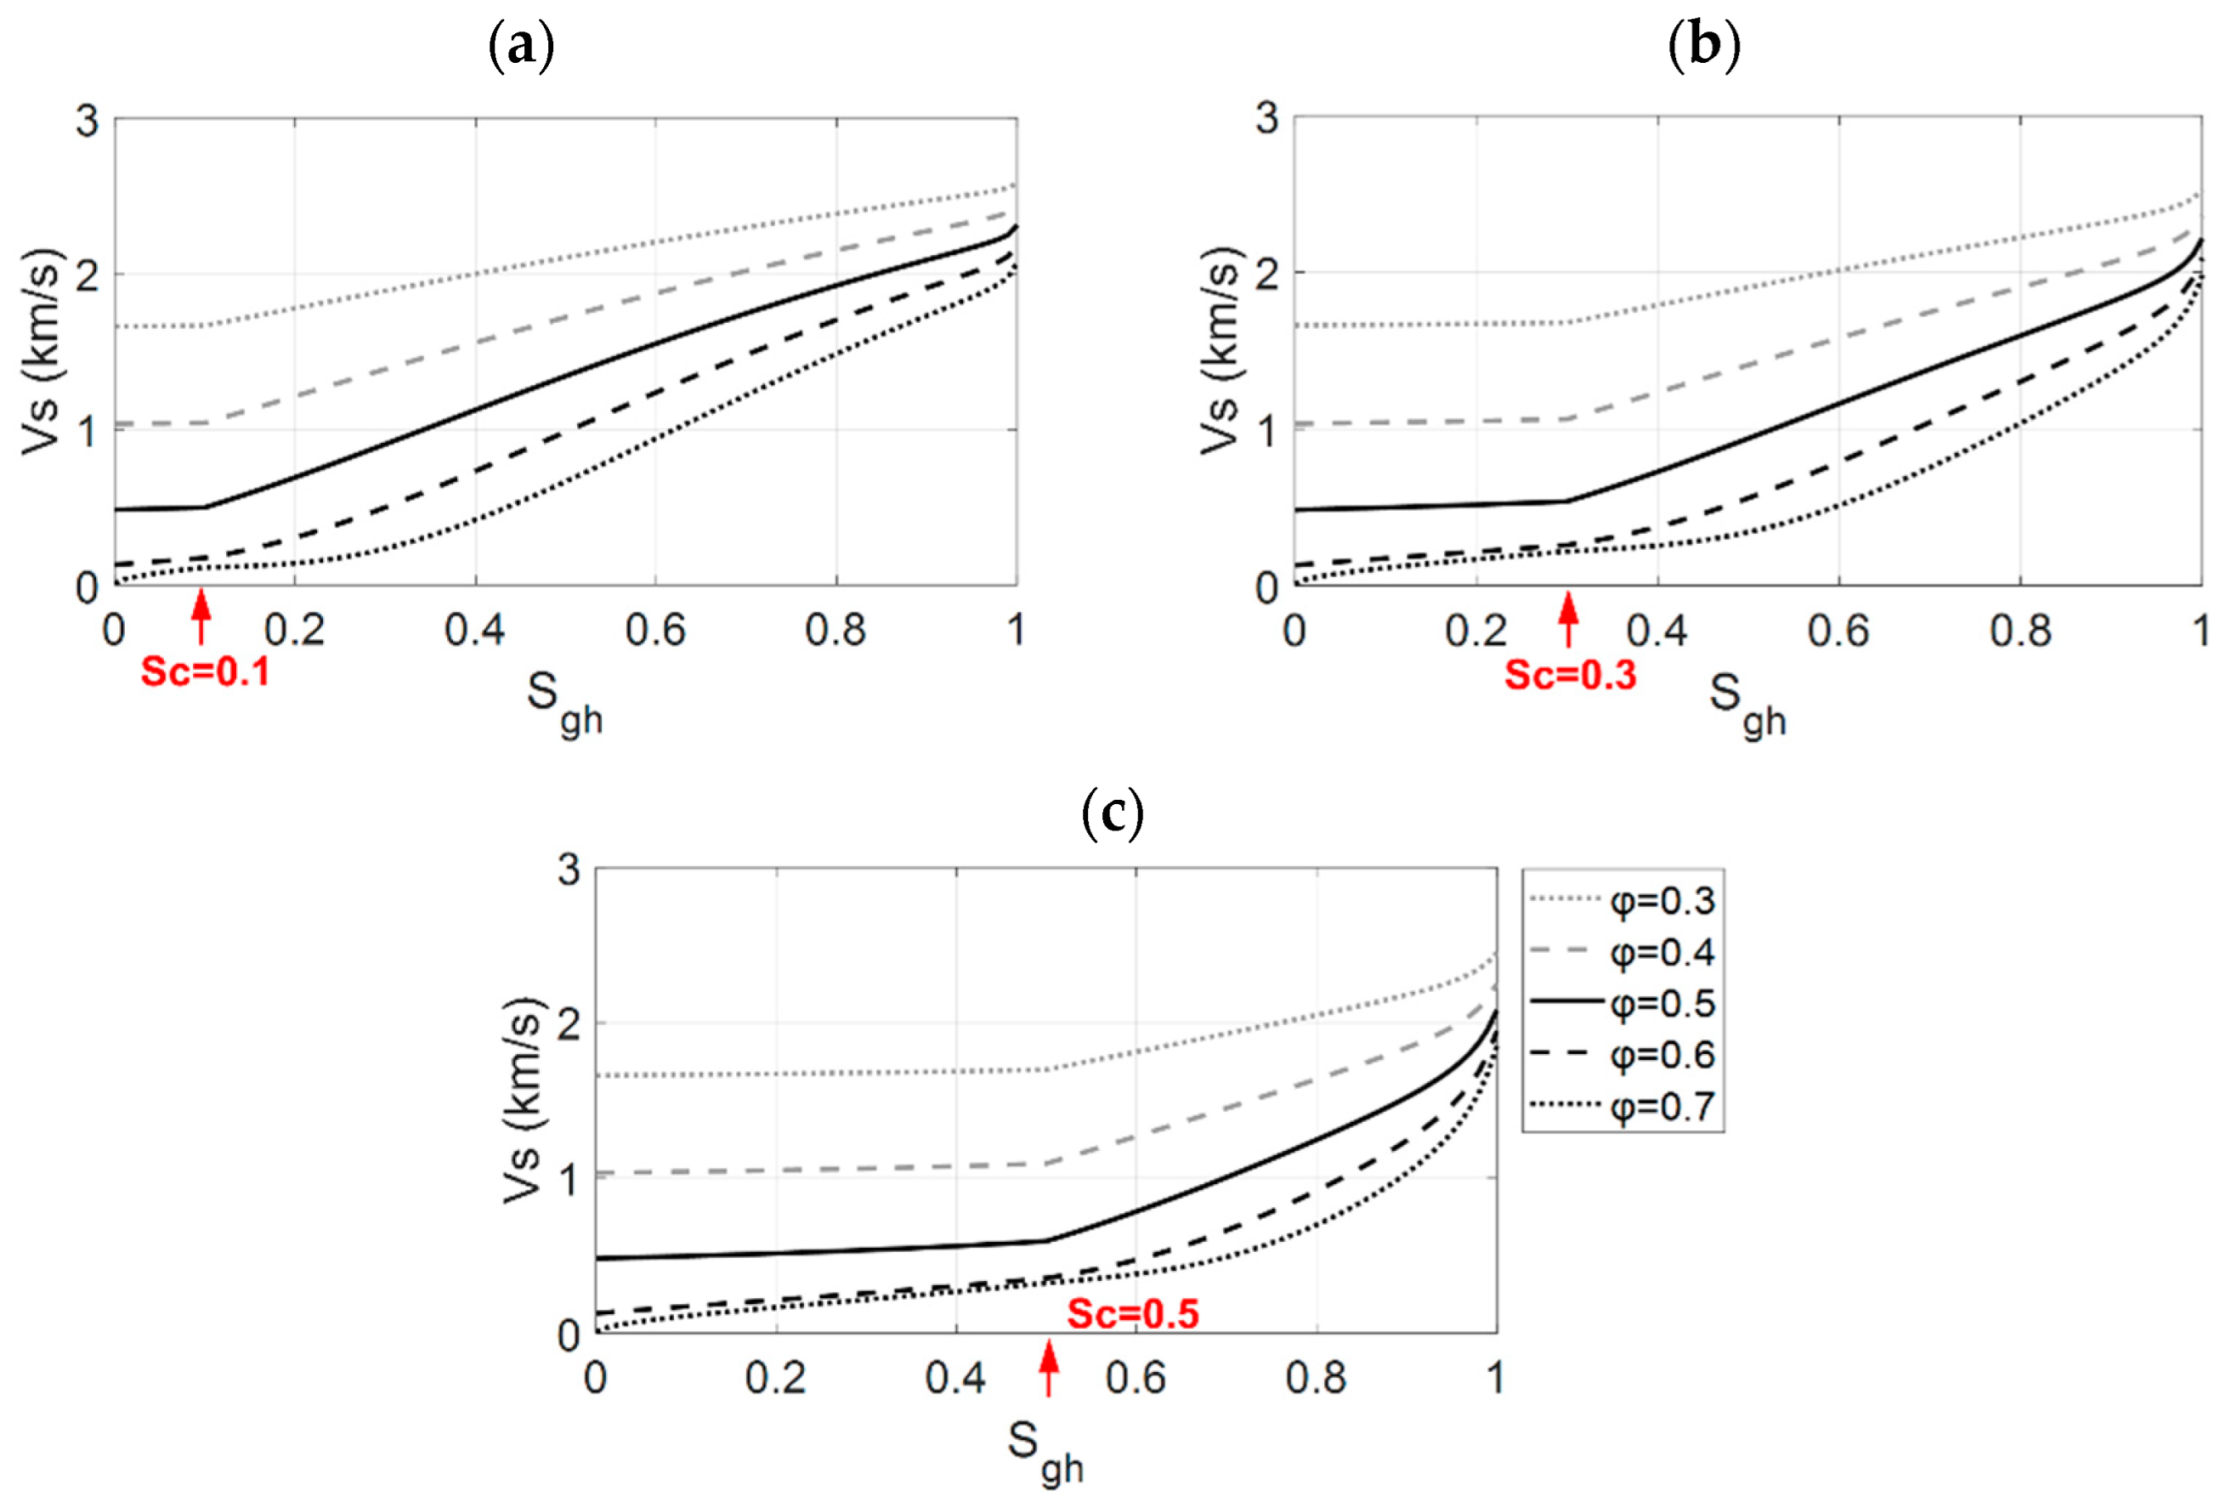
  • Theoretical modeling illustrates the elastic properties of the marine sediments exhibit various variation trends determined by Sc. The increase in Sgh considerably elevates the values of VP and vs. of sediments, with the velocities increasing more rapidly for Sgh values beyond the Sc value. This issue is mainly attributed to the fact that gas hydrates become part of the solid component of sediments and noticeably affect sediment stiffness for Sgh higher than Sc.
  • The numerical experiment of the RPM using well-log data validates that the proposed model can be employed to estimate the gas hydrate saturation based on the elastic properties of marine sediments. The elevated VP values within target depth intervals can be utilized to infer the gas hydrate saturation.
  • The quantitative gas hydrate saturation estimation leads to results agreeing with the core measurement data, confirming the applicability of the proposed method for reliable estimation of the gas hydrate saturation based on the elastic properties.
The RPM proposed in the present study provides a powerful tool for describing the physical relationships between elastic parameters and the sedimentary properties associated with gas hydrates. The proposed model improves the understanding of elastic behaviors of gas hydrates and suggests a practical way to estimate gas hydrate concentration using well-log data. The RPM can be employed in future investigations to construct rock physics templates for quantitative seismic interpretation or be incorporated into seismic inversion methods for directly characterizing gas hydrate–bearing sediments.

Author Contributions

Conceptualization, Z.G.; methodology, Z.G. and X.L.; software, X.L.; validation, Z.G. and X.L.; formal analysis, Z.G. and X.L.; investigation, Z.G. and H.C.; resources, C.L.; data curation, H.C. and Z.C.; writing—original draft preparation, Z.G.; writing—review and editing, Z.G.; visualization, X.L.; project administration, Z.G.; funding acquisition, Z.G. All authors have read and agreed to the published version of the manuscript.

Funding

This research was funded by the National Natural Science Foundation of China (grant numbers 42074153 and 42274160) and the CNPC Science Research and Technology Development Project (grant number 2021DJ3503).

Institutional Review Board Statement

Not applicable.

Informed Consent Statement

Not applicable.

Data Availability Statement

All data have been provided in the paper.

Conflicts of Interest

The authors declare no conflict of interest.

References

  1. Kvenvolden, K.A. Gas hydrates-geological perspective and global change. Rev. Geophys. 1993, 31, 173–187. [Google Scholar] [CrossRef]
  2. Minshull, T.A.; Singh, S.C. Seismic velocity structure at a gas hydrate reflector, offshore western Columbia, from full waveform inversion. J. Geophys. Res. Solid Earth 1994, 99, 4715–4734. [Google Scholar] [CrossRef]
  3. Ecker, C.; Lumley, D.; Dvorkin, J.; Nur, A. Structure of hydrate sediment from seismic and rock physics. In Proceedings of the International Conference on Natural Gas Hydrates, Toulouse, France, 2–6 June 1996. [Google Scholar]
  4. Boswell, R. Is gas hydrate energy within reach? Science 2009, 325, 957–958. [Google Scholar] [CrossRef] [PubMed]
  5. Timur, A. Velocity of compressional waves in porous media at permafrost temperature. Geophysics 1968, 33, 584–595. [Google Scholar] [CrossRef]
  6. Pearson, C.F.; Halleck, P.M.; McGuire, P.L.; Hermes, R.; Mathews, M. Natural gas hydrate deposit: A review of in situ properties. J. Phys. Chem. 1983, 87, 4180–4185. [Google Scholar] [CrossRef]
  7. Yuan, T.; Hyndman, R.D.; Spence, G.D.; Desmons, B. Seismic velocity increase and deep-sea gas hydrate concentrations above a bottom-simulating reflector on the northern Cascadia continental slope. J. Geophys. Res. 1996, 101, 13655–13671. [Google Scholar] [CrossRef]
  8. Wyllie, M.R.J.; Gregory, A.R.; Gardner, G.H.F. An experimental investigation of factors affecting elastic wave velocities in porous media. Geophysics 1958, 23, 459–493. [Google Scholar] [CrossRef]
  9. Lee, M.W.; Hutchinson, D.R.; Collett, T.S.; Dillon, W.P. Seismic velocities for hydrate bearing sediments using weighted equation. J. Geophys. Res. 1996, 101, 20347–20358. [Google Scholar] [CrossRef]
  10. Wood, A.B. A Textbook of Sound; G. Bell and Sons, Ltd.: London, OH, USA, 1941. [Google Scholar]
  11. Nobes, D.C.; Viilinger, H.; Davis, E.E.; Law, L.K. Estimation of marine sediment bulk physical properties at depth from seafloor geophysical measurements. J. Geophys. Res. 1986, 91, 14033–14043. [Google Scholar] [CrossRef]
  12. Dvorkin, J.; Prasad, M.; Sakai, A.; Lavoie, D. Elasticity of Marine Sediments: Rock Physics Modeling. Geophys. Res. Lett. 1999, 26, 1781–1784. [Google Scholar] [CrossRef]
  13. Mindlin, R.D. Compliance of elastic bodies in contact. J. Appl. Mech. 1949, 16, 259–268. [Google Scholar] [CrossRef]
  14. Hashin, Z.; Shtrikman, S. A variational approach to the theory of the elastic behavior of multiphase materials. J. Mech. Phys. Solids 1963, 11, 127–140. [Google Scholar] [CrossRef]
  15. Helgerud, M.B.; Dvorkin, J.; Nur, A.; Sakai, A.; Collett, T.S. Elastic-wave velocity in marine sediments with gas hydrates: Effective medium modeling. Geophys. Res. Lett. 1999, 26, 2021–2024. [Google Scholar] [CrossRef]
  16. Dai, J.; Banik, N.; Gillespie, D.; Dutta, N. Exploration for gas hydrates in the deepwater, northern Gulf of Mexico: Part II. Model validation by drilling. Mar. Pet. Geol. 2008, 25, 845–859. [Google Scholar] [CrossRef]
  17. Dai, J.; Snyder, F.; Gillespie, D.; Koesoemadinata, A.; Dutta, N. Exploration for gas hydrates in the deepwater northern Gulf of Mexico: Part I. A seismic approach based on geologic model, inversion and rock physics principles. Mar. Pet. Geol. 2008, 25, 830–844. [Google Scholar] [CrossRef]
  18. Shankar, U.; Riedel, M. Heat flow and gas hydrate saturation estimates from Andaman Sea, India. Mar. Pet. Geol. 2013, 43, 434–449. [Google Scholar] [CrossRef]
  19. Ehsan, M.I.; Ahmed, N.; Khalid, P.; Wei, L.X.; Naeem, M. An application of rock physics modeling to quantify the seismic response of gas hydrate-bearing sediments in Makran accretionary prism, offshore, Pakistan. Geosci. J. 2016, 20, 321–330. [Google Scholar] [CrossRef]
  20. Chand, S.; Minshull, T.M. The effect of hydrate content on seismic attenuation: A case study for Mallik 2L-38 well data, Mackenzie delta, Canada. Geophys. Res. Lett. 2004, 31, L14609. [Google Scholar] [CrossRef]
  21. Chand, S.; Minshull, T.M.; Priest, J.A.; Best, A.T.; Clayton, C.R.I.; Waite, W.F. An effective medium inversion algorithm for gas hydrate quantification and its application to laboratory and borehole measurements of gas hydrate-bearing sediments. Geophys. J. Int. 2006, 166, 543–552. [Google Scholar] [CrossRef]
  22. Guo, Z.Q.; Wang, X.Y.; Jiao, J.; Chen, H.F. Rock physics model and seismic dispersion and attenuation in gas hydrate-bearing sediments. Front. Earth Sci. 2021, 9, 641606. [Google Scholar] [CrossRef]
  23. Krief, M.; Garat, J.; Stellingwerff, J.; Ventre, J. A petrophysical interpretation using the velocities of P and S waves (full waveform sonic). Log Anal. 1990, 31, 355–369. [Google Scholar]
  24. Gassmann, F. Über die elastizitat poroser medien. Vierteljahr. Nat. Gesselschafi Zur. 1951, 96, 1–23. [Google Scholar]
  25. Ciz, R.; Shapiro, S.A. Generalization of Gassmann equations for porous media saturated with a solid material. Geophysics 2007, 72, 75–79. [Google Scholar] [CrossRef]
  26. Su, D.; White, N.; McKenzie, D.A.N. Extension and subsidence of the Pearl River mouth basin, northern South China Sea. Basin Res. 1989, 2, 205–222. [Google Scholar] [CrossRef]
  27. Yang, R.; Su, M.; Qiao, S.; Cong, X.; Su, Z.; Liang, J.; Wu, N. Migration of methane associated with gas hydrates of the Shenhu Area, northern slope of South China Sea. Mar. Geophys. Res. 2015, 36, 253–261. [Google Scholar] [CrossRef]
  28. Zhang, W.; Liang, J.; Su, P.; Wei, J.; Sha, Z.; Lin, L.; Liang, J.; Huang, W. Migrating pathways of hydrocarbons and their controlling effects associated with high saturation gas hydrate in Shenhu area, northern South China Sea. Chin. Geol. 2018, 45, 1–14. [Google Scholar]
  29. Wu, S.G.; Zhang, G.X.; Huang, Y.Y.; Liang, J.; Wong, H.K. Gas hydrate occurrence on the continental slope of the northern South China Sea. Mar. Pet. Geol. 2005, 22, 403–412. [Google Scholar] [CrossRef]
  30. Yu, X.; Wang, J.; Liang, J.; Li, S.; Zeng, X.; Li, W. Depositional characteristics and accumulation model of gas hydrates in northern South China Sea. Mar. Pet. Geol. 2014, 56, 74–86. [Google Scholar] [CrossRef]
  31. Deng, W.; Liang, J.Q.; He, Y.L.; Kuang, Z.G.; Meng, M.M. Rock-physics-based estimation of quartz content in the Shenhu area, South China Sea. Acta Geophys. 2020, 68, 1619–1641. [Google Scholar] [CrossRef]
  32. Su, M.; Sha, Z.B.; Qiao, S.H. Sedimentary evolution since Quaternary in the Shenhu hydrate drilling area, northern South China Sea. Chin. J. Geophys. 2015, 58, 2975–2985. [Google Scholar] [CrossRef]
  33. Qin, X.W.; Lu, J.A.; Lu, H.L.; Qiu, H.J.; Liang, J.Q.; Kang, D.J.; Zhan, L.S.; Lu, H.F.; Luang, Z.G. Coexistence of natural gas hydrate, free gas and water in the gas hydrate system in the Shenhu Area, South China Sea. China Geol. 2020, 2, 210–220. [Google Scholar] [CrossRef]
  34. Liang, J.Q.; Wang, H.B.; Su, X.; Fu, S.Y.; Wang, L.F.; Guo, Y.Q.; Chen, F.; Shang, J.J. Natural gas hydrate formation conditions and the associated controlling factors in the northern slope of the South China Sea. Nat. Gas Ind. 2014, 34, 128–135. [Google Scholar]
  35. Zhang, W.; Liang, J.Q.; Lu, J.A.; We, J.G.; Su, P.B.; Fang, Y.X.; Guo, Y.Q.; Yang, S.X.; Zhang, G.X. Accumulation features and mechanisms of high saturation natural gas hydrate in Shenhu Area, northern South China Sea. Pet. Explor. Dev. 2017, 44, 708–719. [Google Scholar] [CrossRef]
  36. Liu, J.; Zhang, J.Z.; Sun, Y.B.; Zhao, T.H. Gas hydrate reservoir parameter evaluation using logging data in the Shenhu area, South China Sea. Nat. Gas Geosci. 2017, 28, 164–172. [Google Scholar] [CrossRef]
  37. Lin, L.; Liang, J.; Guo, Y.Q.; Lu, J.A.; Liang, J.Q. Estimating saturation of gas hydrates within marine sediments using soinc log data. Well Logging Technol. 2014, 38, 234–238. [Google Scholar] [CrossRef]
  38. Mavko, G.; Mukerji, T.; Dovrkin, J. The Rock Physics Handbook: Tools for Seismic Analysis in Porous Media; Cambridge University Press: Cambridge, UK, 2009. [Google Scholar]
  39. Berge, L.I.; Jacobsen, K.A.; Solstad, A. Measured acoustic wave velocities of R11 (CCl3F) hydrate samples with and without sand as a function of hydrate concentration. J. Geophys. Res. 1999, 104, 15415–15424. [Google Scholar] [CrossRef]
  40. Ba, J.; Carcione, J.M.; Cao, H.; Du, Q.Z.; Yuan, Z.Y.; Lu, M.H. Velocity dispersion and attenuation of P waves in partially-saturated rocks: Wave propagation equations in double-porosity medium. Chin. J. Geophys. 2012, 55, 219–231. [Google Scholar] [CrossRef]
  41. Ba, J.; Xu, W.; Fu, L.; Carcione, J.M.; Zhang, L. Rock anelasticity due to patchy saturation and fabric heterogeneity: A double double-porosity model of wave propagation. J. Geophys. Res. Solid Earth 2017, 122, 1949–1976. [Google Scholar] [CrossRef]
  42. Ba, J.; Zhao, J.; Carcione, J.M.; Huang, H. Compressional wave dispersion due to rock matrix stiffening by clay squirt flow. Geophys. Res. Lett. 2016, 43, 6186–6195. [Google Scholar] [CrossRef]
  43. Sun, W.T.; Xiong, F.S.; Ba, J.; Carcione, J.M. Effects of ellipsoidal heterogeneities on wave propagation in partially saturated double-porosity rocks. Geophysics 2018, 83, 71–81. [Google Scholar] [CrossRef]
  44. Guo, Z.Q.; Lv, X.Y.; Liu, C.; Liu, X.W.; Liu, Y.W. Shale gas characterisation for hydrocarbon accumulation and brittleness by integrating a rock-physics-based framework with effective reservoir parameters. J. Nat. Gas Sci. Eng. 2022, 100, 104498. [Google Scholar] [CrossRef]
Figure 1. Schematics representations of various occurrence statuses (AD) of gas hydrates. 1—Solid frame composed of minerals. 2—Water. 3—Gas hydrates as pore fillings. 4—Gas hydrates as part of the solid frame.
Jmse 10 01379 g001
Figure 2. Workflow to construct the rock physics model for sediments containing gas hydrates with various gas hydrate occurrences in Figure 1.
Jmse 10 01379 g002
Figure 3. Flowchart of the prediction model of the gas hydrate concentration based on the well-log data.
Jmse 10 01379 g003
Figure 4. The computed P-wave velocity (VP) in terms of the gas hydrate saturation (Sgh) with varying porosity for three levels of the critical gas hydrate saturation (Sc): (a) 0.1, (b) 0.3, and (c) 0.5.
Jmse 10 01379 g004
Figure 5. The computed S-wave velocity (VS) in terms of the gas hydrate saturation (Sgh) with varying porosity for three levels of the critical gas hydrate saturation (Sc): (a) 0.1, (b) 0.3, and (c) 0.5.
Jmse 10 01379 g005
Figure 6. Contour plots of P- and S-wave velocities varying with Sgh and φ for Sc = 0.3: (a) VP, (b) Vs.
Jmse 10 01379 g006
Figure 7. Regional geological map of the study area. The locations of SH2 and SH17 wells are indicated.
Jmse 10 01379 g007
Figure 8. Log data from (a) SH2 well and (b) SH17 well, including gamma ray, resistivity, P-wave velocity (VP), porosity (φ), and density (ρ).
Jmse 10 01379 g008
Figure 9. (a) Modeled VP of the marine sediments and (b) measured Sgh for core samples from SH2 well. (c) Modeled VP of the marine sediments and (d) measured Sgh for core samples from SH17 well.
Jmse 10 01379 g009
Figure 10. Modeled VP in terms of Sgh for various values of φ for: (a) SH2 well, (b) SH17 well (note: Sgh data in Figure 9b,c are color-coded by φ and overlaid in the plots with colorful dots).
Jmse 10 01379 g010
Figure 11. Estimated results in (a) SH2 and (b) SH17 wells, including the VP log overlaid by modeled VP, estimated Sgh, logging data of φ, and Cgh obtained by Cgh = Sgh × φ.
Jmse 10 01379 g011aJmse 10 01379 g011b
Figure 12. The estimated results of Sgh for various Sc values in (a) SH2 well, (b) SH17 well (note: the Sgh data measured from the core samples is overlaid with solid-dotted markers).
Jmse 10 01379 g012
Figure 13. Correlation analyses of VP versus (a) Sgh, (b) Cgh, and (c) φ from the estimated results in Figure 11.
Jmse 10 01379 g013aJmse 10 01379 g013b
Table 1. Properties of the constituents used in rock physics modeling [37,38].
ClayQuartzCalciteHydrateBrine
K (GPa) 20.9036.6076.805.602.25
µ (GPa) 6.8545.0032.002.400.00
ρ (g/cm3) 2.582.652.710.921.04
Publisher’s Note: MDPI stays neutral with regard to jurisdictional claims in published maps and institutional affiliations.

