Article

Experimental Modelling of an Isolated WECfarm Real-Time Controllable Heaving Point Absorber Wave Energy Converter

1
Department of Civil Engineering, Ghent University, Technologiepark 60, B-9052 Zwijnaarde, Belgium
2
Department of the Built Environment, Aalborg University, Thomas Manns Vej 23, 9220 Aalborg, Denmark
*
Author to whom correspondence should be addressed.
These authors contributed equally to this work.
J. Mar. Sci. Eng. 2022, 10(10), 1480; https://doi.org/10.3390/jmse10101480
Submission received: 9 September 2022 / Revised: 6 October 2022 / Accepted: 7 October 2022 / Published: 11 October 2022
(This article belongs to the Special Issue Offshore Renewables for a Transition to a Low Carbon Society)

Abstract

:
To offer point absorber wave energy converters (WECs) as a bankable product on the marine renewable energy market, multiple WECs will be installed together in an array configuration. The wave energy community (research and industrial) has identified the urgent need for available realistic and reliable data on WEC array tests in order to perform a better WEC array optimization approach and in order to validate recently developed (non-linear) numerical models. The ‘WECfarm’ project is initiated to cover this scientific gap on necessary experimental data. The ‘WECfarm’ experimental setup consists of an array of five generic heaving point-absorber WECs. The WECs are equipped with a permanent magnet synchronous motor (PMSM), addressing the need for WEC array tests with an accurate and actively controllable power take-off (PTO). The WEC array control and data acquisition are realized with a Speedgoat Performance real-time target machine, offering the possibility to implement advanced WEC array control strategies in the MATLAB-Simulink environment. The presented article describes the experimental setup, the performed tests and the results of the test campaign using a single, isolated ‘WECfarm’ WEC in April 2021 at the wave basin of Aalborg University (AAU), Denmark. A Coulomb and viscous friction model is determined to partly compensate for the drivetrain (motor, gearbox, rack and pinion) friction. A system identification (SID) approach is adopted considering the WEC system to be composed of two single input single output (SISO) models, the radiation and the excitation model. Radiation tests yield the intrinsic impedance. Excitation tests yield the excitation frequency response function. Adopting an impedance matching approach, the control parameters for the resistive and reactive controller are determined from the complex conjugate of the intrinsic impedance. Both controllers are tested for a selection of regular wave conditions. The performed experimental test campaign using an isolated ‘WECfarm’ WEC allows a full evaluation of the WEC design prior to extending the setup to five WECs. Within the ‘WECfarm’ project, an experimental campaign with a five-WEC array in the Coastal and Ocean Basin (COB) in Ostend, Belgium, is under preparation.

1. Introduction

A point absorber wave energy converter (WEC) consists of a floating or submerged body to capture energy from different wave directions. The point absorber diameter should preferably be in the range of 5–10% of the prevailing wavelength [1]. Due to its ability to absorb energy from different directions, this WEC type is particularly suitable to put in arrays. In a WEC array, hydrodynamic interactions between the WECs occur through radiation and diffraction of waves. Both constructive and destructive interactions will occur between individual WECs within a WEC array called near-field interactions.
Göteman et al. define directions for future research necessary for a better WEC array optimization approach [2]. There is a need for available real life data for the validation of WEC array modelling and optimization. This is a research gap for the full wave energy sector, not only in the optimization of WEC arrays. In computational fluid dynamics-based numerical wave tanks (CNWT), the Power Take-Off (PTO) system is mostly modeled as a linear spring–damper system, not representing realistic PTO dynamics and inefficiencies and undermining the overall model fidelity [3]. To validate CNWT considering WECs, it is desirable to incorporate a realistic, nonlinear PTO model. As the computational power capabilities increase yearly, so do the numerical model’s capabilities, stressing the need for experimental data to validate the model. However, publicly available databases from WEC array experiments are scarce. Vervaet et al. identified 17 experimental campaigns on point absorber WEC arrays, carried out during the last decades [4]. This limited number of experimental campaigns is due to the high cost of constructing and testing in wave basin facilities, as well as due to the complexity of the experiments and related instrumentation [5]. Therefore, the ‘WECfarm’ project aims to deliver a dataset to cover the research gap on the need for publicly available real life and reliable data to validate these new advanced numerical models. Vervaet et al. discuss the state of the art in physical modelling of point absorber WEC arrays and the identification of research gaps, resulting in design specifications of the ‘WECfarm’ experimental setup [4].
The ‘WECfarm’ experimental setup consists of an array of five heaving point-absorber WECs, designed as a unique test bench for future innovative WEC array research, able to address the current requirements and research gaps on physical WEC array testing. Given the limited number of five WECs, the WECfarm WEC array is not classified as a large WEC array, as the Manchester Bobber 25-WEC array [6], the PerAWaT project 24-WEC array [7] and the WECwakes project 25-WEC array [8]. Vervaet et al. discuss the features of the experimental setup, for which the most important ones are summarized below [4]. The WEC buoy is designed to be generic, being a truncated cylinder with a draft of 0.16 m and a radius of 0.30 m. The high diameter-to-draft ratio of 3.75 yields a flat Response Amplitude Operator (RAO) response and high resonance bandwidth, enhancing WEC–WEC interactions. The WECs are equipped with a Permanent Magnet Synchronous Motor (PMSM), addressing the need for WEC array tests with an accurate and actively controllable PTO. The air bushings linear guiding system excludes guiding friction in the power absorption measurements. The WEC array control and data acquisition are realized with a Speedgoat (Speedgoat, Köniz, Switzerland) Performance real-time target machine, offering the possibility to implement advanced WEC array control strategies in the MATLAB-Simulink environment. Wave basin testing with ‘WECfarm’ WEC arrays targets to include long- and short-crested waves and extreme wave conditions, representing real sea conditions. Within the ‘WECfarm’ project, two experimental campaigns have been performed at the Aalborg University (AAU) wave basin: (a) testing of the first WEC in April 2021, addressed in the presented article; (b) testing of a two WEC array in February 2022. An experimental campaign with a five WEC array, in the new wave basin; the Coastal and Ocean Basin (COB) in Ostend (Belgium) [9], is scheduled in 2023.
Friction characterization tests are performed to quantify the drivetrain (motor, gearbox, rack and pinion) introduced friction, whereafter a Coulomb and viscous based friction model for partial compensation of the drivetrain friction is implemented in the MATLAB-Simulink control model. Beatty et al. used a Proportional Integral (PI) force control to minimize the error between the target and measured forces for the physical model of a Wavestar WEC [10]. However, Bacelli et al. stress that closing the loop around a force sensor may induce negative consequences for the design of higher level control loops [11]. The presented friction compensation methodology provides an alternative for closing the PTO force feedback loop around the force sensor.
Coe et al. present a WEC control design based on the principle of impedance matching [12]. The control parameters yield from the complex conjugate of the intrinsic impedance, determined by radiation system identification (SID) tests, where the WEC is excited by a torque noise signal in calm water. Bacelli et al. performed SID tests for an isolated heaving point absorber WEC [13]. This article discusses the application of SID tests on an isolated ‘WECfarm’ WEC. The SID methodology will be extended to arrays with two to five WECs. Application of the impedance matching methodology for WEC arrays will yield valuable data and insights on WEC-WEC interactions and WEC array control optimization. Within the presented test campaign, the resistive and reactive controller are tested for a selection of regular wave conditions. This testing campaign allows a full evaluation of the WEC prior to extending the setup to five WECs.
Section 2 provides a detailed overview of the experimental setup, with a focus on the ‘WECfarm’ WEC, instrumentation and wave basin setup. The experimental results of the drivetrain friction model characterization tests, the SID tests and the power absorption tests are discussed in Section 3. A summary of the findings and conclusions are presented in Section 4.

2. Experimental Setup

2.1. WECfarm WEC and Instrumentation

For a detailed discussion on the design of the ‘WECfarm’ five-WEC array, the reader is referred to [4]. In this article, we consider a single, isolated ‘WECfarm’ WEC. Figure 1 shows a 3D rendering of the final design of the device. The used right-handed coordinate system has its origin at the intersection of the still water level (SWL) with the vertical axis through the center of the WEC buoy. This allows us to express displacements of the WEC buoy relative to the SWL. The x-axis corresponds with the positive wave propagation direction. The y-axis follows from the motor sign convention: a positive torque results in a downward motion of the WEC buoy. Therefore, the z-axis is pointed downwards to define positive forces, displacements, velocities and accelerations.
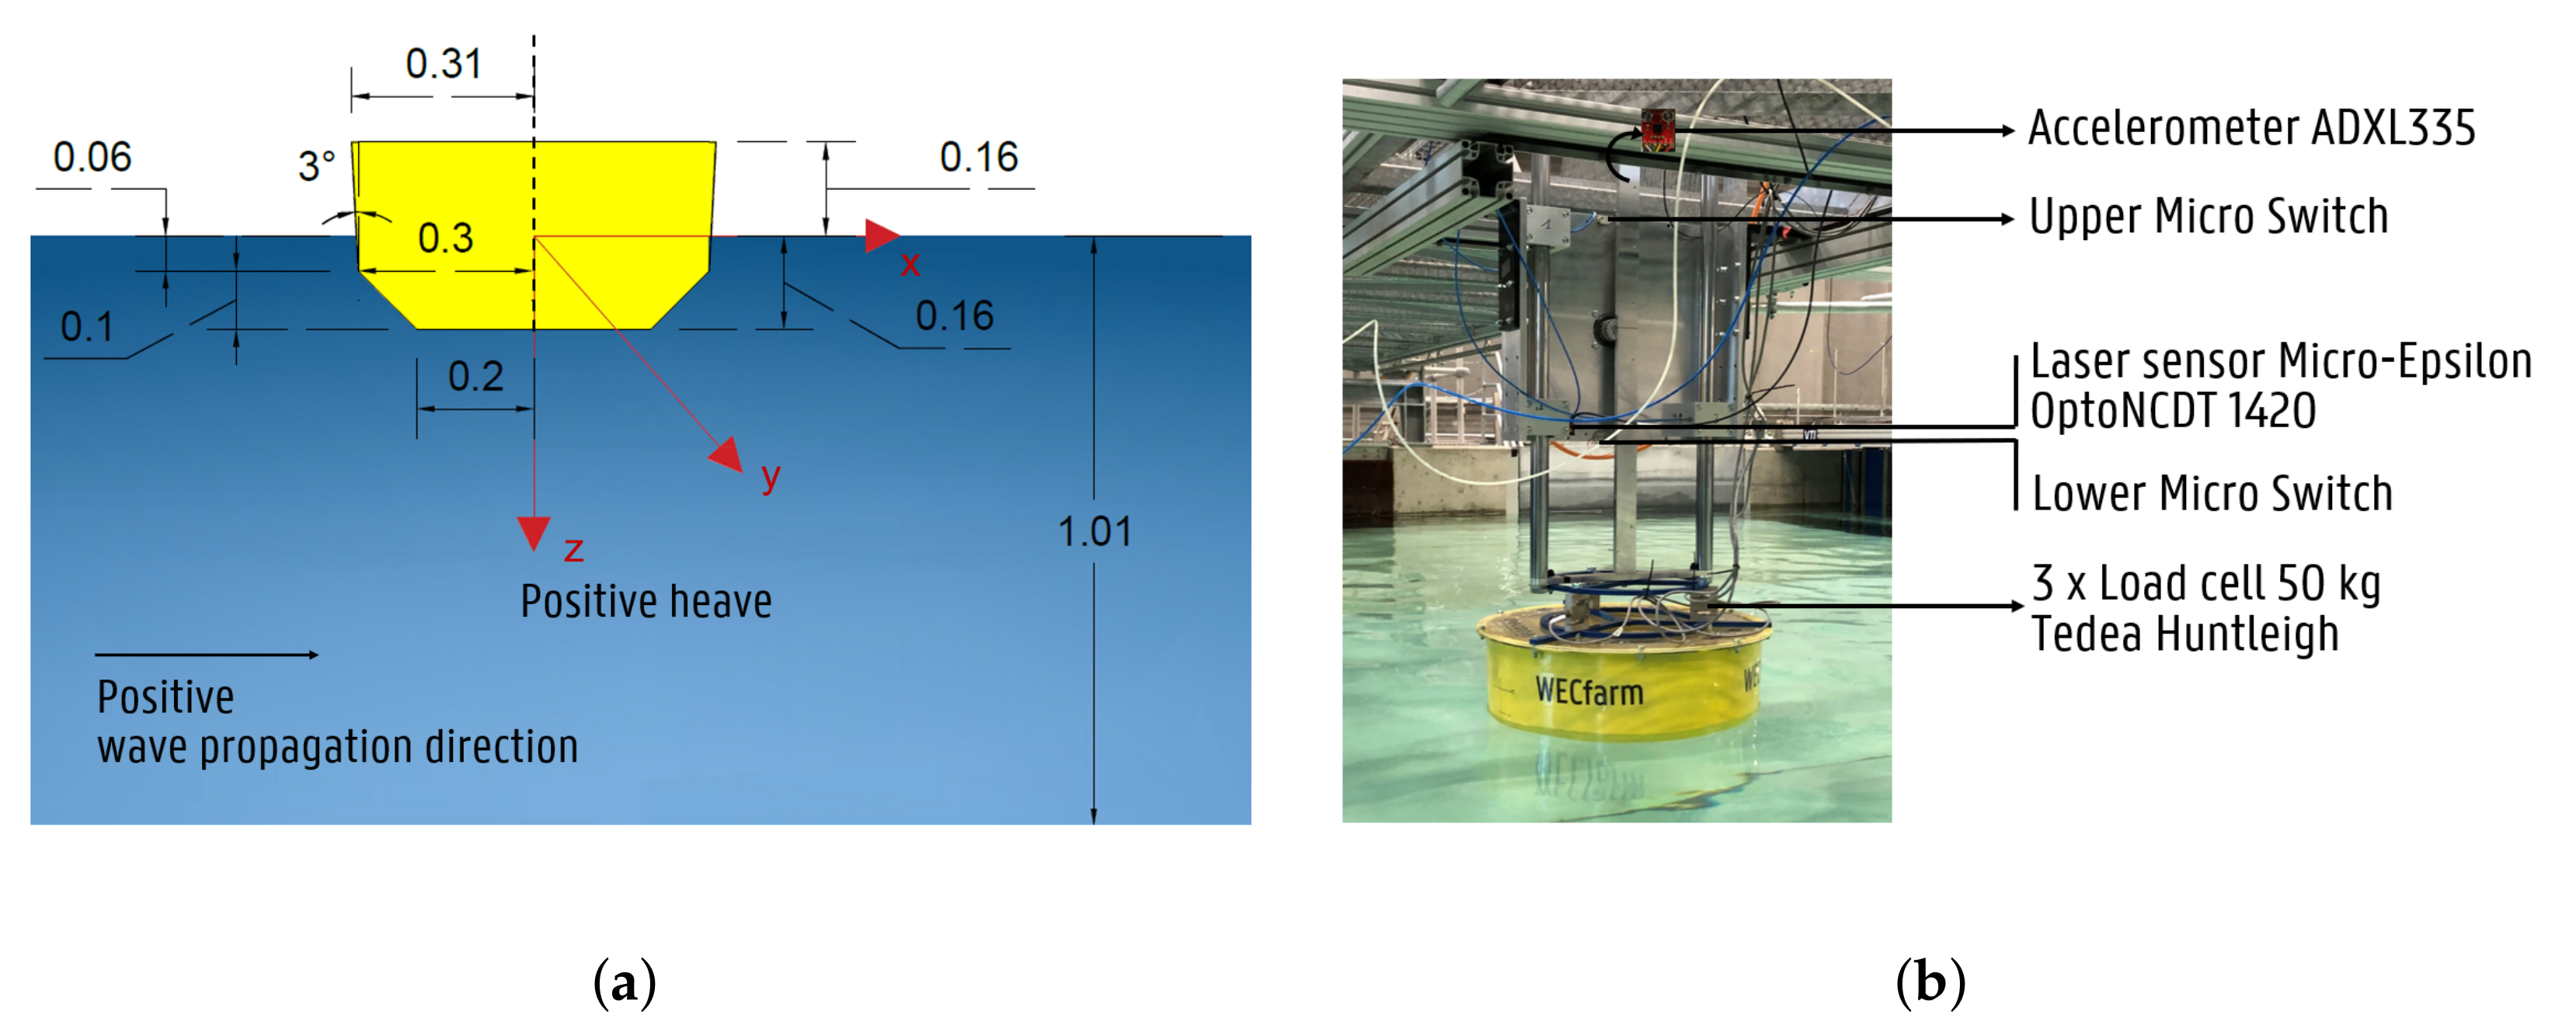
To exclude friction in the linear guiding, 40 mm OAV (OAV Air Bearings, Princeton, NJ, USA) air bushings are used. The air bushings are characterized by a load versus pressure curve, where one air bushing can cope with a maximum radial load of 720 N, for a nominal pressure of 5.5 bar [14]. A configuration of three OAV 40 mm air bushings guarantees a permanent layer of air between the guide shafts and the bushings for the most extreme wave conditions, resulting in zero-friction linear guiding on the condition of proper alignment. The PTO system of the WEC is designed as a PMSM connected to a gearbox powering a rack and pinion system. The pinion pitch circle radius R p i n i o n is equal to 0.0212205 m. A Wittenstein (Wittenstein, Igersheim, Germany) single-stage gearbox ‘NPR 025S-MF1-4 -2E1-1S’ with ratio i = 4 is connected to a Beckhoff (Beckhoff Automation, Verl, Germany) PMSM ‘AM8542-2E11-0000’ with an inertia of 6.17 kg cm2, a rated torque of 3.97 Nm and a rated speed of 1200 RPM, for 230 V AC power supply [15,16]. The velocity on the pinion will be four times less than on the motor shaft, while the torque on the pinion will be four times more than on the motor shaft. The Beckhoff PMSM is powered and controlled by a Beckhoff motor drive type ‘AX5103-0000-0212’. The hydrodynamic part of the WEC consists of an Acrylonitril-Butadieen-Styreen (ABS) thermofolded truncated cylindrical buoy, covered with a Polymethylmethacrylate (PMMA) plate. Figure 2a shows a 2D rendering of the WEC buoy with its dimensions. The WEC buoy is 0.32 m high and designed with a draft of 0.16 m. This draft corresponds with a submerged volume of 0.03683 m3. Therefore, the mass of the WEC buoy and hydrodynamically activated parts on top of it is 36.83 kg.
Figure 3 shows a scheme of the data acquisition and control flow for the ‘WECfarm’ setup with the isolated WEC, with a legend indicating the signal type. The MATLAB-Simulink real-time control model is built on the host PC and loaded on the Speedgoat Performance real-time target machine by Ethernet communication. This target machine runs the Simulink model and processes the input/output (I/O) at a sample frequency of 1000 Hz. In this context, the high sample frequency corresponds with the defined ‘real-time’ terminology. For each test, the various time series of each logged Simulink signal are saved within a single MATLAB structure.
A scheme on the bottom of Figure 3 shows the sensor input for the Speedgoat IO133 terminal board. The accelerometer ADXL335 (Analog Devices, Norwood, MA, USA) is used to measure the acceleration of the WEC buoy in the heave direction and is attached on top of the rack, the furthest position on the WEC from the water. The accelerometer has a linearity of ±0.3 % of the Full Scale Output (FSO) [17]. Three Tedea Huntleigh (Vishay Precision Group, Malvern, PA, USA) 50 kg load cells are placed between the hydrodynamic part (=the buoy) and the electromechanical part (=the motor) to measure the actual applied forces. The load cells with accuracy class C3 have a total error (per OIML R60) of 0.020% of the rated output [18]. A configuration of at least three load cells is required to avoid torsion and bending influencing the measurements. The mass of the three load cells together is equal to 0.682 kg, the mass above the load cells m t o p is equal to 27.610 kg and the mass below the load cells is equal to 8.534 kg, which results in a total hydrodynamically activated mass m of 36.83 kg. A TLE analog weight transmitter (Laumas Elettronica, Montechiarugolo, Italy) is used to amplify these three analog signals and to sum them to one analog signal. In case the WEC is locked, the wave heave excitation force F e can be measured. In case the motor is active, the load cells measure the PTO force F P T O . The upper micro switch and the lower micro switch are used as safety limit switches. It is necessary to limit the amplitude of the WEC buoy displacement to prevent the guiding system damaging the structure. The laser sensor Micro-Epsilon optoNCDT 1420-500 (Micro-Epsilon, Ortenburg, Germany) is installed as a backup for the motor encoder to measure the displacement of the WEC buoy relative to the SWL. The laser sensor has a linearity of ±500 μm, equivalent to ±0.1% of the FSO [19]. Moreover, the laser sensor can be used for displacement measurements for tests without the motor. Three pneumatic indicators, one for each air bushing, are used as a visual safety indicator in the pneumatic circuit. As long as the air bushing is provided with a certain air pressure, the red balloon in the indicator stays inflated, confirming the air bushings are pressurized. Figure 2b shows a picture of the WEC as installed at the AAU wave basin with indication of the location of the sensors.
The motor drive, the Speedgoat IO133 terminal board, DC power supply and loss current switches are centralized in the control cabinet. Figure 3 shows a picture of the inside of the control cabinet. During the experimental campaign, the VTI (VTI Instruments Corporation, Irvine, CA, USA) wave gauge sensor system was put inside the control cabinet to establish the connection of the VTI wave gauge sensor analog output with the Speedgoat IO133 terminal board analog input. The VTI wave paddle trigger is used for synchronization by providing a constant voltage signal from the moment the wave paddles are activited. The seismic accelerometer (PCB 393B04) is placed on top of the steel frame to quantify possible vibrations of this frame. Vibrations of the frame and resonance in particular are to be avoided, since these affect the measurement quality of the other sensors.
The torque request in the Simulink model is sent by the EtherCAT (Ethernet for Control Automation Technology) communication protocol to the Beckhoff motor drive as a Master Data Telegramm (MDT) process parameter. On the other hand, the Speedgoat target machine can receive by EtherCAT communication Amplifier Telegramm (AT) process parameters from the Beckhoff motor drive. The Beckhoff PMSM input and output signals are sent from and to the Beckhoff motor drive by the One Cable Technology (OCT), which allows to power the motor and process feedback. The motor drive receives the absolute position within one revolution at an 18 bit resolution from the single-turn absolute encoder. This encoder allows real-time determination of the state (position and velocity) of the WEC buoy. The drive provides the motor with a certain current, corresponding to a torque by multiplication with the torque constant of 1.91 Nm/A [16].
The uncertainty in the measured values with the given instrumentation is minimized by the selection of sensors with high resolution, high accuracy and low linearity error. It is important that the sensors are correctly calibrated, with a zero offset for the equilibrium position with draft 0.16 m, represented in Figure 2a. Besides the uncertainty related to sensor measurements, it is important to quantify the uncertainty of the physical testing results. Lamont-Kane et al. identified five distinct sources of uncertainty for physical testing of WEC-arrays [20]: Spatial variation of the wave-field within the wave basin; temporal variation of the wave-field from one repeat to another; the repeatability of model response for any single individual WEC; the reproducibility of model response between various nominally identical WECs (not applicable for the test campaign with a single, isolated WEC in the presented article) and the variation in the time-series of an incident irregular wave train. The quantification of these sources of uncertainty for the performed experimental campaign is not addressed in the presented article.

2.2. Wave Basin Setup

The experimental campaign took place at the AAU wave basin of the Ocean and Coastal Engineering Laboratory of the Department of the Built Environment [21]. The wave basin measures 14.60 m × 19.30 m × 1.50 m (length × width × depth) with an active test area of 8.00 m × 13.00 m (length × width). The wave generation system is 13 × 1.5 m (width × height) with 30 individually controlled wave paddles (snake type configuration). The system allows accurate generation of 3D waves due to narrow vertically hinged paddles (0.43 m segment width) with maximum wave height up to 0.45 m (at 3.0 s period) and typical maximum significant wave height H s in the range of 0.25–0.30 m. The wave basin is equipped with passive wave absorber elements. The AwaSys wave generation software is able to generate regular, irregular, solitary waves, execute 2-D and 3-D active wave absorption (reflection compensation) and generate 2nd order irregular unidirectional and multidirectional waves [22].
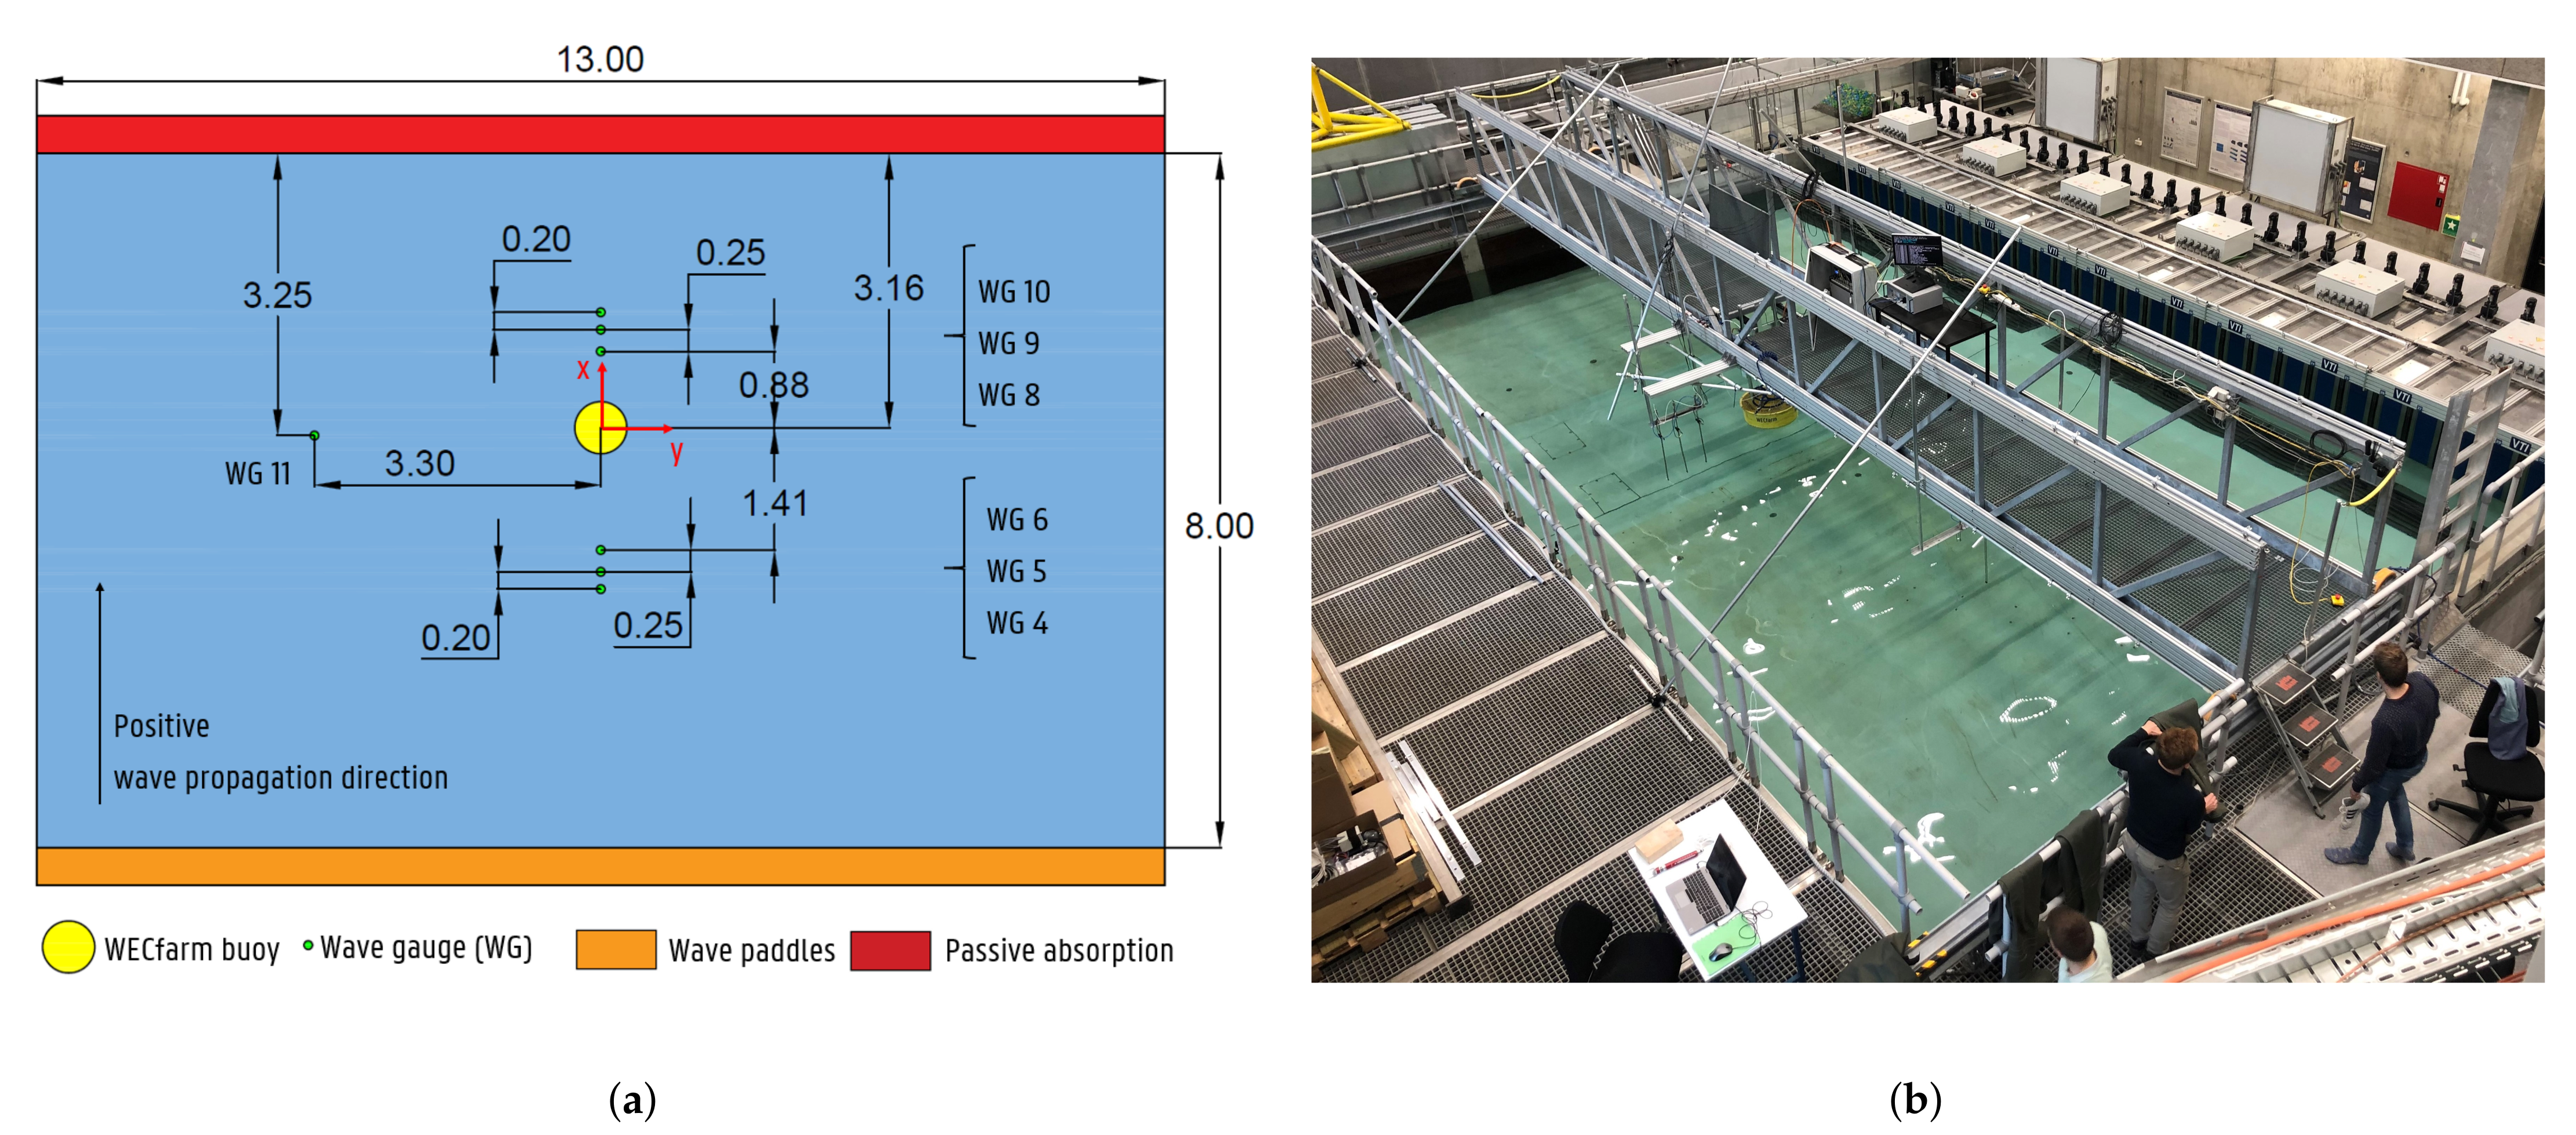
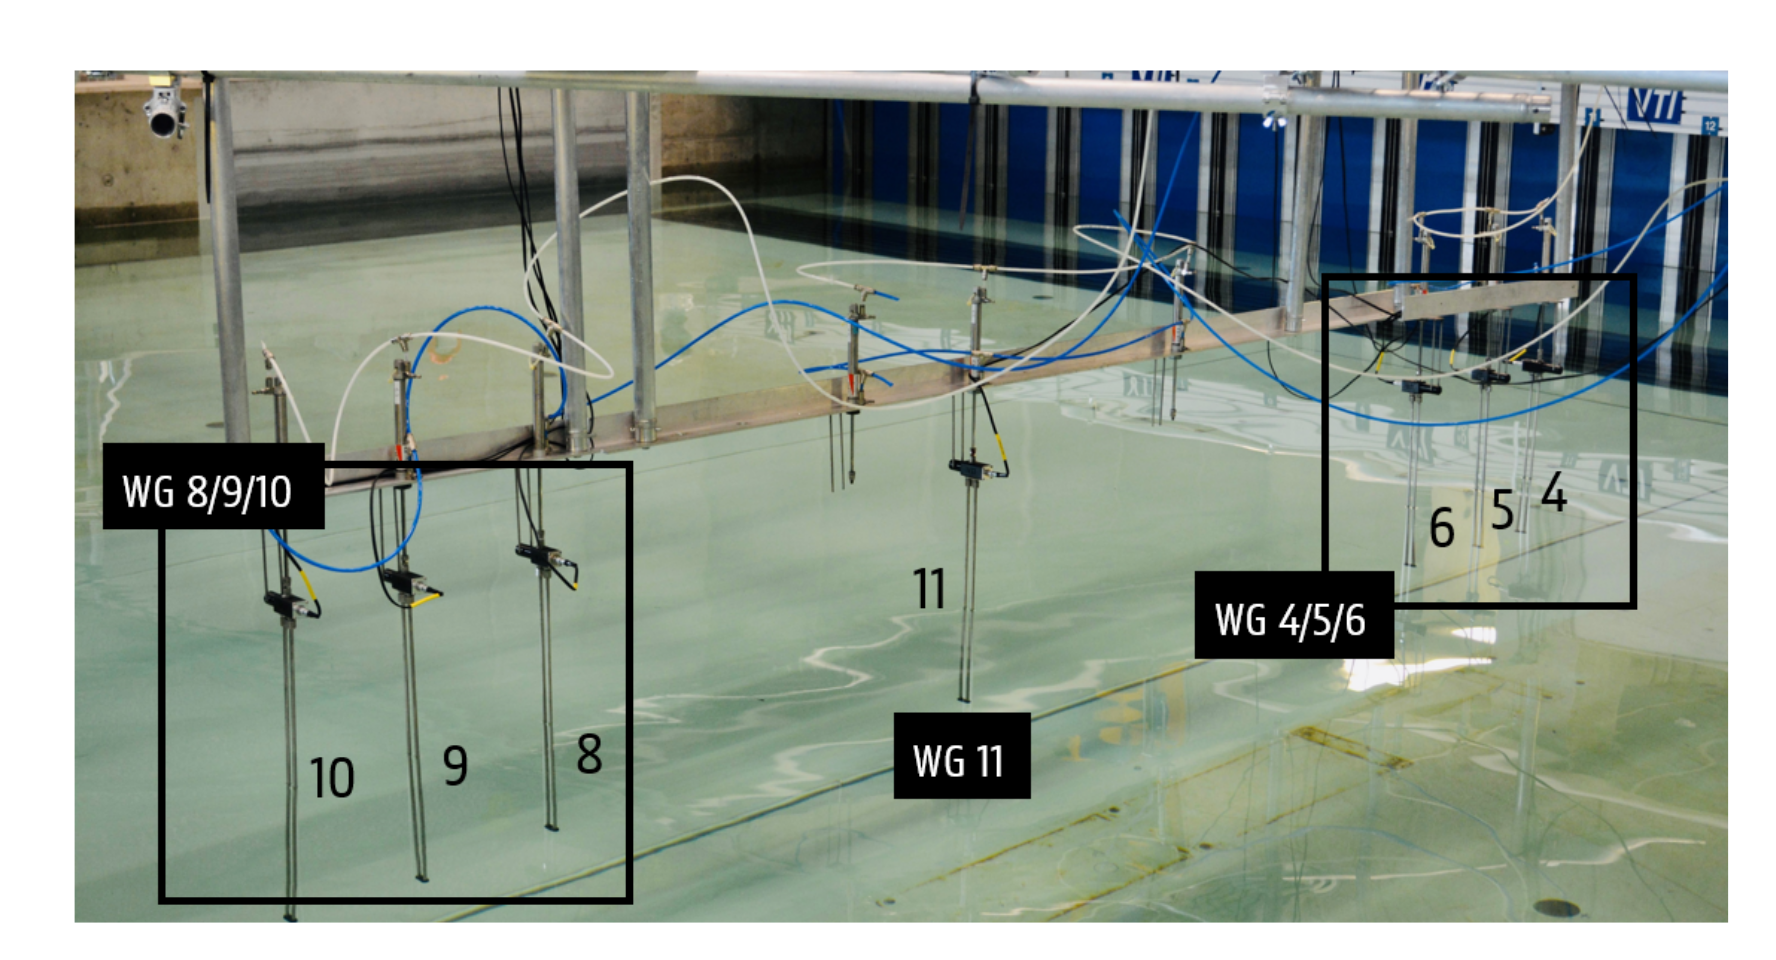
Seven resistive wave gauges (WGs) are installed in the wave basin to measure incident, diffracted, radiated and reflected waves during the tests. Figure 4a shows the planview layout of the wave basin with the central location of the WEC buoy, WGs, wave generation system and passive absorption. The interdistance between the different WGs and the WEC buoy are indicated in m and waves are generated from the bottom of Figure 4a. These seven WGs are also displayed in Figure 5a. The numbering is based on the used analog input ports of the Speedgoat IO133 terminal board.
Figure 4b shows a ‘bird’s-eye’ perspective of the experimental setup at the AAU wave basin. The WEC is attached to the bridge over the wave basin, complying with the spirit level requirements. Waves are generated from the top right corner in Figure 4b. The host PC for the Simulink control and the PC with the AwaSys software are located in line with the bridge, on the bottom right corner in Figure 4b. The water level is set equal to 1.010 m, which results in an equal positive and negative heave stroke with a magnitude of 0.25 m. This water level should be kept constant during the experimental campaign, since changing water level yields an offset for the position measurements from the laser sensor and motor encoder. A water density ρ of 1000 kg/m3 is taken into account.
Figure 5a shows a picture of the overview of the setup as schematized in Figure 3. Figure 5b shows the coordinate system and sign convention on a picture of the experimental setup, as adopted in Figure 1 and Figure 2a. During this test campaign, waves are generated in the x-direction, corresponding to the direction of the greatest stiffness of the WEC.

3. Results

3.1. Test Matrix

Table 1 gives an overview of the different types of tests that are performed. Based on their underlying purpose, they are subdivided in three categories. The next sections discuss the different test categories.

3.2. Friction Model

The air bushings coefficient of friction is a function of air shear from motion, not from surface contact. Therefore, a friction coefficient of 0.00008 in log-scale due to the contribution from air molecules and gravitation can be taken into account [23]. To obtain the air gap between the shaft and the air bushing, a compressor with a two stage air filter supplies these bushings with clean and dry air under a nominal pressure of 5.5 bar. The gearbox break-away torque T 01 is expected to be around 0.20–0.40 Nm, with convergence towards lower values for a longer operational lifetime [24]. The motor static friction M R is reported to be equal to 0.02 Nm [15]. As a result, the total drivetrain friction experienced by the WEC will be mainly determined by the Coulomb friction attributed to the gearbox. Moreover, additional Coulomb and viscous friction attributed to the rack and pinion will occur. Based on the empirical characterization of the actual friction, a static friction model is constructed, discussed in Section 3.2.1 [25].

3.2.1. Friction Characterization Tests

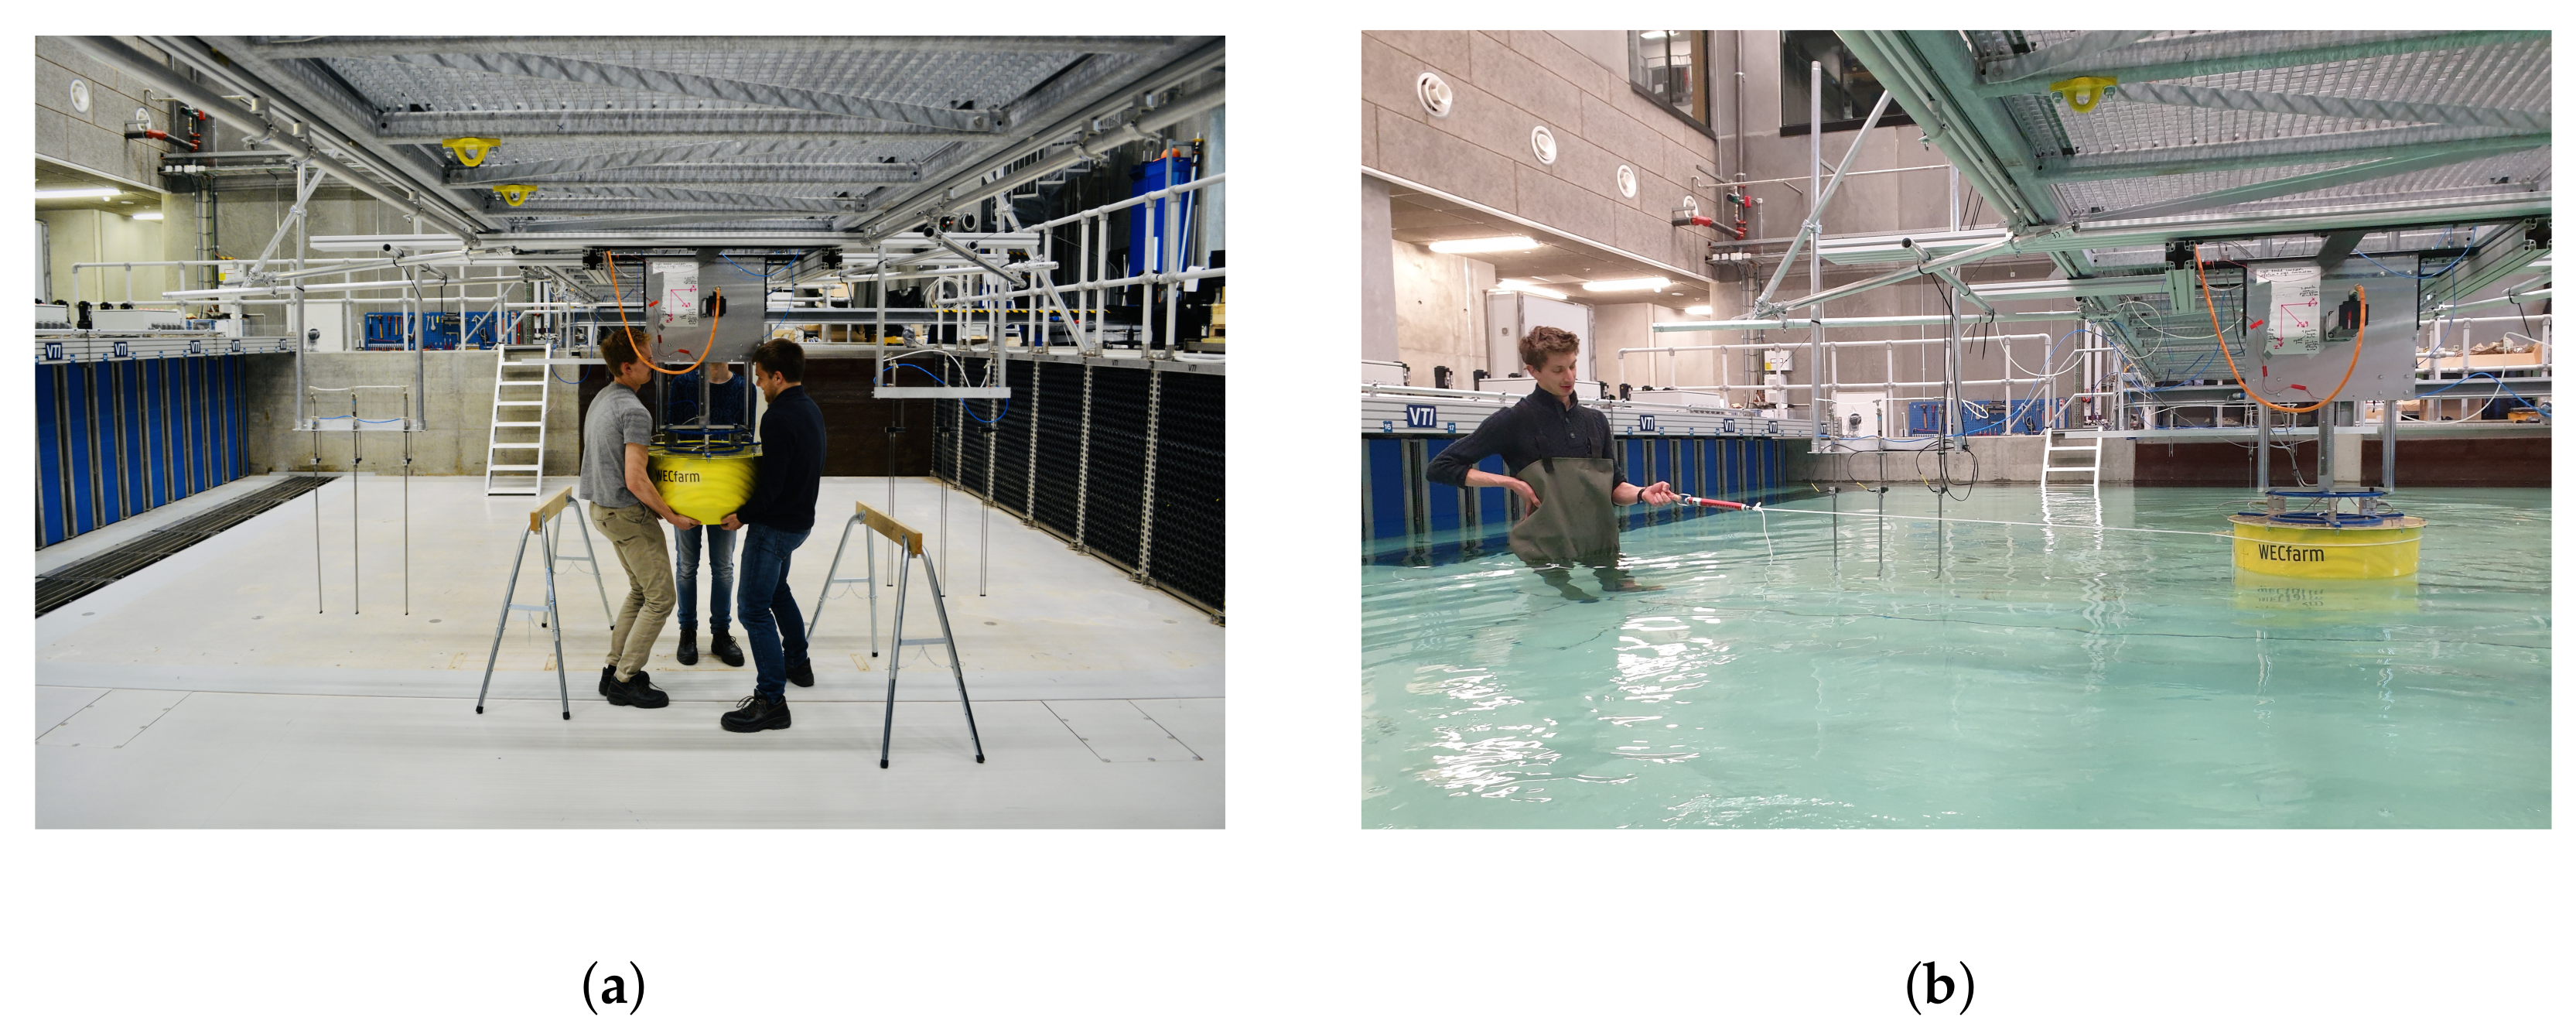
The friction of the WEC with the motor and gearbox installed is characterized by a zero torque command on the motor. The WEC buoy is manually moved up and down from below the load cells with following elements in the test sequence: slowly at a targeted constant velocity close to 0.0 m/s and an accelerated motion with amplitude up to 0.40 m/s. Figure 6a shows a picture of a friction characterization test in the empty AAU wave basin. The tests are repeated in the filled AAU wave basin to benefit from buoyancy forces.
During the execution of the lifting procedure, the force acting on the loadcells F l o a d c e l l s , the position z, the velocity z ˙ and the acceleration z ¨ are measured. The first element of the test sequence allows us to determine the Coulomb damping coefficient C C o u , while the second element allows us to determine the viscous damping coefficient C V i s .
The friction force F F r i c t i o n to compensate for equals F l o a d c e l l s reduced by the acceleration force F a c c caused by m t o p and by the rotational inertia of the motor and the gearbox. To take this rotational inertia of the motor and the gearbox into account in F a c c , it is expressed as a mass in the heave direction, i.e., the mass attributed to the motor and gearbox inertia m M G I :
m M G I = J m o t o r · i 2 + J g e a r b o x R p i n i o n 2 = 6.17 kg cm 2 · 4 2 + 0.71 kg cm 2 ( 2.12205 cm ) 2 = 22.08 kg
with J m o t o r the motor inertia equal to 6.17 kg cm2 [16] and J g e a r b o x the gearbox inertia equal to 0.71 kg cm2 [26]. It is anticipated that the actual inertia will be higher, as the inertia of the rack and pinion is not taken into account in Equation (1). The resulting F F r i c t i o n is:
F F r i c t i o n = F l o a d c e l l s F a c c = F l o a d c e l l s ( z ¨ · ( m t o p + m M G I ) )
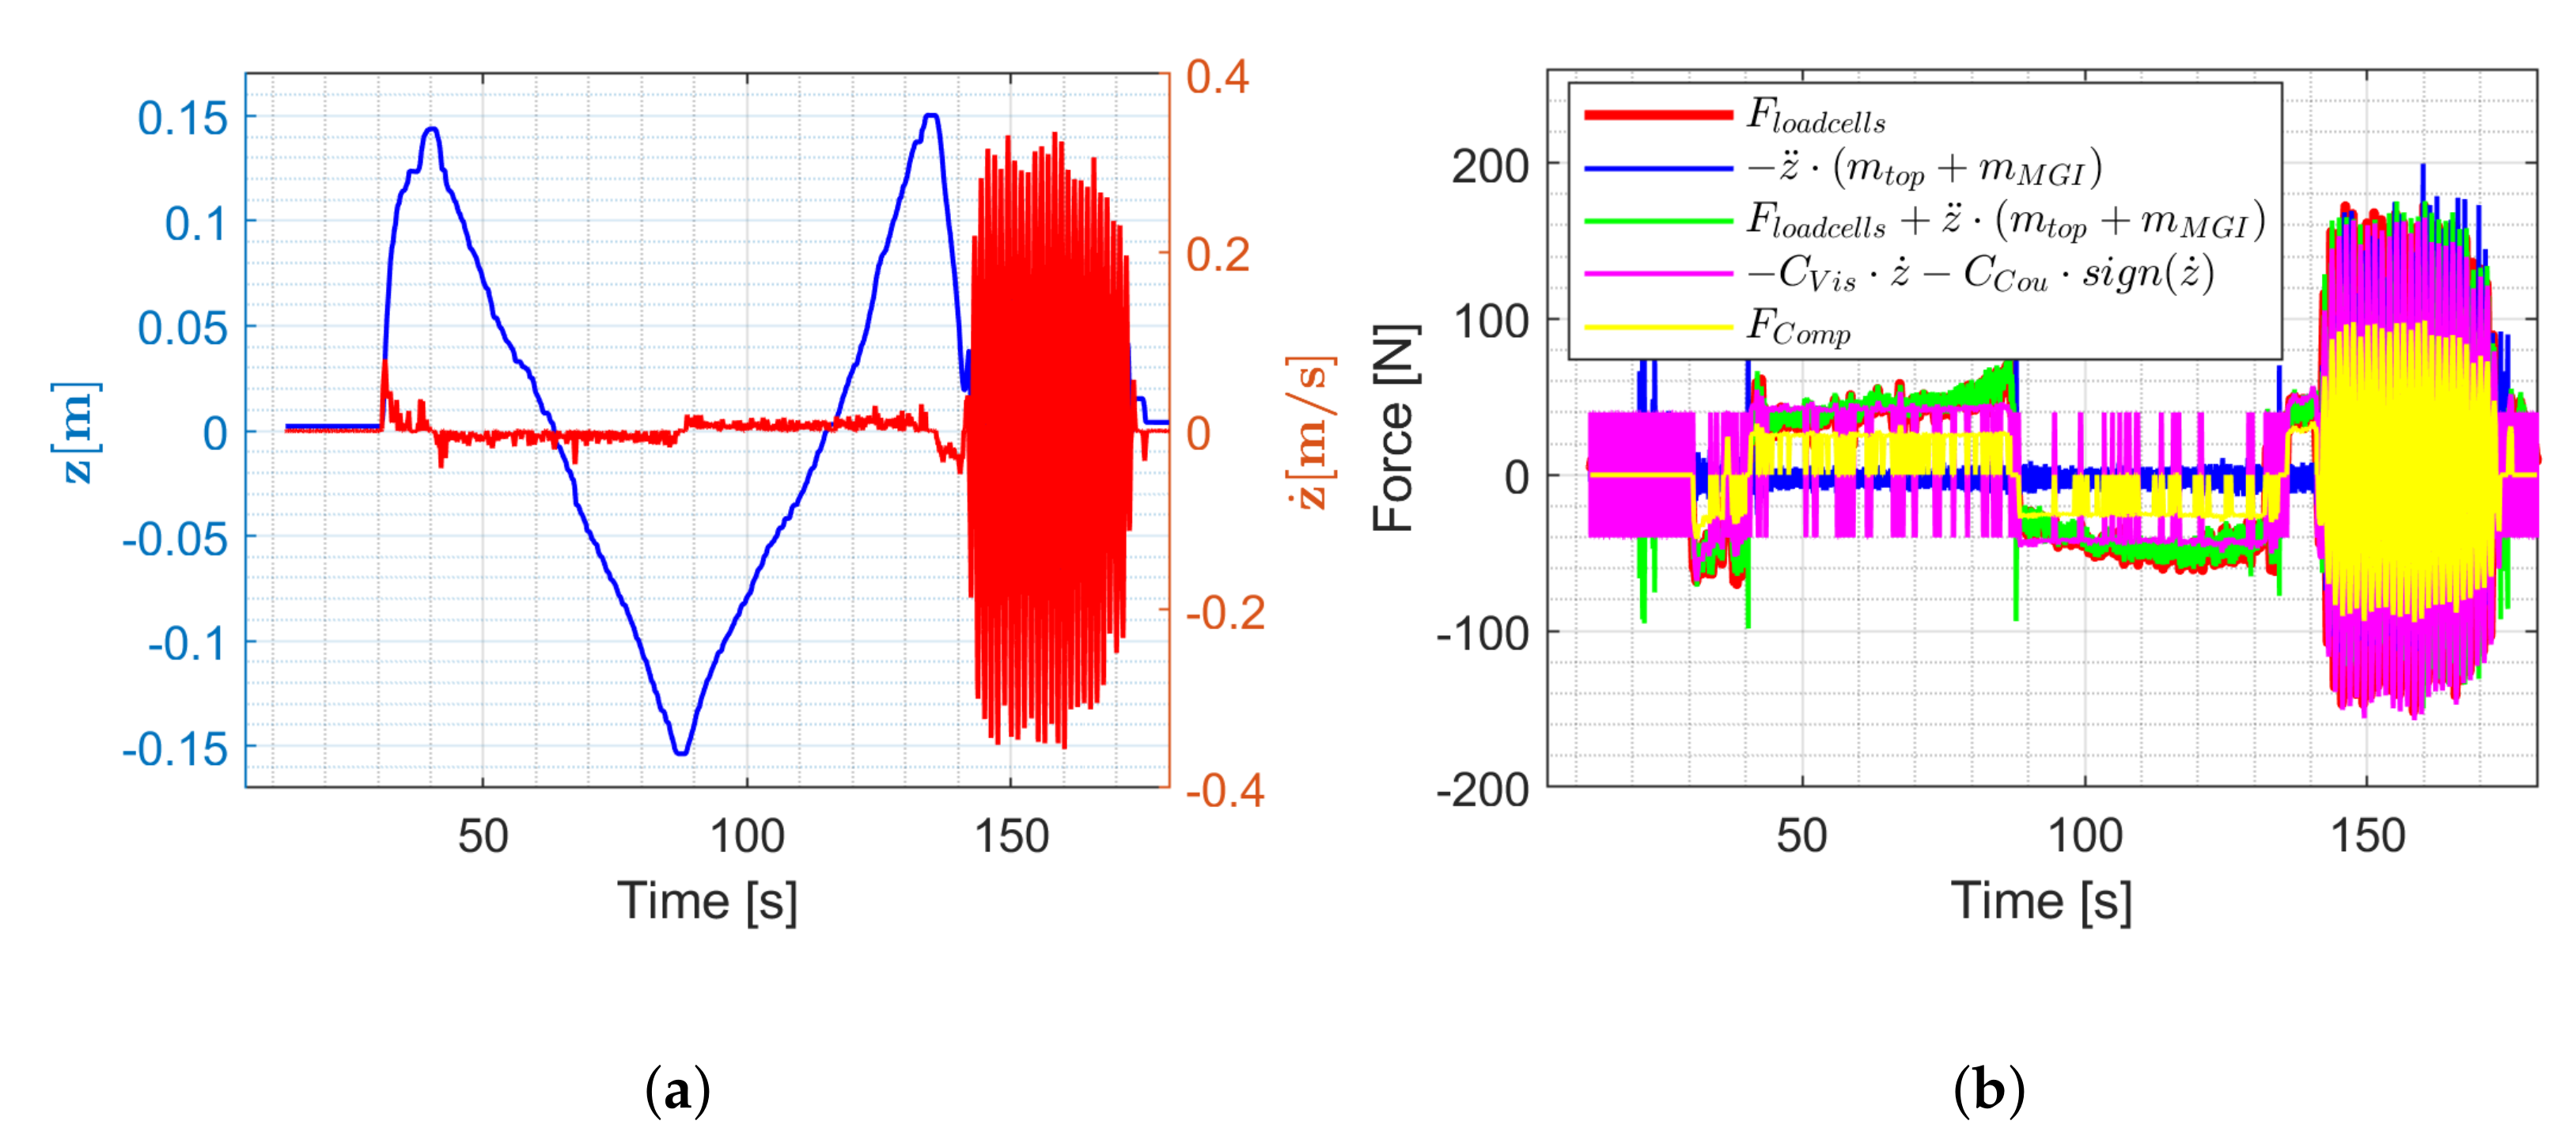
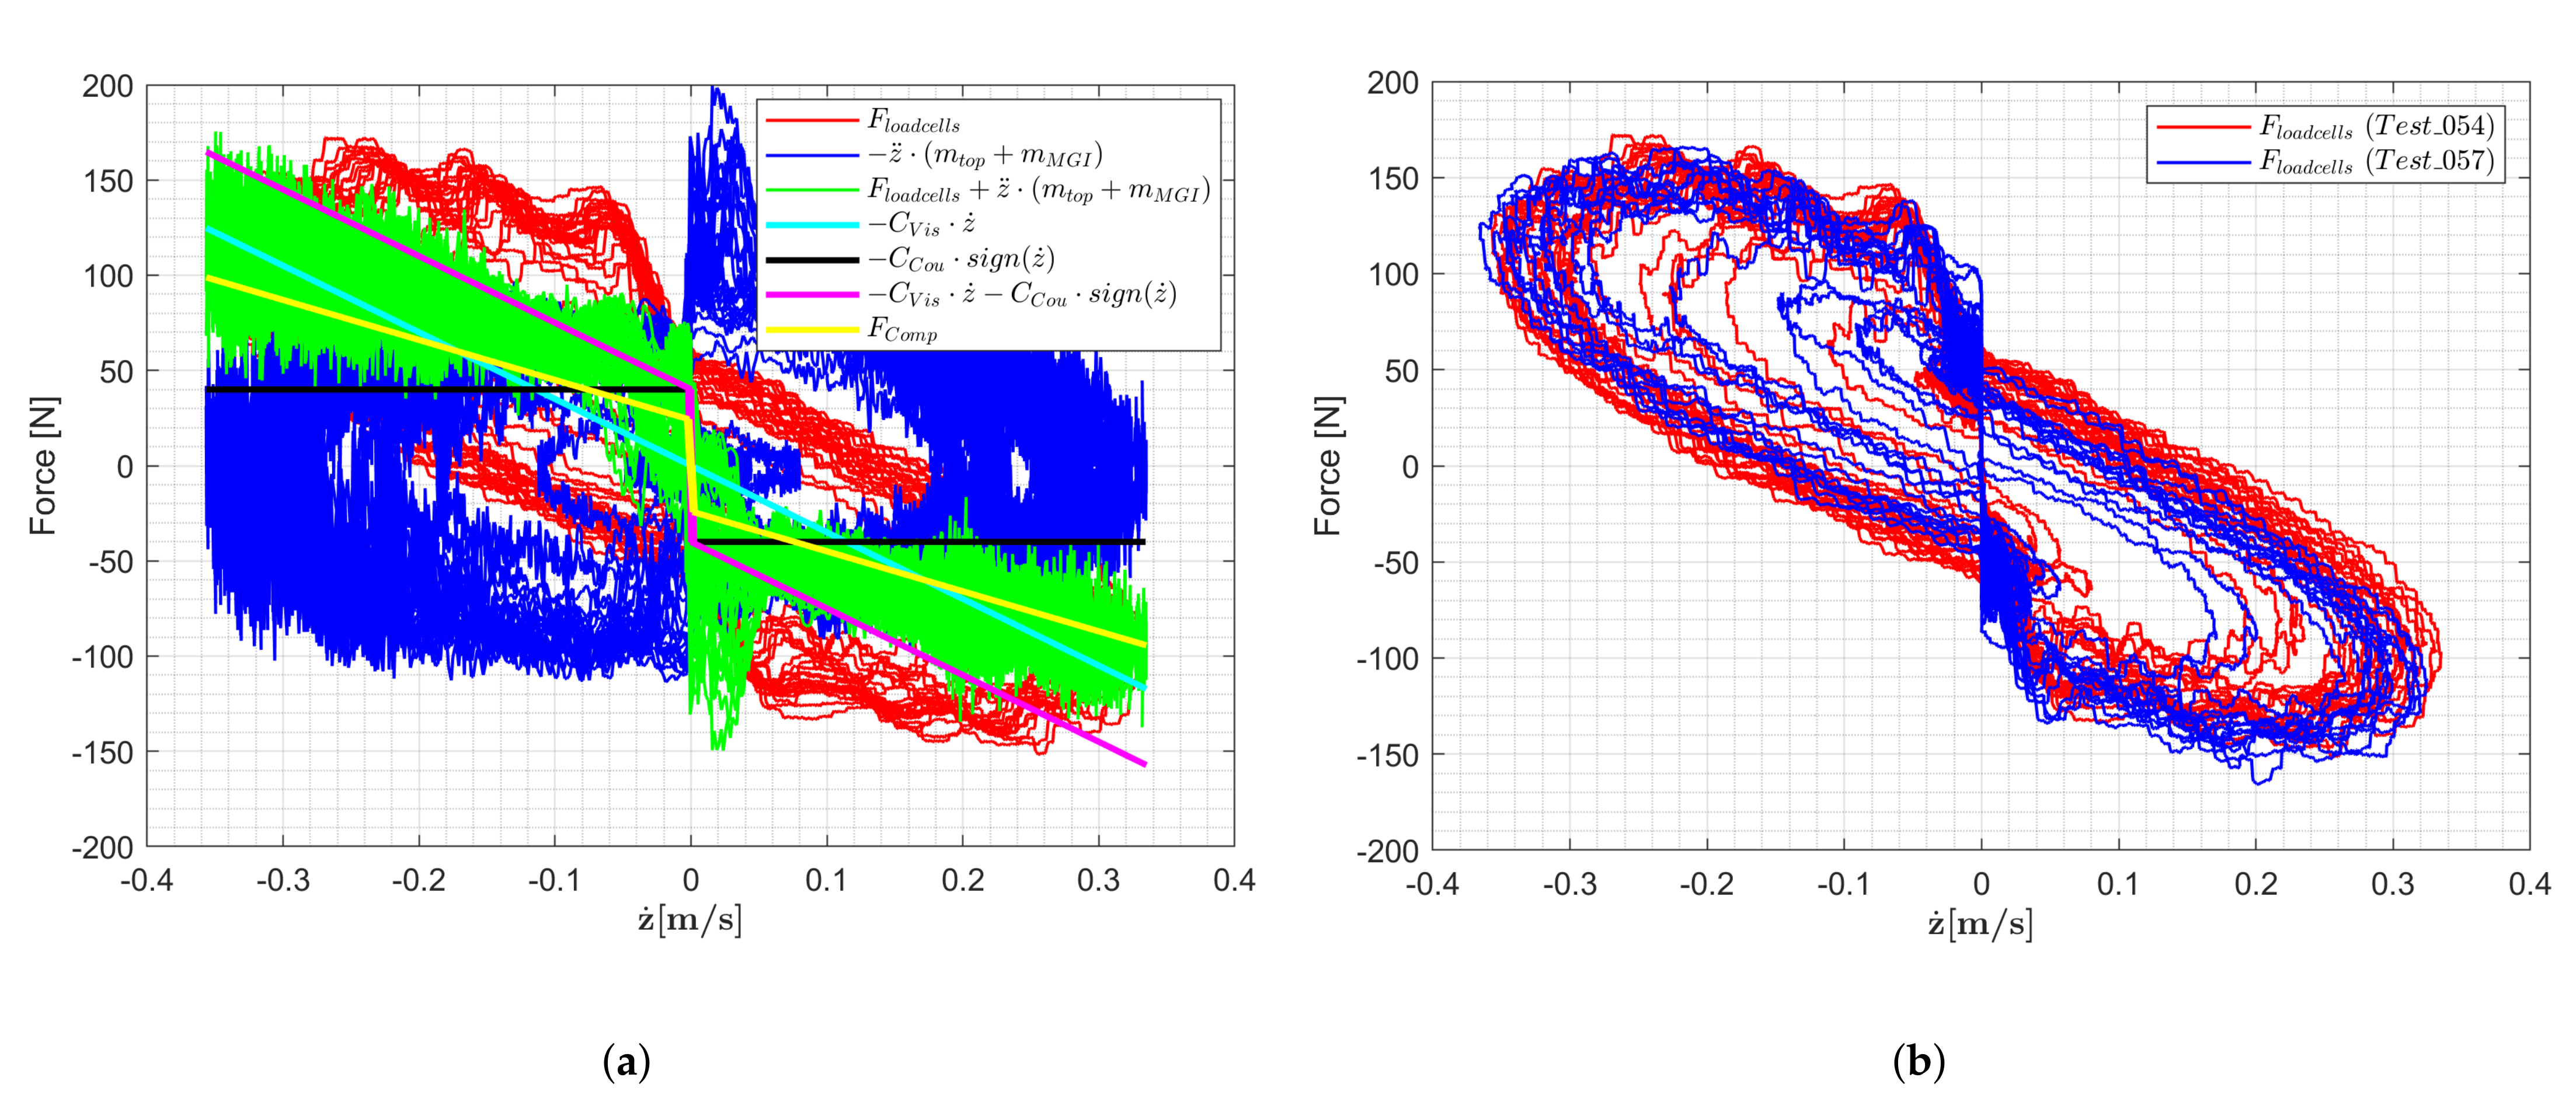
In case the motor and the gearbox are not installed and the air bushings work properly, F a c c should equal F l o a d c e l l s , resulting in F F r i c t i o n = 0 N. Figure 7a shows the z and z ˙ time series for the friction characterization Test_054. Figure 7b shows the time series of F l o a d c e l l s , F a c c , F F r i c t i o n and the fitting of C V i s and C C o u . F l o a d c e l l s exceeds F a c c due to the addition of the drivetrain (motor, gearbox and rack and pinion) friction.
Fitting a model to F F r i c t i o n results in the friction compensation model F C o m p , given by Equation (3).
F C o m p = 0 for z ˙ B o u z ˙ z ˙ B o u C V i s · z ˙ C C o u · s i g n ( z ˙ ) C C for z ˙ < z ˙ B o u z ˙ > z ˙ B o u
Note that an additional minus sign is necessary to have F C o m p in the same direction as z ˙ . The model is composed of a Coulomb part proportional to the sign of the velocity and a viscous part proportional to the velocity. A velocity boundary z ˙ B o u is imposed to avoid rapid sign switches for the Coulomb friction term at low velocities. Consequently, no friction compensation is taken into account between − z ˙ B o u and z ˙ B o u . These boundaries correspond approximately with the noise range on the velocity feedback from the motor encoder. Moreover, it is preferred to partly compensate for the friction to preserve a realistic PTO, expressed by the compensation factor C C . Figure 8a shows the F l o a d c e l l s to z ˙ mapping for the friction characterization Test_054, which allows us to fit the parameters of F C o m p . Table 2 provides the obtained values for C V i s , C C o u , C C , and z ˙ B o u .
Figure 7b shows the time series of F C o m p . The proper functioning of the velocity boundaries can be observed as less sign switches occuring for F C o m p (yellow curve) compared to the fitting of C V i s and C C o u (magenta curve). The difference between F F r i c t i o n (green curve) and F C o m p (yellow curve) is the remaining PTO friction.
The friction characterization tests are repeated with different lateral loading conditions, as an approximation for the surge or sway wave excitation force. In the wave propagation direction (x-direction) −20 kg is applied with a tension spring and rope around the WEC buoy, shown in Figure 6b (Test_057). This loading of 196 N corresponds approximately with a surge wave excitation force for a wave with period T = 1.0 s and wave height H = 0.40 m, according to linear potential flow simulations with the open-source software package openWEC [27], with the integration of the Boundary Element Method (BEM) code Nemoh. The F l o a d c e l l s to z ˙ mapping in Figure 8b shows no increased F l o a d c e l l s for Test_057 compared to Test_054, demonstrating the proper functioning of the air bushings. In the Simulink model, the uncompensated input motor torque τ m o t o r , u n c o m p augmented with F C o m p ( R p i n i o n / i ) yields the compensated input motor torque τ m o t o r , c o m p :
τ m o t o r , c o m p = τ m o t o r , u n c o m p + F C o m p R p i n i o n i
Note that the friction compensation in Equation (4) is implemented as a feedback control structure, since the velocity output of the WEC is used. Commonly, a friction compensation feedforward control structure is adopted when tracking a reference is the objective, which is not the case here [28]. Table 3 provides an overview of all the executed friction characterization tests, with indication of the filling of the AAU wave basin, lateral loading force, lateral loading direction and applied air pressure. The Test_ID is the identification number of each performed test.

3.3. System Identification

3.3.1. Linear Decomposed Wave–WEC Interaction Model

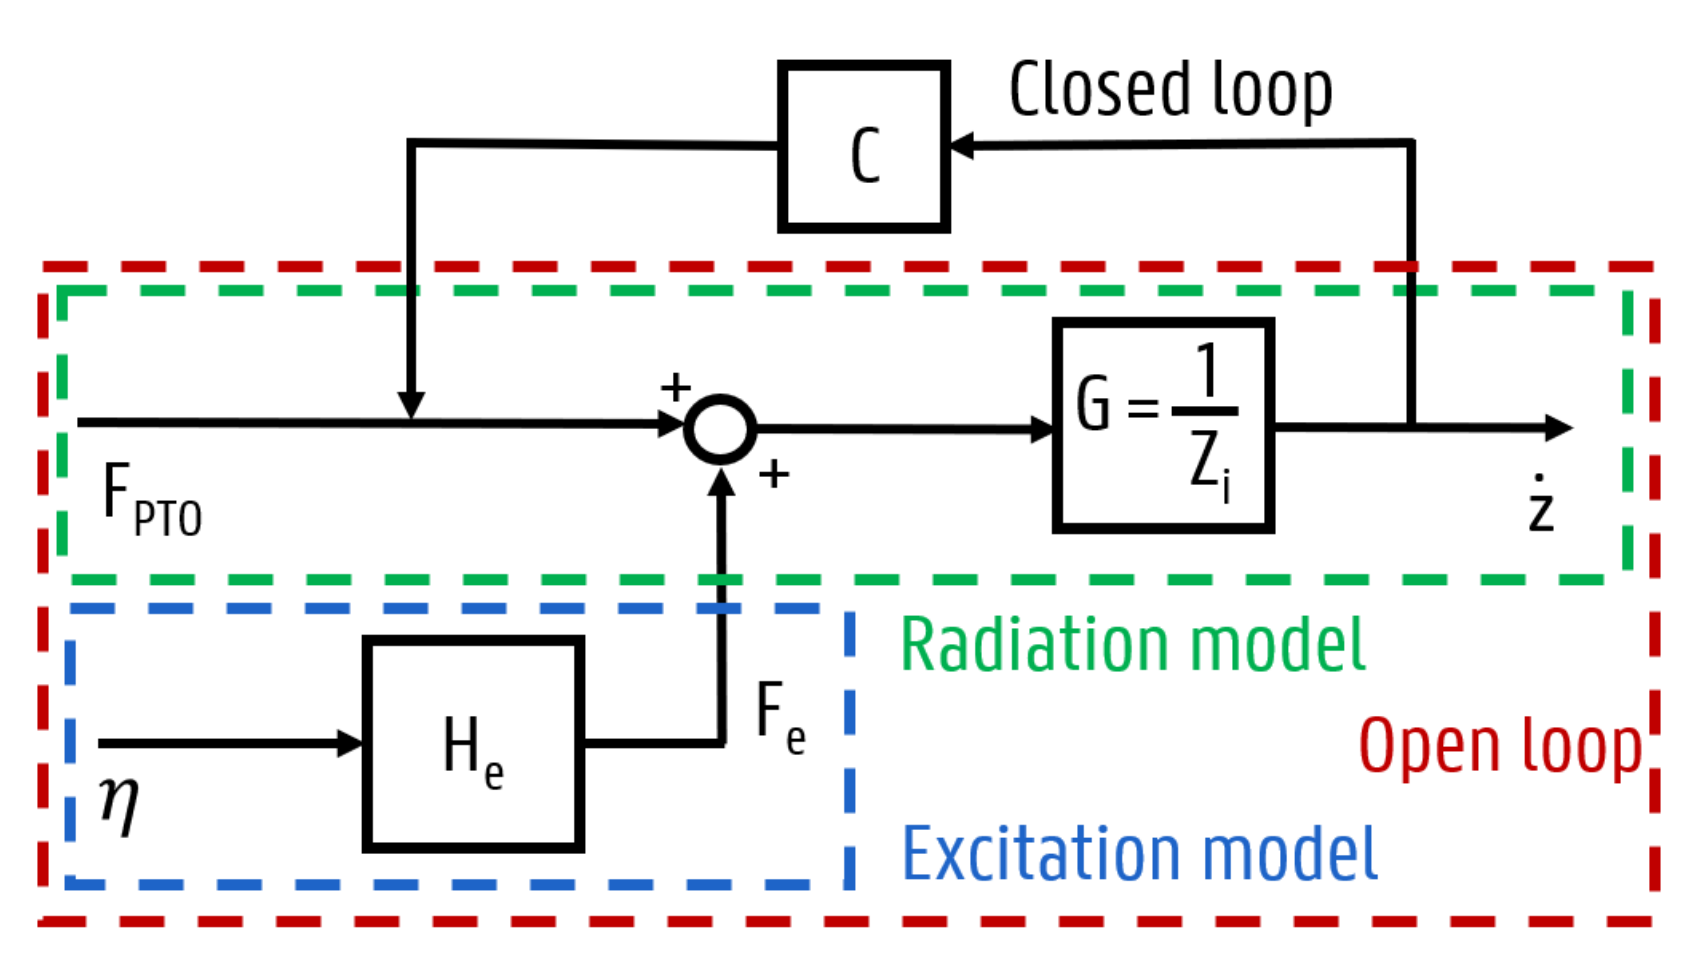
To perform a SID of the WEC, a linear decomposition model formulation for the wave–WEC interaction is adopted. The problem is separated into radiation and excitation components. Distinct tests are performed for both the radiation and the excitation components to determine the WEC system response, whereafter radiation and excitation frequency response functions (FRFs) can be constructed from the discrete frequency components. At a high level of abstraction, the WEC can be considered as a system with two inputs: the surface elevation η and F P T O , as displayed in Figure 9. When the WEC system, consisting of the PTO and the WEC buoy, is assumed to be linear for small motions and small waves, superposition can be applied. The WEC system is considered to be composed of two single input single ouput (SISO) models, the radiation and the excitation model, as displayed in Figure 9 [12,13,29]:
The radiation model is obtained by computing the ratio of the FRF of the output z ˙ to the FRF of the input F P T O , resulting in the admittance G ( ω ) :
G ( ω ) = X ˙ ^ ( ω ) F ^ P T O ( ω )
The quantities are expressed as a function of the angular frequency ω . The upper case indicates that these variables are all in the frequency-domain, while the hat symbol ˆ denotes that these variables are complex quantities. The control parameters for the impedance matching controller are determined from the intrinsic impedance Z i ( ω ) , defined as the inverse of G ( ω ) :
Z i ( ω ) = ( G ( ω ) ) 1 = F ^ P T O ( ω ) X ˙ ^ ( ω )
Mechanical impedance is a measure of the opposition to motion from a source when a potential is applied, defined as the ratio of force (potential) to velocity (flow) in Equation (6). Note that X ˙ ^ is used instead of Z ˙ ^ for the FRF of z ˙ , to avoid confusion with the defined Z i . The excitation model is obtained by computing the ratio of the FRF of the output excitation force F e , measured as F l o a d c e l l s , to the FRF of the input η at the location of the WEC, resulting in the excitation force coefficients H e ( ω ) :
H e ( ω ) = F ^ e ( ω ) η ^ ( ω )
In the first instance, the above-discussed SID tests are carried out in “open loop”, which means no output feedback is considered, represented in Figure 9 by no feedback arrow. A “closed loop” is obtained at any time the WEC is controlled and F P T O is calculated based on an output measurement. In Figure 9, F P T O depends on z ˙ , as F P T O = C z ˙ , with C representing the control system dynamics. In case of resistive damping, C is a negative constant in this formulation. As a result, the frequency-domain WEC equation of motion, as displayed in Figure 9 as the dual SISO model, is given by:
F ^ P T O + H e ( ω ) η ^ = F ^ P T O + F ^ e = Z i ( ω ) X ˙ ^
By applying the superposition principle, the decomposition in the radiation and excitation model is given by:
X ˙ ^ = 1 Z i ( ω ) ( F ^ P T O + H e ( ω ) η ^ ) = 1 Z i F ^ P T O + H e ( ω ) Z i ( ω ) η ^

3.3.2. Impedance Formulation and Radiation Tests

When the Fourier transform F differentiation property is applied to write z ¨ in terms of z ˙ :
F [ z ¨ ( t ) ] = i ω X ˙ ^ ( ω )
the point absorber WEC equation of motion can be written in terms of X ˙ ^ ( ω ) [12,30]:
m i ω X ˙ ^ ( ω ) = ( B ( ω ) + i ω A ( ω ) ) X ˙ ^ ( ω ) + K i ω X ˙ ^ ( ω ) + F ^ P T O + F ^ e
where m = 36.83 kg, A ( ω ) is the added mass coefficient and B ( ω ) is the hydrodynamic damping coefficient. The hydrostatic stiffness coefficient K is given by:
K = ρ g S
where S is the cross-sectional area of the WEC buoy at the SWL equal to 0.283 m 2 , ρ = 1000 kg/m 3 and g the gravitational acceleration equal to 9.81 N/kg. Rearrangement of Equation (11) based on Equation (9), results in Z i ( ω ) :
Z i ( ω ) = F ^ P T O + F ^ e X ˙ ^ = B ( ω ) + i ω ( m + A ( ω ) ) K ω
Z i ( ω ) is experimentally determined by executing a forced oscillation test in the AAU wave basin, without waves generated by the wave paddles. In Equation (13), F e equals zero and F P T O is a chirp signal with a frequency spectrum covering the bandwidth of interest [13]. Since it is experimentally more convenient to use F P T O as an input and measure the output z ˙ , Z i is obtained as the inverse of G, defined by Equations (5) and (6).
Table 4 shows an overview of the performed radiation tests. The chirp-up PTO input torque is defined with an initial frequency of 0.0 Hz, a target time of 220 s and a frequency at target time of 4.0 Hz. The chirp-down PTO input torque is defined with an initial frequency of 4.0 Hz, a target time of 220 s and a frequency at target time of 0.0 Hz. The noise signal is defined with an amplitude of 1.0 Nm, multiplied by the defined PTO gain to control the absolute maximum heave amplitude of the WEC buoy z m a x . Most of the test were executed with C C = 0.0 , without the friction compensation model discussed in Section 3.2 included. Test_112 and Test_113 consider C C = 0.6 , which is the WEC system to build the resistive and reactive controller on.
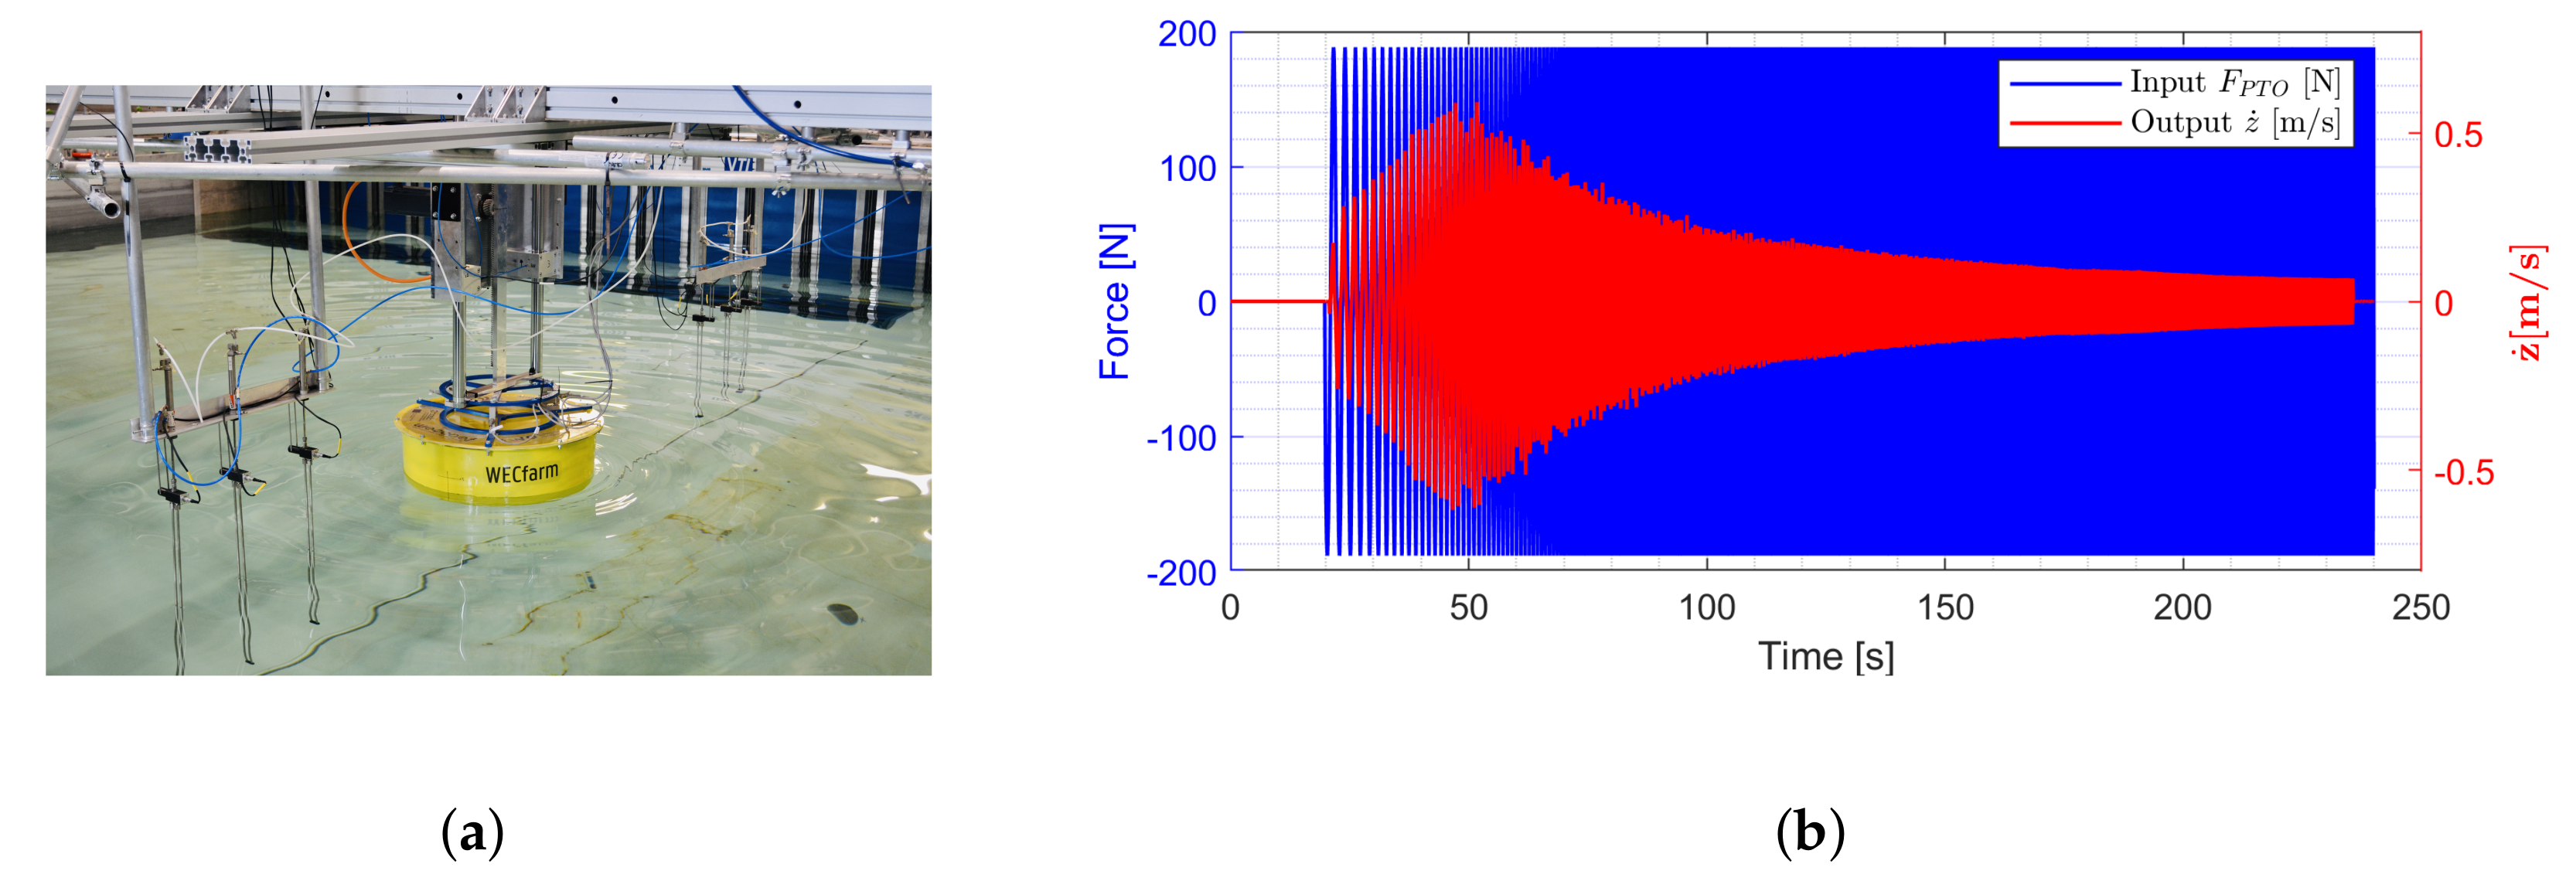
Figure 10a displays a radiation test for the ‘WECfarm’ WEC, where the circular radiated waves can be observed. Figure 10b shows the F P T O and z ˙ time series, for which z ˙ displays a resonance. According to Equation (4), a τ m o t o r , u n c o m p of 1.0 Nm corresponds with a F P T O of 188.5 N.
The calculated Z i can be displayed as a bode plot with gain and phase, given in Figure 11 for Test_021, Test_059, Test_066, Test_112 and Test_113 [12]. Comparing Test_021 with Test_059 confirms that the chirp-up and chirp-down signal yields the same Z i ( ω ) . Test_066 with a gain of 0.5 and z m a x = 0.041 m results in a higher identified Z i compared to Test_059 with a gain of 1.0 and z m a x = 0.116 m, stressing the importance of covering motion amplitudes representative for the WEC during operation. Test_112 and Test_113 demonstrate how the implementation of F C o m p alters the WEC system dynamics. As expected, z ˙ is more amplified when the friction is compensated. The WEC resonance frequency f n is equal at 0.84 Hz, corresponding to a natural period T n = 1.19 s.

3.3.3. Excitation Tests

H e ( ω ) is experimentally determined by locking the WEC in equilibrium position, as defined in Figure 2a, imposing a frequency rich η signal and measuring F l o a d c e l l s . The WEC is fixed by deactivating the motor drive, resulting in an active holding brake. Application of Equation (7) results in H e ( ω ) .
Table 5 shows an overview of the performed excitation tests. The wave input generated by the wave generation system is a JONSWAP wave spectrum, defined by a peak enhancement factor γ of 3.3 and the mentioned significant wave height H s and peak period T p . In the case of Test_133 with regular waves, H and T are mentioned. Using a start signal from the wave paddles and recording the wave paddle motion, allow for a deterministic comparison of the same sea state over different control inputs and types.
Figure 12a displays an excitation test for the WECfarm WEC, where the incoming and diffracted waves can be observed. Figure 12b shows the F l o a d c e l l s and η W G 11 time series for Test_074. When a wave crest (negative η ) passes the WEC buoy, the load cells are compressed, resulting in a positive F l o a d c e l l s . When a wave trough (positive η ) passes the WEC buoy, the load cells are under tension, resulting in a negative F l o a d c e l l s .
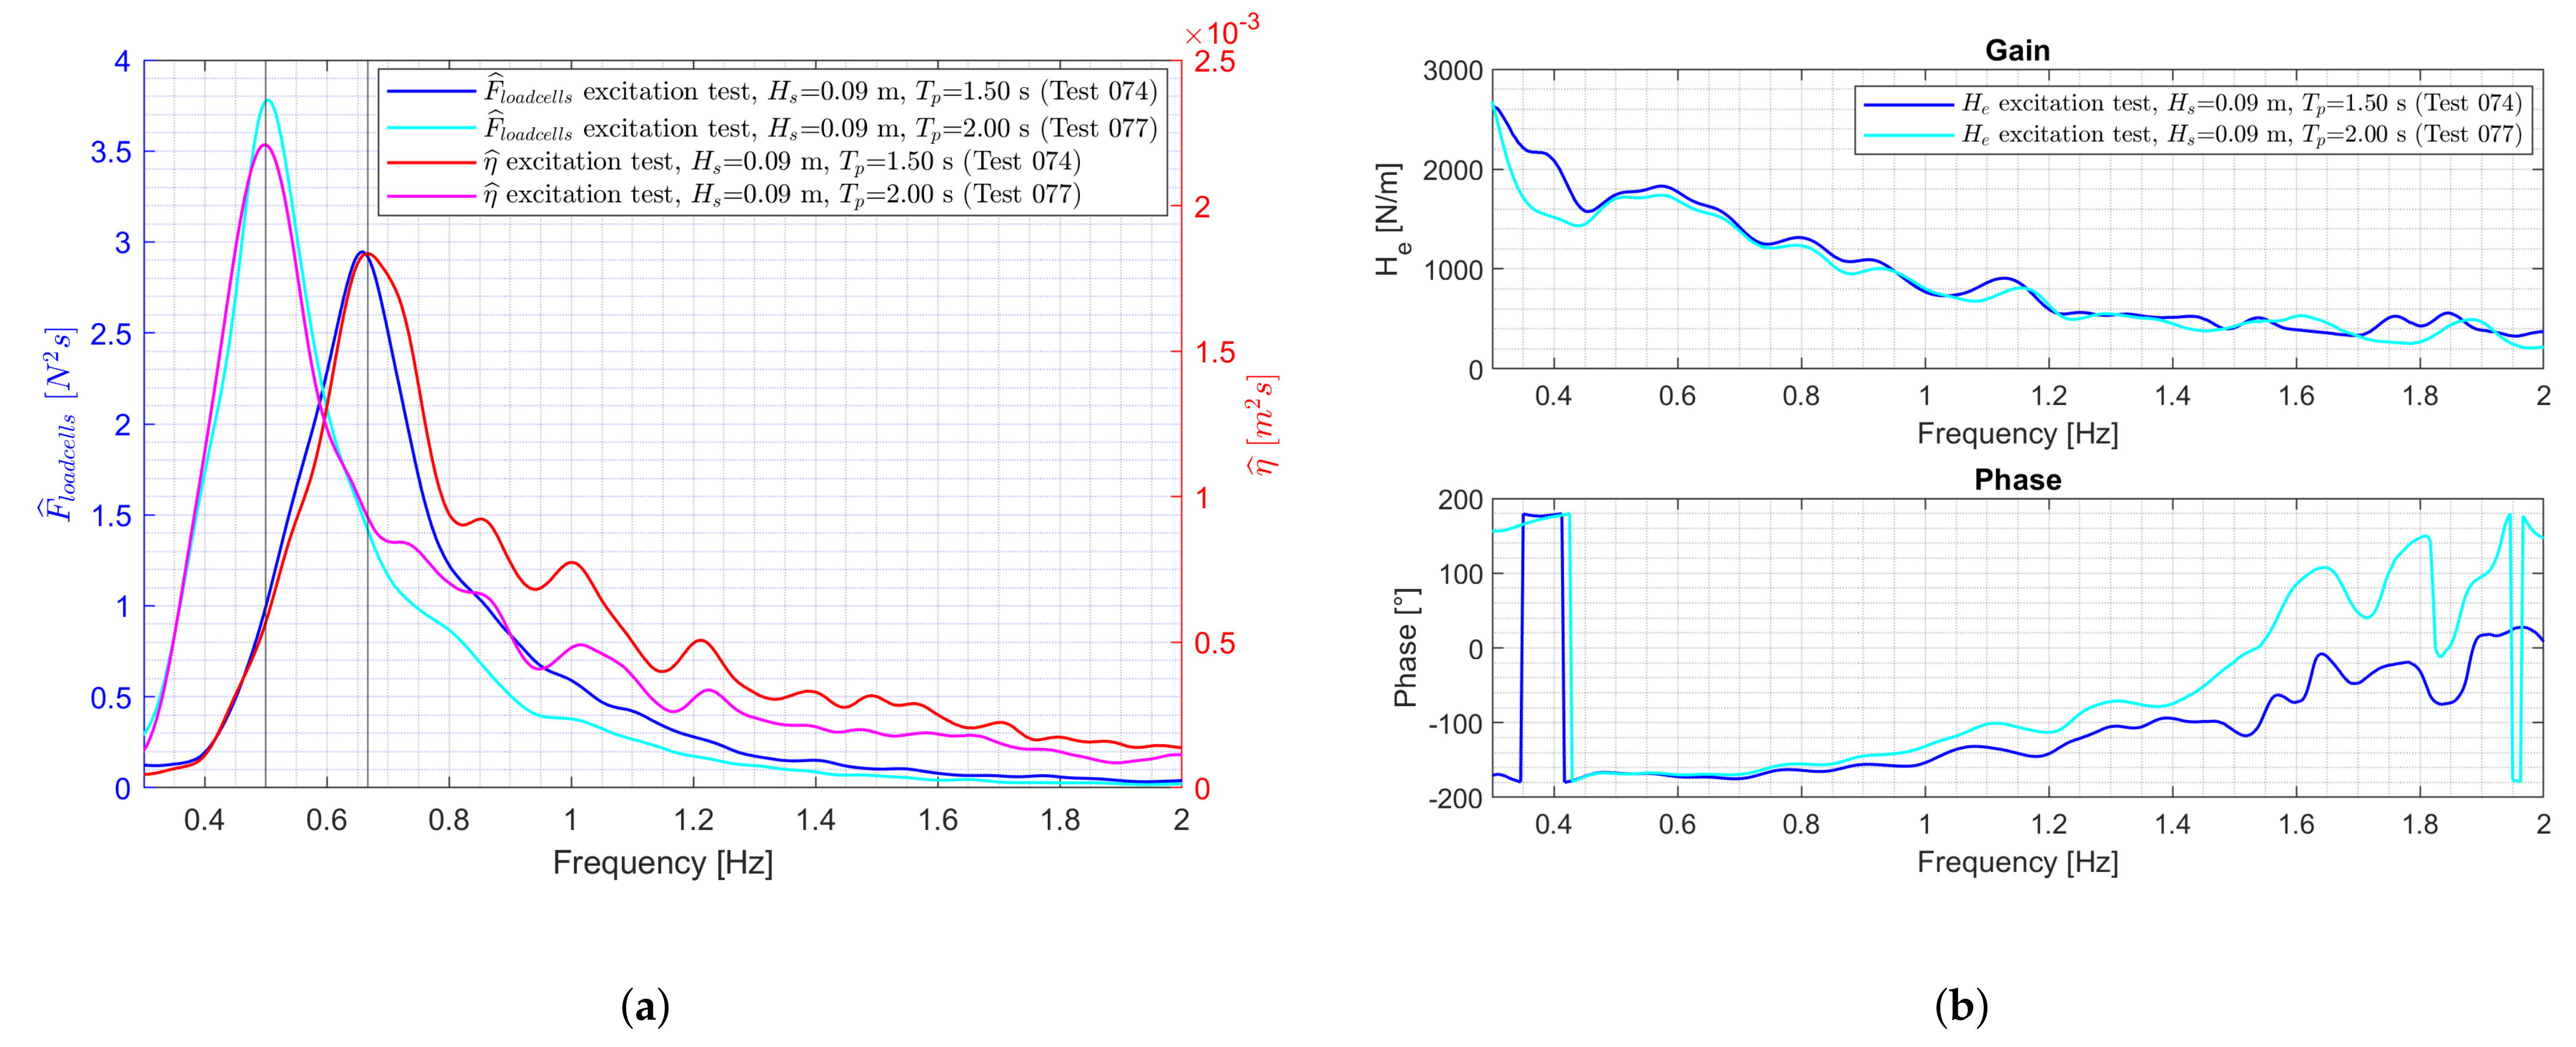
Figure 13a shows the resulting F ^ l o a d c e l l s , equivalent to F ^ e , and η ^ for Test_074 and Test_077. The calculated H e can be displayed with a gain and phase, given in Figure 13b for Test_074 and Test_077. Frequency smoothing has been performed on F ^ l o a d c e l l s , η ^ and the gain and phase of H e . The Gaussian-weighted moving average over a window of 30 frequency intervals of 0.0042 Hz has been taken. Figure 13b confirms the higher H e for lower wave frequencies, as noticed in Figure 13a.
To calculate H e ( ω ) based on the most straightforward conceptual definition, a WG is placed on the location of the WEC buoy when the WEC buoy is not present and then record the η time series. The WEC buoy is then put in place and the same wave time series are run again, this time measuring the force on the WEC buoy caused by the waves. For control purposes, this procedure is of little use, since it is clearly not possible to measure η at the point where the WEC is located, once the WEC is in place. Therefore, η obtained with WG 11 is used as an approximation for η on the location of the WEC buoy. It is shown by Bacelli et al. that if the distance between the WEC buoy and the WG is increased, the term describing the diffracted waves at the WG becomes small enough and the original model given by Equation (9) can be adopted [13].
To verify the assumption that the data of WG 11 of these excitation tests could be used for this purpose, at the end of the test campaign some tests with wave spectra are executed with the WEC buoy removed and WG11 moved to the position of the WEC buoy, equilinear with the other WGs. For these tests, the interdistance WG 6 to WG 11 is 1.31 m and the interdistance WG 11 to WG 8 is 0.98 m. Figure 14 shows a picture of this layout of the WGs.
Three JONSWAP spectra and one regular wave are tested, defined in Table 6.
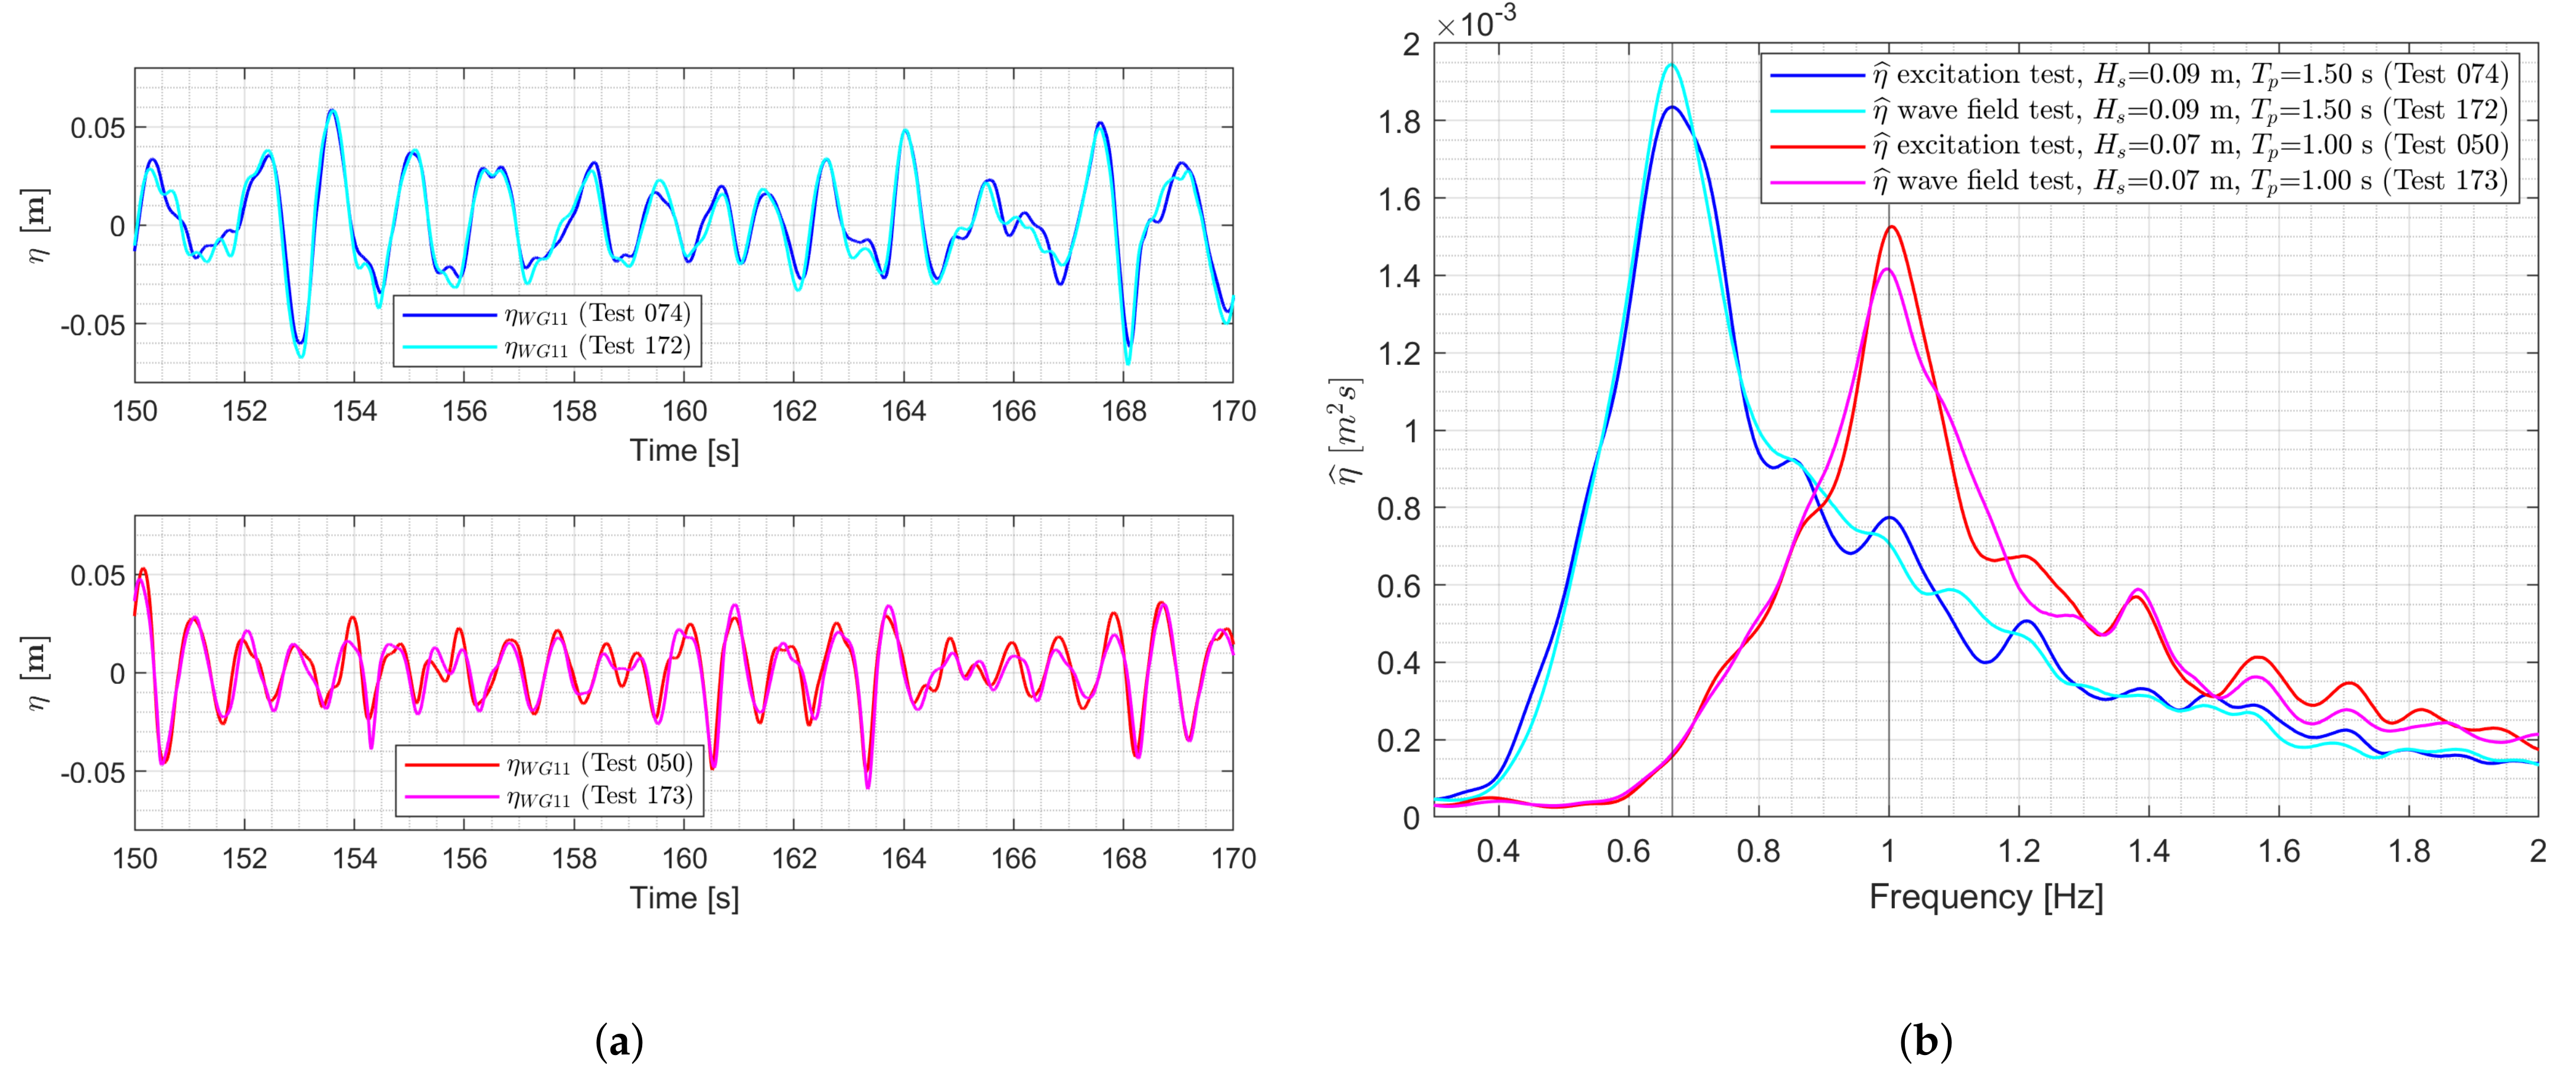
The top Figure 15a shows the time series comparison between η measured by WG11 in excitation Test_074 and η measured by WG11 in Test_172. The bottom Figure 15a shows this comparison for Test_050 and Test_173.
For both wave conditions, a minor difference between the two time series can be observed. Figure 15b shows η ^ for Test_074 compared to Test_172 and η ^ for Test_050 compared to Test_173. Figure 15a,b confirm that η obtained with WG 11, according to the layout of the WGs in Figure 4a, can be used as an approximation for η on the location of the WEC buoy.

3.3.4. Free Decay Tests

Free decay tests are executed to determine the decay response. The heave displacement z allows us to calculate the logarithmic decrement Λ , the corresponding damping ratio ξ d and the natural period T n . This T n should correspond with the one obtained from the radiation tests discussed in Section 3.3.2. Conceiving the WEC as a mass-spring-damper system, ξ d follows from Λ [31]:
Λ = 1 n 1 l n x 1 x n = 2 π ξ d 1 ξ d 2
in which x 1 and x n are the values of the first and the n-th peak of the free decay motion z. For un underdamped system (0 < ξ d < 1), the oscillations of the WEC buoy fade exponentially over time and tend toward zero, yielding the envelope:
z e ( t ) = z A · e x p ( ξ d ω n t )
in which z A is the amplitude of the free WEC response [31]. The angular natural frequency ω n of the WEC buoy can be calculated from the damped natural frequency ω d :
ω n = 2 π T n = ω d 1 ξ d 2
Table 7 gives an overview of the executed free decay tests, with indication of the start position of the WEC buoy z s t a r t , C C , n used Equation (14), ξ d and T n . A positive z s t a r t corresponds to a submerged start position and a negative value corresponds to an elevated start position. The WEC buoy is submerged or elevated with a torque command. Once the torque is set equal to zero, the decay motion is initiated. Test_089 and Test_129 yield a T n equal to 1.19 s, corresponding to the value obtained by the bode plots of the radiation tests displayed in Figure 11. When the motor and gearbox with pinion are removed in Test_170, a T n equal to 1.00 s is obtained. This lower T n can be attributed to the removed inertia within the PTO drivetrain since removing inertia results in a lower T n . Test_089 and Test_129 yield a ξ d of 0.13 and 0.12, respectively, corresponding to an underdamped system. Given this low ξ d , ω n will closely approximate ω d .
The limited draft in combination with the flat bottom will introduce important bottom slamming effects for tests where the WEC buoy re-enters the water after being lifted out [32]. These bottom slamming forces are assessed in Test_161 and Test_162, for which the start position of the WEC buoy is completely lifted out of the water. In addition, nonlinear viscous drag effects occur. The semi-empirical Morison equation describes the viscous force F v i s in function of a viscous drag coefficient C D [33]:
F v i s = 0.5 ρ S C D X ˙ | X ˙ |
This C D can be identified from experiments or from fully viscous modelling methods based on the Navier–Stokes equations [34,35,36]. The experimental quantification of bottom slamming effects and nonlinear viscous drag effects is not addressed in the presented article.
Test_170 considers multiple free decay tests for the WEC buoy with the motor and gearbox with pinion removed. While z is obtained by both the laser and encoder for the other tests, only laser measurements are available when the motor is removed. The WEC buoy is manually pushed down or lifted from the measurement bridge.
Figure 16a displays the WEC buoy displacing a water volume, equivalent to the volume of the WEC buoy, after being dropped from −0.202 m in Test_161. The concentric circular radiated waves can be observed. Bottom slamming forces are obtained from F l o a d c e l l s . Figure 16b shows the free decay z time series and corresponding exponential decay envelopes according to Equation (15) for Test_089, Test_129 and Test_170.
Test_089 with an elevated start position of −0.089 m results in a quasi-equivalent decay response as Test_078 with a submerged start position of 0.078 m. In order to allow a comparison of the symmetry of the WEC system, Test_089 is plotted with inversed sign.

3.4. Power Absorption

Figure 17 displays the four quadrants where the WEC PTO system acts as a motor or generator, according to the adopted sign convention [37].
When F P T O and the resultant z ˙ have an opposite sign, energy will be extracted from the waves and the PTO acts as a generator, occurring in quadrant II and IV. When F P T O and the resultant z ˙ have an identical sign, energy will be consumed and the PTO acts as a motor, occurring in quadrant I and III. The defined convention in the Simulink model is that a net positive absorbed power value P a b s corresponds to mechanical power absorption and a net negative P a b s corresponds to adding power to the system. Therefore, a minus sign is added to the multiplication of F P T O with z ˙ in order to obtain P a b s :
P a b s = F P T O · z ˙
Note that this calculation results in instantaneous values. For regular waves, averaging over a number n of wave periods T results in the averaged absorbed power value P ¯ a b s :
P ¯ a b s = 1 n T 0 n T P a b s ( t ) d t

3.4.1. Impedance Matching

Impedance matching can be applied to enable maximum power transfer between two oscillatory systems, the ocean waves and the WEC PTO system. Since impedance is defined as a complex value, the PTO generally has a resistance component (real part) and a reactance component (imaginary part). The maximum power transfer theorem says that the maximum possible power is delivered to the PTO when the PTO impedance Z P T O (load impedance or input impedance) is equal to the complex conjugate (represented by *) of the impedance of the source Z i (intrinsic impedance or output impedance). For two impedances to be complex conjugates their resistances must be equal and their reactances must be equal in magnitude and opposite in sign. With the WEC impedance model given by Equation (13), an optimal PTO is obtained by Z P T O ( ω ) [12,38]:
Z P T O ( ω ) = Z i ( ω ) = B ( ω ) i ω ( M + A ( ω ) ) K ω
The frequency response of the Proportional Integral Derivative (PID) controller is given by [12]:
F R F P I D ( ω ) = ( i ω ) 2 K D + i ω K P + K I i ω
K P , K I and K D are the proportional, integral and derivative gains of the controller, respectively. The rearrangement of Equation (21) results in the PID controller impedance:
Z P I D ( ω ) = i ω K D + K P i K I ω = K P + i ( ω K D K I ω )
Given Equations (20) and (22), the proportional gain for the Proportional (P) controller, equivalent to the damping coefficient C P T O , P for the resistive control strategy, is given by:
C P T O , P ( ω ) = | Z i ( ω ) | = B 2 ( ω ) + ω ( M + A ( ω ) ) K ω 2
Given Equations (20) and (22), the proportional and integral gain for the Proportional Integral (PI) controller, equivalent to C P T O , P I and the spring coefficient K P T O , P I for the reactive control strategy, are given by:
C P T O , P I ( ω ) = R e { Z i ( ω ) } = B ( ω )
K P T O , P I ( ω ) = ω · I m { Z i ( ω ) } = ω ω ( M + A ( ω ) ) K ω = ω 2 ( M + A ( ω ) ) + K
The presented study considers only P and PI control. Gu et al. present the implementation of a PID controller in a frequency domain model for a heaving point absorber WEC [39]. In this case the derivative controller acts on the acceleration term, corresponding to mass control.

3.4.2. Causal Impedance Matching P and PI Controller

For any causal system, the complex conjugate of the impedance will produce an acausal system. Since a WEC is a causal system, an acausal system is obtained for Z i ( ω ) . Therefore, to implement Equation (23) or Equations (24) and (25) perfectly across all wave frequencies, the future velocity of the WEC has to be known, resulting in an acausal controller implementation [12]. However, the controller does not need to operate perfectly at all wave frequencies simultaneously and can be designed to work well in a restricted range of frequencies. The energy in a typical sea state ranges over at most a single decade of frequencies, with the sea state changing appreciably only over the course of hours. This band-limited and slowly varying nature of ocean waves allows to utilize a causal realization of the impedance matching approach. Approximating Z i ( ω ) in the peak frequency ω p of the design sea state is straightforward to implement in the Simulink model. The impedance of the causal impedance matching P controller is equal to C P T O defined in Equation (24) [12,38]:
Z P ( ω ) = C P T O ( ω p )
The impedance of the causal impedance matching PI controller is an interpolation of the impedance given by Equation (22) in ω p [12,38]:
Z P I ( ω ) = C P T O ( ω p ) i · K P T O ( ω p ) ω
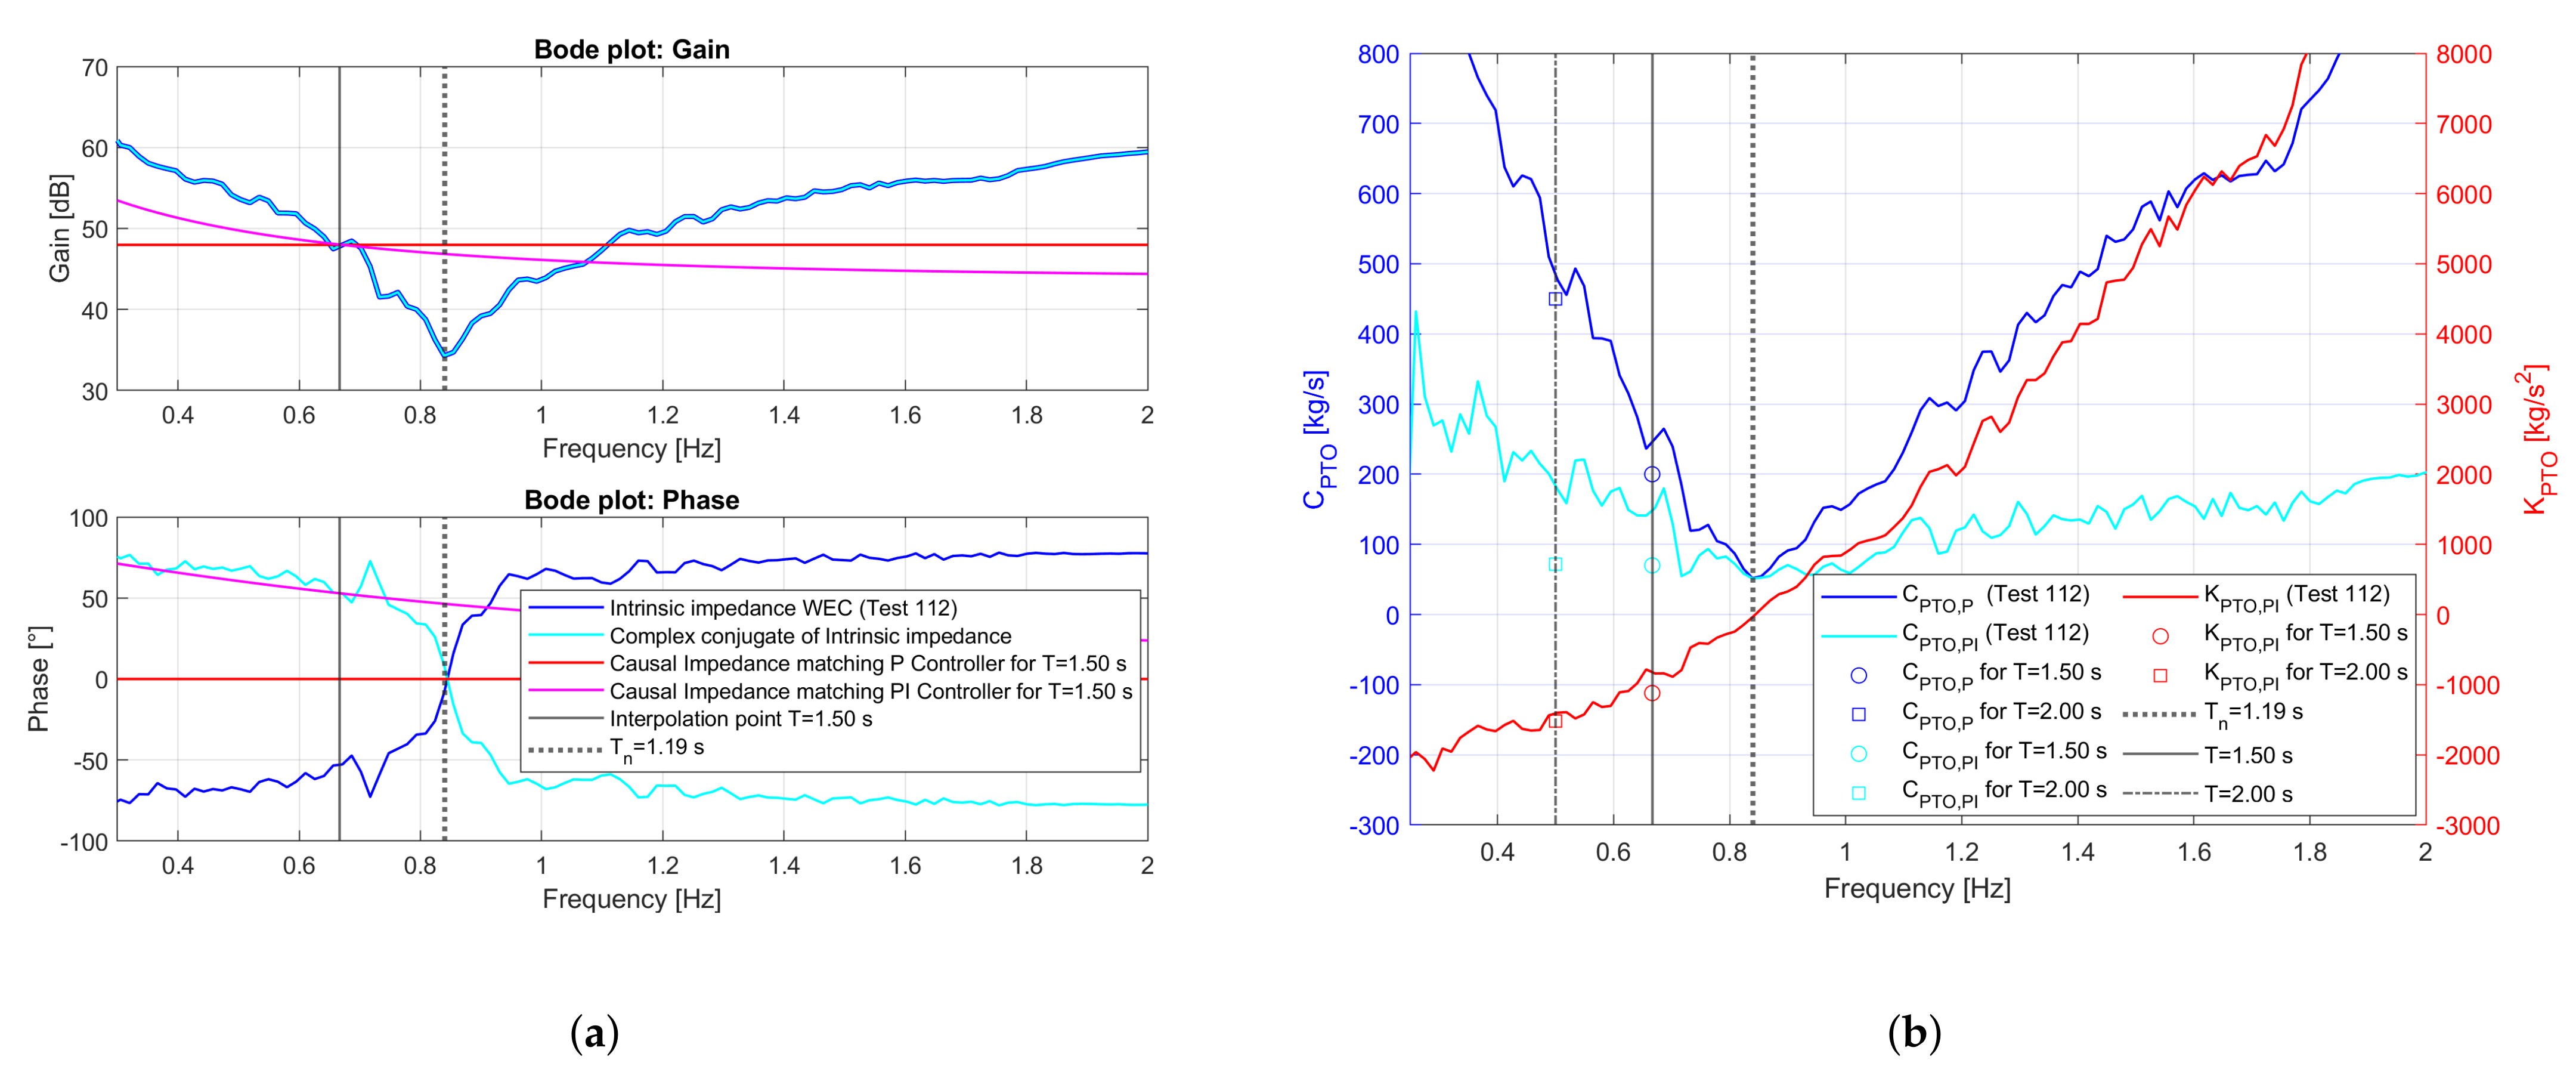
Based on the experimentally determined Z i in Test_112, the impedance of a causal impedance matching P controller and PI controller can be determined, according to Equations (26) and (27), respectively. Figure 18a shows the gain and phase of these controllers, for an interpolation point of T = 1.50 s. Since in the power absorption tests various wave conditions are considered, Figure 18b plots C P T O , P ( ω ) (Equation (23)), C P T O , P I ( ω ) (Equation (24)) and K P T O , P I ( ω ) (Equation (25)) in function of the wave frequency. The resulting control parameters for T = 1.50 s and T = 2.00 s are indicated. As expected, K P T O , P I ( ω ) = 0 kg/s 2 for T n = 1.19 s.

3.4.3. Resistive Control

The baseline control strategy is resistive control, equivalent to causal impedance matching P control as defined in Equation (26). F P T O , P is equal to z ˙ multiplied with a positive C P T O :
F P T O , P = C P T O · z ˙
A minus sign is added, since F P T O , P should oppose z ˙ . Table 8 and Table 9 provide an overview of the performed resistive control tests, for regular and irregular waves, respectively. The applied C C is given. For the regular waves, characterized by T and H, a range of C P T O is tested during a single test. For the irregular waves, characterized by a JONSWAP wave spectrum with γ = 3.3, H s and T p , a fixed C P T O is applied.
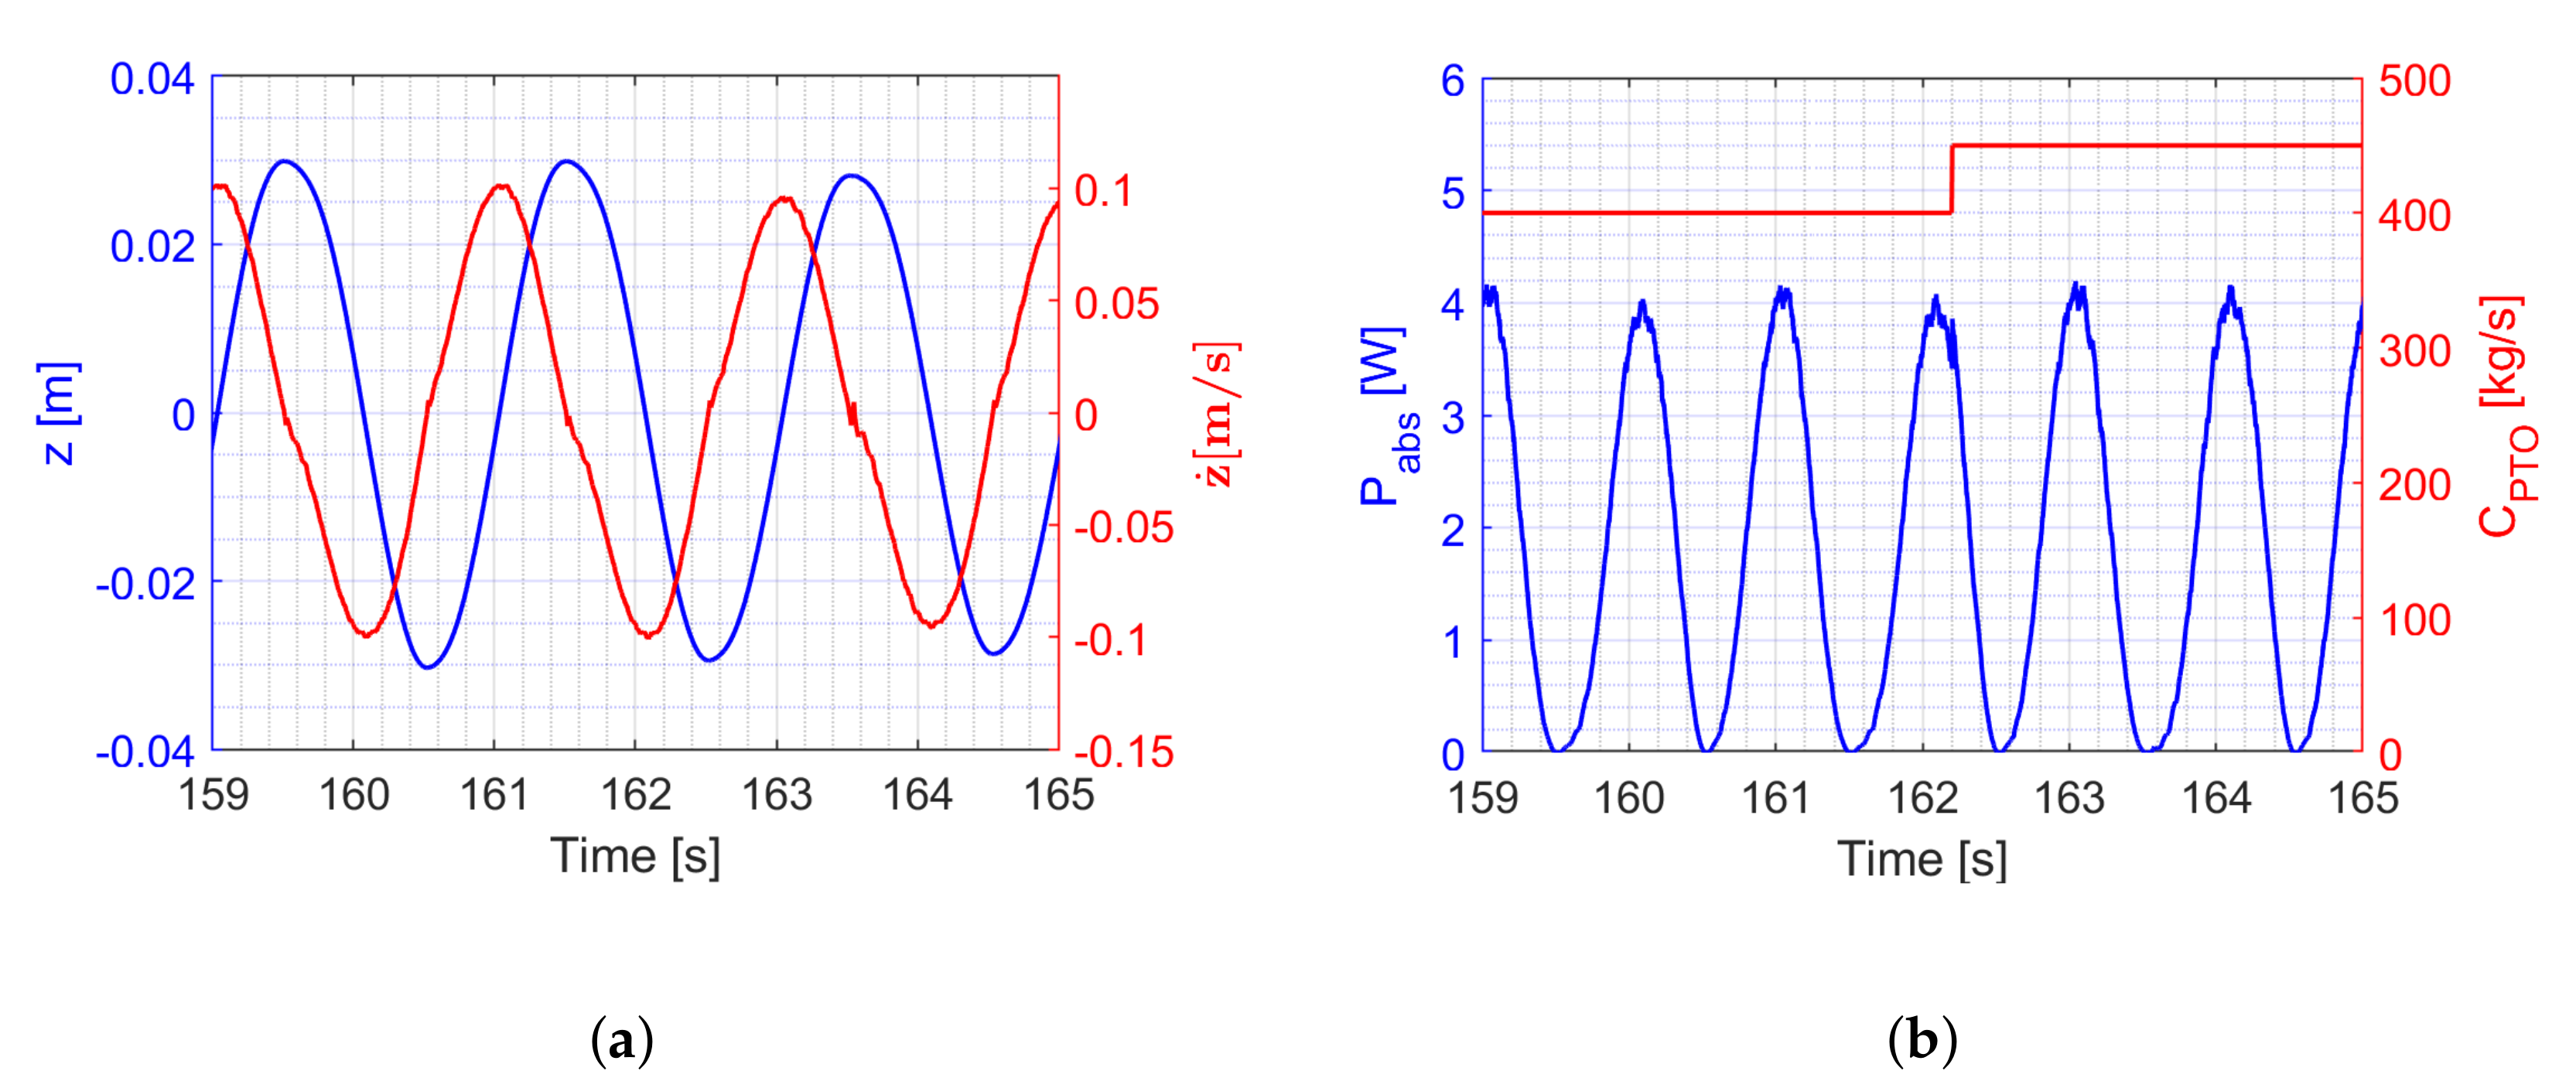
Figure 19a shows a snapshot of the z and z ˙ time series for Test_100. Figure 19b shows the corresponding C P T O input, with a stepwise increase from 400 kg/s to 450 kg/s, and the P a b s output.

3.4.4. Reactive Control

Reactive control, equivalent to causal impedance matching PI control as defined in Equation (27), aims to bring the WEC into resonance by the addition of a spring. F P T O , P I is composed of z ˙ multiplied with a positive C P T O and z multiplied with negative K P T O .
F P T O , P I = C P T O · z ˙ K P T O · z
Again, a minus sign is added, since F P T O , P I should oppose z ˙ . Table 10 gives an overview of the performed reactive control tests for regular waves, characterized by H and T. C C is fixed at 0.6 and a range of C P T O and K P T O is tested during each test.
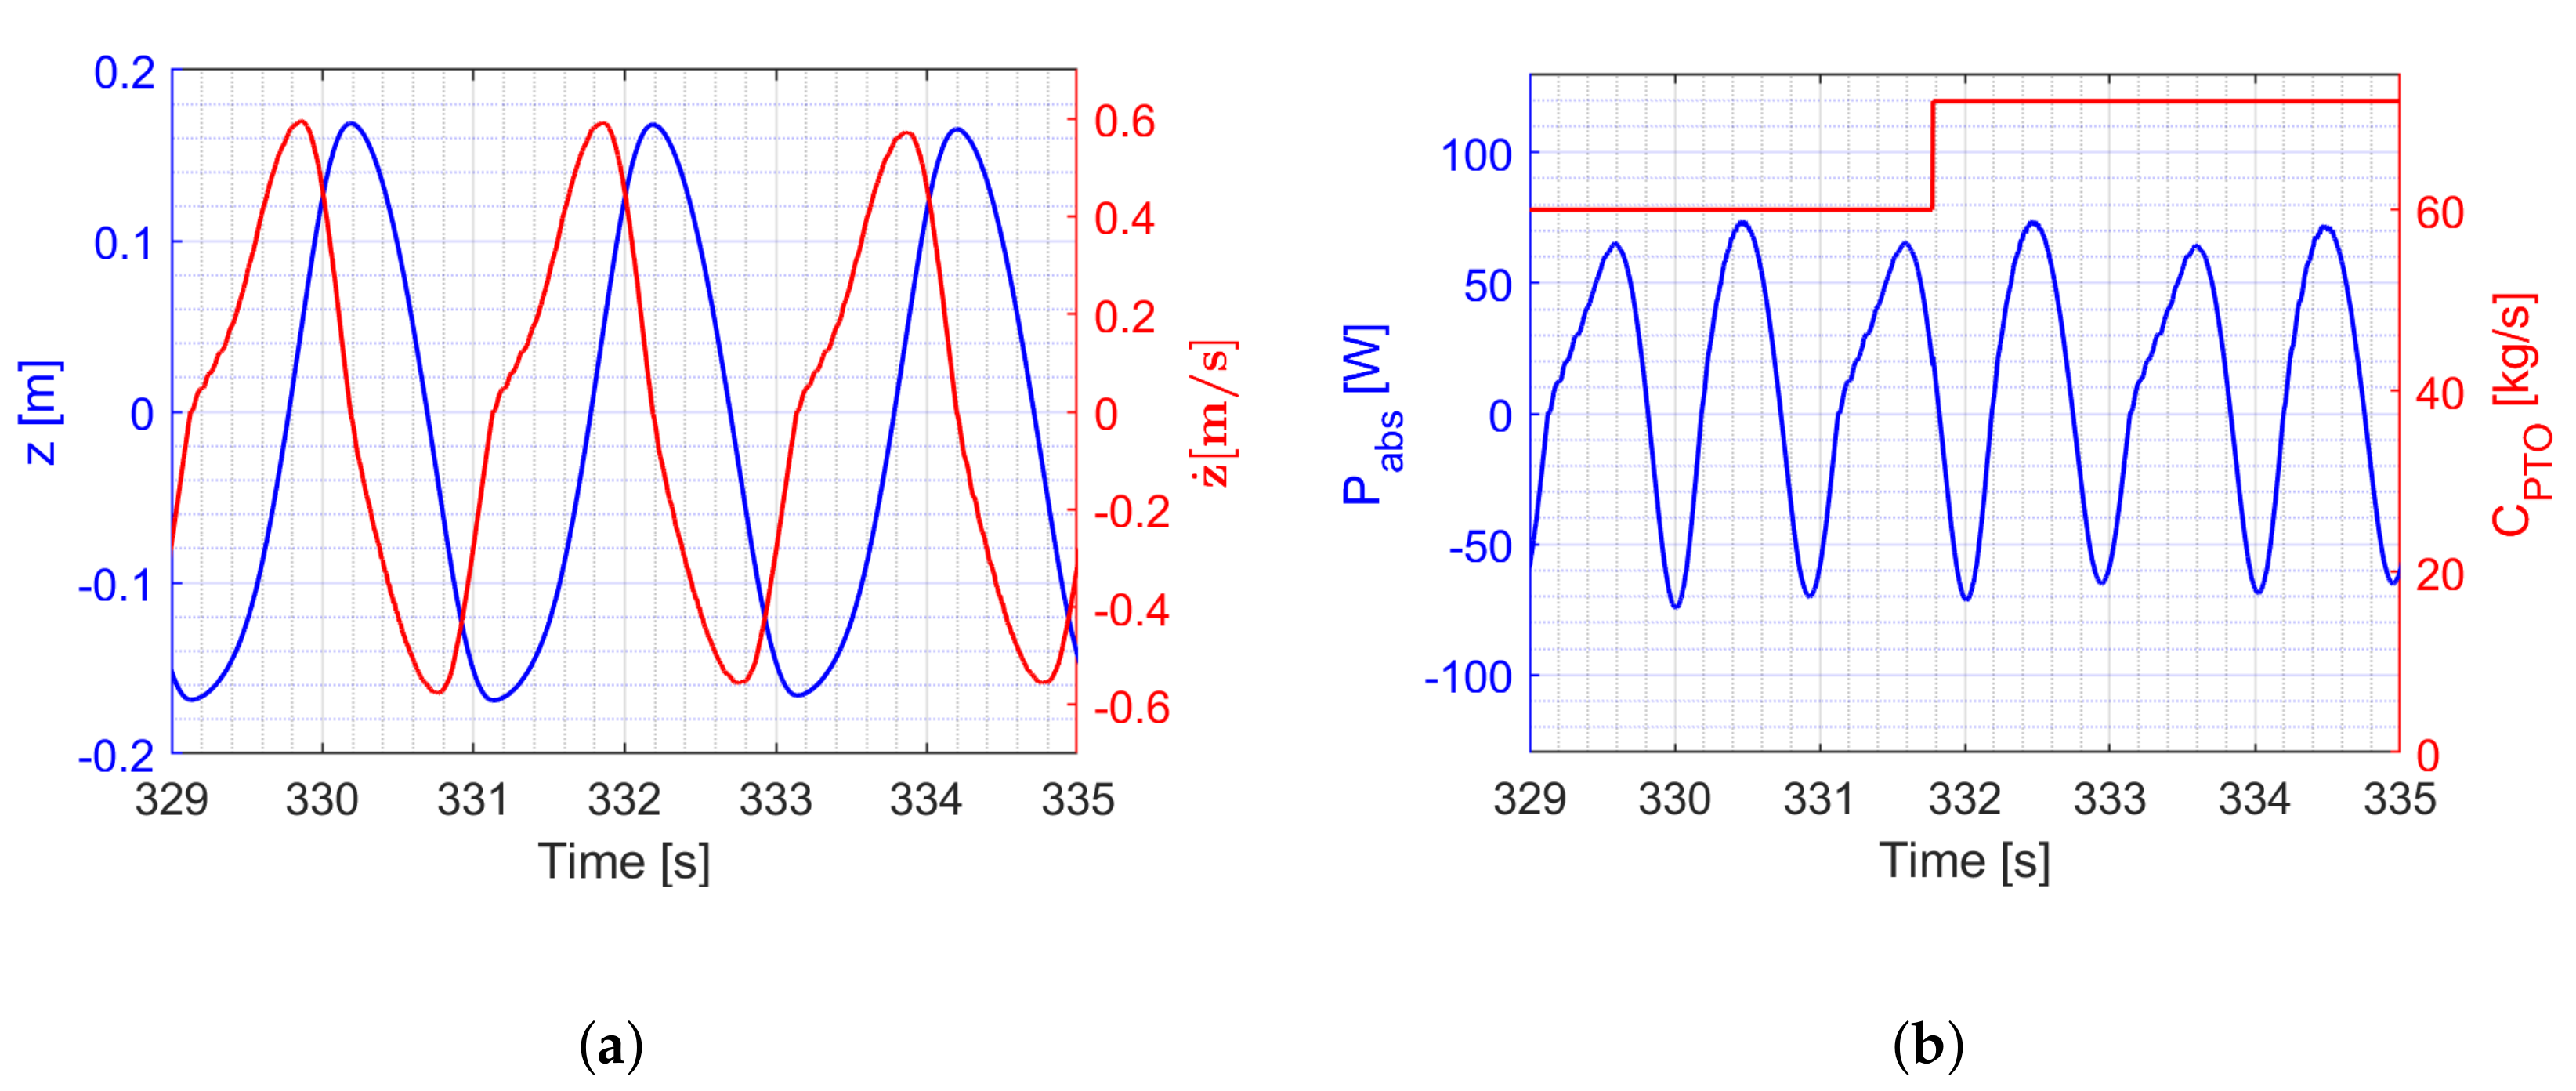
Figure 20a shows a snapshot of the z and z ˙ time series for Test_138. The Simulink control model did not impose constraints on z, z ˙ , z ¨ , allowing these high values for z and z ˙ . The stroke is mechanically limited to 0.25 m by the micro switches, displayed in Figure 3. Figure 20b shows the corresponding C P T O input, with a stepwise increase from 60 kg/s to 72 kg/s, and the P a b s output. The net P ¯ a b s is calculated as the period averaged difference between the integrated generated power (positive P a b s ) and the integrated added power (negative P a b s ), according to Equation (19) and the sign convention as defined in Figure 17. K P T O is equal to −1520 kg/s 2 for the displayed time window.

3.4.5. Power Absorption Comparison between the Resistive and Reactive Controller

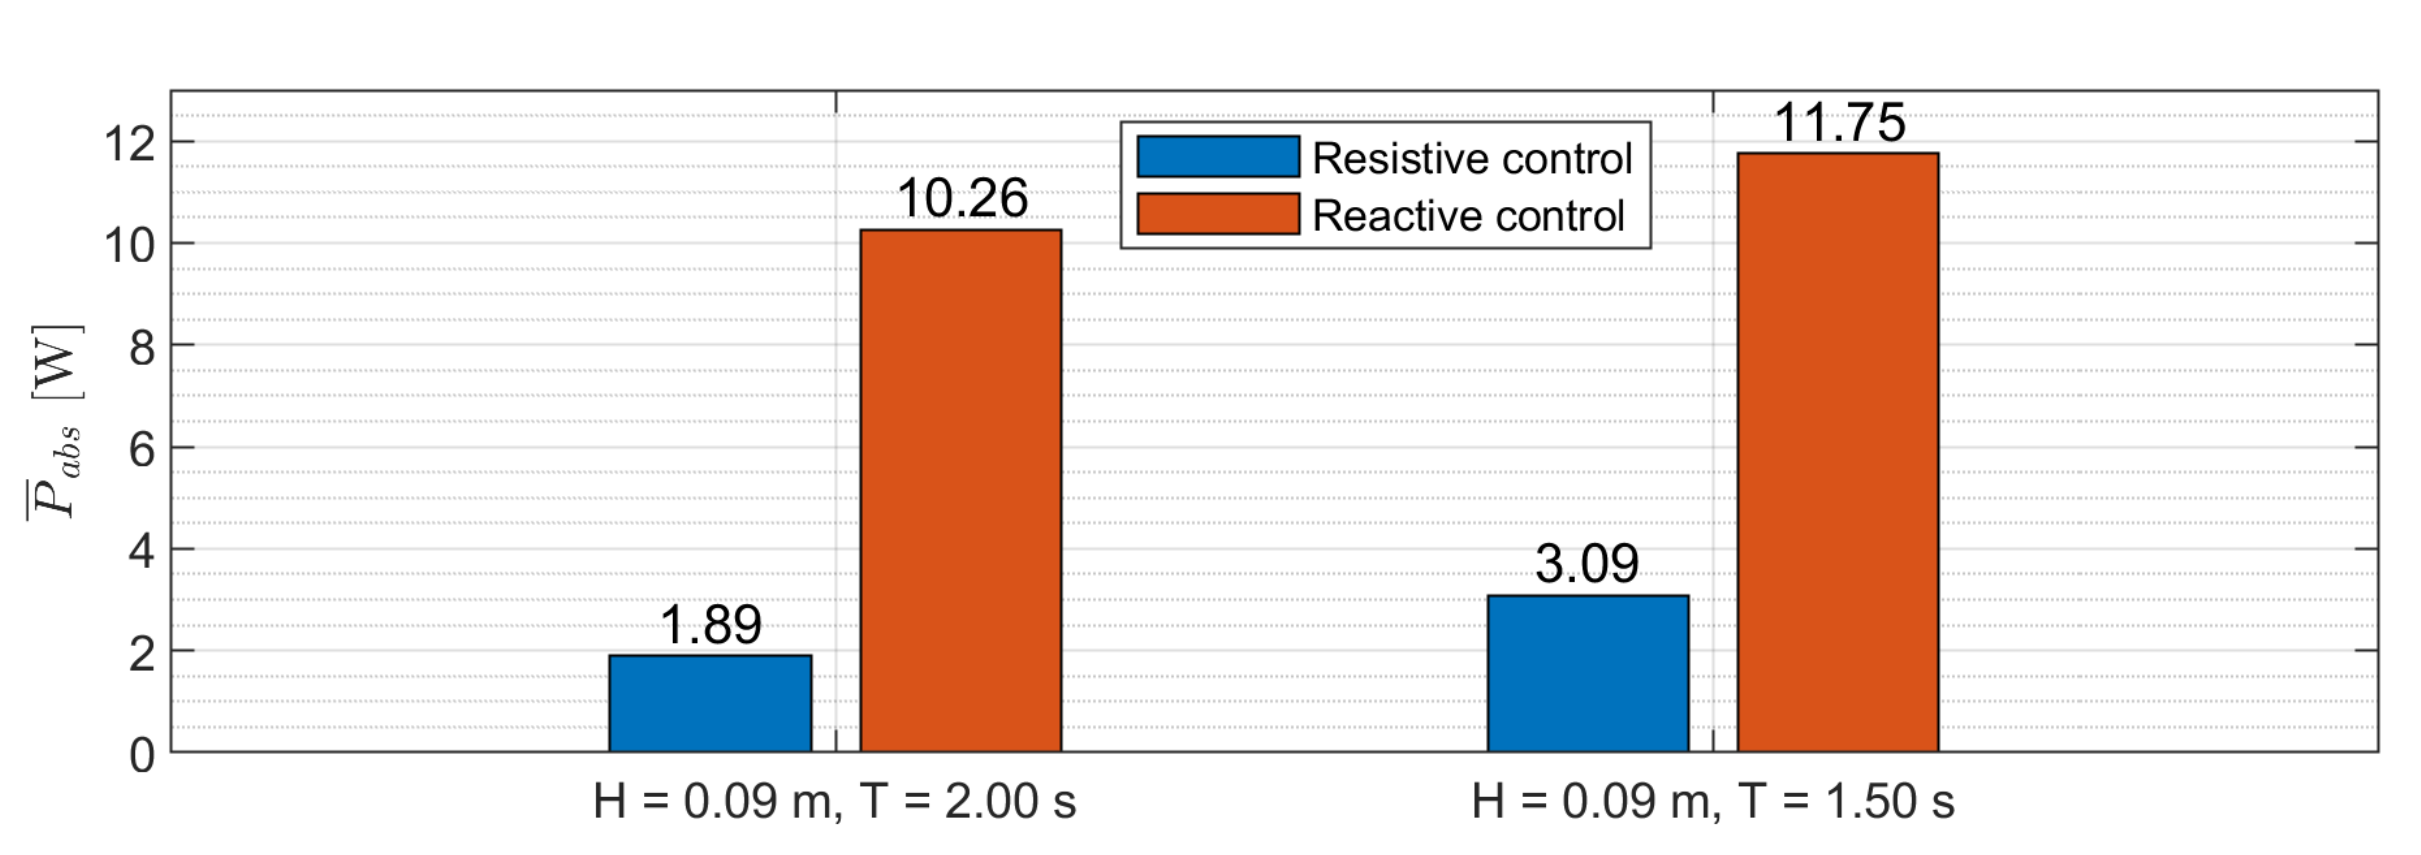
Two regular wave conditions, characterized by H = 0.09 m, T = 2.00 s and by H = 0.09 m, T = 1.50 s, respectively, are considered to compare the presented resistive and reactive control strategy. P ¯ a b s is calculated with n = 5 in Equation (19). For resistive control, C P T O , P is obtained according to Equation (23) and for reactive control, C P T O , P I and K P T O , P I are obtained according to Equations (24) and (25), respectively. Figure 18b displays the obtained control parameters for T = 2.00 s and T = 1.50 s. For C P T O , P I , lower values than experimentally indentified are adopted. For the regular wave with H = 0.09 m and T = 2.00 s, resistive control (Test_100) with C P T O = 450 kg/s yields P ¯ a b s = 1.89 W and reactive control (Test_138) with C P T O = 72 kg/s and K P T O = −1520 kg/s yields P ¯ a b s = 10.26 W. For the regular wave with H = 0.09 m and T = 1.50 s, resistive control (Test_103) with C P T O = 200 kg/s yields P ¯ a b s = 3.09 W and reactive control (Test_147) with C P T O = 70 kg/s and K P T O = −1120 kg/s yields P ¯ a b s = 11.75 W. Figure 21 visualizes these results.
For the reactive controller, a significant increase in power absorption compared to the resistive controller is observed, which is according to the literature [40]. Figure 20a shows that resonance occurs as z m a x = 0.165 m is significantly higher than H/2 = 0.045 m. To properly assess the power performance of the reactive controller compared to the resistive controller, irregular waves should be considered, as discussed in Section 3.4.2.
The amplification on z requires the motor to add energy, which has a certain efficiency. Apart from larger peaks in F P T O and P a b s , a major drawback of reactive control is the energy loss by dissipative processes inherent to the back-and-forth energy exchange between the PTO and the WEC buoy, especially when the magnitude of the exchanged energy is comparable to, or even significantly larger than, the net absorbed energy [41]. The presented research does not consider the PTO efficiency, nor the damping force, nor the reactive force. Strager et al. present a method to determine the optimal reactive control parameters for a given combination of non-ideal PTO efficiency and monochromatic wave frequency [42].

4. Discussion and Conclusions

Within the ‘WECfarm’ project, two test campaigns are performed at the AAU wave basin: (a) a testing of the first WEC in April 2021 and (b) a testing of a two-WEC array in February 2022, in preparation of five-WEC array tests. The main objective of the ‘WECfarm’ project is to cover the scientific gap on experimental data necessary for the validation of recently developed (non-linear) numerical models. The presented article discusses experimental testing of an isolated WEC, being the first test campaign within the ‘WECfarm’ project. The primary objective of evaluating the hydrodynamics, electromechanics, control platform, DAQ and structural performance of the WEC is to allow extending the setup to a five-WEC array.
The WEC buoy is a truncated cylinder with a high diameter to draft ratio to increase radiation and WEC–WEC interactions. The PTO system of the WEC is a PMSM connected to a gearbox powering a rack and pinion system. A configuration of three air bushings guarantees a permanent layer of air between the guide shafts and the bushings, resulting in zero-friction linear guiding. The WEC control and data acquisition are realized with a Speedgoat Performance real-time target machine, offering the possibility to implement advanced WEC array control strategies in the MATLAB-Simulink model. This unique PTO system in combination with the real-time target machine makes active and accurate PTO control possible.
The drivetrain (motor, gearbox, rack and pinion) friction is assessed by manually moving the WEC buoy up and down, from below the loadcells and under a zero torque command. Based on the empirical relationship between F l o a d c e l l s and z ˙ , a simplified model based on Coulomb and viscous friction is determined. The resulting friction compensation model F C o m p is implemented in Simulink as a torque augmentation on the torque command.
A SID approach is adopted, considering the WEC system to be composed of two SISO models, the radiation and the excitation model. The radiation tests in calm water, with F P T O chirp-up and chirp-down noise signals as input and z ˙ as output, yield the intrinsic impedance Z i . The excitation tests with the WEC buoy fixed, with as input various JONSWAP spectra and as output F l o a d c e l l s , yield the wave excitation force coefficients H e ( ω ) . The assumption that WG measurements at sufficient distance from the WEC buoy may be used to characterize η on the location of the WEC is confirmed. Free decay tests characterize the WEC buoy decay response, confirming that T n = 1.19 s, obtained by the radiation tests.
Power absorption tests are executed with the resistive and reactive control strategy. The tests with regular waves are executed with ‘real-time’ tuning of the control parameters in the Simulink model. Adopting an impedance matching approach, the optimal C P T O , P for resistive control and the optimal C P T O , P I and K P T O , P I for reactive control are calculated from Z i . For the two selected regular wave conditions, characterized by H = 0.09 m, T = 2.00 s and by H = 0.09 m, T = 1.50 s, the reactive controller results in a significant higher averaged absorbed power P ¯ a b s compared to the resistive controller. However, the presented research does not consider PTO efficiency, which is detrimental for reactive control.
The implementation of the friction compensation model F C o m p proved to be a good methodology to partly compensate Coulomb and viscous friction attributed to the drivetrain. The experimentally determined radiation and excitation model yields a simple, though accurate, model of the WEC system. The intrinsic impedance, resulting from the radiation test, is used to design a causal impedance matching P and PI controller, equivalent to a resistive and reactive controller. Although this approach was only tested limitedly, mainly for regular waves, the successful extension to a multiple-WEC array, considering irregular waves, is confirmed. The testing of the isolated ‘WECfarm’ WEC proved to be successful and the extension of the setup to a five-WEC array will allow it to comply with the future research objectives.

Author Contributions

Conceptualization, methodology and analysis, T.V.; execution of the experiments, T.V., F.F., L.D.B., H.C. and B.D.W.; data curation, T.V.; writing—original draft preparation, T.V.; writing—review and editing, V.S., F.F., M.V. and P.T.; funding acquisition for the experimental setup, V.S. and P.T. All authors have read and agreed to the published version of the manuscript.

Funding

This work is supported by the FWO (Fonds Wetenschappelijk Onderzoek-Research Foundation Flanders), Belgium, through the following funding: (1) Timothy Vervaet is Ph.D. fellow (fellowship 11A6919N); (2) Vasiliki Stratigaki is a FWO postdoctoral researcher (fellowship 1267321N) and has been granted the ‘FWO Research Grant’ for constructing the WEC experimental set-up (FWO-KAN-DPA376). The travel expenses of Timothy Vervaet, Louis De Beule, Hendrik Claerbout and Bono De Witte for conducting the experimental campaign at the AAU wave basin were funded by four WECANet COST Action CA17105 Short Term Scientific Missions (STSMs). COST (European Cooperation in Science and Technology) is supported by the EU Framework Programme Horizon 2020. COST is a funding agency for research and innovation networks.

Institutional Review Board Statement

Not applicable.

Informed Consent Statement

Not applicable.

Data Availability Statement

The datasets resulting from the WECfarm project will be made available in due time on https://www.awww.ugent.be, accessed on 23 August 2022.

Acknowledgments

Michiel Herpelinck and Brecht De Backer were involved in the design of the WECfarm WEC in the framework of a master dissertation supervised by Kurt Stockman from the Department of Electromechanical, Systems and Metal Engineering of Ghent University. Brecht De Backer initiated the Autodesk Inventor drawings of the WEC. OAV (https://www.oavco.com/, accessed on 23 August 2022) is acknowledged for providing educational discount on the OAV 40 mm air bushings used in the experimental setup as well as for providing technical support [14]. Beckhoff, Wittenstein and Speedgoat are acknowledged for providing technical support. Aalborg University, Denmark is acknowledged for making the wave basin available from 12–18 April 2021 for the presented test campaign.

Conflicts of Interest

The authors declare no conflict of interest. The funders had no role in the design of the study; in the collection, analyses, or interpretation of data; in the writing of the manuscript, or in the decision to publish the results.

Abbreviations

AAUAalborg University
ABSAcrylonitril-Butadieen-Styreen
ATAmplifier Telegramm
BEMBoundary Element Method
CFDComputational fluid dynamics
CNWTCFD-based numerical wave tank
COBCoastal and Ocean Basin
DAQData Acquisition System
DOFsDegrees of Freedom
EtherCATEthernet for Control Automation Technology
FFTFast Fourier Transform
FRFFrequency response function
FSOFull Scale Output
I/OInput and Output
JONSWAPJoint North Sea Wave Project
MDTMaster Data Telegramm
MWLMean Water Level
MISOMultiple input single output
OCTOne Cable Technology
PProportional
PIProportional Integral
PIDProportional Integral Derivative
PMMAPolymethylmethacrylate
PMSMPermanent Magnet Synchronous Motor
PTOPower Take-Off
RAOResponse Amplitude Operator
SIDSystem Identification
SISOSingle input single output
SWLStill Water Level
WECWave Energy Converter
WGWave Gauge

References

  1. Falnes, J.; Lillebekken, P.M. Budal’s latching-controlled-buoy type wave-power plant. In Proceedings of the European Wave Energy Conference, Cork, Ireland, 17–20 September 2003; pp. 233–244. [Google Scholar]
  2. Göteman, M.; Giassi, M.; Engström, J.; Isberg, J. Advances and Challenges in Wave Energy Park Optimization—A Review. Front. Energy Res. 2020, 8, 26. [Google Scholar] [CrossRef] [Green Version]
  3. Windt, C.; Davidson, J.; Ringwood, J. High-fidelity numerical modelling of ocean wave energy systems: A review of computational fluid dynamics-based numerical wave tanks. Renew. Sustain. Energy Rev. 2018, 93, 610–630. [Google Scholar] [CrossRef] [Green Version]
  4. Vervaet, T.; Stratigaki, V.; De Backer, B.; Stockman, K.; Vantorre, M.; Troch, P. Experimental modelling of point absorber wave energy converter arrays: A comprehensive review, identification of research gaps and design of the WECfarm setup. J. Mar. Sci. Eng. 2022, 10, 1062. [Google Scholar] [CrossRef]
  5. Nader, J.R.; Fleming, A.; Macfarlane, G.; Penesis, I.; Manasseh, R. Novel experimental modelling of the hydrodynamic interactions of arrays of wave energy converters. Int. J. Mar. Energy 2017, 20, 109–124. [Google Scholar] [CrossRef]
  6. Stallard, T.; Stansby, P.K.; Williamson, A.J. An experimental study of closely spaced point absorber arrays. In Proceedings of the International Offshore and Polar Engineering Conference, Vancouver, BC, Canada, 6–11 July 2008. [Google Scholar]
  7. Folley, M.; Whittaker, T. Preliminary Cross-Validation of Wave Energy Converter Array Interactions. In Proceedings of the International Conference on Offshore Mechanics and Arctic Engineering—OMAE, Nantes, France, 8–13 June 2013; Volume 10837. [Google Scholar]
  8. Stratigaki, V.; Troch, P.; Stallard, T.; Forehand, D.; Kofoed, J.P.; Folley, M.; Benoit, M.; Babarit, A.; Kirkegaard, J. Wave basin experiments with large wave energy converter arrays to study interactions between the converters and effects on other users in the sea and the coastal area. Energies 2014, 7, 701–734. [Google Scholar] [CrossRef]
  9. Troch, P.; Stratigaki, V.; Devriese, P.; Kortenhaus, A.; De Maeyer, J.; Monballiu, J.; Toorman, E.; Rawoens, P.; Vanneste, D.; Suzuki, T.; et al. Design features of the upcoming coastal and ocean basin in Ostend, Belgium. In Proceedings of the Coastal Structures Conference, Hannover, Germany, 30 September–2 October 2019; Goseberg, N., Schlurmann, T., Eds.; pp. 1191–1199. [Google Scholar]
  10. Beatty, S.; Ferri, F.; Bocking, B.; Kofoed, J.P.; Buckham, B. Power Take-Off Simulation for Scale Model Testing of Wave Energy Converters. Energies 2017, 10, 973. [Google Scholar] [CrossRef] [Green Version]
  11. Bacelli, G.; Ringwood, J. Constrained control of arrays of wave energy devices. Int. J. Mar. Energy 2013, 3–4, 53–69. [Google Scholar] [CrossRef]
  12. Coe, R.G.; Bacelli, G.; Forbush, D. A practical approach to wave energy modeling and control. Renew. Sustain. Energy Rev. 2021, 142, 110791. [Google Scholar] [CrossRef]
  13. Bacelli, G.; Coe, R.G.; Patterson, D.; Wilson, D. System Identification of a Heaving Point Absorber: Design of Experiment and Device Modeling. Energies 2017, 10, 472. [Google Scholar] [CrossRef] [Green Version]
  14. OAV Air Bearings. OAV Air Bearing Product Book & Design Guide: Where Aerospace Techonology Meets Air Bearing Systems. 2021. Available online: https://www.oavco.com/brochures (accessed on 7 July 2021).
  15. Beckhoff Automation. Beckhoff New Automation Technology, Operation Instructions, AM8000 and AM8500: Synchronous Servomotors, Version 4.9. 2022. Available online: https://download.beckhoff.com/download/document/motion/am8000_am8500_ba_en.pdf (accessed on 5 October 2022).
  16. Beckhoff Automation. AM8542-wEyz|Servomotor with Increased Moment of Inertia 4.10 Nm (M0), F4 (87 mm). 2022. Available online: https://www.beckhoff.com/nl-be/products/motion/rotary-servomotors/am8500-servomotors-with-increased-rotor-moment-of-inertia/am8542-weyz.html (accessed on 2 June 2022).
  17. Analog Devices. ADXL335: Small, Low Power, 3-Axis ±3 g Accelerometer. 2022. Available online: https://www.analog.com/media/en/technical-documentation/data-sheets/ADXL335.pdf (accessed on 5 October 2022).
  18. Vishay Precision Group. Model 614, Tedea-Huntleigh: Tension Compression Load Cell. 2022. Available online: http://www.vishaypg.com/docs/12040/614.pdf (accessed on 5 October 2022).
  19. Micro-Epsilon. Operating Instructions optoNCDT 1420. 2022. Available online: https://www.micro-epsilon.com/download/manuals/man–optoNCDT-1420–en.pdf (accessed on 5 October 2022).
  20. Lamont-Kane, P.; Folley, M.; Whittaker, T. Investigating Uncertainties in Physical Testing of Wave Energy Converter Arrays. In Proceedings of the 10th European Wave and Tidal Energy Conference Series—EWTEC, Aalborg, Denmark, 2–5 September 2013. [Google Scholar]
  21. Aalborg University. Ocean and Coastal Engineering Laboratory. 2022. Available online: https://www.en.build.aau.dk/laboratories/ocean-and-coastal-engineering/ (accessed on 25 June 2021).
  22. Aalborg University. AwaSys. 2022. Available online: https://www.hydrosoft.civil.aau.dk/awasys/ (accessed on 2 August 2022).
  23. OAV Air Bearings. Friction Coefficient 40 mm OAV Air Bushings; e-mail communication, from 24 June 2021; OAV Air Bearings: Princeton, NJ, USA, 2021. [Google Scholar]
  24. Wittenstein Alpha. Gearbox ’NPR 025S-MF1-4 -2E1-1S’ Break-Away Torque; e-mail communication, from 16 December 2021; Wittenstein Alpha: Igersheim, Germany, 2021. [Google Scholar]
  25. Armstrong-Helouvry, B.; Dupont, P.; Canudas de Wit, C. A Survey of Models, Analysis Tools and Compensation Methods for the Control of Machines with Friction. Automatica 1994, 30, 1083–1138. [Google Scholar] [CrossRef]
  26. Wittenstein Alpha. Alpha Basic Line & Alpha Value Line Product Catalog. 2022. Available online: https://alpha.wittenstein.de/en-en/alpha-value-line/ (accessed on 8 September 2022).
  27. Verbrugghe, T. openWEC: Open Source Wave Energy Converter (WEC) Simulation Tool, Ghent University. 2018. Available online: https://users.ugent.be/~tverbrug/ (accessed on 2 June 2022).
  28. Yang, P.; Zhang, Z.; Zhao, J.; Zhou, D. Improved PID Friction Feed-forward Compensation Control Based on Segment Friction Model. Open Autom. Control. Syst. J. 2014, 6, 1620–1628. [Google Scholar] [CrossRef] [Green Version]
  29. Ringwood, J.; Davidson, J.; Giorgi, S. Identifying Models Using Recorded Data. In Numerical Modelling of Wave Energy Converters; Academic Press: Cambridge, MA, USA, 2016; pp. 123–147. [Google Scholar]
  30. Falcão, A.F.d.O. Wave energy utilization: A review of the technologies. Renew. Sustain. Energy Rev. 2009, 14, 899–918. [Google Scholar] [CrossRef]
  31. Stratigaki, V. Experimental Study and Numerical Modelling of Intra-Array Interactions and Extra-Array Effects of Wave Energy Converter Arrays. Ph.D. Thesis, Ghent University, Ghent, Belgium, 2014. [Google Scholar]
  32. De Backer, G.; Vantorre, M.; Frigaard, P.; Beels, C.; De Rouck, J. Bottom slamming on heaving point absorber wave energy devices. J. Mar. Sci. Technol. 2010, 15, 119–130. [Google Scholar] [CrossRef] [Green Version]
  33. Morison, J.R.; O’Brien, M.P.; Johnson, J.W.; Schaaf, S. The force exerted by surface waves on piles. Pet. Trans. AIME 1950, 2, 149–154. [Google Scholar] [CrossRef]
  34. Penalba, M.; Giorgi, G.; Ringwood, J. A Review of Non-Linear Approaches for Wave Energy Converter Modelling. In Proceedings of the 11th European Wave and Tidal Energy Conference, Nantes, France, 6–11 September 2015. [Google Scholar]
  35. Giorgi, G.; Ringwood, J.V. Nonlinear Froude-Krylov and viscous drag representations for wave energy converters in the computation/fidelity continuum. Ocean Eng. 2017, 141, 164–175. [Google Scholar] [CrossRef] [Green Version]
  36. Quartier, N.; Ropero-Giralda, P.; MDomínguez, J.; Stratigaki, V.; Troch, P. Influence of the drag force on the average absorbed power of heaving wave energy converters using smoothed particle hydrodynamics. Water 2021, 13, 384. [Google Scholar] [CrossRef]
  37. Antony, M.S.; Praveen Raj, R.S. Four Quadrant Operation of Vector Control of PMSM with Dynamic Braking. In Proceedings of the International Conference on Control, Communication & Computing India (ICCC), Trivandrum, India, 19–21 November 2015. [Google Scholar]
  38. Faedo, N.; Carapellese, F.; Pasta, E.; Mattiazzo, G. On the principle of impedance-matching for underactuated wave energy harvesting systems. Appl. Ocean. Res. 2022, 118, 102958. [Google Scholar] [CrossRef]
  39. Gu, Y.; Ding, B.; Sergiienko, N.Y.; Cazzolato, B.S. Power maximising control of a heaving point absorber wave energy converter. IET Renew. Power Gener. 2021, 15, 3296–3308. [Google Scholar] [CrossRef]
  40. Coe, R.G.; Bacelli, G.; Wilson, D.G.; Abdelkhalik, O.; Korde, U.A.; Robinett, R.D. A comparison of control strategies for wave energy converterss. Int. J. Mar. Energy 2017, 20, 45–63. [Google Scholar] [CrossRef]
  41. Falcão, A.F.d.O.; Henriques, J.C.C. Effect of non-ideal power take-off efficiency on performance of single- and two-body reactively controlled wave energy converters. J. Ocean Eng. Mar. Energy 2015, 1, 273–286. [Google Scholar] [CrossRef]
  42. Strager, T.; Martin dit Neuville, A.; Fernandez Lopez, P.; Giorgio, G.; Muresan, T.; Andersen, P.; Nielsen, K.M.; Pedersen, T.S.; Vidal Sanchez, E. Optimising Reactive Control In Non-Ideal Efficiency Wave Eenergy Converters. In Proceedings of the ASME 2014 33rd International Conference on Ocean, Offshore and Arctic Engineering, San Francisco, CA, USA, 8–13 June 2014. [Google Scholar]
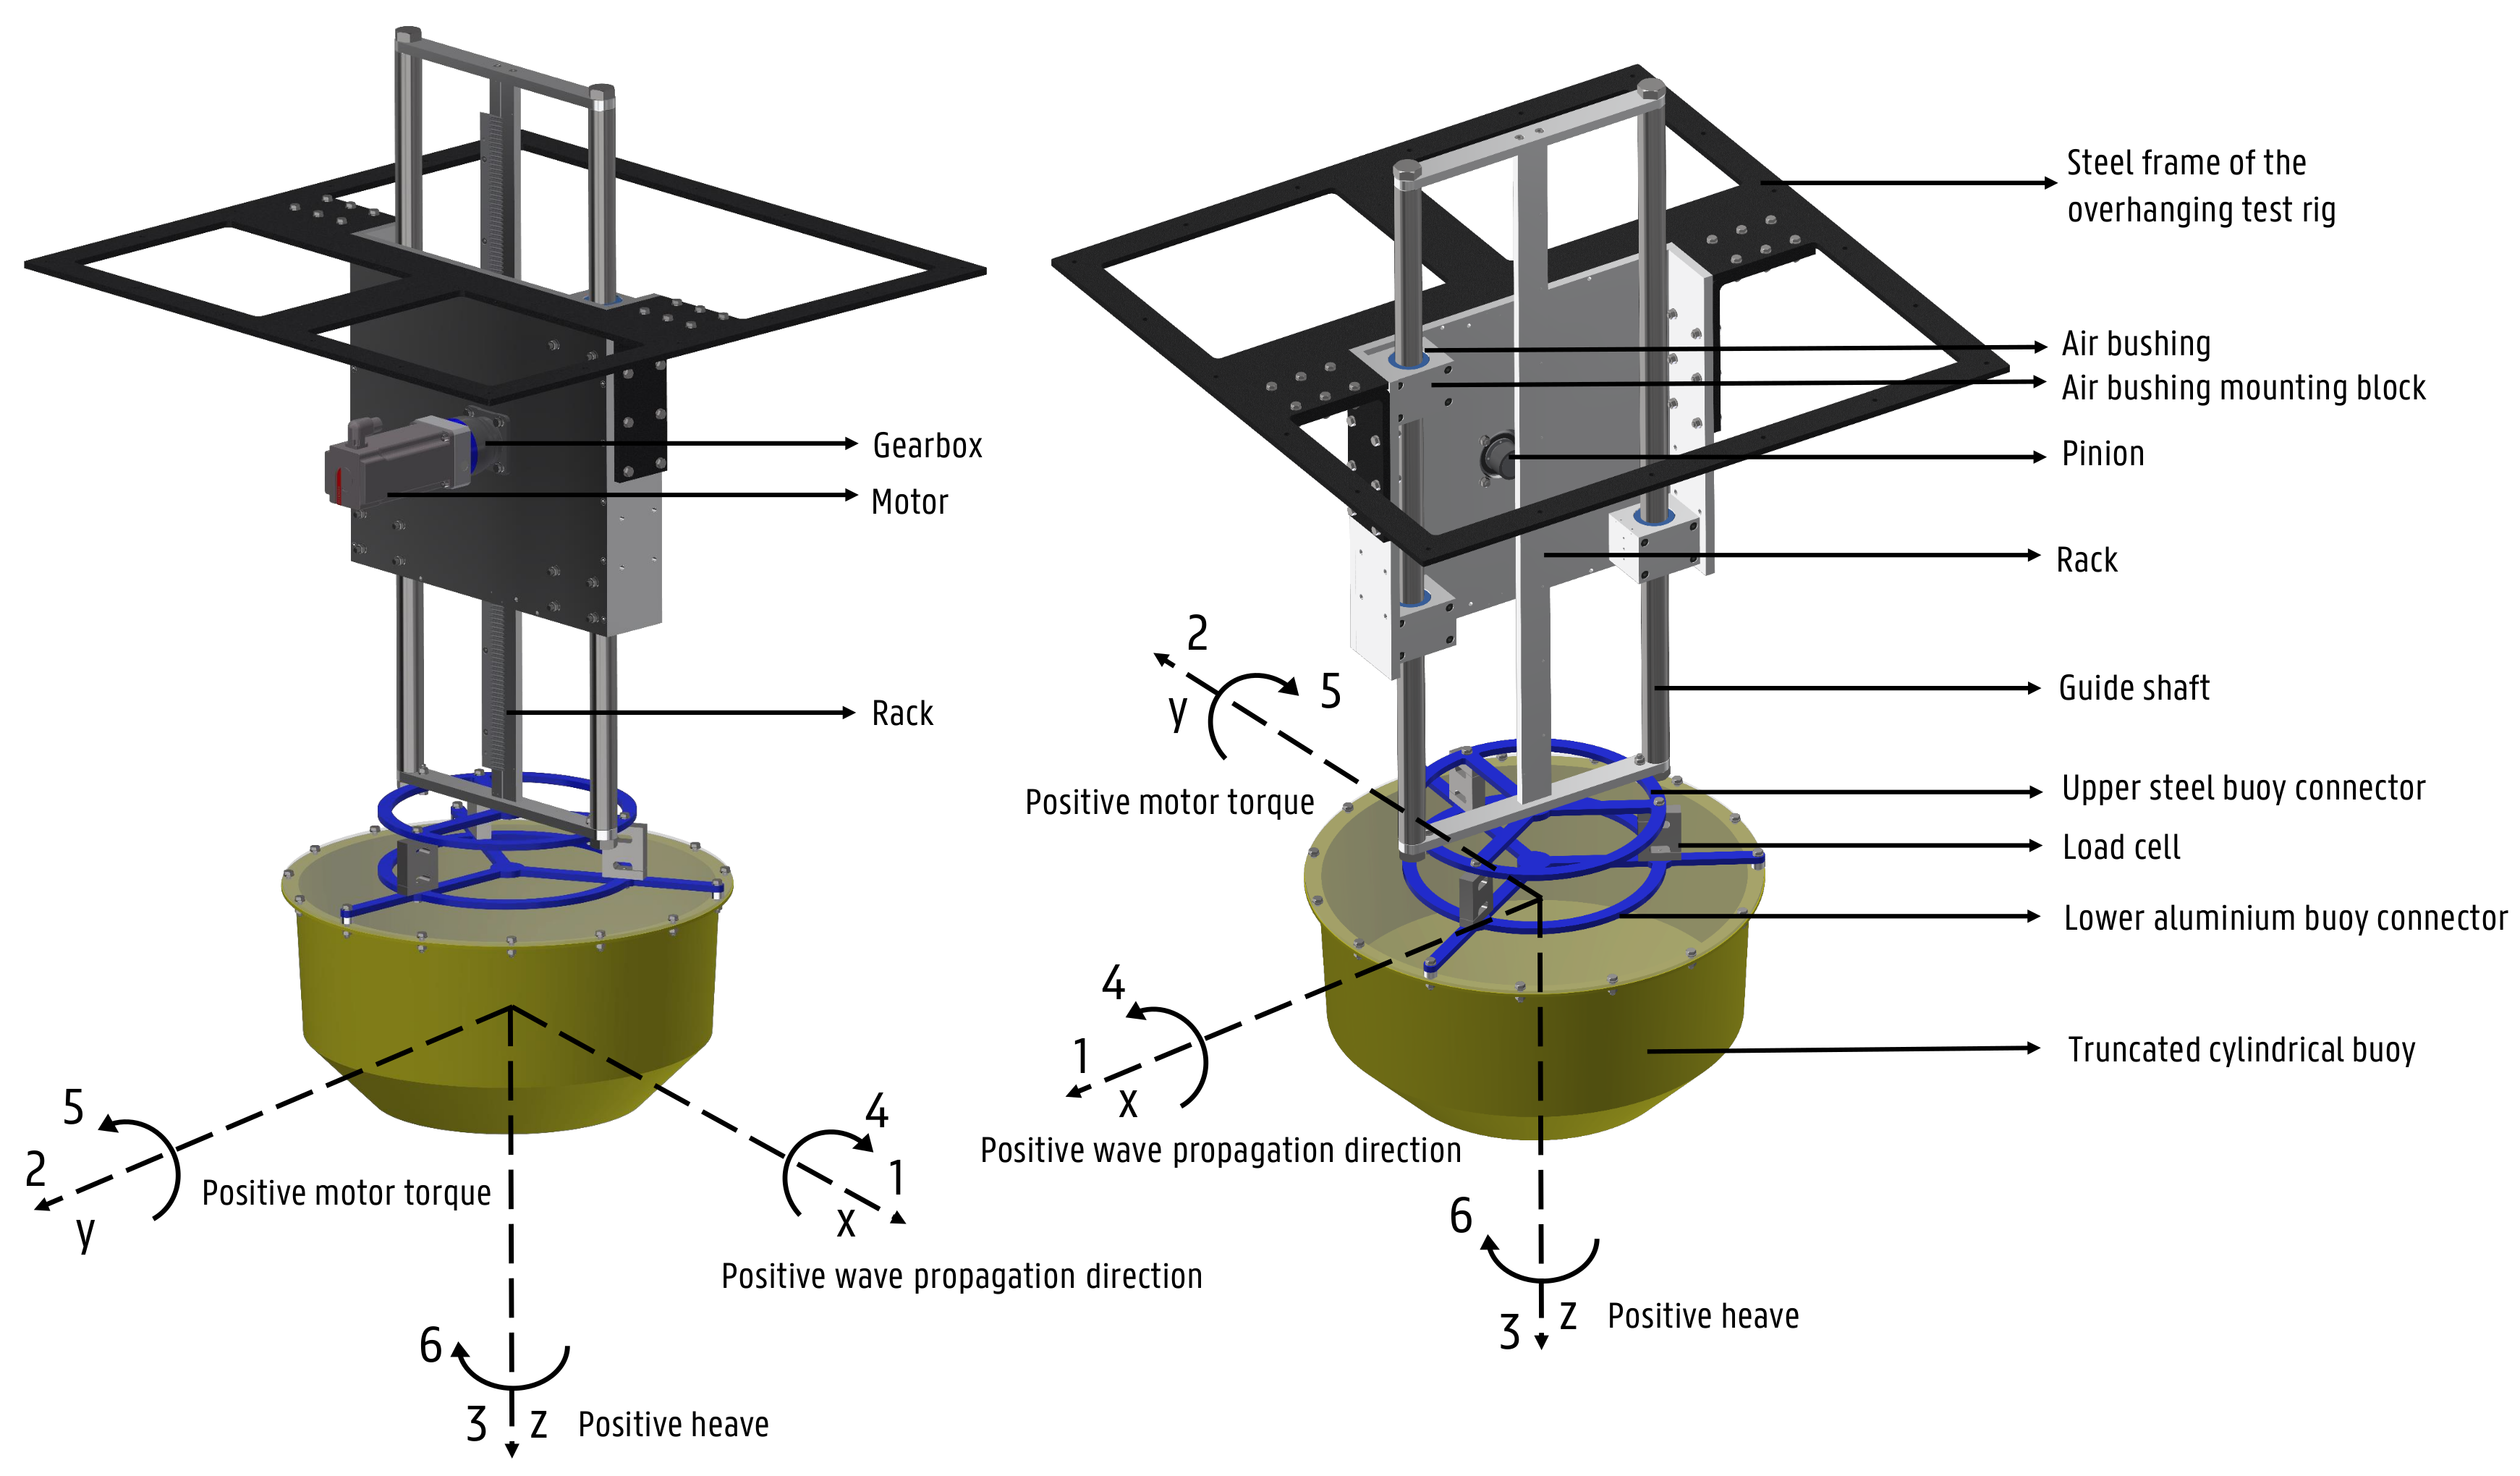
Figure 1. Rendering of the ‘WECfarm’ WEC, made with Autodesk Inventor (Autodesk, San Rafael, CA, USA).
Jmse 10 01480 g001
Figure 2. ‘WECfarm’ WEC: (a) 2D rendering of the WEC buoy, dimensions in m; (b) sensors and their respective location on the WEC.
Jmse 10 01480 g002
Figure 3. General data acquisition and control flow for the isolated ‘WECfarm’ WEC.
Jmse 10 01480 g003
Figure 4. Experimental setup of the isolated ‘WECfarm’ WEC at the AAU wave basin: (a) wave basin planview layout with dimensions in meters; (b) bird’s-eye perspective picture towards the wave paddles.
Jmse 10 01480 g004
Figure 5. Experimental setup of the isolated ‘WECfarm’ WEC at the AAU wave basin: (a) picture with indication of the subsystems; (b) picture with indication of the coordinate system and sign convention.
Jmse 10 01480 g005
Figure 6. Friction characterization tests (a) in the empty AAU wave basin; (b) with application of lateral loading in the-x-direction.
Jmse 10 01480 g006
Figure 7. Friction characterization WEC with gearbox and motor (a) z and z ˙ time series (Test_054); (b) Force time series (Test_054).
Jmse 10 01480 g007
Figure 8. Force to velocity mapping from the WEC friction characterization tests: (a) No lateral loading (Test_054); (b) No lateral loading (Test_054) versus −20 kg lateral loading in the x-direction (Test_057).
Jmse 10 01480 g008
Figure 9. WEC block diagram based on the dual single input single ouput (SISO) radiation/diffraction model.
Jmse 10 01480 g009
Figure 10. Radiation test: (a) Picture of the setup in the AAU wave basin; (b) F P T O and z ˙ time series (Test_059).
Jmse 10 01480 g010
Figure 11. Bode plot of the experimentally identified Z i for Test_021, Test_059, Test_066, Test_112 and Test_113.
Jmse 10 01480 g011
Figure 12. Excitation test: (a) Picture of the setup in the AAU wave basin; (b) F l o a d c e l l s and η W G 11 time series (Test_074).
Jmse 10 01480 g012
Figure 13. Wave excitation Test_074 and Test_077: (a) F ^ l o a d c e l l s and η ^ , frequency smoothened over a window of 30 frequencies; (b) H e , frequency smoothened over a window of 30 frequencies.
Jmse 10 01480 g013
Figure 14. Picture of WGs layout for η measurements with WG 11 on the location of the WEC buoy.
Jmse 10 01480 g014
Figure 15. Wave excitation tests (Test_074 and Test_050) and wave field accuracy tests (Test_172 and Test_173): (a) η W G 11 time series; (b) η ^ , frequency smoothened over a window of 30 frequencies.
Jmse 10 01480 g015
Figure 16. Free decay tests: (a) Picture of Test_161; (b) z time series of the free decay tests and corresponding exponential decay envelopes (Test_089, Test_129 and Test_170).
Jmse 10 01480 g016
Figure 17. Power generation quadrant.
Jmse 10 01480 g017
Figure 18. Radiation Test_112: (a) Bode plot intrinsic impedance and causal impedance matching P and PI controller; (b) Coefficients causal impedance matching P and PI controller.
Jmse 10 01480 g018
Figure 19. Resistive control test (Test_100): (a) z and z ˙ time series; (b) P a b s and C P T O time series.
Jmse 10 01480 g019
Figure 20. Reactive control test (Test_138): (a) z and z ˙ time series; (b) P a b s and C P T O time series.
Jmse 10 01480 g020
Figure 21. P ¯ a b s for Test_100, Test_103, Test_138 and Test_147.
Jmse 10 01480 g021
Table 1. Overview of the types of performed tests.
CategoryTest Type
Friction modelFriction characterization tests
System IdentificationRadiation tests
Excitation tests
Free decay tests
Power absorptionResistive control tests
Reactive control tests
Table 2. C V i s , C C o u , C C and z ˙ B o u for the resulting F C o m p .
C V i s [Ns/m] C C o u [N] C C [-] z ˙ B o u [m/s]
350400.600.0012
Table 3. Overview of the friction characterization tests.
Test_IDFilled
Basin
Loading
Force [kg]
Loading
Direction
Air Pressure
[bar]
Test_007no--5.0
Test_008no--5.0
Test_009no--0
Test_024yes--5.0
Test_025yes10−x5.0
Test_026yes15−x5.5
Test_054yes--5.5
Test_055yes10−x5.5
Test_056yes15−x5.5
Test_057yes20−x5.5
Test_058yes15y5.5
Table 4. Overview of the performed radiation tests.
Test_IDPTO
Input
Target
Time [s]
Frequency
Range [Hz]
PTO
Gain
C C
[-]
z m a x
[m]
Test_018Chirp-up2200.0–4.01.00.00.115
Test_021Chirp-down2204.0–0.01.00.00.122
Test_053Chirp-up2200.0–4.01.00.00.123
Test_059Chirp-up2200.0–4.01.00.00.116
Test_066Chirp-up2200.0–4.00.50.00.041
Test_109Chirp-up2200.0–4.01.00.00.127
Test_112Chirp-up2200.0–4.00.30.60.152
Test_113Chirp-down2204.0–0.00.30.60.162
Test_163Chirp-up2200.0–4.01.00.00.128
Table 5. Overview of the performed excitation tests.
Test_IDWave
Input
H s
[m]
T p
[s]
Test_IDWave
Input
H s
[m]
T p
[s]
Test_048JONSWAP0.051.0Test_076JONSWAP0.072.0
Test_049JONSWAP0.051.0Test_077JONSWAP0.092.0
Test_050JONSWAP0.071.0Test_078JONSWAP0.112.0
Test_071JONSWAP0.091.0Test_133Regular0.092.0
Test_072JONSWAP0.051.5Test_144JONSWAP0.072.0
Test_073JONSWAP0.071.5Test_145JONSWAP0.132.0
Test_074JONSWAP0.091.5Test_167JONSWAP0.201.5
Test_075JONSWAP0.052.0Test_168JONSWAP0.302.0
Table 6. Overview of η measurement tests with WG11 on the location of the WEC buoy.
Test_IDWave
Input
H s
[m]
T p
[s]
Test_172JONSWAP0.091.5
Test_173JONSWAP0.071.0
Test_174JONSWAP0.052.0
Test_175Regular0.092.0
Table 7. Overview of the performed free decay tests.
Test_ID z s t a r t [m] C C [-]n ξ d [-] T n [s]
Test_089−0.0890.620.131.19
Test_1290.0780.630.121.19
Test_161−0.2020.6n.a.n.a.n.a.
Test_162−0.2220.0n.a.n.a.n.a.
Test_1700.082; 0.140; 0.113;n.a.40.141.00
(no motor, gearbox and pinion)−0.204; −0.214; 0.039
Table 8. Overview of the resistive control strategy tests for regular waves.
Test_IDH
[m]
T
[s]
C C
[-]
C P T O
[kg/s]
Test_IDH
[m]
T
[s]
C C
[-]
C P T O
[kg/s]
Test_0800.092.00.00Test_1000.092.00.6[200;800]
Test_0810.072.00.00Test_1010.051.50.6[50;550]
Test_0850.092.00.0[0;800]Test_1020.071.50.6[50;450]
Test_0870.091.00.60Test_1030.091.50.6[50;550]
Test_0900.092.00.6[100;900]Test_1040.112.00.6[200;800]
Test_0910.051.00.60Test_1050.132.00.6[200;800]
Test_0920.091.00.60Test_1060.152.00.6[200;800]
Test_0930.091.00.6[25;125]Test_1150.092.00.6[200;800]
Test_0940.091.00.6[40;220]Test_1160.092.00.6[200;800]
Test_0950.071.00.6[40;220]Test_1390.071.170.6[50;500]
Test_0960.051.00.6[40;180]Test_1400.071.170.6[40;100]
Test_0970.052.00.6[200;1400]Test_1410.202.00.6[250;800]
Test_0980.052.00.6[200;800]Test_1640.202.00.6[0;800]
Test_0990.072.00.6[200;800]
Table 9. Overview of the resistive control strategy tests for irregular waves.
Test_ID H s
[m]
T p
[s]
C C
[-]
C P T O
[kg/s]
Test_ID H s
[m]
T p
[s]
C C
[-]
C P T O
[kg/s]
Test_0790.051.00.00Test_1580.091.50.6200
Test_1300.091.50.6300Test_1590.091.50.6100
Test_1310.091.50.6200Test_1600.201.50.6200
Test_1320.091.50.6400Test_1690.302.00.6500
Table 10. Overview of the reactive control strategy tests for regular waves.
Test_IDH
[m]
T
[s]
C C
[-]
C P T O
[kg/s]
K P T O
[kg/s 2 ]
Test_1370.092.00.6[320;480][−1710;−1140]
Test_1380.092.00.6[48;72][−2280;−1520]
Test_1460.091.50.6[277;415][−978;−652]
Test_1470.091.50.6[70;104][−1680;−1120]
Publisher’s Note: MDPI stays neutral with regard to jurisdictional claims in published maps and institutional affiliations.