1. Introduction
The growing international awareness of climate change and global warming has led various countries and organisations to issue regulations or outline goals to address the topic. The transportation sector, consisting mainly of shipping, air transport, road transport and rail, is one of the various sources of global pollution. According to the International Maritime Organization (IMO), shipping was responsible for nearly 2.9% of the global carbon dioxide equivalent emissions in 2018, with a total of 1076 million tons, which represents a 9.6% increase over the 977 million tons accounted for in 2012 [
1]. For this reason, IMO adopted mandatory regulations for ships through its 1973 International Convention for the Prevention of Pollution from Ships (MARPOL) treaty, in particular with regard to emissions with its Annex VI, which entered into force in 2005. The treaty was amended several times to set limits which, over time, became more severe. First, in 2008, IMO established limits on emissions of nitrogen oxides and sulphur oxides, and some Emission Control Areas (ECAs) where limits were stricter than those outside them with the resolution MEPC 176 (58). Hence, with resolution MEPC 203 (62) in 2011, IMO included regulations on the calculation of the Energy Efficiency Design Index (EEDI), a measure of the emission of carbon dioxide in the operating conditions of a particular ship.
Ways to reduce EEDI have been presented, for example, in [
2] (effect of contractual speed reduction) and [
3], where new energy conservation measures were presented. This study focuses in particular on cruise ships, considering not only the need for electric power for propulsion, ship services, and payload services, but also addressing the need for hot water and steam. Innovative ways to save energy onboard considered in this study are Organic Rankine Cycles (ORCs), steam turbines, heat pumps, and heat recovery. ORC and dual pressure steam systems have proven to be the most beneficial technologies for improving energy efficiency. Alternative propulsion systems were investigated [
4], concentrating on ro-ro ships and ferries. In particular, the authors of [
4] focused on dual fuel engines, which use Liquefied Natural Gas (LNG) and Marine Diesel Oil (MDO) as fuels, and a Waste Heat Recovery (WHR) system was also considered. The ro-ro ship in this study would not meet the required EEDI, except with a propulsion plant composed of dual fuel engines equipped with a WHR system. Another study [
5] proposed the use of solar energy as a means by which to reduce EEDI, and also considered the effect of time, declination angles and latitude. Some criticisms have also been levelled at the regulation. For example, [
6] highlights that most newly built ships can easily comply with EEDI calculation, and also that it only considers one operating condition. This study proposes a more realistic way to assess the energy efficiency of ships, especially bulk carriers.
IMO has also outlined a strategy to further reduce GHG emissions in the maritime sector and, in particular, carbon intensity, defined as the emission of carbon dioxide per transport work. The goal is to reduce this characteristic by at least 40% by 2030, and try to achieve a reduction of 70% by 2050 compared to 2008. Furthermore, global annual GHG emissions from shipping are expected to be reduced by at least 50% by 2050 compared to 2008, reaching carbon neutrality as soon as possible by the end of this century. In the latest IMO Marine Environment Protection Committee (MEPC 76), held in June 2021, a new index was proposed for discussion: Carbon Intensity Indicator (CII). This factor is a measure of the total carbon dioxide emissions divided by the amount of cargo carried and by the distance travelled on an annual basis. Several options have been proposed for calculating the CII, but none have been taken as the final formula. The CII measuring is linked to a rating system for ships, from A to E, where A is best. If a ship achieves a D or E rating for three consecutive years, it should then outline a strategy for achieving a C or better rating the following year. As this proposed regulation is recent and still under development, there are not many publications available. Some criticisms have already appeared, pointing out that there are four potential formulas of CII defined as “supply-based”, “demand-based”, “distance-based”, and “sailing time-based”. In order to comply with the “supply-based” CII, the “distance-based” CII, or “time-based” CII limits, a shipowner may sail for a certain distance with the ship empty, thus enhancing emissions only to comply with regulations and not allowing the ship fulfil its purpose. The article also points out that the “demand-based” CII can be achieved by detouring over long distances. For this reason, the authors of [
7] affirm that this requirement can bring certain ships to increase overall emissions in order to comply with CII regulations. A detailed overview of the proposed CII regulation and the calculation and rating scheme has been presented in [
8] by a classification society.
The context of stricter emissions limits still needs to be fully outlined, but it is clear that there is a distinct tendency to find ways to reduce emissions from ships [
9,
10,
11]. In order to lower GHG emissions, different measures can be taken by shipowners and ship designers. Technological solutions can bring different benefits to GHG emissions while influencing the overall design of a ship [
12]. In recent years, ship designers have focused on switching from traditional residual oil-based fuels to alternative ones, such as low sulphur fuel oils or gaseous fuels (especially natural gas), or on implementing exhaust gas cleaning technologies, such as scrubbers and Selective Catalytic Reduction (SCR) systems [
13]. Low sulphur fuel oils, scrubbers, and SCR systems were the most popular options to comply with IMO sulphur oxides and nitrogen oxides emissions regulations. A detailed technical-economic description of the scrubbers states that sulphur oxides emissions are reduced by more than 90%, and that the emissions of Particulate Matter (PM) are reduced by 60% to 90% while causing the discharge of hazardous waters in the so-called “open-loop” configurations [
14]. SCR systems can reduce nitrogen oxides emissions by 90% by washing exhaust gases with a solution of ammonia or urea [
15]. These systems have some downsides, such as worse abatement performances at low engine loads, wear and tear of the catalyst during operation, resulting in ammonia slip, and additional space and weights required for installation [
16]. When trying to lower carbon dioxide emissions, and thus CII, exhaust gas treatment systems cannot bring a tangible benefit, even if some carbon capture systems for ships are currently under a design stage [
17,
18,
19]. Changing the fuel is the other possible solution to reduce CO
2 emissions without installing exhaust gas treatment systems. Today, the vast majority of marine oil-based fuels have a sulphur content which allows the ship to comply with IMO regulations on sulphur oxides emissions. To reduce GHG emissions, different fuels can be employed onboard. The most consolidated and well-known solution is natural gas, especially in its liquefied state, or LNG. The benefits of adopting LNG as a marine fuel are a 45% to 85% reduction in nitrogen oxides emissions, almost zero sulphur oxides emissions, and a 15% to 30% reduction in carbon dioxide emissions [
20]. The main environmental downside of LNG fuelled engines is methane slip, i.e., the emissions of unburnt methane in the atmosphere [
21,
22].
The possibility of having gaseous fuels like natural gas onboard a ship and the need to further decrease GHG emissions have led to a consideration of innovative power generators in recent years, such as Solid Oxide Fuel Cells (SOFCs). SOFC are fuel cells, devices capable of converting gaseous fuels into electric energy through an electrochemical reaction [
23]. This particular technology is characterised by an operative temperature above 800 °C, by a theoretical electrical efficiency that can reach 60%, by a flexibility of the inlet fuel, and by GHG emissions consisting only of carbon dioxide if natural gas is used as fuel [
24]. SOFC in 2020 were the second fuel cell type in terms of unit numbers shipped, particularly for home appliances in Japan and as a power source for data centres [
25]. Due to these advantages, SOFC have begun to be considered as a possible option for power generation onboard ships, particularly on cruise ships, as the high operating temperatures may allow for the installation of a heat recovery system [
26]. These systems can boost efficiency and can lead to thermal power generation, which is a significant part of the overall power required by a cruise ship [
27]. A study on the benefits obtained from installing SOFC on a ship in terms of emissions, economics, and efficiency highlights the possibility of reducing GHG emissions up to 34%, and the fact that a ship’s lifetime, fuel prices, and Capital Expenditure (CAPEX) are the main uncertain parameters [
28]. Another publication examines the possibility of using a hybrid SOFC-gas turbine system that operates in parallel with dual-fuel diesel generators. The hybrid system is the main source of electrical power during port stays because SOFC have long start-up and shut-down times due to their high temperature. This system also brings an advantage over the EEDI calculation and is therefore described as particularly suitable for gas carriers [
29,
30,
31]. Another work states that splitting the electric power generation between SOFC (67%) and dual fuel internal combustion engine (33%) can bring about a maximum efficiency gain of about 8% [
24].
This study is focused on the growing market for cruise ships. Twenty-eight cruise ships of various types were delivered in 2021 to various shipowners, with capacities ranging from 120 passengers to more than 5000, and costs ranging from 65 million dollars to almost 950 million dollars [
32]. The application of LNG as main fuel in these types of ships is one of the current options and is already considered by many shipowners as the main solution for an immediate reduction of carbon dioxide emissions. When this fuel is available onboard, SOFC can be used as a power generation system, and 50 kW of SOFC will be installed onboard in a cruise ship due to be launched in 2022 [
33].
This study is focused on the calculation of carbon intensity for a cruise ship as initially outlined by IMO, assessing how different technical solutions for power generation onboard perform regarding the proposed index. This calculation shows clearly which CII is attained when a cruise ship is equipped with current power generation systems, and if and how these values can be improved when employing SOFC onboard. As already outlined, there have been studies regarding SOFC and possible solutions for greenhouse gas emissions mitigation for cruise ships, and also some considerations about the proposed CII, but none of them, to our knowledge, specifically address the development and utilization of an originally developed software tool focused on cruise ships energy CII calculation. The paper is articulated into five sections. After the introduction,
Section 2 describes the methods employed by the authors to calculate the CII of a contemporary-class cruise ship, which is the biggest type of cruise ship capable of carrying onboard almost 7000 people. This proposed index of ship emissions is calculated for one year of operation. Authors of this study have assumed a plausible year of operation, which is composed of different typical cruise routes all over the world, spanning from the Mediterranean to Northern Europe and the Caribbean. Once characteristics of the ship have been defined, the amount of power loads related to propulsion and to all other services required onboard this type of vessel are described. This power is required both as electrical power and thermal power, requiring different types of generators and of energy recovery systems. In the same section, seven possible different power plant layouts are outlined in order to compare their fuel consumption and their emissions. Each generator is described in terms of electrical efficiency and of the efficiency of the state-of-the-art energy recovery systems that can be coupled to them. Once operative profiles, power requirements, and possible power generation plant configurations are outlined, the steady state condition simulation process and its results are described in
Section 2. From this simulation, knowing each generator’s fuel consumption and total fuel requirement, total emissions are calculated.
Section 3 describes the proposed method for CII calculation, how this value changes with the ship’s gross tonnage and how this regulation would become stricter over the years.
Section 4 provides a discussion of the results obtained and proposes some possible developments for this paper. Finally,
Section 5 concludes the paper.
2. Methods
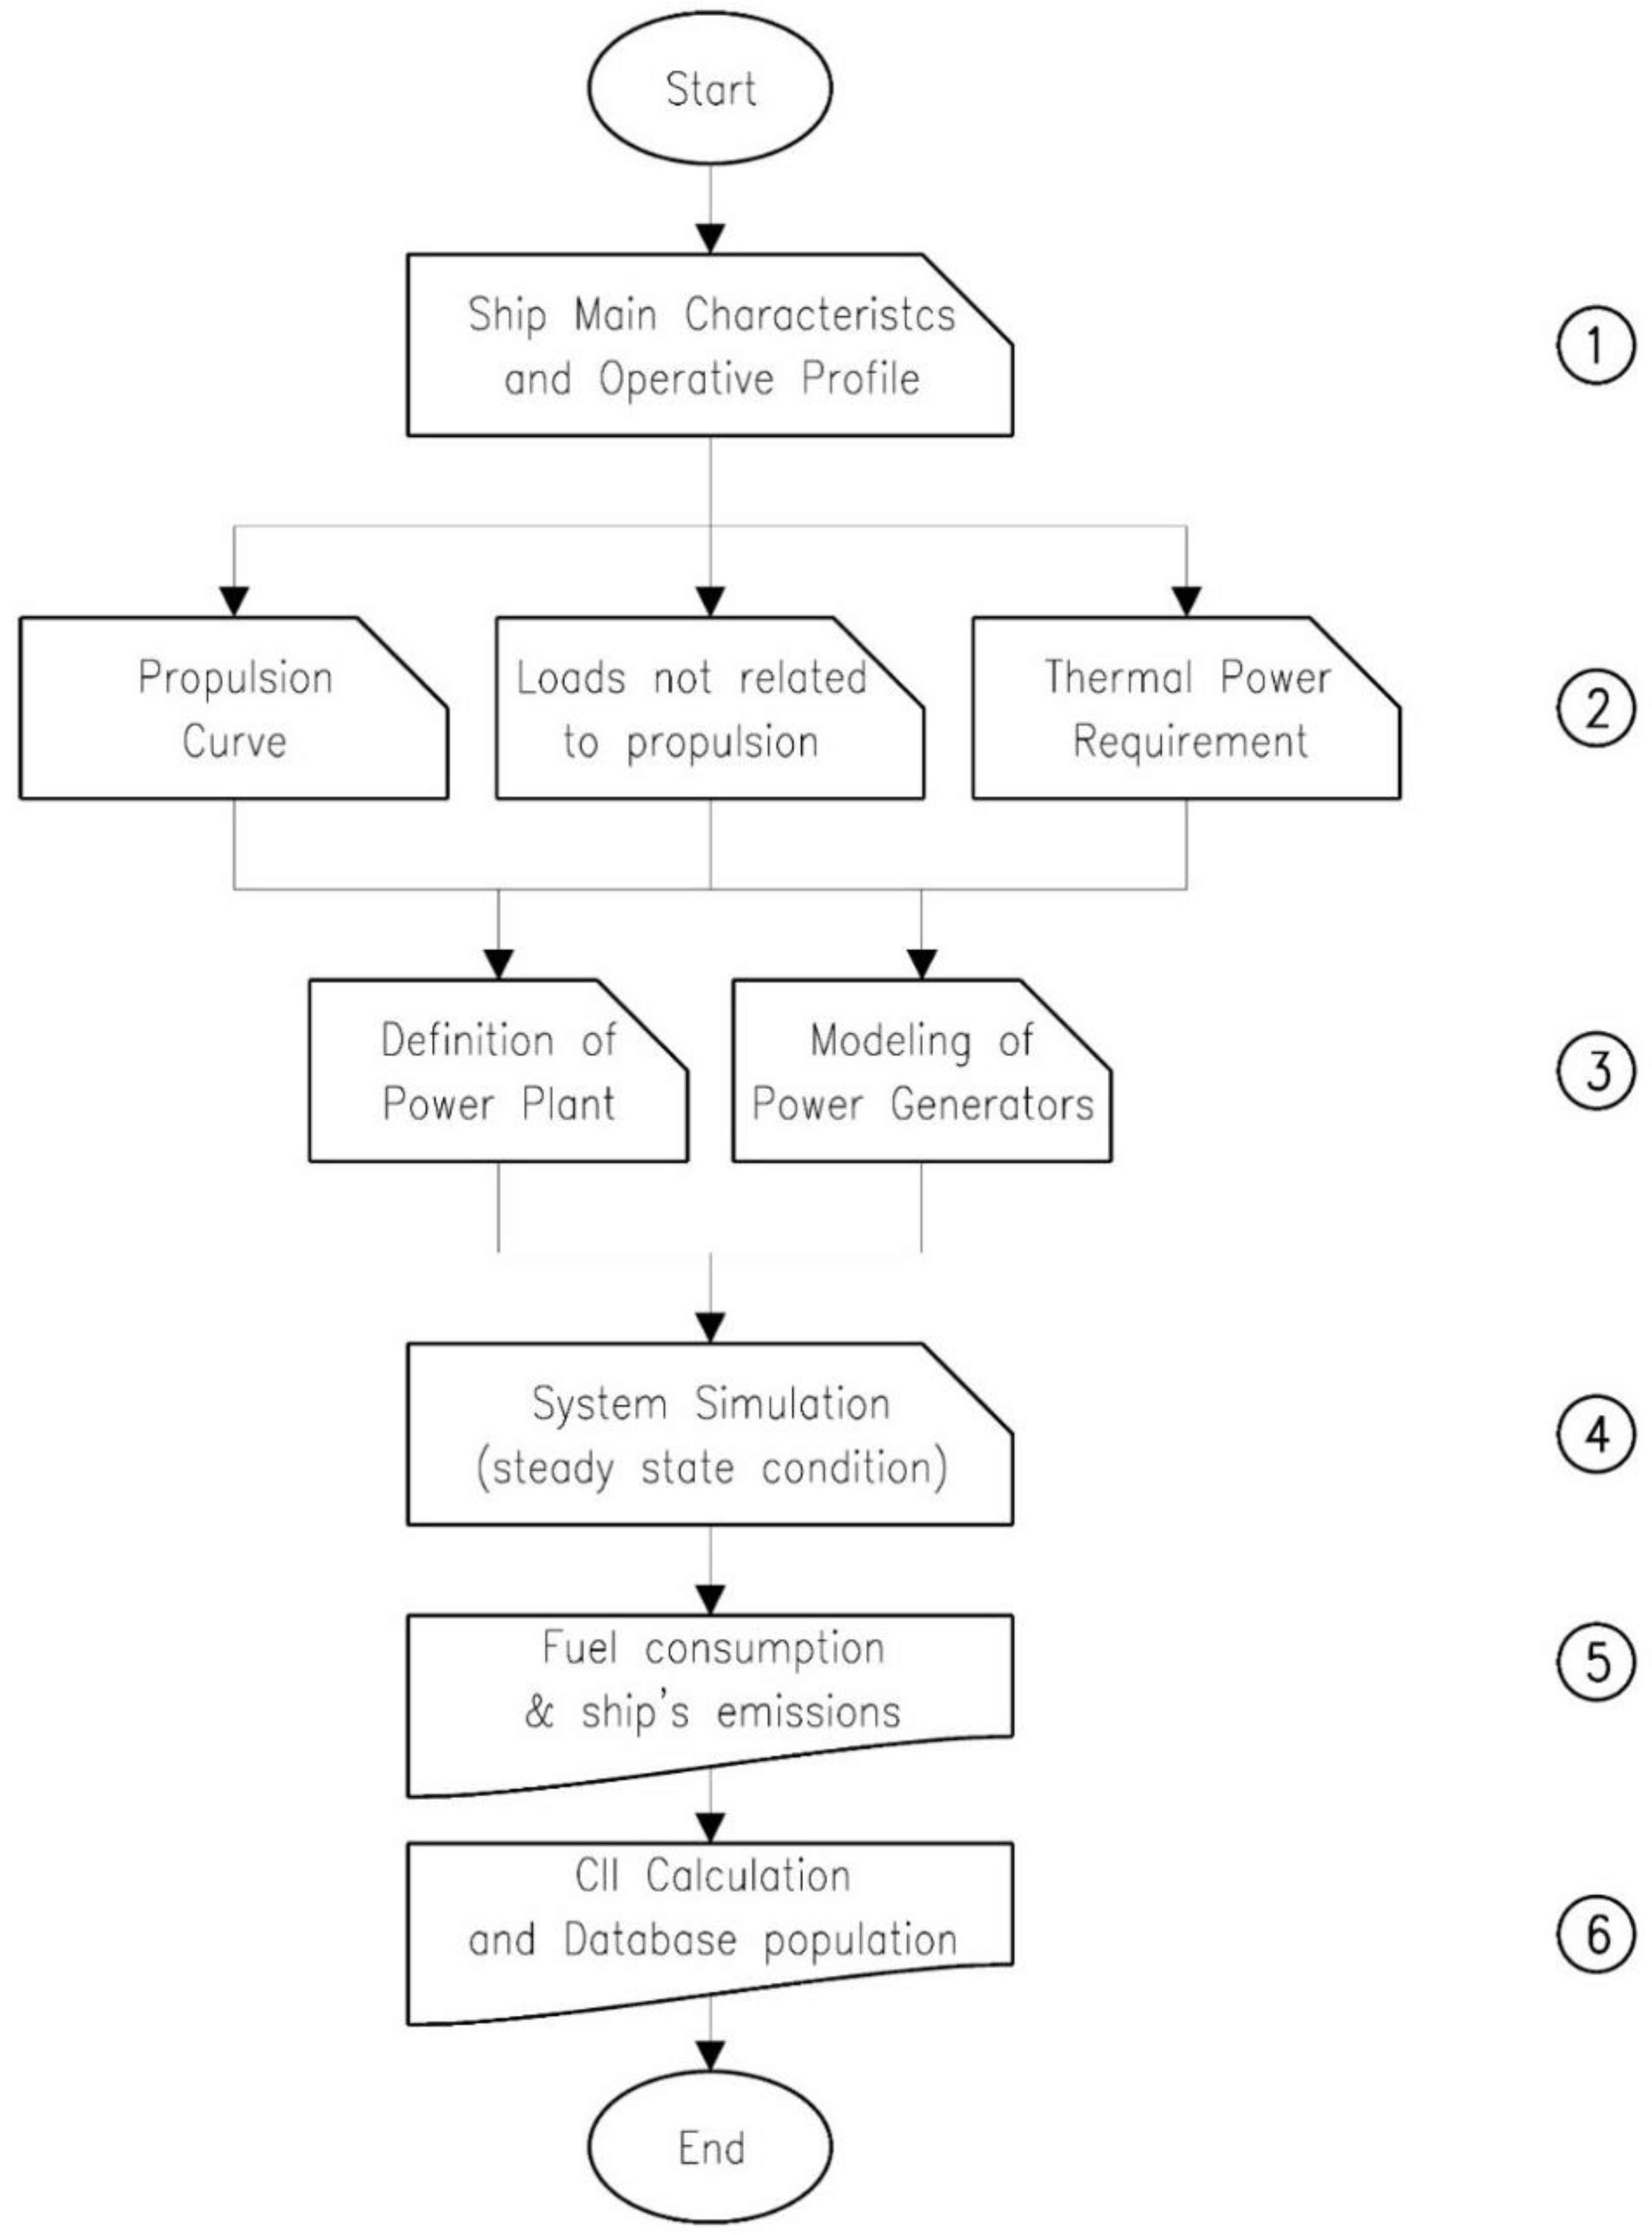
The method followed to evaluate the CII of a cruise ship equipped with different power generation plants is described in
Figure 1. In the following sub-paragraphs, each phase is described.
2.1. Ship Main Characteristics and Operative Profile
The first phase of the simulation model is associated with the definition of the ship, which is taken as a reference for the study. Cruise ships can have different sizes, which are represented by their main characteristics like gross tonnage and deadweight. Gross tonnage is a number related to the internal volume of the ship and is defined according to the IMO’s International Convention on Tonnage Measurement of Ships with Equation (1), where
V is the ship’s total volume in cubic meters.
For this study, a ship with a gross tonnage of about 180,000 GRT and with the characteristics described in
Table 1 is taken as the reference vessel.
Normally, for cruise ships, gross tonnage identifies cruises’ market segments, with different technical and commercial characteristics. A cruise ship with 180,000 GRT can embark about 7000 people and is considered a contemporary-class cruise ship. This type of vessel is dedicated to standard routes and to almost all types of passengers, for which onboard features can represent the main attraction of the holiday. This data is important because, by knowing the class of the cruise ship, it is possible to better estimate its operative profile.
In order to estimate the total power required by the reference ship during one year of operation, its operational profile was assumed. Cruise ships can travel in different locations during different seasons; thus, establishing an accurate operating profile is not easy. In this work, it was assumed that the cruise ship sails in four different scenarios. These scenarios differ in air temperature, relative humidity, and water temperature, and resemble cruises in their most popular destinations, such as the east and west Mediterranean, the Caribbean, and Northern Europe (EU). A typical contemporary-class cruise ship would travel worldwide during the year, and thus these four scenarios can be a good model of its operative conditions. The characteristics taken as reference are shown in
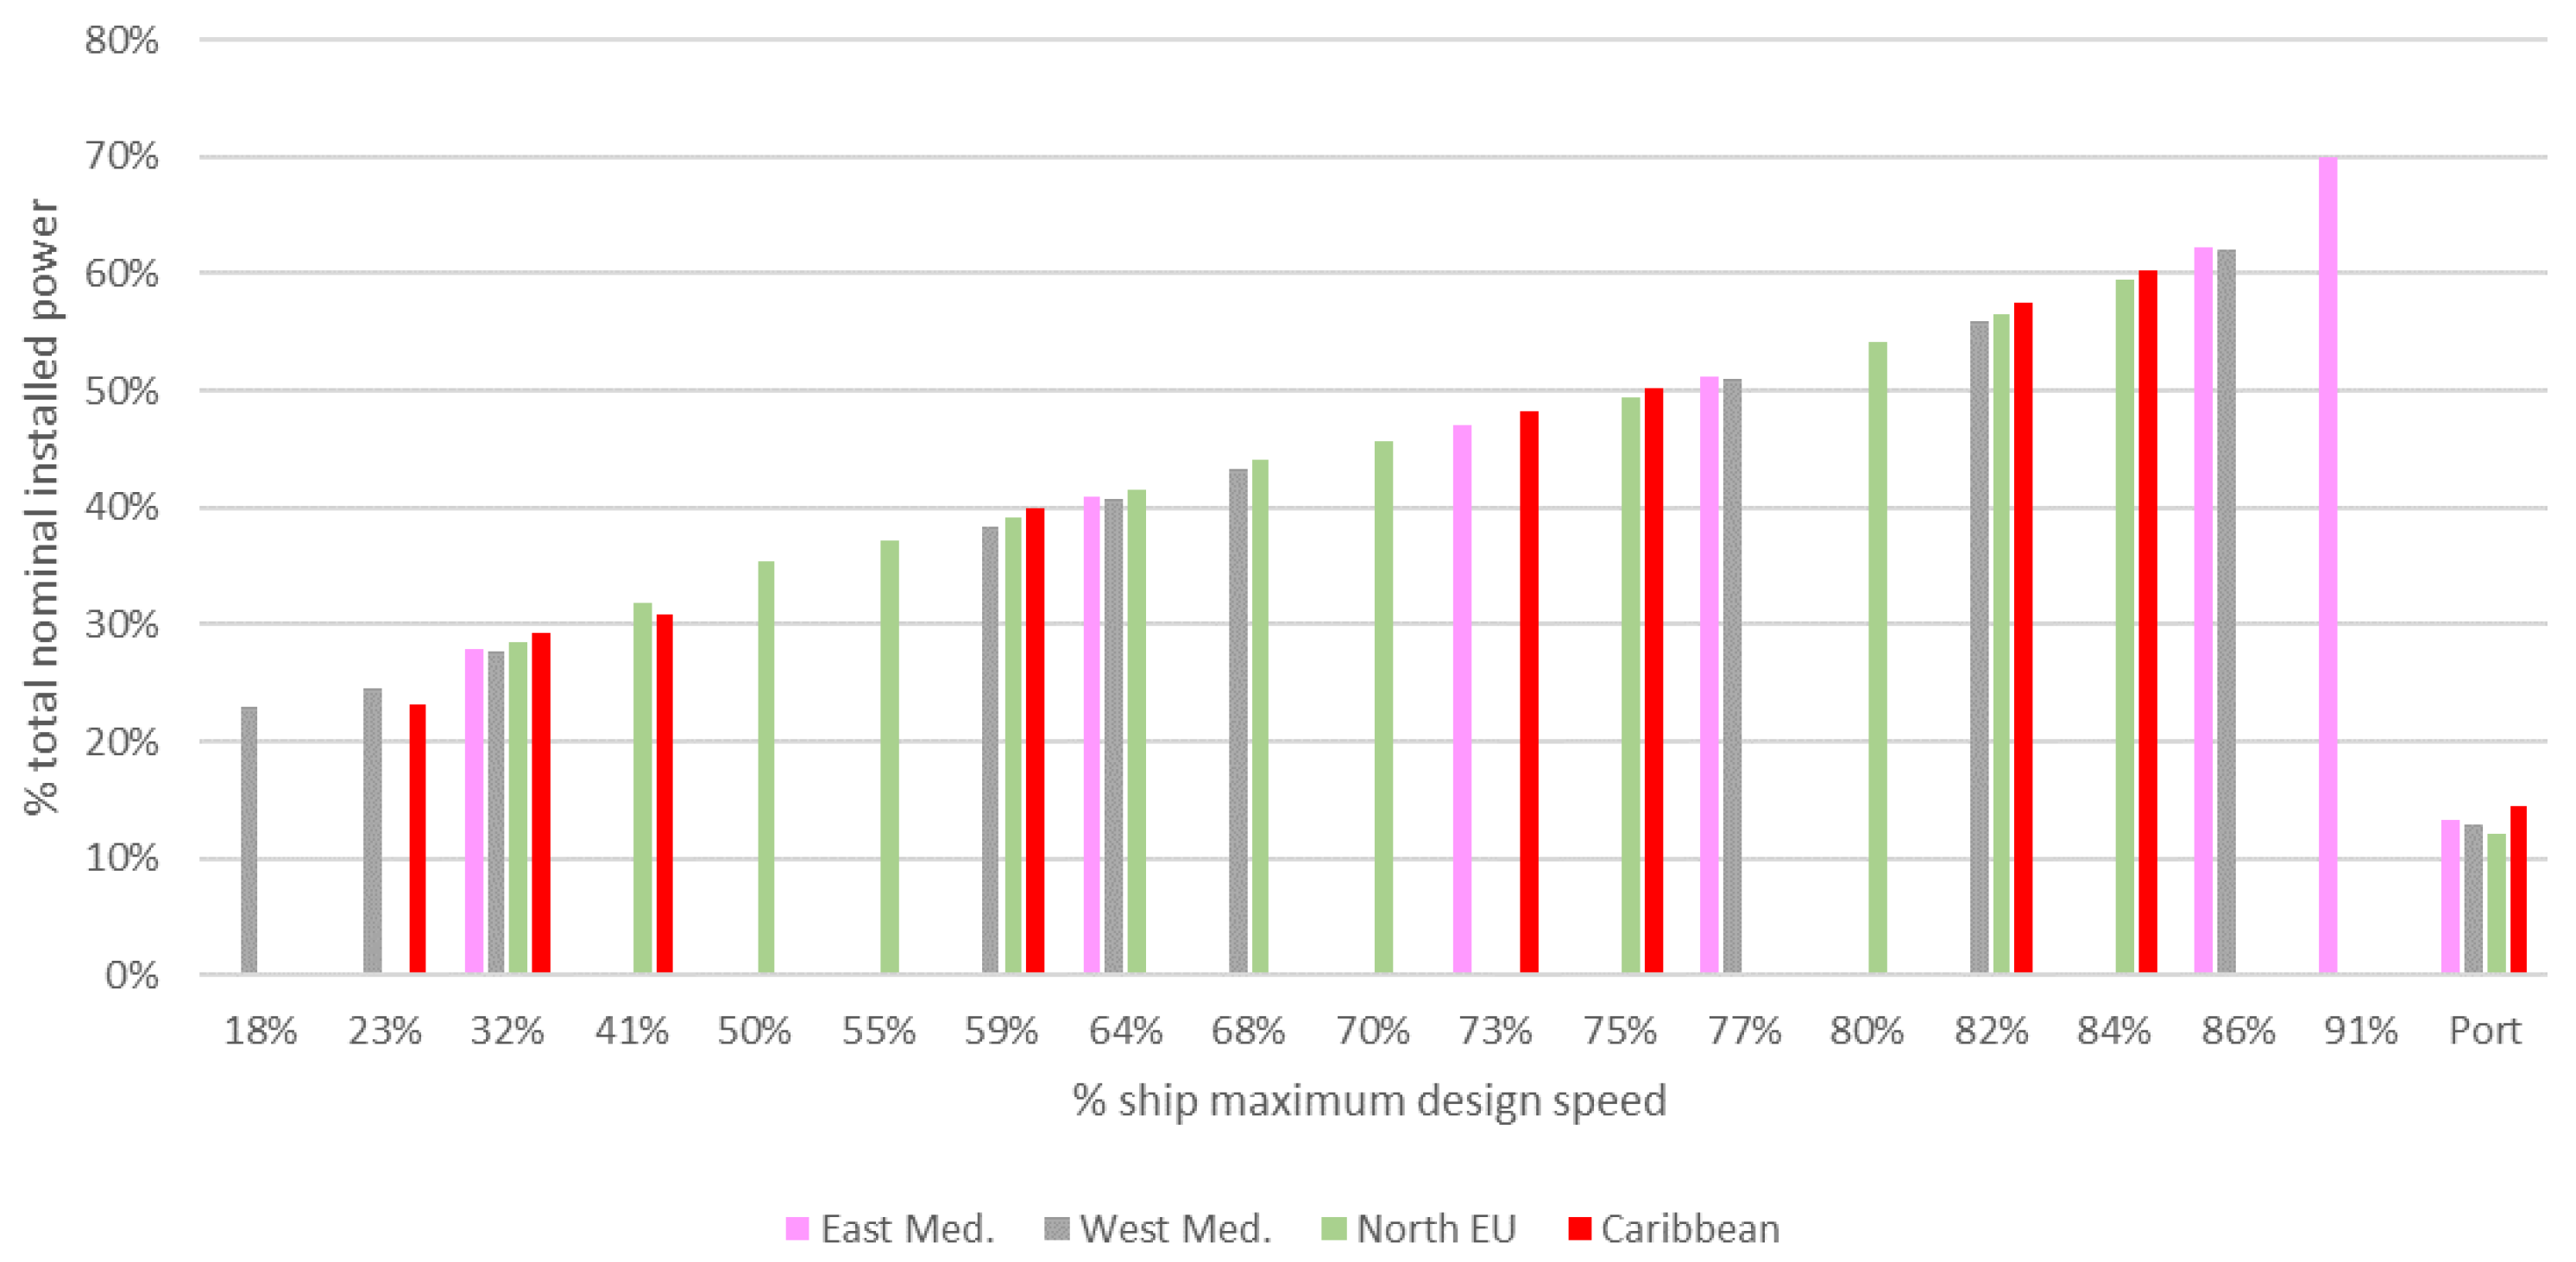
Table 2. These scenarios also have different durations and different ship speeds, port stays, and manoeuvre times. A representation of these variations is given in
Figure 2. Each step of the
x-axis identifies an operating mode of the ship as a percentage of the maximum design speed. These values were chosen by analysing the actual operational profiles of cruise ships available to the authors of this article: the ship sails at a particular speed during different operative profiles. The first value, for example, is “18%”. Supposing that the maximum design speed of the reference vessel is 22 knots, the operating mode identified by this value is one in which the ship sails at about 4 knots, like manoeuvring operations. For each operative mode of the
x-axis, a vertical bar illustrates a percentage of the total cruise duration spent in that operating mode. The pink bars refer to the operational profile of the east Mediterranean Sea, the green bars to west Mediterranean Sea, the grey bars to Northern Europe cruises, and the red bars to the Caribbean Sea. The reference cruise ship and its operating profile over one year of operation will remain the same for power plant configuration and to better compare carbon dioxide emissions. It can be highlighted from
Figure 2 that, for a cruise ship, a significant share of the operational time is passed inside ports: for cruises in the east Mediterranean Sea, west Mediterranean Sea, and the Caribbean, 40% to 45% of the time is passed inside port. For a cruise in Northern Europe, this share is reduced to almost 20% because, as it is assumed that for these cruises, the ports involved in the voyage are more distant from each other. If we assume that a cruise lasts 10 days, for “East Med.” port stays last almost 4 days, “West Med.” and “Caribbean” port time is almost 4 days and a half, and for “North EU” the time spent in this operating mode is slightly more than 2 days.
2.2. Power Requirement Estimation
2.2.1. Propulsion Curve
A ship’s propulsion curve is obtained, for most ships, from in-house data taken from similar ships that have already been designed, tested in tanks, and then built, at least during the first design phases. Alternative methods are based on empirical models [
34,
35,
36] and/or computer-based simulation tools [
37]. A design power propulsion curve is taken as a reference for the reference vessel. The propulsion curve is based on the resistance of the hull at different speeds, and the interaction between the propulsion system and the hull. In most cases, the propulsion curve is similar to a cubic function where the dependent variable is the power required for propulsion, and the independent variable is ship speed. An example of a ship’s propulsion curve is shown in
Figure 3.
2.2.2. Loads Not Related to Propulsion
The main power requirement of merchant ships comes from propulsion, but this characteristic is not true for all types of vessels. Some types of ships require an amount of power for their payload comparable to that required for their propulsion. Cruise ships are one of these types of vessels. Cruise ships, especially those with about 180,000 GRT, can be considered as small floating cities where all kinds of possible services and entertainment are available. These services are related to lighting, accommodation, pools, and common areas, but also private cabins, galleys, ventilation of spaces, and air conditioning. In addition, there are other loads not related directly to propulsion. Hull and deck services, such as mooring equipment, safety services, and all the auxiliaries related to propulsion services; for example, heat exchangers and ventilation for machinery spaces. The maximum power required by all these services can be estimated to be 15 MW for a cruise ship of about 180,000 GRT, but this figure is not required in each operational scenario.
By adding up the required propulsion power and all loads not related to this service, the power demand for each operational scenario as percentage of the total installed power onboard the reference vessel is shown in
Figure 4. Similar to
Figure 2, each step of the
x-axis identifies a ship operating mode as a percentage of the maximum design speed. For each operating mode of the
x-axis, a vertical bar illustrates the power demand in that condition as a percentage of total installed power onboard the reference vessel. The pink bars refer to the operational profile of the east Mediterranean Sea, the green bars to the west Mediterranean Sea, the grey bars to Northern Europe cruises, and the red bars to the Caribbean Sea. Assuming that total installed power onboard the reference vessel is 60 MW, the required power when the reference vessel sails at 77% of its design speed is almost equal to 30 MW for “East Med.” and “West Med.” operating profiles. The other two operating profiles are not represented by this speed (see
Figure 2), and thus there is no corresponding vertical bar.
As shown in
Figure 4, the total power required in port is approximately 12% of the total rated power installed onboard the ship. These loads are those not related to propulsion and can be considered almost constant in each operating condition. Furthermore, the power required in the four different scenarios is similar for each operating condition: there is no great difference between the green, grey, and red bars for the “82%” operating mode. Differences are related to different environmental conditions as indicated in
Table 2, which considers the different loads required, for example, for air conditioning and other services. The values chosen on the
x-axis were obtained from an analysis of actual cruise ships operational data collected and available to the authors of this article.
When the steady state conditions are considered, i.e., the required power shown in
Figure 4 is constantly required for the time indicated in
Figure 2, the energy required for each operating condition can be calculated as the product of these two figures. The result is shown in
Figure 5. Similar to
Figure 2 and
Figure 4, each step of the
x-axis identifies an operating mode of the ship as a percentage of the maximum design speed. For each operating mode of the
x-axis, a vertical bar illustrates the energy required in that condition as a percentage of total energy required during the entire operating profile for the reference vessel. The pink bars refer to the operational profile of the east Mediterranean Sea, the green bars to west Mediterranean Sea, the grey bars to Northern Europe cruises and the red bars to the Caribbean Sea. Assuming the total energy demand for the “East Med.” operative profile is 4000 MWh, almost 23% of this energy is required by the ship when the reference vessel is sailing at 64% of its design speed, while almost 28% of the total energy demand is requested when the ship sails at 77% of its design speed. As highlighted, for the east Mediterranean Sea operational profile, energy is required above all during navigation at medium speeds (64% and 77% of maximum design speed), while the energy required during port stays represents almost 15% of the total energy required during this type of cruise. A similar condition is presented for the west Mediterranean Sea operational profile, although the energy is required when the ship sails at a lower speed, and the energy required for port stays represents a more significant share than that of “East Med.”, reaching almost 20%. The Northern Europe operational profile is very balanced for the power demand, and does not have large peaks, but as reported in
Figure 2, it is the one in which the ship sails the most, and therefore the energy required in port by the ship represents only 7% of the total energy required. For the Caribbean operational profile, the situation is similar to that of the Mediterranean Sea operational profiles.
2.2.3. Thermal Power Requirement
Since cruise ships can be considered to be floating cities, they require not only electrical power but also thermal power. This power is used for various services onboard cruise ships, mainly for galleys and laundries, which operate almost 24 h every day. Other services that require heat are the tanks heating system, fuel purifiers (only for oil-based fuels), freshwater heaters, swimming pool water heaters, and the heating and ventilation air conditioning system. Heat is generated onboard via heat recovery systems associated with prime generators and via steam generators fuelled by the same fuel used for power generation on the vessel. Certain users require heat at high temperatures, so high-pressure steam is required: the steam needed onboard the reference cruise ship is shown in
Figure 6. Similarly, to other figures, each step of the
x-axis identifies an operating mode of the ship as a percentage of the design maximum speed. For each operating mode of the
x-axis, a vertical bar illustrates the thermal power required in that operating condition as a percentage of the total thermal power generation capacity of the steam boilers installed on the reference vessel. The pink bars refer to the operational profile of the east Mediterranean Sea; the green bars to west Mediterranean Sea; the grey bars to Northern Europe cruises; the red bars to the Caribbean Sea. Assuming that the total thermal power generation capacity of the steam boilers installed on the reference vessel is 10 MW, during “West Med.” operating mode almost 8.5 MW of thermal power is required by ship users when the reference vessel sails at 59%, 64%, 68%, 77%, and 86% of the design speed. The need for steam is particularly high in the Northern Europe operational profile since sea and air temperatures are lower, so there is a greater demand for heating by the various users. Other users only need hot water, and the power required at this lower temperature is shown in
Figure 7 in the same way explained in
Figure 6. The picture highlights how the heat required at low temperature is lower than that required at high temperature, and the demand is also more stable in different operating conditions. As explained in paragraph 2.4, the thermal power requirement is covered first by the heat generated by the recovery systems and then, if this figure is not enough, by the steam generated by dedicated generators installed onboard.
Figure 6 indicates a heat requirement higher than 100%. This relative value is given by the ratio between the thermal power required and the thermal power generation capacity of oil-fired steam boilers installed onboard. In some conditions, heat demand is higher than the thermal power generation capacity of the steam boilers: In these cases, the value is higher than 100%. When the ship is in this condition, however, the total heat demand is satisfied because thermal power is generated partially by heat recovery systems and partially by steam generators installed onboard.
2.3. Definition of Power Plant and Modelling of Power Generators
In the study, seven different power plant layouts were analysed in this study to compare the results obtained. These possible configurations are:
Marine Gas Oil (MGO) diesel generators;
MGO diesel generators and shore connection (SC) (MGO boilers);
MGO diesel generators and shore connection (SC) (electric boilers);
Dual-fuel (MGO and LNG) diesel generators;
Dual-fuel (MGO and LNG) diesel generators and shore connection (SC) (LNG boilers);
Dual-fuel (MGO and LNG) diesel generators and shore connection (SC) (electric boilers);
Dual-fuel (MGO and LNG) diesel generators and SOFC.
A first strong assumption is related to the fact that the electrical and thermal power requirements in all these configurations have been considered to be the same. This basic design study introduces some errors, but it has been considered that the difference between the described scenario would be negligible in the final result.
As pointed out in the introduction, most ships are equipped with a diesel generator-based power plant, in which oil-based fuel with different degrees of refinement are used. In order to comply with IMO regulations on sulphur and nitrogen oxides, ships must use exhaust gas treatments or oil-based low sulphur fuels, such as MGO. In this case, the modelling of the power generators was performed and described in articles already cited in the introduction [
14,
15,
16]. In
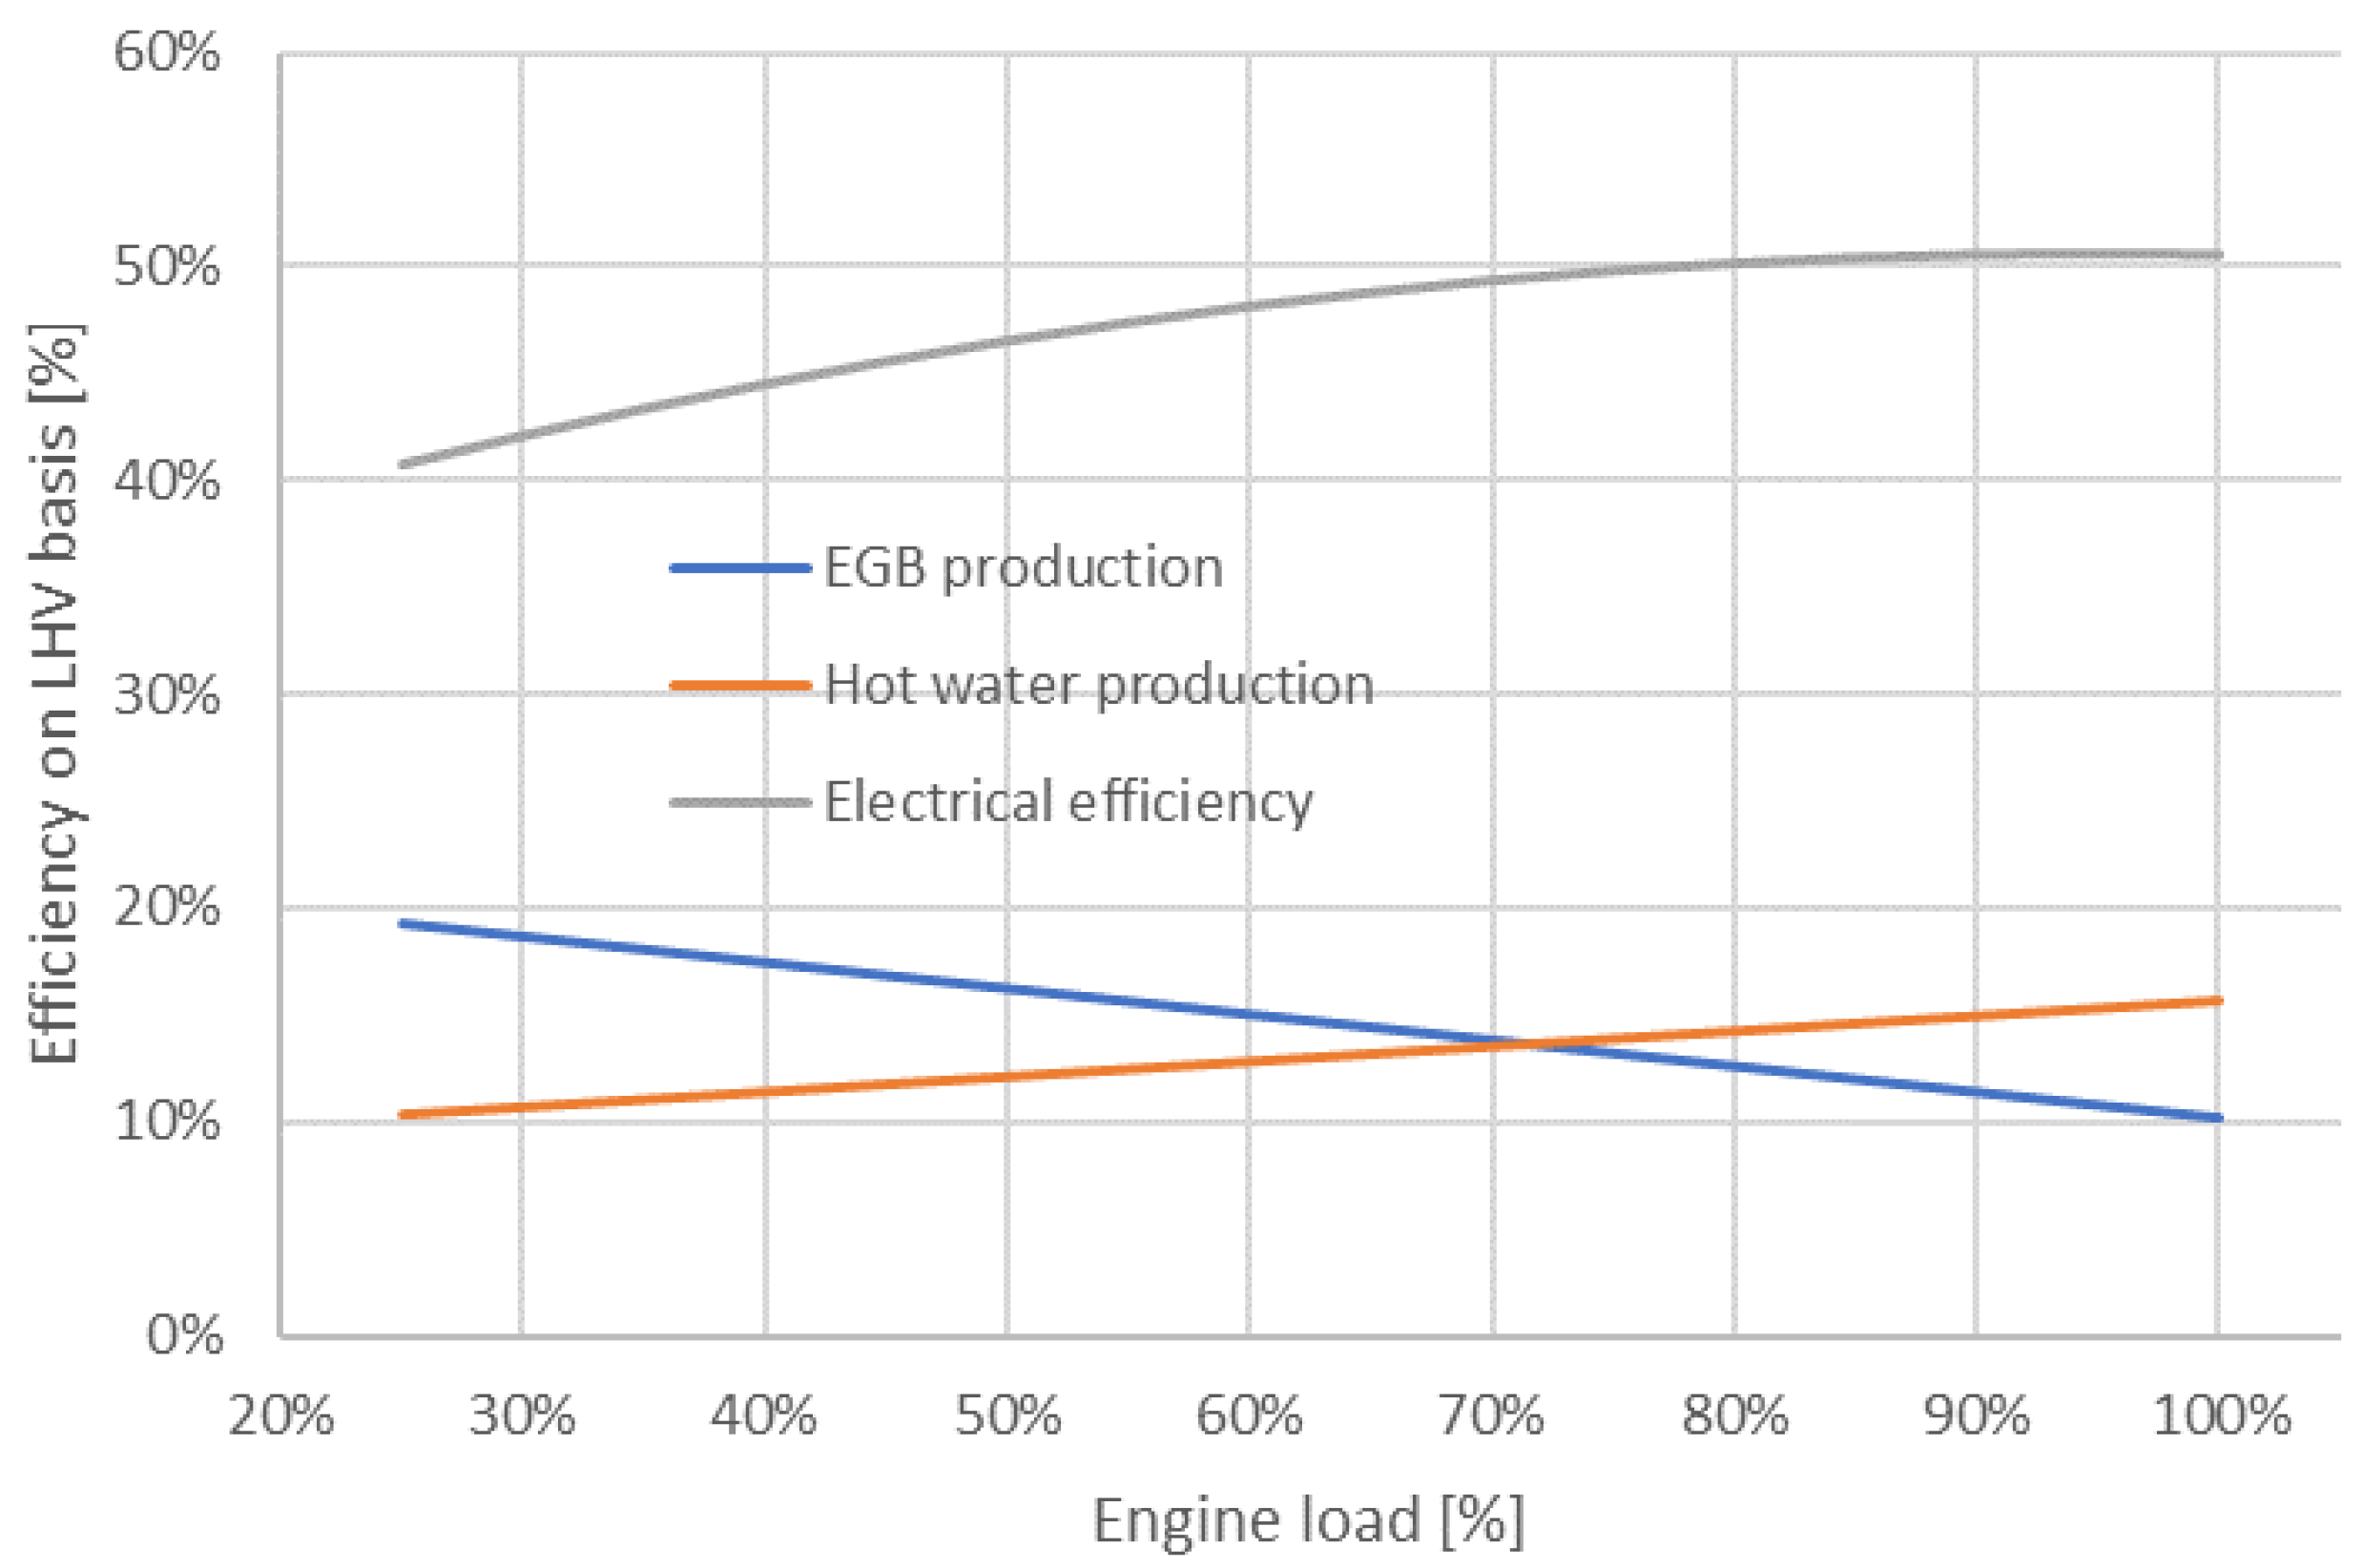
Figure 8 the authors present the relationship between MGO-fuelled engine load, its electrical efficiency, and the efficiency gains through two heat recovery systems: Exhaust Gas Boilers (EGB), used for steam generation, and a high temperature engine cooling circuit. This model was used for configurations 2 and 3, where MGO engines are used for onboard power generation. The same model is also used for LNG-fuelled engines in configurations 3–6.
In configurations number 2 and 3 a shore connection is used for the power supply during stays in port. A ship can use a shore connection when docked in suitable ports, carrying out the so-called “cold ironing”. In this case, the ship’s power generators are switched off, or put in stand-by mode, and all the electric power is drawn from the national grid through dedicated distribution stations installed in some ports. In these two configurations, the authors have performed two strong assumptions: national grid electric power can be considered as “zero-emission” and each port in which the reference cruise ship docks has the possibility to perform cold-ironing. In configuration 1, the required thermal power is generated by MGO-fuelled boilers, while in configuration 2, this is generated by theoretical electric boilers. These boilers are theoretical because, at this time, there are no electric boilers with such thermal power generation capability that could be installed onboard a ship. Additionally, this solution would require volume and weight that would not be used during navigation since “traditional” boilers would still be embarked.
In configurations 4–7, dual fuel diesel engines are supposed to be installed onboard. These engines use natural gas as the primary fuel and MGO only as pilot fuel or backup fuel. The relationship between dual fuel engine load, its electrical efficiency and the efficiency gains via two heat recovery systems: Exhaust Gas Boilers (EGB), used for steam generation, and the high temperature engines cooling circuit; shown in
Figure 8. In configurations 4 and 5, a shore connection is used for electric power generation. In configuration number 4, the required thermal power is generated by LNG-fuelled boilers, while in configuration number 5, this is generated by theoretical electric boilers. The two assumptions previously expressed are considered valid also for these configurations.
In all configurations from 1 to 6, five diesel generators divided into two engine rooms were considered as the reference scenario. Since the total installed power is nearly 70 MW, the authors considered four engines with a Maximum Continuous Rating (MCR) of almost 15 MW, and one with an MCR of almost 10 MW. In configuration 7, the authors have considered replacing the 10 MW diesel engine with an equal power generation capacity of SOFCs. In configuration 7, SOFC are considered to be used at their peak power and, therefore, to operate in parallel with diesel generators in any condition in which more than 10 MW are required by the ship, so almost in every operational scenario except port stays. When the cruise ship is docked, SOFC are used in island-mode and are the only available power source. It is assumed that in both these conditions the electrical efficiency is the same and it is equal to 58%, with slight drops of 1% to 2% for partial loads. Since data on exhaust gas temperatures and flows are not accurate enough to be modelled, the authors assumed that 9% of efficiency can be gained via an EGB similar to the one considered with diesel engines. For this system, no heat recovery via hot water is considered. It is not common to find a water-cooled SOFC and adding another heat recovery system which, for example, could heat up water, can be considered a possible future scenario which needs to be further analysed.
2.4. System Simulation
After modelling the ship’s operational profiles in terms of electrical and thermal energy needs and different generating systems, the ship’s life is modelled during one year of operation. For each condition in each operational scenario, the electrical and thermal energy required by the ship is known. Knowing the composition of the power generation plant in each configuration considered in this study, the authors have hypothesized for each condition which generators are in operation and connected to the grid, establishing the percentage of MCR for each system using Formula (2), where
is the index of the generation systems available onboard.
As already pointed out, in configuration 6, SOFC always operate at 100% of their MCR, except when the ship is moored in ports. The number of diesel generators in operation is optimised in order to let them work as close as possible to their most efficient mode of operation. Knowing the load required by each generating system and its variation in the electrical efficiency variation with the percentage of MCR, it is possible to calculate the fuel consumption. Furthermore, from the load requirement for each generating system, it is possible to evaluate the efficiency gained from the heat recovery systems. The situation for each configuration and each operational scenario is similar to the example shown in
Table 3.
Since the thermal power requirement and all possible heat recovery sources are known, it is possible to calculate the resulting heat balance, which can be positive if the sum of EGB and Hot Water (HW) heat recovered is bigger than the thermal power required. If this figure is negative, the ship needs heat. In order to generate this power, as already pointed out, the ship uses boilers fed with the same main fuel used in the considered configuration, so MGO in configurations 1–3 and LNG in configurations 4–7. The boiler consumption as a function of the required power is known thanks to the manufacturer data available to the authors and therefore, knowing the required heat, the calculation of the fuel consumption becomes straightforward.
2.5. Fuel Consumption and Ship’s Emissions
The fuel consumptions evaluated in the previous paragraphs are instantaneous. In order to assess the total consumption of the ship, the instantaneous fuel consumption must be multiplied by the time spent in each condition of each operative profile. The total fuel consumed for one trip of one operative profile can then be calculated by adding the values resulting from each condition that composes the operational profile in question. Emissions are directly related to fuel consumption through conversion factors related to the carbon content of fuels: by multiplying these two figures, carbon dioxide emissions are obtained. For MGO a factor equal to 3.1 has been considered, while for LNG this value was assumed to be 2.75.
3. Results: CII Calculation and Database Population
The annual emission of carbon dioxide is the key figure for CII calculation in all of its proposed forms. In this article, the authors have used the formula proposed in the CII guidelines following IMO’s MPEC 76, as already reported in the introduction [
8]. First, for each type of ship, the reference value for the CII has to be calculated using Formula (3).
The values for
and
and the measure of capacity are given in
Table 4, where DWT stands for deadweight, which is the weight that a ship can carry as cargo, fuel, crew, passengers, food, and water. This deadweight is referred to as the maximum summer load draft.
The attained value of CII for cruise passenger ships, ro-ro passenger ships, and ro-ro cargo ships is given in Formula (4), while the formula to be used for all other ship types is Formula (5).
The attained value for each ship must be compared with the required value, which can be calculated with Formula (6). The reduction factor
changes from year to year as shown in
Table 5.
As explained in the introduction, the CII measurement is linked to a rating system for ships, from A to E, where A is best. If a ship obtains a rating of a D or E for three consecutive years, it should outline a strategy for achieving a C or higher rating the following year. The rating is assigned based on the ratio between the attained CII and the required CII: the higher this ratio is, the worse the rating. The threshold values for ratings from B to E are shown in
Table 6. If the ratio is lower than the value in column B, the rating is equal to A.
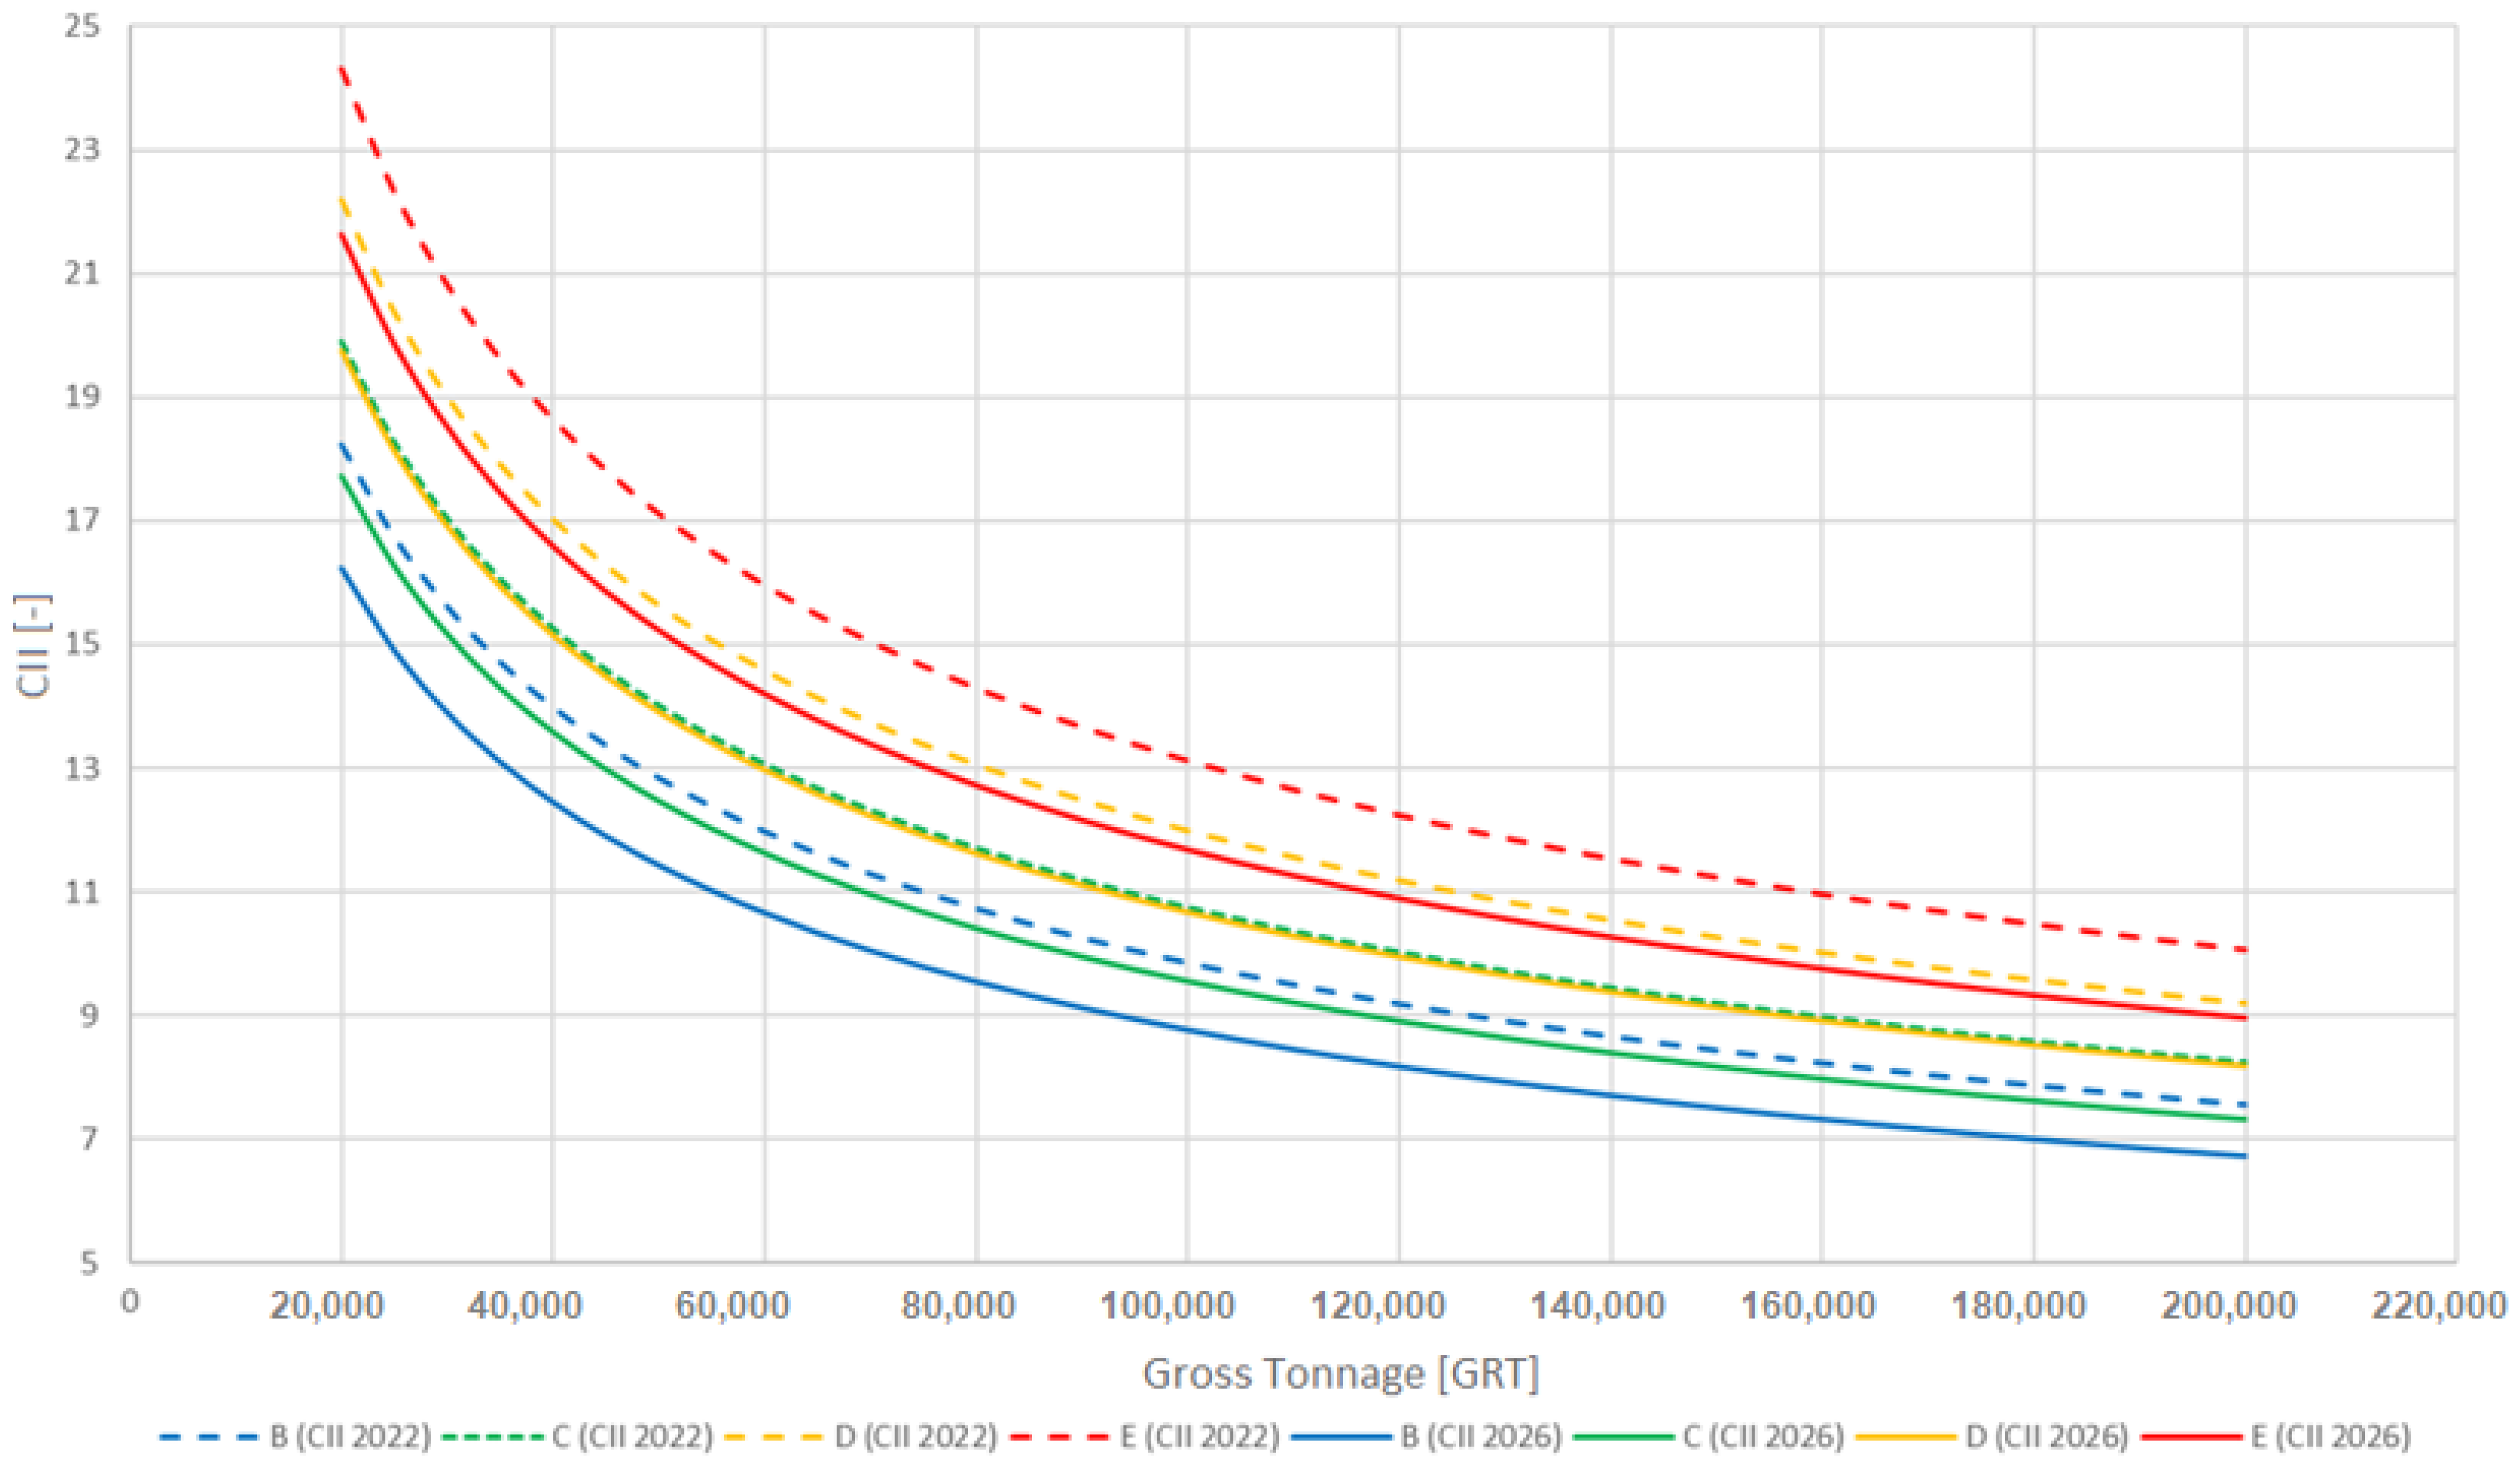
Figure 9 shows the variation of threshold values between different ratings for two different reference years (2022 and 2026). As already shown in
Table 5. Reduction factors Z variation for required CII calculation [
8], each year, the requirements would be more demanding for ships with this proposed regulation, and therefore a cruise ship that has a
C in 2022 would reach a
D rating in 2026, or possibly even earlier. For this reason, it is important to address this problem now, especially for newbuilding cruise ships. These vessels must be ready to obtain a good rating and should be able to maintain or even improve it over time.
The calculations described were performed in order to evaluate the CII of the reference vessel in all seven configurations detailed in paragraph 2.3. The overall results are shown in
Table 7.
If the reference vessel is powered by MGO-fuelled internal combustion engines for its entire operating time, the proposed CII requirements will not be met from 2024, and therefore, operational actions should be taken to comply with this regulation. The results highlight the great potential of LNG in reducing carbon dioxide emissions: even the relatively simple transition from MGO to a vessel powered mainly by LNG can guarantee an A rating at least until 2026. According to these calculations, the configuration with the lowest emissions of carbon dioxide is the one in which the vessel is powered by LNG internal combustion engines during navigation and by a shore connection during port stays. This configuration is also able to generate all the thermal power required by the ship via electric boilers. When SOFC replace a diesel generator, there is a tangible benefit when comparing carbon dioxide emissions of these configurations with those in which the ship is powered by MGO, or those in which LNG is used for both navigation and port stays. The carbon dioxide emissions, and thus the CII, of the SOFC configuration and of the configuration with LNG and shore connection, in which LNG-fuelled boilers are used, are similar. Furthermore, as pointed out in the introduction, all these fuels are already compliant with sulphur oxides emissions regulations, and the alternatives using LNG as primary fuel are also compliant with nitrogen oxides emissions regulations without the need of exhaust gas cleaning systems.
5. Conclusions
In recent years, climate change and sustainability have become the two main topics of discussion in the majority of institutions operating in the industrial and transport sectors. In this scenario, ships are one of the means of transport on which studies have focused the most. In 2018 alone, the naval sector was responsible for almost 2.9% of global emissions of carbon dioxide equivalent, and the projections on the future total emissions of ships indicate a progressive increase from year to year. In order to counter this trend, the International Maritime Organization and other national and international institutions regularly update and tighten the laws in force on ship emissions and periodically issue new regulations. In June 2021, IMO proposed a new ship classification scheme based on the Carbon Intensity Indicator (CII) as an index of their operational efficiency. This factor is a measure of the total carbon dioxide emissions divided by the amount of cargo carried and by the distance travelled on an annual basis. At the moment, different options to calculate CII are proposed, but none have yet been taken as the final formula. In order to reduce GHG emissions, shipowners and ship designers can adopt various solutions. In the last decade, ship designers have mostly focused on implementing exhaust gas cleaning technologies, like scrubbers and Selective Catalytic Reduction (SCR). Only in recent years the transition from traditional residual oil-based fuels to alternative ones, such as low sulphur fuel oils or gaseous fuels (particularly natural gas), has been considered as a possible solution to effectively reduce the CO2 emissions without the need to install exhaust gas treatment systems. Among the gaseous fuels, thanks to its consolidated and well-known technology, natural gas has become most widespread in the naval sector, especially in the liquefied state, or LNG. The possibility of having gaseous fuels onboard a ship and the need to further reduce GHG emissions have also led ship designers to consider innovative power generators, like Solid Oxide Fuel Cells (SOFCs).
In this study, the authors illustrated in detail the method of calculating the CII considering a cruise ship of 180,000 GRT as a case study. After defining the main characteristics and the operational profile of the ship and having estimated its power requirements, the authors calculated the CII with reference to seven different possible layouts of its power plant. In the first three, the reference ship is equipped with MGO-fuelled internal combustion engines; in the remaining layouts, the plant is based on dual fuel internal combustion engines (MGO and LNG) coupled, in one case, to a 10 MW SOFC power plant.
The results of the calculation show that, in the absence of corrective actions, the reference ship equipped with engines powered exclusively by MGO will not be able from 2024 to comply with the limits set on the CII, while the adoption of LNG as main fuel allows the ship to maintain an CII A rating at least until 2026. The study also highlights that the mere adoption of LNG as the main fuel cannot be considered as the definitive solution to the problem of greenhouse gas emissions by ships. This is due to the fact that combustion engines suffer from the methane slip problem, i.e., the release of unreacted methane into the atmosphere.
Although current IMO regulations do not address the methane slip issue, it is internationally recognized that methane is potentially more dangerous than carbon dioxide in terms of its effects on global warming. From this point of view, the study showed that adopting innovative technologies such as SOFCs that do not suffer from the methane slip problem could represent a valid technical solution for future ships.


