Article

Mitigation of Hub Vortex Cavitation with Application of Roughness

1
Department of Naval Architecture, Ocean & Marine Engineering, University of Strathclyde, Glasgow G1 1XQ, UK
2
Lloyd’s Register EMEA, Technical Investigation Department (TID), Southampton SO16 7QF, UK
*
Author to whom correspondence should be addressed.
J. Mar. Sci. Eng. 2022, 10(10), 1426; https://doi.org/10.3390/jmse10101426
Submission received: 4 August 2022 / Revised: 16 September 2022 / Accepted: 22 September 2022 / Published: 4 October 2022
(This article belongs to the Special Issue Ship Dynamics and Hydrodynamics)

Abstract

:
This study investigates the influence of roughness on hydrodynamic performance, especially for the hub vortex—and, hence, hub vortex cavitation—of a benchmark propeller operating under uniform flow conditions using the RANS method. The Schnerr–Sauer cavitation model is also used for modelling the cavitation on and off the propeller blades. In order to include the effects of roughness in the numerical calculations, the experimentally obtained roughness functions were incorporated with the wall function of the CFD solver. The applicability and effectiveness of the roughness application applied on the propeller hub as a novel concept were explored to mitigate hub vortex cavitation. The results are first validated with experimental data on smooth conditions through the propeller hydrodynamic performance characteristics and cavitation extension. Then, the propeller hub is covered with four different sizes of roughness. The results show that the degradation effects of roughness applied to the hub on propeller performance are negligible, and the maximum efficiency loss is around 0.25% with respect to the smooth condition when the propeller hub was roughened. Favourable impacts of roughness are found for the hub vortex, and hence, hub vortex mitigation. Applying the roughness on the propeller changed the flow properties (e.g., pressure, velocity and turbulent kinetic energy) inside the vortex, enabling the early breakdown of the extension of hub vortices. These flow changes in the presence of roughness result in a mitigation of hub vortex cavitation up to 50% depending on the roughness size with respect to the smooth condition. Thus, this proposed novel concept, application of roughness to the propeller hub, can be used to mitigate hub vortex cavitation, rudder erosion and propeller URN for both newly designed and retrofitted projects by keeping the efficiency loss as minimum as possible.

1. Introduction

Shipping is a significant contributor to the underwater radiated noise levels (URN) in the world’s oceans, particularly in the low-frequency range of the noise spectrum. These escalated URN levels have caused several detrimental impacts on marine fauna. This is because marine animals use a certain frequency range for various fundamental living activities such as communication, interaction and feeding. For this reason, the sudden increase in URN levels may disorient them, destroy their ability to communicate with each other and even cause their local extinction. Thus, the mitigation of URN levels caused by the shipping industry is of great importance, although this subject is currently of a low priority compared to other sustainability concerns within the shipping industry (e.g., Greenhouse Gas Emissions (GHG)). In addition, the lack of mandatory international regulations and noise limits makes progress slow for URN mitigation investigations. Nevertheless, the effort in this field is getting more attention to highlight the possible short- and long-term detrimental impacts of ship URN on marine mammals. Recently, the Marine Environment Protection Committee of the IMO has accepted the proposal from Australia, Canada and the United States to review the existing 2014 Guidelines [1] for URN mitigation radiated by commercial vessels [2,3,4]
The main source of ship URN is propeller cavitation, which dominates the other noise sources such as machinery, flow noise, etc. Despite the many side effects of cavitation (e.g., performance degradation, noise, vibration and material damage), inevitably, commercial ship propellers will always operate under cavitating conditions above a certain speed limit. Depending on the operating conditions and propeller action, several cavitation formations (e.g., sheet, vortex, bubble and cloud cavitation) can be present on and off the propeller blades. Amongst those, propellers generally operate in a condition where sheet and vortex cavitation are present. Vortex cavitation, which appears at the blade tips, leading edge and propeller hub, is not erosive unless it is present excessively, but it is a source of noise. Vortex cavitation is formed by the low-pressure core of the shed vortices. Tip vortex cavitation (TVC), created by the vortex at the blade tips and observed as the first type of cavitation on well-designed propellers, is an important noise source and leads to a substantial increase in noise levels when bursting or collapsing phenomena occurs [5,6]. Another type of vortex cavitation is hub vortex cavitation, which appears around the propeller hub; it is formed through the contribution of different vortices, which are unlikely to cavitate individually, shed from the blade root. Under the impact of the propeller’s converging cone, the combination of blade-root vortices tends to cavitate. When the vortices start to cavitate, the resulting cavitation (i.e., hub vortex cavitation) becomes very stable and appears like a rope with strands corresponding to the number of propeller blades [7].
Similar to TVC, hub vortex cavitation, which is the main interest of this study, is also of practical importance. First of all, the waste energy is spent by the excessive swirl of the flow in the propeller slipstream near the propeller’s rotational axis. This swirl will result in a pressure reduction with respect to ambient pressure, and hence, it will generate an undesirable drag force on the propeller. In addition, when the swirl is large, the delivery of energy to the fluid near the hub will not produce axial thrust, and the mixing of turbulence will dissipate it. Secondly, hub vortex cavitation is a large cavity. Thus, if the rudder or any control surfaces are positioned in line with the propeller-shaft-system axis, they can lose the lift force which is aimed to be produced. Eventually, the vortices around the hub reduce the propeller’s efficiency by increasing energy loss depending on the axial load distribution on the propeller and hub geometry. Lastly, hub vortex cavitation can also be associated with undesirable vibration, noise and, in some cases, erosion on the rudder [7,8,9].
In order to mitigate the cavitation and associated URN, several active and passive noise-control methods can be applied for marine propellers, especially for retrofit projects [10] The most common passive noise-control methods, mainly implemented for TVC mitigation, are blade-geometry modification, reduction of the propeller tip’s circulation, the inclusion of additional geometry at the tip, drilling holes, leading-edge tubercle modifications and application of roughness to propeller blades (e.g., [11,12,13,14,15,16]) In addition to these methods, propeller boss cap fins (PBCF), primarily designed to improve a propeller’s performance characteristics, have also been utilised as an Energy Saving Device (ESD). Moreover, with this concept, the strength of the hub vortex is weakened, and the kinetic energy of the flow around the boss can be recovered by applying a number of fins corresponding to the propeller-blade number. Thus, it can also be used as a passive noise-control concept to mitigate hub vortex cavitation, associated URN and rudder erosion. The PBCF investigations were carried out by [17,18,19]; the authors found out that with the application of PBCF, thrust increases while the torque reduces, resulting in an efficiency increase. Since then, there have been several experimental and numerical investigations conducted using different PBCF concepts to investigate its effects on propeller hydrodynamic performance, including cavitation and URN (e.g., [20,21,22,23,24]).
Another new passive noise-control concept, namely, roughness application on the propeller’s hub—which is the main interest of this study—can also be used as an alternative to PBCF to mitigate hub vortex cavitation, associated URN and rudder erosion. With roughness, near-wall flow structures can change significantly, and turbulence transition can be stimulated in the laminar boundary layer. The roughness elements interact with the vortices around the hub, and it enables early breakdown; hence, hub vortex cavitation mitigation can be achieved. However, unlike the PBCF, the roughness application on the propeller’s hub may cause performance degradation, resulting in efficiency loss. Nevertheless, this less efficiency loss can be further minimised by applying the roughness on a strategical section of the hub, similar to the strategic application of roughness on propeller blades to keep the efficiency loss as minimal as possible [15] In this regard, the authors recently explored the influence of roughness on the hydrodynamic performance of a model-scale INSEAN E779A propeller under non-cavitating and cavitating conditions. With the application of roughness to the propeller blades, the cavitation volume decreased, which is mainly due to the TVC; this resulted in URN mitigation up to 10dB at a certain frequency range, whereas the propeller efficiency loss was found to be 25% [16]. Later on, the authors extended their research to find a compromise between cavitation-volume reduction and efficiency loss by applying the roughness heterogeneously on strategic areas on the blades for model- and full-scale benchmark propellers in a wide range of operating conditions (i.e., uniform, inclined and non-uniform flow conditions). The results showed that the detrimental effects of roughness on propeller hydrodynamic performance could be significantly reduced by applying the roughness on the back side (or suction side) of the propeller blades between the radius of 0.9 and 1 [15].
In light of previous findings regarding propeller hydrodynamic performance—including cavitation volume reduction and URN—with a roughness application on propeller blades, the authors have further extended their research with this study by applying a similar type of roughness on the propeller’s hub. This study aims to explore hub vortex cavitation mitigation with this alternative new concept, roughness application on a propeller’s hub for a model-scale propeller under uniform flow conditions, for the first time in the literature. This study is a pioneer in investigating propeller URN, propeller–hull–rudder interaction and rudder erosion by mitigating hub vortex cavitation using a roughness application both in model- and full-scale propellers under non-uniform flow conditions.
In this study, the standard RANS method with the k-ω SST turbulence model was used to solve the cavitating flow around the propeller. Sheet and hub vortex cavitation were modelled using the mass transfer cavitation model, Schnerr–Sauer, within the commercial CFD solver, Star CCM. The propeller’s open-water characteristics (i.e., thrust and torque coefficients) were validated with the available experimental data when the propeller blades and hub were clean (i.e., in smooth condition). In addition, the cavitation extensions were compared between numerical calculations and experimental observation. Then, the propeller hub was covered with a particular type of biofouling roughness. The four different roughness heights were used in the calculations to investigate the effects of roughness on propeller hydrodynamic performance, including cavitation. The results obtained in the presence of roughness were compared with respect to the smooth condition to explore the impact of roughness on propeller hydrodynamic performance, particularly for hub vortex and hub vortex cavitation mitigation.
The structure of the paper is as follows. The hydrodynamic model and details of the roughness are given in Section 2. The test case and numerical modelling details are given in Section 3. The numerical results are given in Section 4, and the results are consequently presented in Section 5.

2. Theoretical Background

2.1. Hydrodynamic Model

The governing flow equations are solved using the computational fluid dynamics (CFD) solver [25]. The CFD solver uses a finite volume method to discretise the Navier–Stokes equations. The unsteady RANS method with k-ω SST turbulence model was used to solve cavitating flow around the propeller.
Cavitation is modelled using a homogenous seed-based approach. The Schnerr–Sauer cavitation model based on the reduced Rayleigh–Plesset equation was used with the VOF (Volume of Fluid) approach to model the liquid and vapor phases. The adapted cavitation model neglects the influence of the bubble growth and collapse rates, viscous and surface-tension effects, and is the simplified version of the full Rayleigh–Plesset equation. The detailed information about the governing equations and cavitation model can be found in the user guide of CFD solver [25], and as such is not repeated here.
Cavitation and roughness models were incorporated to account for effects of roughness on propeller hub vortex cavitation. The wall function of CFD solver was utilised for the roughness modelling, whereas a mass transfer model, the Schnerr–Sauer cavitation model, was used for the cavitation modelling at the same time.

2.2. Roughness Model

Biofouling accumulation increases surface roughness, affecting the flow around the ship and propeller. This effect can be described as a downward shift in the log-law region of the turbulent boundary layer. Therefore, the non-dimensional velocity profile for a rough surface can be defined as follows.
U + = 1 κ ln ( y + ) + B Δ U +
where U + = U U τ is the non-dimensional velocity, κ is the von Karman constant equal to 0.42, y + = y U τ v is the non-dimensional normal distance from the boundary, B is the constant for smooth-wall log-law intercept, v is the kinematic viscosity of the fluid and U τ = τ w / ρ is the friction velocity where τ w represents the shear stress at the wall and ρ represents the density. Δ U + represents the roughness functions depending on the roughness Reynolds number k + , which is defined as follows:
k + = k U τ ν
where k is the roughness length scale. It is important to note that there is no universal roughness function. Therefore, Δ U + needs to be obtained experimentally for the rough condition in question. For the smooth condition, Δ U + is taken as zero.
In this study, barnacle-type roughness was used to represent the surface roughness around the propeller hub. Roughness functions provided in [26] were implemented in the wall function of the CFD software, Star CCM+ 14.06, 2019, to mitigate the hub vortex cavitation of a propeller. It is important to note that Δ U + and corresponding k values show excellent agreement with the roughness-function model of Grigson, 1992 [27], as described in Equation (3).
Δ U + = 1 κ ln ( 1 + k + )
Table 1 provides the roughness length scales and equivalent sand roughness heights of the surfaces used in this study. In Table 1, Mix and NS Mix are surface names obtained from the study of Uzun et al., 2020 [26]; h is barnacle height (mm) and k G is the representative hydrodynamic roughness length scale (μm) that give the same roughness Reynolds numbers with corresponding roughness-function values of Grigson, 1992 [27]. It should be noted that these representative hydrodynamic roughness length scales, k G , are not a function of measurable surface properties and may be termed as experimentally obtained equivalent roughness height. The details of the surfaces can be found in [26].

3. Test Case Set-Up and Numerical Modelling

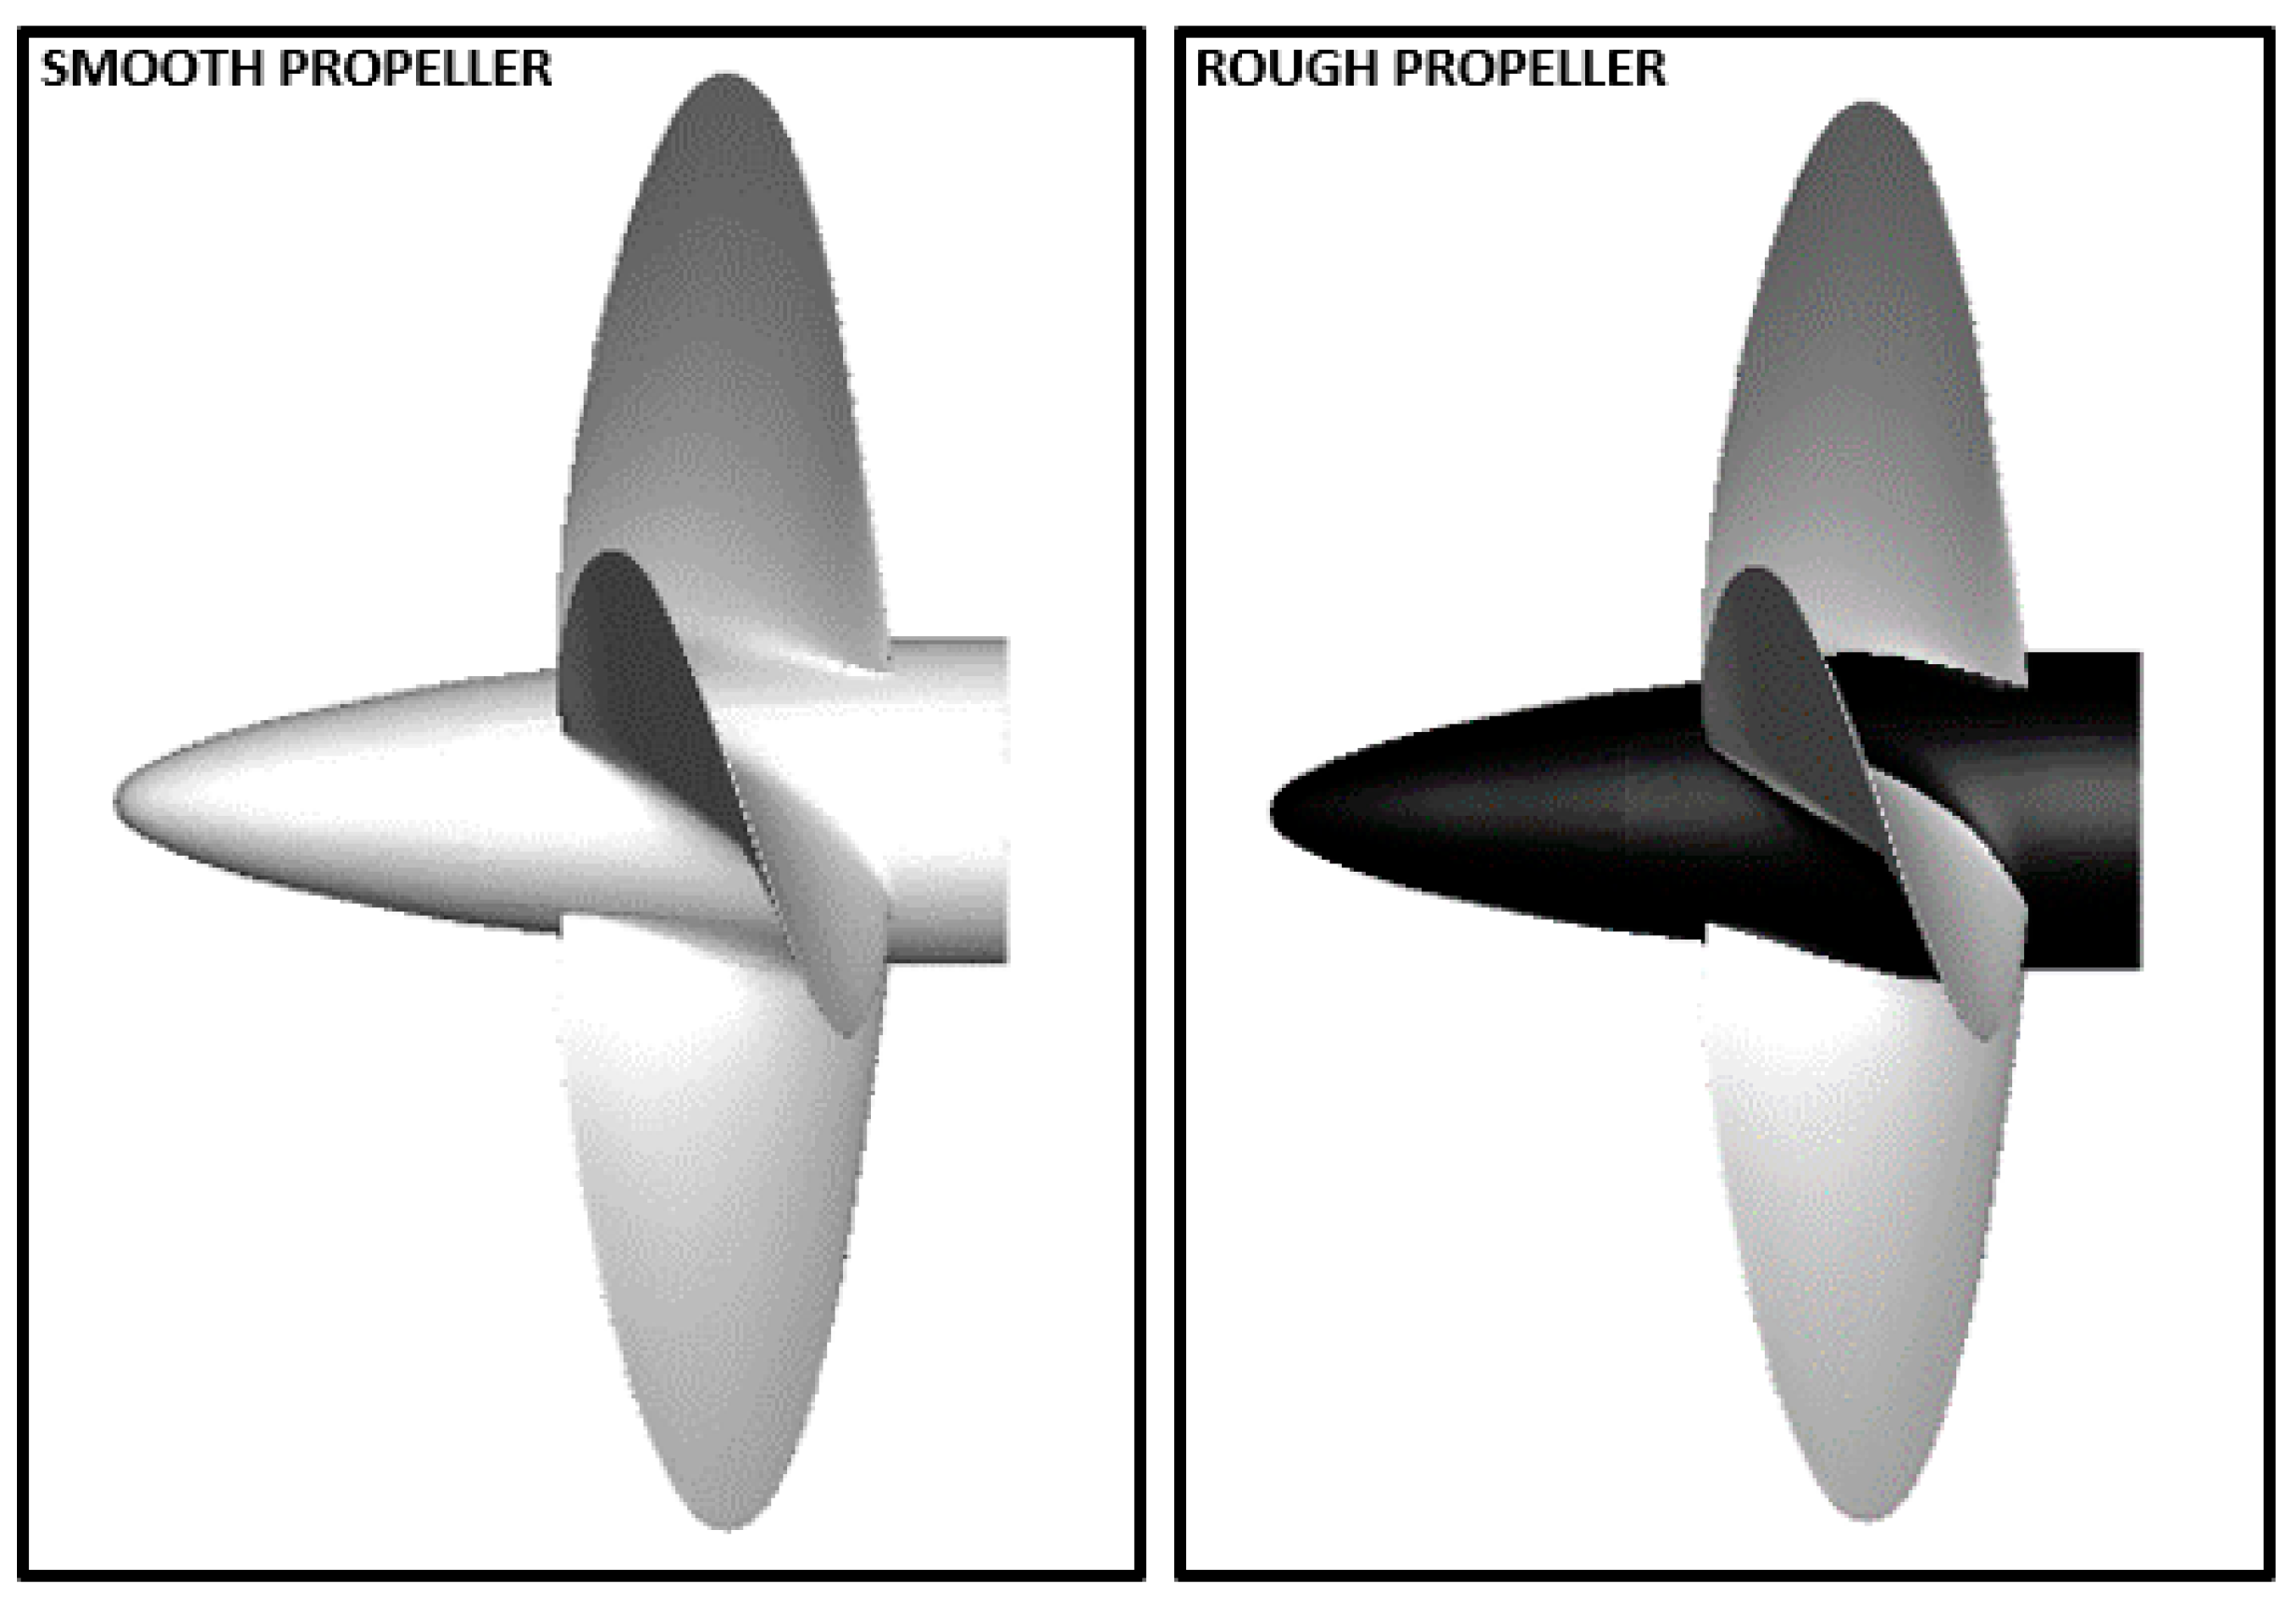
3.1. Geometry and Test Matrix

In the numerical calculations, the benchmark INSEAN E779A model propeller, four-bladed with a diameter of 0.227 m—widely used in the literature for validation purposes because of the available experimental data—was used for the investigation of hub vortex cavitation mitigation with roughness application. Table 2 summarises the test conditions explored in this study.
Here, J is the advance ratio, V A is the averaged velocity at the propeller plane, n is the propeller rotational rate and σ n is the cavitation number based on the propeller rotational rate. The advance ratio and cavitation number are defined as follows, respectively.
J = V A n D
σ N = P 0 P V 1 2 ρ ( n D ) 2
where P 0 is the static pressure, P V is the vapour pressure, ρ is the density of the fluid, n is the propeller rotational rate and D is the propeller diameter.
The global performance characteristics (i.e., thrust ( K T ) , torque ( K Q ) coefficients and efficiency ( η 0 ) ) of the propeller can also be calculated using the following equations.
K T = T ρ n 2 D 4
K Q = Q ρ n 2 D 5
η 0 = J 2 π K T K Q
Here, T is thrust (N) and Q is the torque of the propeller (N.m).
Figure 1 shows the roughness-application area on the hub together with the smooth propeller. Here, the black colour shows the area where the roughness is applied in this study. The four different roughness configurations given in Table 1 were applied to the black area to investigate the mitigation of hub vortex cavitation with an increase in roughness length scale.

3.2. Numerical Modelling

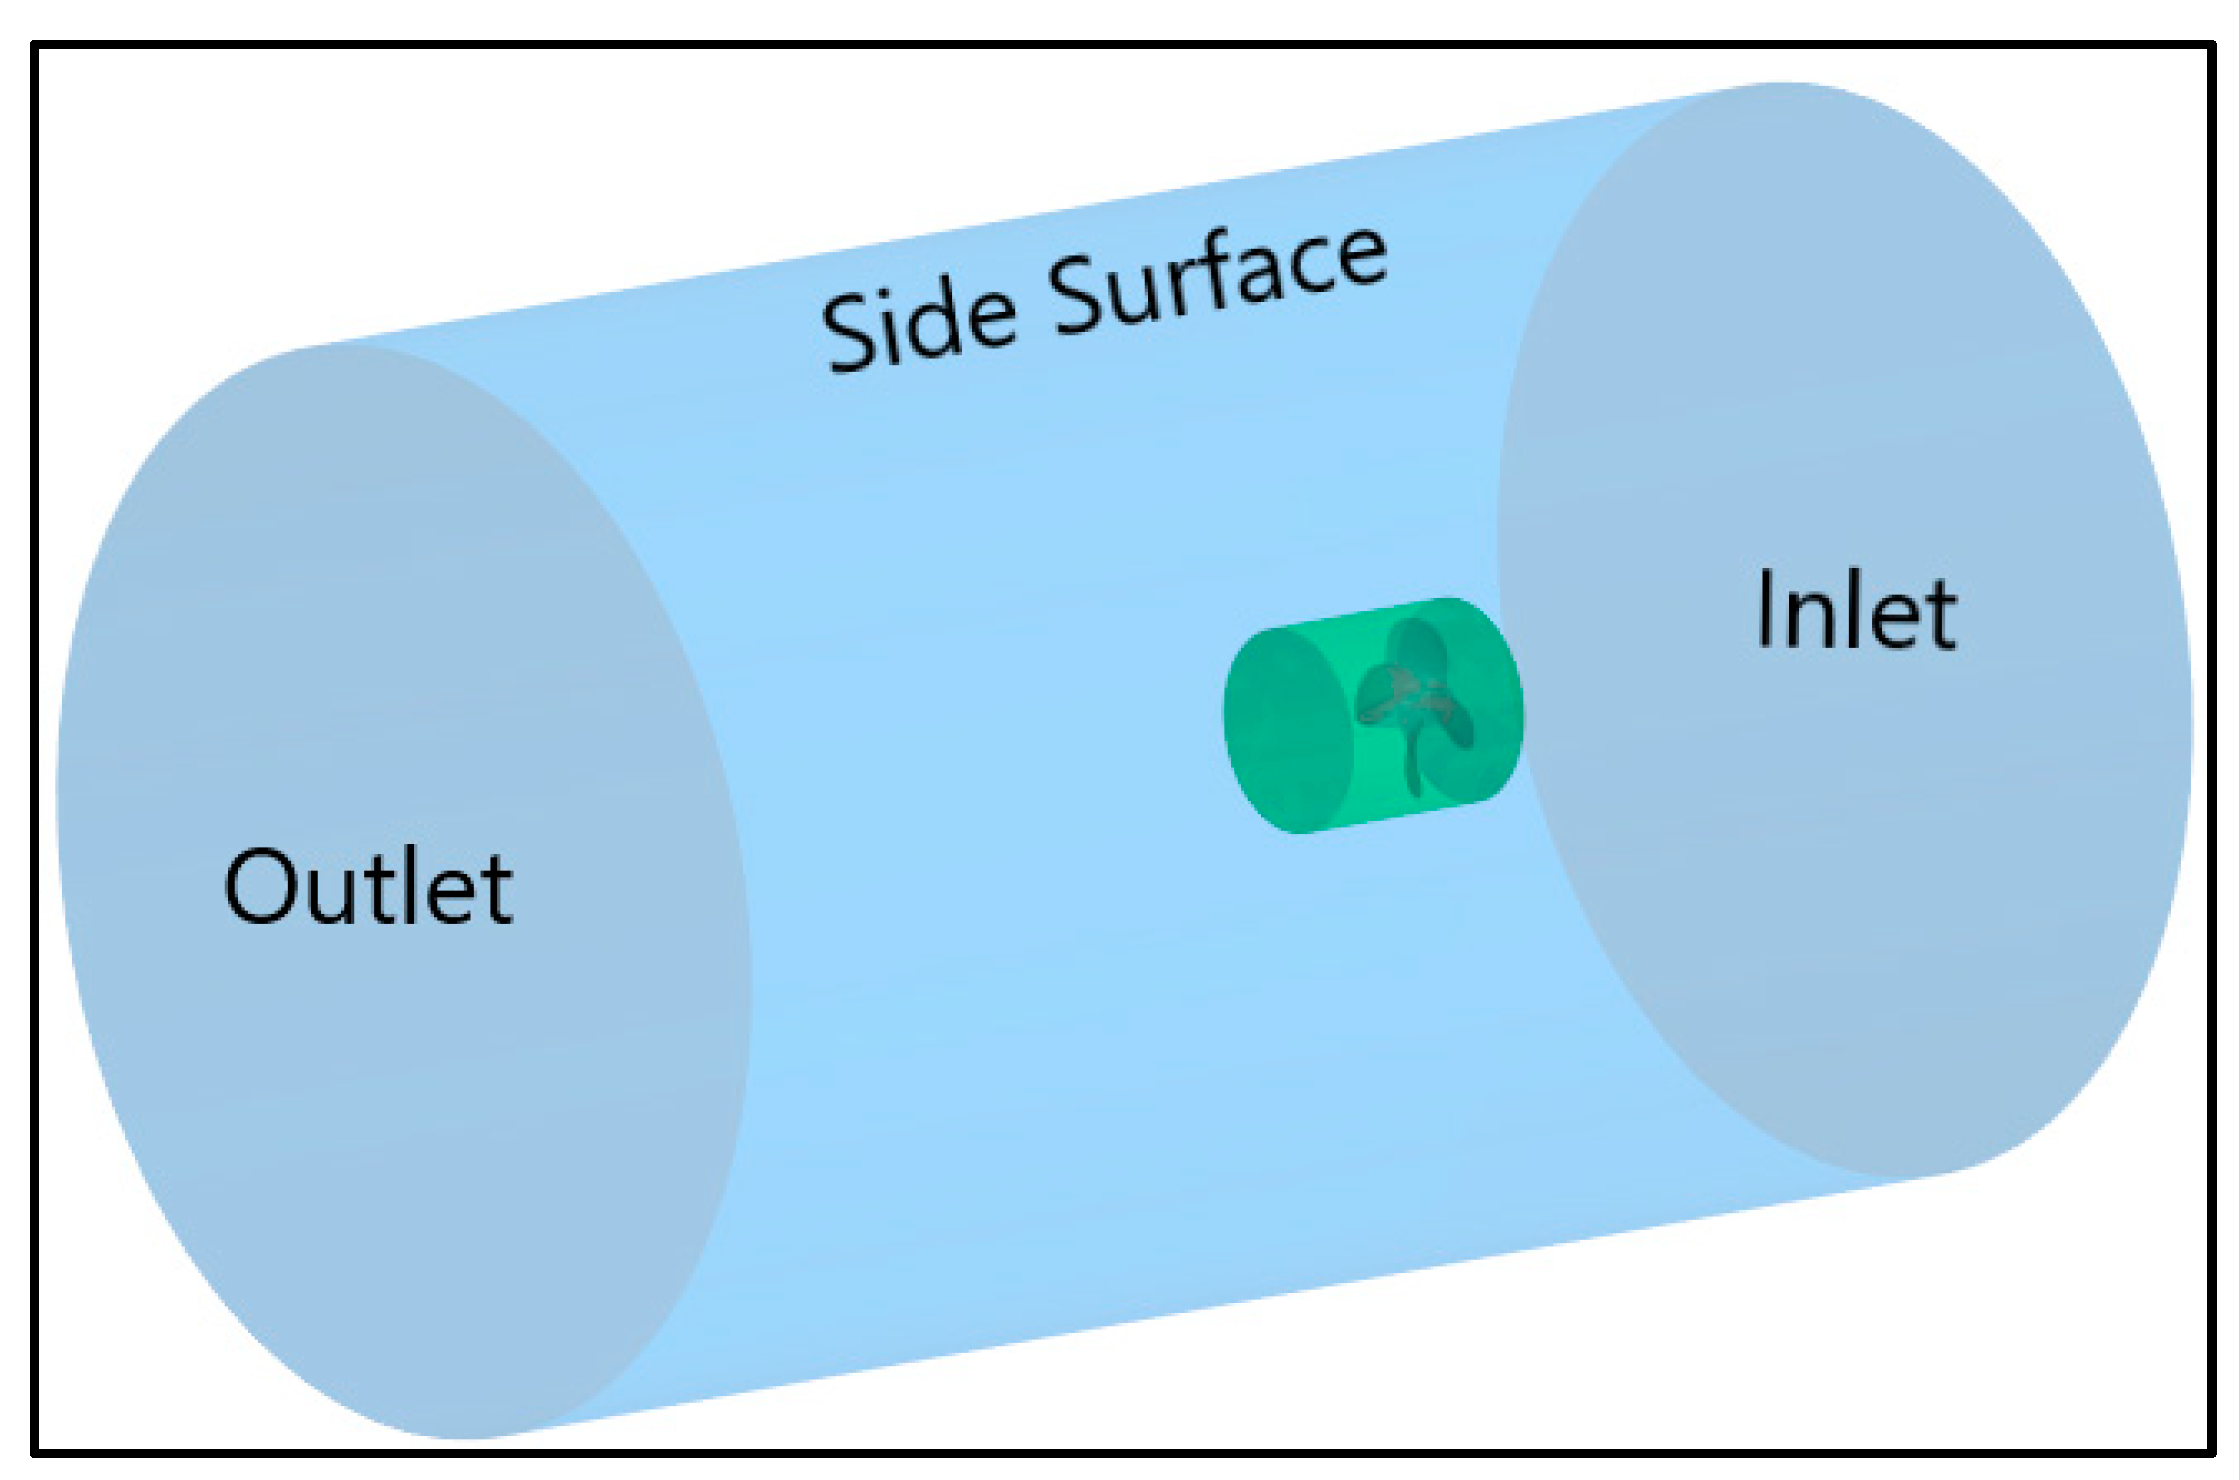
3.2.1. Computational Domain and Boundary Conditions

The computational domain utilised in the numerical calculations is given in Figure 2. The total length of the domain was set to 10D. The upstream and downstream of the domain were extended to 3D and 7D, respectively, whereas the radius of the domain was set to 4D from the propeller centre. The computational domain constitutes static (blue) and rotating (green) regions, as shown in Figure 2. The rotating region was created around the propeller blades, which have a 1.1D diameter and 1.2D total length. The propeller rotational motion was specified into the rotating region, encapsulating the blades and hub. The internal interfaces enabled the transition between the rotating and static regions.
The inlet was defined as a velocity inlet with constant velocity given in Table 2, whereas the outlet was defined as a pressure outlet. The side surface of the cylindrical computational domain was identified as a symmetry boundary condition. The no-slip boundary condition was applied on the propeller blades, including the hub and boss cap, to satisfy the kinematic boundary condition.

3.2.2. Grid Generation

The discretisation of the computational domain is provided with the finite volume method within the facilities of the CFD solver, Star CCM+ 14.06, 2019. The trimmer mesh algorithm with hexahedral elements was used for the mesh adaptation. In this algorithm, the mesh transitions were set to 1:2 between the rotating region and further downstream. Moreover, the automated mesh tool was implemented to make the meshing process fast. The uniform grid resolution was adopted, and additional mesh refinement was applied to the blades. As the main interest of this study is hub vortex cavitation and its mitigation with roughness application, the recently introduced V-AMR (Vorticity-based Adaptive Mesh Refinement) technique by the authors [28] was not implemented in this study for the observation of tip vortex cavitation (TVC) in the propeller slipstream. This also enabled a reduction of the computational cost of the solution. As the uncertainty study was conducted with the selected propeller at the same operating condition as in our recent studies (e.g., [15,16]), the uncertainty study was not repeated. The total element count was calculated at around 10M. The grid resolution inside the computational domain is given in Figure 3.

3.2.3. Analysis Properties

The cavitating flow around the propeller was solved using the RANS method together with the k-ω SST turbulence model. The all y + wall treatment was used, which is a hybrid treatment combination of low y + for the regions where the fine mesh is present and high y + treatment for the coarse grids. The artificial biofouling-type roughness was imposed using the wall function of the CFD solver. In this approach, the selected y + needs to be higher than 30 and higher than the k + values to be able to reflect the roughness effects into the calculations as stated in the CFD solver. Thus, y + was set according to the highest roughness length scale (i.e., NSM20).
The segregated flow solver was used together with the SIMPLE algorithm to solve the continuity and momentum equations. The convection terms of the momentum equations and turbulence were discretised with the second-order scheme. Additionally, the second-order scheme was used for temporal discretisation and the time step was set to 0.5° of propeller rotational rate.
The multiphase VOF (Volume of Fraction) approach was coupled with the mass transfer cavitation model, which is Scherr–Sauer based on the reduced Rayleigh–Plesset equation, for modelling the cavitation phenomena. For the convection term of the VOF approach, High-Resolution Interface Capturing (HRIC) was used to maintain sharp interfaces between the fluid phases. The customisable cavitation parameters (i.e., nuclei density and diameter) were taken as default values in this model based on our recent investigation of its effects on the sheet, TVC and hub vortex cavitation formation [28]. Thus, the nuclei density and diameter were set to 1012 (1/m3) and 10−6 (m), respectively.
The simulations were initialised in a steady manner to speed up the convergence of the numerical solution using one of the propeller rotational motion techniques, Moving Reference Frame (MRF). Following this, the simulations and propeller rotational motion technique were switched to unsteady RANS and Rigid Body Motion (RBM), respectively, and cavitation was activated. In this way, any possible stability issues were removed. In addition, when the flow field was converged, the hydrodynamic performance coefficients (i.e., thrust and torque), including total cavitation volume and velocity field, were computed using the time-averaged data corresponding to 12 propeller rotations.

4. Results

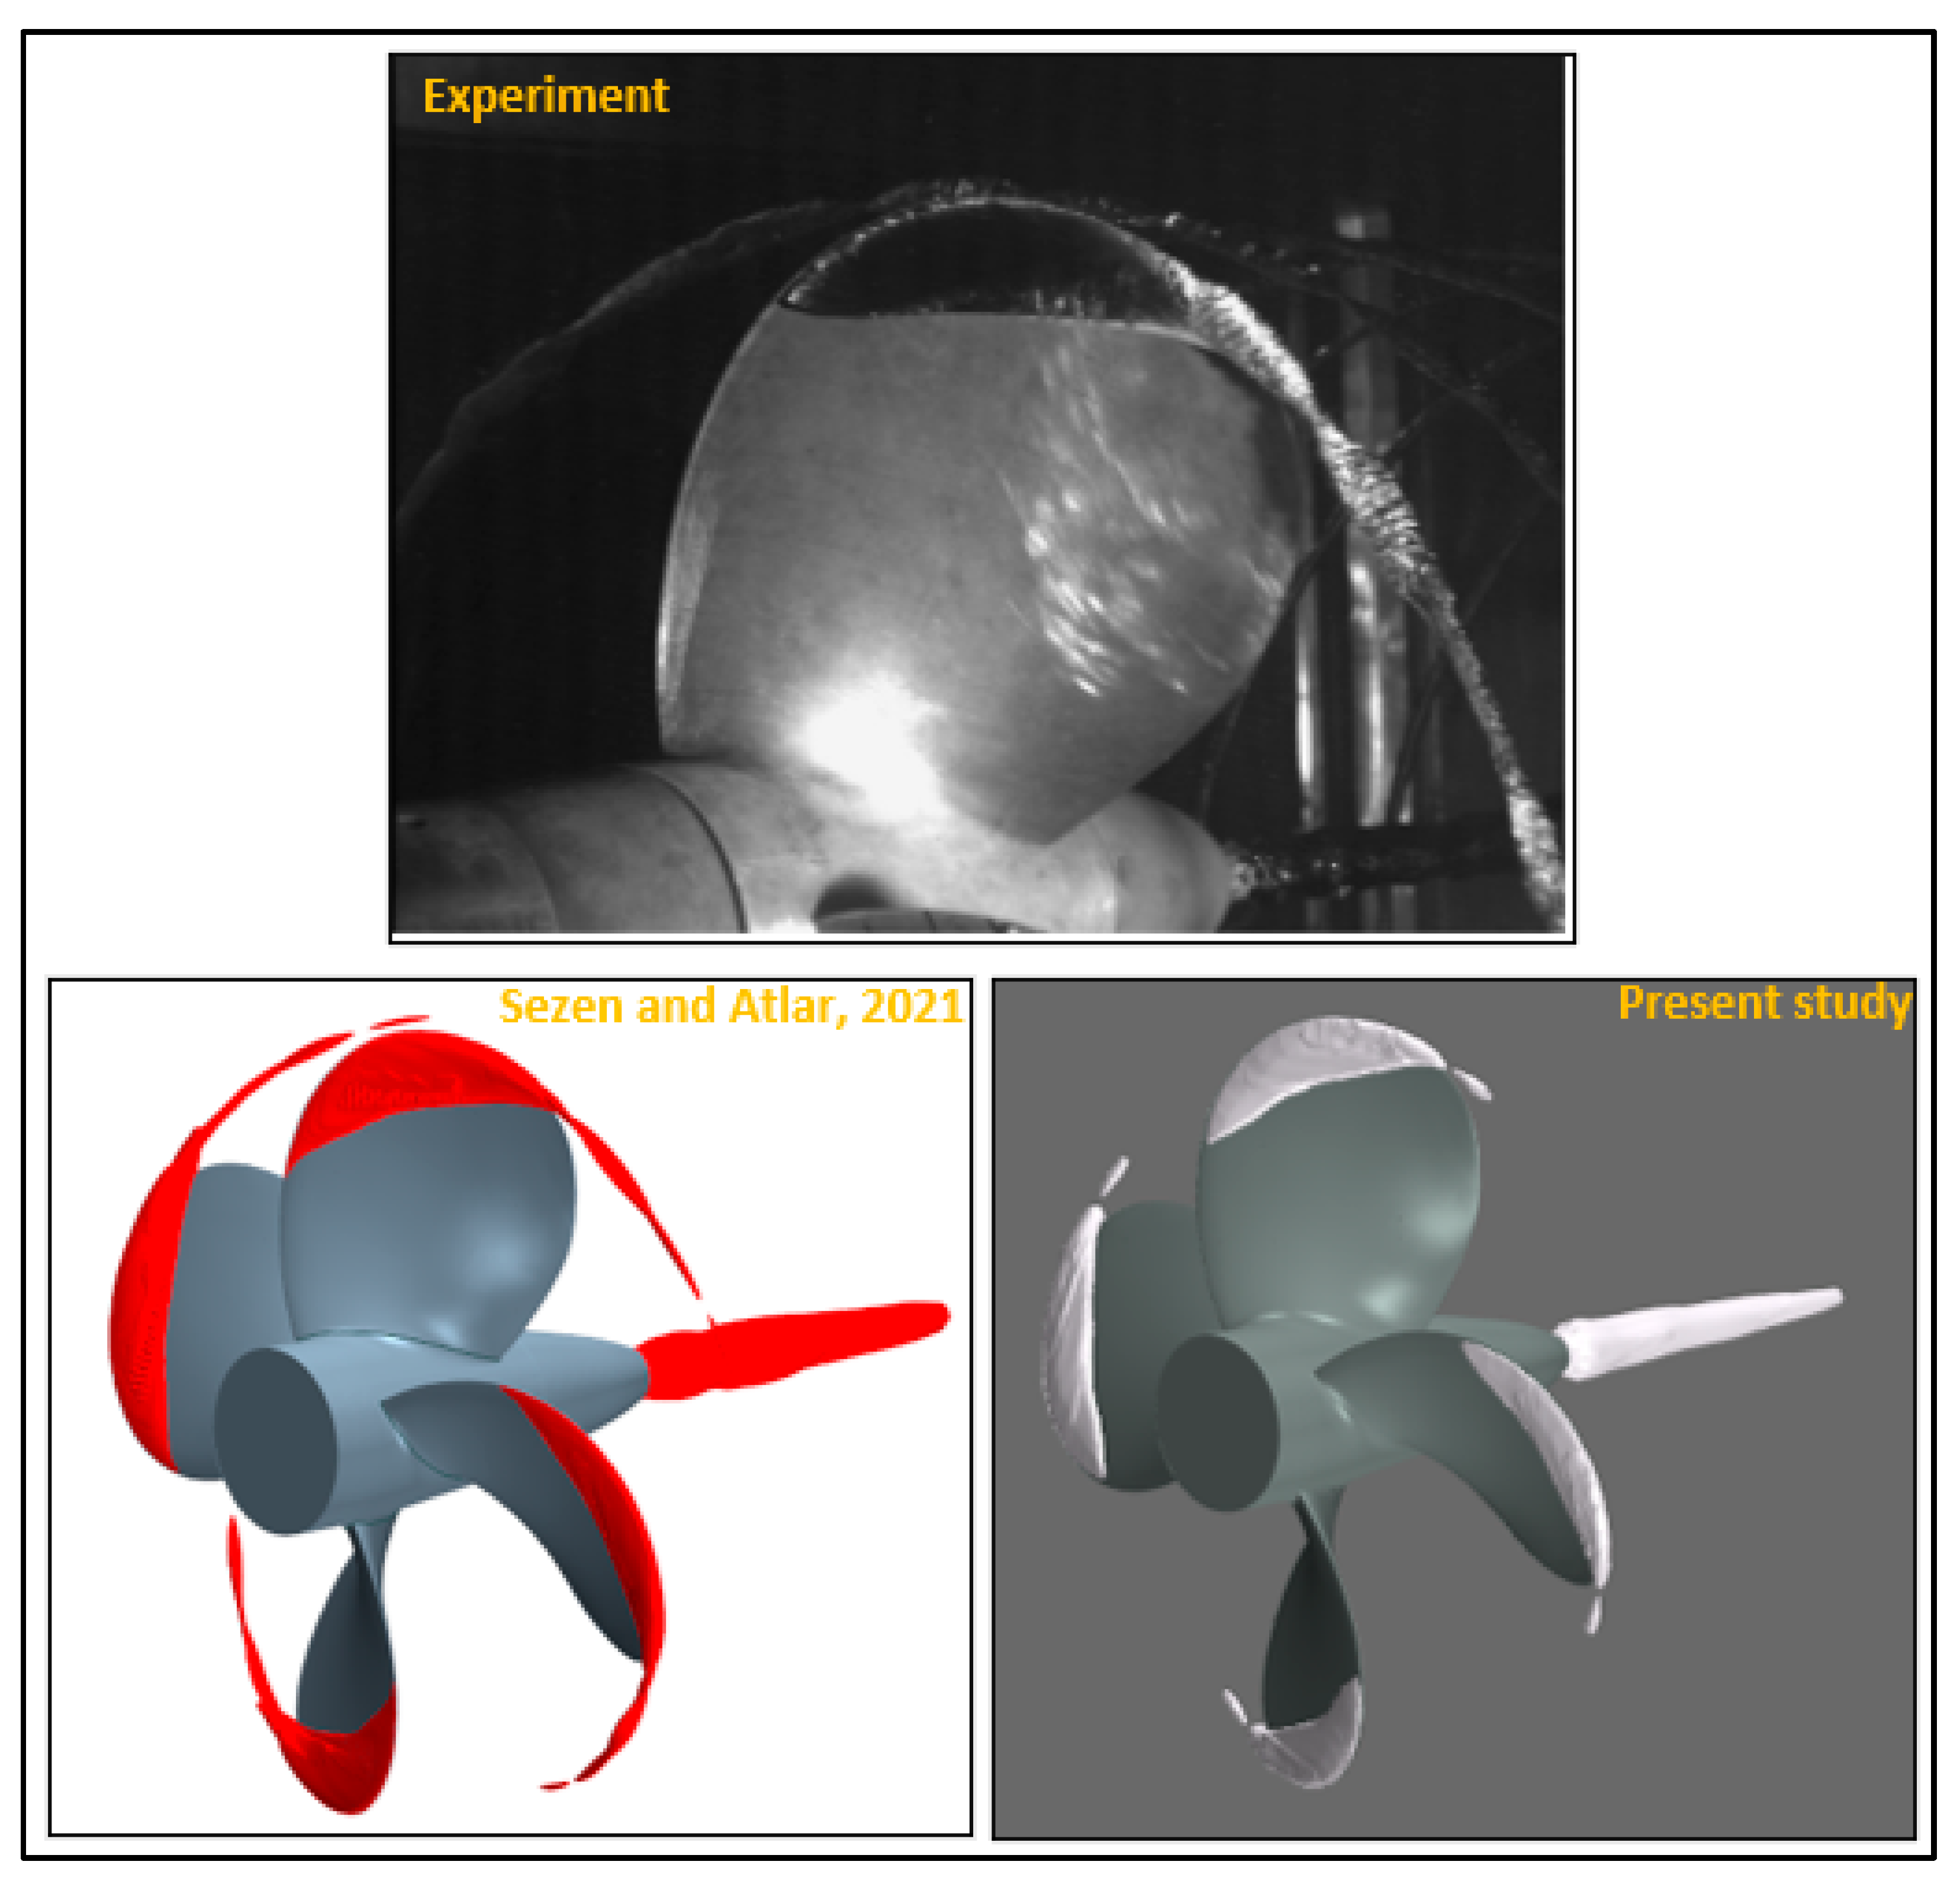
4.1. Validation of the Numerical Results in Smooth Condition

Table 3 shows the comparison of global performance characteristics (i.e., thrust and torque) of the propeller predicted using CFD with that of the experiment in a smooth condition. As shown in Table 3, the difference between the CFD and experiment is approximately 6% for thrust and torque coefficients. One of the reasons for this discrepancy can be related to the replication of the experimental set-up as the shaft in the upstream direction was eliminated in the CFD to reduce the computational cost of the solution.
The cavitation extension predicted in the CFD calculations is also compared with the experiment at J   = 0.71, σ = 1.763 in the smooth condition in Figure 4. In the CFD predictions, the iso-surface of volume fraction is taken as 0.1 ( α v = 0.1 ) . As shown in Figure 4, the sheet and hub vortex cavitation are predicted similarly both in the numerical calculations and the experiment. The sheet cavitation extension on the blades is slightly overpredicted in the CFD calculations compared to the experiment. In the experiment, the sheet cavitation rolls up into a thick and strong tip vortex cavitation. This TVC extends further downstream of the propeller. In the numerical calculations, as the V-AMR technique was not applied in this study and the hub vortex cavitation is of great interest, a similar TVC could not be predicted in the CFD calculations. Nevertheless, to show the capabilities of the V-AMR technique for the TVC modelling, the cavitation observation obtained by RANS in the authors’ recent study at the same operating condition is shown in Figure 4. As can be seen in Figure 4, the TVC can be modelled in the propeller slipstream successfully using the V-AMR technique. Also, the roll-up phenomena can be clearly seen in a region where the sheet and TVC interact with each other. The less extension of TVC in the propeller slipstream is observed in the numerical calculations as compared to the experiments. This is because the excessive amount of eddy viscosity inside the vortex is produced by the RANS and this results in less extension of TVC in the numerical calculations when compared to the experiment.

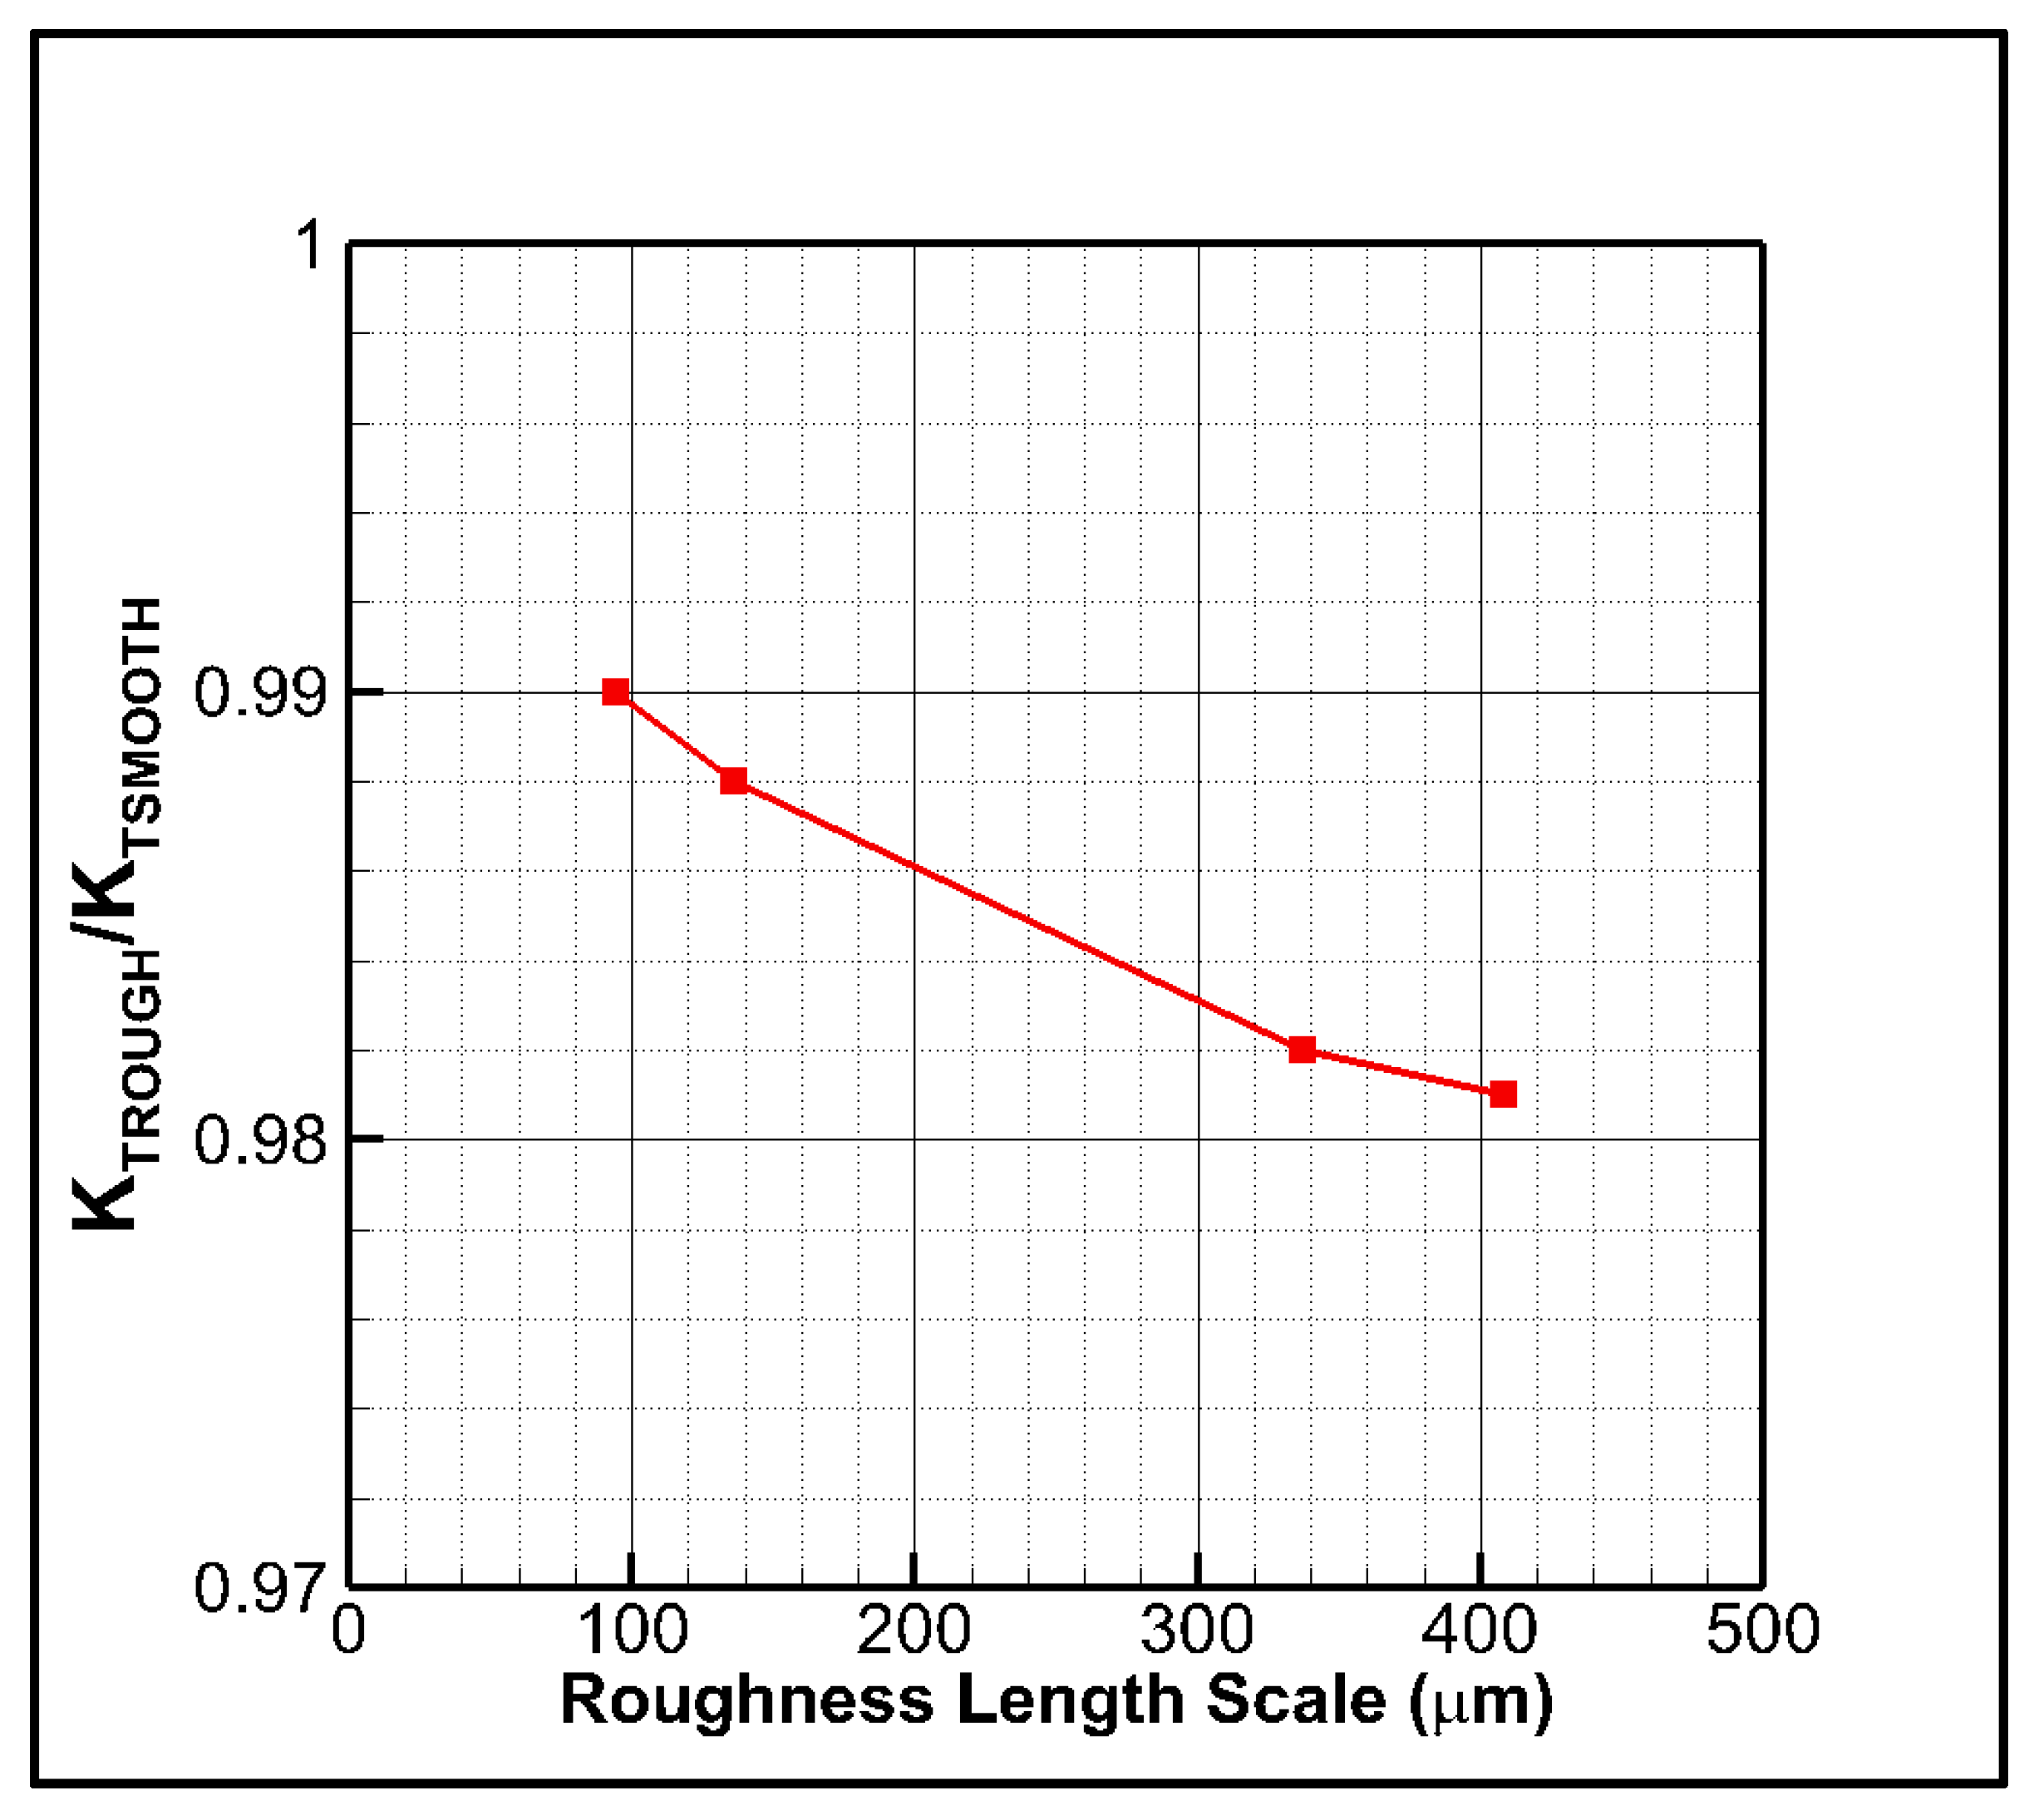
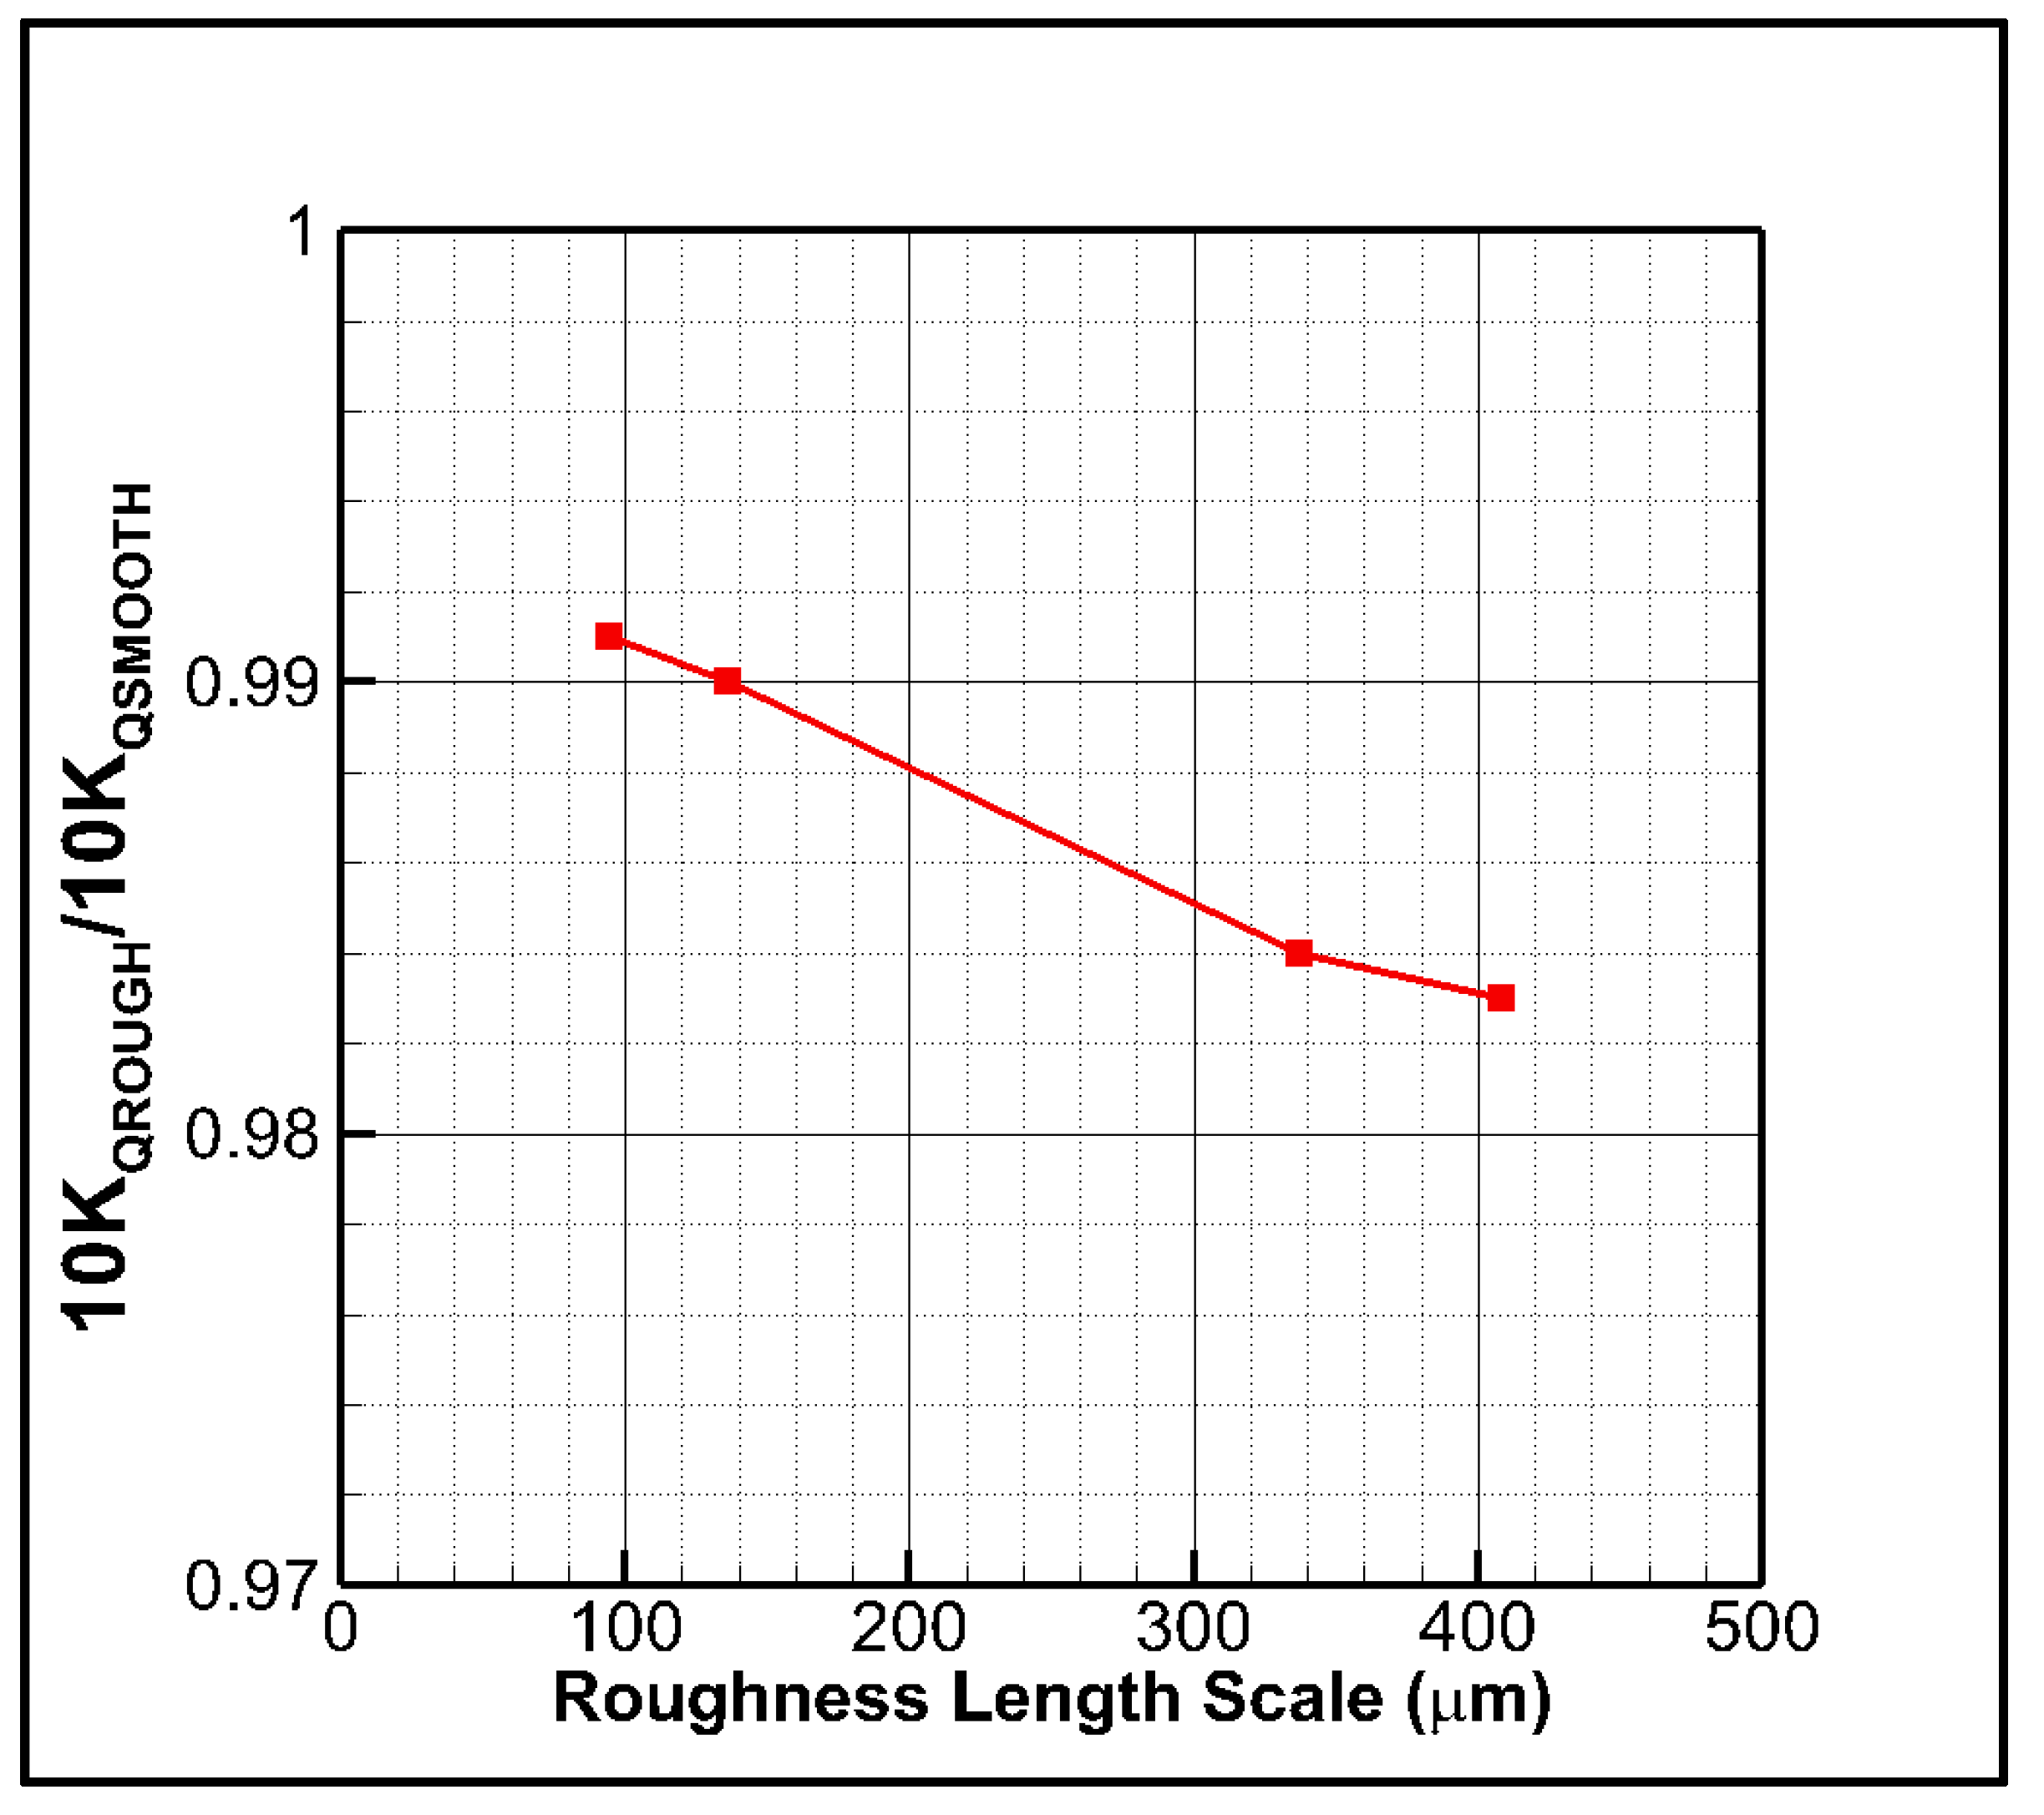
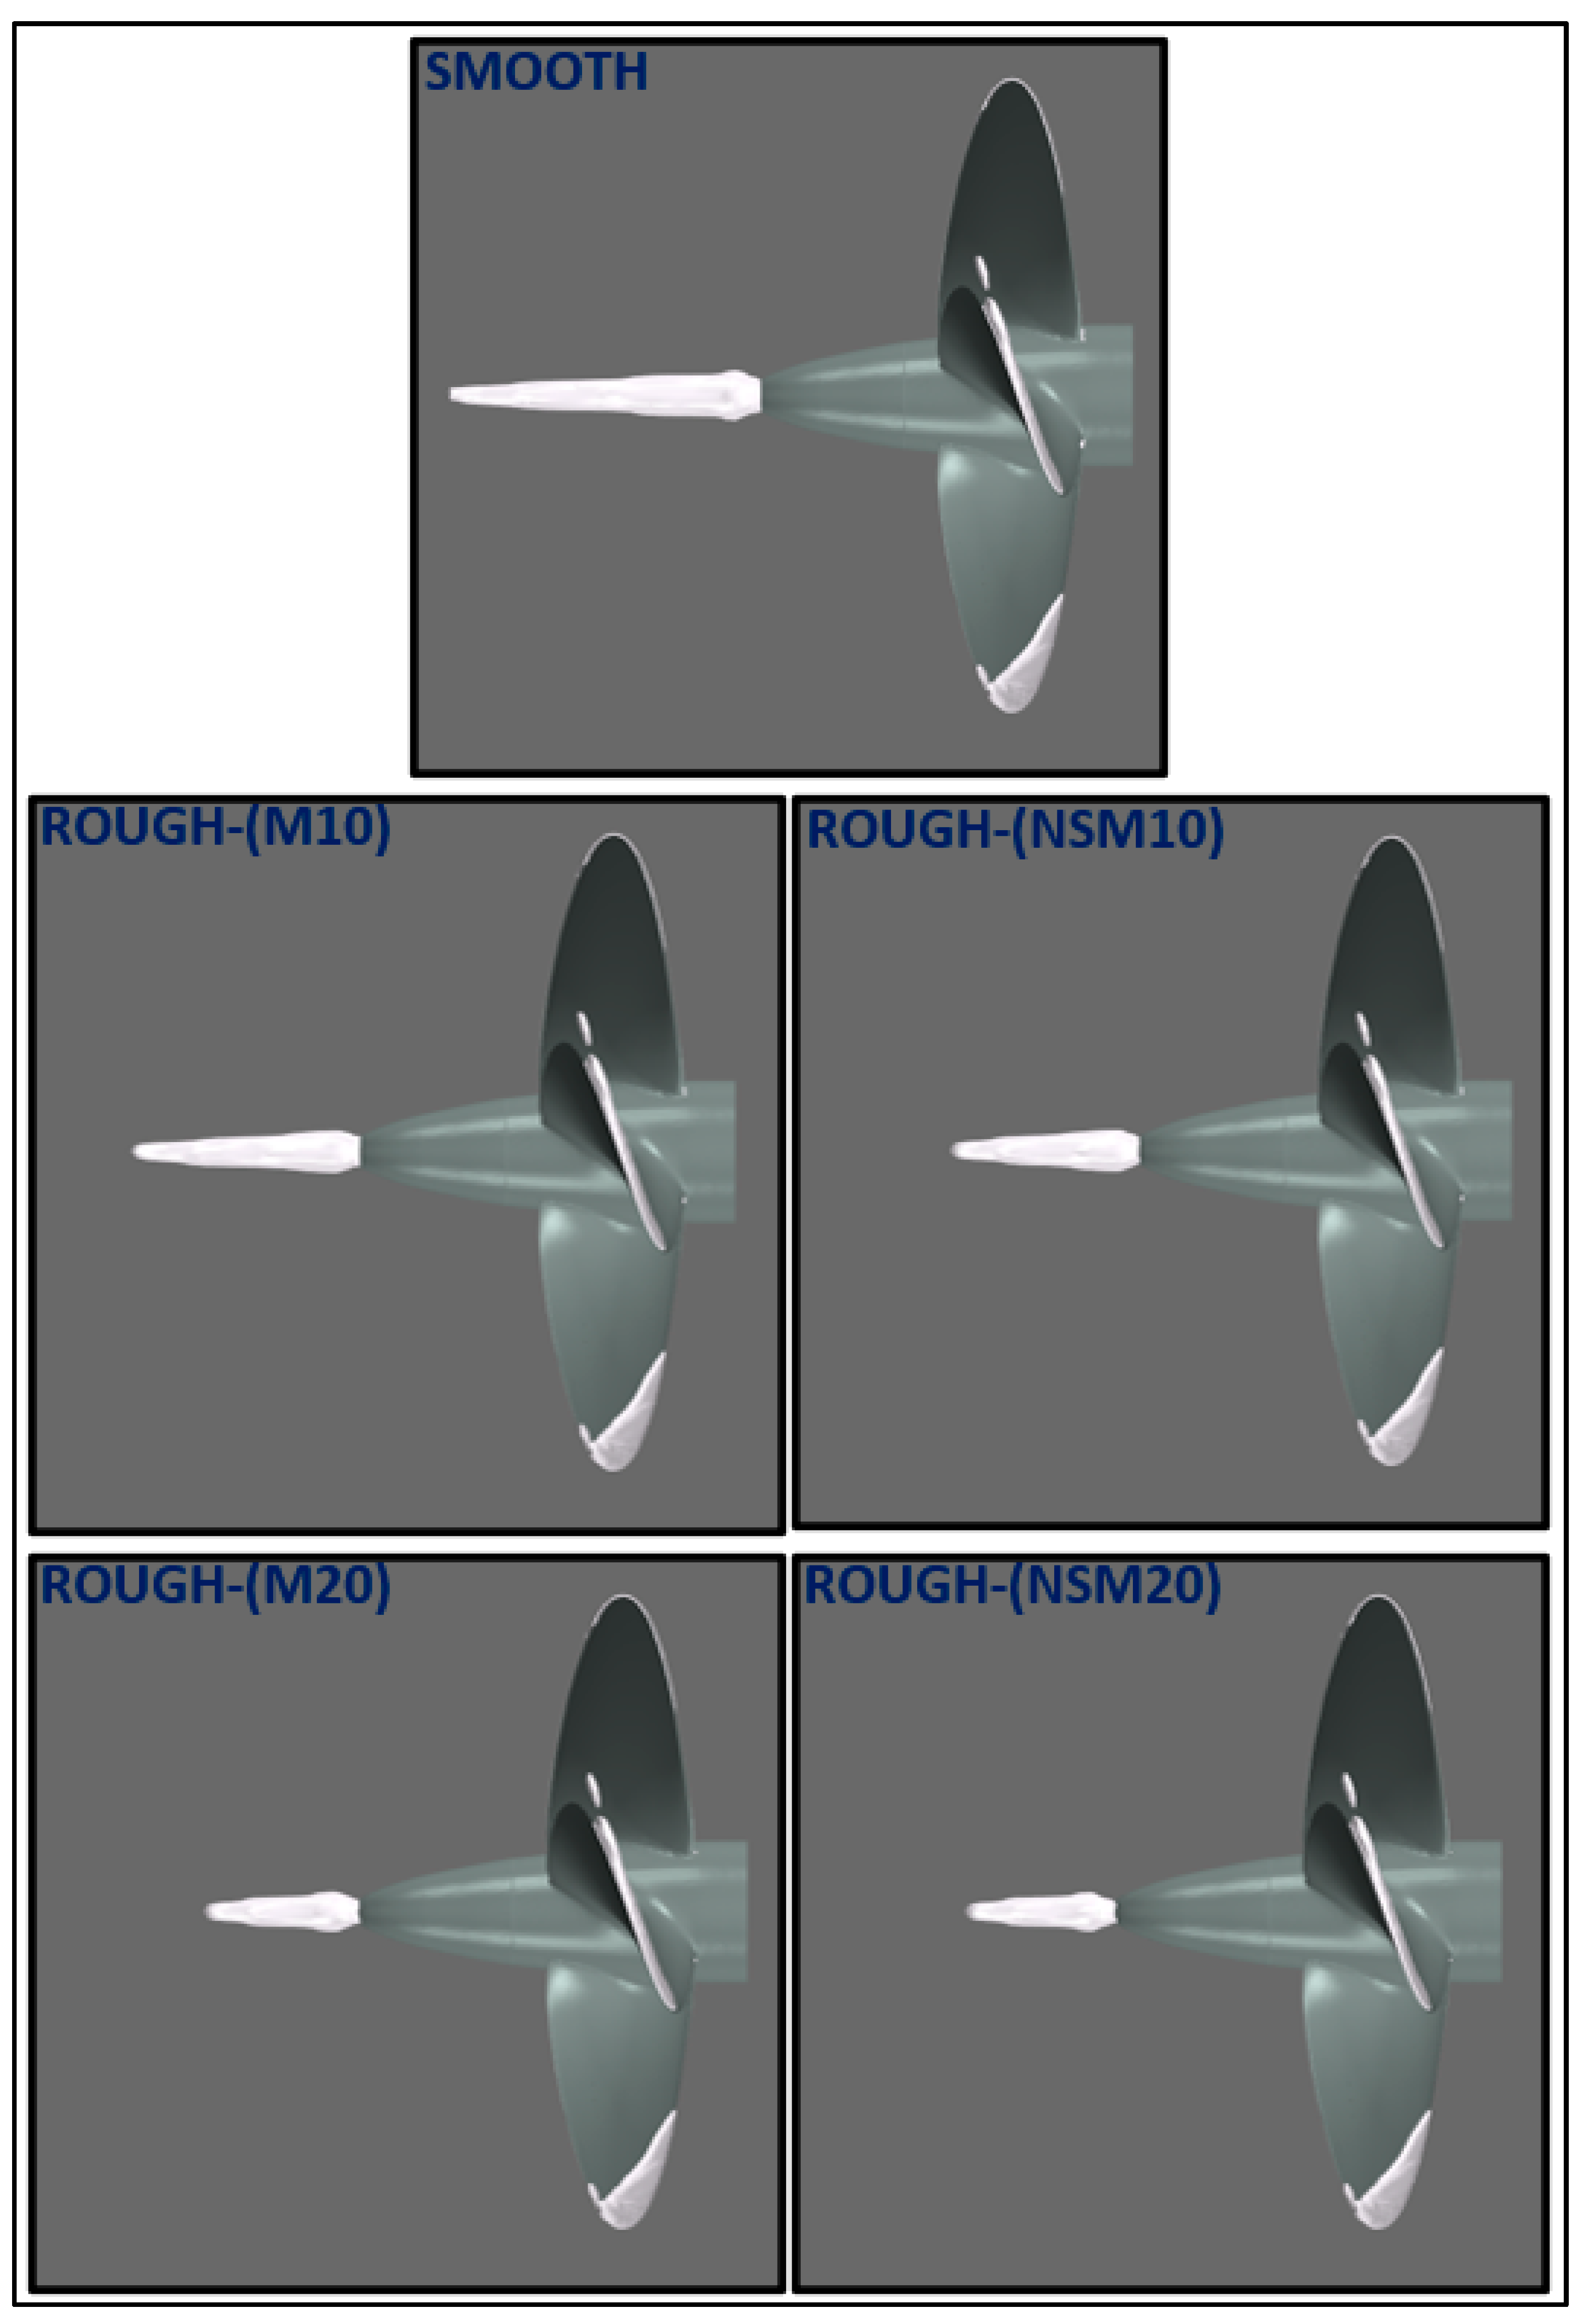
4.2. Influence of Roughness on Propeller Hydrodynamic Performance and Cavitation Extension

Figure 5 and Figure 6 show the change in thrust coefficient (i.e., K T ) and torque coefficient in the presence of roughness with the different roughness length scales, as given in Table 1. Here, the smooth condition is shown with zero roughness height. With the application of roughness, the thrust coefficient decreases with an increase in roughness length scale due to the increased drag and decreased lift, as shown in Figure 5. As expected, the thrust decrease is smaller with the application of roughness on the hub compared to that of roughness application on the blades, as explored in our previous study [16]. The maximum thrust-reduction is found at around 2% with respect to the smooth condition.
The change in torque coefficient (i.e., 10 K Q ) with roughness is also shown in Figure 6. Similar to thrust coefficient, roughness applied on the hub has a degradation effect on the torque coefficient of the propeller. The maximum reduction is found to be approximately 1.5% at the maximum roughened condition.
The decreased thrust and torque coefficients with the application of roughness lead to efficiency loss for the marine propellers, as shown in Figure 7. This is the main difference between the roughness and typical PBCF applications, as the increased thrust in PBCF enables efficiency gain due to the recovery of the energy loss. Nevertheless, the efficiency loss is not high with the application of roughness on the propeller’s hub and the maximum efficiency loss is found at around 0.25%, while the cost of applying roughness and PBCF is another parameter to consider when deciding which one to implement.
Figure 8 shows the comparison of wall shear stresses on the hub between smooth and rough conditions. As expected, the roughness applied to the hub increases the wall shear stresses.
The detailed flow analysis is carried out in the propeller slipstream to show the influence of roughness on the hub vortex and hub vortex cavitation. Figure 9 shows the change in turbulent kinetic energy obtained directly from the turbulence model with the application of roughness. As shown in Figure 9, the turbulent kinetic energy increases considerably with the roughness due to the transformation of the vortex’s circumferential momentum into turbulent kinetic energy.
The change in magnitude of the vortex structures with the roughness is shown at different sections in the propeller slipstream in Figure 10. Applying the roughness reduces the strength of the hub vortex with respect to the smooth condition. The reduced vortex strength enables the destabilisation process of the hub vortices and hence hub vortex disappears with the roughness application.
Figure 11 compares the distribution of the non-dimensional pressure coefficient ( C p = P / 0.5 ρ ( n D ) 2 ) between rough and smooth conditions. The roughness elements located around the hub interact with the hub vortices and change their velocity and pressure fields. The roughness decreases the velocity magnitudes, and hence, the pressure inside the vortex core and its surroundings increases significantly. With the application of roughness, the pressure inside the hub vortex increases, resulting in the reduction of hub vortex strength and hub vortex cavitation, as shown in Figure 12.
Applying roughness leads to destabilisation of the hub vortex strength, which results in the early breakdown of the hub vortex in the propeller slipstream. The reduced strength of the hub vortex due to the increased pressure inside the vortex core results in hub vortex cavitation mitigation with roughness application, as shown in Figure 12. With an increase in roughness length scale from M10 to NSM20, the hub vortex cavitation is further reduced. The maximum hub vortex cavitation volume reduction due to the roughness is computed at around 50% with respect to the smooth condition. As the roughness is solely applied to the propeller hub and boss cap, the sheet cavitation is not affected by the roughness application.

5. Conclusions

This study presented an application of roughness onto the propeller hub as a novel concept to mitigate the hub vortex cavitation for marine propellers. In the numerical calculations, the RANS method—together with the k-w SST turbulence model—was utilised for the solution of cavitating flow around the benchmark model-scale propeller, INSEAN E779A, operating under uniform flow conditions. The Schnerr–Sauer cavitation model was used for modelling the sheet and hub vortex cavitation. A detailed flow-field analysis was also performed to understand the influence of roughness on the hub vortex, and hence, hub vortex cavitation. The crucial findings can be summarised as follows.
  • The propeller’s hydrodynamic characteristics (i.e., thrust and torque coefficients) and cavitation extensions showed good agreement with the experimental data and cavitation observations, with slight differences.
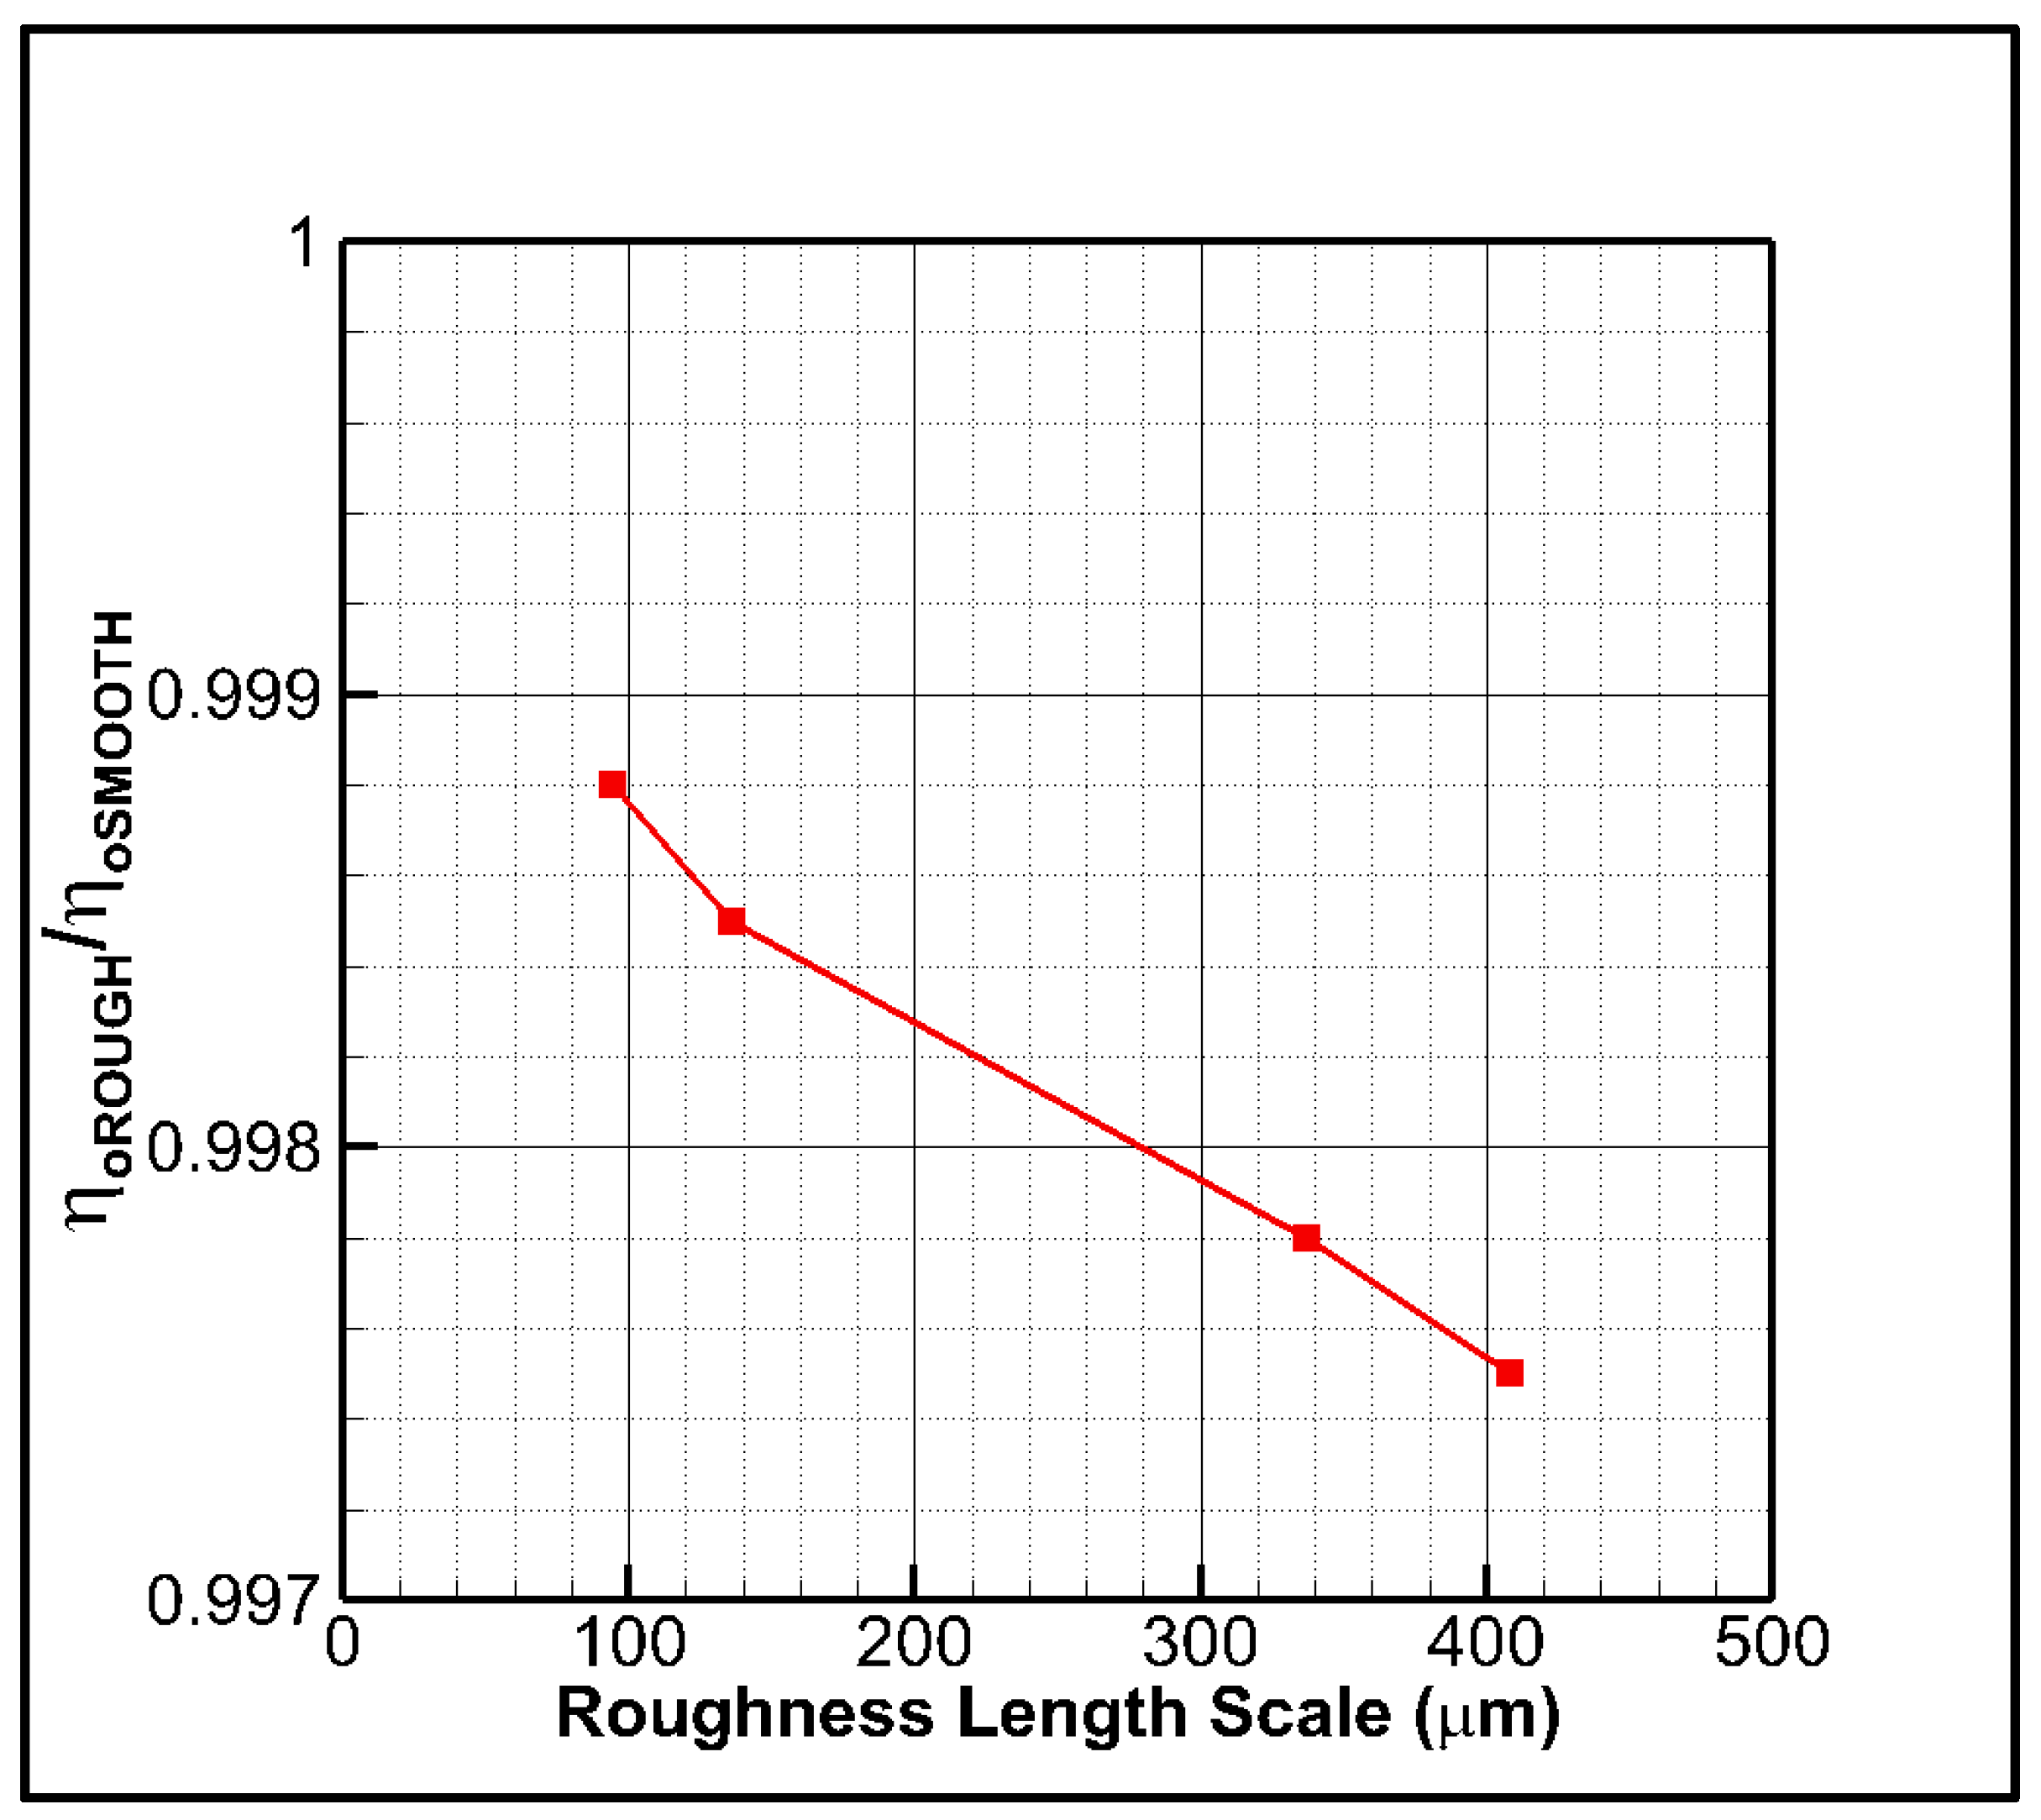
  • Similar to the roughness application on the blades explored in our previous studies [15,16], the roughness on the propeller hub caused efficiency loss. However, the unfavourable impact of roughness applied on the hub was less than that of applying homogenously and heterogeneously distributed roughness to the blades. The maximum efficiency loss was found at 0.25% with respect to the smooth condition in the presence of roughness on the propeller hub.
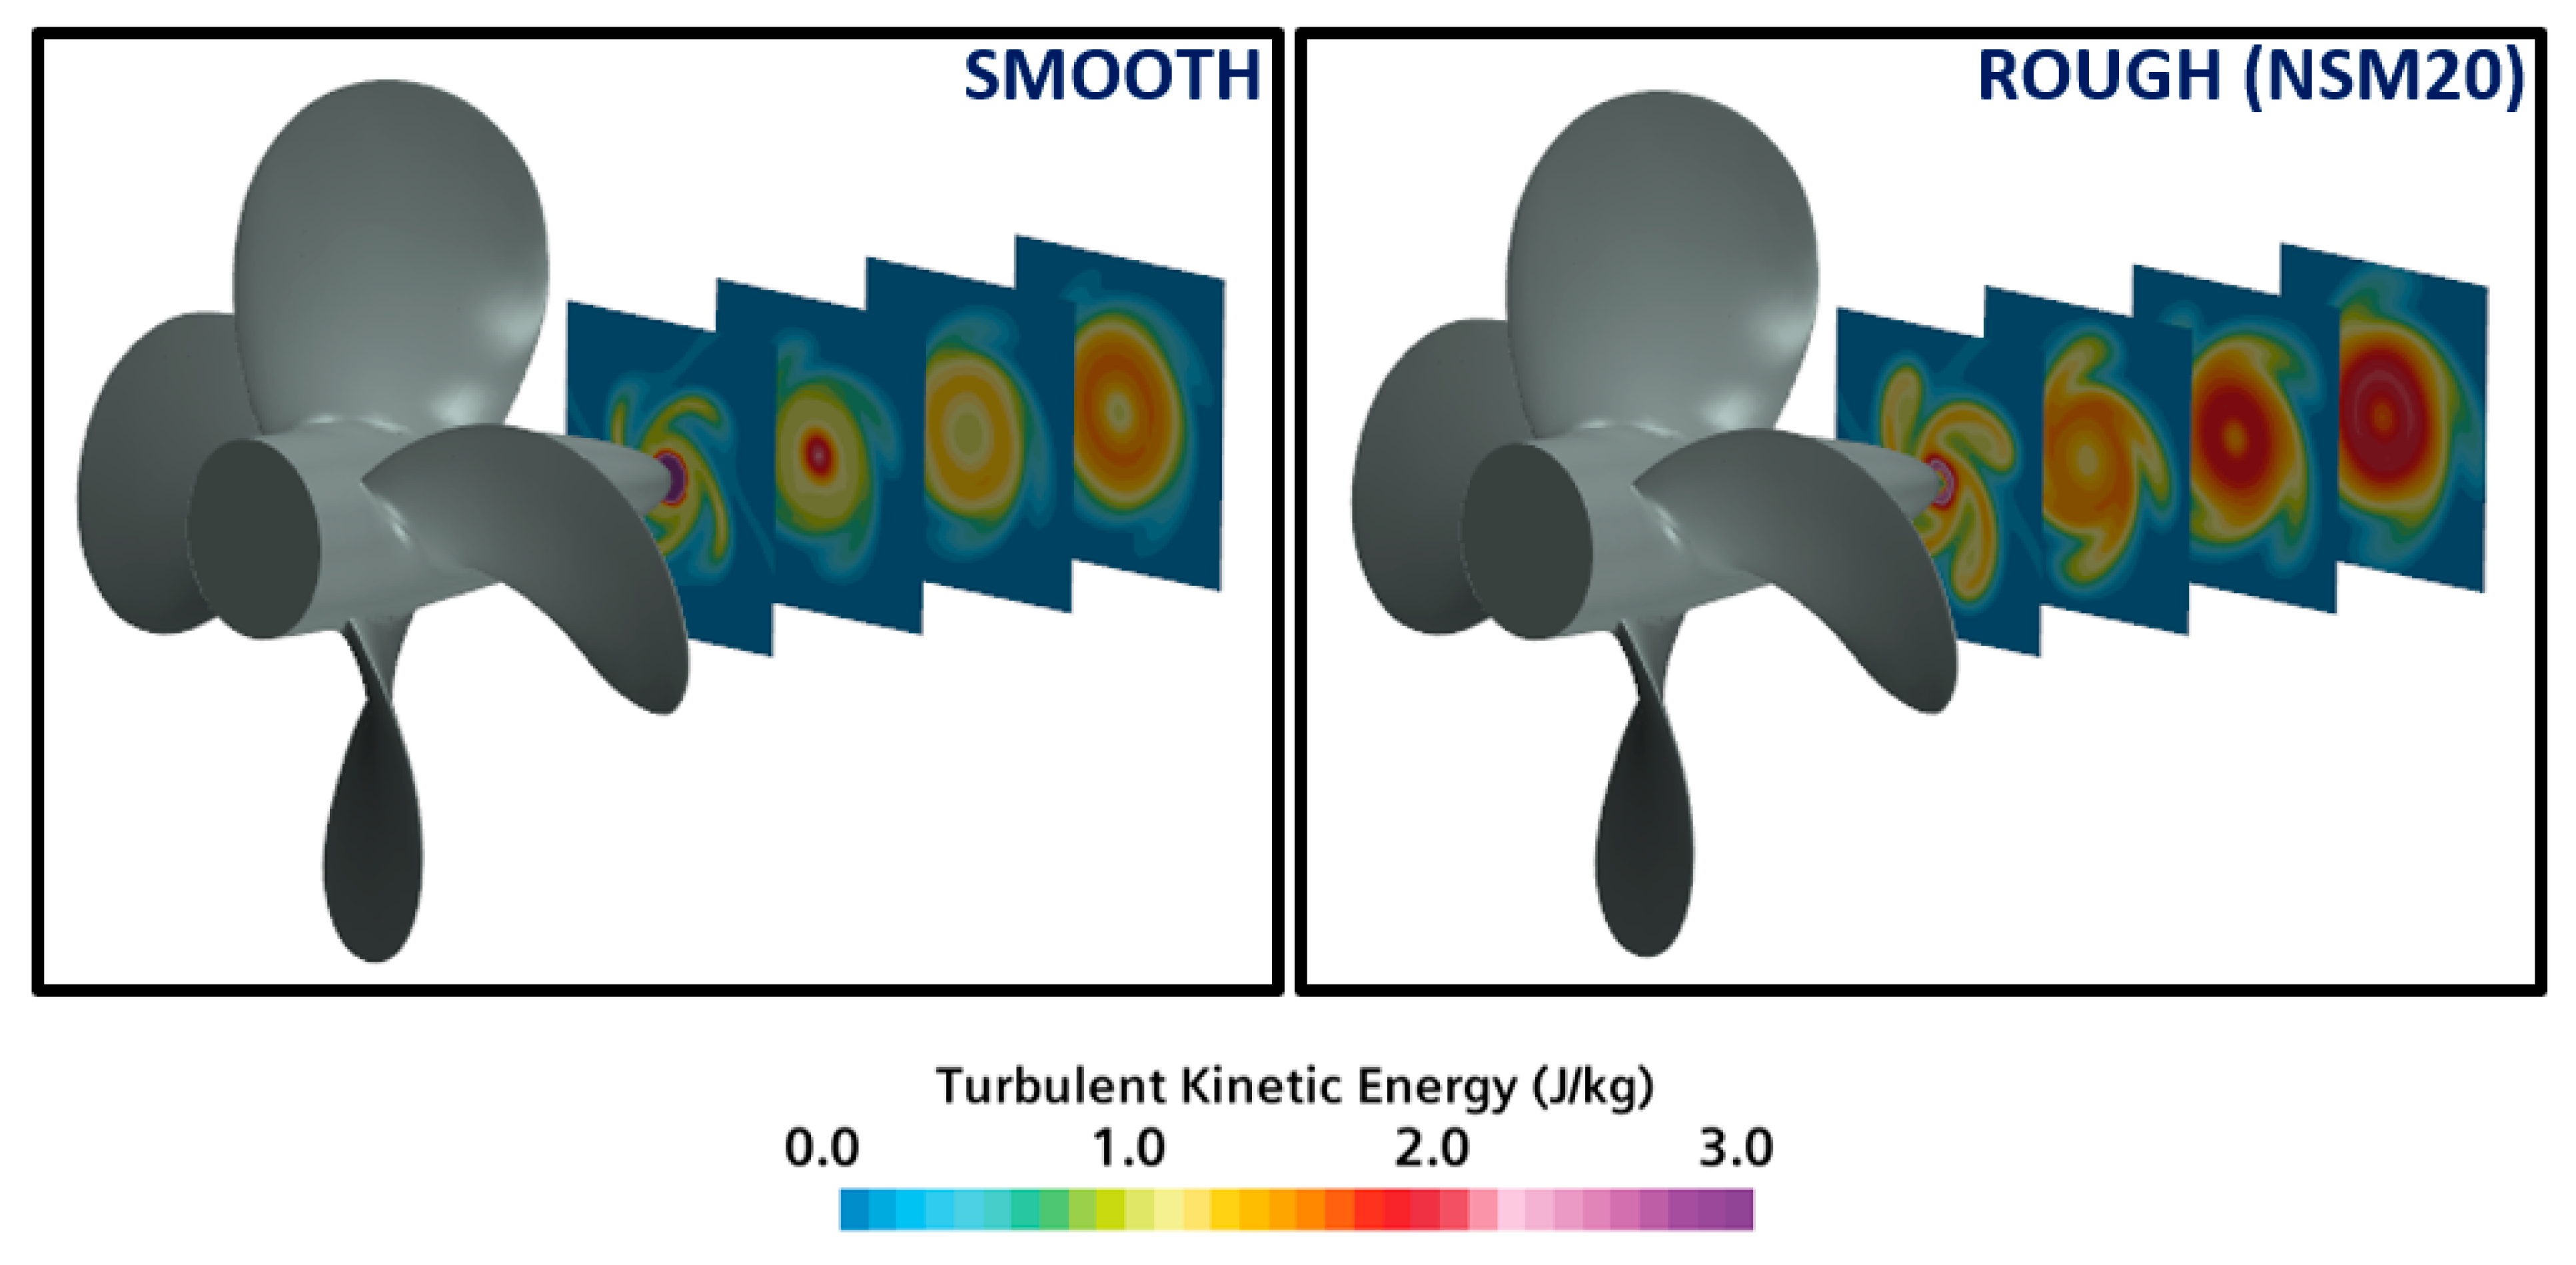
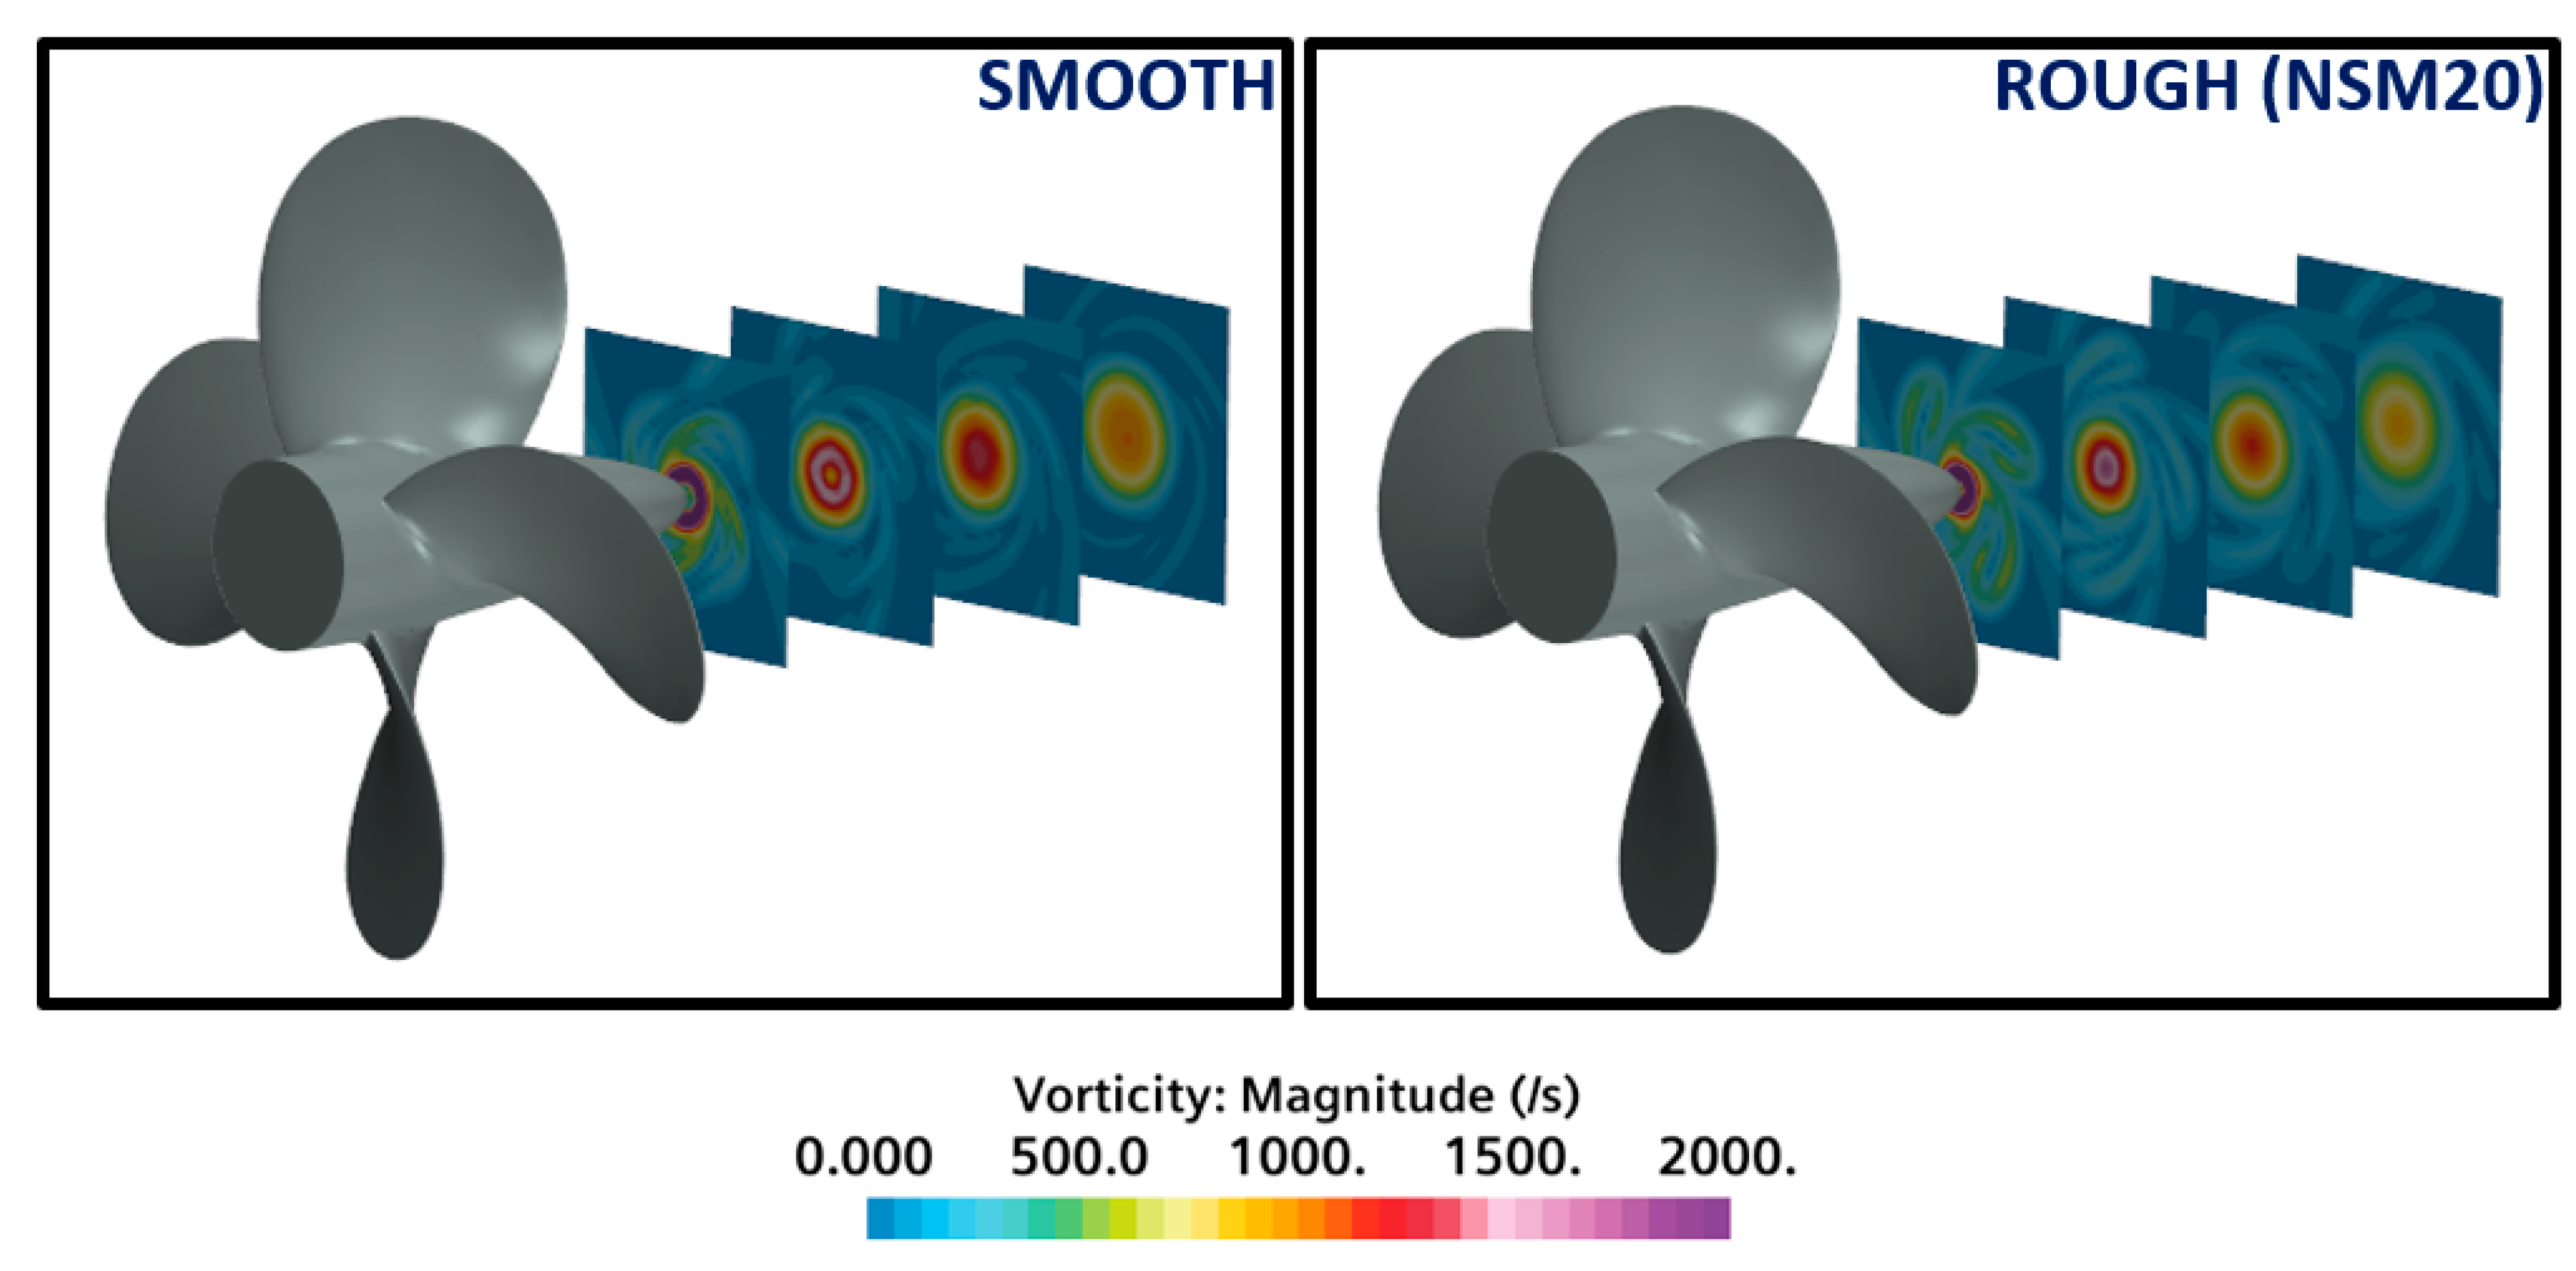
  • The roughness increased the turbulence kinetic energy considerably, whereas the hub vortex strength was reduced significantly due to the destabilisation effects of roughness.
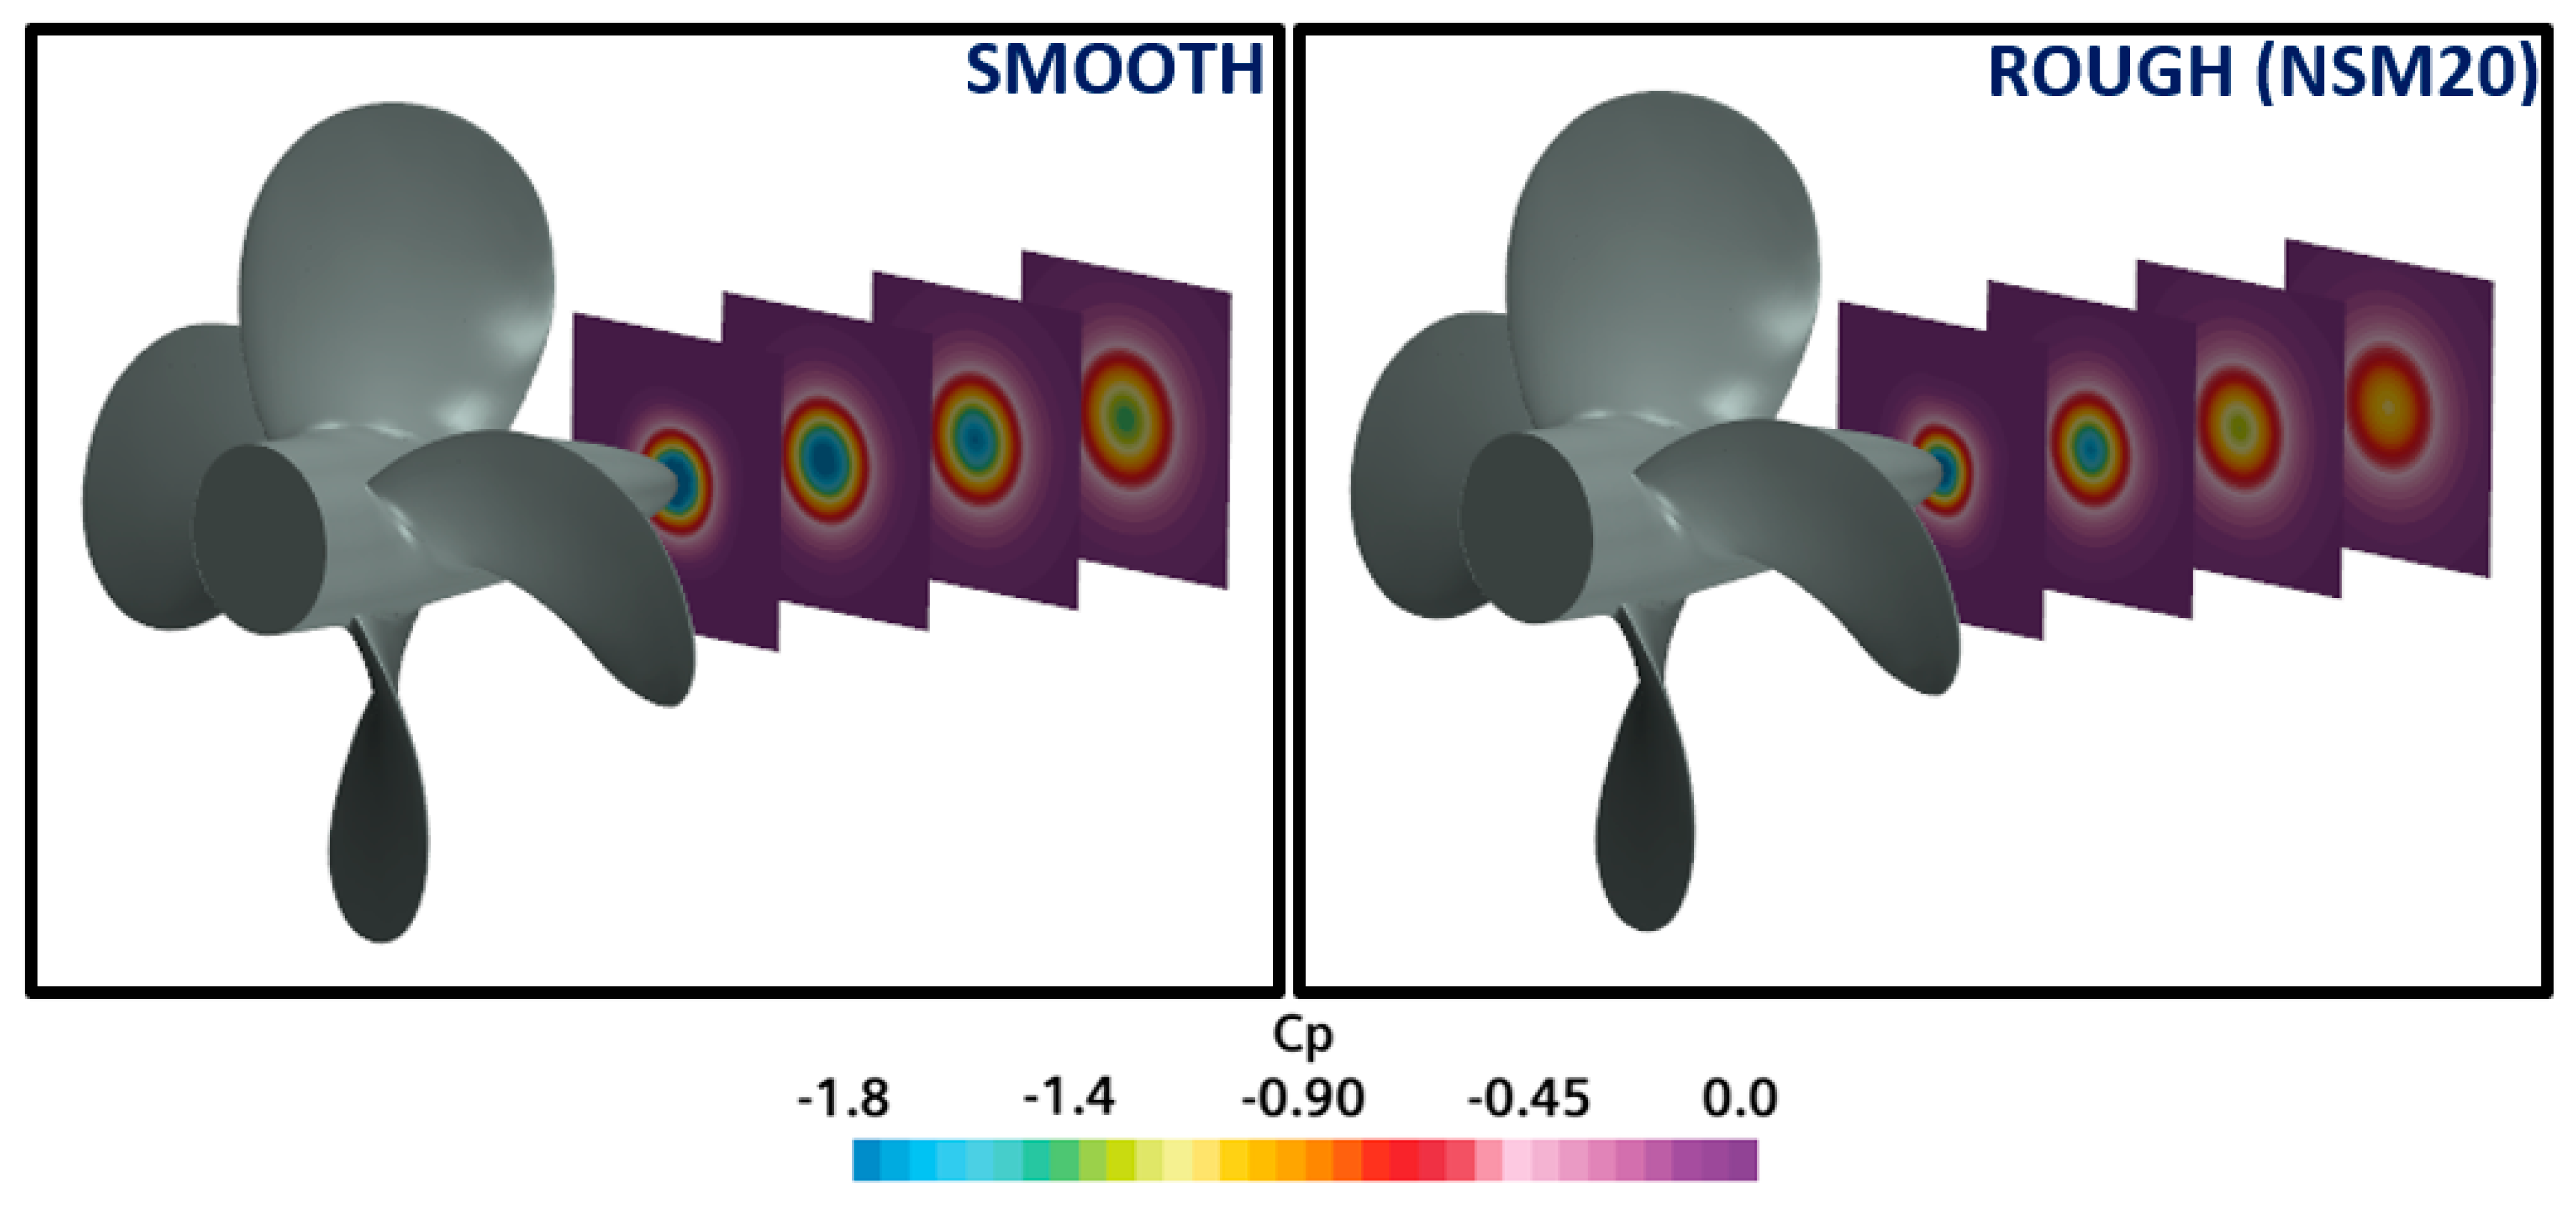
  • As the roughness changed the flow properties, the pressure inside the hub vortex increased. This increased pressure inside the vortex enabled hub vortex cavitation mitigation up to 50% depending on the roughness height applied to the hub with respect to the smooth condition.
  • Finally, this novel concept will be further explored and it will be incorporated with the propeller URN prediction and erosion models using CFD for model- and full-scale propellers operating under non-uniform flow conditions.

Author Contributions

Conceptualization; S.S., methodology; S.S.; software, S.S.; validation, S.S.; investigation, S.S., M.A.; resources; S.S., M.A.; data curation; S.S.; writing-original draft preparation; S.S.; writing-review and editing, S.S., M.A.; visualization; S.S.; supervision, M.A.; project administration, M.A. All authors have read and agreed to the published version of the manuscript.

Funding

This research received no external funding.

Institutional Review Board Statement

Not applicable.

Informed Consent Statement

Not applicable.

Data Availability Statement

Not applicable.

Acknowledgments

The first author was sponsored by Stone Marine Propulsion Ltd. of the UK and the University of Strathclyde during his PhD study. Results were obtained using the ARCHIE-WeSt High-Performance Computer (www.archie-west.ac.uk) based at the University of Strathclyde.

Conflicts of Interest

The authors declare no conflict of interest.

References

  1. MEPC.1/Circ.833; Guidelines for the Reduction of Underwater Noise from Commercial Shipping to Address Adverse Impacts on Marine Life. International Maritime Organization (IMO): London, UK, 2014.
  2. Hildebrand, J. Sources of anthropogenic sound in the marine environment. In Proceedings of the International Policy Workshop on Sound and Marine Mammals, London, UK, 28–30 September 2004. [Google Scholar]
  3. Cruz, E.; Lloyd, T.; Bosschers, J.; Lafeber, F.H.; Vinagre, P.; Vaz, G. Study on Inventory of Existing Policy, Research and Impacts of Continuous Underwater Noise in Europe; EMSA report EMSA/NEG/21/2020; WavEC Offshore Renewables: Lisbon, Portugal; Maritime Research Institute: Wageningen, The Netherlands, 2021. [Google Scholar]
  4. Breeze, H.; Nolet, V.; Thomson, D.; Wright, A.J.; Marotte, E.; Sanders, M. Efforts to advance underwater noise management in Canada: Introduction to the Marine Pollution Bulletin Special Issue. Mar. Pollut. Bull. 2022, 178, 113596. [Google Scholar] [CrossRef] [PubMed]
  5. Renilson, M.; Leaper, R.; Boisseau, O. Hydro-acoustic noise from merchant ships-impacts and practical mitigation techniques. In Proceedings of the Third International Symposium on Marine Propulsors, SMP’13, Tasmania, Australia, 5–8 May 2013. [Google Scholar]
  6. Bosschers, J. Propeller Tip-Vortex Cavitation and its Broadband Noise. Ph.D. Thesis, Universtiy of Twente, Enschede, The Netherlands, 2018. [Google Scholar]
  7. Carlton, J. Marine Propellers and Propulsion, 4th ed.; Butterworth-Heinemann: Oxford, UK, 2018. [Google Scholar]
  8. Atlar, M.; Takinaci, A.C.; Korkut, E. On the Efficiency and Cavitation Performance of a Propeller with Different Boss Caps. In Proceedings of the International Symposium Honouring Tarik SABUNCU On the Occasion of His 75th Birthday, Istanbul Technical University, Istanbul, Turkey, 17 December 1998. [Google Scholar]
  9. Ghassemi, H.; Mardan, A.; Ardeshir, A. Numerical Analysis of Hub Effect on Hydrodynamic Performance of Propellers with Inclusion of PBCF to Equalize the Induced Velocity. Pol. Marit. Res. 2012, 19, 17–24. [Google Scholar] [CrossRef]
  10. Yakushiji, R. Mechanism of Tip Vortex Cavitation Suppression by Polymer and Water Injection. Ph.D. Thesis, Naval Architecture and Marine Engineering, University of Michigan, Ann Arbor, MI, USA, 2009. [Google Scholar]
  11. Chekab, M.A.F.; Ghadimi, P.; Djeddi, S.R.; Soroushan, M. Investigation of Different Methods of Noise Reduction for Submerged Marine Propellers and Their Classification. Am. J. Mech. Eng. 2013, 1, 34–42. [Google Scholar] [CrossRef] [Green Version]
  12. Aktas, B.; Yilmaz, N.; Atlar, M.; Sasaki, N.; Fitzsimmons, P.; Taylor, D. Suppression of Tip Vortex Cavitation Noise of Propellers using PressurePoresTM Technology. J. Mar. Sci. Eng. 2020, 8, 158. [Google Scholar] [CrossRef] [Green Version]
  13. Asnaghi, A.; Svennberg, U.; Gustafsson, R.; Bensow, R.E. Propeller tip vortex mitigation by roughness application. Appl. Ocean Res. 2020, 106, 102449. [Google Scholar] [CrossRef]
  14. Stark, C.; Shi, W. Hydroacoustic and hydrodynamic investigation of bio-inspired leading-edge tubercles on marine-ducted thrusters. R. Soc. Open Sci. 2021, 8, 210402. [Google Scholar] [CrossRef] [PubMed]
  15. Sezen, S.; Uzun, D.; Turan, O.; Atlar, M. Influence of roughness on propeller performance with a view to mitigating tip vortex cavitation. Ocean Eng. 2021, 239, 109703. [Google Scholar] [CrossRef]
  16. Sezen, S.; Uzun, D.; Ozyurt, R.; Turan, O.; Atlar, M. Effect of biofouling roughness on a marine propeller’s performance including cavitation and underwater radiated noise (URN). Appl. Ocean Res. 2021, 107, 102491. [Google Scholar] [CrossRef]
  17. Ouchi, K. Effect and Application of PBCF (Propeller Boss Cap Fins). J. Mar. Eng. Soc. Jpn. 1992, 27, 768–778. [Google Scholar] [CrossRef]
  18. Ouchi, K.; Ogura, M.; Kono, Y.; Orito, H.; Shiotsu, T.; Tamashima, M.; Koizuka, H. A Research and Development of PBCF (Propeller Boss Cap Fins). J. Soc. Nav. Arch. Jpn. 1988, 1988, 66–78. [Google Scholar] [CrossRef]
  19. Ouchi, K.; Tamashima, M.; Kawasaki, T.; Koizuka, H. A Research and Development of PBCF (Propeller Boss Cap Fins): 2nd Report: Study on Propeller Slipstream and Actual Ship Performance. J. Soc. Nav. Archit. Jpn. 1989, 165, 43–53. [Google Scholar] [CrossRef] [Green Version]
  20. Kawamura, T.; Ouchi, K.; Nojiri, T. Model and full scale CFD analysis of propeller boss cap fins (PBCF). J. Mar. Sci. Technol. 2012, 17, 469–480. [Google Scholar] [CrossRef]
  21. Xiong, Y.; Wang, Z.; Qi, W. Numerical study on the influence of boss cap fins on efficiency of controllable-pitch propeller. J. Mar. Sci. Appl. 2013, 12, 13–20. [Google Scholar] [CrossRef]
  22. Mizzi, K.; Demirel, Y.K.; Banks, C.; Turan, O.; Kaklis, P.; Atlar, M. Design optimisation of Propeller Boss Cap Fins for enhanced propeller performance. Appl. Ocean Res. 2017, 62, 210–222. [Google Scholar] [CrossRef] [Green Version]
  23. Sun, Y.; Wu, T.; Su, Y.; Peng, H. Numerical prediction on vibration and noise reduction effects of propeller boss cap fins on a propulsion system. Brodogradnja 2020, 71, 1–18. [Google Scholar] [CrossRef]
  24. Gaggero, S.; Martinelli, M. Comparison of different propeller boss cap fins design for improved propeller performances. Appl. Ocean Res. 2021, 116, 102867. [Google Scholar] [CrossRef]
  25. Siemens. Star CCM+ 14.06, User Guide; Siemens: Munich, Germany, 2019. [Google Scholar]
  26. Uzun, D.; Ozyurt, R.; Demirel, Y.K.; Turan, O. Does the barnacle settlement pattern affect ship resistance and powering? Appl. Ocean Res. 2020, 95, 102020. [Google Scholar] [CrossRef]
  27. Grigson, C. Drag Losses of New Ships Caused by Hull Finish. J. Ship Res. 1992, 36, 182–196. [Google Scholar] [CrossRef]
  28. Sezen, S.; Atlar, M. An alternative Vorticity based Adaptive Mesh Refinement (V-AMR) technique for tip vortex cavitation modelling of propellers using CFD methods. Ship Technol. Res. 2021, 69, 1–21. [Google Scholar] [CrossRef]
  29. Salvatore, F.; Streckwall, H.; Van Terwisga, T. Propeller Cavitation Modelling by CFD-Results from the VIRTUE 2008 Rome Workshop. In Proceedings of the First International Symposium on Marine Propulsors, SMP’09, Trondheim, Norway, 22–24 June 2009. [Google Scholar]
Figure 1. Representation of the roughness application area on the hub (black colour represents the area where the roughness was applied).
Jmse 10 01426 g001
Figure 2. The computational domain used in the numerical calculations.
Jmse 10 01426 g002
Figure 3. Grid resolution inside the computational domain.
Jmse 10 01426 g003
Figure 4. Comparison of cavitation extensions between CFD and experiment at J   = 0.71, σ = 1.763 in smooth condition ( α v = 0.1 ) [28].
Jmse 10 01426 g004
Figure 5. Change in thrust coefficient ( K T ) with roughness.
Jmse 10 01426 g005
Figure 6. Change in torque coefficient ( 10 K Q )   with roughness.
Jmse 10 01426 g006
Figure 7. Efficiency ( η 0 ) loss with roughness.
Jmse 10 01426 g007
Figure 8. Comparison of wall shear stresses between smooth and rough conditions.
Jmse 10 01426 g008
Figure 9. Change in turbulent kinetic energy with roughness.
Jmse 10 01426 g009
Figure 10. Change in the magnitude of the vortex structures in the propeller slipstream with roughness.
Jmse 10 01426 g010
Figure 11. Change in non-dimensional pressure distribution with roughness.
Jmse 10 01426 g011
Figure 12. Mitigation of hub vortex cavitation with roughness ( α v = 0.1 ) .
Jmse 10 01426 g012
Table 1. Roughness length scales of test surfaces, adapted from [26] Uzun et al., 2020.
Test SurfacesSurface Coverage (%)Barnacle
Height h
(mm)
Representative
Roughness Height
k G (μm)
Equivalent
Sand Roughness
Height
k S (μm)
Mix105, 2.5, 1.2594409
NS Mix105, 2.5, 1.25136635
Mix205, 2.5, 1.253371366
NS Mix205, 2.5, 1.254081645
Table 2. Operating conditions for the INSEAN E779A propeller.
ParameterSymbol and UnitValue
Advance ratio J (-)0.71
Rotation Rate n (rps)36
Inflow averaged velocity V A (m/s)5.8
Cavitation number σ (-)1.763
Vapour pressure P V (Pa)2337
Table 3. The comparison of thrust and torque coefficients between the experiment and CFD at J   = 0.71, σ   = 1.763 in the smooth condition.
ParameterExperiment [29] CFD
K T 0.2550.240
10 K Q 0.4600.435
Publisher’s Note: MDPI stays neutral with regard to jurisdictional claims in published maps and institutional affiliations.

