
Experimental Research on the Influences of Head Shape and Surface Properties on the Water Entry Cavity

1
School of Marine Science and Technology, Northwestern Polytechnical University, Xi’an 710072, China
2
Key Laboratory of Unmanned Underwater Vehicle Technology, Northwestern Polytechnical University, Xi’an 710072, China
*
Author to whom correspondence should be addressed.
J. Mar. Sci. Eng. 2022, 10(10), 1411; https://doi.org/10.3390/jmse10101411
Submission received: 5 September 2022
/
Revised: 27 September 2022
/
Accepted: 28 September 2022
/
Published: 2 October 2022
(This article belongs to the Section Ocean Engineering)
Abstract
:Addressing the problem of the influence of surface properties on the cavity in the process of a moving body entering water, especially the problems of water entry speed and the cavitation evolution of the round-head, air-delivered projectile that has many practical applications, a self-designed launch platform and high-speed camera were used, and the MK46 was used as a prototype to conduct scaled model experiments with different head form types and different surface properties. This paper describes the general process of the moving body entering the water and the generation of the cavity. The relationship between the re-injection flow, the local cavity number and the cavity stability is discussed. At the same time, the effects of head shape, launch velocity and surface wettability on the cavity evolution and motion characteristics were analyzed, including 0°, 57°, 70°, 90° and 180° hemispherical angle-head projectiles with speeds of 2.2 m/s and 3.95 m/s, so as to observe the cavity development and ballistics. The results show that hydrophobic surfaces are more prone to cavities when entering water vertically at low speeds. The influencing factors of water entry ballistics are often the combined effects of head shape, water entry speed and water entry angle. The speed of the hydrophilic surface models with head hemisphere angles of 57 degrees and 70 degrees entering the water is the fastest. This provides a reference for us to design the shape of the projectile. The internal relationship between the cavity shape and the ballistic characteristics is based on the premise that the cavity will complicate the force on the model. The cavity affects the ballistic characteristics of the model by affecting the forces on the model.
1. Introduction
The entry of a body moving into water involves the interaction between solid–liquid–gas and is affected by many physical parameters, such as the geometric shape and material properties of the moving body, the motion parameters of the moving body at the moment of hitting the water, the physical properties of the liquid and the air pressure, etc. The process starts with the moving body touching the free surface and ends when the moving body enters the water and reaches a steady state. It is a very short, transient and unsteady process. In the process of entering the water, the moving body experiences four stages: impact, immersion, navigation with the cavity and full wetting. The process involves complex physical phenomena, such as impact, splash, formation, closure and collapse of the entering cavities. The water entry process begins when the vehicle hits water at a high speed, and cavitation begins to form and passes through evolutionary stages, such as development, closure and collapse. The head shape, water-entry velocity and the surface properties have significant impacts on the subsequent ballistic stability [1,2]. The research on the influences of the head shape and surface properties of the vehicles on the water entry process could help us to better study the water entry process, so that we can conduct more in-depth research on the water entry problems of various types of vehicles in order to develop more advanced underwater navigation devices.
Chaudhry et al. [3] studied and summarized the research on water entry produced in the past 100 years. Over the past century, with the development of science and technology, research methods have been continuously improved, but the research on water entry is still not comprehensive, and there is still huge space for exploration in terms of theoretical research, experimental research and numerical calculation methods. The earliest theoretical research on the water entry problem was that of Von Karman [4] researching the aircraft ditching problem, and Logvinovich [5], who described the development and change process of the cavity by studying the expansion and contraction of the cavity wall according to the principle of energy conservation. The problem of the impact of the vehicle when entering the water has received attention from scholars. On this basis, a series of explorations have been carried out on the evolution mechanism of the flow field during the oblique entry of the rotor into the water [6]. In the last century, scholars have conducted a great deal of research on the problem of the missile entering the water. Richardson [7] and May [8,9] have studied the effects of different head shapes on the acceleration and trajectory of missiles entering the water. May [10] also studied the effect of the surface state on the shape of the water entry cavity of the moving body and found that the sphere with a clean surface cannot easily generate a water entry cavity, while the sphere with a dirty surface is prone to a large water entry cavity. Yves-Marie [11] studied the oblique water entry of a body, and the pressure, force and dynamics of the wetted surface expansion were assessed. Chen Cheng et al. [12] studied the influences of the water entry angle, speed and cavitator area on the axial force when a vehicle with a disk cavitator impacts and enters the water. Sun et al. [13] conducted an experimental study on the evolutionary process of the water-entry cavity when a sphere impacts on a viscous liquid. Shi et al. [14] studied the shoulder exhaust of the aircraft, and Chen et al. [15] studied the effects of different head shapes and launch speeds on the evolution and motion characteristics of cavities. Shi et al. [16] analyzed the influences of the Froude number on the flow field interference and trajectory characteristics of multiple successively launched underwater projectiles. Studies by Duez et al. [1] showed that only when the water inlet velocity of the moving body exceeds a certain critical value will the water inlet cavity be generated, and the critical velocity value has an important relationship with the wettability of the sphere surface. Korobkin et al. [17] compared the processes of water entry impact and water exit.
Yan et al. [18] developed a mathematical model to describe the development of water entry cavities based on the matched asymptotic approach and the potential flow theory aiming to address the problem of water entry in the case of a low Froude number. The simulation results were in good agreement with the mathematical model developed by Duclaux et al. [19] and the previous experimental data. Gilbarg et al. [20] researched the effects of impact velocity and atmospheric pressure on the evolution of water entry cavities. Aristoff et al. [21] experimentally studied the development of the cavity of a hydrophobic surface sphere. The results show that the closure of the cavity depends mainly on the surface properties rather than gravity at low bond numbers.
Abelson. [22] measured the cavity pressure distribution of a projectile with a diameter of 76.2 mm and a head cone angle of 140° at a maximum velocity of 76.2 m/s, and with water entry angles of 45°, 60° and 90°, respectively. The results show that the smaller the water entry angle is, the smaller the pressure in the cavity is. Meanwhile, the minimum cavity pressure decreases linearly with the increase in the water entry velocity in the studied velocity range.
Truscott et al. [23] carried out a series of studies in the MIT Fluid Mechanics Laboratory on the cavity shape, flow field characteristics and projectile oblique entry of a rotating sphere into the water. They found that the cavity and splash formed when a sphere enters the water at a certain rotational speed is asymmetric, and the lift caused by the rotation causes the sphere’s ballistic trajectory to bend into a curve. When the sphere rotates, the water carried from one side of the sphere impacts the other side of the cavity wall, forming a series of wedge-shaped bubble lines in the water.
Yu et al. [24] found that the peak value of the non-dimensional impact force is independent of the impact velocity and the radius of the sphere, while it depends on the mass of the sphere. Li et al. [25] found that the lower velocity of the projectile causes the damage of the cavity shape and the trajectory instability. Among all the projectiles used with three different r values, the projectile of r = 1 mm had a better trajectory stability and drag reduction performance. Li et al. [26] carried out an experimental study of heating spheres entering water cavities and analyzed the effect of the sphere surface temperature on water cavities upon entry. Sun et al. [27] used a combination of numerical simulations and experiments to conduct a systematic study on the formation mechanism of a cavity, the development law of a cavity and the multiphase flow field structure and fluid dynamics of spheres and cylinders with different surface wettability characteristics when vertically entering the fruit layer. Wang et al. [28] carried out numerical simulations of half hydrophobic and hydrophilic spheres entering the water vertically.
The experiments of Yang Heng et al. [29]. carried out experimental research on the formation, development characteristics and influencing factors of cavities in the context of the low-velocity entry of projectiles into water with different head cone angles. Different ballistic laws were obtained. In addition, Bush et al. [1,30,31]. also carried out experiments on spheres entering water. However, most of the current research in this area has been carried out on the conical-headed projectile or sphere, and there are few studies on the development of cavities and the ballistics of the round-headed, air-dropped projectile during water entry. Moreover, there are few studies on the effects of combining surface hydrophilicity and hydrophobicity, water entry velocity and head shape on the development of water entry cavities or ballistic laws.
Scholars have carried out a great deal of research on the problem of vehicles entering water, but many research methods are not mature enough at present. Moreover, there no systematic experiment on the effects of the surface properties and head shape of a cylindrical vehicle on the evolution of cavitation and splashing during the water entry process has been carried out. However, the related issues urgently need to be resolved.
In this paper, five different head shapes of models of different surface properties will be analyzed based on water entry experiments, and the experiments were carried out at two different water entry speeds. Through the experiments, this paper will explore the influences of the vehicle head shape and the surface properties on the evolution of the cavitation and splashing during water entry. The structure of this paper is as follows. The second chapter mainly introduces the experimental platform, experimental model and related knowledge. The third chapter will mainly show the experimental results and analysis and discuss the experimental phenomena. The conclusions will be given in Section 4.
2. Experimental Platform and Model
2.1. Experimental Platform
The experimental platform consists of a water tank, a launching device, a lighting system and a high-speed camera system, etc., as shown in Figure 1. The materials of the experimental water tank are a steel frame and plexiglass. The size of the tank is 1.84 m × 1.2 m × 1.24 m, and the thickness of plexiglass is 20 mm. At the same time, three layers of rubber pads are laid on the bottom to prevent the model from directly hitting the bottom of the water tank and reduce the impact force on the experimental model. The launching device is composed of a gas storage tank, a solenoid valve, a solenoid valve signal line and a launch tube, etc., and is launched by an air cannon. The Phantom high-speed camera system was used for the image acquisition, with pixel dimensions of 1024 (H) × 1200 (V), a frame rate of 1000 fps and an exposure time of 100 us. The overall test system is shown in Figure 2. All experiments were carried out under standard atmospheric pressure, and the experimental water temperature was 23 °C. In this experiment, two different speeds assessed during the experiment were used, respectively, upon the release of the projectile head at a distance of 0.25 m from the free liquid surface in order to obtain the initial speed of 2.2 m/s, and the release at the distance of 0.8 m to obtain an initial speed of 3.95 m/s.
2.2. Experimental Model
In the experiment, five head form models with hemispherical angles of 0°, 57°, 70°, 90° and 180° [32] were designed, as shown in Figure 3, to study the influence of the surface properties on the water entry of the projectile. The experimental scale model of the underwater projectile was designed based on the MK46 torpedo and was made of aluminum, with the density rho = 2700 kg/m3. The overall parameters are shown in Table 1. Model parameters and the processing physical map are shown in Figure 4. All model materials were the same, and different surface treatments were used to ensure the model surface’s wettability.
As shown in Figure 5, is the radius of the model, is the radius of the head ogive and is the hemispherical radius of the head. Moreover, is the angle between and , defined as the cone apex angle of the head ogive, and is the hemisphere angle, which is the angle between and the axis of the head shape. The following geometric relationships exist between them [33]:
In addition, a parameter is defined to describe the ratio of the hemispherical arc to the head line:
The hydrophilicity and hydrophobicity of the surface can be expressed by the contact angle between the liquid and the surface. When the liquid surface is in contact with the solid surface, the angle between the tangent of the liquid surface and the solid surface is the surface contact angle θ. As shown in Figure 6, θ ≥ 90° means that the solid surface has a repulsion effect on the water, which is called a hydrophobic surface, while θ ≤ 90° means that the solid surface has a certain affinity for the water, and the liquid spreads easily on the surface. Such surfaces are called hydrophilic surfaces.
2.3. Spraying of Hydrophobic Coating
The surface of the model is treated with a hydrophobic layer, and the contact angle is measured by using a camera to photograph the water droplets on the model of the hydrophobic surface. As shown in Figure 7, the measured surface contact angle θ = 126.3°, and the model surface has a high hydrophobicity at this angle. The model without surface spraying was used as a comparison to obtain the effects of surface properties on the water entry cavity.
The influences of surface hydrophilicity and hydrophobicity on the water entry process are the focus of this study. In this paper, the polished original surface was used as the hydrophilic surface, and the hydrophobic surface was obtained by spraying it with the hydrophobic coating Ultra-Ever Dry.
Ultra-Ever Dry uses unique nanotechnology to form an air protection film on the surface of the object that can prevent the erosion of water, oil and other liquids and has the characteristics of moisture resistance, corrosion resistance, freezing resistance, pollution prevention and the capacity for self-cleaning. To apply this technique, treat the surface before spraying with alcohol and acetone to remove oil, dust and other debris so as to ensure the even adhesion of the substrate. Ultra-Ever Dry sprays are divided into bases and topcoats. Avoid wet environments during spraying, and spray back and forth thinly. After the bottom layer has been sprayed, wait at least 30–60 min before spraying the top layer. The topcoat will be a hazy white color when sprayed and cured. It will show superhydrophilicity after about 15–30 min and reach the best performance after 2 h.
3. Results and Discussion
The water entry process generally refers to the progression from the moment when the head of the underwater projectile makes contact with the water surface to the time when the torpedo is completely wet, which is divided into the shock wave stage, flow formation stage, cavity open stage, cavity closed stage, cavity collapse stage and full wetting stage.
The following is an example of the process of water entry of a model with a hemispherical angle β = 57° at the speed of 12.45 m/s and an impact angle of 60°, used to show the general process of the projectile entering the water. As shown in Figure 8a, the model water entry process has passed the shock wave stage and is in the flow formation stage. The model interacts violently with the free liquid surface, and the surrounding fluid forms a sputtering flow that sputters horizontally outward. This sputtering flow expands radially, and as the model falls, the sputtering flow diverges outward in the horizontal direction. It gradually turns upward, forming an upward spray of the liquid surface. As shown in Figure 8b, the model head completely penetrates the free liquid surface and forms an open cavity. At this stage, during the falling process of the model, through the exchange of kinetic energy, the surrounding fluid gains the radial expansion speed, so that the opening diameter of the cavity gradually increases and expands below the free liquid surface. The water entry cavities increase rapidly in both the lateral and vertical dimensions, and at this time, the entry cavities remain open and are connected to the external atmosphere. As shown in Figure 8c, as the model continues to fall, under the combined actions of the hydrostatic pressure and the change in the internal pressure of the cavity, the outward expansion speed of the cavity slows down and changes direction. The scale begins to shrink and the cavities close. As shown in Figure 8d, the vacuoles are divided into upper and lower parts. The upper cavity moves to the free surface, and the volume gradually decreases. The lower cavity follows the model and continues to fall and gradually collapse.
In this paper, the free liquid surface, at rest, is defined as the position zero-point z = 0 mm, and the time when the model head makes contact with the free liquid surface is the time zero point t = 0 s.
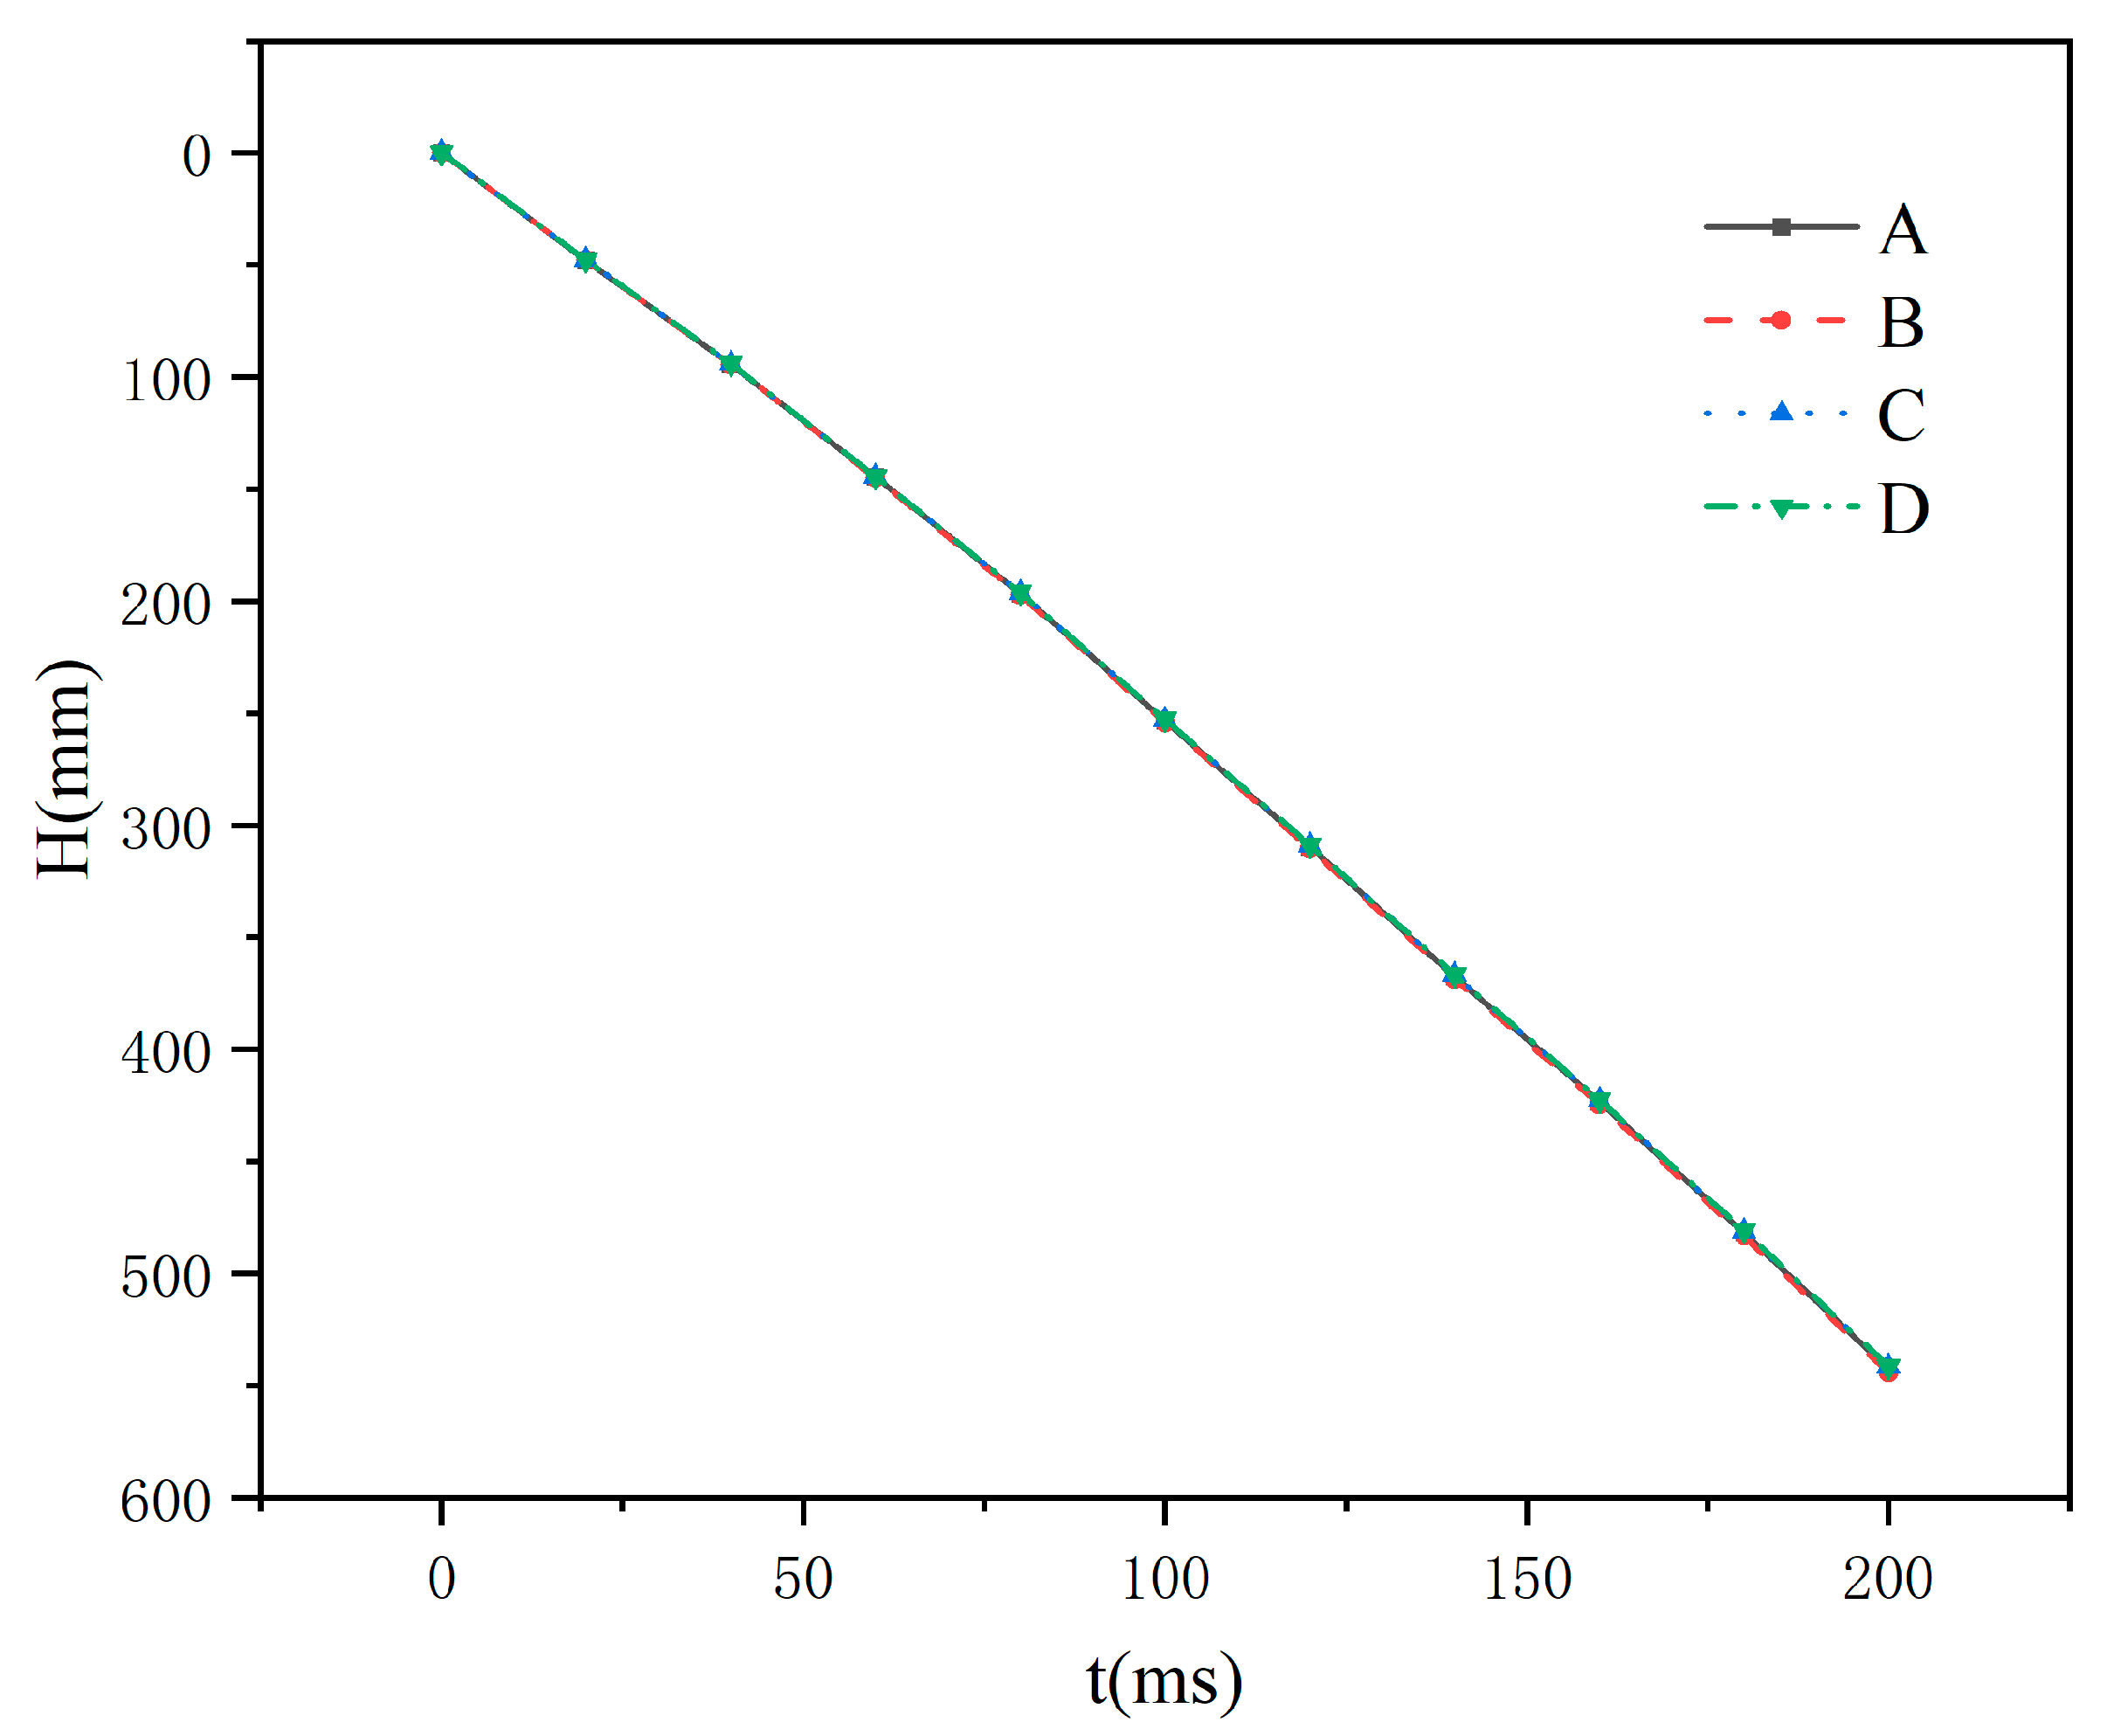
Before the official start of the experiment, we used a 90-degree hemispherical angle hydrophobic surface projectile model to conduct four sets of repeated experiments and used a high-speed camera to take pictures of four sets of projectiles entering the water at an initial velocity of 2.2 m per second, and then measured and compared the results. We found that the error in the depth position of the projectile at the same initial speed was less than 1%, as shown in Figure 9. This shows that our experimental device was normal, the experimental environment was reliable and the experimental results are credible.
3.1. Influences of the Surface Properties and Head Shapes on the Splash Profile
Considering that the water entry velocity has significant effects on the splash and cavity morphology of the vertical entry, the water entry velocity and surface properties affect the model splash and cavity in a coupled manner. In this paper, two release heights were proposed for the low-speed vertical experiment, which were 20 cm and 80 cm, respectively. For each height, the models of the five types of hydrophilic heads and five types of hydrophobic heads were subjected to water entry experiments. The corresponding water entry motion parameters are shown in Table 2.
In the table, is the water entry velocity; is the dynamic viscosity of the water; is the surface tension coefficient of the water; is the acceleration of gravity; is the maximum cross-sectional diameter of the model; and is the density of the water.
Through experimental observation, it was found that no clear splashing of the hydrophilic model could be identified when it entered the water, especially when the water entry speed was low. When the water entry height was 20 cm, during the model’s entry into the water, only a small splash along the surface of the sailing body occurred when the model first entered the water, and a small mass of water splashed after the entire model entered the water.
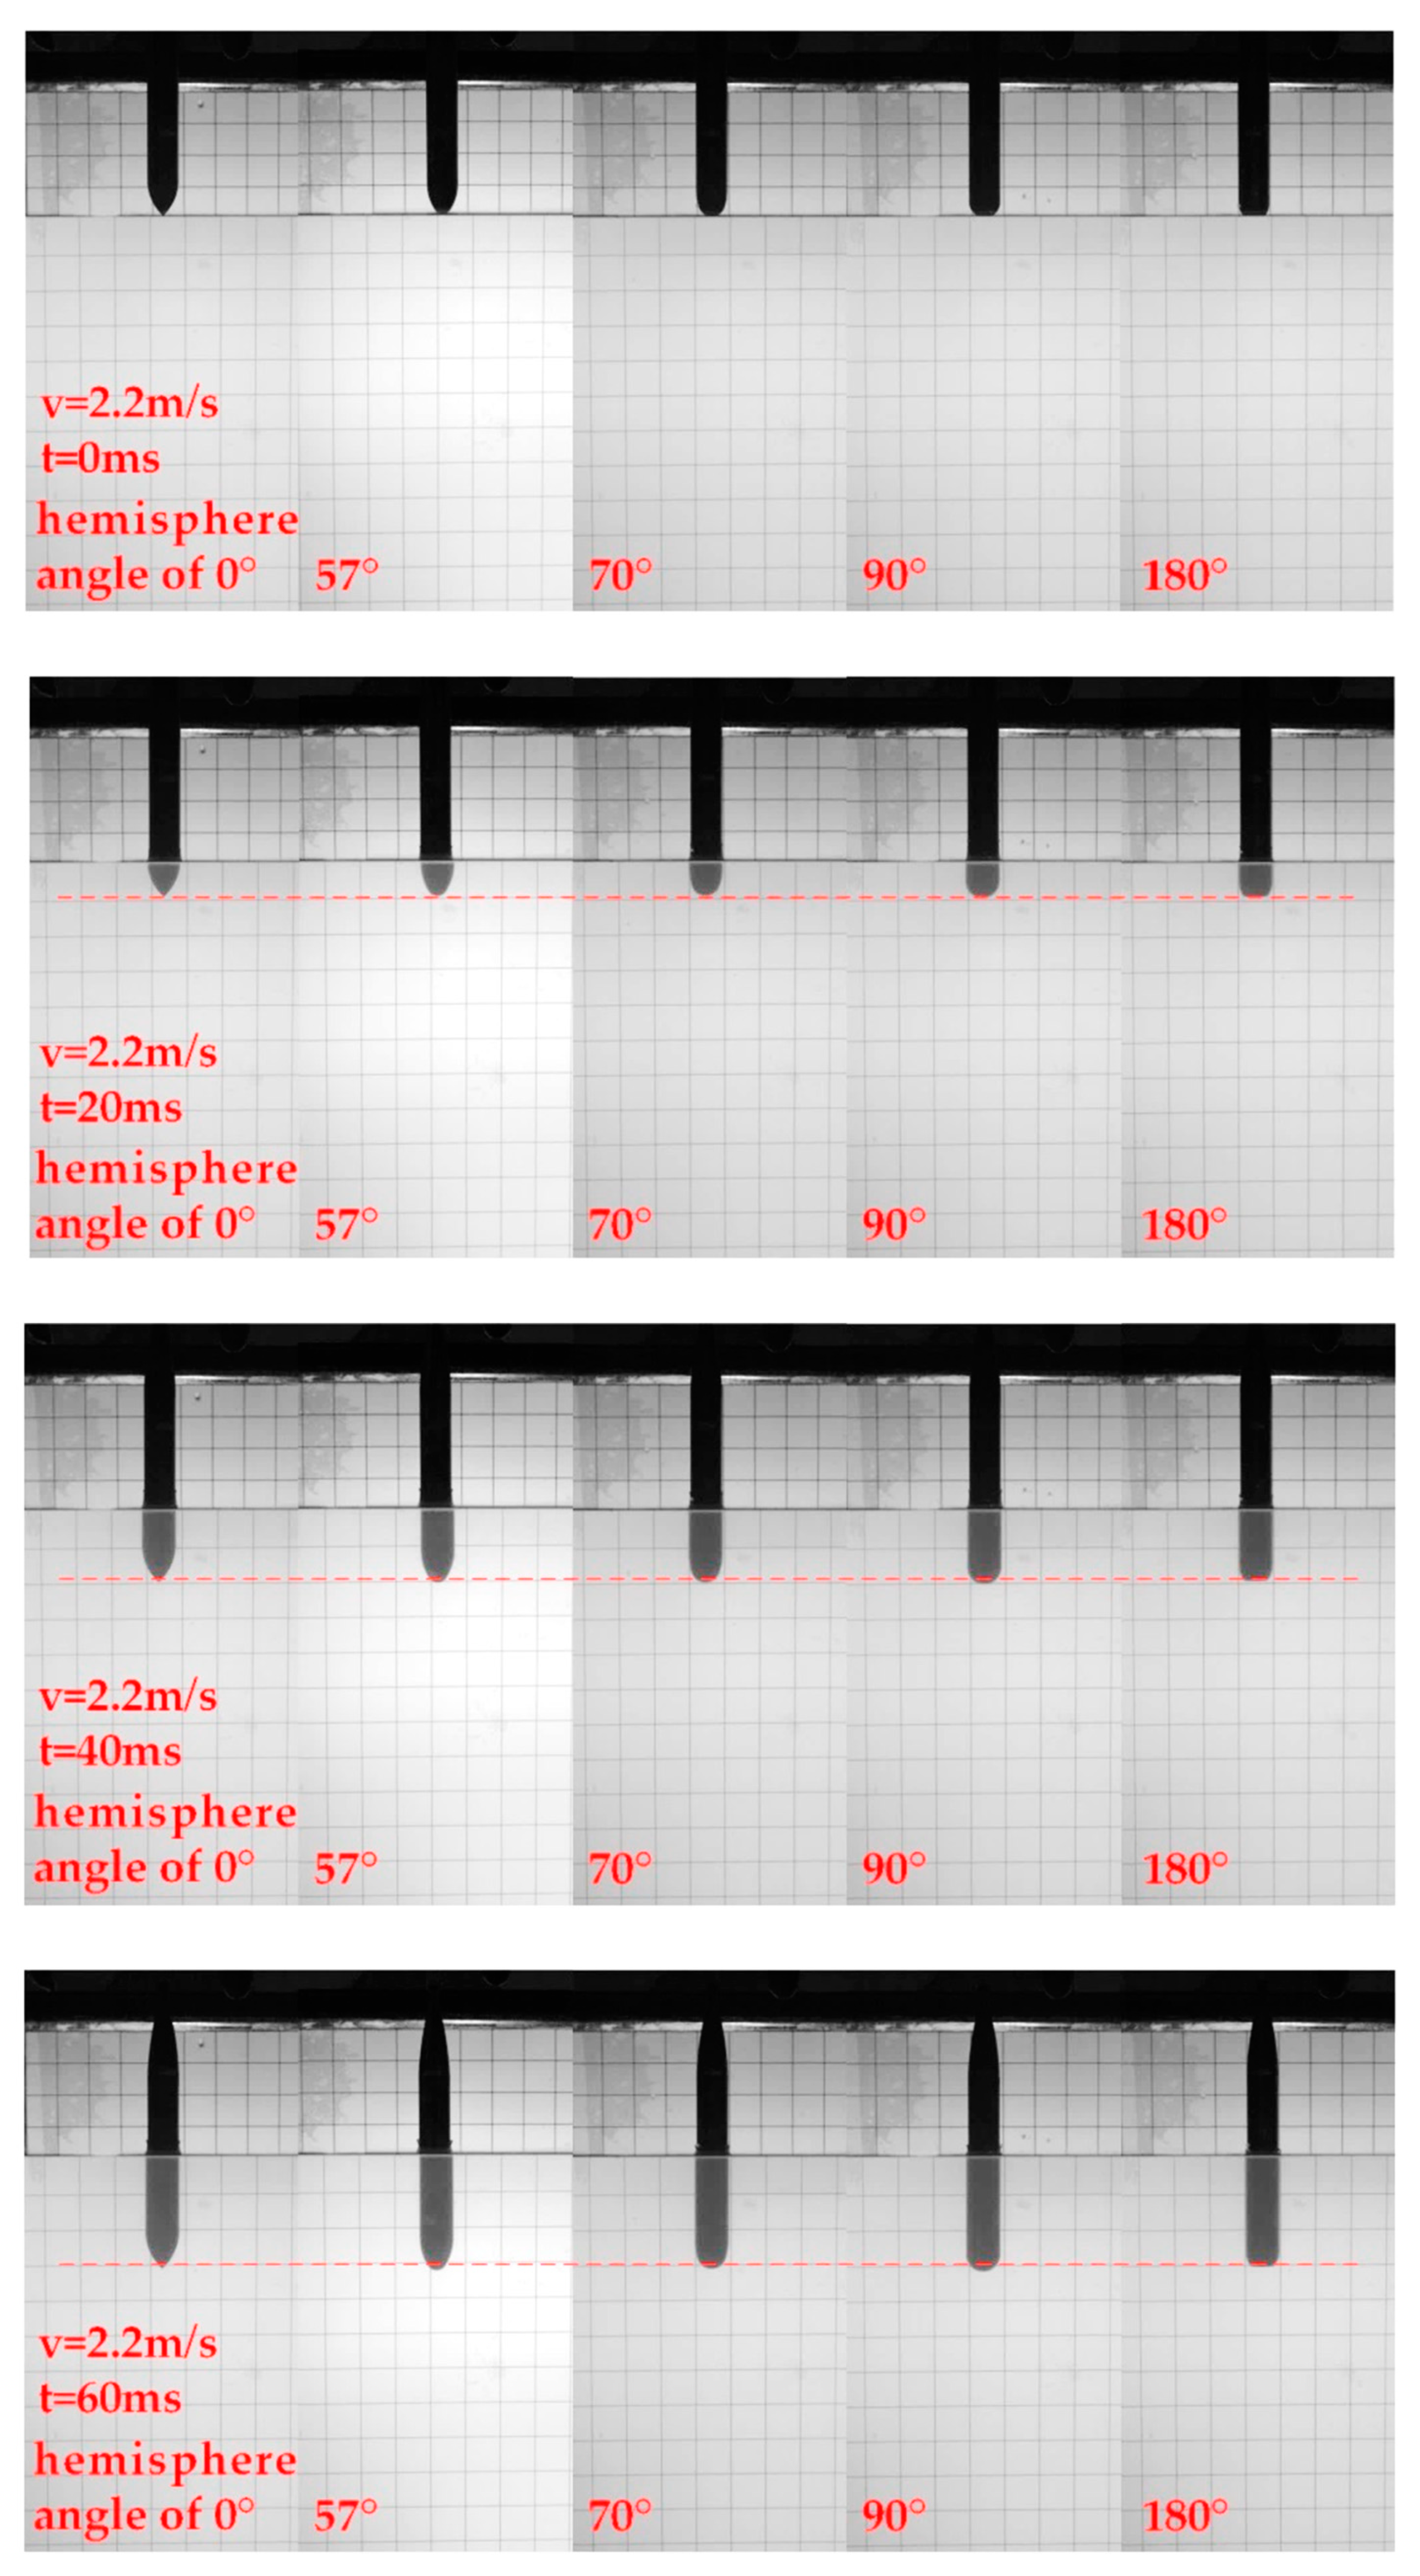
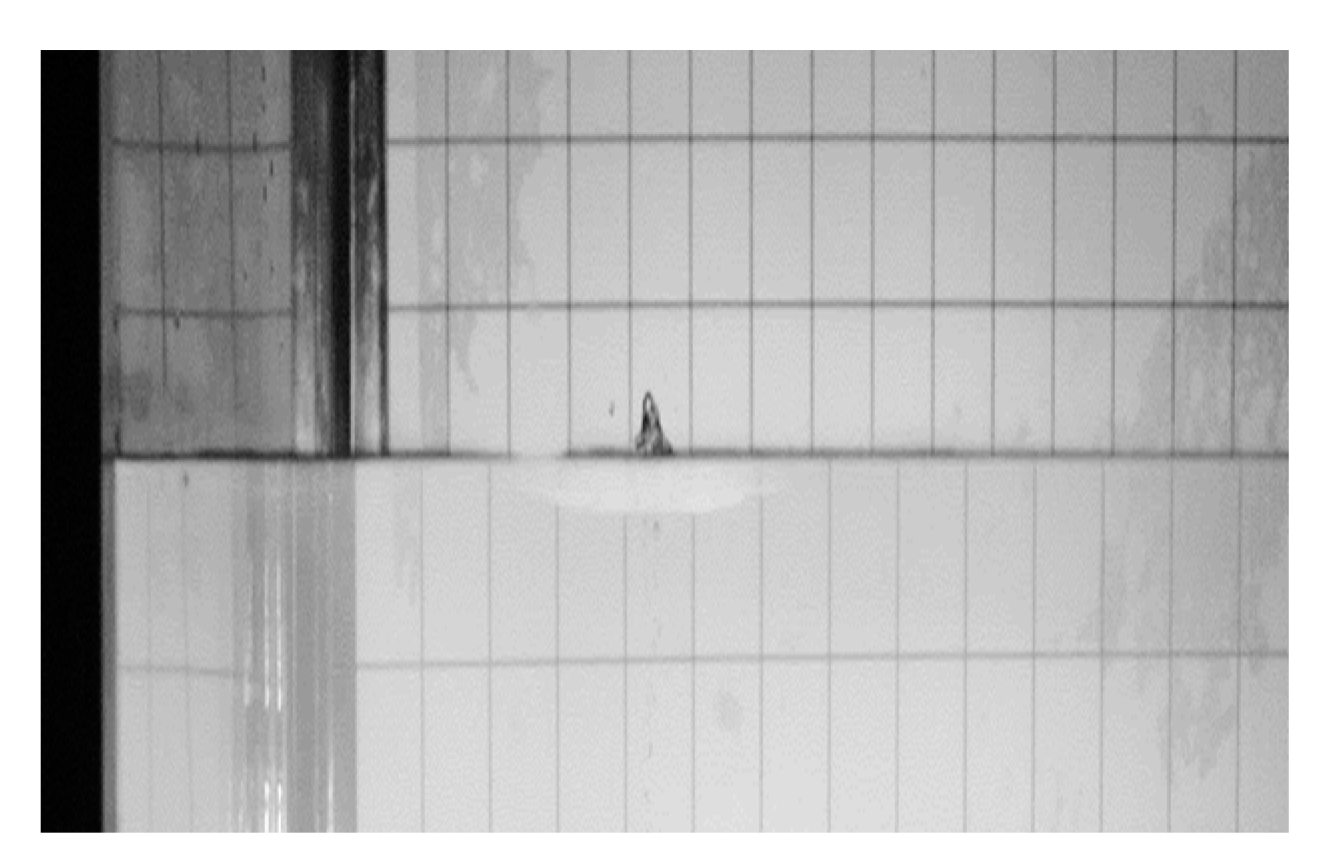
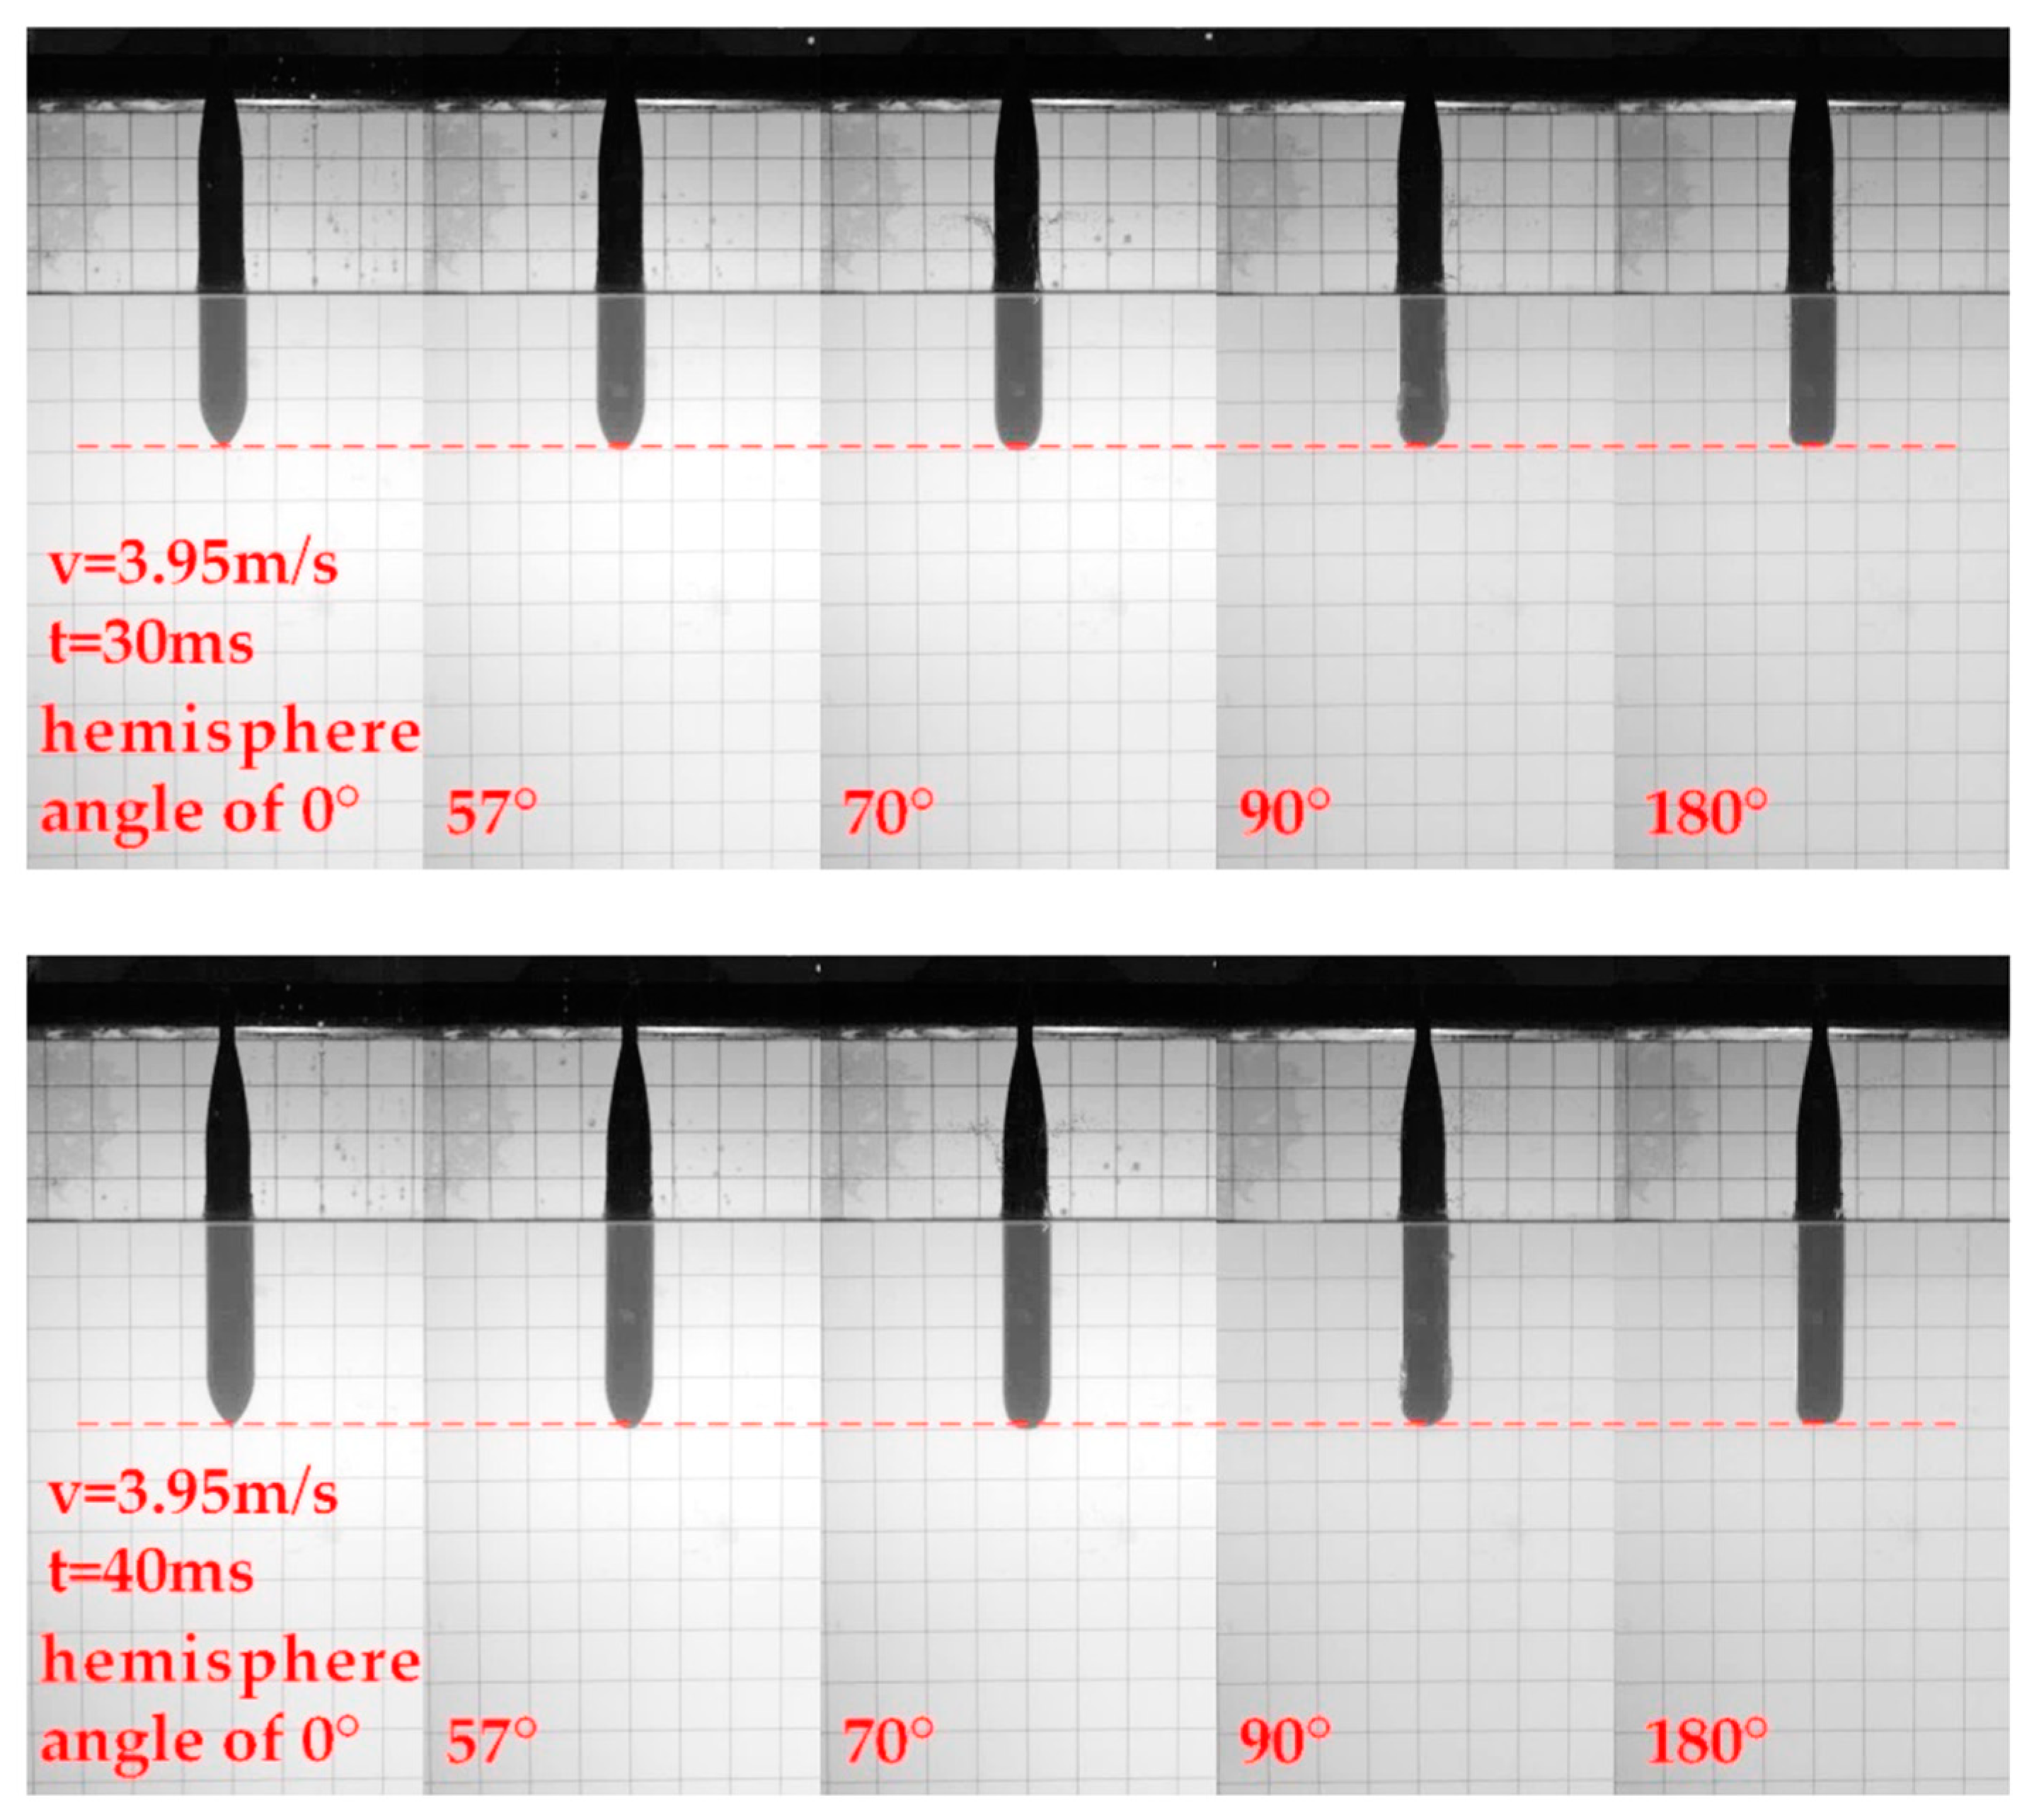
Figure 10 is an image of the experimental process of the model of the hydrophilic surface entering the water vertically. The hemispherical angles of the model are 0°, 57°, 70°, 90° and 180° from left to right, and the water entry speed is 2.2 m/s. During the water-entry process, a jet slowly rises along the model, and the water at the top of it bends slightly outward. After the jet reaches the highest point, it begins to descend in the horizontal direction. As the model continues to fall, a small swell of water will appear on the water surface, as shown in Figure 11, until the model is completely submerged. Figure 12 is a chart comparing the splashing of the water for hydrophilic models with different hemispherical angles at a water entry height of 80 cm. Compared with the hydrophilic model with an initial velocity of 2.2 m/s, when entering the water at 3.95 m/s, the top of the splashing water expands outwardly to a greater extent. When the hemispherical angle is 0° and 57°, the splashed droplets in the water are relatively thin and gradually disperse into water mist. After 10 ms, the splashed droplets are thin to the extent that they are almost non-existent. In the early stage, it can be observed that there is a conical water curtain around the model, and then the splash becomes thinner as it expands upward and outward and finally disappears into the air. After the middle of the model enters the water, it splashes to create a jet, just as when the model first entered the water at a speed of 2.2 m/s, as shown in Figure 13.
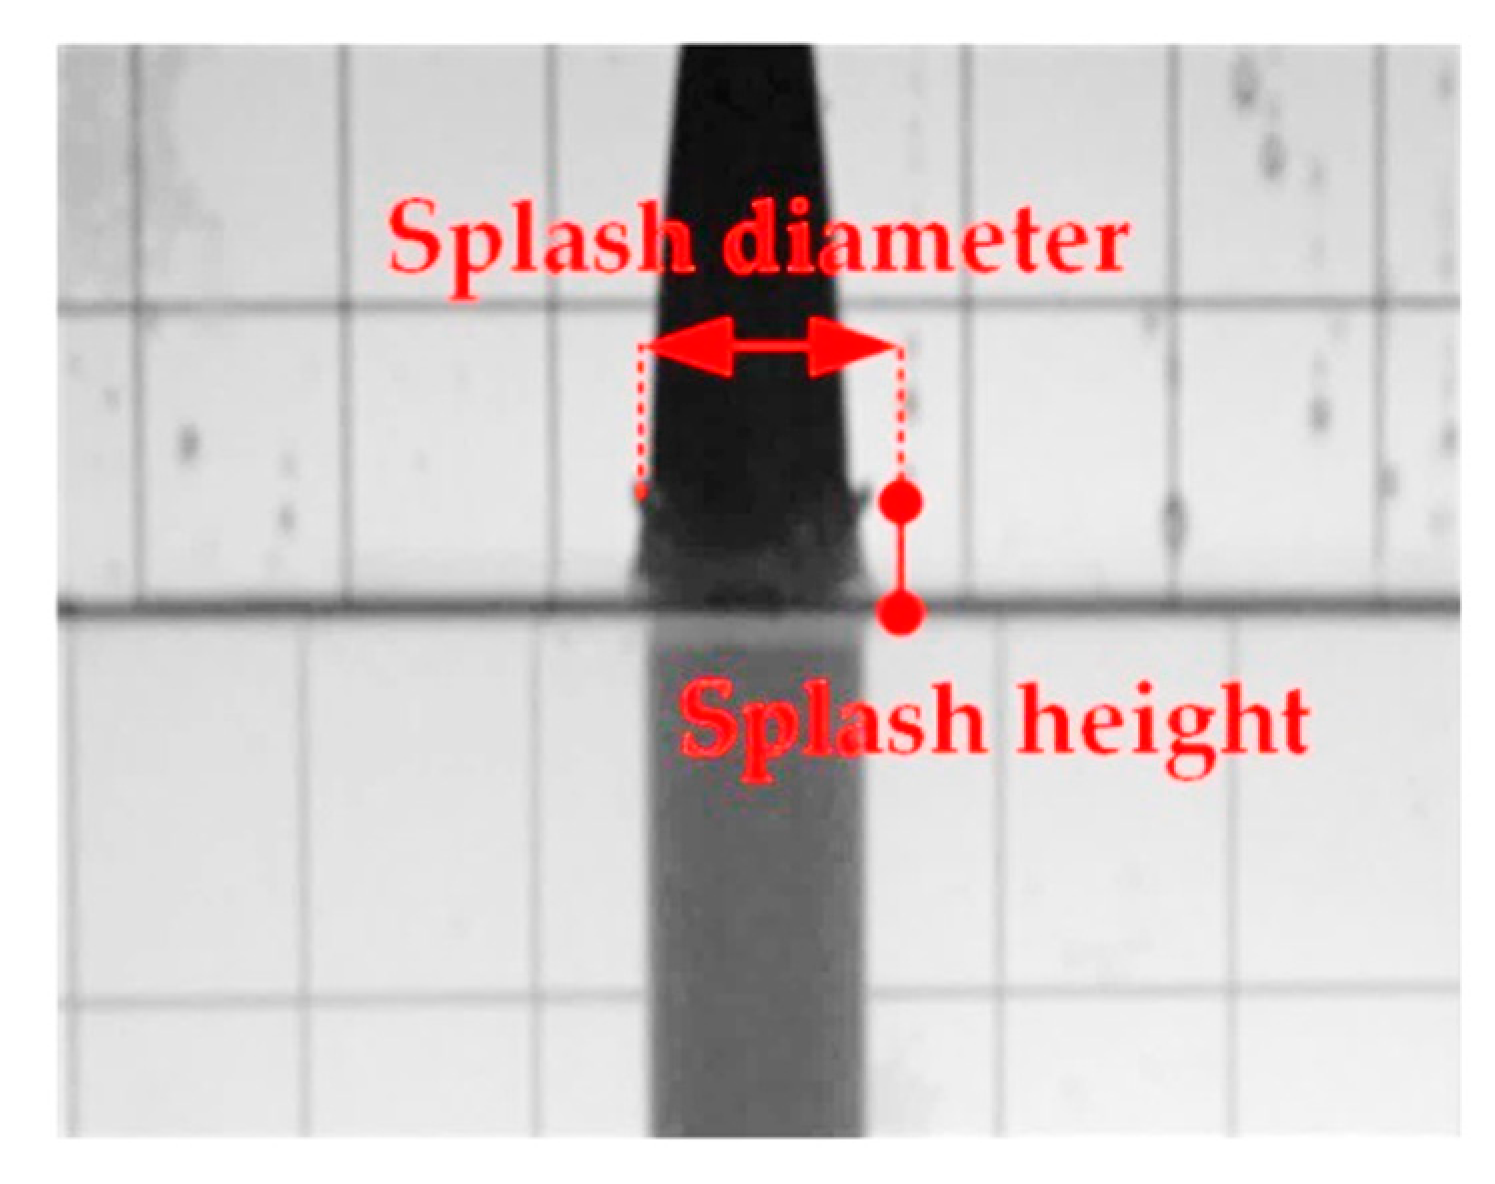
Since the splash of the hydrophilic model cannot be observed clearly, the position of its highest point is measured here as the splash height, and the farthest horizontal distance from the top of the splash is the splash diameter. Among these parameters, at 3.95 m/s, since the splash spreads out, the highest point at which the splash does not spread out was selected in order to measure the data. The data obtained are summarized in Table 3.
At 2.2 m/s, the maximum height of the splash is basically about 20 mm and it takes longer to reach the maximum height when the head shape is 0° and 57°, indicating that the smoother head shape is more prone to splashing. At 3.95 m/s, due to the high speed, the maximum splash height of the latter three head types is significantly greater than that of the first two. Thus, the time taken is not significantly less than that of the first two, or even longer. However, from the perspective of the degree and size of the splash, the latter three head types are more likely to generate splashes, and of the three head types, the 180° head type has a weaker ability to generate splashes.
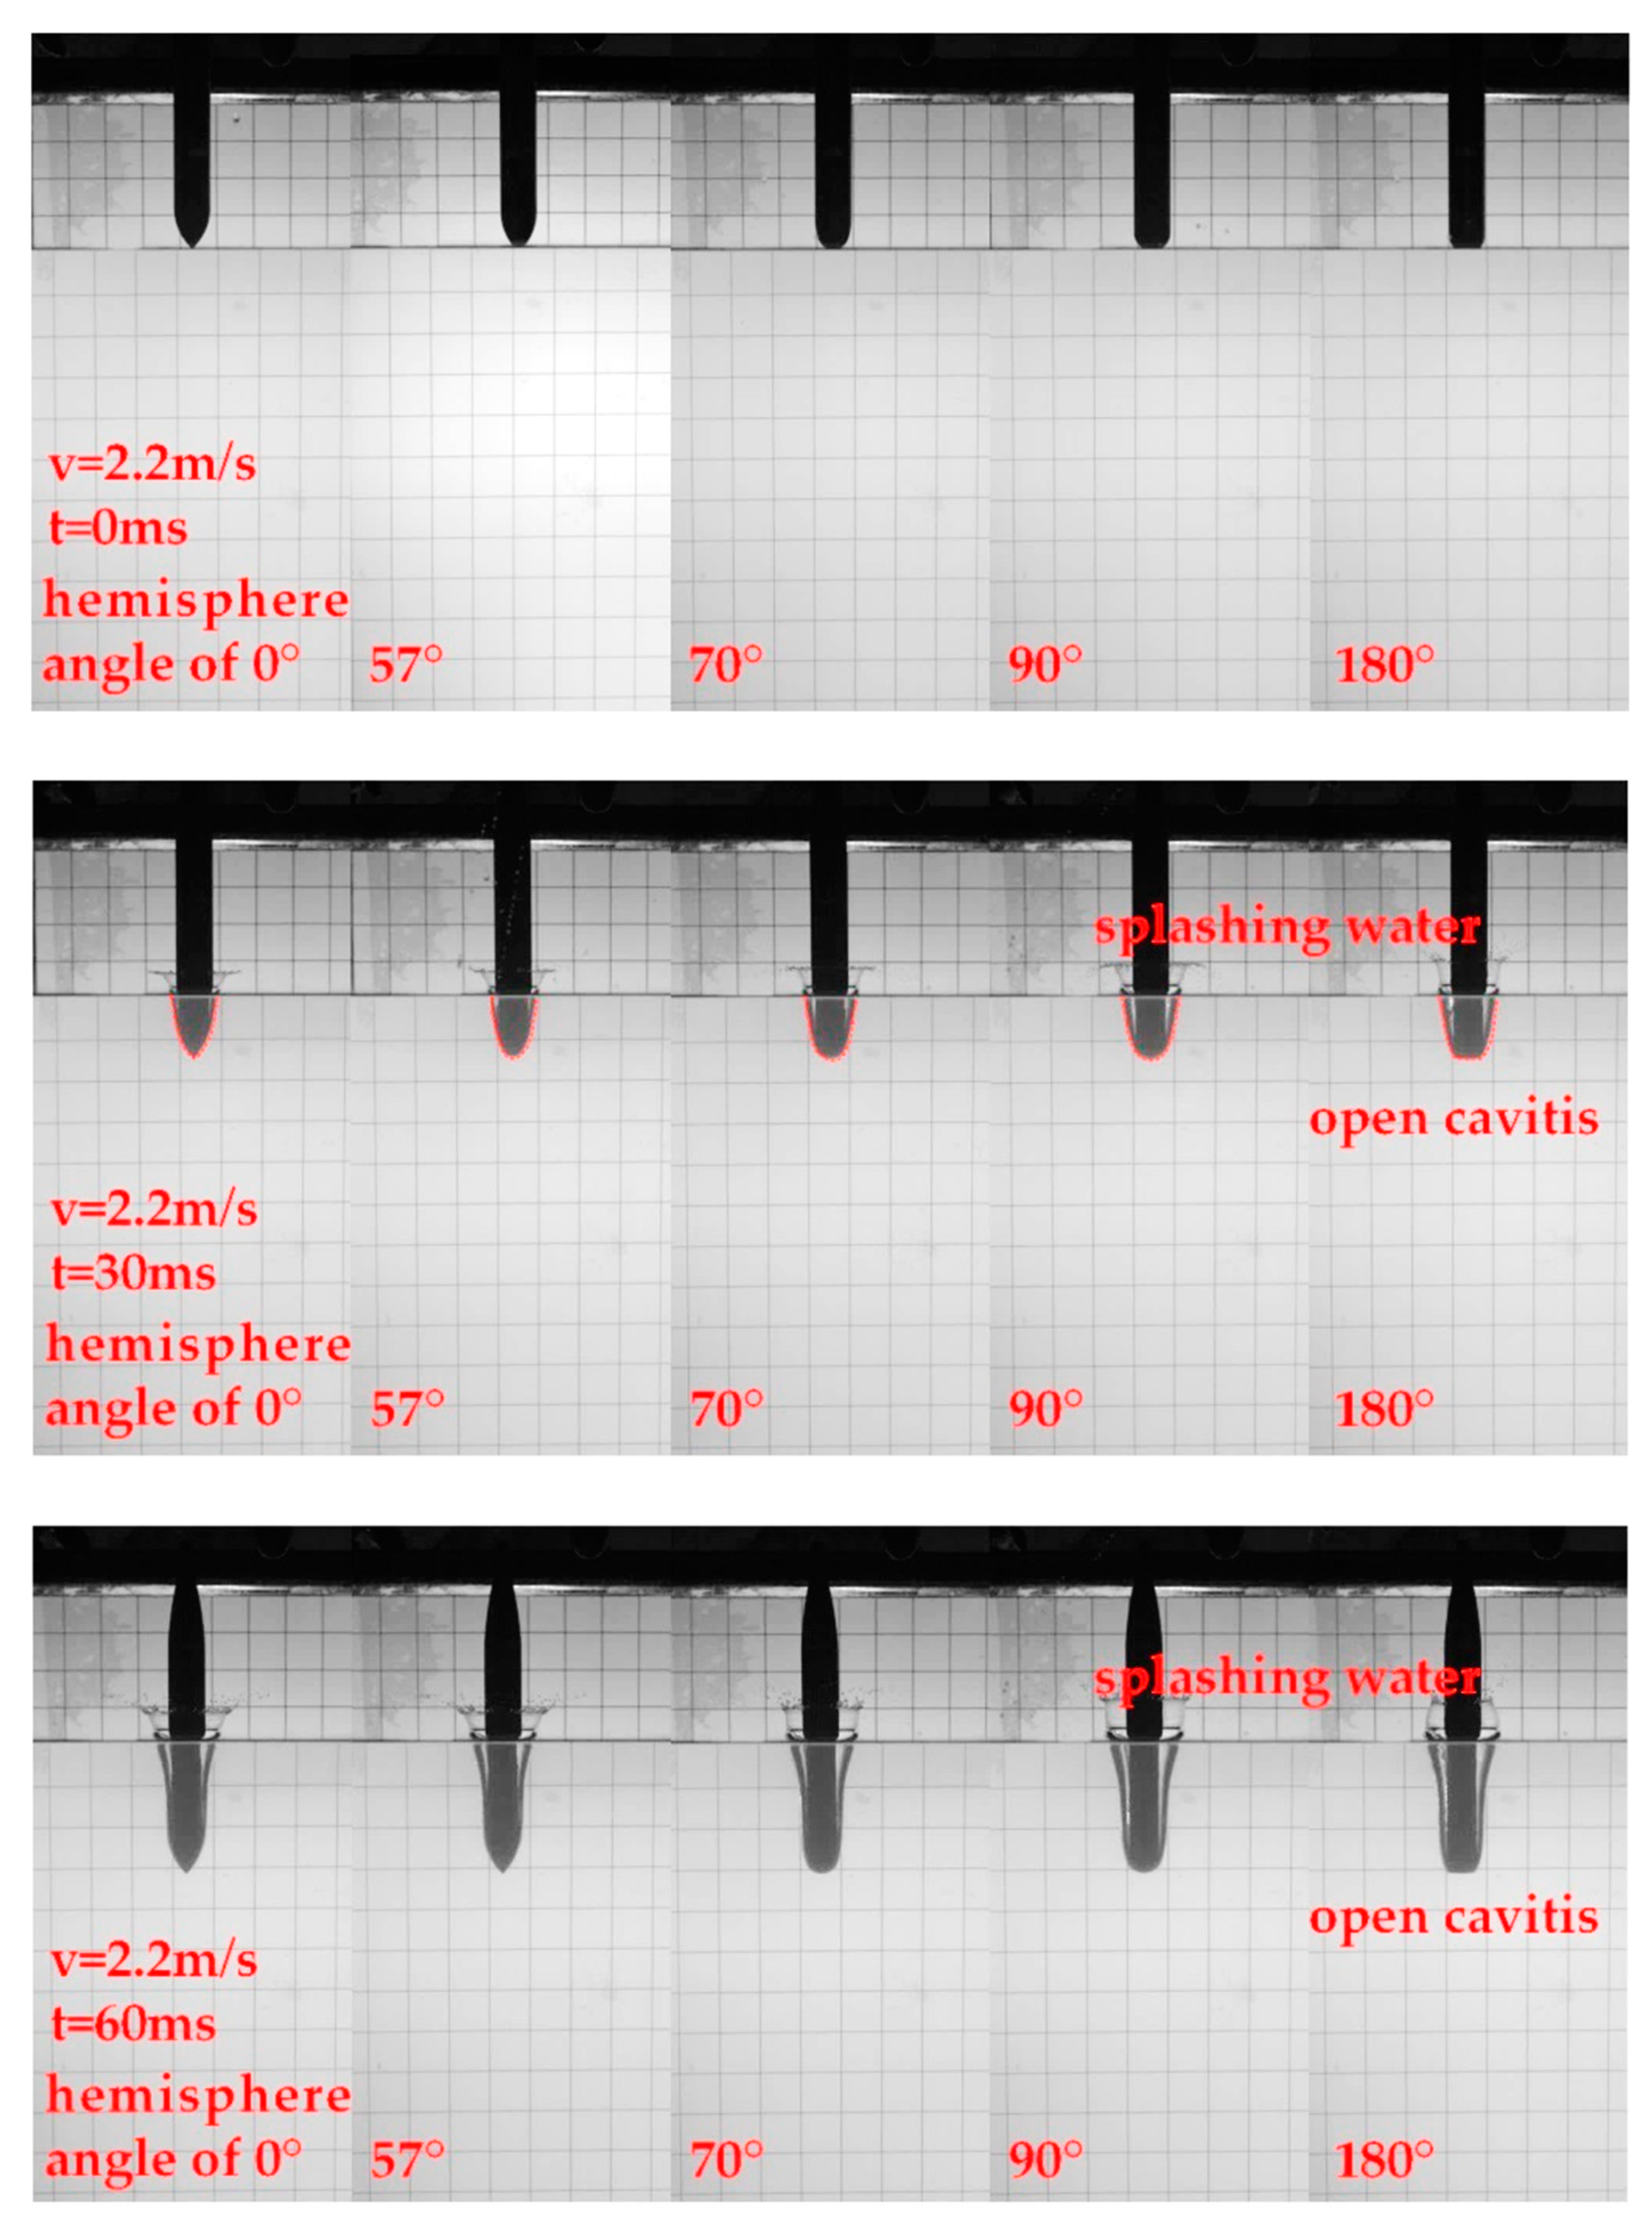
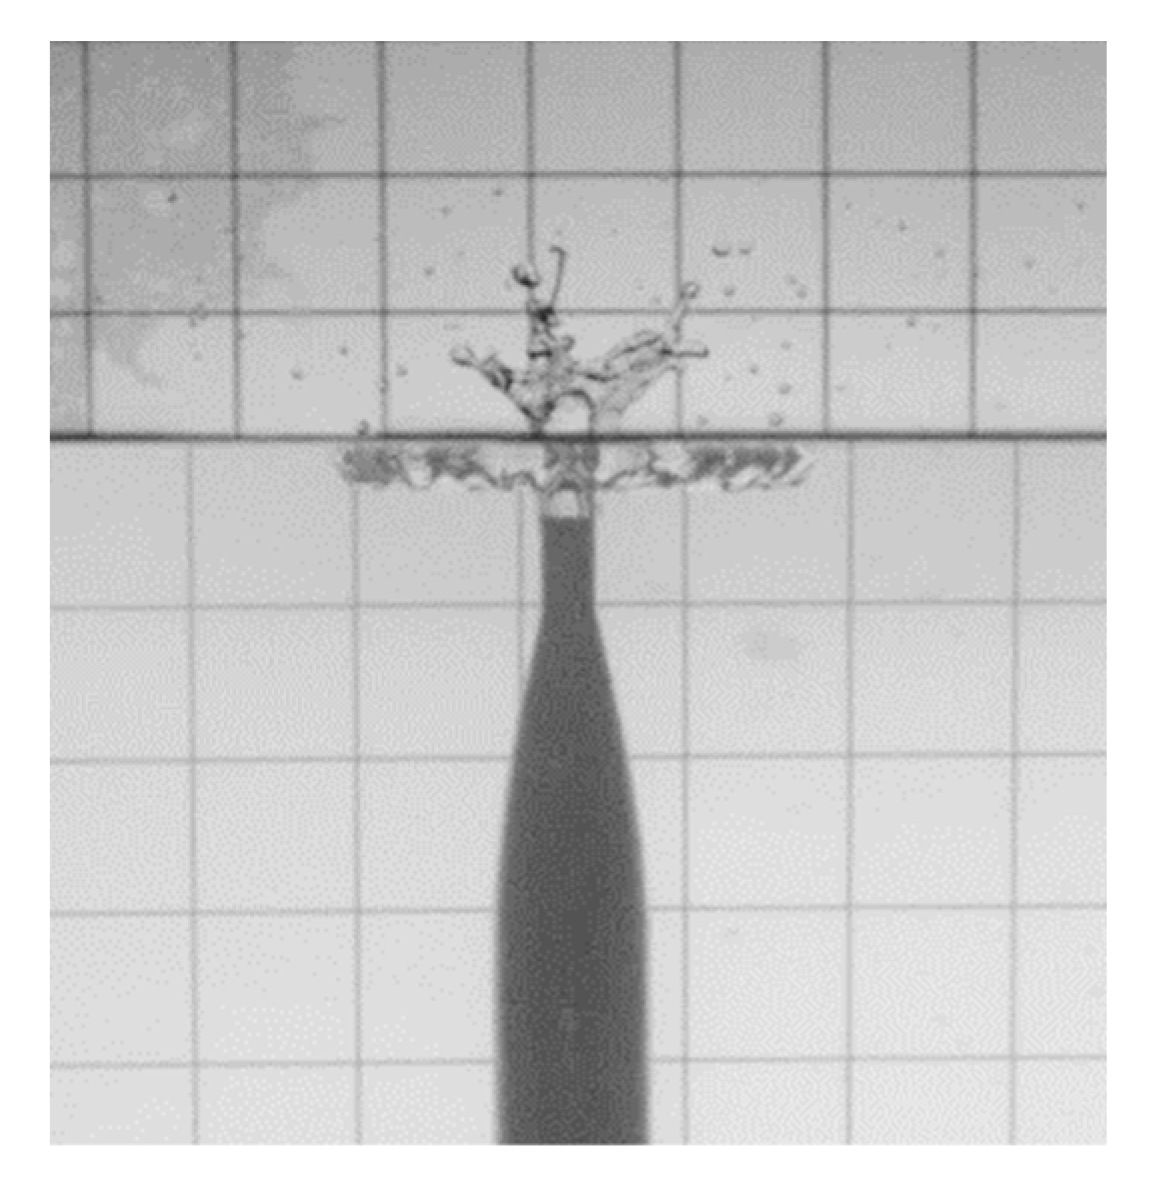
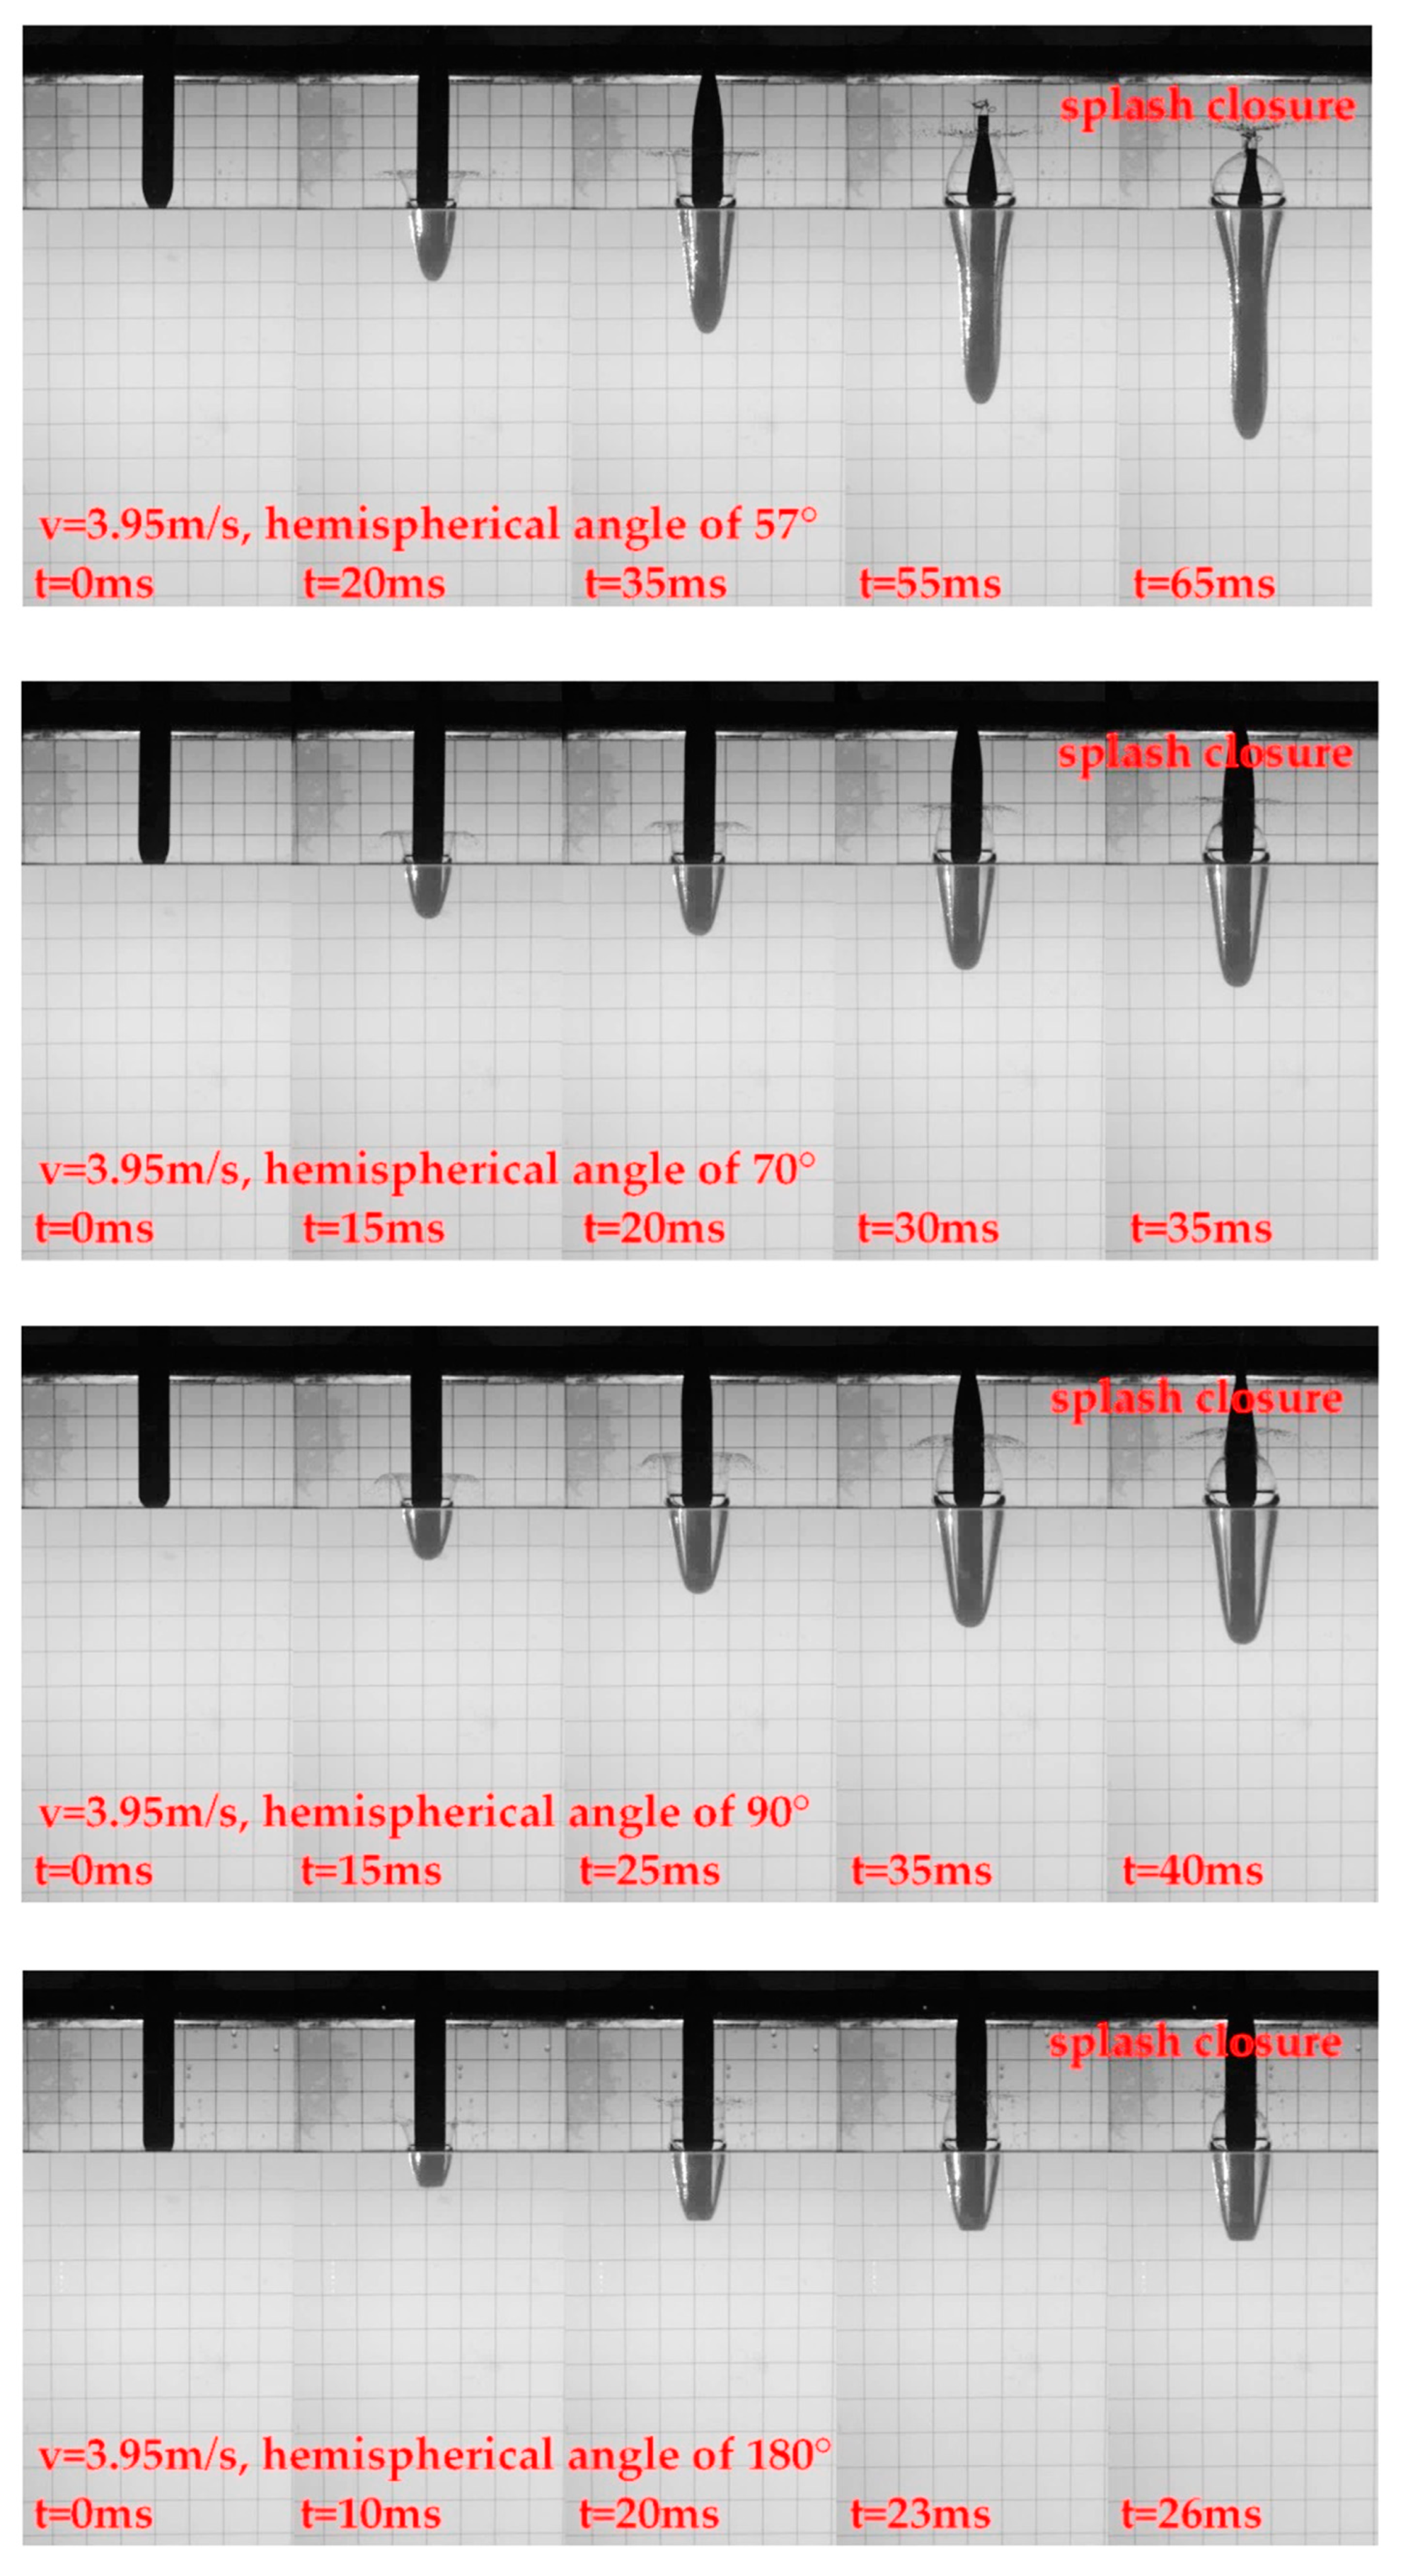
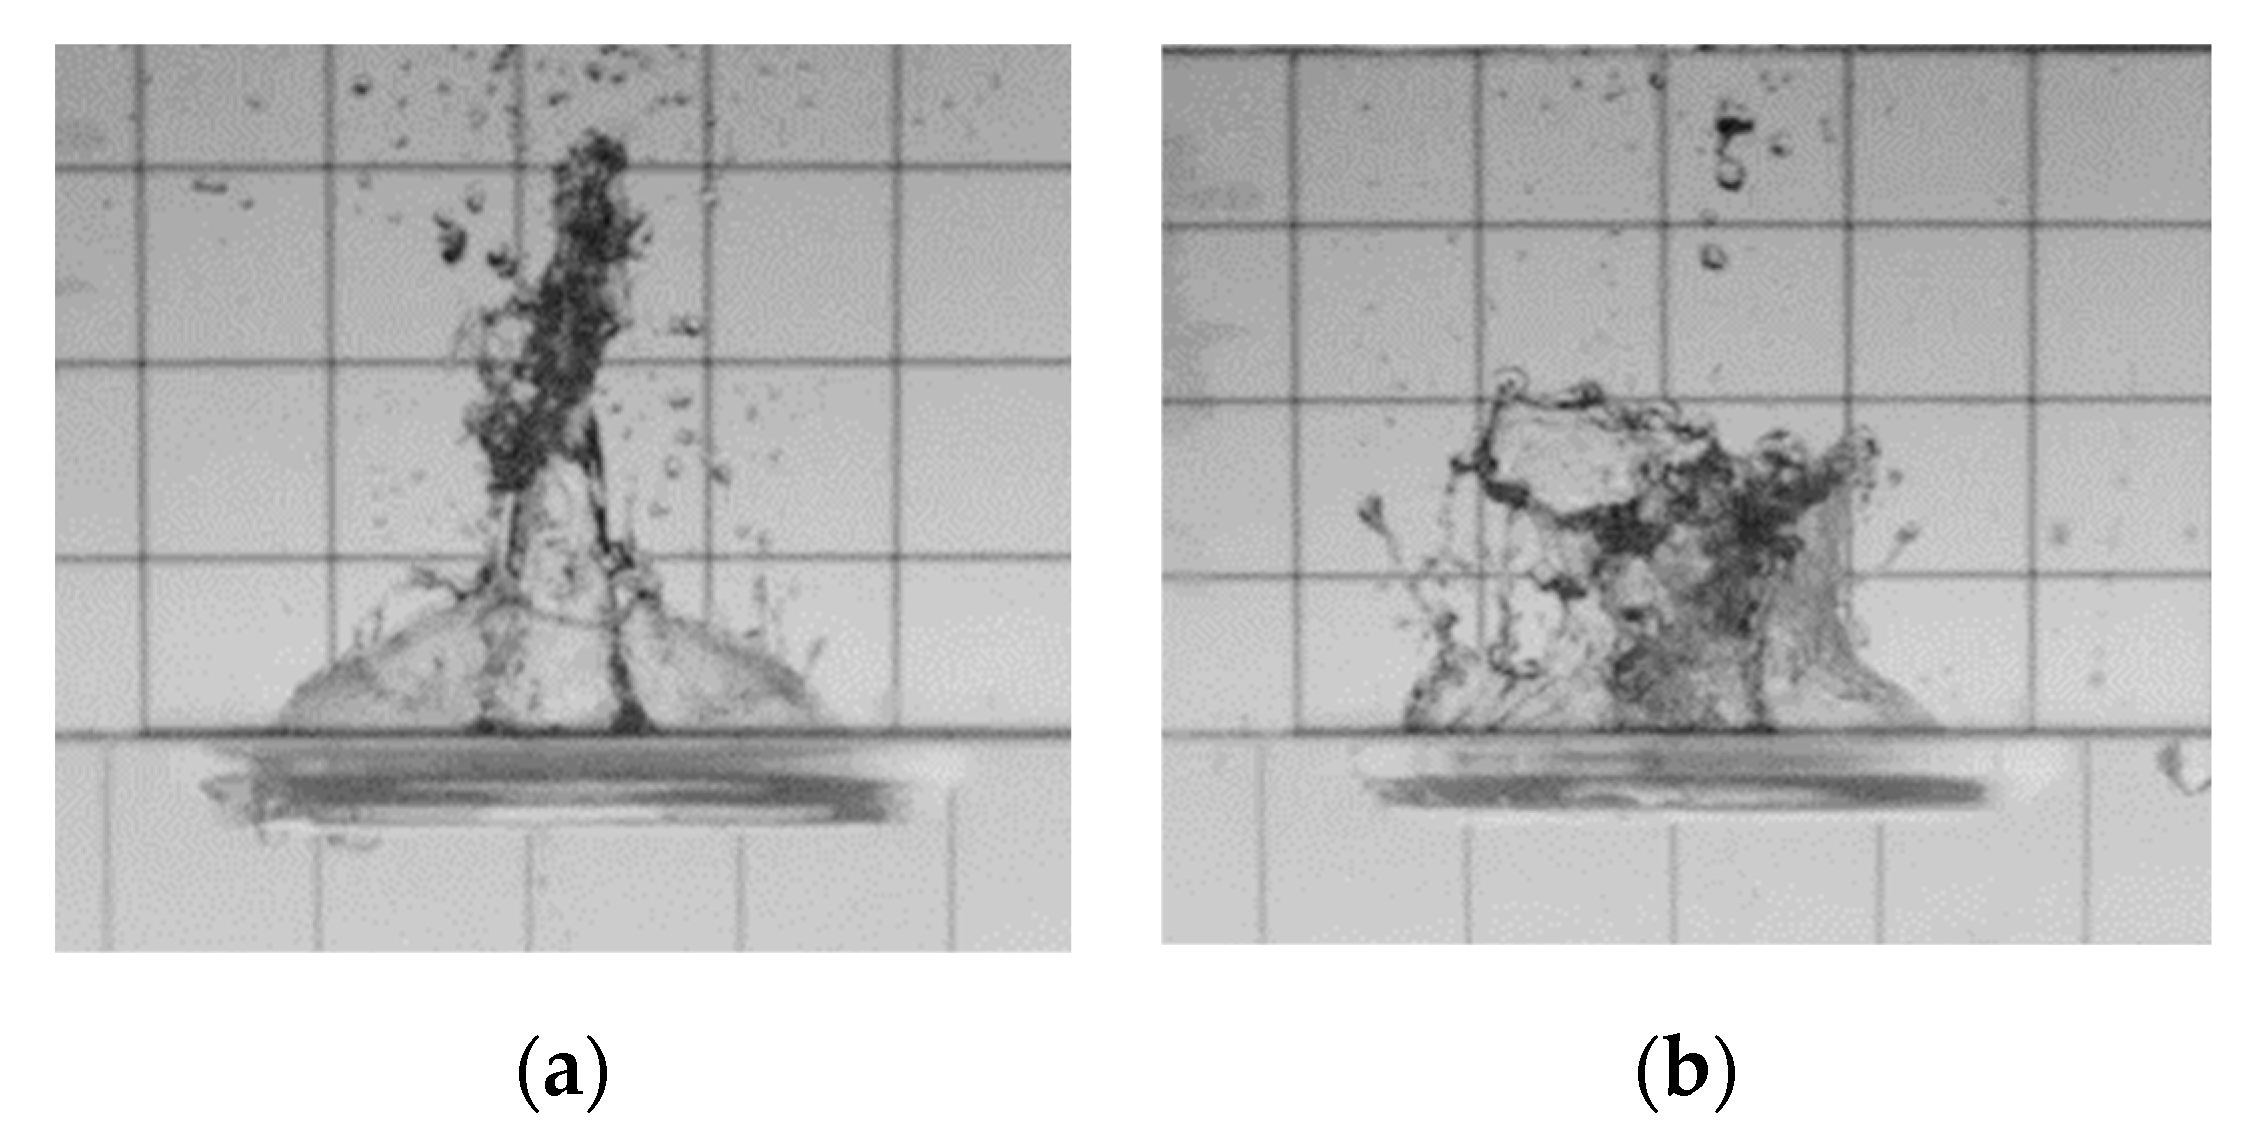
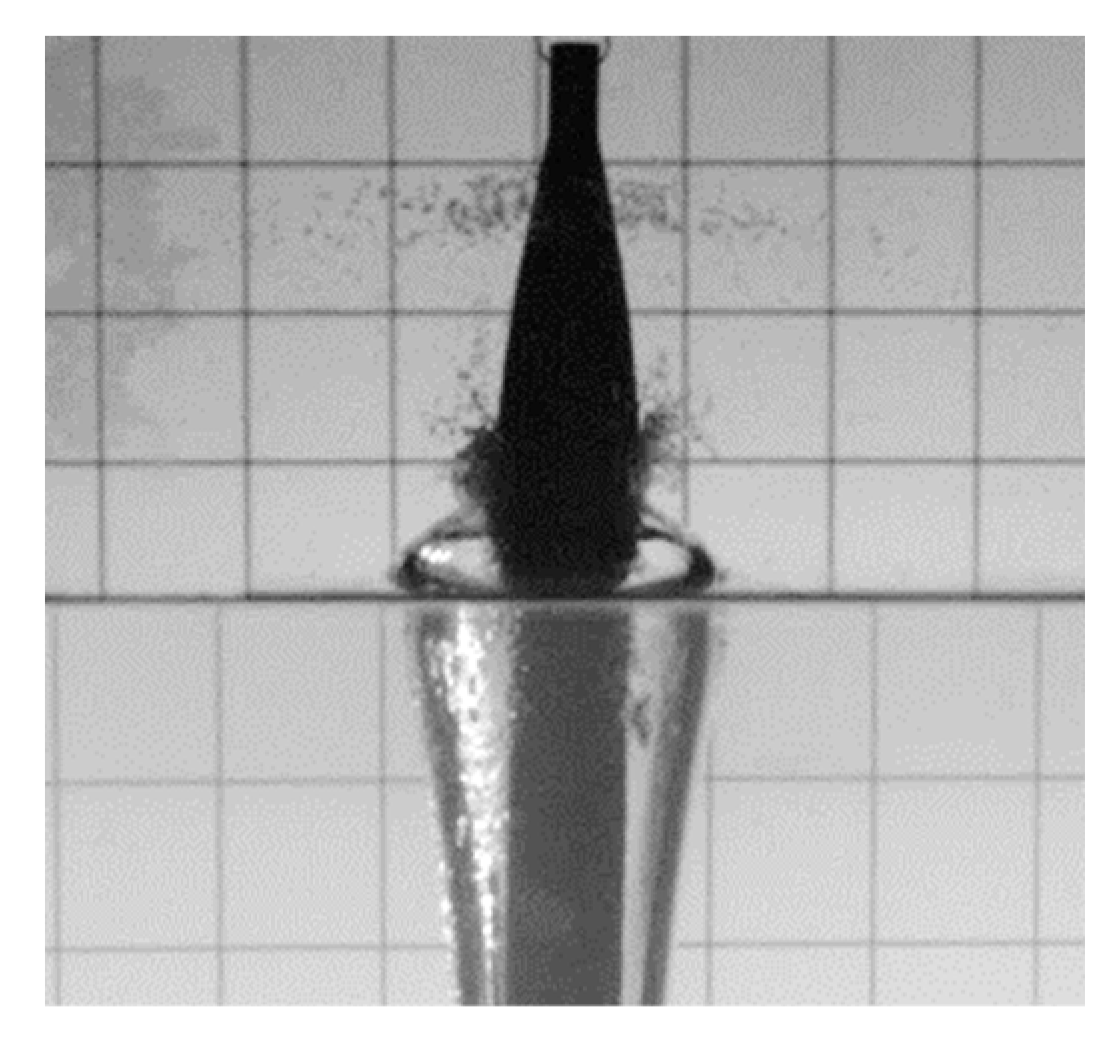
As shown in Figure 14, it is the experimental image of the model of the hydrophobic surface entering the water vertically. The hemispherical angles of the model are 0°, 57°, 70°, 90° and 180° from left to right, and the water entry speed is 2.2 m/s in each case. When t = 30 ms, the water splashes and the five working conditions are all conical. That is, the diameter of the circle at the top of the splash is the largest, and the diameter that is closer to the horizontal plane is the smallest. Then, in the case of 0° and 57° hemispherical angles, both the upper and lower circumferences of the splashes expand, so that the splashes maintain a conical state. For the other three cases, the splash shape becomes cylindrical (the same size at the top and bottom) over time. Among them, in the case of 90°, after the splash becomes cylindrical, it shows an inconspicuous arc shape (large in the middle and small at both ends). In the case of 180°, the shape of the arc is evident, and the shape of the cone appears after the arc shape (large at the bottom and small at the top). In all five cases, the splash quickly fell to the base level after rising to the highest point. After 120 ms, there is a more obvious splash (as shown in Figure 15) due to the smaller diameter of the tail end of the model. Figure 16 shows the experimental process of the hydrophobic surface model entering the water at an initial velocity of 3.95 m/s. Since the splash occurrence times of the five head types are quite different, the splash occurrence processes of each head type are listed separately. Under the five head types, the splash is initially conical, and then the shape of the splash becomes cylindrical. Then, the top of the splash necks down slightly and reaches the highest point during necking. When the diameter is 0 or 40 mm, the droplets above it are broken and scattered, and the lower part is hemispherical. With the increase in the hemispherical angle, the development time of the splash basically decreases. When the hemispherical angle is 0° and 57°, after the splash closes above the model, it maintains a hemispherical shape and gradually falls. The cavity at the tail of the model rises after falling off, and this impact means that the height of the splash is basically unchanged. Afterwards, a secondary splash that penetrates the cavity and the splash rushes upward from the bottom of the tail cavity. When the hemispherical angle is 0°, only the semi-spherical splash appears to be penetrated, and the semi-spherical splash continues to fall to the water surface (as shown in Figure 17a). In the case of a hemispherical angle of 57°, the splashes break apart under this impact (as shown in Figure 17b). In the other three hemispherical angles, the development time of the splash is short, and the model is not under the splash when the splash necks, so that the top of the splash fits the model. Then, it falls with the splash, and many fine droplets splash out at the point of connection between the splash and the model (as shown in Figure 18). When the model drops below the splash, the splash becomes a complete hemisphere and continues to fall. A slight difference from the first two hemispherical angles is observed, as the rise of the tail cavity causes the hemispherical splash to rise slightly, and then the splash is broken by the impact.
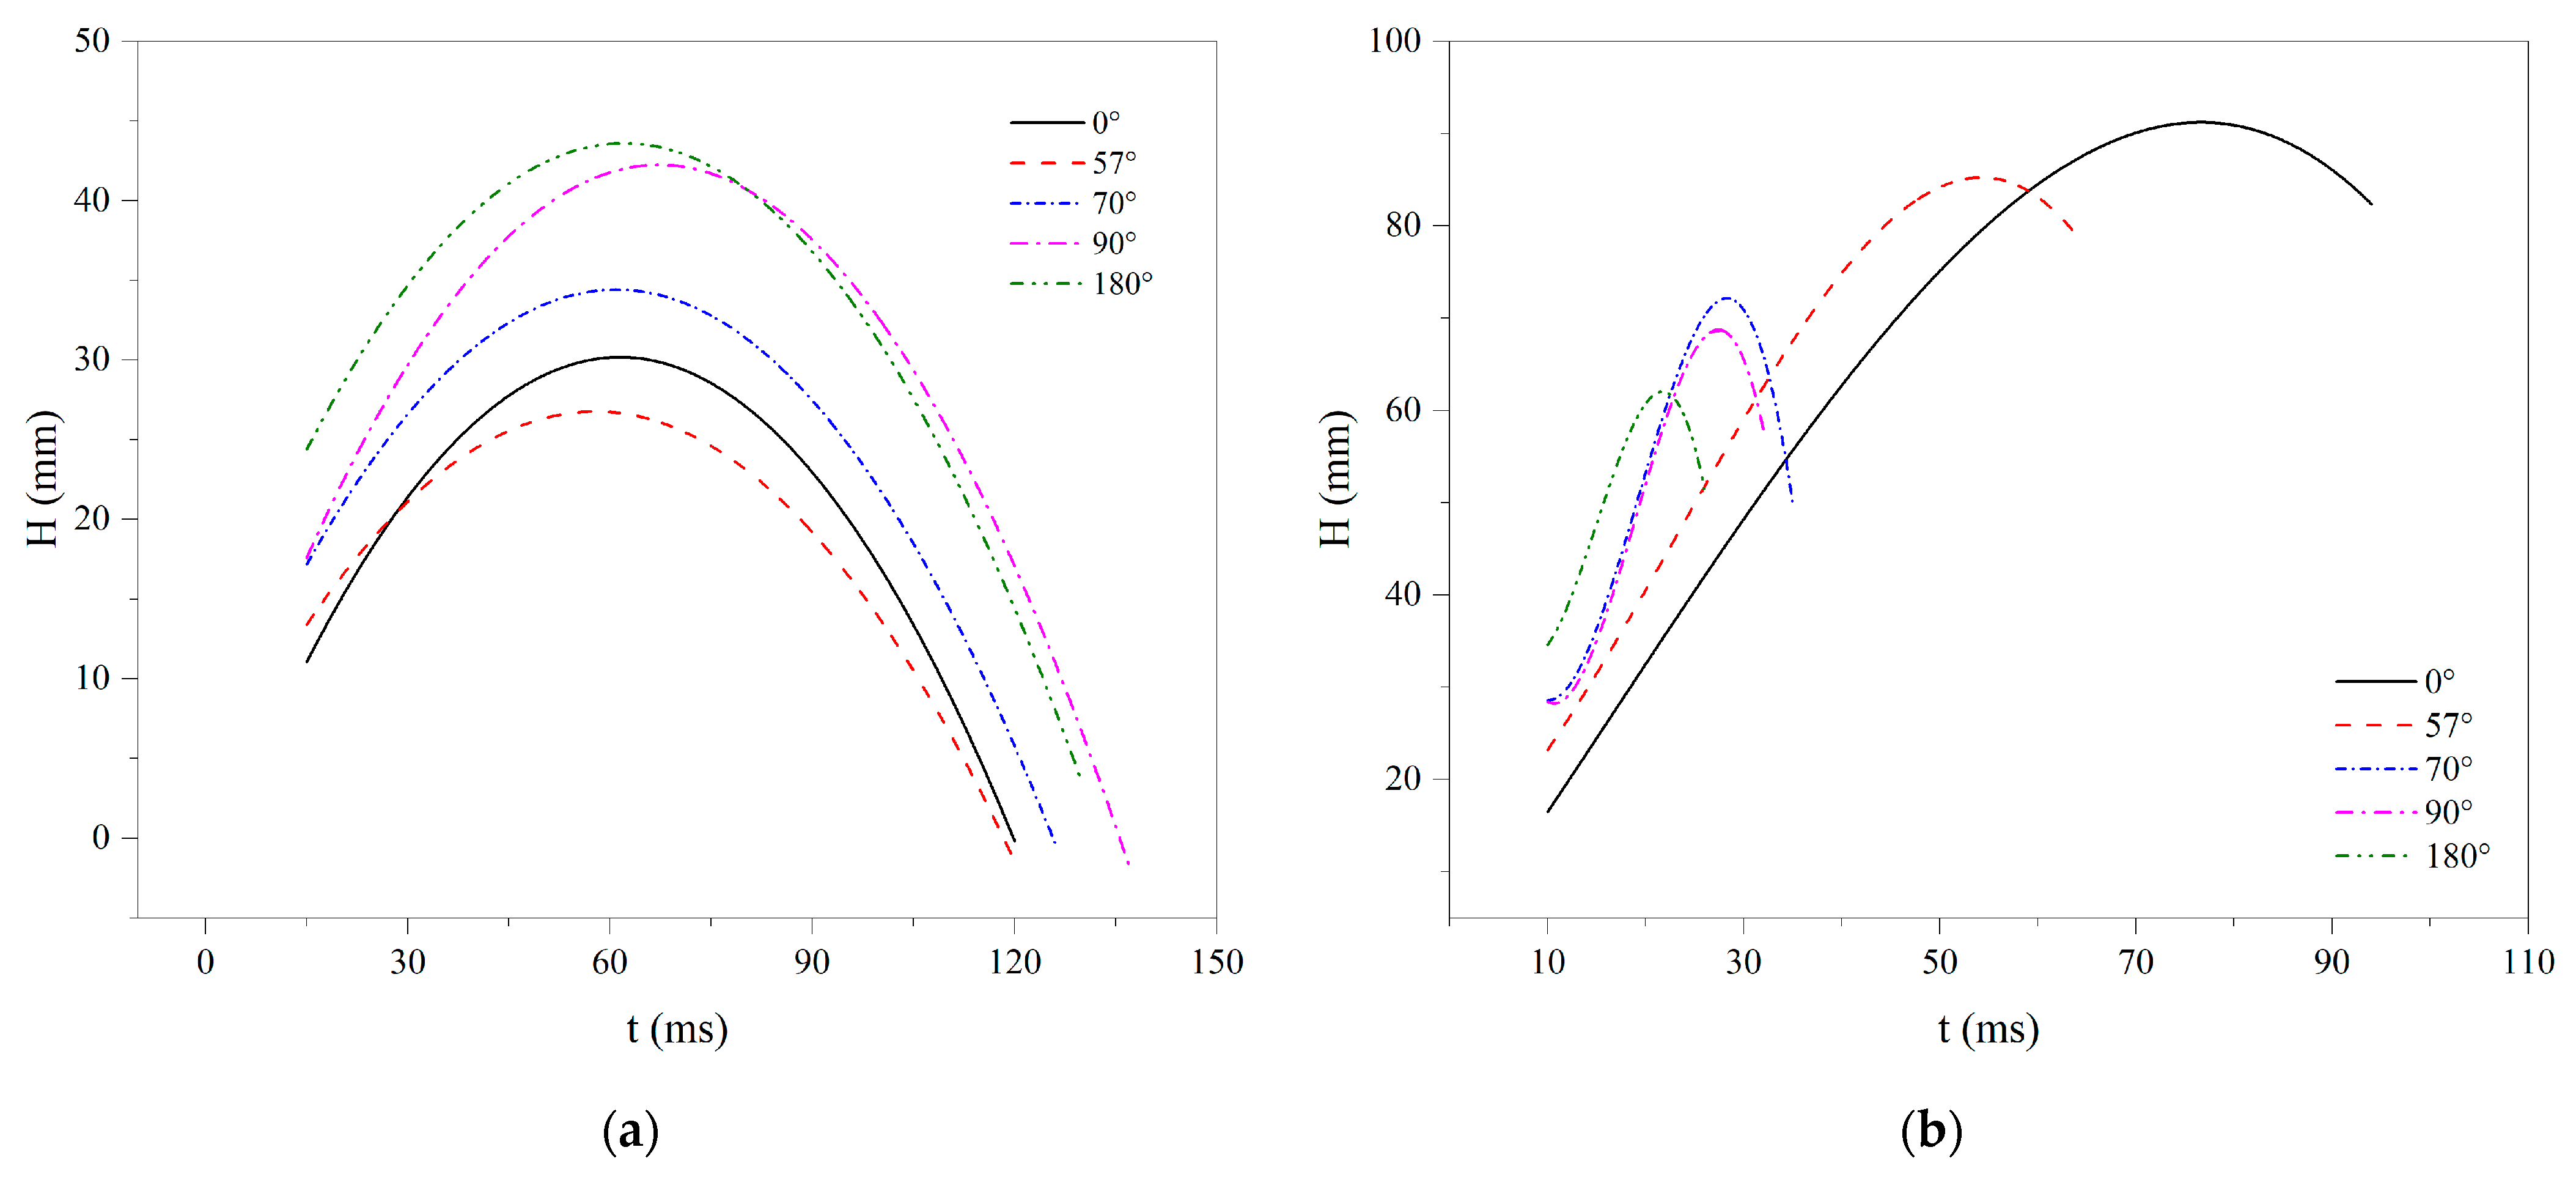
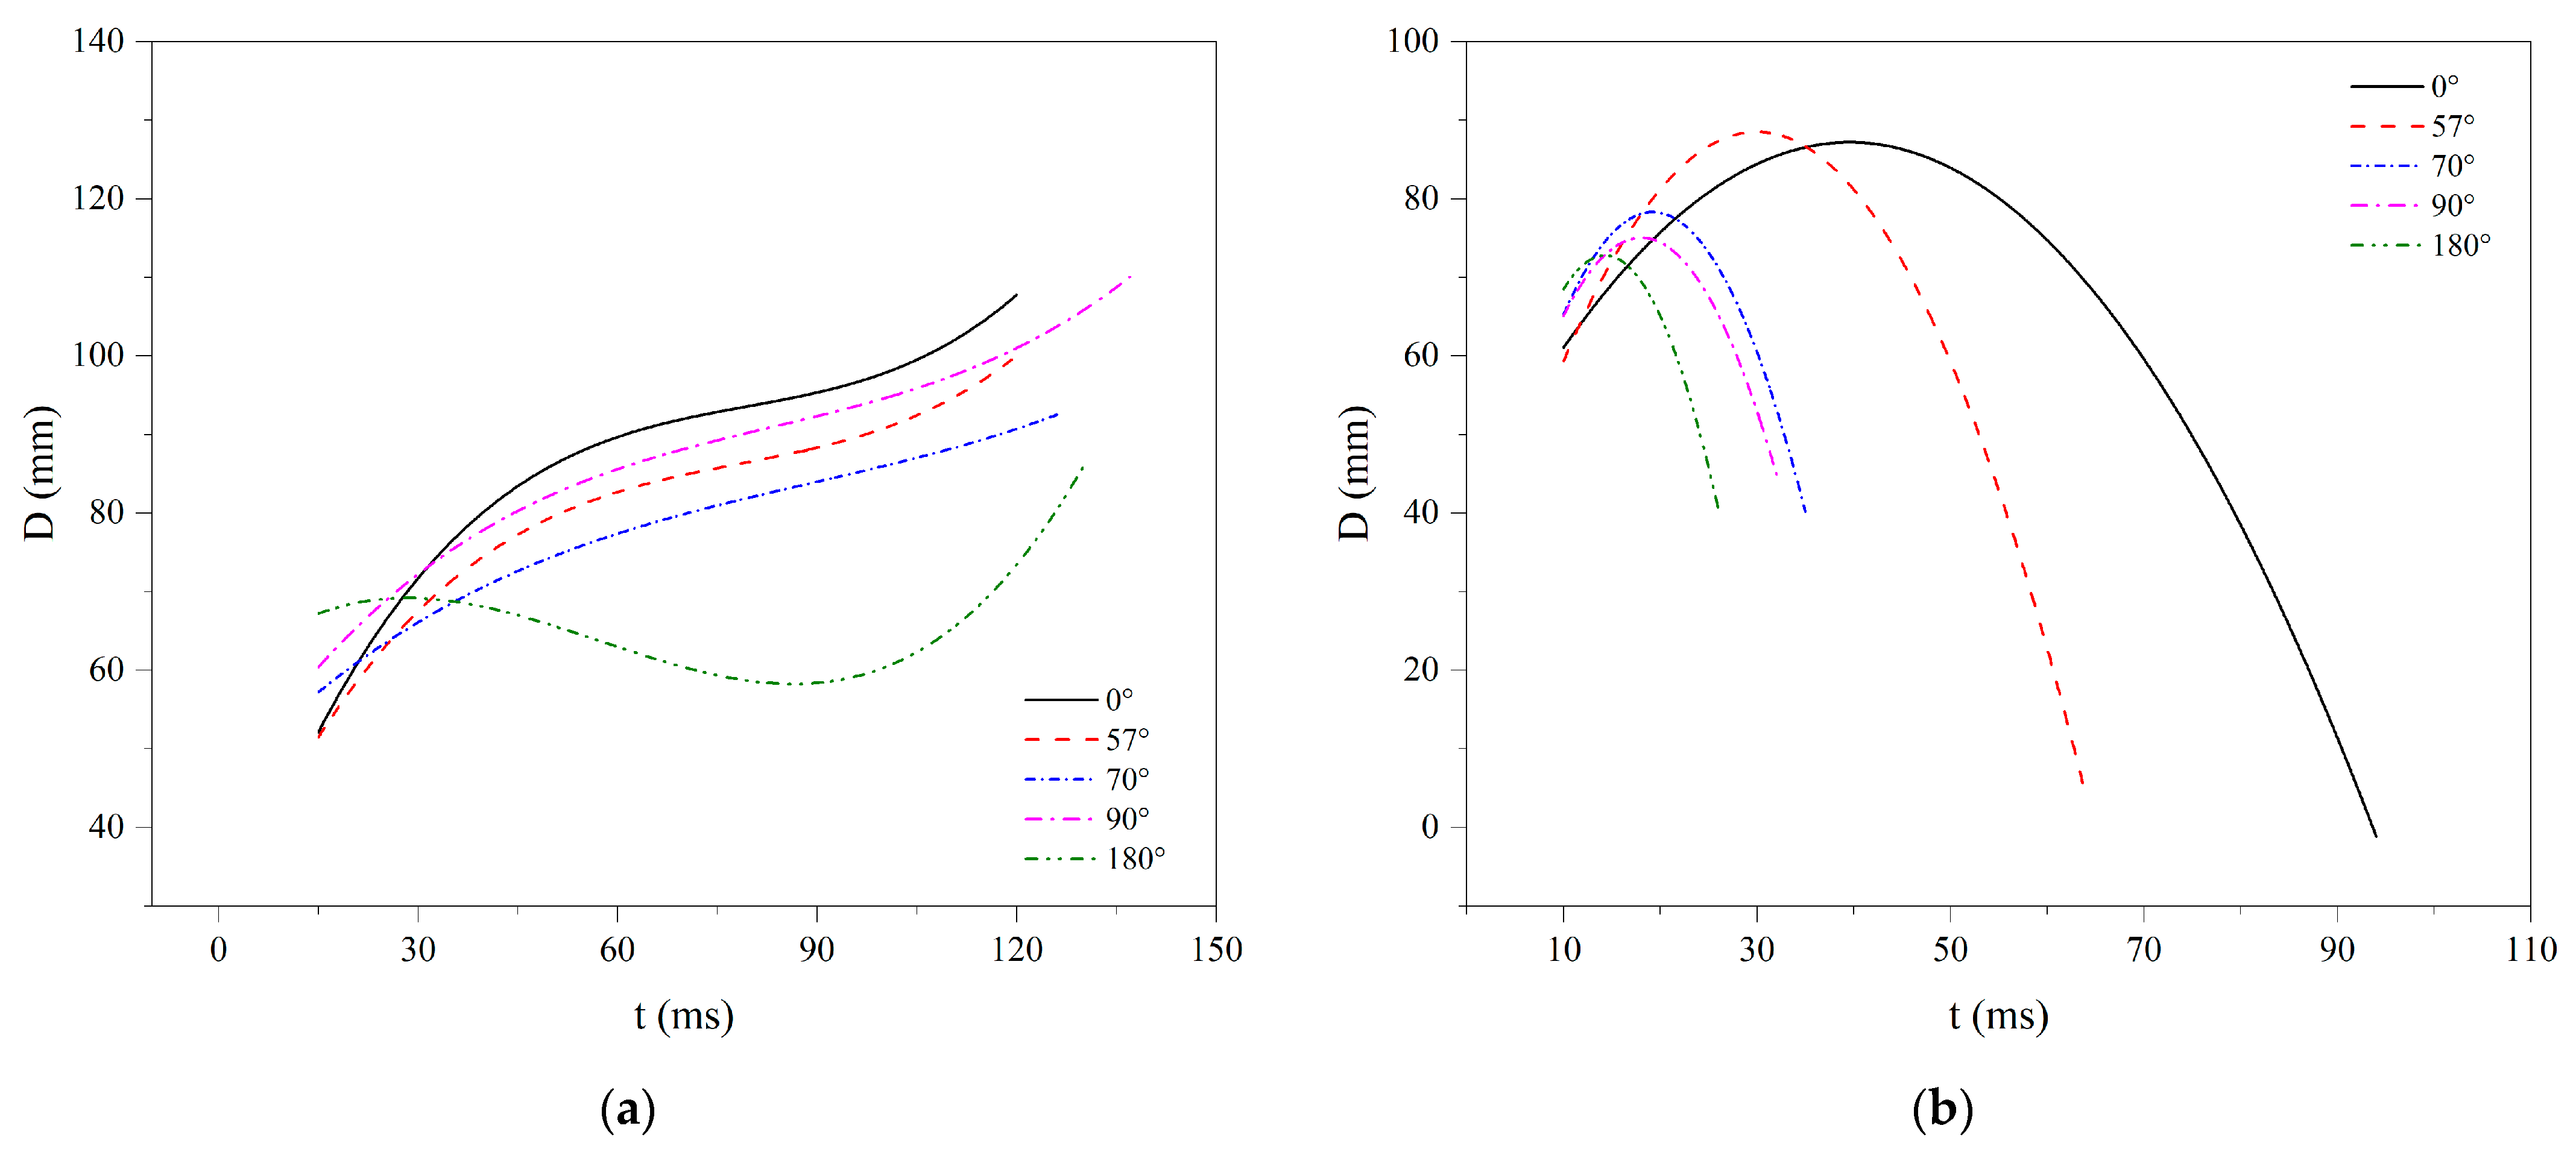
Since the splash of the hydrophobic model forms an obvious water curtain, when measuring the height and diameter of the splash, the fine droplets at the edge of the splash are ignored, and the diameter at the highest point is taken as the splash diameter. At 3.95 m/s, since the secondary splash formed after the tail enters the water destroys the shape of the primary splash, the splash height and diameter are measured until the splash closes. The curves of the splash height and diameter over time under the hydrophobic conditions are shown in Figure 19.
In the initial splash stage, at both speeds, the larger the head shape’s hemispherical angle is, the larger the splash height is. As for the maximum splash height at 2.2 m/s, basically, a larger head hemispherical angle produces a greater maximum splash height. At 3.95 m/s, basically, the larger the head shape hemispherical angle is, the smaller the maximum splash height is. This is because the entire development time of the splash is short, and the splash cannot be extended upward to the necessary extent. Similarly, the splash closure height is related to the way in which it is closed, and the closure height above the model is the same, and the closure height on the surface of the model is the same. When the speed is 2.2 m/s, the time required for different head shapes to reach the maximum splash height ranges between 50–60 ms, and the time for the splash to fall to the water surface ranges between 120–140 ms. At 3.95 m/s, with a larger hemispherical angle of the head shape, the splash reaches its maximum height, and the upper end of the splash closes faster.
As for the splash diameter, since the processes of the change in the shape of the splash at the two speeds are completely different, the processes of the change in the splash diameter with time are also completely different. At 2.2 m/s, except for the 180° hemispherical angle condition, the development trend of the diameter is basically similar, and the splash continues to expand slowly after the initial rapid expansion. For the 180° hemispherical angle condition, when the shape of the splash changes into a truncated cone, the diameter of the upper part decreases. After the diameter is reduced for a period, as the splash falls, the overall diameter increases rapidly. At 3.95 m/s, basically, the larger the head shape hemispherical angle is, the smaller the splash diameter is and the earlier the splash closes. Figure 20 shows the splash diameter over time.
3.2. Influences of the Model Surface Properties on the Cavity
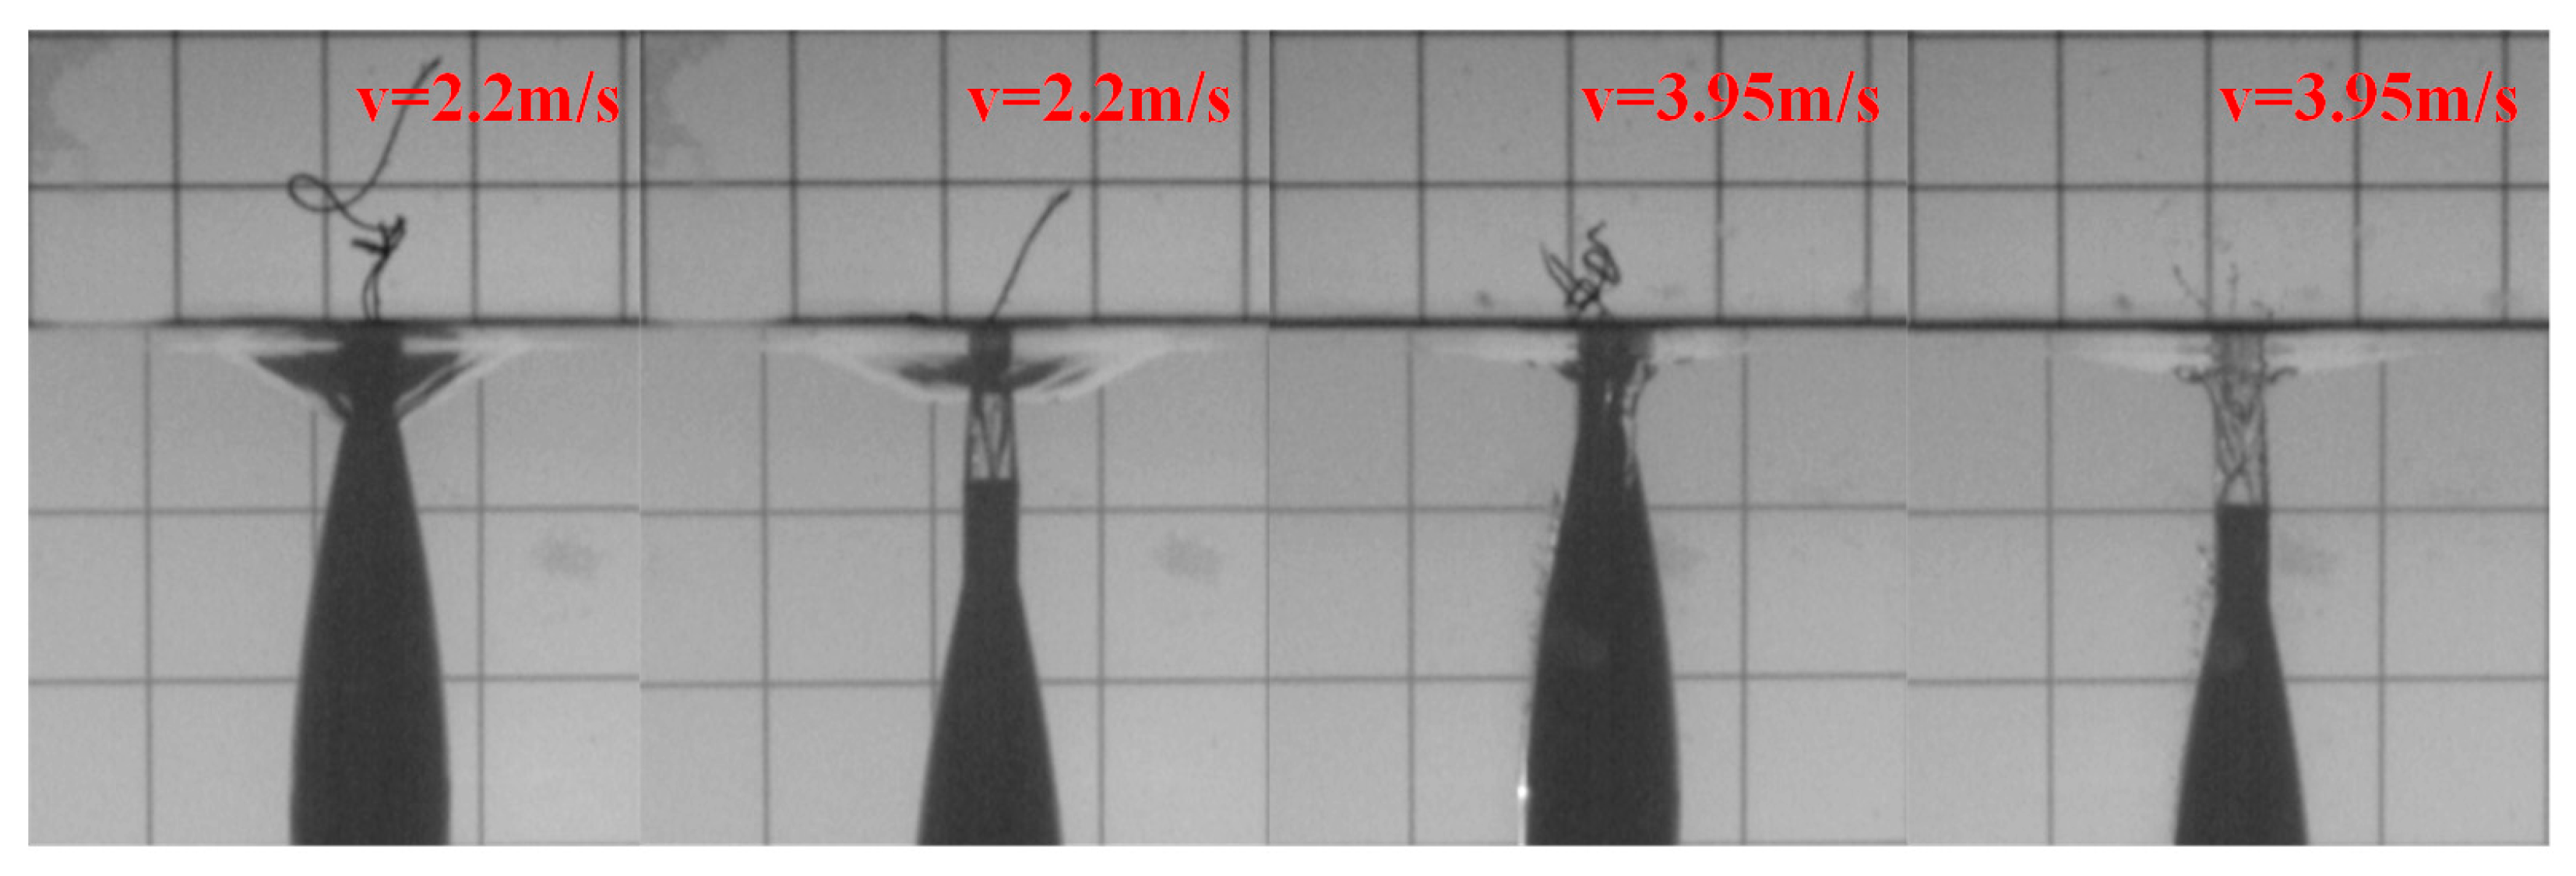
In the hydrophilic model experiment, the free liquid surface is close to the model surface and does not separate. With the falling of the model, the surface of the outer cylinder, except for the tail section, is enwrapped by the surrounding liquid, and only a slight solid–liquid separation occurs at the tail position, forming tail vacuoles. The tail cavity closes closer to the free surface. Among the experiments, when the speed of water entry is 2.2 m/s, the cavity in the tail is more apparent. When the speed is 3.95 m/s, the trace of the cavity in the tail is very shallow, and the cavity is almost absent, as shown in Figure 21.
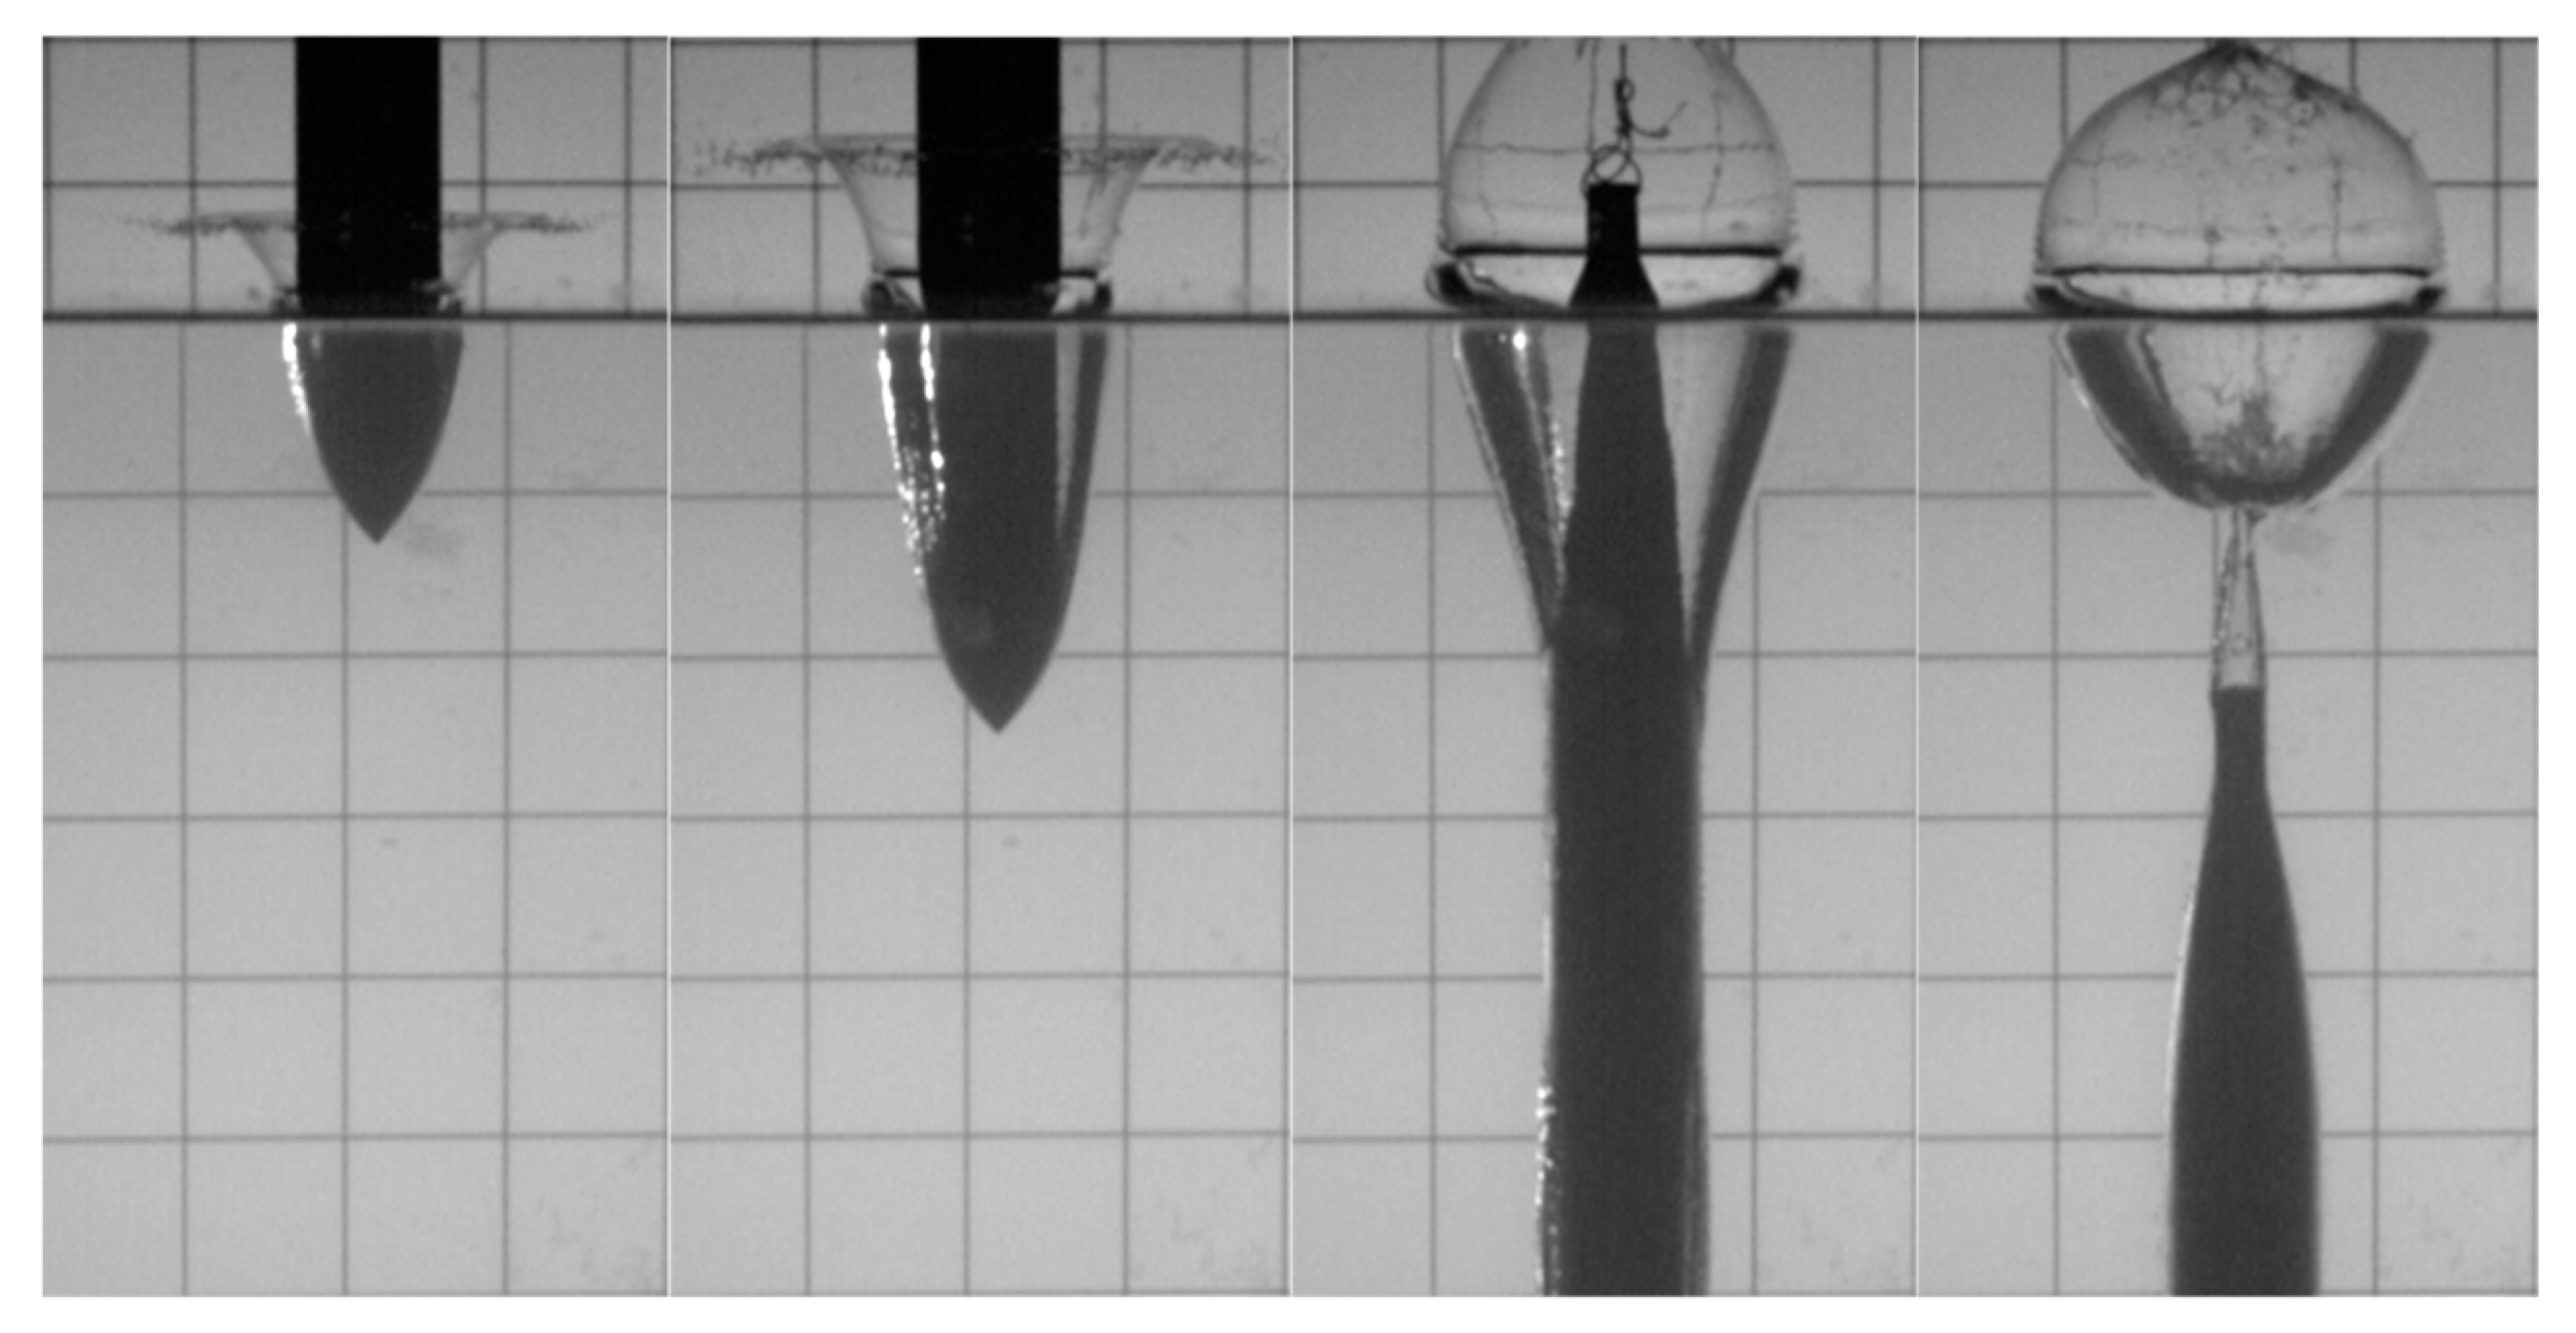
For the hydrophobic model, an obvious solid–liquid separation occurs at the model shoulder, forming open vacuoles. With the falling of the cylinder, it undergoes the process of expansion, dragging and closing the cavity as it moves into the water. In the hydrophobic model, the closure of the vacuole occurs twice. In one cases, the closure of the cavity is caused by the head on the surface of the model cylinder; in the other, after the first closure, the cavity is separated into upper and lower parts, and the upper cavity shrinks to meet the free surface and finally closes for the second time, as shown in Figure 22.
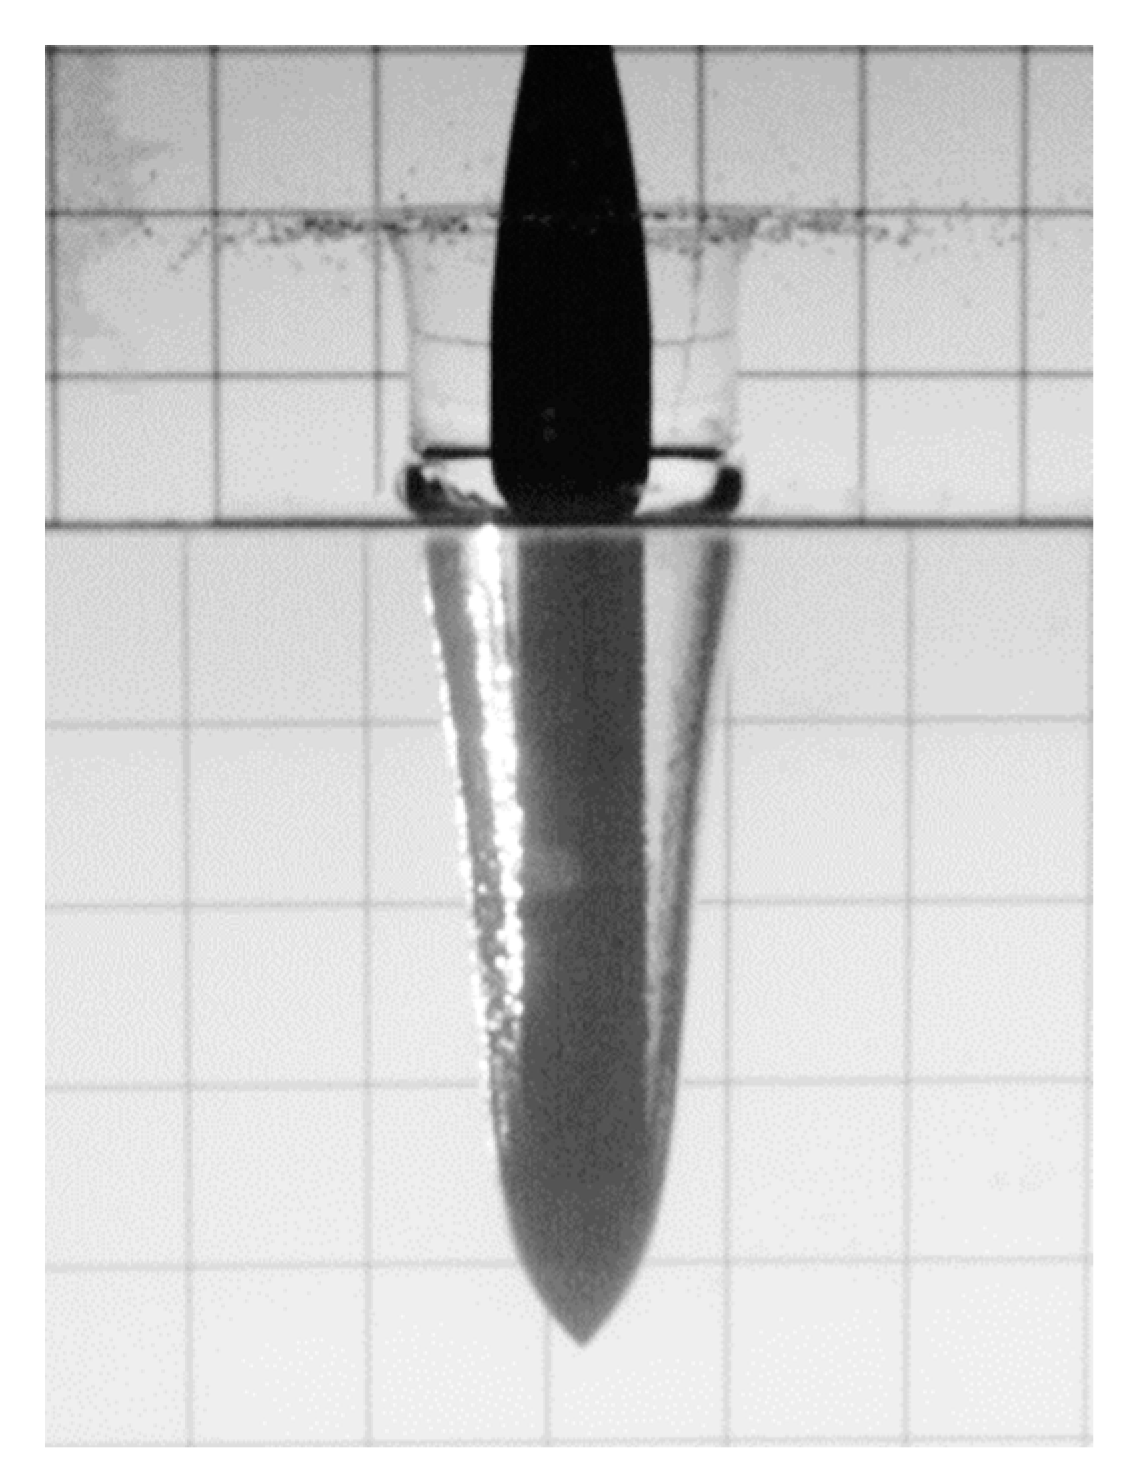
When the water entry speed is 2.2 m/s, the expansion range and drag depth of the open cavities are small, and they quickly shrink to the surface of the model, and the separated upper cavity shrinks down along the model to the horizontal plane. At 3.95 m/s, the expansion range and drag depth of the open cavity are larger, the cavity is more apparent, and the separated upper cavity is separated from the surface of the model. Moreover, for some head shapes, at a speed of 3.95 m/s, the separated upper cavities will appear wrinkled. The process of the expansion and contraction of the cavity wall can be observed simultaneously, as shown in Figure 23.
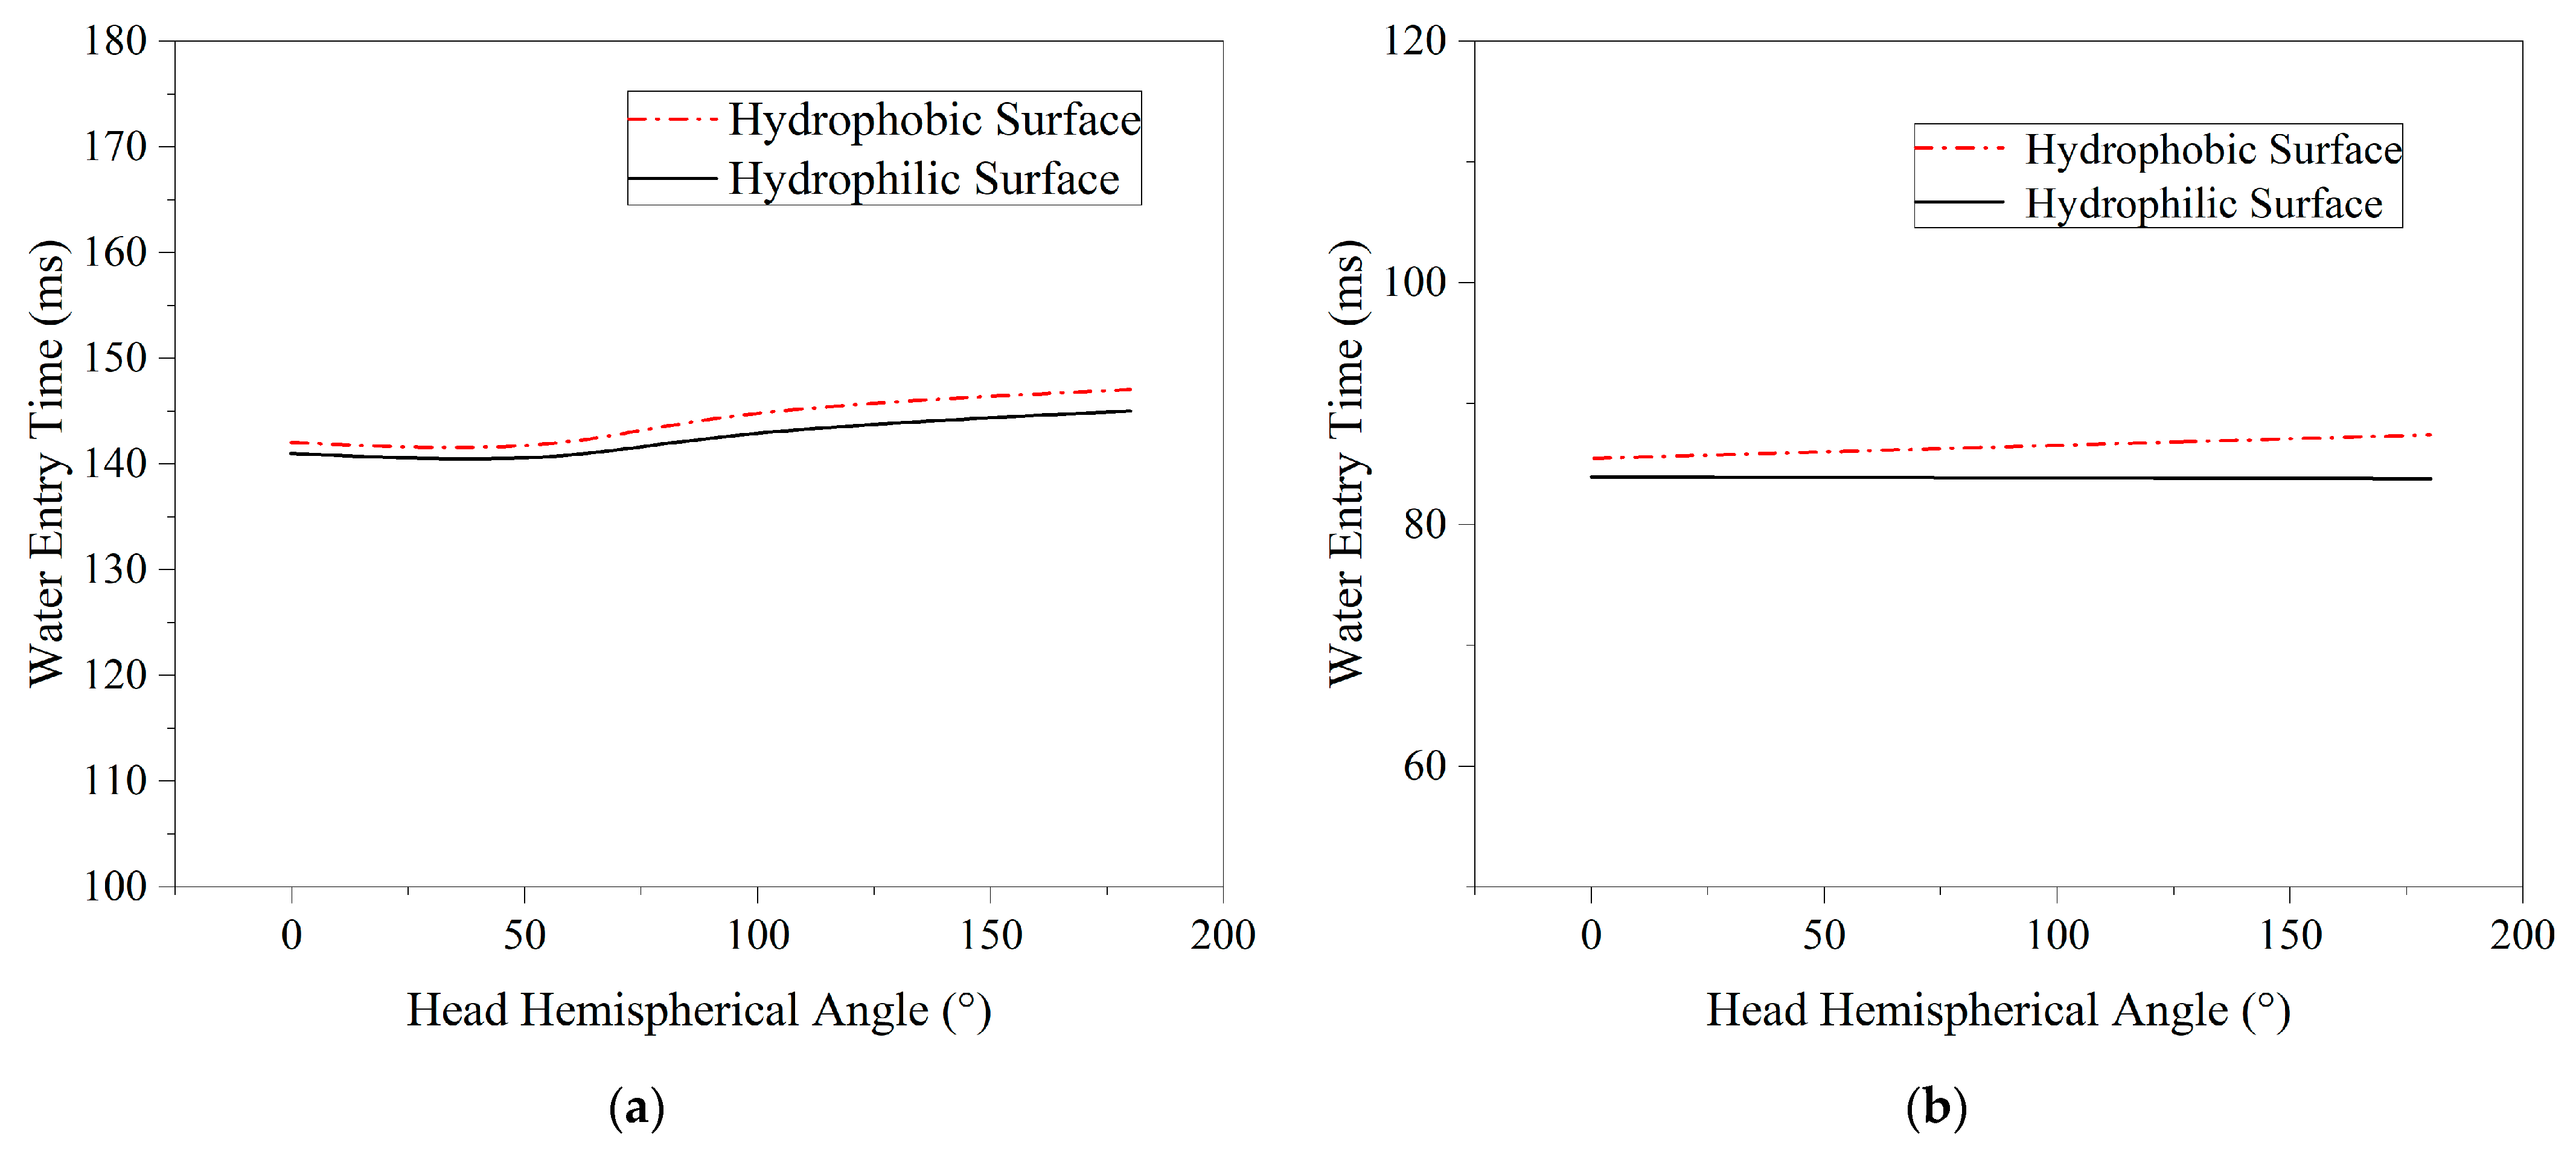
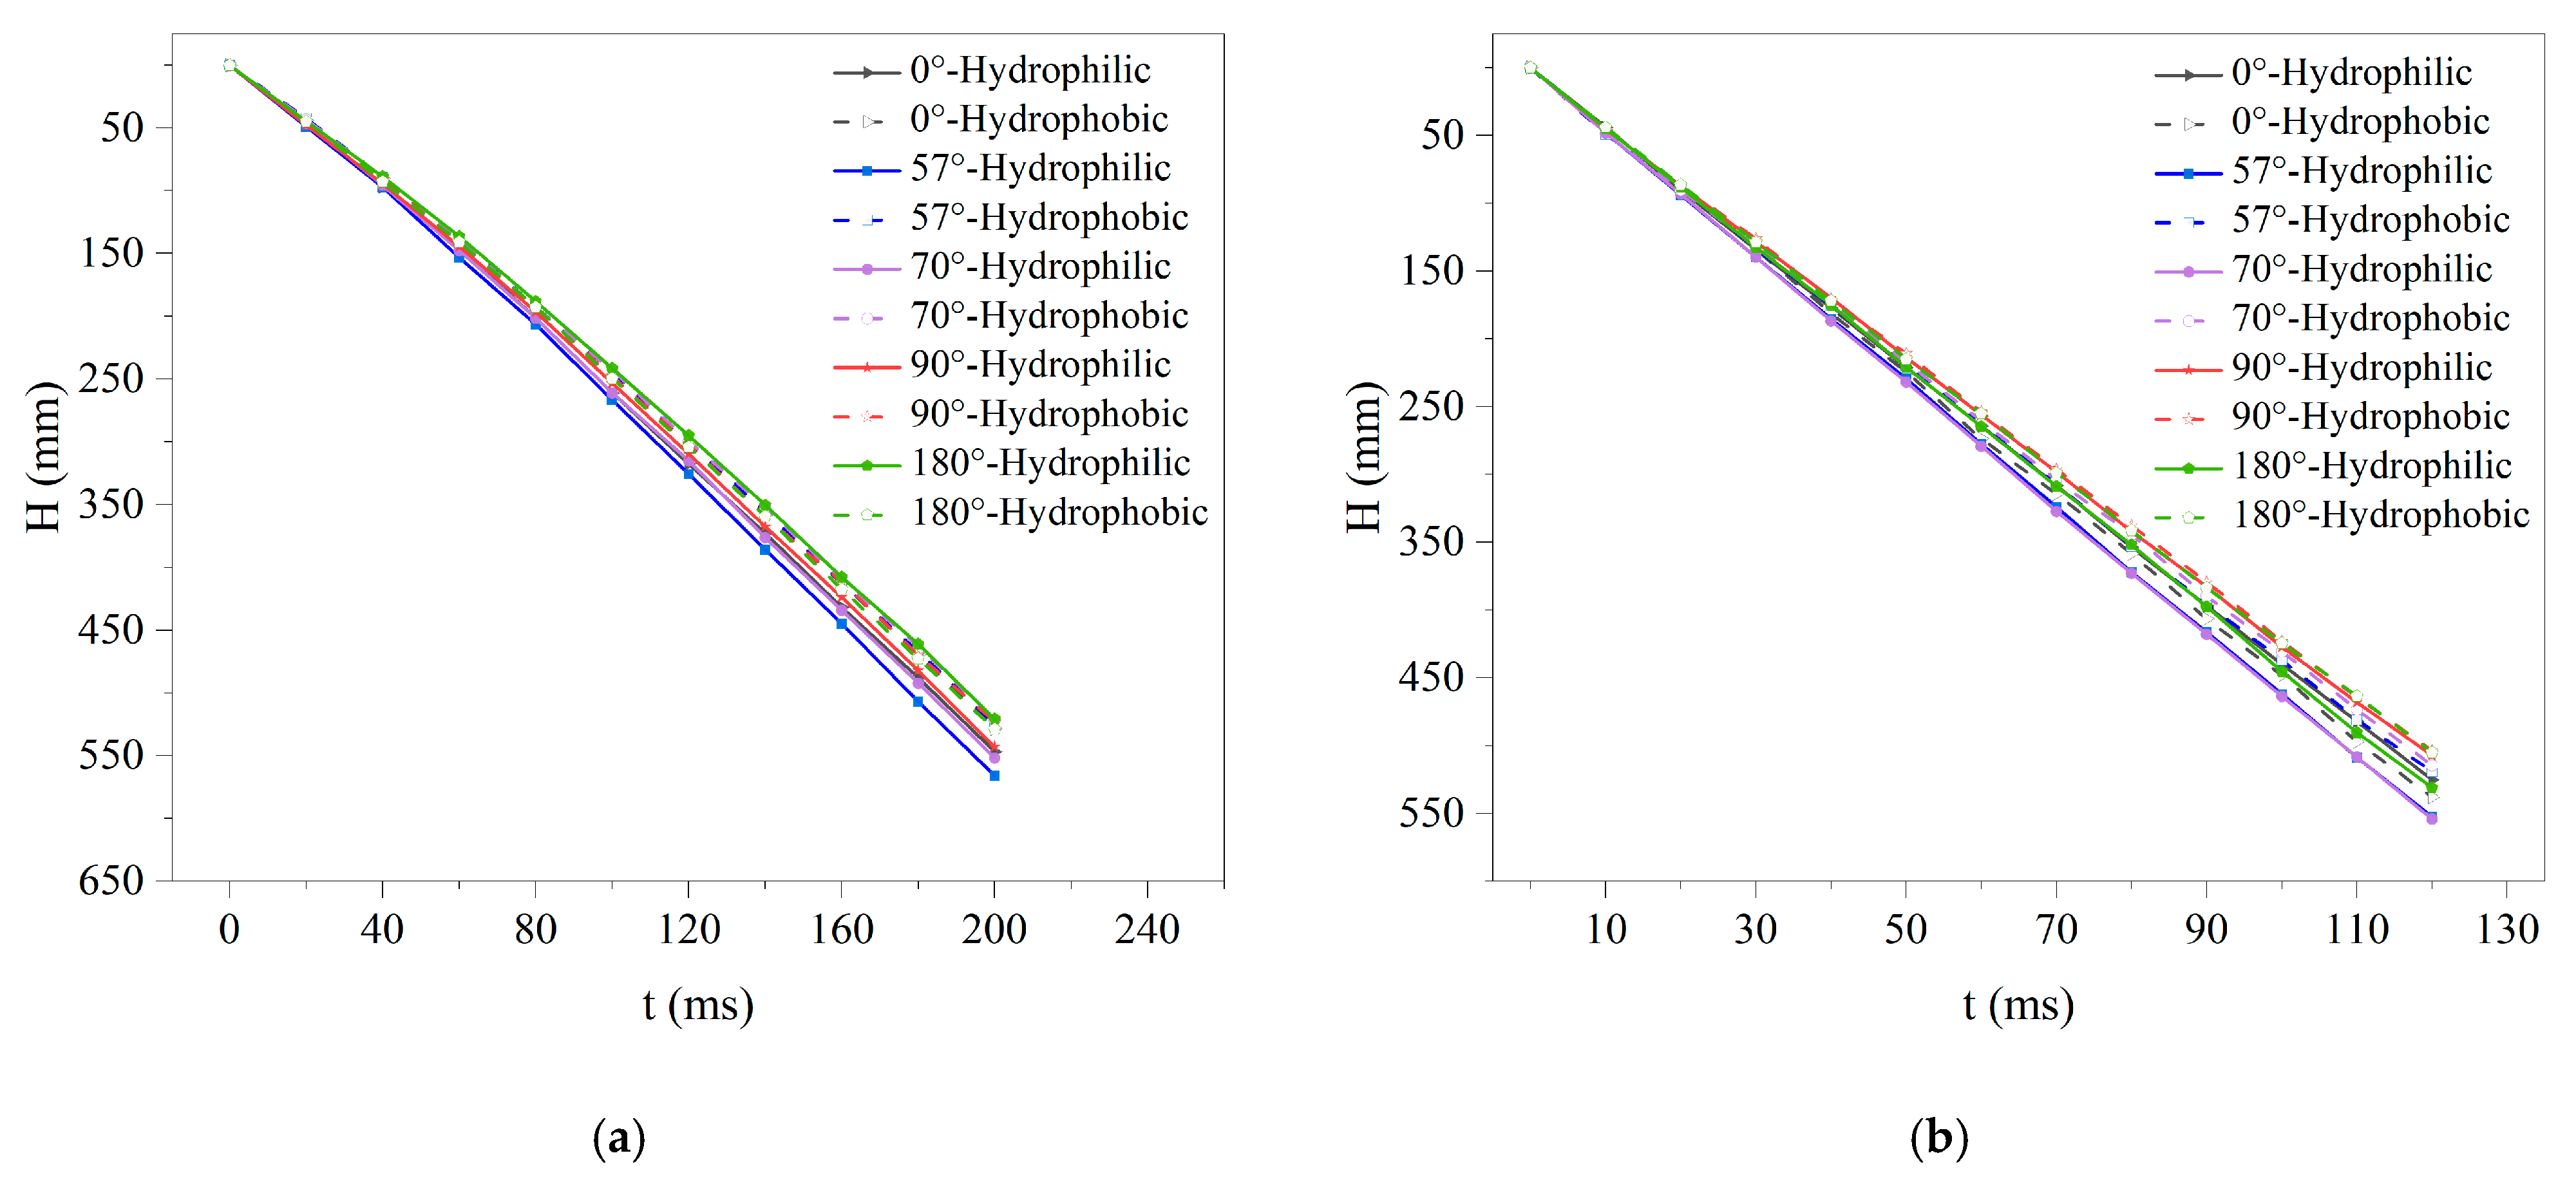
Figure 24a is a chart comparing the water entry times of different head shape hemispherical angle models when the initial water entry velocity is v = 2.2 m/s. It can be seen from the figure that the water entry times of the different head shape models are almost on the same horizontal line. This is because the models with different head types show little difference in terms of the cavity generated during the water entry process (the hydrophilic model does not generate a cavity at this speed), and the difference in energy loss during the model entry process is also minimal. At the same time, the water entry time of the hydrophobic model, represented by the dotted line in the figure, should be higher than the water entry time of the hydrophilic model, represented by the solid line. This is because the hydrophobic model generates a certain number of water entry vacuoles during the water entry process. The model’s cavity-free entry into the water transfers more kinetic energy to the nearby fluid, with greater energy and velocity losses and a longer entry time.
Figure 24b shows the comparison of the water entry times of the hydrophilic and hydrophobic models of different hemispherical angular head shapes at a water entry velocity of 3.95 m/s. It can be seen from the figure that, after increasing the speed, although the water entry times of the hydrophilic and hydrophobic models of different head types decrease, they remain on almost the same horizontal line. Likewise, the entry time of the hydrophobic model, represented by the red line, is greater than the entry time of the hydrophilic model, represented by the black line.
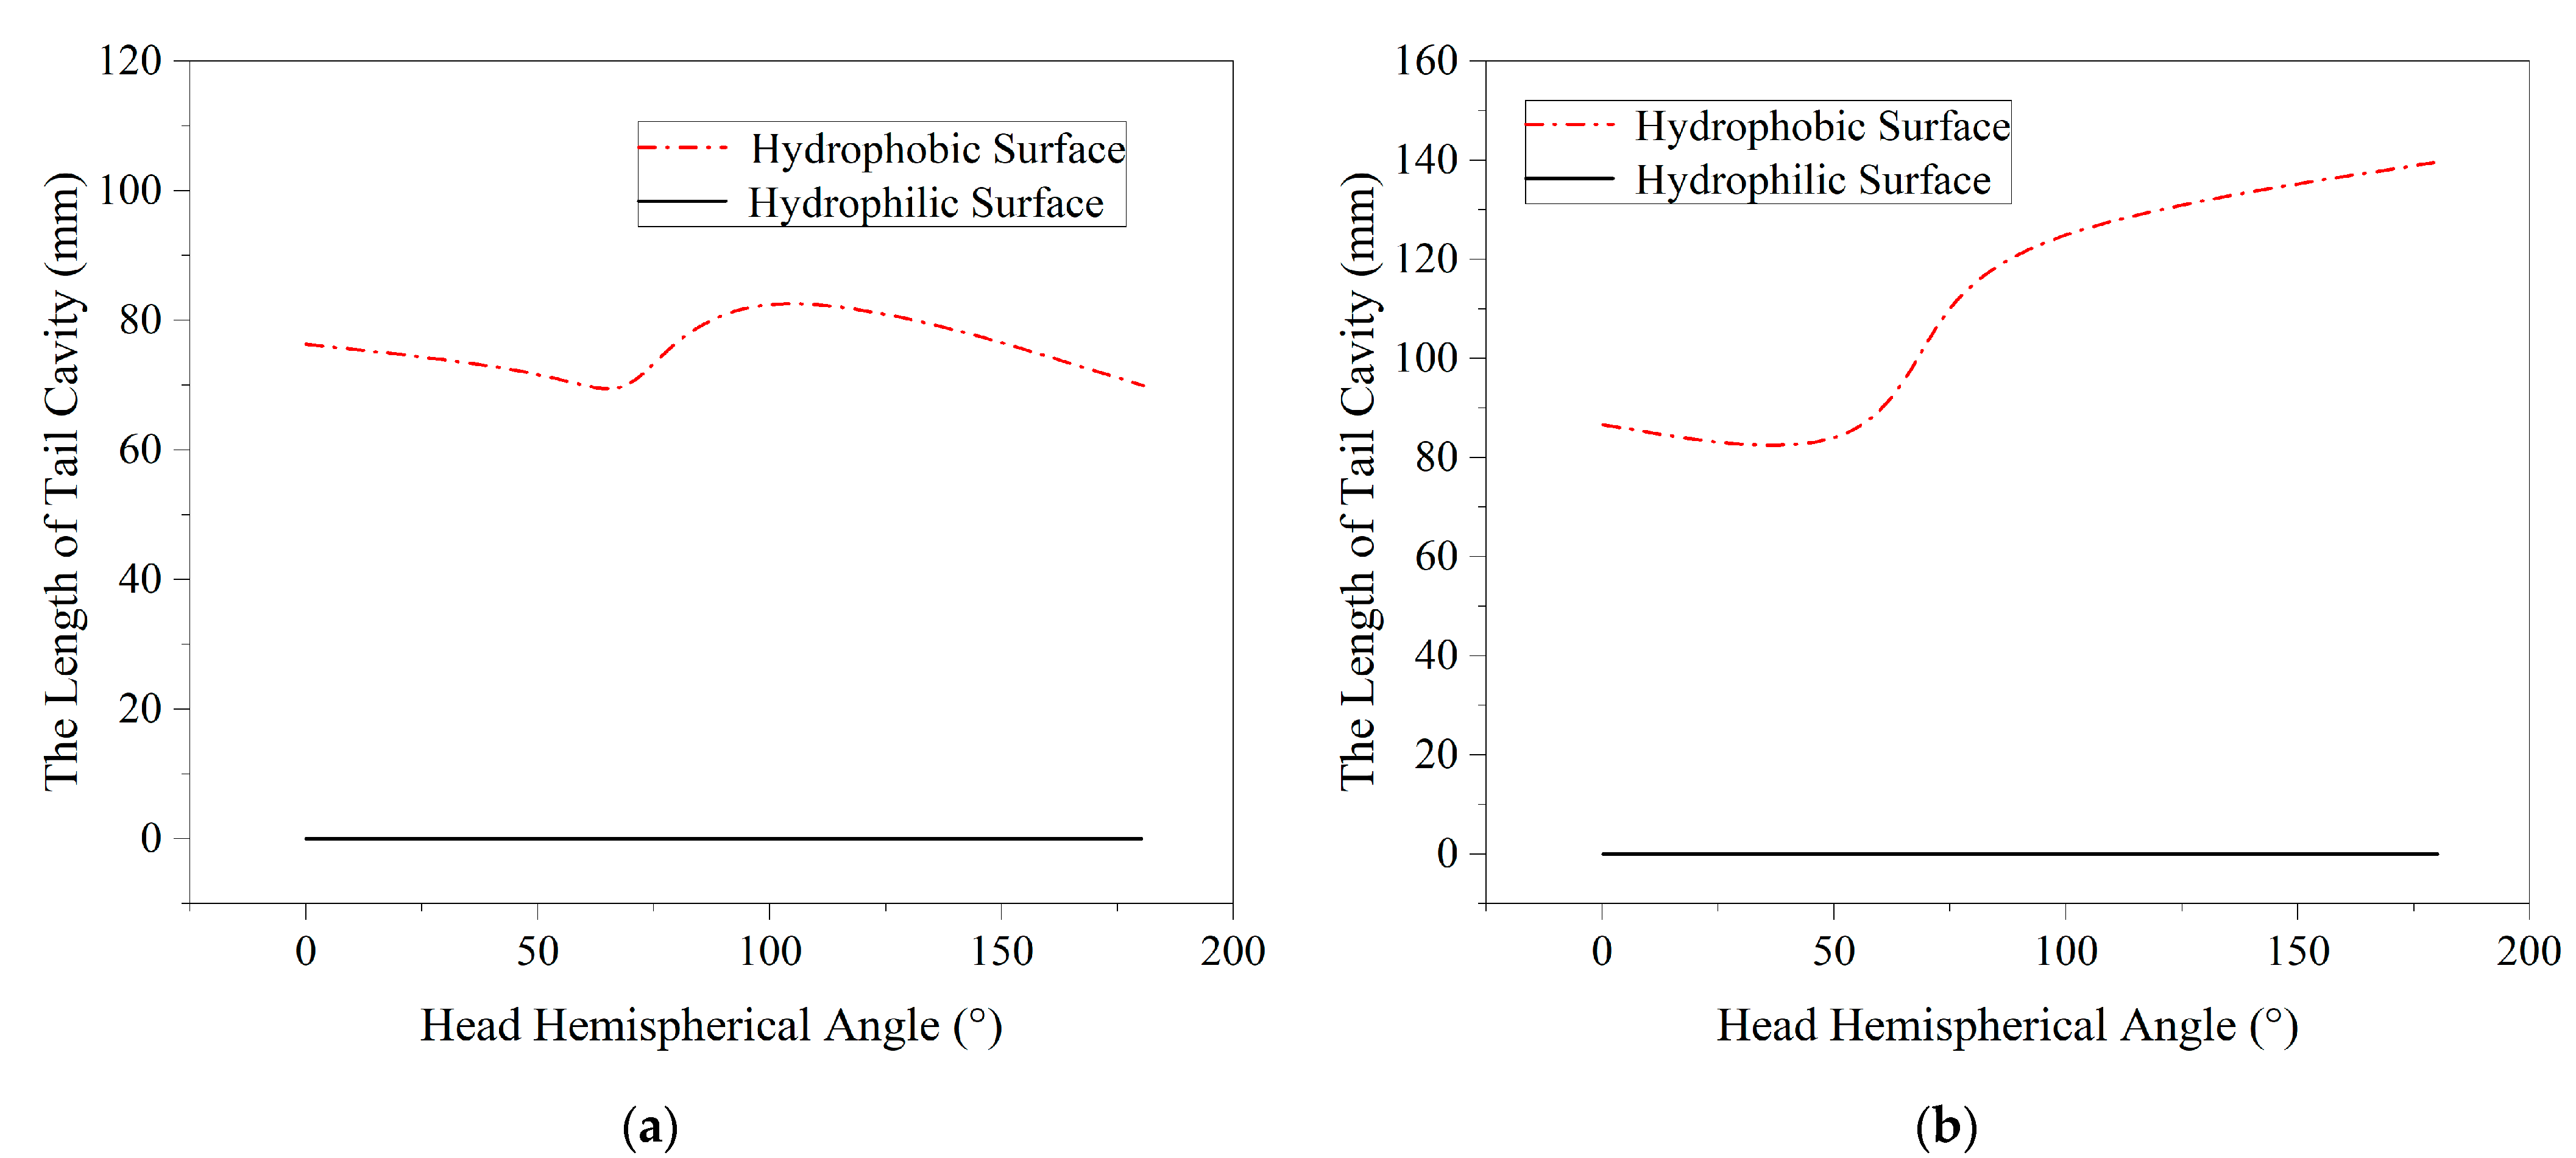
Figure 25a,b shows the comparison of the depth of the vacuoles at the tails and heads of the hydrophilic and hydrophobic models of different hemispherical angular head shapes at a water entry velocity of 3.95 m/s. It can be seen from the figure that the hydrophilic model does not generate water entry cavities during the entire water entry process. For the hydrophobic model entering the water, the model with a head hemispherical angle produces the smallest head cavity, and the model with a head hemispherical angle is slightly larger. When the head hemispherical angle is greater than the generated head cavity, the head cavity generated by the model entering the water increases with the increase in the head hemispherical angle. For the tail vacuole generated by the hydrophobic model entering the water, the sizes of the tail vacuoles produced by the head hemispherical angle of 0° and by the 57° model are basically the same. For the models with head hemispherical angles of 70°, 90° and 180°, the size of the tail vacuoles is affected by the folds and breakage of the tail vacuoles, so that the 70° and 180° models have smaller tail vacuoles, while the 90° models have larger tail vacuoles. The model is less affected by folds, and its tail vacuoles are larger.
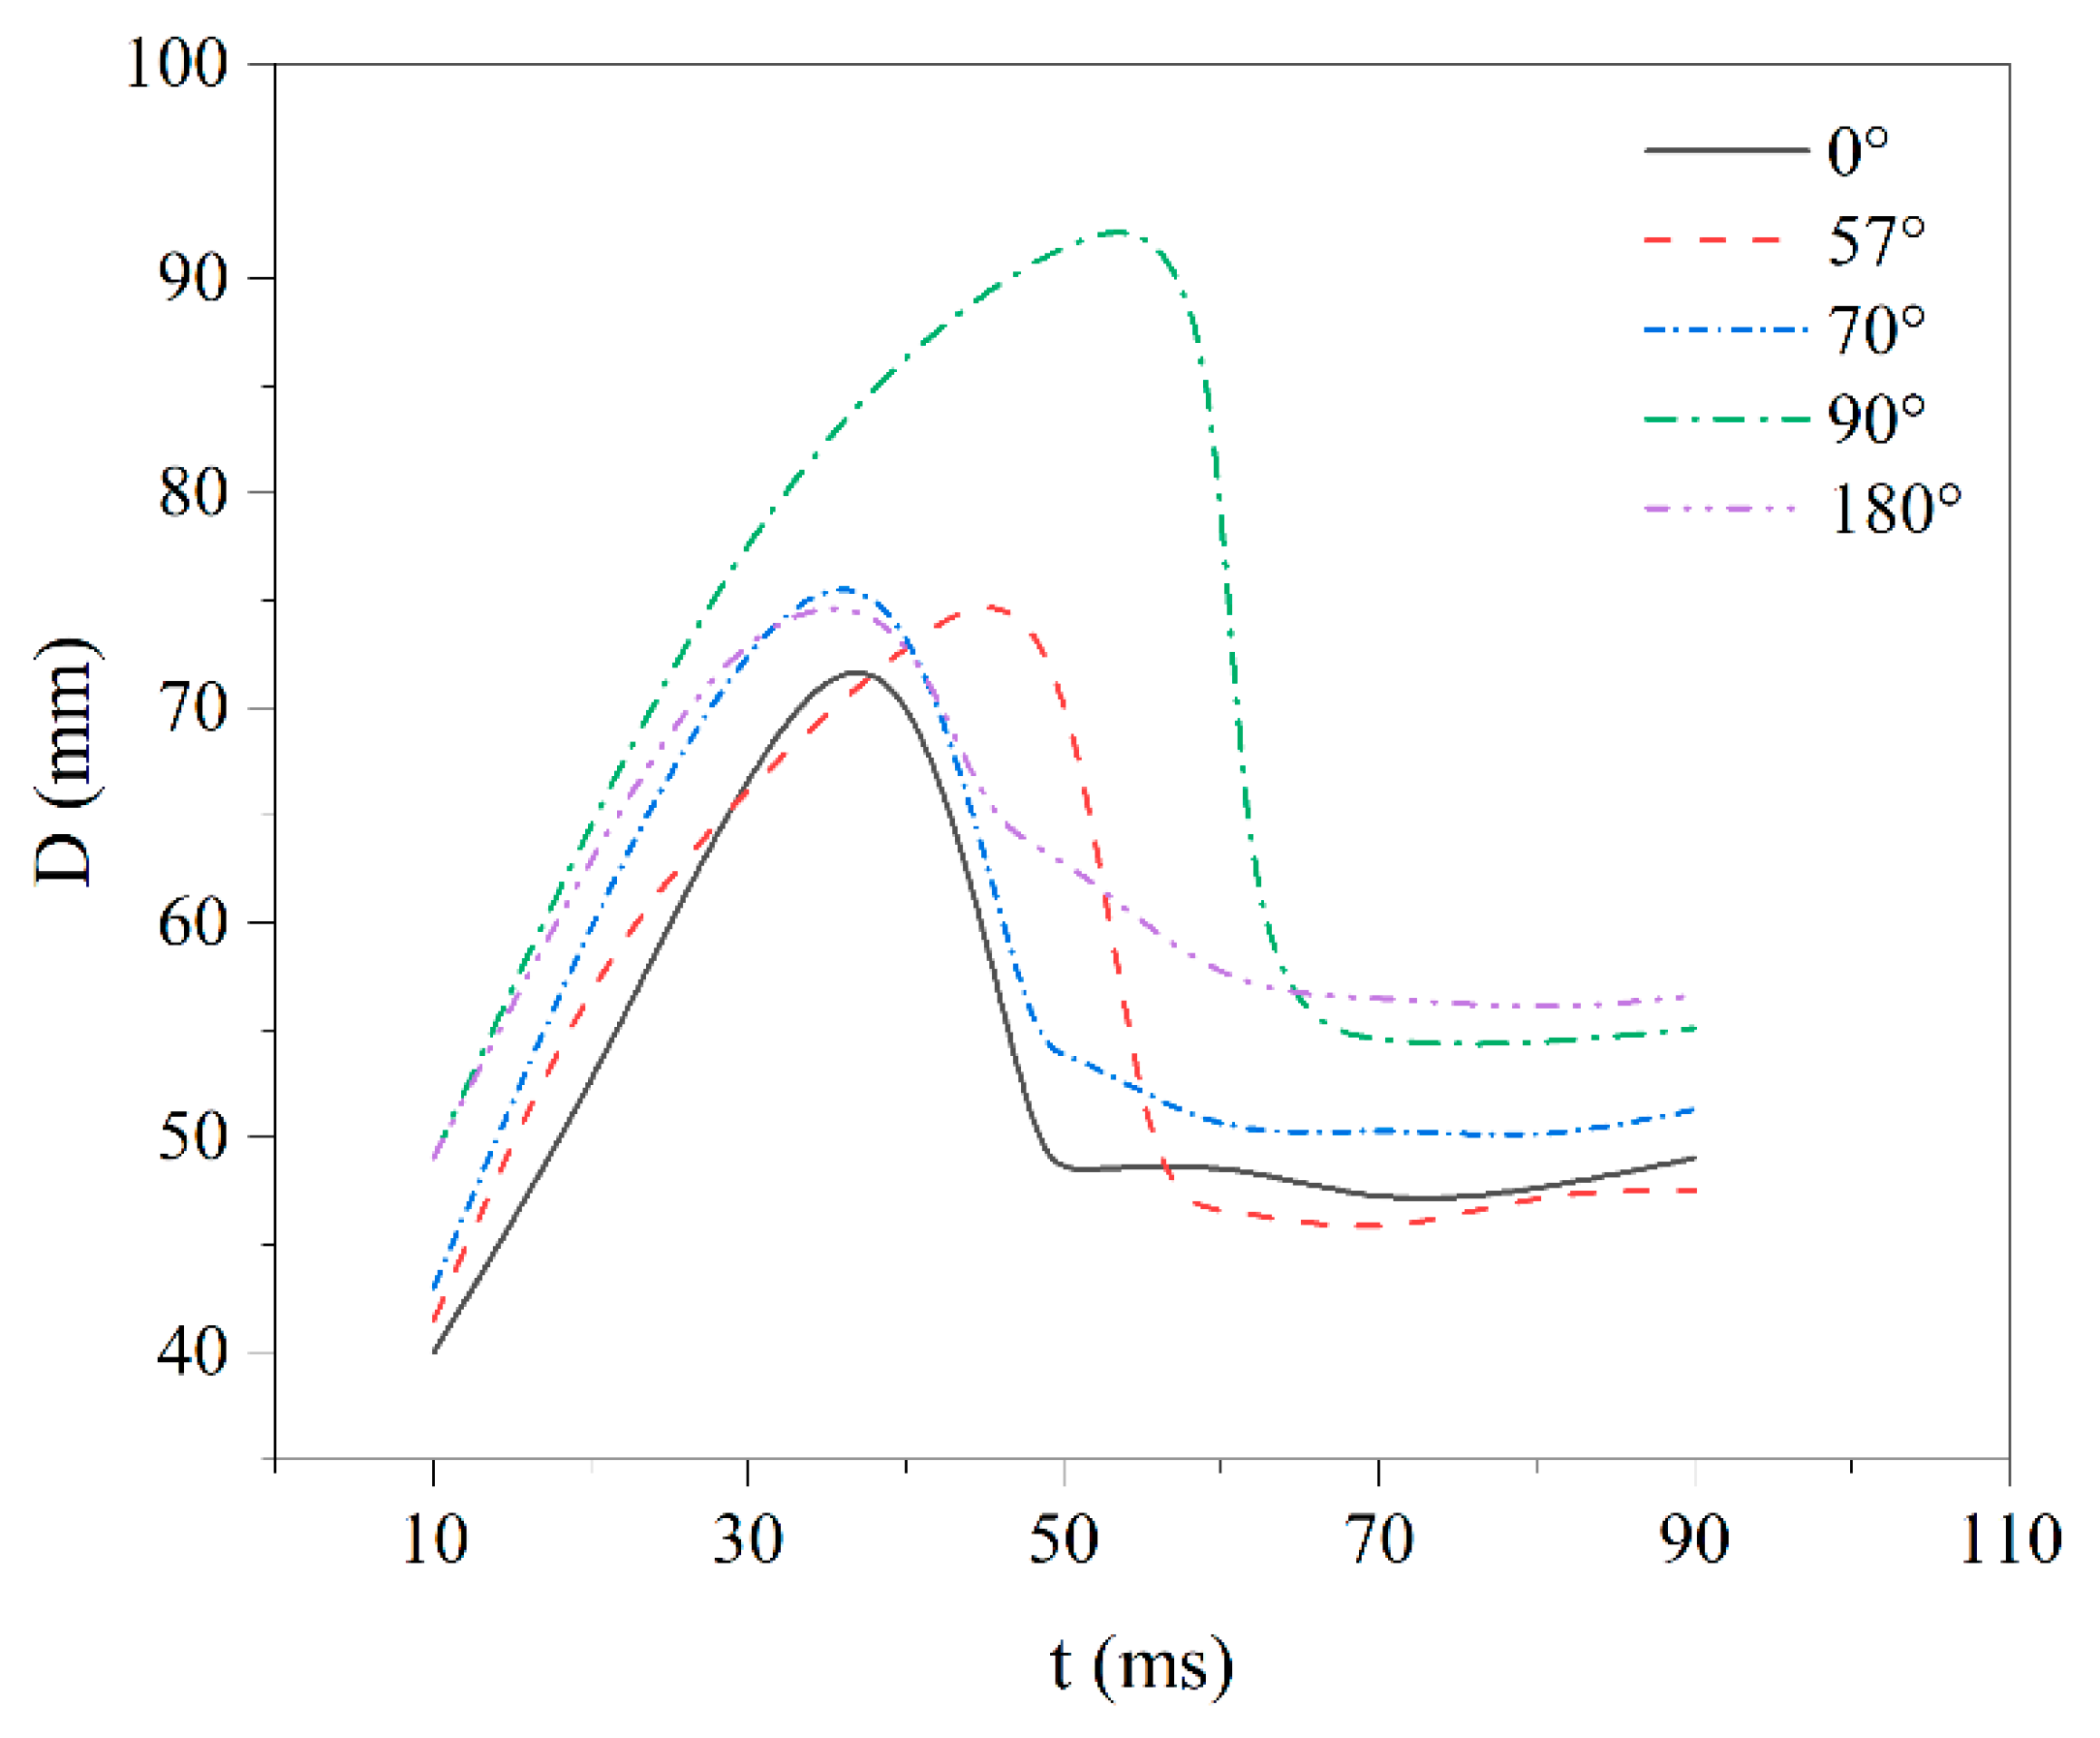
To further analyze the characteristics of the vacuoles generated by the hydrophobic model, the process of the change in the vacuolar diameters of different head shapes over time at a speed of 3.95 m/s was plotted as a curve, as shown in Figure 26. In this analysis, the maximum cavity diameter is used as the cavity diameter. When the center of the cavity shrinks, the maximum diameter of the head cavity is measured as the cavity diameter.
Before the cavity shrinks, except for the 90° model, the cavity sizes of the other models are basically the same. After the cavity shrinks, the cavity diameter of the 0° model is slightly larger than that of the 57° model. After that, with the increase in the head shape hemispherical angle, the cavity diameter increases, which is consistent with the rule of the cavity depth in the previous experiments. This means, in part, that a flatter head shape will transfer more kinetic energy to the surrounding fluid, resulting in a longer entry time and larger head cavity.
3.3. Influences of the Surface Properties and Head on the Ballistics
The water entry ballistics of the craft refer to the motion trajectory of the craft from the time when the craft makes contact with the free liquid surface to the time when the cavity collapses and the craft is fully wetted. The period coincides with the development time of the water entry cavity, and the water entry ballistic is closely connected with the cavity; thus, it is also called the cavity section ballistic. The head shape, water entry speed, impact angle, surface wetness and water environment of the projectile all affect the water entry ballistics of the projectile.
The influence of the impact angle on the water entry ballistics is mainly reflected in the initial stage. The low-pressure effect and resistance of a projectile during water invasion are related to the impact angle. The influence of the water entry velocity is directly reflected by the influence of gravity. When a model enters the water at high speed, the effect of gravity will be weakened, which will increase the possibility of the projectile raising its head or even flooding. The influence of the water environment is based on the fact that the air flow, wind and waves on the sea surface affect the insertion of the projectile into the water, thereby affecting the subsequent ballistics. The surface properties will affect the shape of the cavity, which in turn affects the trajectory of the projectile moving into the water, as shown in Figure 27. By comparison, it was found that at different speeds, with the head hemisphere angle of the hydrophilic surface of 57 degrees, the speed of the model entering the water is the fastest.
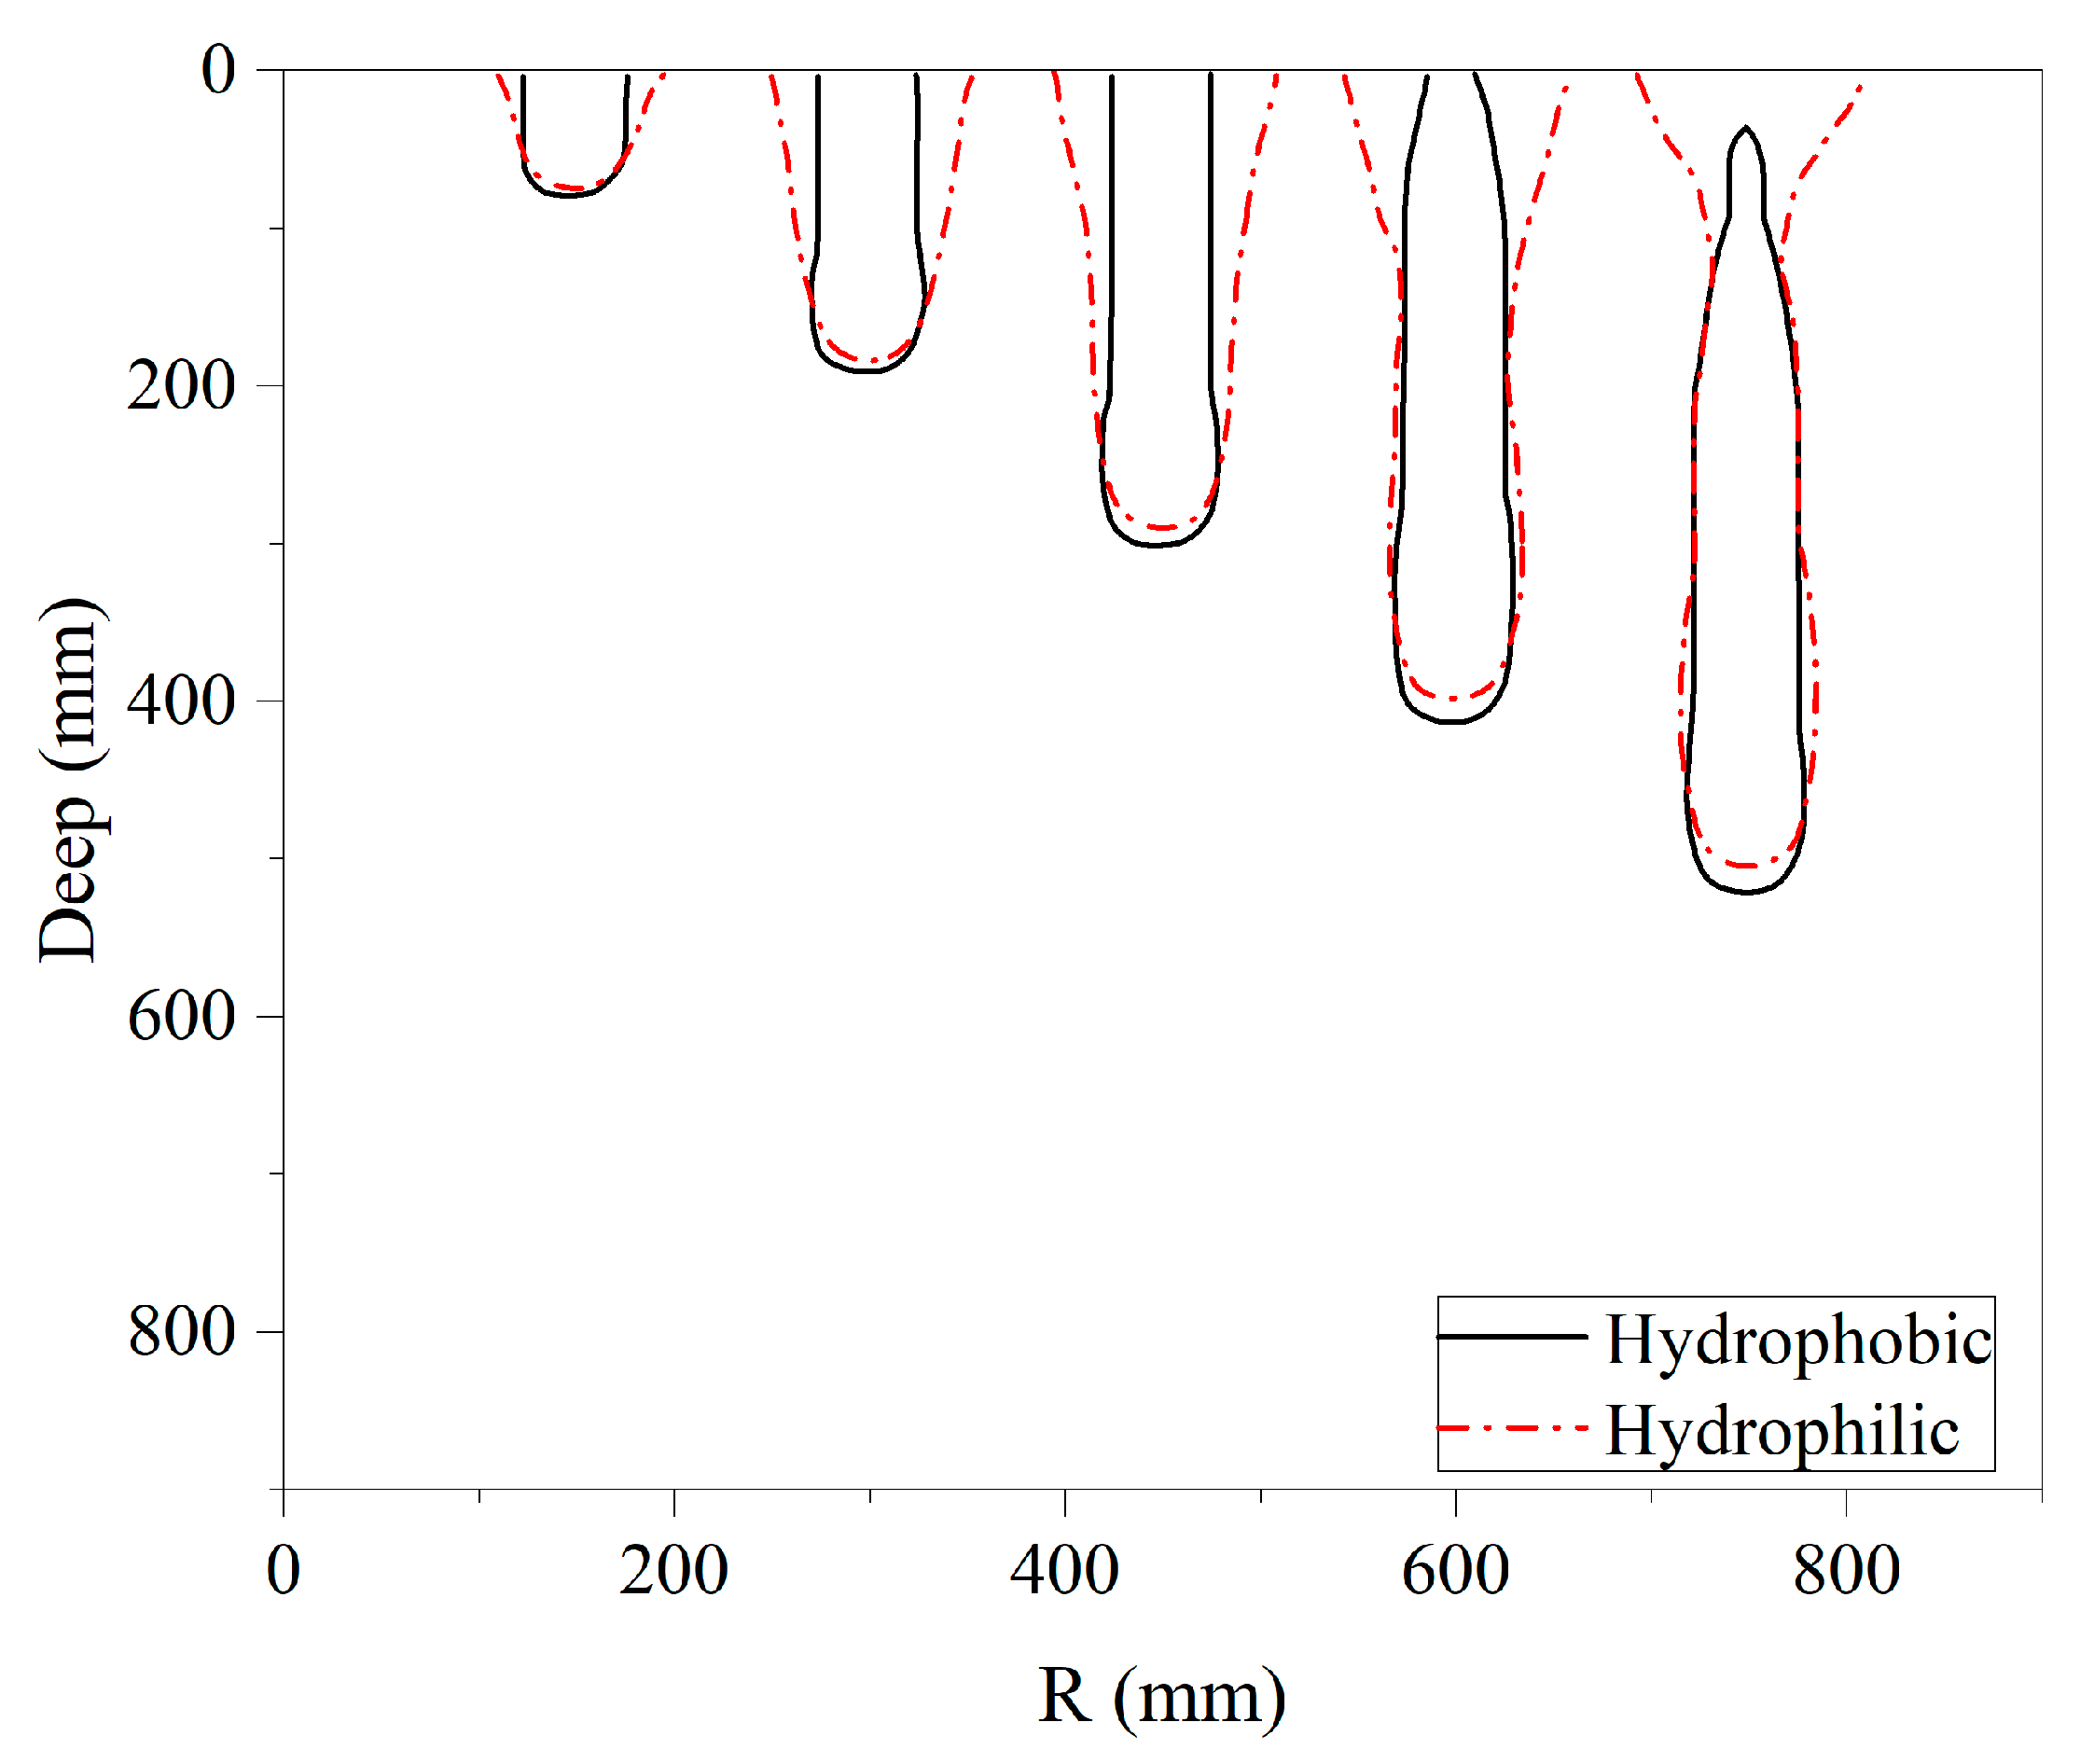
To further study the process of the ballistic changes to the model, this paper includes the water entry cavity diagram of the hydrophilic and hydrophobic models with a water entry velocity of 3.95 m/s and a head shape hemispherical angle (as shown in Figure 28). The solid line in the figure represents the extraction map of the hydrophilic model entering the water, and the dotted line is the extraction map of the hydrophobic model entering the water. It can be seen from the figure that, throughout the whole process of the hydrophobic model entering the water, the vacuoles produced from the head entering the water to the cavity left by the tail entering the water are always larger than those produced by the hydrophilic model entering the water. During the entire water entry process, the water entry cavities of the hydrophilic model represented by the solid line are always on the dotted line, that is, above the water entry cavities of the hydrophobic model. The hydrophobic model shows a larger displacement in the water and a smaller attenuation of the velocity. This is consistent with the conclusion obtained above.
4. Conclusions
Based on the self-designed launch platform, we conducted vertical launch experiments on scaled models with different head shapes, surface properties and launch speeds. Through the further analysis of the unsteady cavity phenomenon and the underwater movement of the underwater projectile, the following conclusions can be drawn:
- (1)
- When an underwater projectile enters the water vertically at a low speed, its surface properties have an important influence on the generation of the cavity in the water, and the hydrophobic surface is more likely to generate a cavity. When the initial velocity of the water entry is 3.95 m/s, the 90-degree hemispherical angle hydrophobic surface model produces the largest cavitation diameter during water entry, which is 25% larger than that of the other models.
- (2)
- The influencing factors of the water entry ballistics are often the combined effects of the underwater projectile’s head shape, water entry speed and impact angle.
- (3)
- The internal relationship between the shape of the cavity and the ballistic characteristics is based on the premise that the cavity causes the force on the model to become complicated, and the cavity will affect the ballistic characteristics of the model by affecting the force on the model.
- (4)
- At different speeds, the speed of the hydrophilic surface models with head hemisphere angles of 57 degrees and 70 degrees entering the water is the fastest, penetrating 10% deeper than the hydrophobic model with a hemispherical angle of 90 degrees at the same initial speed.
Author Contributions
All authors made substantially equal contributions in the formation of the objectives of this paper and the discussion and analysis of the results. P.X. and H.Z. completed all the experiments and data processing under the guidance of Y.S., and G.P., P.X. completed the manuscript under the supervision of Y.S. All authors have read and agreed to the published version of the manuscript.
Funding
We are thankful to the National Natural Science Foundation of China (grant Nos. U21B2055 and 52171324) and the Fundamental Research Funds for the Central Universities (grant No. 3102019JC006) for their financial support of our research.
Institutional Review Board Statement
Not applicable.
Informed Consent Statement
Not applicable.
Data Availability Statement
All data and models generated or used during the research period appear in the submitted manuscript.
Conflicts of Interest
The authors declare no conflict of interest and unanimously agreed to submit the manuscript to the journal.
References
- Duez, C.; Ybert, C.; Clanet, C.; Bocquet, L. Making a splash with water repellency. Nat. Phys. 2007, 3, 180–183. [Google Scholar] [CrossRef] [Green Version]
- Zhou, B.; Liu, H.; Zhang, G.; Han, X.; Wang, X.; Tan, S.-K. Numerical Simulation of Cavity Dynamics and Motion Characteristics for Water Entry of a Hydrophobic Sphere at Various Speeds and Angles. J. Eng. Mech. 2020, 146, 04020091. [Google Scholar] [CrossRef]
- Chaudhry, A.Z.; Shi, Y.; Pan, G. Recent developments on the water entry impact of wedges and projectiles. Ships Offshore Struct. 2022, 17, 695–714. [Google Scholar] [CrossRef]
- Von Karman, T. The Impact on Seaplane Floats during Landing; NACA TN321; National Advisory Committee for Aeronautics: Washington, DC, USA, 1929.
- Logvinovich, G.V. Hydrodynamics of Free-Boundary Flows; Israel Program for Scientific Translation: Washington, DC, USA, 1972. [Google Scholar]
- Mirzaei, M.; Taghvaei, H.; Golneshan, A.A. Improvement of cavity shape modeling in water-entry of circular cylinders by considering the cavity memory effect. Appl. Ocean Res. 2020, 97, 102073. [Google Scholar] [CrossRef]
- Richardson, E.G. The impact of a solid on a liquid surface. Proc. Phys. Soc. 1948, 61, 352. [Google Scholar] [CrossRef]
- May, A. Water Entry and the Cavity-Running Behavior of Missiles; Navsea Hydroballistics Advisory Committee: Silver Spring, MD, USA, 1975. [Google Scholar]
- May, A. Vertical entry of missiles into water. J. Appl. Phys. 1952, 23, 1362–1372. [Google Scholar] [CrossRef]
- May, A. Effect of surface condition of a sphere on its water-entry cavity. J. Appl. Phys. 1951, 22, 1219–1222. [Google Scholar] [CrossRef]
- Yves-Marie, S. Oblique water entry of a three dimensional body. Int. J. Nav. Archit. Ocean Eng. 2014, 6, 1197–1208. [Google Scholar] [CrossRef]
- Chen, C.; Yuan, X.; Liu, X.; Dang, J. Experimental and numerical study on the oblique water-entry impact of a cavitating vehicle with a disk cavitator. Int. J. Nav. Archit. Ocean Eng. 2019, 11, 482–494. [Google Scholar] [CrossRef]
- Sun, T.; Wang, H.; Zou, L.; Zong, Z.; Li, H. Experimental study on the cavity dynamics of oblique impact of sphere on a viscous liquid floating on water. Ocean Eng. 2019, 194, 106597. [Google Scholar] [CrossRef]
- Shi, Y.; Ren, J.; Gao, S.; Pan, G. Numerical Investigation on Air Film Fusion of Pressure-Equalizing Exhaust around Shoulder Ventilation of Submarine-Launched Vehicle. J. Mar. Sci. Eng. 2021, 10, 39. [Google Scholar] [CrossRef]
- Chen, S.; Shi, Y.; Pan, G.; Gao, S. Experimental Research on Cavitation Evolution and Movement Characteristics of the Projectile during Vertical Launching. J. Mar. Sci. Eng. 2021, 9, 1359. [Google Scholar] [CrossRef]
- Shi, Y.; Gao, S.; Pan, G.; Quan, X. Simulation of the wake vortex and trajectory characteristics of successively launched multiple projectiles. Ocean Eng. 2022, 249, 110962. [Google Scholar] [CrossRef]
- Korobkin, A.; Khabakhpasheva, T.; Malenica, S.; Kim, Y. A comparison study of water impact and water exit models. Int. J. Nav. Archit. Ocean Eng. 2014, 6, 1182–1196. [Google Scholar] [CrossRef]
- Yan, H.; Liu, Y.; Kominiarczuk, J.; Yue, D.K.P. Cavity dynamics in water entry at low Froude numbers. J. Fluid Mech. 2009, 641, 441–461. [Google Scholar] [CrossRef]
- Duclaux, V.; Caillé, F.; Duez, C.; Ybert, C.; Bocquet, L.; Clanet, C. Dynamics of transient cavities. J. Fluid Mech. 2007, 591, 1–19. [Google Scholar] [CrossRef]
- Gilbarg, D.; Anderson, R.A. Influence of atmospheric pressure on the phenomena accompanying the entry of spheres into water. J. Appl. Phys. 1948, 19, 127–139. [Google Scholar] [CrossRef]
- Aristoff, J.M.; Bush, J.W.M. Water entry of small hydrophobic spheres. J. Fluid Mech. 2009, 619, 45–78. [Google Scholar] [CrossRef]
- Abelson, H.I. Pressure in the water-entry cavity. J. Fluid Mech. 1970, 44, 129–144. [Google Scholar] [CrossRef]
- Truscott, T.T.; Techet, A.H. Water entry of spinning spheres. J. Fluid Mech. 2009, 625, 135–165. [Google Scholar] [CrossRef]
- Yu, P.; Shen, C.; Zhen, C.; Tang, H.; Wang, T. Parametric Study on the Free-Fall Water Entry of a Sphere by Using the RANS Method. J. Mar. Sci. Eng. 2019, 7, 122. [Google Scholar] [CrossRef] [Green Version]
- Li, Q.; Lu, L. Numerical investigations of cavity nose structure of a high-speed projectile impact on water-entry characteristics. J. Mar. Sci. Eng. 2020, 8, 265. [Google Scholar] [CrossRef] [Green Version]
- Li, J.; Wei, Y.; Sun, W.; Wang, C. Water-entry cavity experiments of hydrophilic and super-hydrophobic hot spheres. J. Vib. Shock 2019, 7, 35–41. (In Chinese) [Google Scholar]
- Sun, Z.; Cao, W.; Wang, C. Numerical Simulation of Cavity and Hydrodynamic Force of the Sphere Water Entry in Consideration of Surface Wettability. J. Ship Mech. 2019, 23, 1057–1069. [Google Scholar]
- Sun, Z.; Wang, C.; Cao, W. Numerical Investigations on Water-entry Cavity of Half Hydrophobic-half Hydrophilic Sphere. Acta Armament ARII 2017, 38, 968–977. [Google Scholar]
- Yang, H.; Zhang, A.; Gong, X.; Yao, X. Experimental study of the cavity of low speed water entry of different head shape projectiles. J. Harbin Eng. Univ. 2014, 35, 1060–1066. (In Chinese) [Google Scholar]
- Sudo, S.; Takayanagi, H.; Kamiyama, S. Water entry of a magnetic fluid coated sphere. J. Magn. Magn. Mater. 2011, 323, 1348–1353. [Google Scholar] [CrossRef]
- Bush, J.W.M.; Aristoff, J.M. The influence of surface tension on the circular hydraulic jump. J. Fluid Mech. 2003, 489, 229–238. [Google Scholar] [CrossRef] [Green Version]
- Shi, Y.; Wang, G.; Pan, G. Experimental study on cavity dynamics of projectile water entry with different physical parameters. Phys. Fluids 2019, 31, 067103. [Google Scholar]
- Shi, Y.; Pan, G.; Yan, G.-X.; Yim, S.C.; Jiang, J. Numerical study on the cavity characteristics and impact loads of AUV water entry. Appl. Ocean Res. 2019, 89, 44–58. [Google Scholar] [CrossRef]
Figure 1.
Projectile launcher.

Figure 2.
Overall view of the experimental device.

Figure 3.
Five head shapes. The hemispherical angles from left to right are 0°, 57°, 70°, 90°, 180°.
Figure 3.
Five head shapes. The hemispherical angles from left to right are 0°, 57°, 70°, 90°, 180°.

Figure 4.
Model physical map.

Figure 5.
Hemispherical radius of the head.

Figure 6.
Droplet contact shape and contact angle.

Figure 7.
Hydrophobic surface contact angle measurement.

Figure 8.
Evolution process of the water cavity upon entry. (a) Flow formation. (b) Open cavity. (c) Cavities closure. (d) Cavities collapse.
Figure 8.
Evolution process of the water cavity upon entry. (a) Flow formation. (b) Open cavity. (c) Cavities closure. (d) Cavities collapse.

Figure 9.
The 90-degree hydrophobic model’s ballistic curve at an initial speed of 2.2 m/s.

Figure 10.
The experimental diagram of the hydrophilic model entering the water at a speed of 2.2 m/s.
Figure 10.
The experimental diagram of the hydrophilic model entering the water at a speed of 2.2 m/s.

Figure 11.
The splash diagram of the hydrophilic model with the initial velocity of water entry v = 2.2 m/s and the head shape hemispherical angle of 0°.
Figure 11.
The splash diagram of the hydrophilic model with the initial velocity of water entry v = 2.2 m/s and the head shape hemispherical angle of 0°.

Figure 12.
The experimental diagram of the model entering the water at a speed of 3.95 m/s.


Figure 13.
The splash diagram of the hydrophilic model with the initial velocity of water entry v = 3.95 m/s and the head shape hemispherical angle of 0°.
Figure 13.
The splash diagram of the hydrophilic model with the initial velocity of water entry v = 3.95 m/s and the head shape hemispherical angle of 0°.

Figure 14.
Experiment diagram of model entering water at a speed of 2.2 m/s.


Figure 15.
The splash diagram of the hydrophobic model with the initial velocity of water entry v = 2.2 m/s and the head shape hemispherical angle of 0°.
Figure 15.
The splash diagram of the hydrophobic model with the initial velocity of water entry v = 2.2 m/s and the head shape hemispherical angle of 0°.

Figure 16.
Experimental diagram of the hydrophobic model water entry at a speed of 3.95 m/s.

Figure 17.
The splash diagram of the hydrophobic model at the initial velocity v = 3.95 m/s. (a) The semi-spherical splash in the case of a hemispherical angle of 0°. (b) Splashes break in the case of a hemispherical angle of 57°.
Figure 17.
The splash diagram of the hydrophobic model at the initial velocity v = 3.95 m/s. (a) The semi-spherical splash in the case of a hemispherical angle of 0°. (b) Splashes break in the case of a hemispherical angle of 57°.

Figure 18.
The partial splash map of the hydrophobic model at the initial velocity v = 3.95 m/s.

Figure 19.
The splash height–time curve of the hydrophobic model. (a) The initial velocity v = 2.2 m/s. (b) The initial velocity v = 3.95 m/s.
Figure 19.
The splash height–time curve of the hydrophobic model. (a) The initial velocity v = 2.2 m/s. (b) The initial velocity v = 3.95 m/s.

Figure 20.
The splash diameter–time curve of the hydrophobic model. (a) The initial velocity v = 2.2 m/s. (b) The initial velocity v = 3.95 m/s.
Figure 20.
The splash diameter–time curve of the hydrophobic model. (a) The initial velocity v = 2.2 m/s. (b) The initial velocity v = 3.95 m/s.

Figure 21.
Schematic diagram of the tail cavity.

Figure 22.
Cavity development and secondary closure.

Figure 23.
Cavity wall expansion.

Figure 24.
The total water entry times of different hemispherical angular head shape models. (a) The initial velocity v = 2.2 m/s. (b) The initial velocity v = 3.95 m/s.
Figure 24.
The total water entry times of different hemispherical angular head shape models. (a) The initial velocity v = 2.2 m/s. (b) The initial velocity v = 3.95 m/s.

Figure 25.
Cavity depths of the water entry at a water entry velocity of 3.95 m/s. (a) Cavity at the tail. (b) Cavity at the head.
Figure 25.
Cavity depths of the water entry at a water entry velocity of 3.95 m/s. (a) Cavity at the tail. (b) Cavity at the head.

Figure 26.
Hydrophobic model vacuolar diameter–time curve (v = 3.95 m/s).

Figure 27.
Hydrophilic/hydrophobic model’s ballistic curve. (a) The initial velocity v = 2.2 m/s. (b) The initial velocity v = 3.95 m/s.
Figure 27.
Hydrophilic/hydrophobic model’s ballistic curve. (a) The initial velocity v = 2.2 m/s. (b) The initial velocity v = 3.95 m/s.

Figure 28.
Comparison of the water entry vacuoles for the hydrophilic/hydrophobic model with a head shape hemispherical angle of 90° (the water entry times from left to right in the figure are 20, 40, 60, 80, 100 ms).
Figure 28.
Comparison of the water entry vacuoles for the hydrophilic/hydrophobic model with a head shape hemispherical angle of 90° (the water entry times from left to right in the figure are 20, 40, 60, 80, 100 ms).


Table 1.
Model parameters.
| Mass | Length | Diameter | Centroid Offset |
|---|---|---|---|
| 0.492 kg | 0.344 m | 0.04 m | 0 |
Table 2.
Water entry parameters.
| Release Height | |||
|---|---|---|---|
| 20 cm | 2.2 m/s | 10.20 | 79,856 |
| 80 cm | 3.95 m/s | 40.82 | 159,712 |
Table 3.
Water splash experiment data of the hydrophilic model.
| Initial Speed | Hemispherical Angle | Time of Occurrence of Maximum Splash Height | Splash Height | Splash Diameter |
|---|---|---|---|---|
| 2.2 m/s | 0° | 45 ms | 20.75 mm | 43.81 mm |
| 57° | 45 ms | 18.04 mm | 46.27 mm | |
| 70° | 30 ms | 19.97 mm | 43.77 mm | |
| 90° | 38 ms | 20.73 mm | 41.20 mm | |
| 180° | 30 ms | 18.46 mm | 41.54 mm | |
| 3.95 m/s | 0° | 13 ms | 32.00 mm | 59.20 mm |
| 57° | 8 ms | 20.75 mm | 53.04 mm | |
| 70° | 22 ms | 47.66 mm | 77.63 mm | |
| 90° | 13 ms | 39.20 mm | 85.61 mm | |
| 180° | 10 ms | 38.86 mm | 64.31 mm |
Publisher’s Note: MDPI stays neutral with regard to jurisdictional claims in published maps and institutional affiliations. |
© 2022 by the authors. Licensee MDPI, Basel, Switzerland. This article is an open access article distributed under the terms and conditions of the Creative Commons Attribution (CC BY) license (https://creativecommons.org/licenses/by/4.0/).
Share and Cite
MDPI and ACS Style
Shi, Y.; Xiao, P.; Zhao, H.; Pan, G. Experimental Research on the Influences of Head Shape and Surface Properties on the Water Entry Cavity. J. Mar. Sci. Eng. 2022, 10, 1411. https://doi.org/10.3390/jmse10101411
AMA Style
Shi Y, Xiao P, Zhao H, Pan G. Experimental Research on the Influences of Head Shape and Surface Properties on the Water Entry Cavity. Journal of Marine Science and Engineering. 2022; 10(10):1411. https://doi.org/10.3390/jmse10101411
Chicago/Turabian StyleShi, Yao, Peng Xiao, Hairui Zhao, and Guang Pan. 2022. "Experimental Research on the Influences of Head Shape and Surface Properties on the Water Entry Cavity" Journal of Marine Science and Engineering 10, no. 10: 1411. https://doi.org/10.3390/jmse10101411
Note that from the first issue of 2016, this journal uses article numbers instead of page numbers. See further details here.