Author Contributions
Conceptualization, S.I., H.S. and Y.N.; methodology, S.I., H.S. and Y.N.; software, S.I. and H.S.; validation, S.I., H.S. and Y.N.; formal analysis, S.I., H.S. and Y.N.; investigation, S.I. and Y.N.; resources, S.I. and Y.N.; data curation, S.I. and Y.N.; writing—original draft preparation, S.I.; writing—review and editing, S.I. and Y.N.; visualization, S.I.; supervision, S.I.; project administration, S.I., H.S. and Y.N.; funding acquisition, Y.N. All authors have read and agreed to the published version of the manuscript.
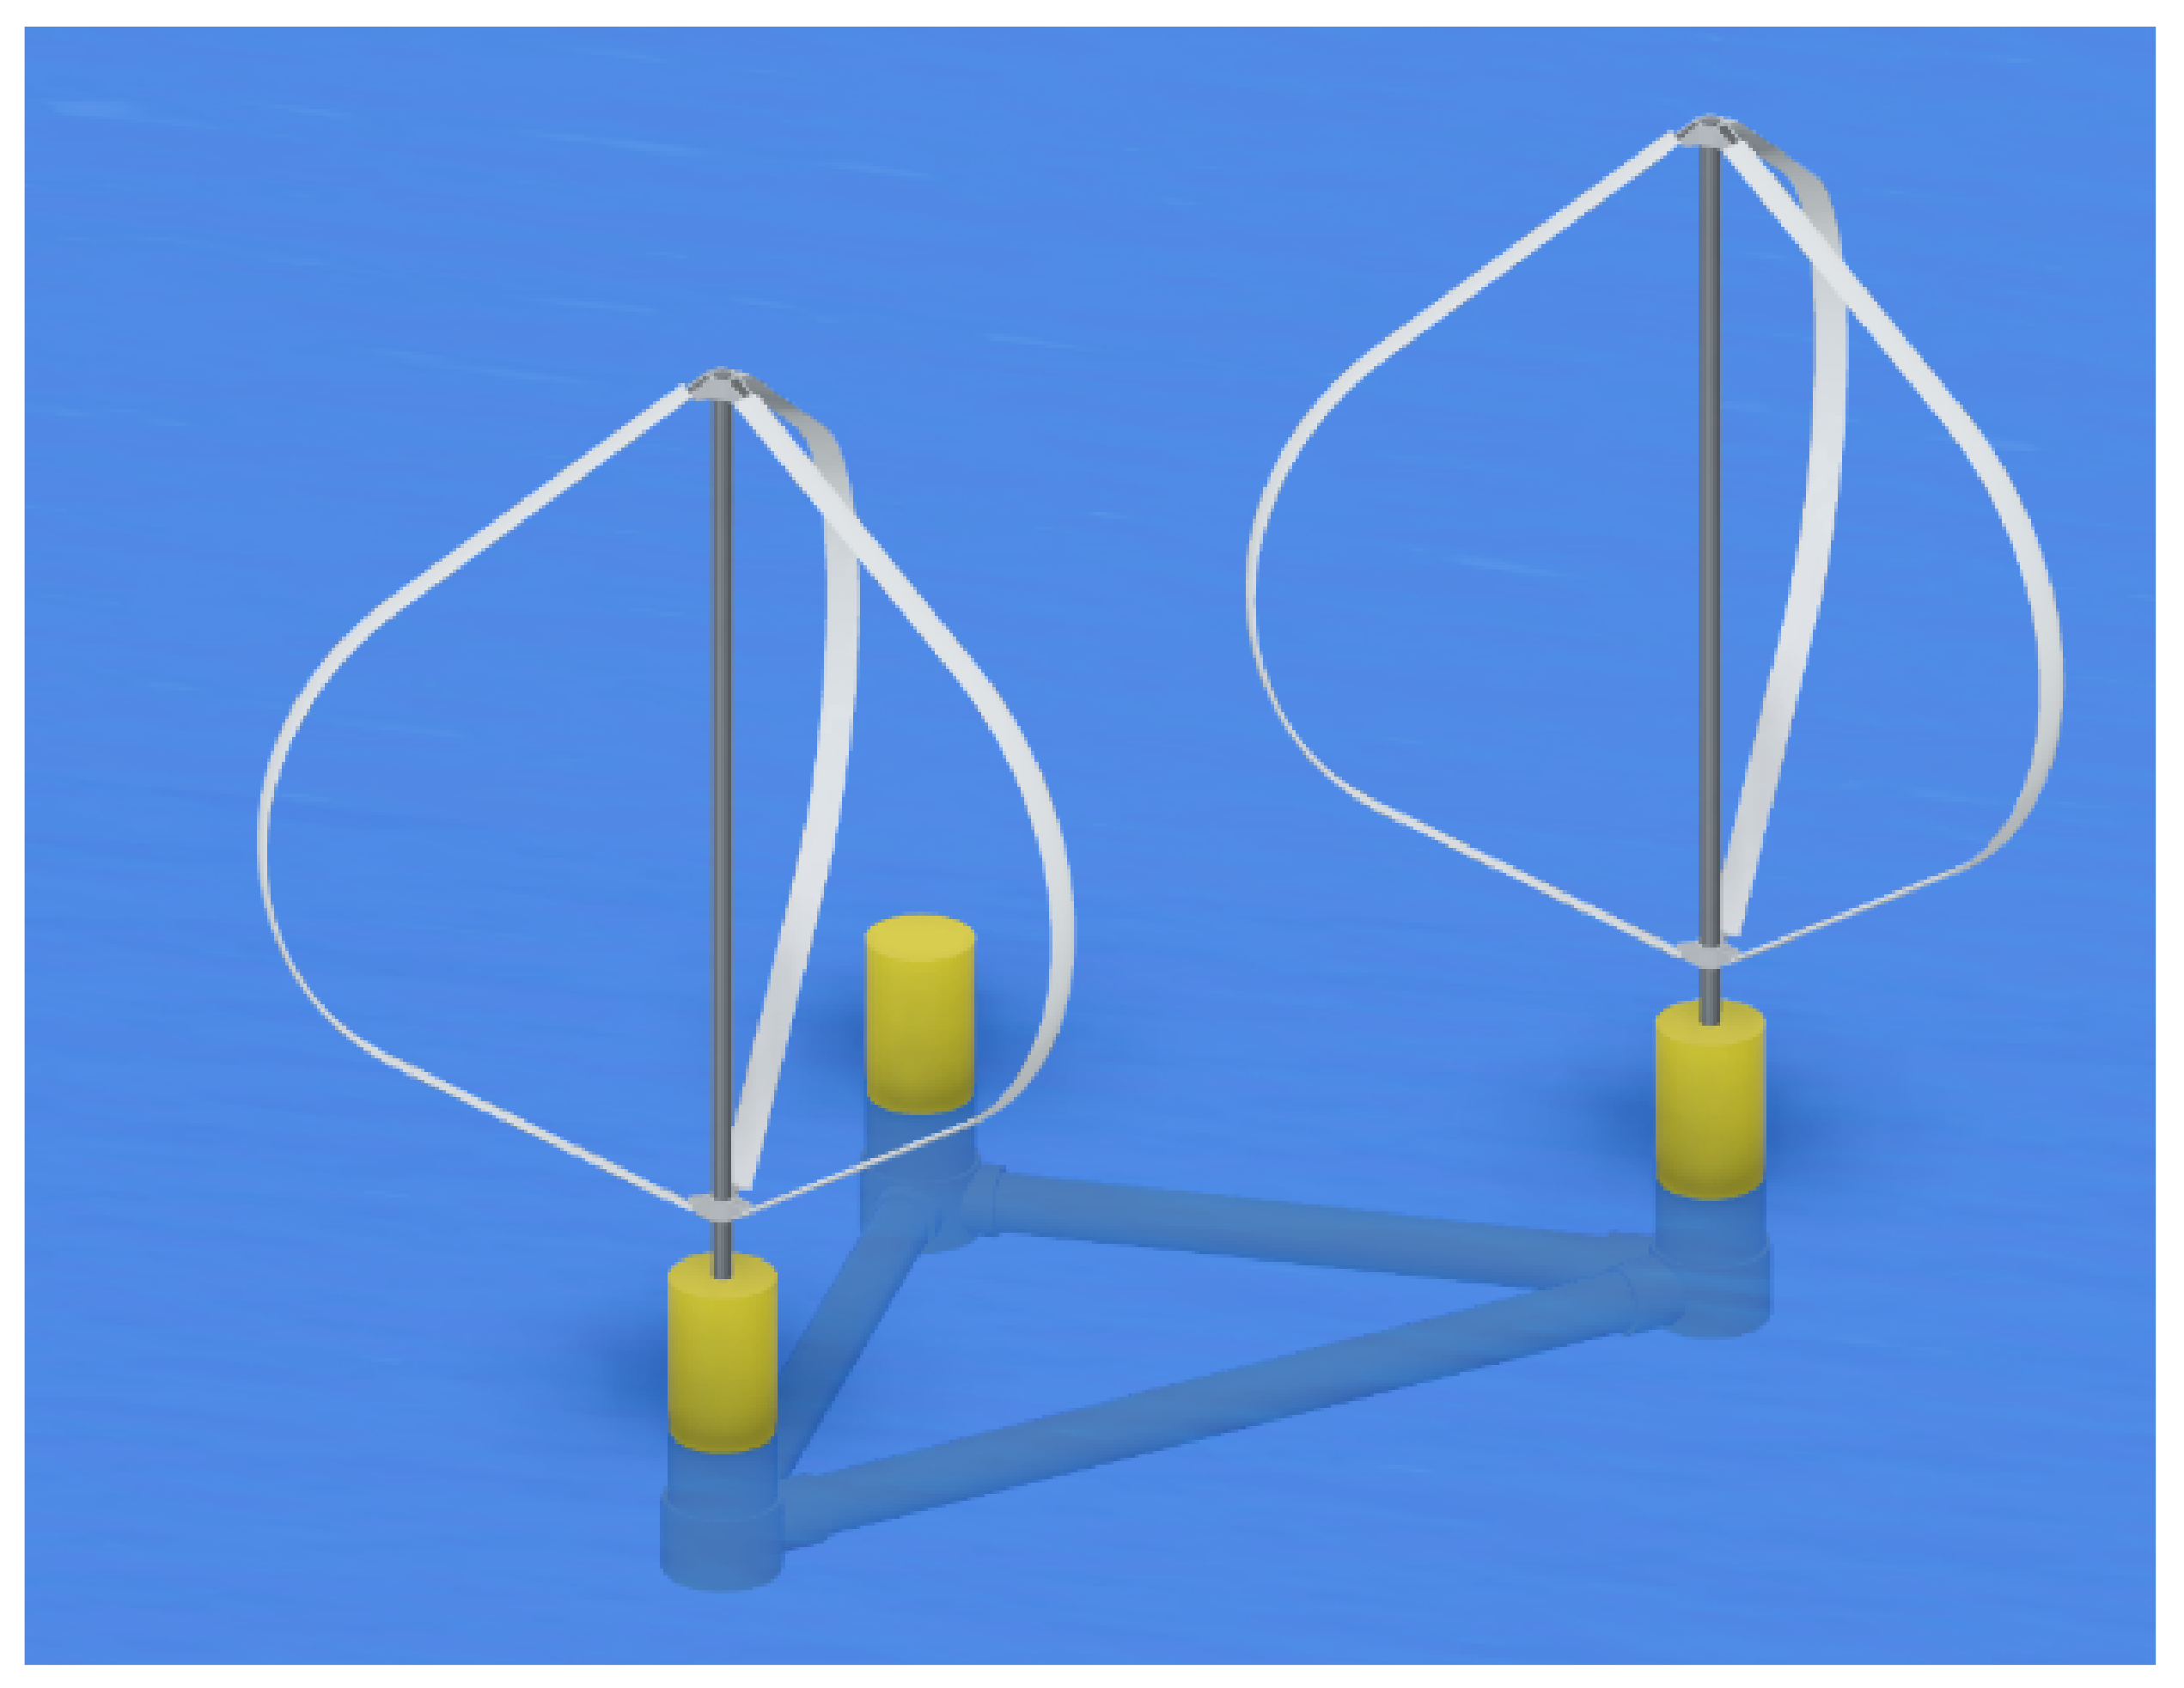
Figure 1.
Conceptual image of double-rotor VAWTs.
Figure 1.
Conceptual image of double-rotor VAWTs.
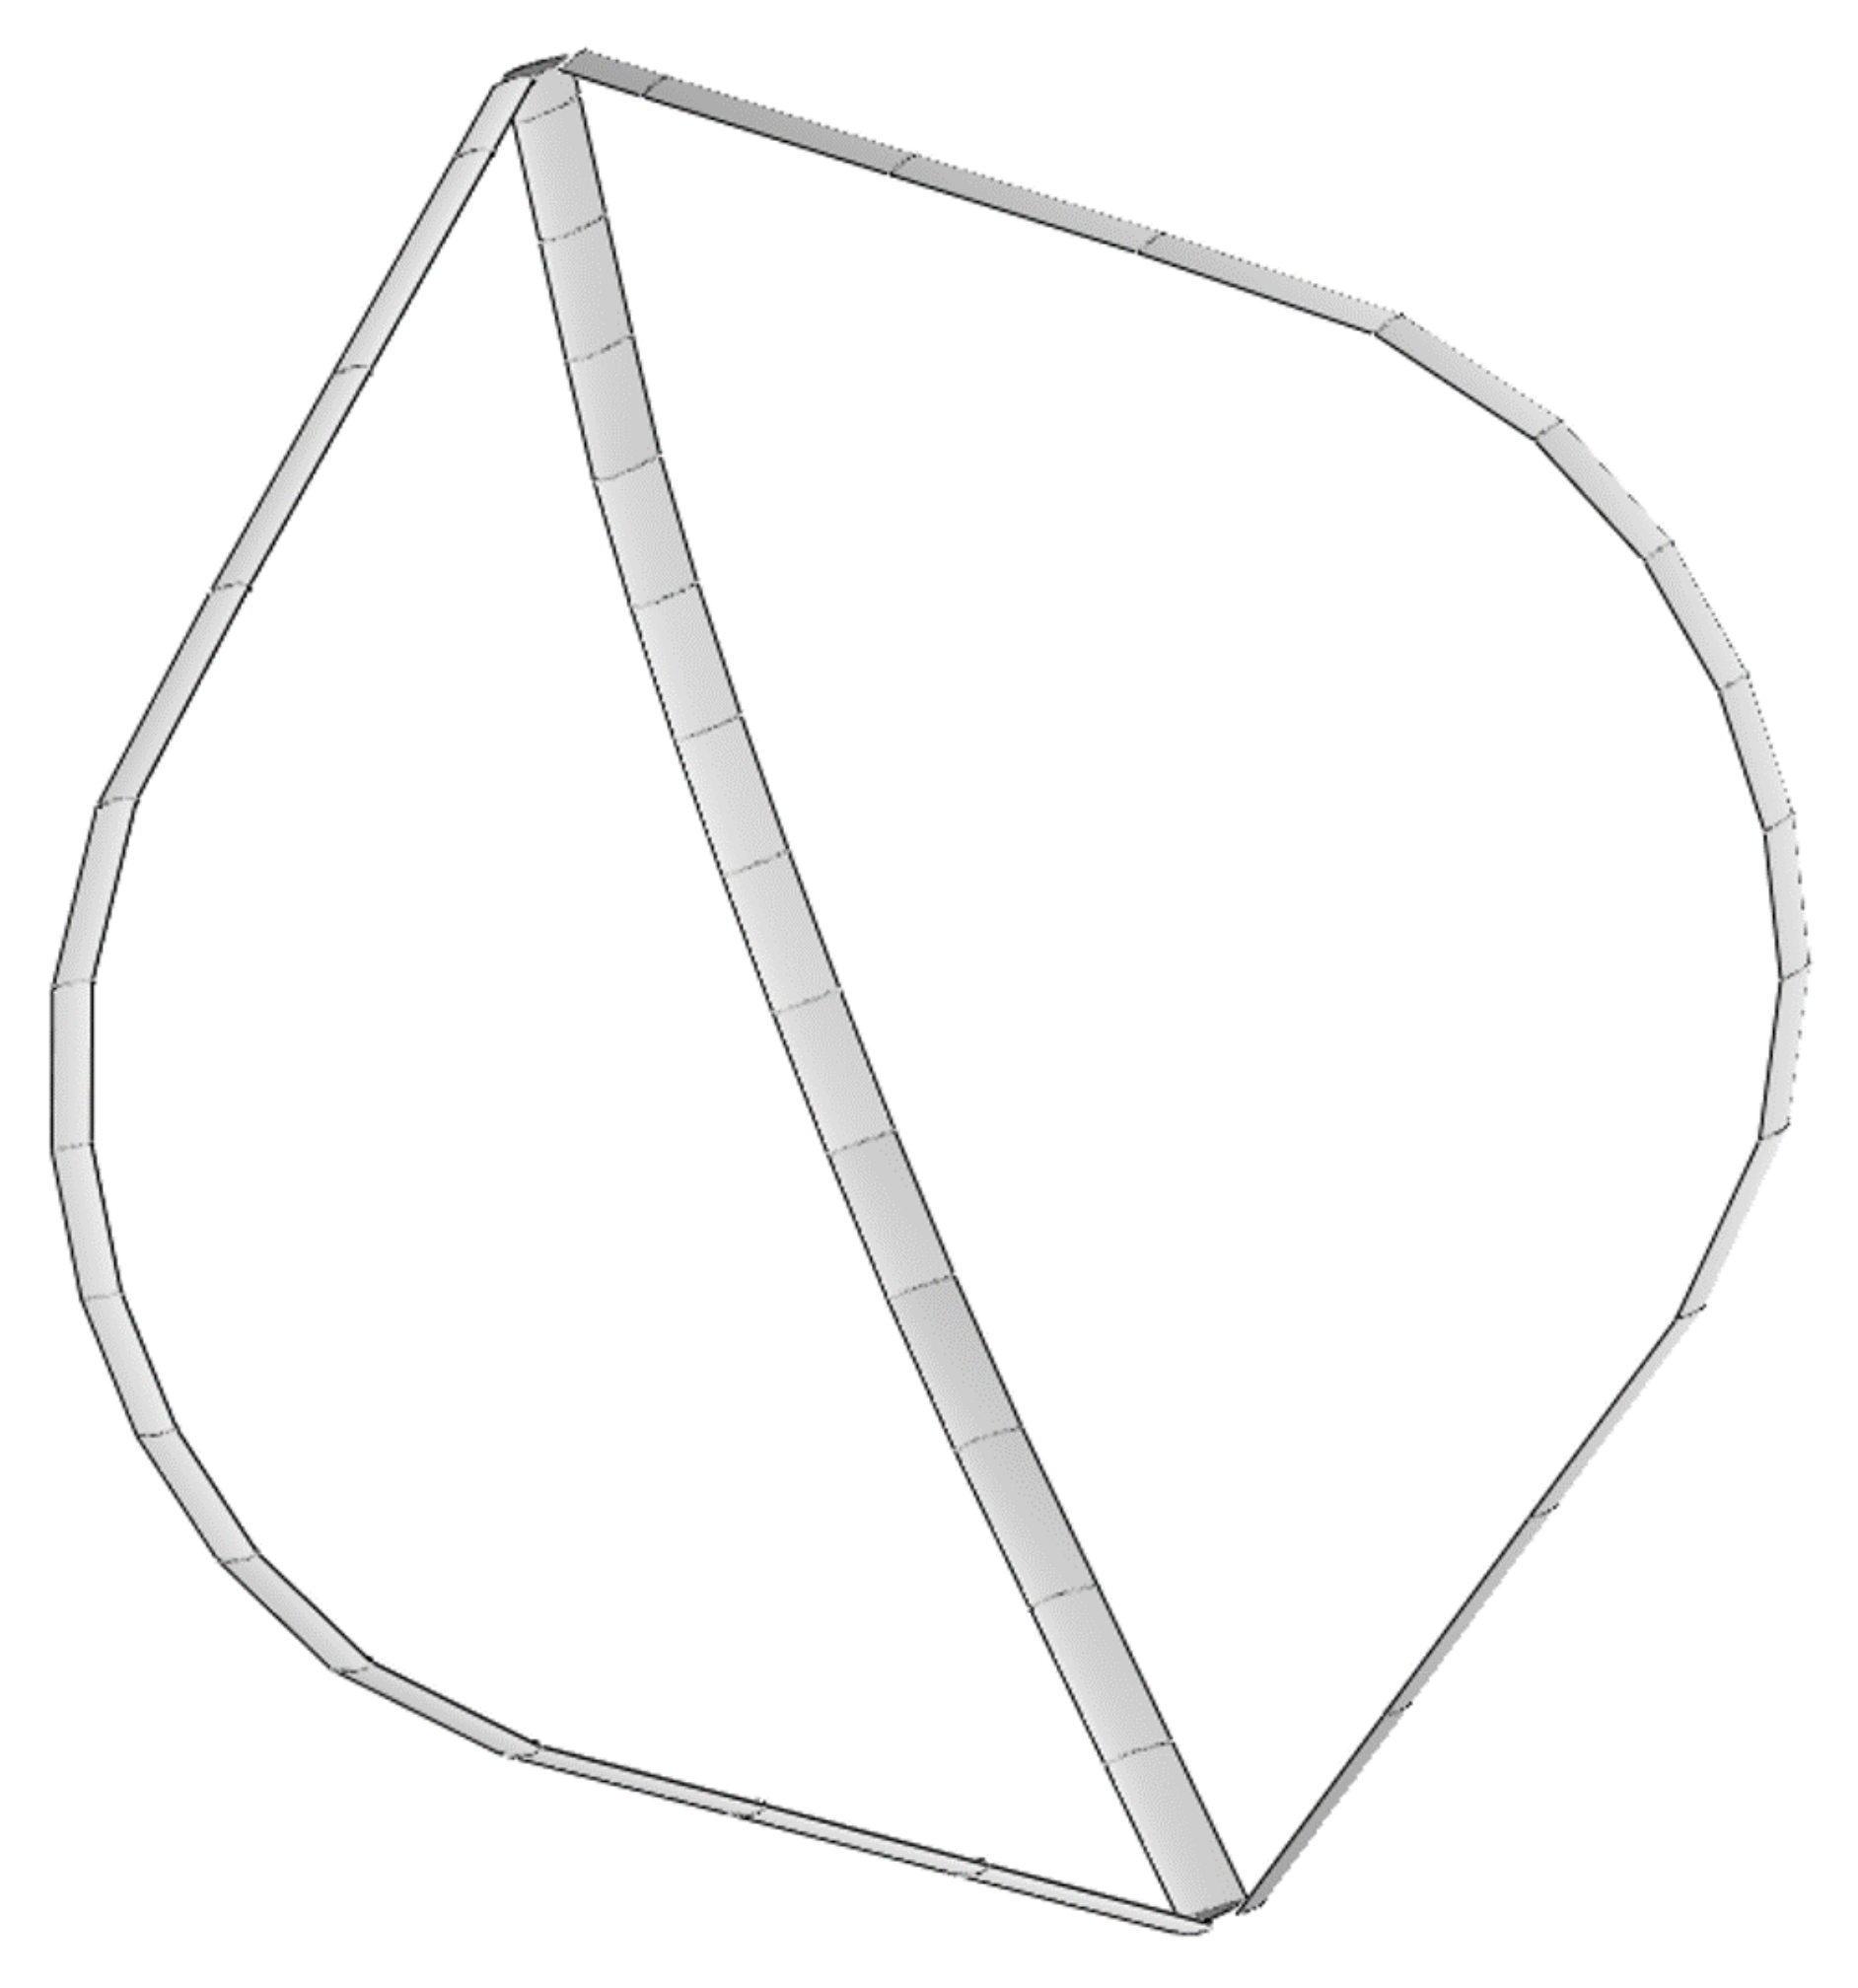
Figure 2.
Actual blade shape (NACA0018).
Figure 2.
Actual blade shape (NACA0018).
Figure 3.
VAWT full scale model.
Figure 3.
VAWT full scale model.
Figure 4.
Power results from QBlade.
Figure 4.
Power results from QBlade.
Figure 5.
Thrust results from QBlade.
Figure 5.
Thrust results from QBlade.
Figure 6.
Power coefficient results from QBlade.
Figure 6.
Power coefficient results from QBlade.
Figure 7.
Thrust coefficient from QBlade.
Figure 7.
Thrust coefficient from QBlade.
Figure 8.
Full scale float model from top.
Figure 8.
Full scale float model from top.
Figure 9.
Full scale float model from front.
Figure 9.
Full scale float model from front.
Figure 10.
Experimental Model.
Figure 10.
Experimental Model.
Figure 11.
Stainless core.
Figure 11.
Stainless core.
Figure 14.
Results of thrust test.
Figure 14.
Results of thrust test.
Figure 15.
Outline of scale model installation.
Figure 15.
Outline of scale model installation.
Figure 16.
Installed scale model.
Figure 16.
Installed scale model.
Figure 17.
Mooring system of scale model.
Figure 17.
Mooring system of scale model.
Figure 19.
Method of measuring bending strain with strain gauge.
Figure 19.
Method of measuring bending strain with strain gauge.
Figure 21.
Strain gauge coordinate axes.
Figure 21.
Strain gauge coordinate axes.
Figure 22.
Installed strain gauge.
Figure 22.
Installed strain gauge.
Figure 23.
UTWind and QBlade calculation flow diagram.
Figure 23.
UTWind and QBlade calculation flow diagram.
Figure 24.
Beam Model in the UTWind.
Figure 24.
Beam Model in the UTWind.
Figure 25.
Relationship between slenderness ratio of cylinders and wave period.
Figure 25.
Relationship between slenderness ratio of cylinders and wave period.
Figure 26.
Tower elements of UTWind.
Figure 26.
Tower elements of UTWind.
Figure 27.
First-order surge motion RAO in wave.
Figure 27.
First-order surge motion RAO in wave.
Figure 28.
First-order heave motion RAO in wave.
Figure 28.
First-order heave motion RAO in wave.
Figure 29.
First-order pitch motion RAO in wave.
Figure 29.
First-order pitch motion RAO in wave.
Figure 30.
Experimental results of bending moments measured by strain gauge-A (Connection point between wind column and Pontoon1): (a) strain gauge-A1. (b) strain gauge-A2.
Figure 30.
Experimental results of bending moments measured by strain gauge-A (Connection point between wind column and Pontoon1): (a) strain gauge-A1. (b) strain gauge-A2.
Figure 31.
Experimental results of bending moments measured by strain gauge-B (Connection point between wind column and Pontoon2): (a) strain gauge-B1. (b) strain gauge-B2.
Figure 31.
Experimental results of bending moments measured by strain gauge-B (Connection point between wind column and Pontoon2): (a) strain gauge-B1. (b) strain gauge-B2.
Figure 32.
Experimental results of bending moments measured by strain gauge-C (Center of Pontoon2): (a) strain gauge-C1. (b) strain gauge-C2.
Figure 32.
Experimental results of bending moments measured by strain gauge-C (Center of Pontoon2): (a) strain gauge-C1. (b) strain gauge-C2.
Figure 33.
Relationship between wavelength ratio and wave period.
Figure 33.
Relationship between wavelength ratio and wave period.
Figure 34.
Comparison of surge motion between experimental and numerical calculations.
Figure 34.
Comparison of surge motion between experimental and numerical calculations.
Figure 35.
Comparison of heave motion between experimental and numerical calculations.
Figure 35.
Comparison of heave motion between experimental and numerical calculations.
Figure 36.
Comparison of pitch motion between experimental and numerical calculations.
Figure 36.
Comparison of pitch motion between experimental and numerical calculations.
Figure 37.
Comparison of experimental and numerical calculation bending moments at the connection position between the wind column and Pontoon1 (comparison of strain gauge-A and UTWind): (a) Bending moment around the y-axis. (b) Bending moment around the z-axis.
Figure 37.
Comparison of experimental and numerical calculation bending moments at the connection position between the wind column and Pontoon1 (comparison of strain gauge-A and UTWind): (a) Bending moment around the y-axis. (b) Bending moment around the z-axis.
Figure 38.
Comparison of experimental and numerical calculation bending moments at the connection position between the wind column and Pontoon2 (comparison of strain gauge-B and UTWind): (a) Bending moment around the y-axis. (b) Bending moment around the z-axis.
Figure 38.
Comparison of experimental and numerical calculation bending moments at the connection position between the wind column and Pontoon2 (comparison of strain gauge-B and UTWind): (a) Bending moment around the y-axis. (b) Bending moment around the z-axis.
Figure 39.
Comparison of experimental and numerical calculation bending moments at the center of Pontoon2 (comparison of strain gauge-C and UTWind): (a) Bending moment around the y-axis. (b) Bending moment around the z-axis.
Figure 39.
Comparison of experimental and numerical calculation bending moments at the center of Pontoon2 (comparison of strain gauge-C and UTWind): (a) Bending moment around the y-axis. (b) Bending moment around the z-axis.
Table 1.
Input data of full scale model for QBlade.
Table 1.
Input data of full scale model for QBlade.
| Number | Height | Chord | Radius | Twist | Circle Angle |
|---|
| 1 | −40.65 | 2.92 | 1.50 | 0 | −2 |
| 2 | −34.55 | 2.92 | 10.90 | 0 | −2 |
| 3 | −28.46 | 2.92 | 20.26 | 0 | −2 |
| 4 | −22.36 | 2.92 | 29.70 | 0 | −2 |
| 5 | −16.26 | 2.92 | 36.10 | 0 | −2 |
| 6 | −10.16 | 2.92 | 39.54 | 0 | −2 |
| 7 | −4.07 | 2.92 | 41.18 | 0 | −2 |
| 8 | 2.03 | 2.92 | 41.42 | 0 | −2 |
| 9 | 8.13 | 2.92 | 40.26 | 0 | −2 |
| 10 | 14.23 | 2.92 | 37.46 | 0 | −2 |
| 11 | 20.33 | 2.92 | 32.30 | 0 | −2 |
| 12 | 26.42 | 2.92 | 23.42 | 0 | −2 |
| 13 | 32.52 | 2.92 | 14.02 | 0 | −2 |
| 14 | 38.62 | 2.92 | 4.62 | 0 | −2 |
| 15 | 40.65 | 2.92 | 1.50 | 0 | −2 |
Table 2.
QBlade analysis conditions.
Table 2.
QBlade analysis conditions.
| Item | Unit | Value |
|---|
| Tower Diameter | m | 3.0 |
| Inflow Speed | m/s | 12.0 |
| Tip Speed Ratio | - | 5.0 |
| Time step size | s | 0.1 |
| Simulation Lengts | s | 60.0 |
Table 3.
Average results (Time = 60.0 s).
Table 3.
Average results (Time = 60.0 s).
| Item | Unit | Only Blade | Blade + Tower |
|---|
| Power | MW | 2.30 | 2.25 |
| Thrust | N | 320,060 | 321,640 |
| Power Coefficient | - | 0.48 | 0.54 |
| Thrust Coefficient | - | 0.26 | 0.26 |
Table 4.
Scale factor.
| Items | Unit | Scale Factor |
|---|
| Length | m | S |
| Time | s | S1/2 |
| Mass | kg | S3 |
| Force | N | S3 |
| Moment | Nm | S4 |
| Flexural rigidity EI | Nm2 | S5 |
Table 5.
Principal particulars of float models.
Table 5.
Principal particulars of float models.
| Items | Unit | Full Scale Model | Scale Model (1:100) |
|---|
| displacement | kg | 29,240,997 | 29.24 |
| draft | m | 20.00 | 0.20 |
| m | 27.75 | 0.28 |
| m | 31.88 | 0.31 |
| Water depth | m | 150.00 | 1.50 |
| s | 18.00 | 1.80 |
| s | 8.0 | 0.8 |
Table 6.
Flexural rigidity EI.
Table 6.
Flexural rigidity EI.
| Part | Unit | Actual Model | Scale Model (1:100) |
|---|
| Mooring column | Pa · m4 | 1.311013 | 1.31103 |
| Wind column | Pa · m4 | 5.271012 | 5.27102 |
| Pontoon1 | Pa · m4 | 2.691012 | 2.69102 |
| Pontoon2 | Pa · m4 | 2.691013 | 2.69102 |
Table 7.
Principal particular of mooring chain.
Table 7.
Principal particular of mooring chain.
| Item | Unit | Value |
|---|
| Material | - | Stainless |
| Mass (wet) | g/cm | 0.96 |
| Length | m | 2.3 |
Table 8.
Principal particular of strain gauge.
Table 8.
Principal particular of strain gauge.
| Item | Value |
|---|
| Gauge Factor (C, 50%) | |
| Gauge Length | 5 mm |
| Gauge Resistance (C, 50%, excluding the leadwires) | |
| Thermal Output | ±1.8 × 10⁻⁶C |
| Temperature Compensation | steel |
| Adoptable Thermal Expansion | 11.7 × 10⁻⁶C |
Table 9.
Test conditions.
Table 9.
Test conditions.
| Item | Unit | Full Scale Model | Scale Model (1:100) |
|---|
| Thrust | N | 0, 320,000 | 0, 0.302 |
| Wave height | m | | |
| Wave period | s | | |
| Water depth | m | 150 | 1.5 |
Table 10.
Added mass and drag coefficient.
Table 10.
Added mass and drag coefficient.
| , | , |
|---|
| 1.0 | 1.2 |
Table 11.
Added mass.
| Total Mass (ton) | Added Mass Mx
(ton) | Added Mass My
(ton) | Added Mass Mz
(ton) |
|---|
| 29,241 | 9646 | 25,860 | 19,400 |


