

Physical Mechanism for Seabed Scouring around a Breakwater—A Case Study in Mailiao Port


Abstract
:1. Introduction
1.1. Scour around Breakwater
- (1)
- General breakwater
- (2)
- Vertical-wall breakwater
- A
- Effect of wave-induced current on breakwater head erosion
- B
- Wave action on breakwater head erosion with foundation protection
- C
- Breakwater head erosion of wave action on vertical breakwater and sloping mount breakwater
1.2. Applying the Hydrodynamic Model to Calculate Wave and Current Field
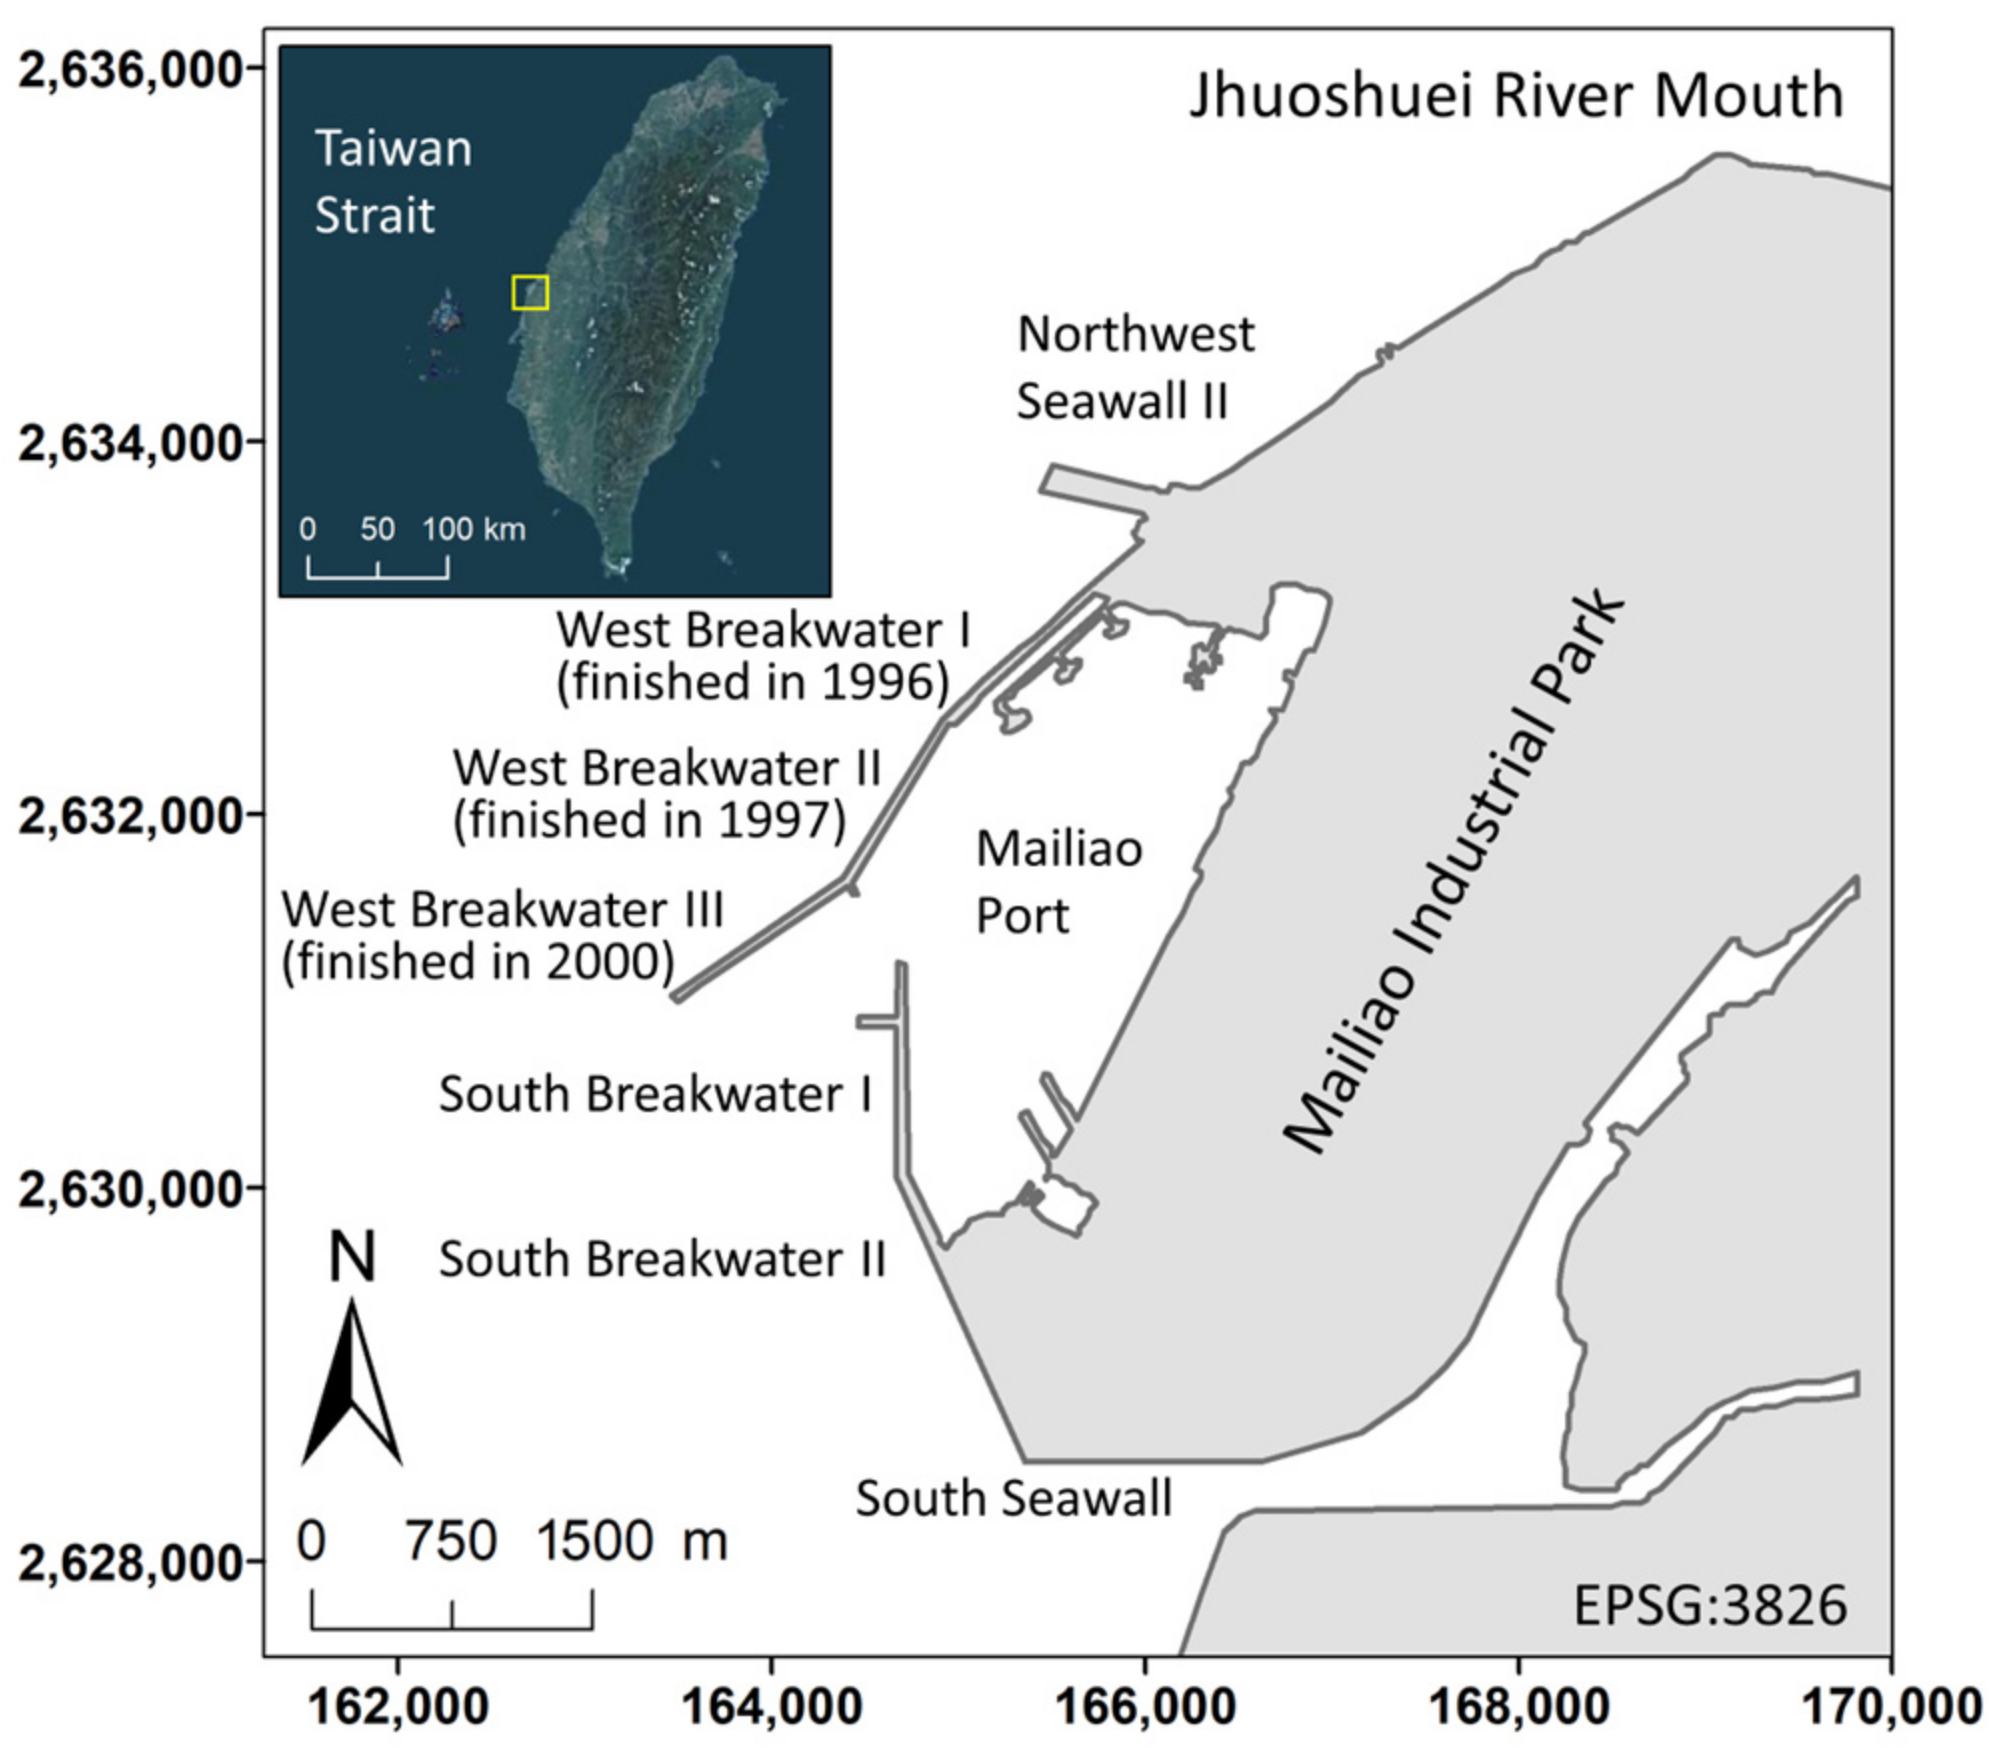
2. Study Area
3. Methods
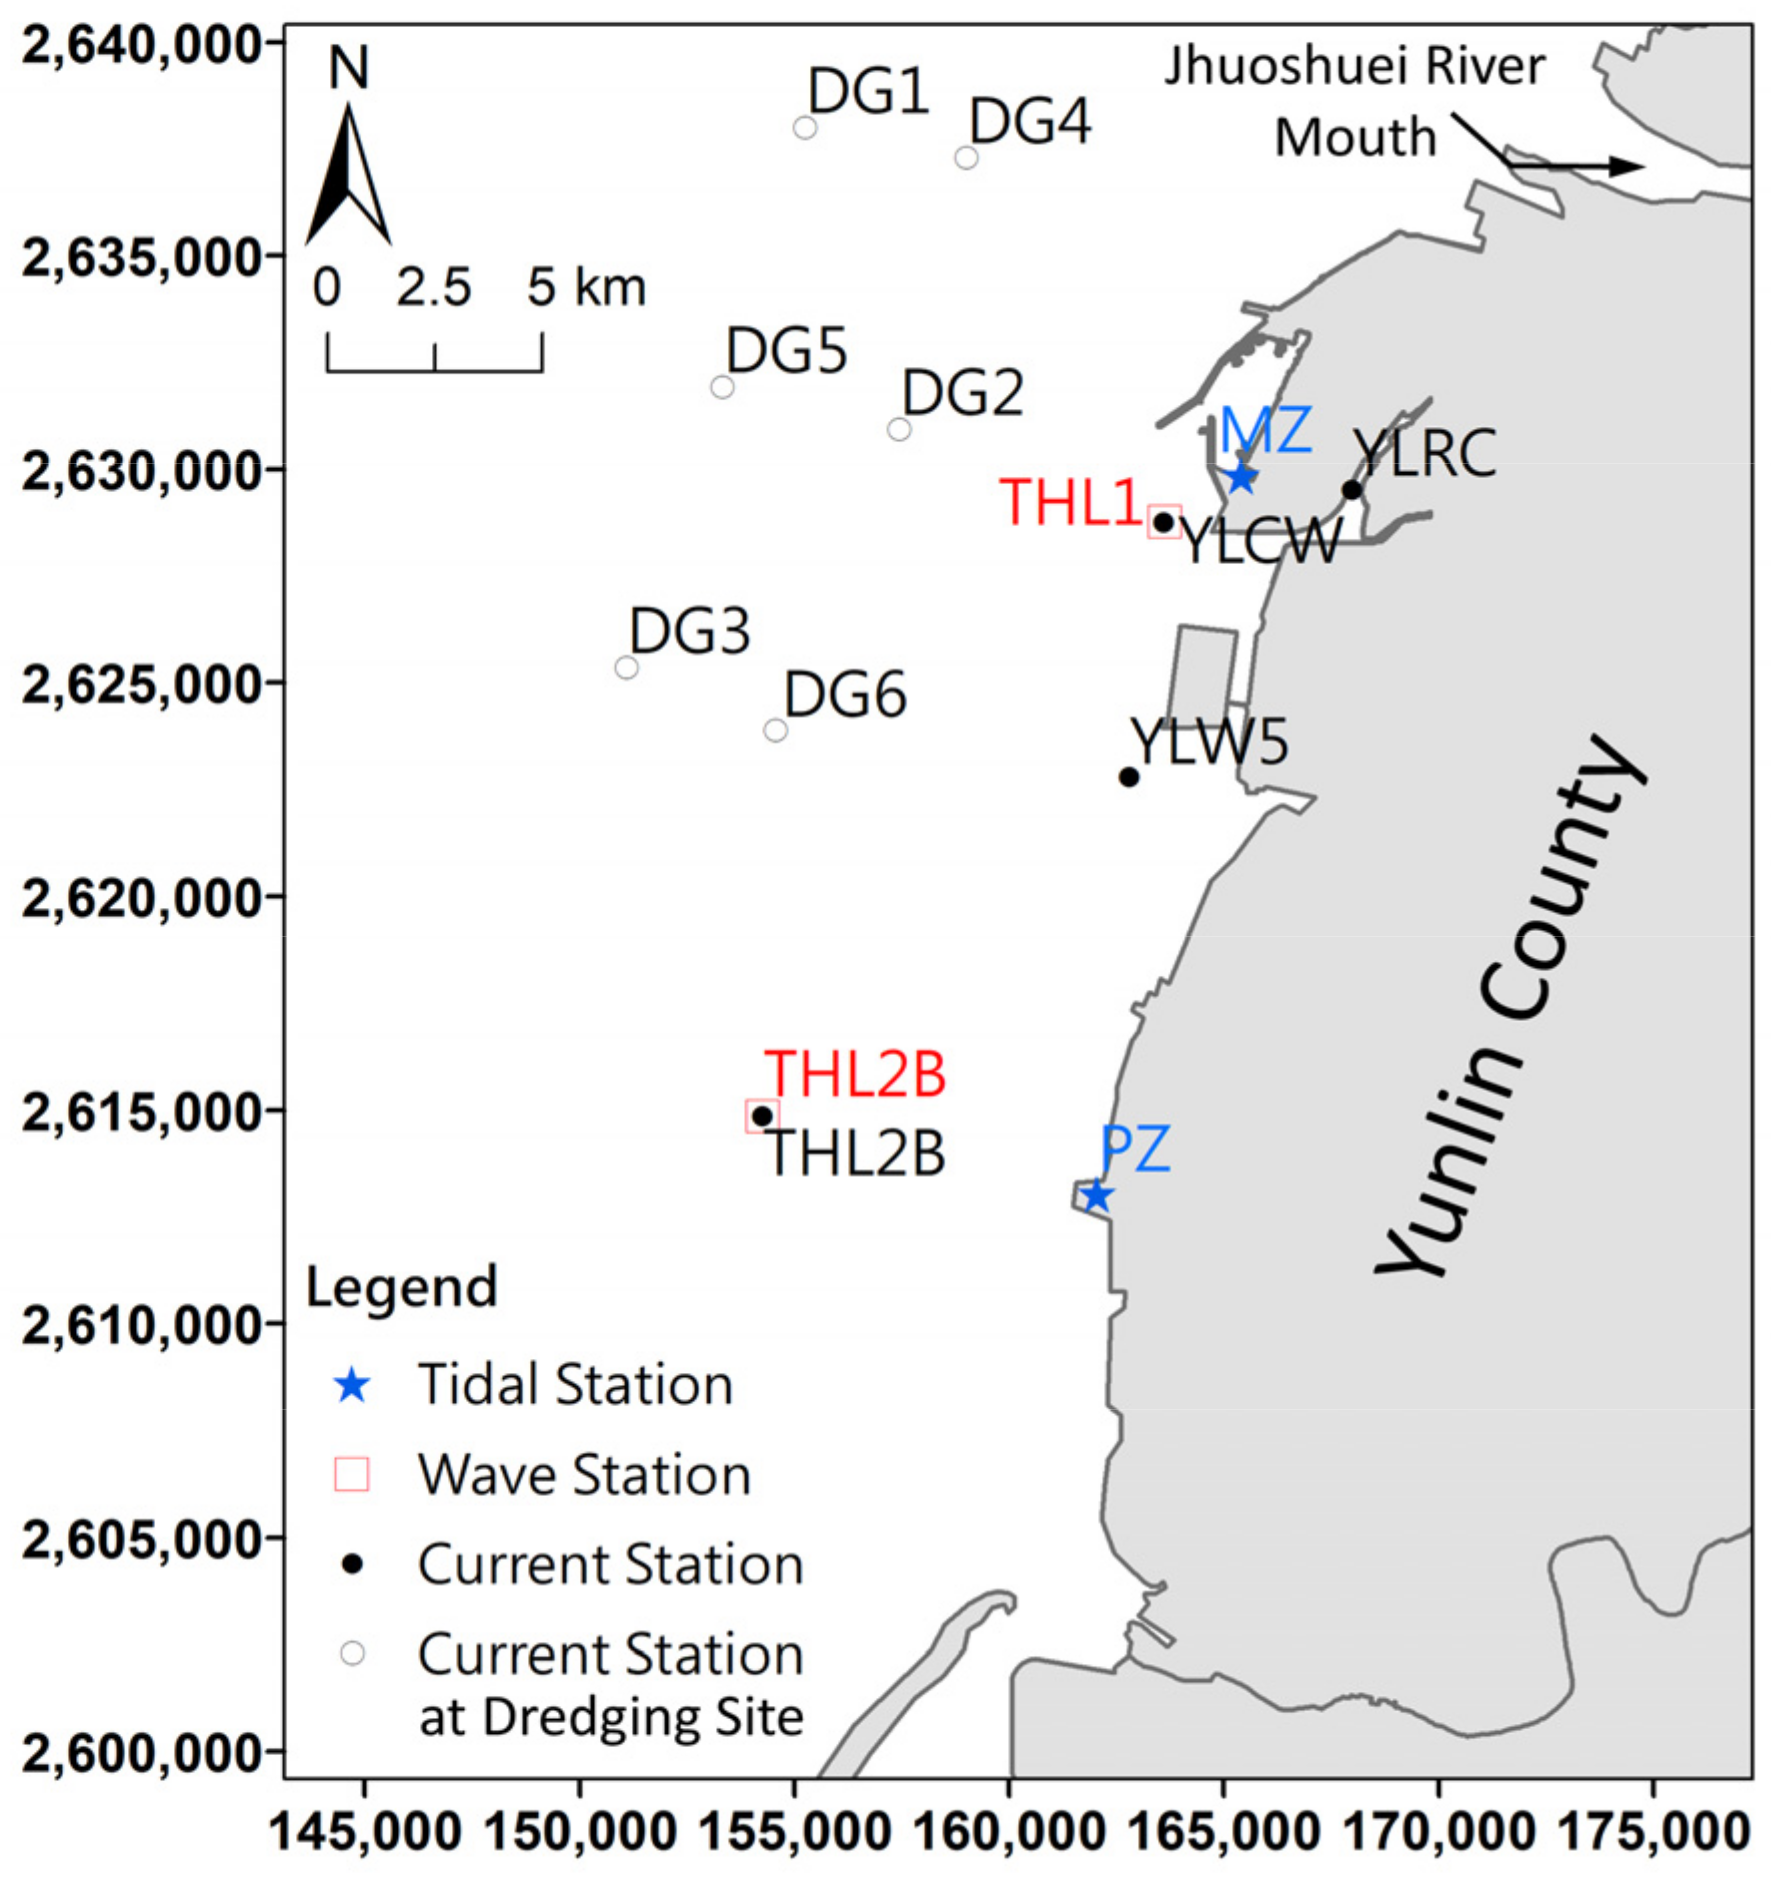
3.1. Field Data Collocation and Analysis
3.2. Hydraulic Model Test
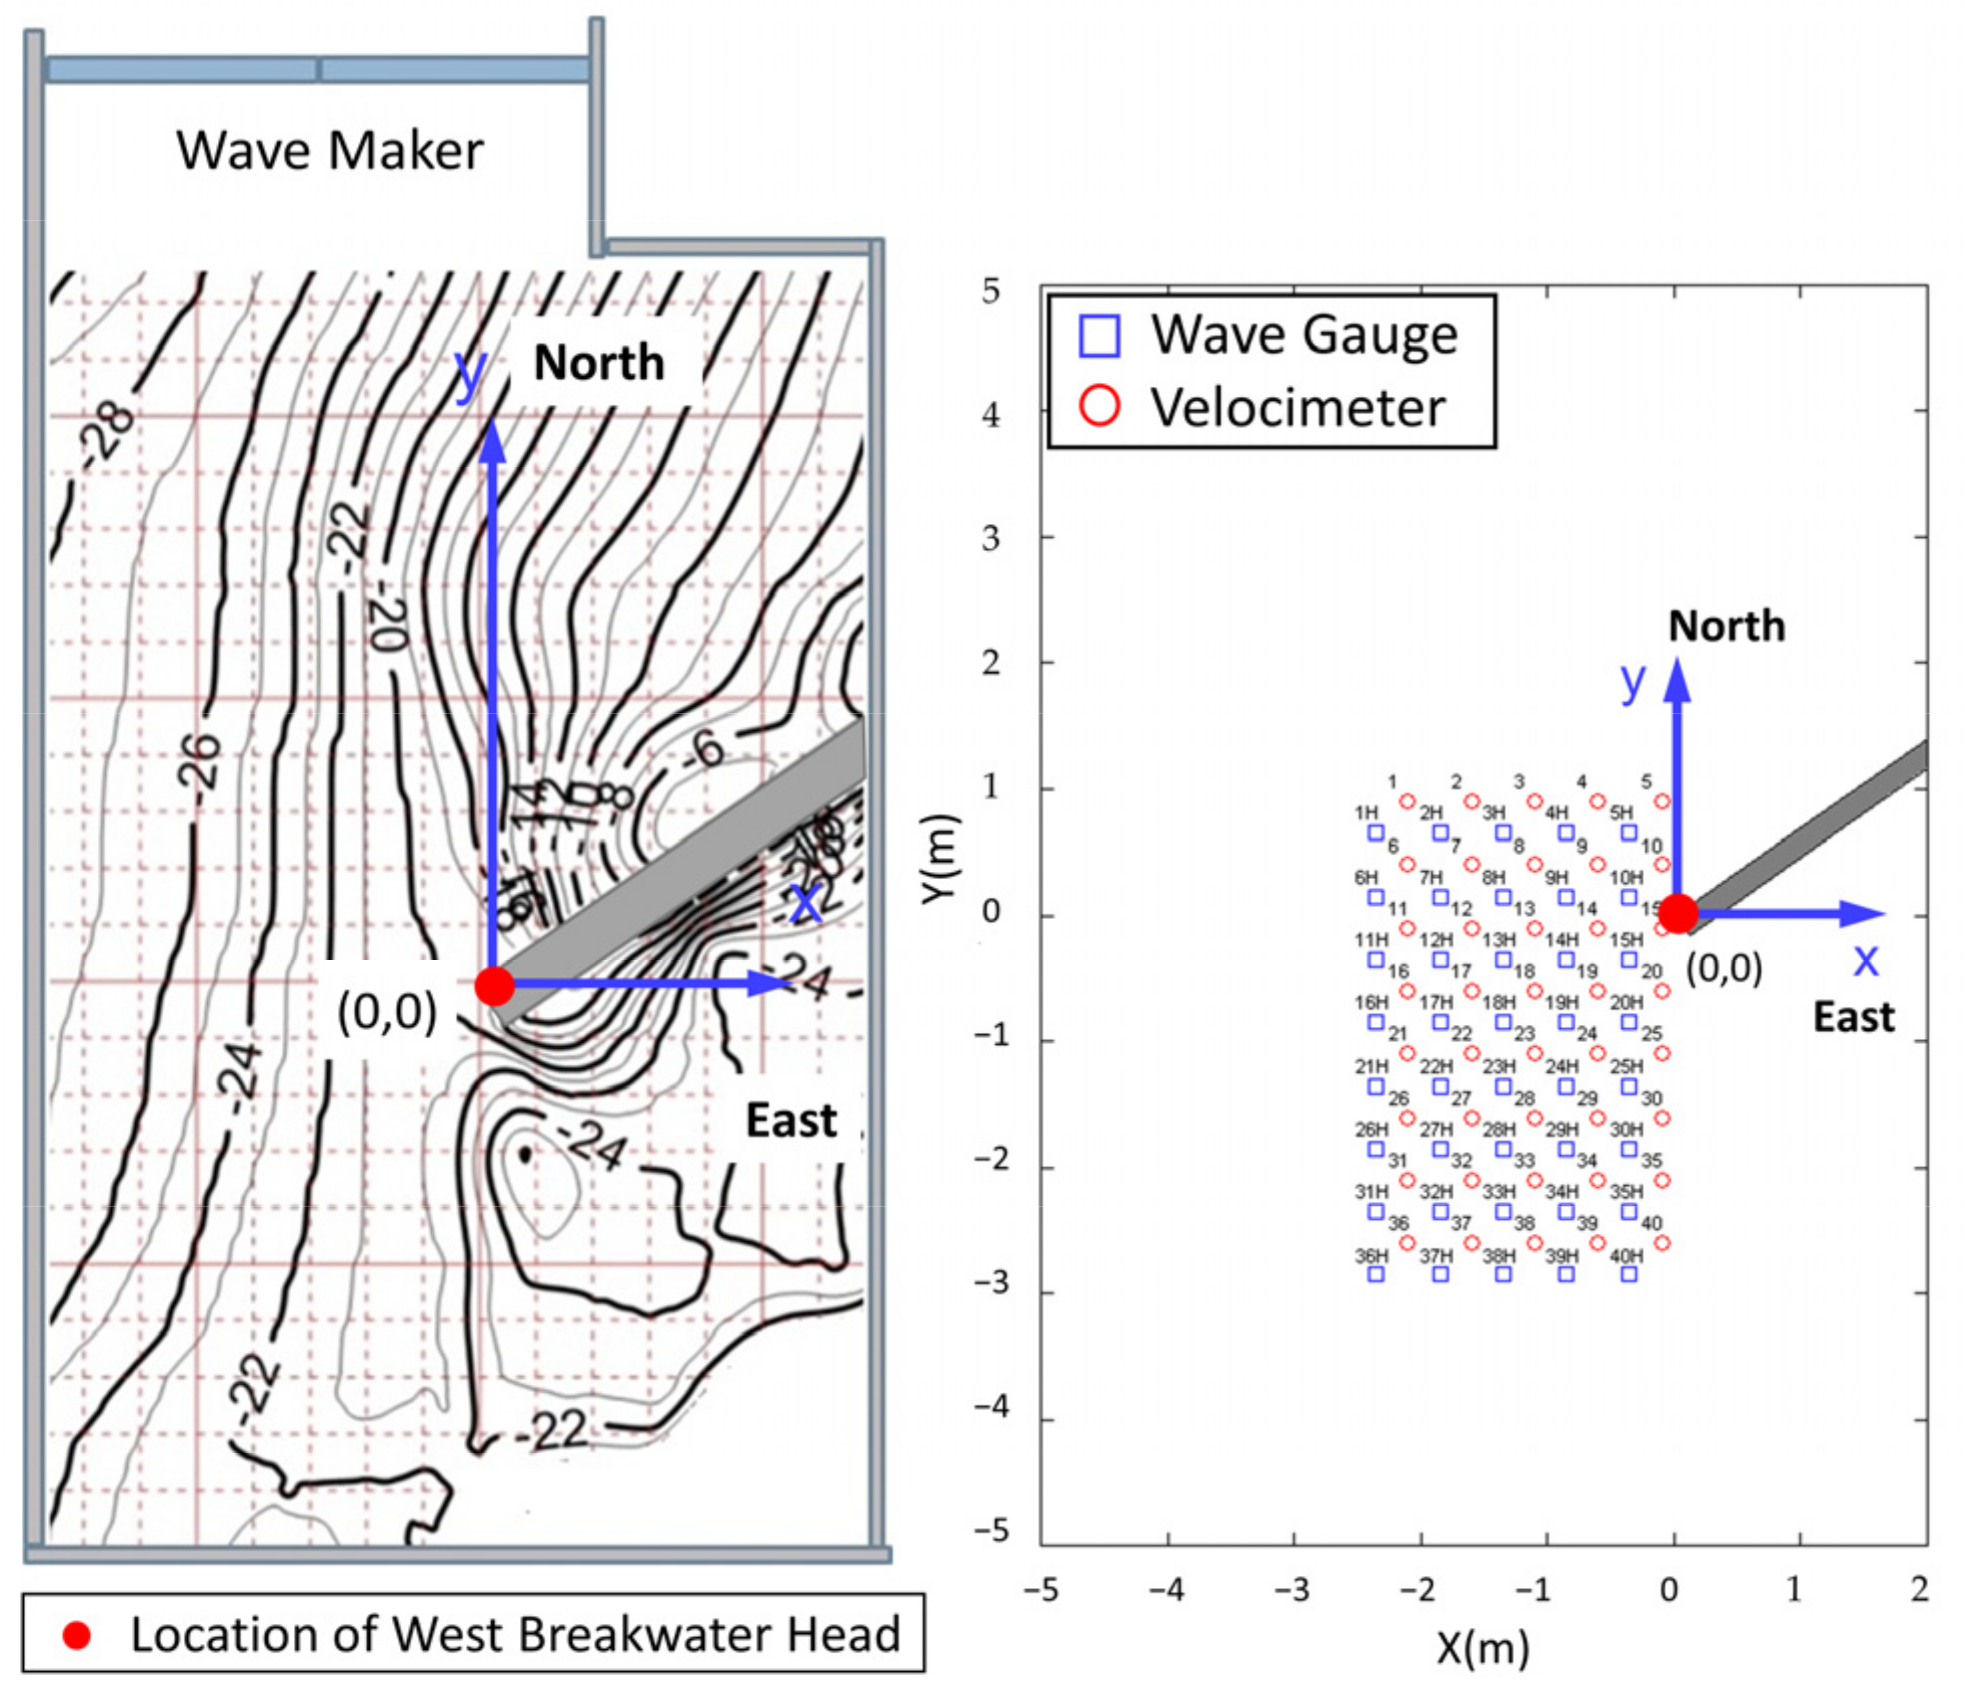
3.2.1. Wave Basin
3.2.2. Model Scale
3.2.3. Boundary Conditions
- (1)
- Tidal Boundary Conditions
- (2)
- Wave Boundary Conditions
3.3. Numerical Simulation
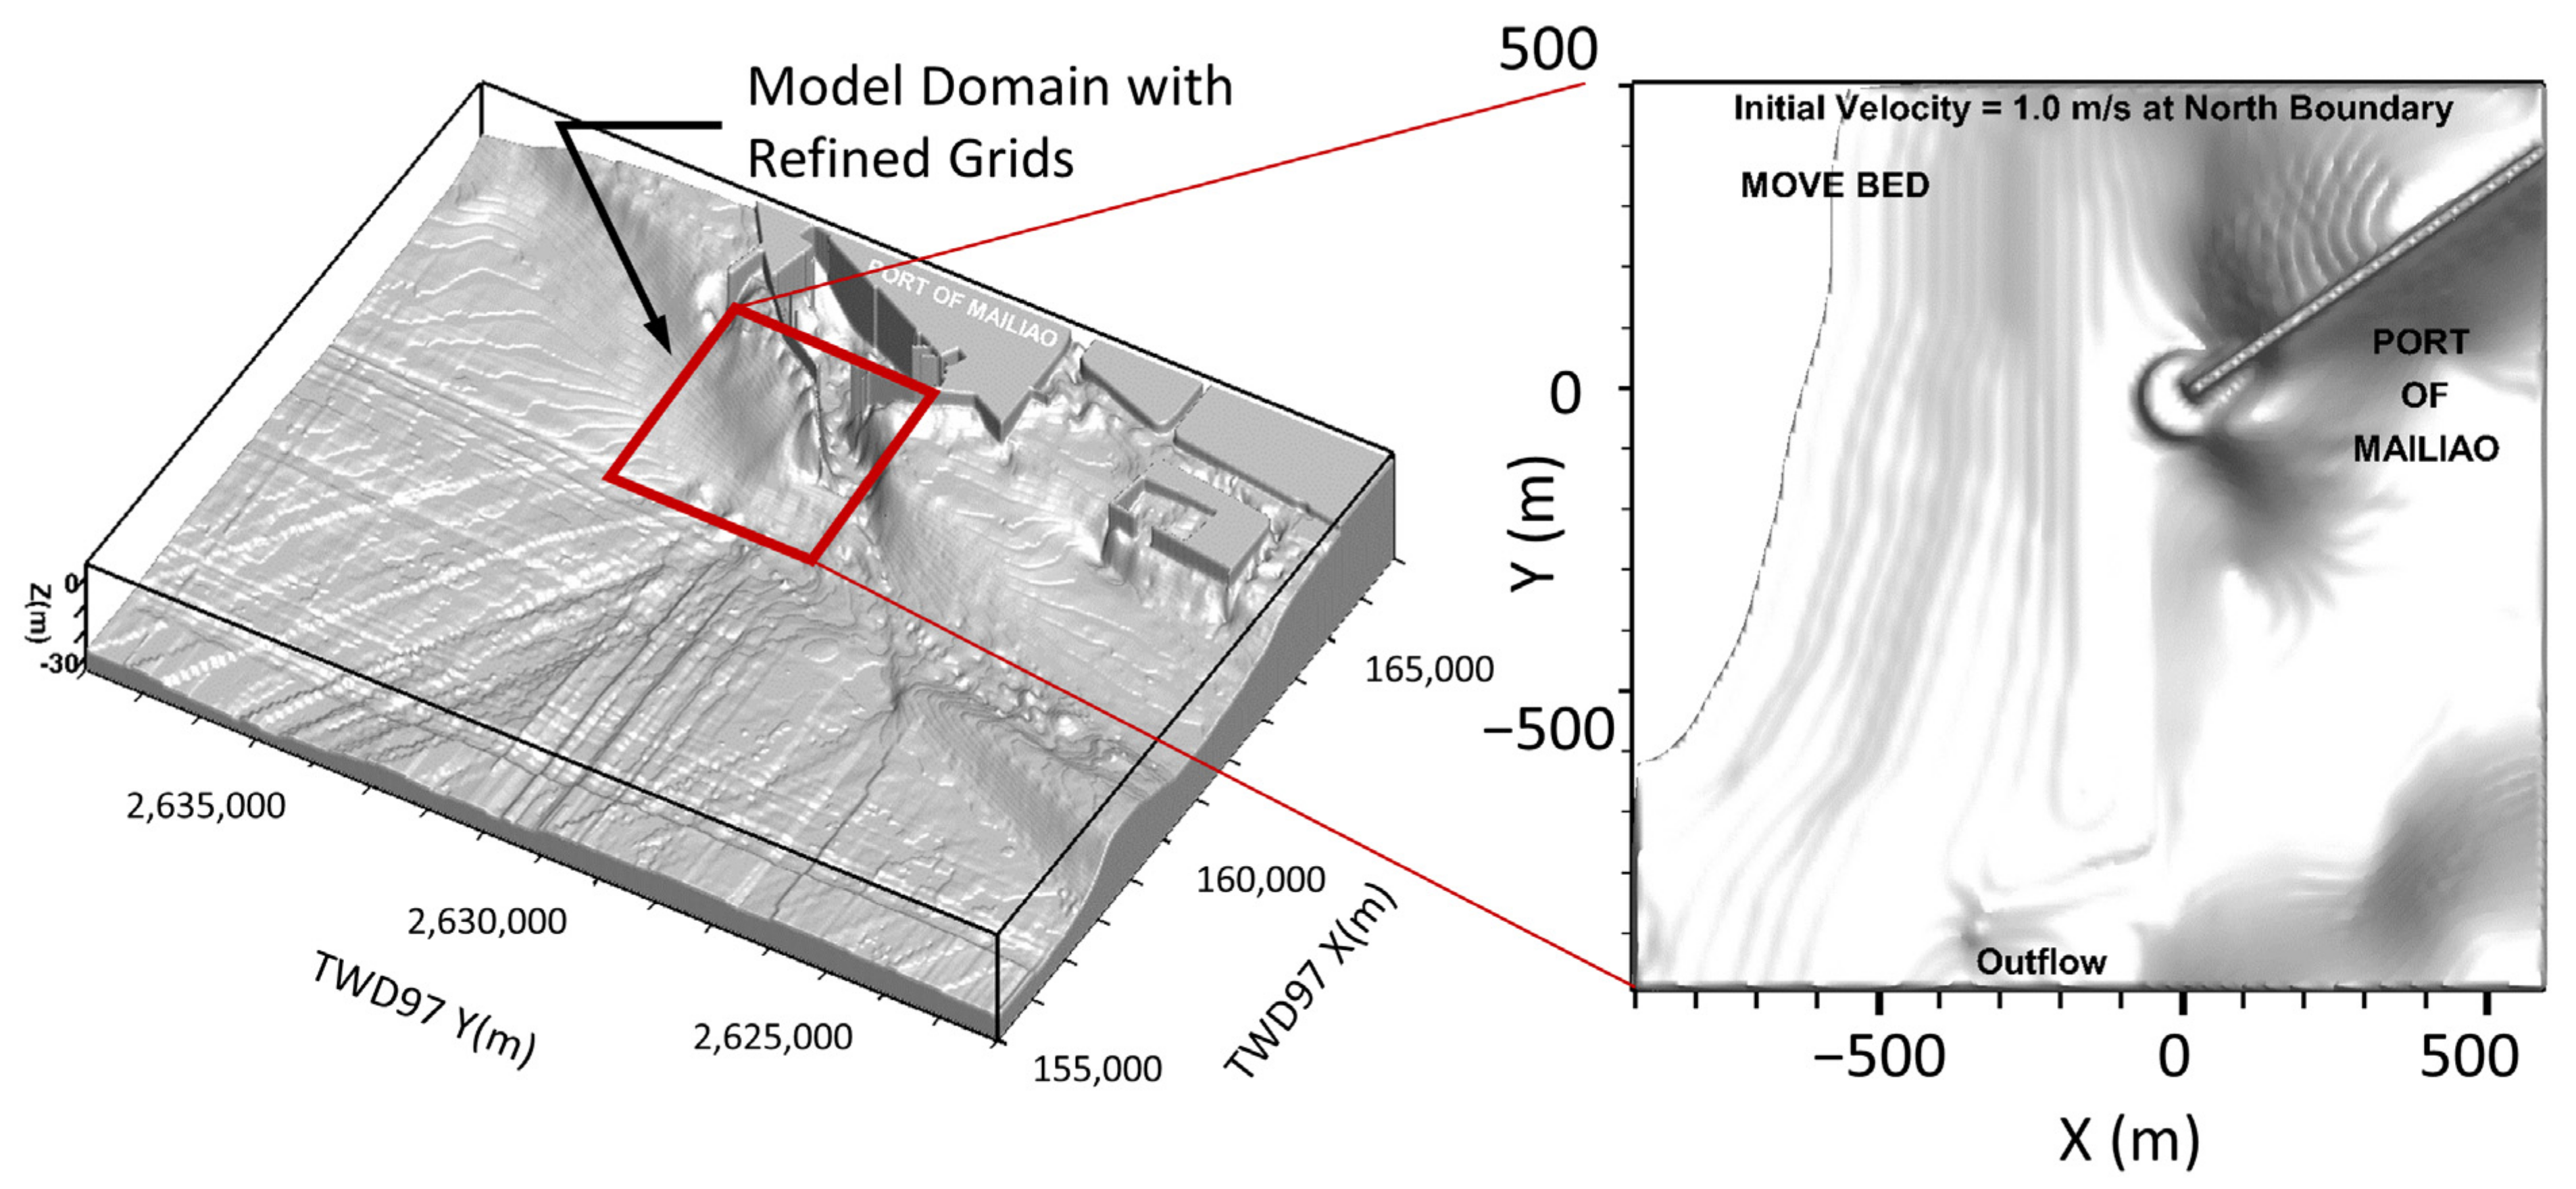
3.3.1. Model Domain
3.3.2. Wave Field Modeling Input
3.3.3. Current Field Modeling Input
4. Results
4.1. Field Data Analysis
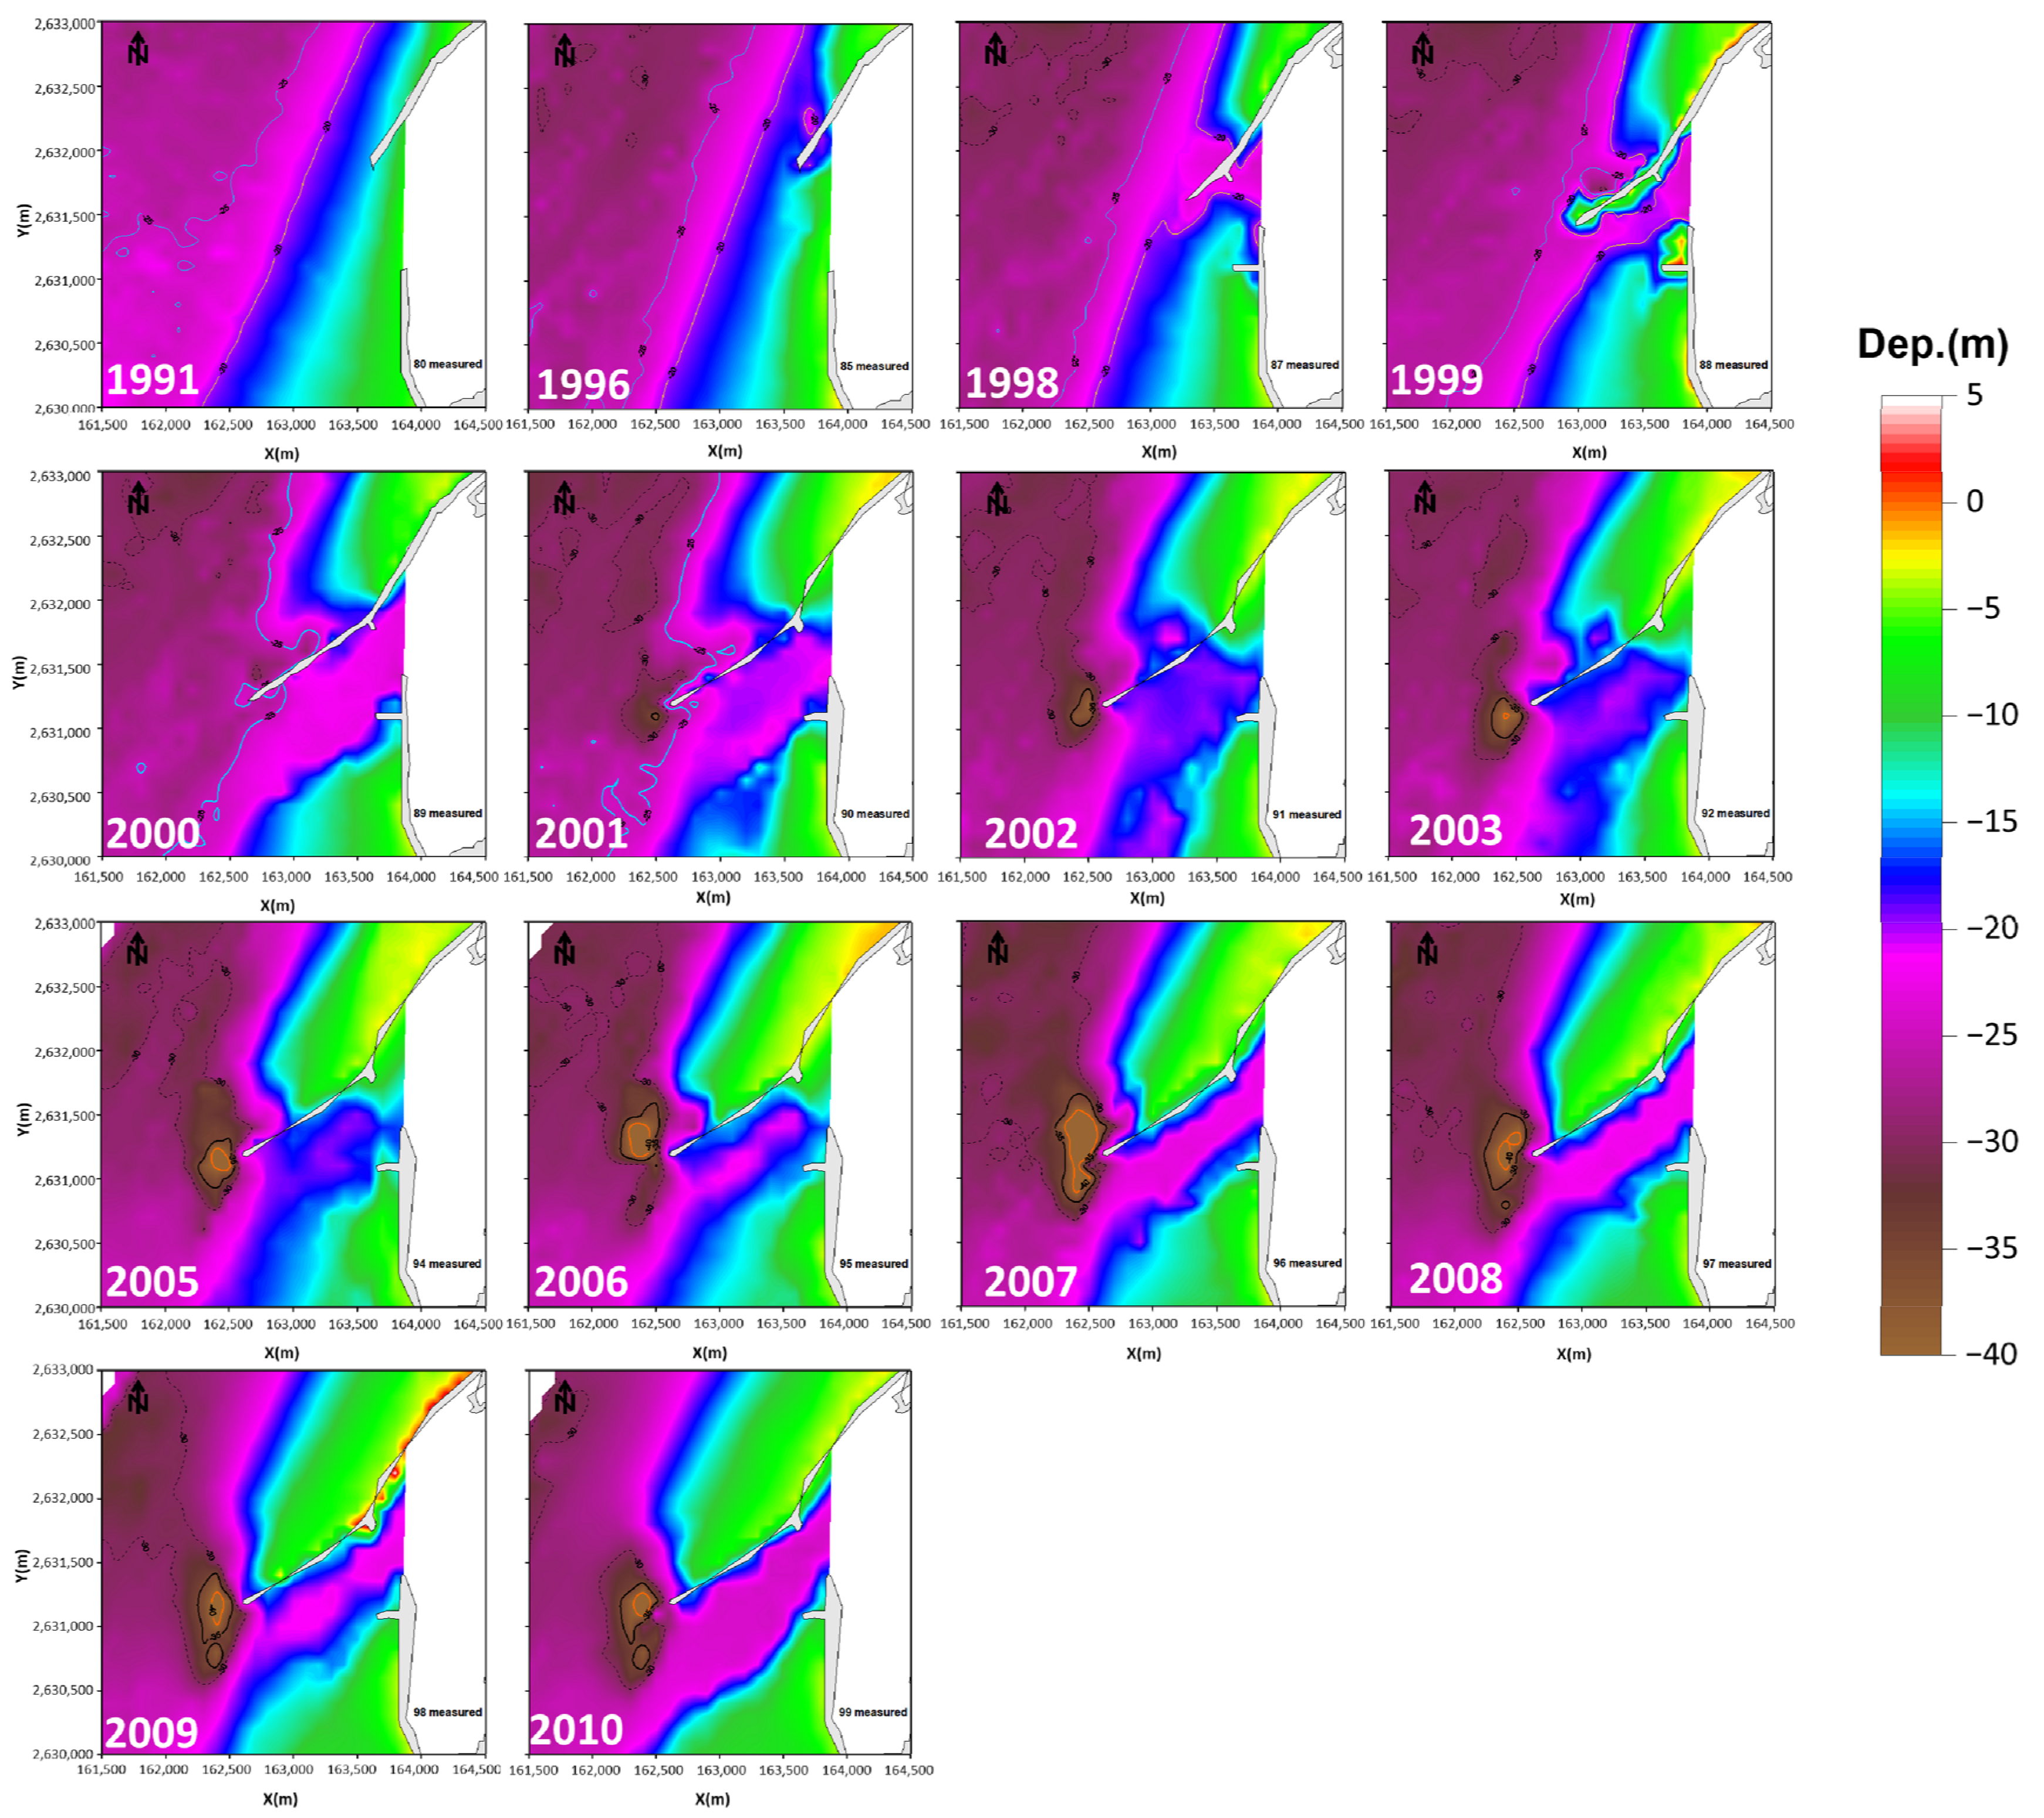
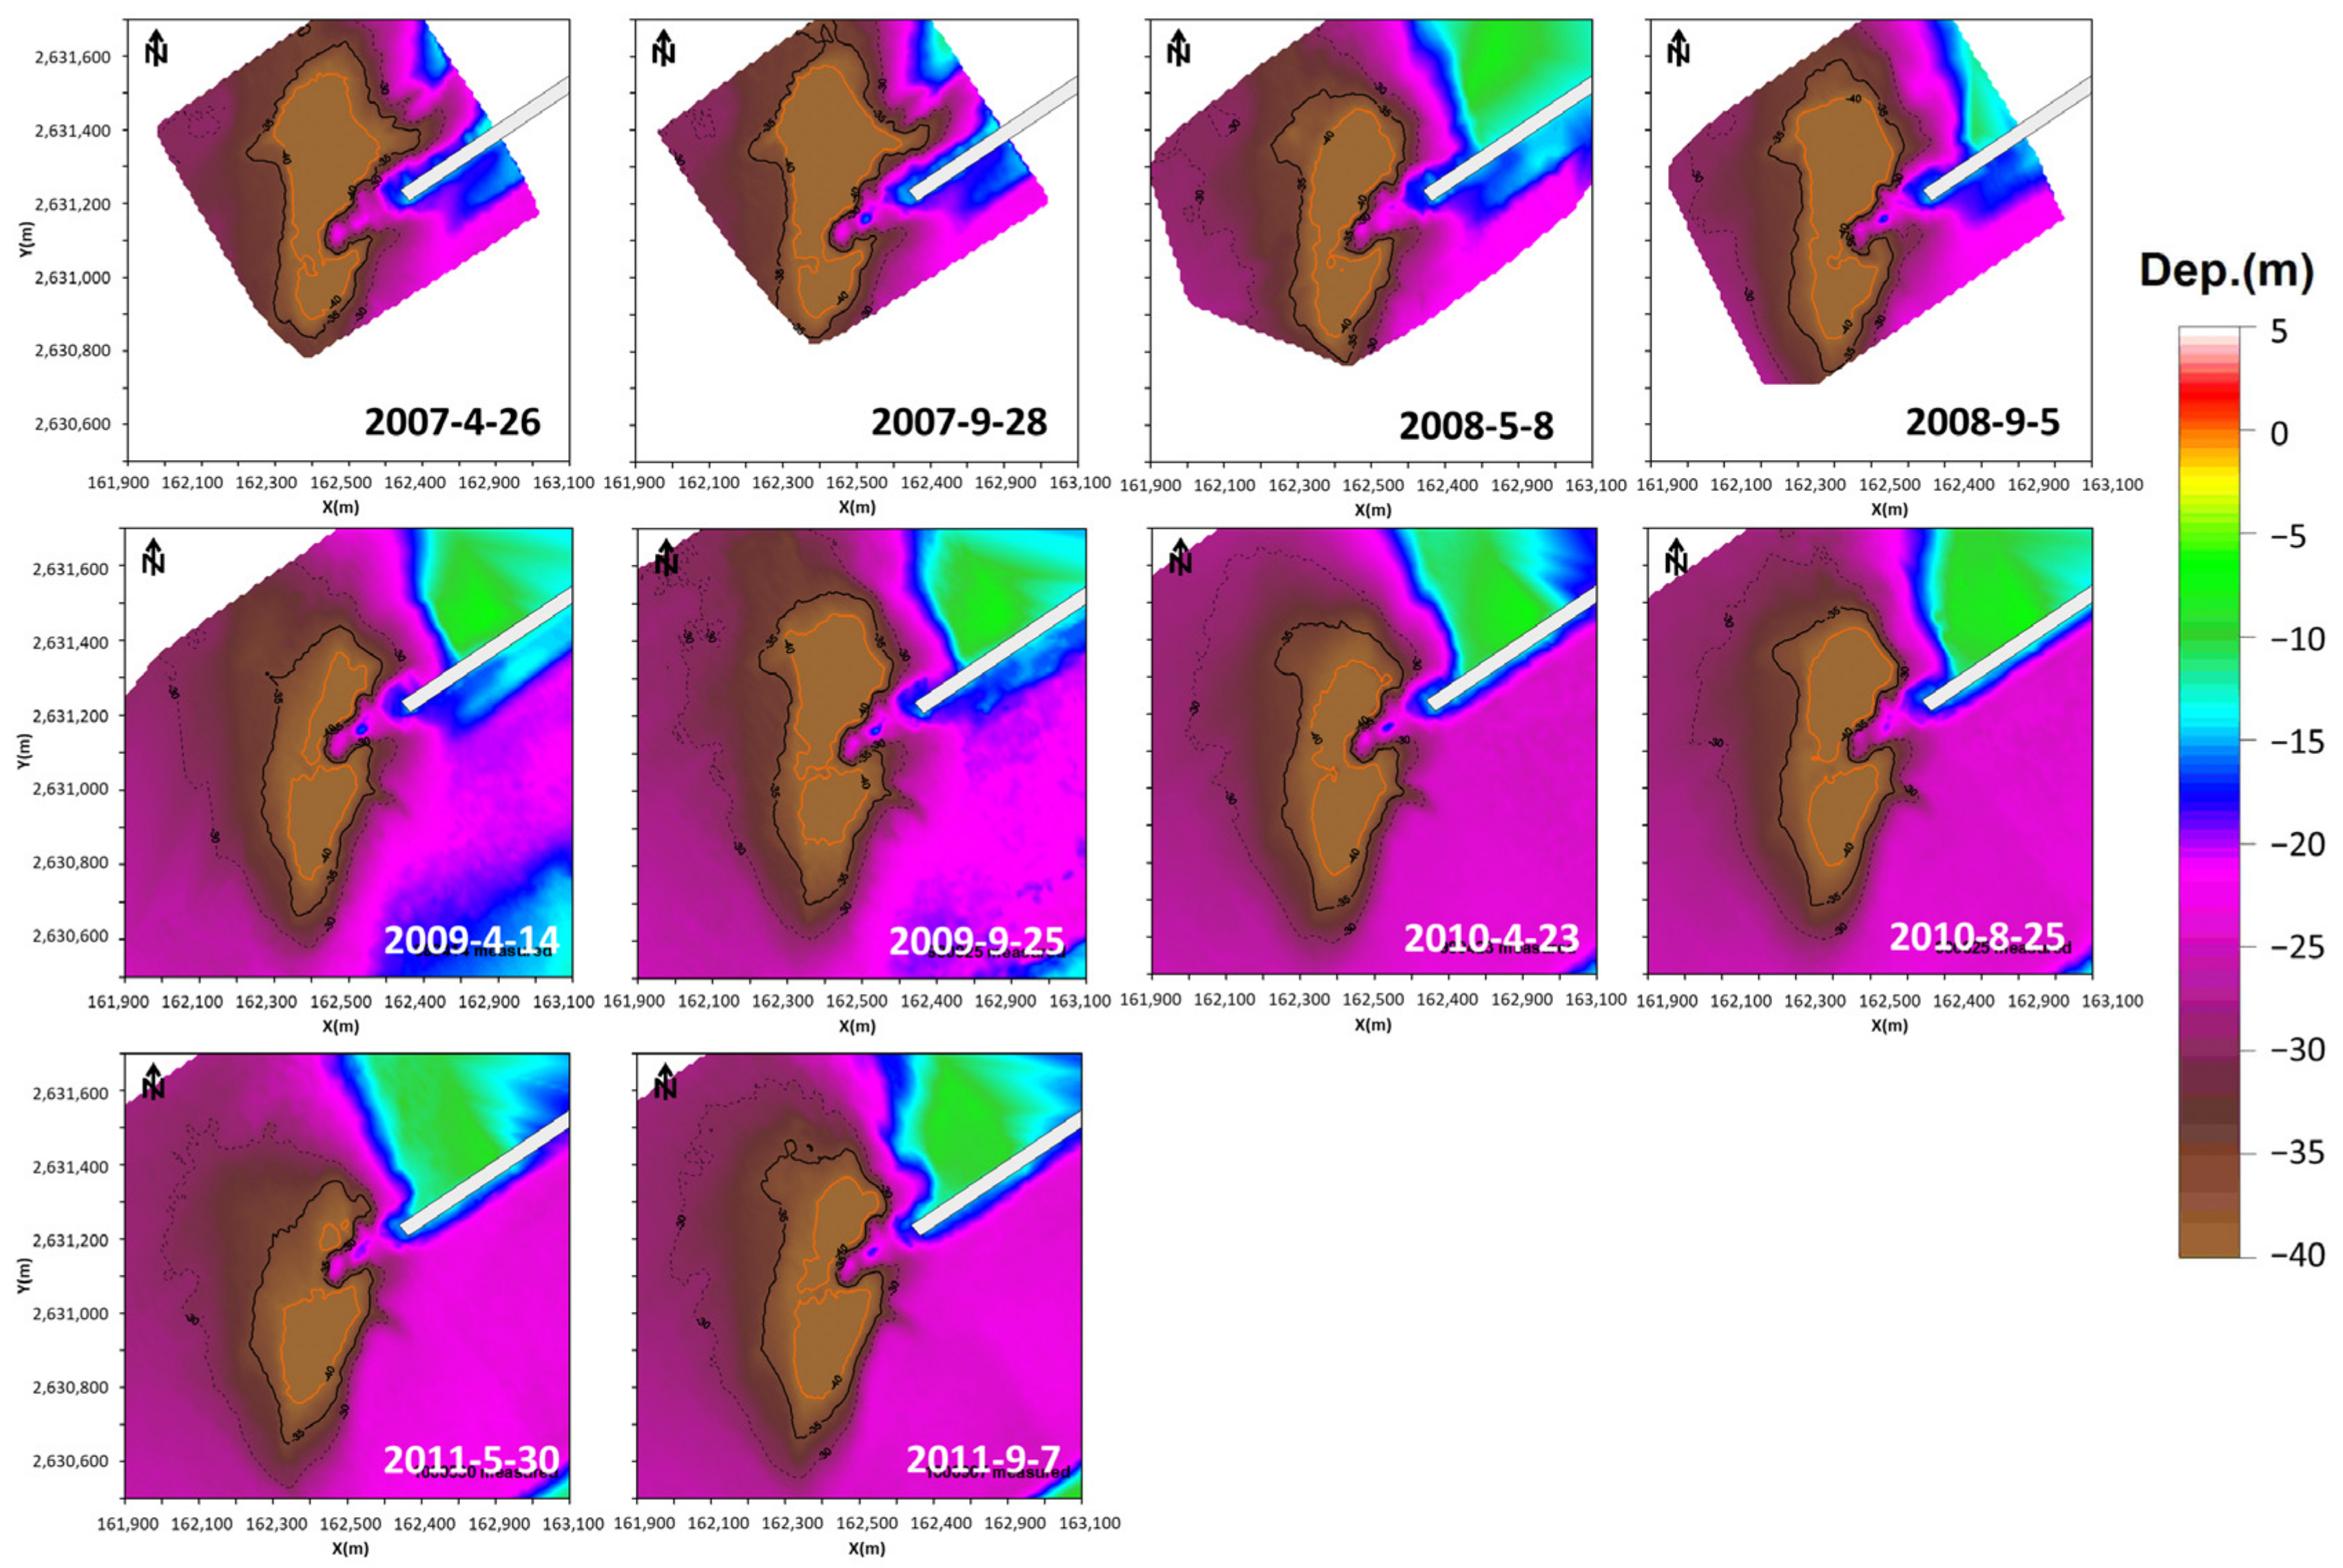
4.1.1. Bathymetry Data Analysis
- (1)
- Erosion and deposition trend of the seabed
- (2)
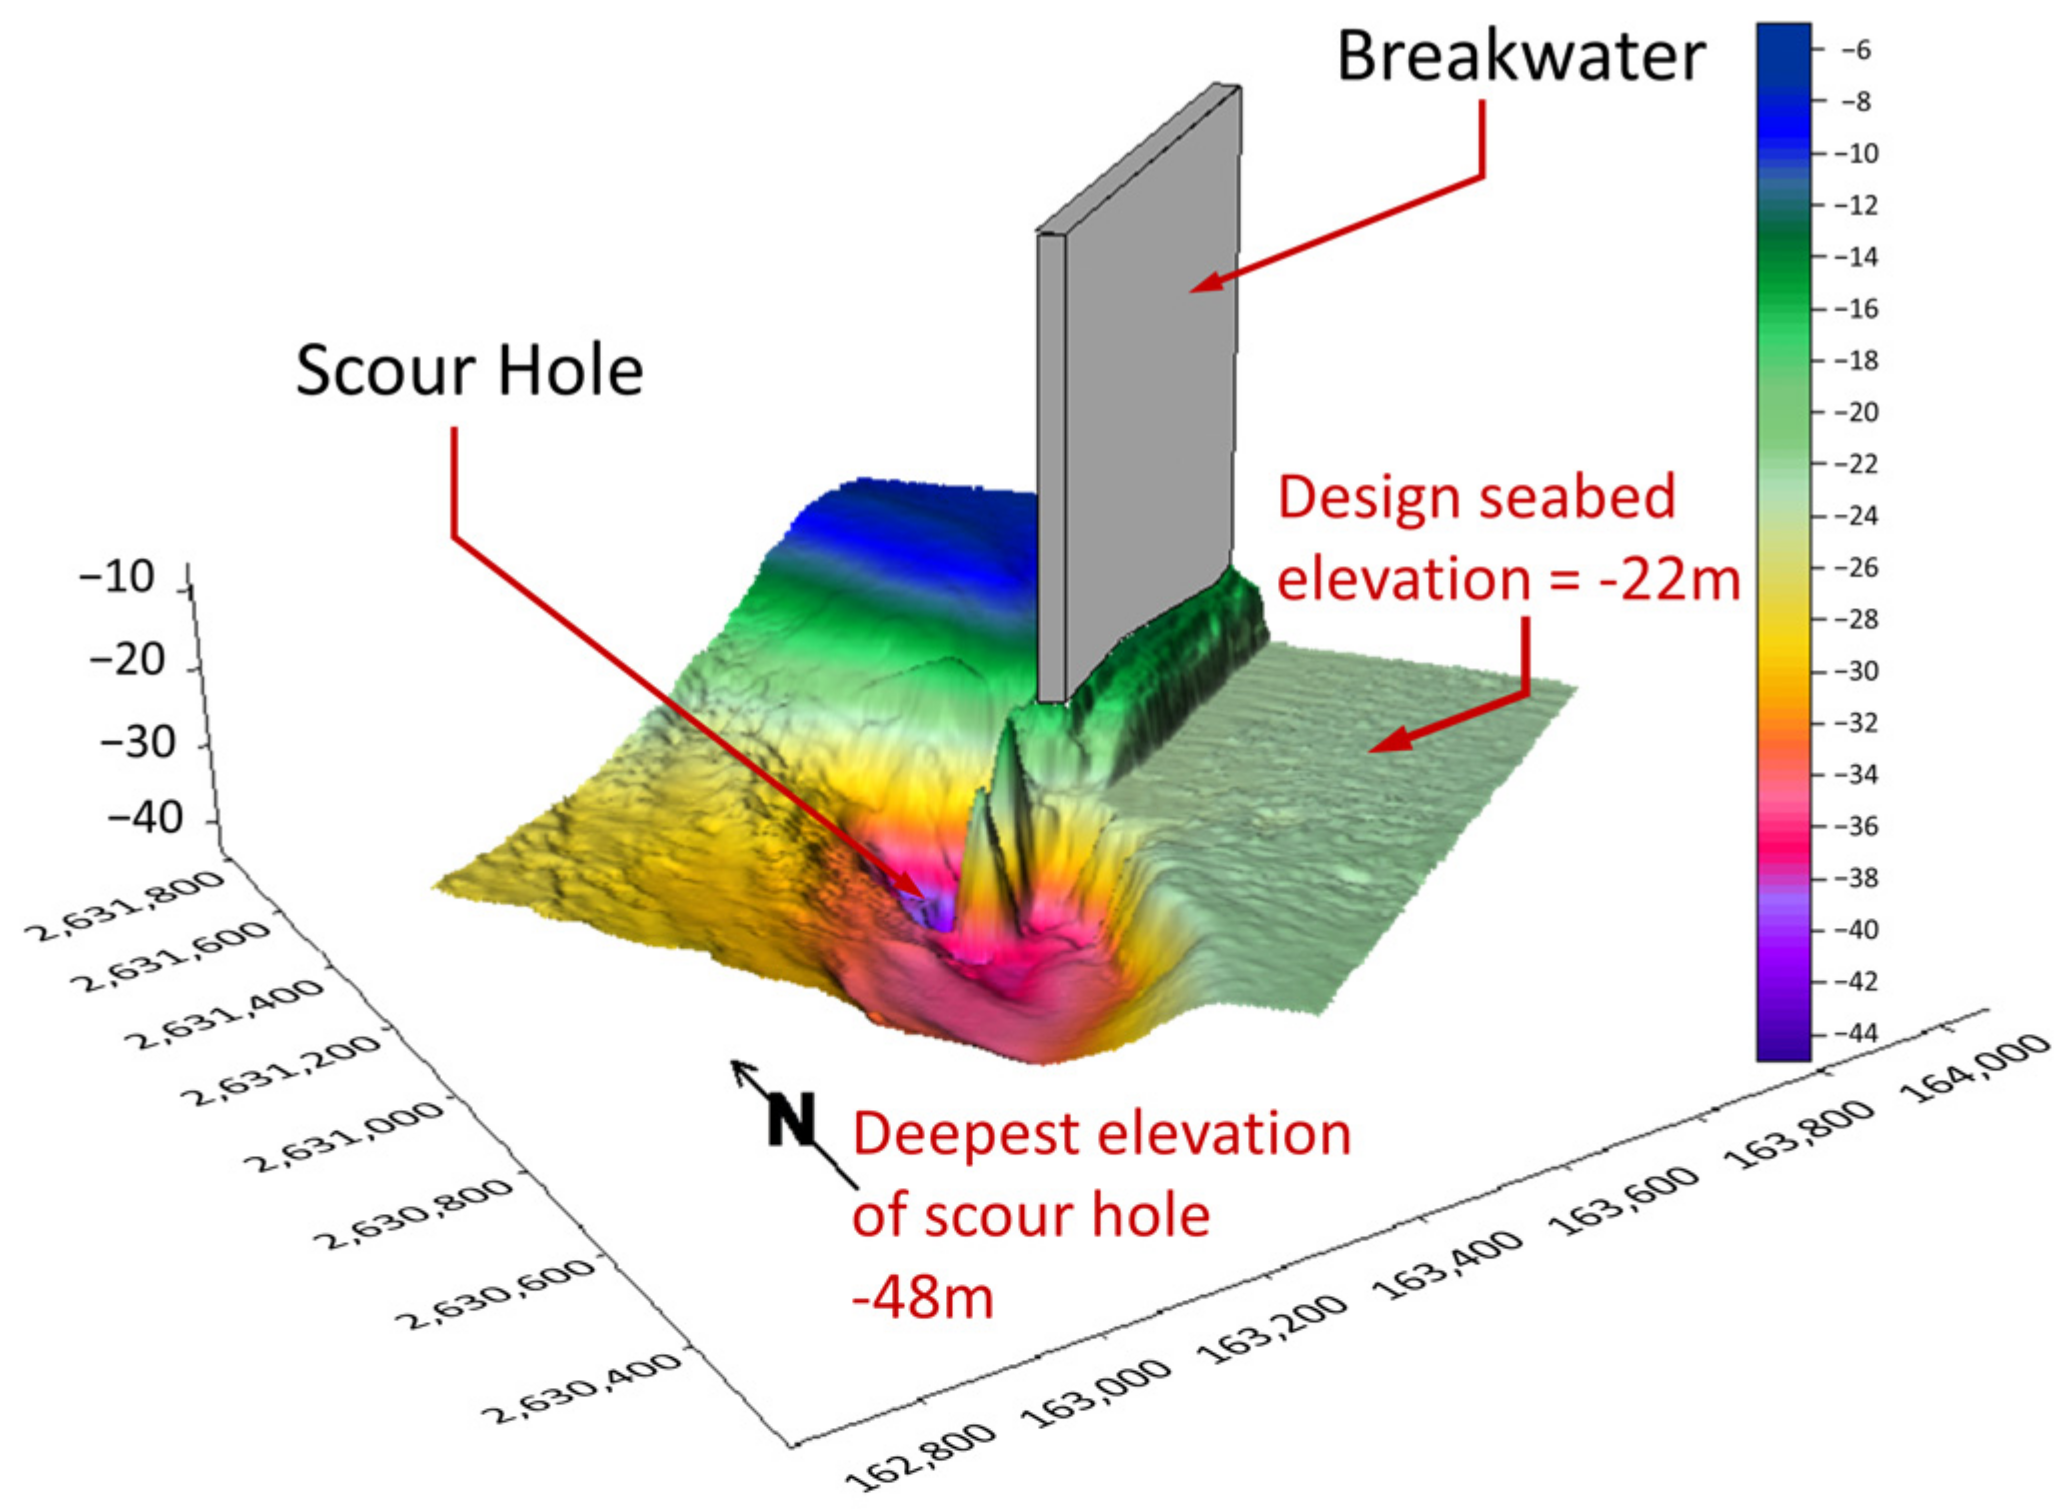
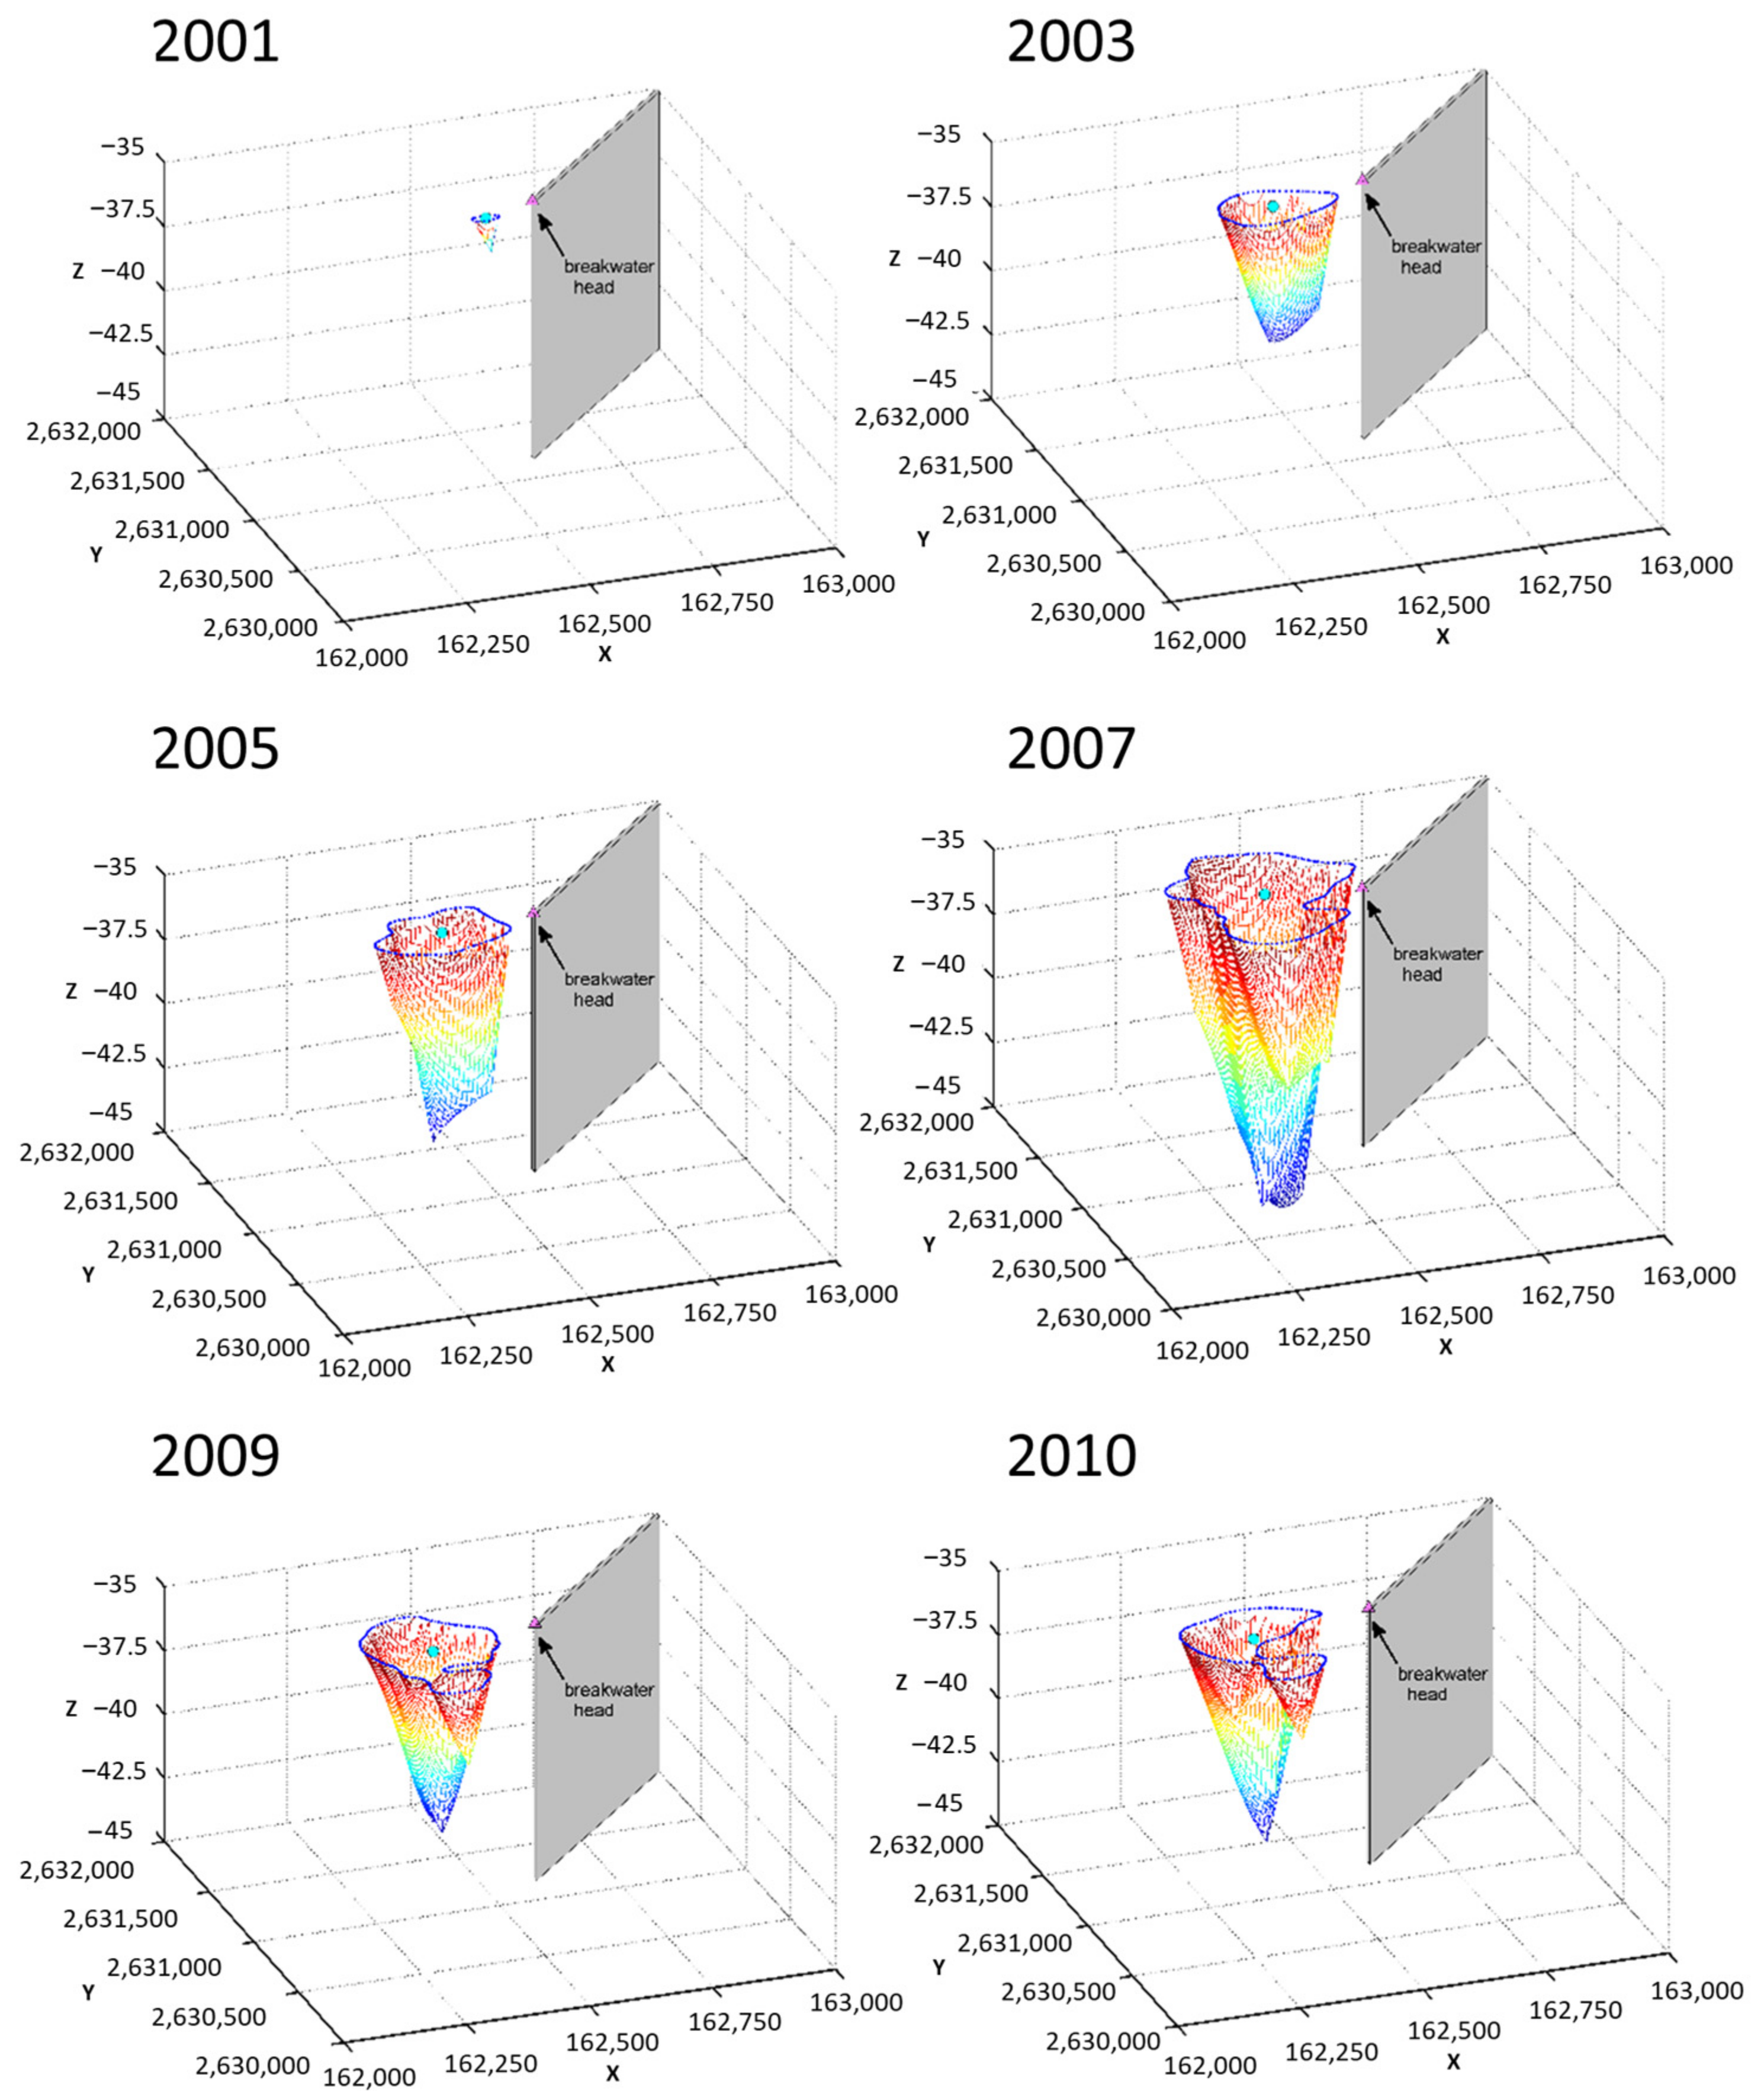
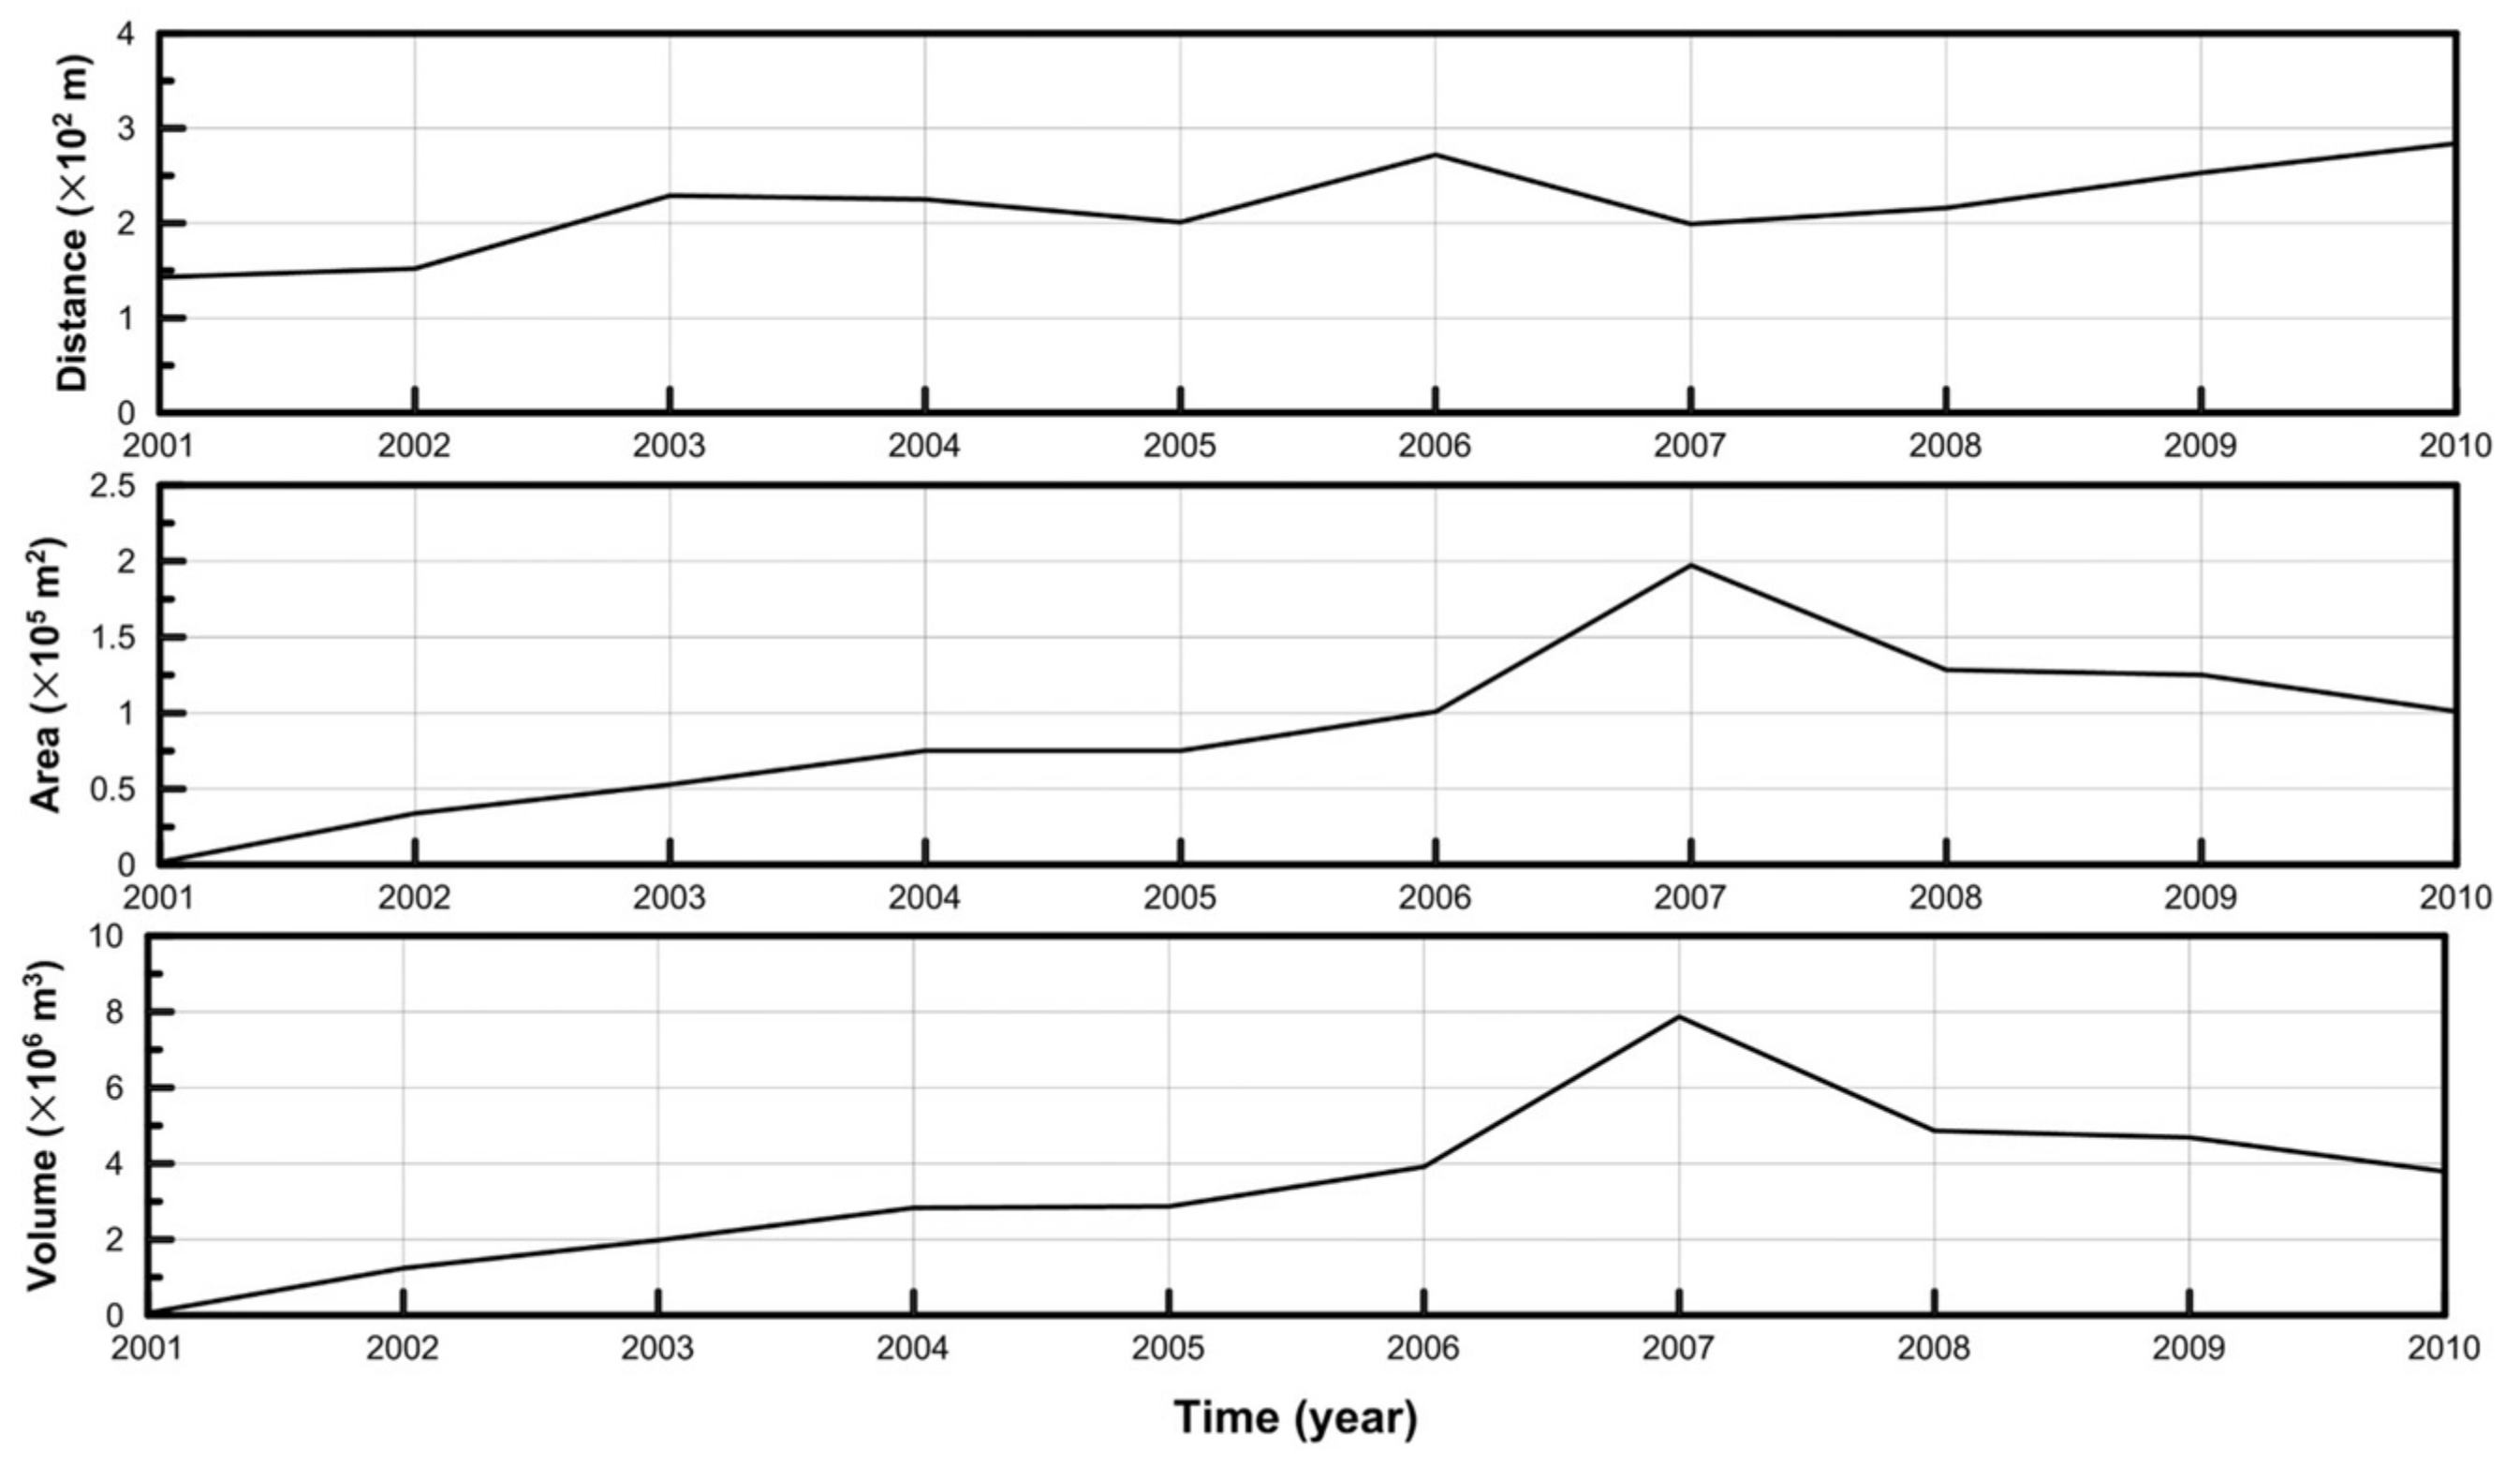
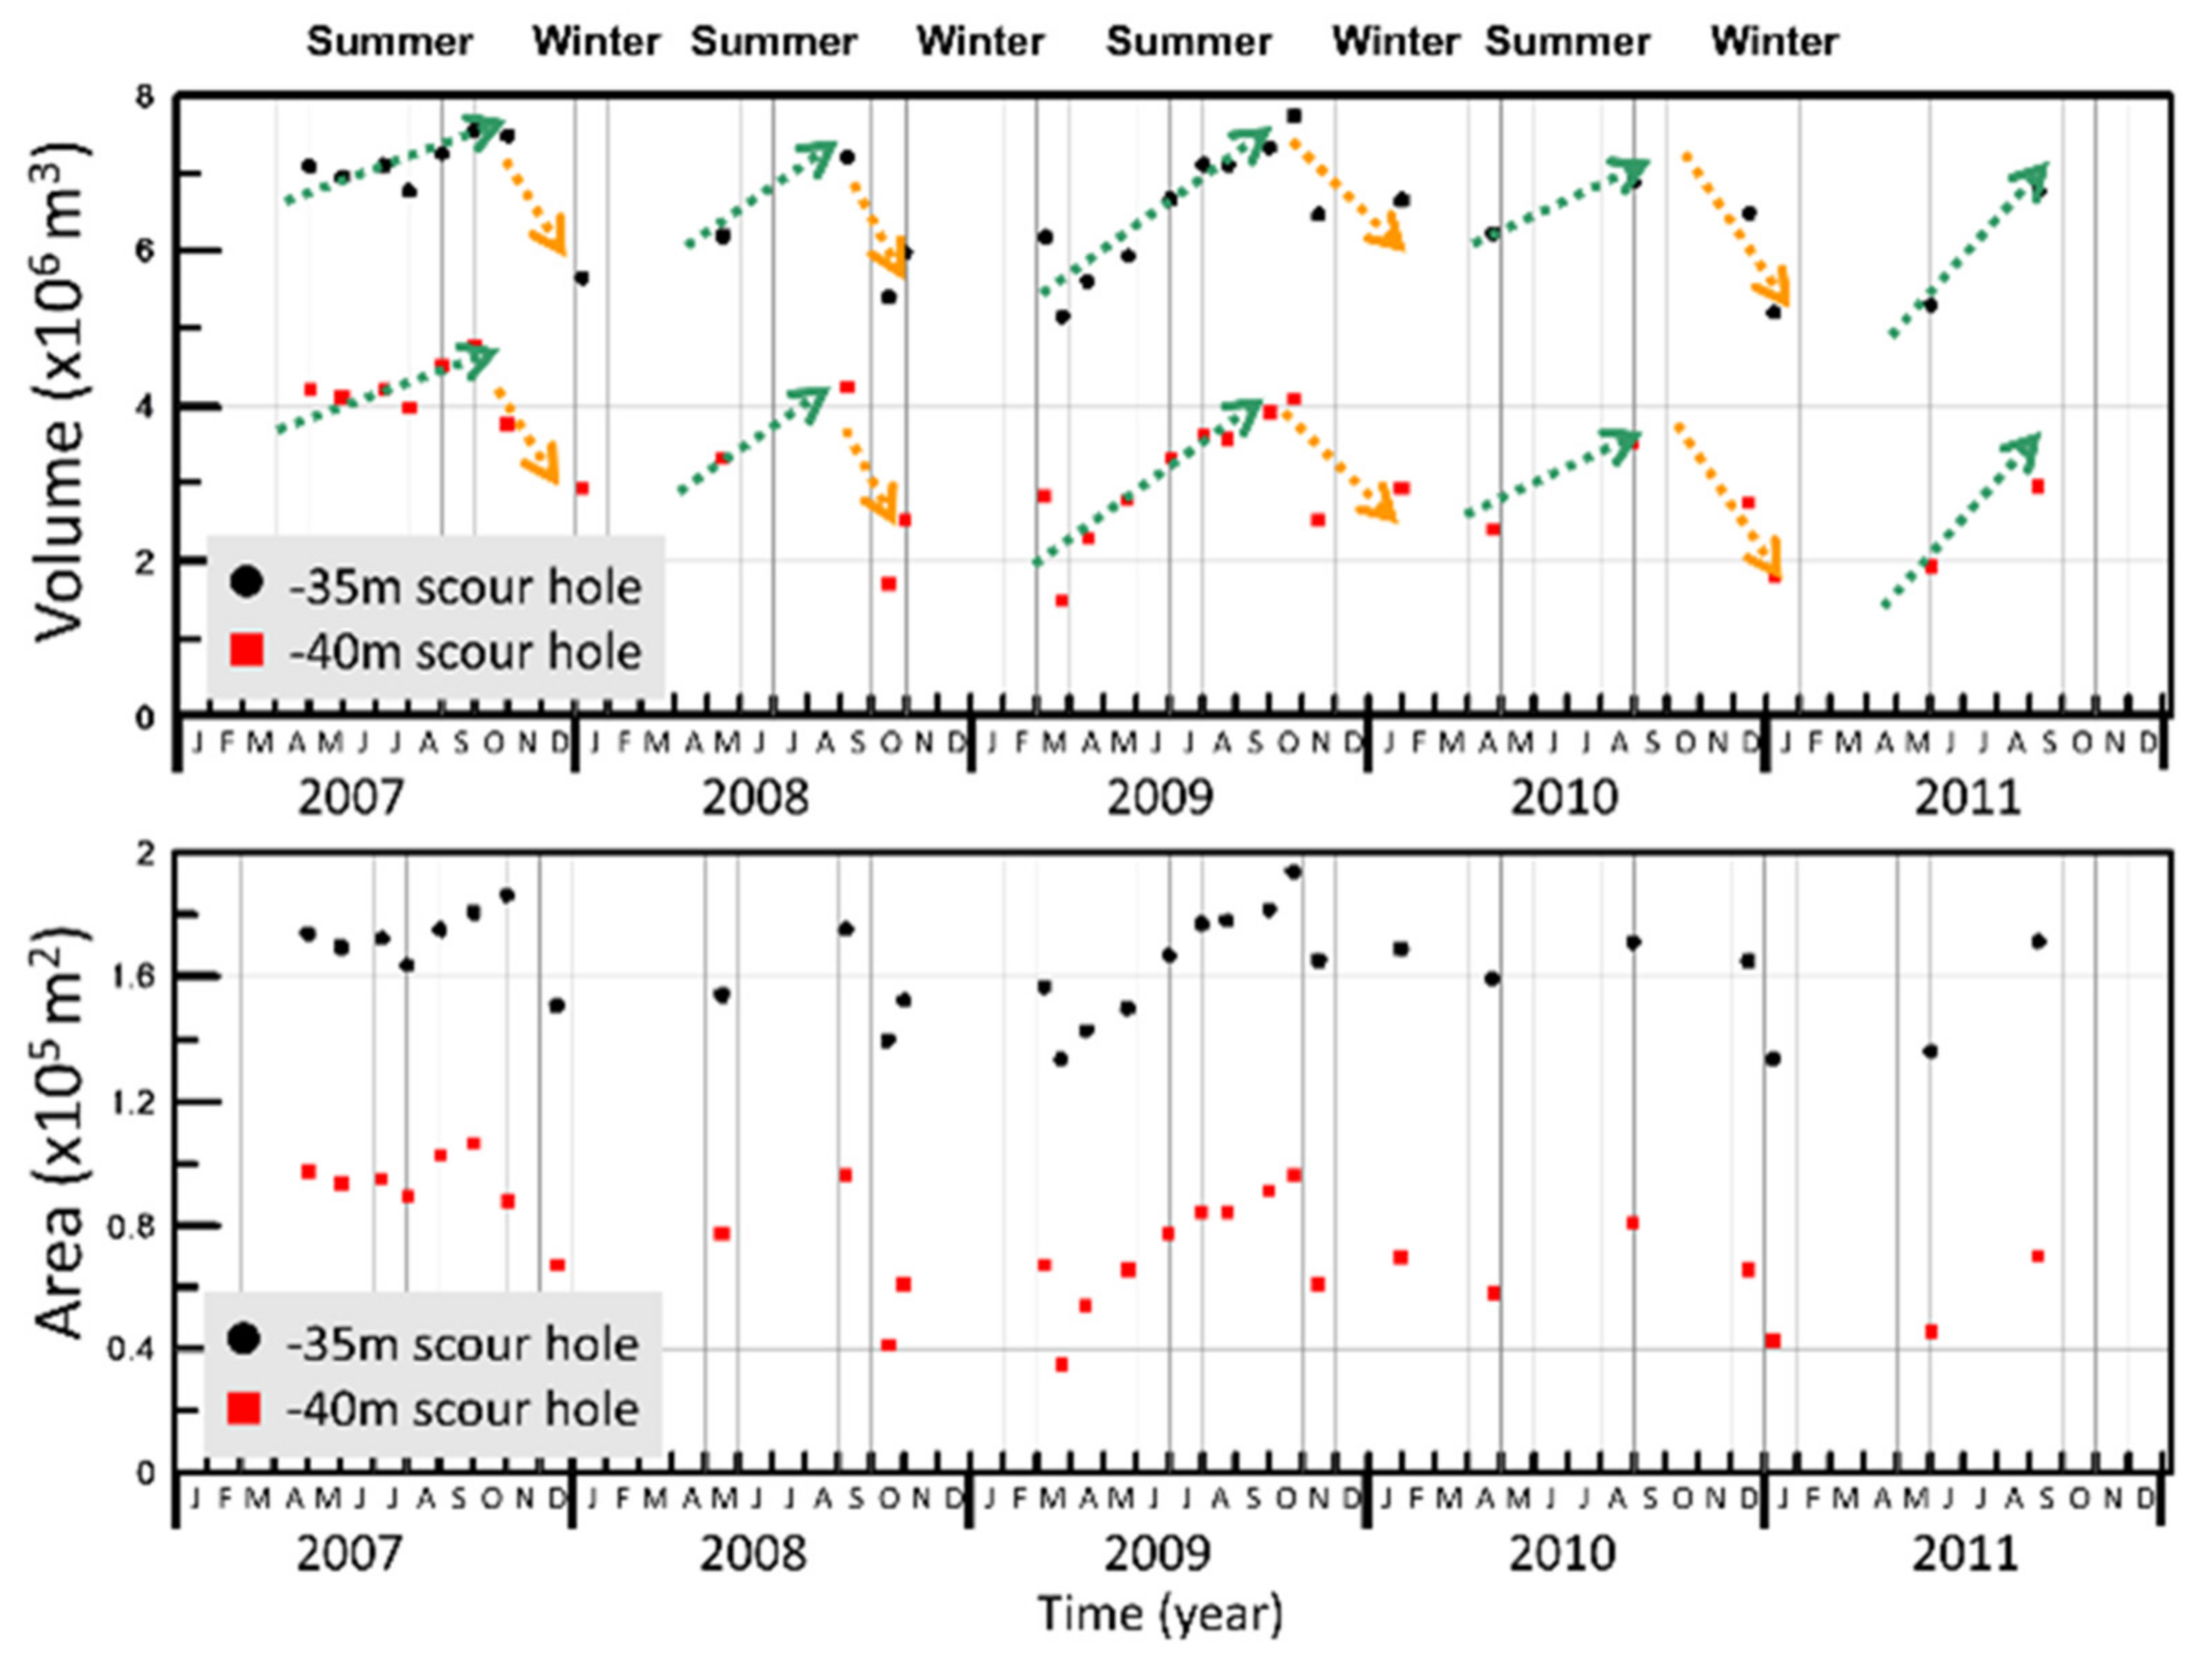
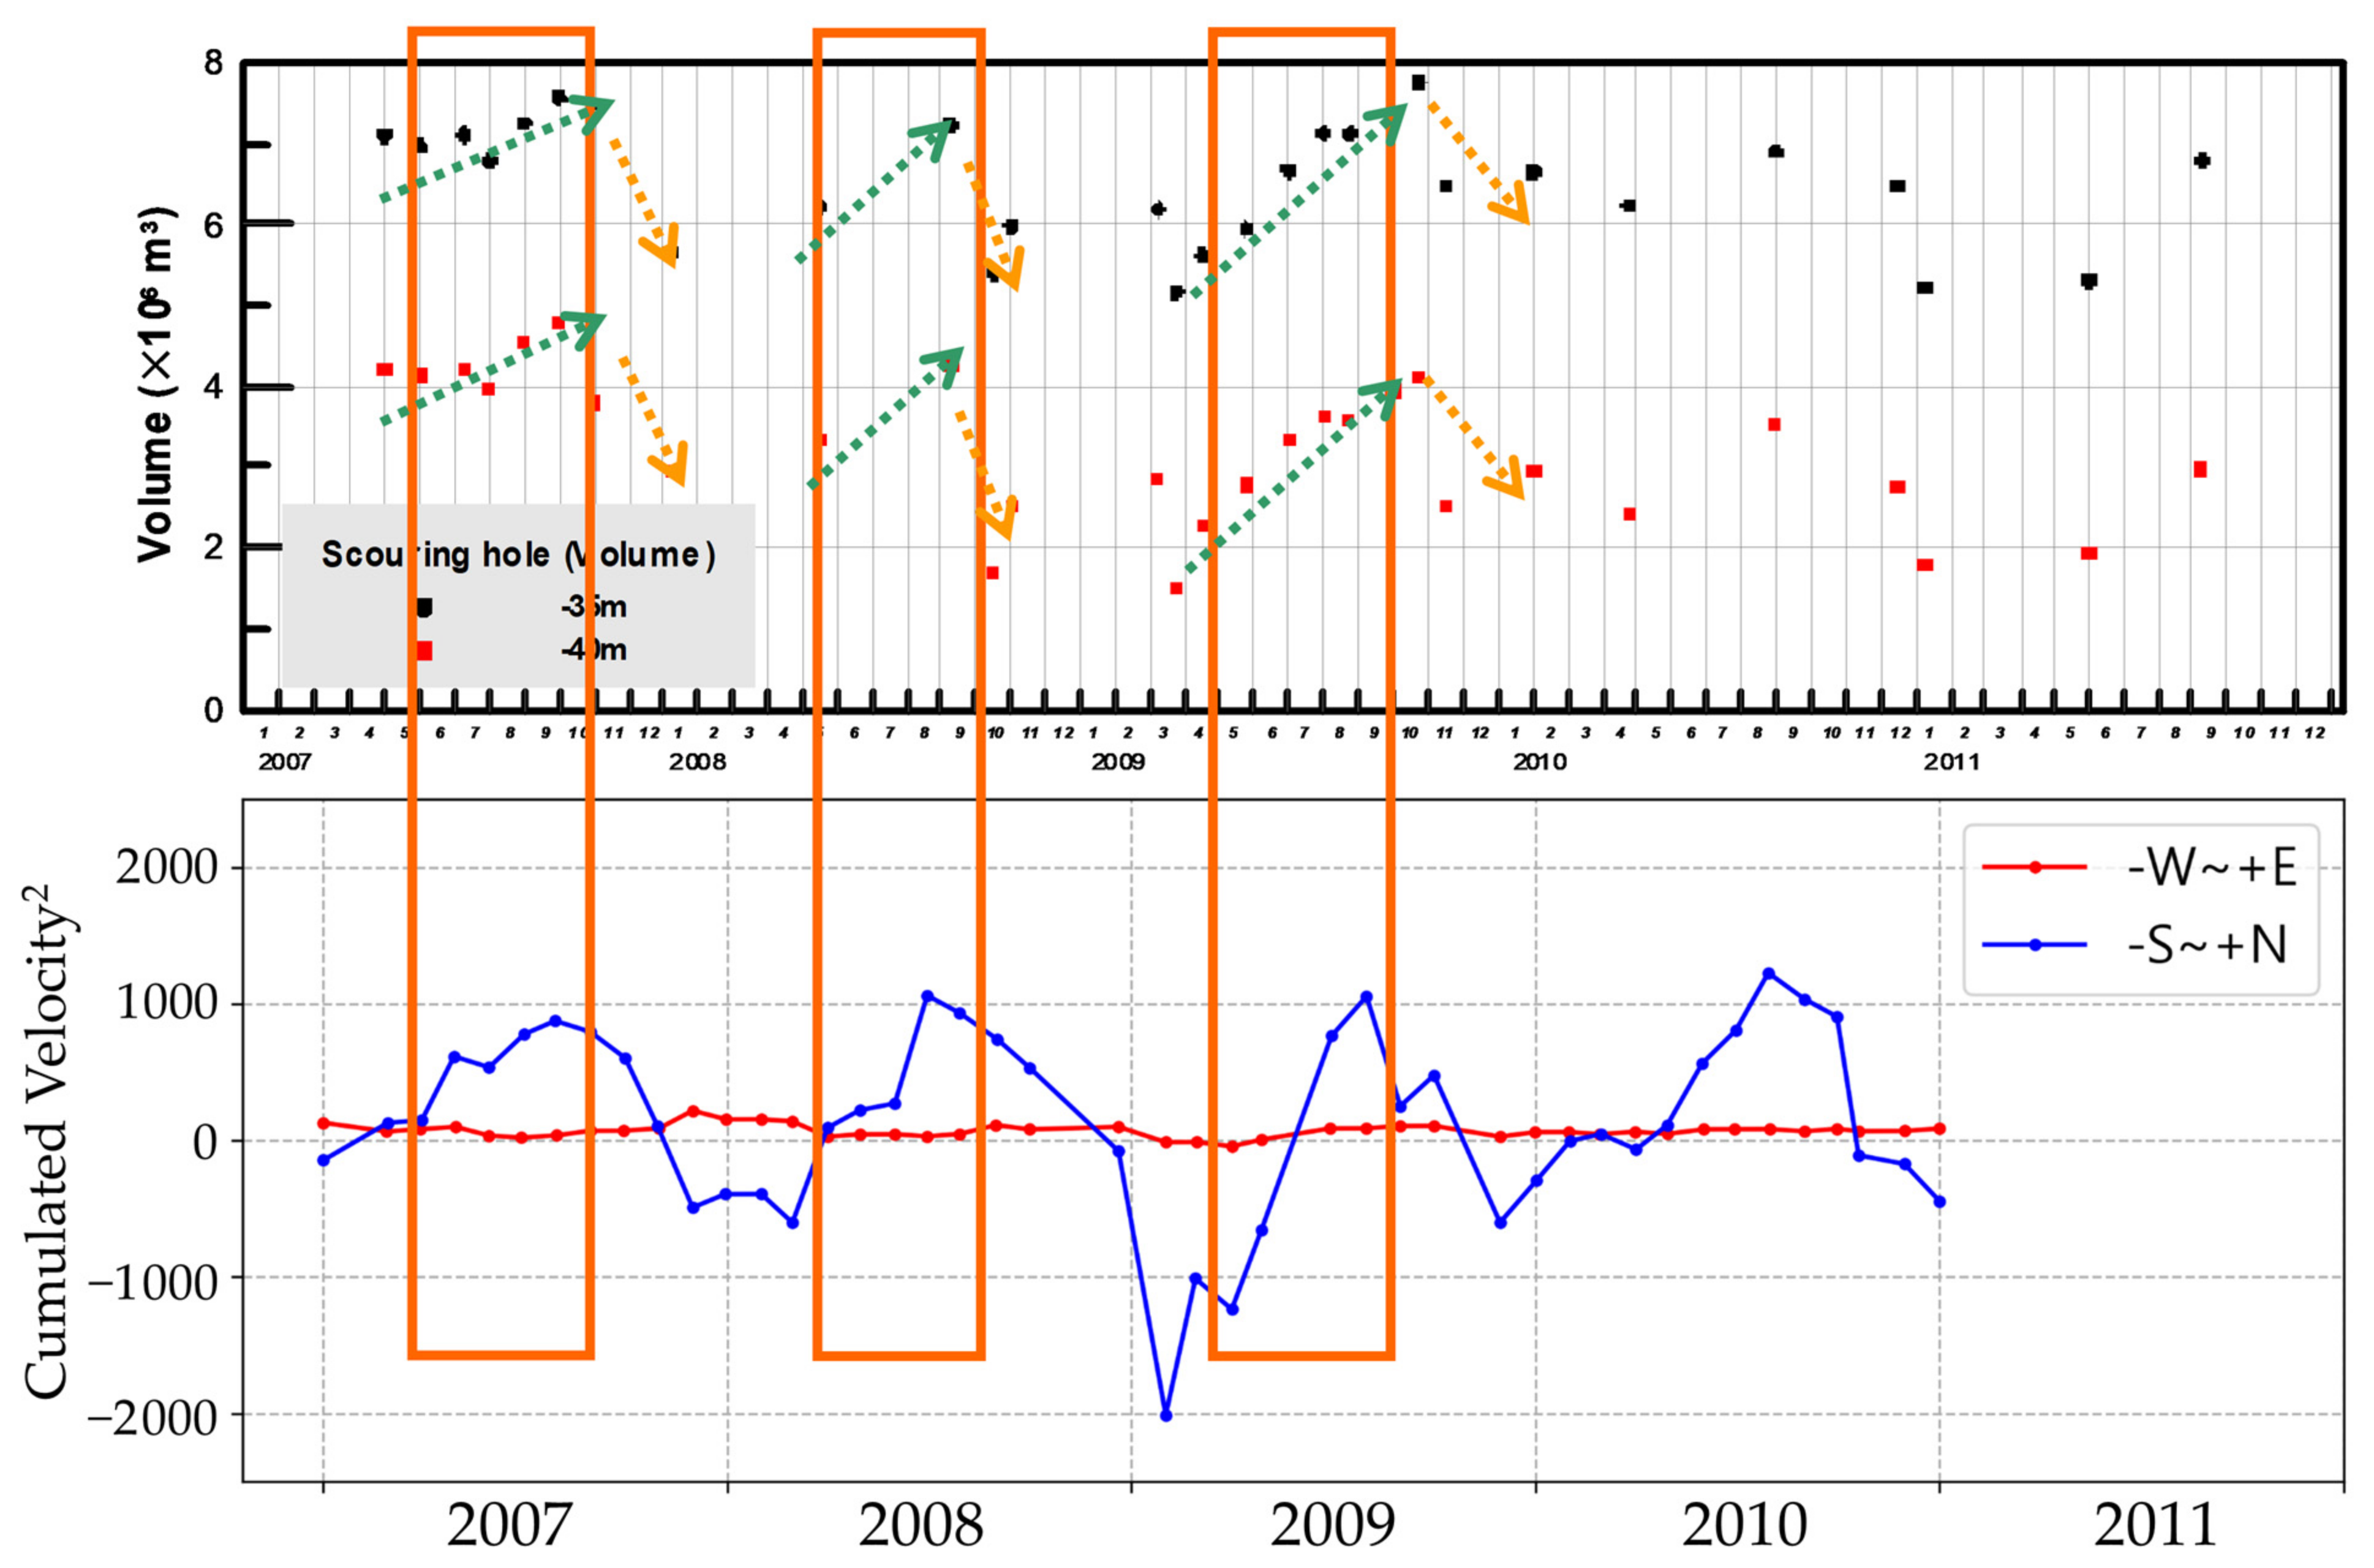
- Evolution of the Scour Hole
- (3)
- High resolution bathymetry data
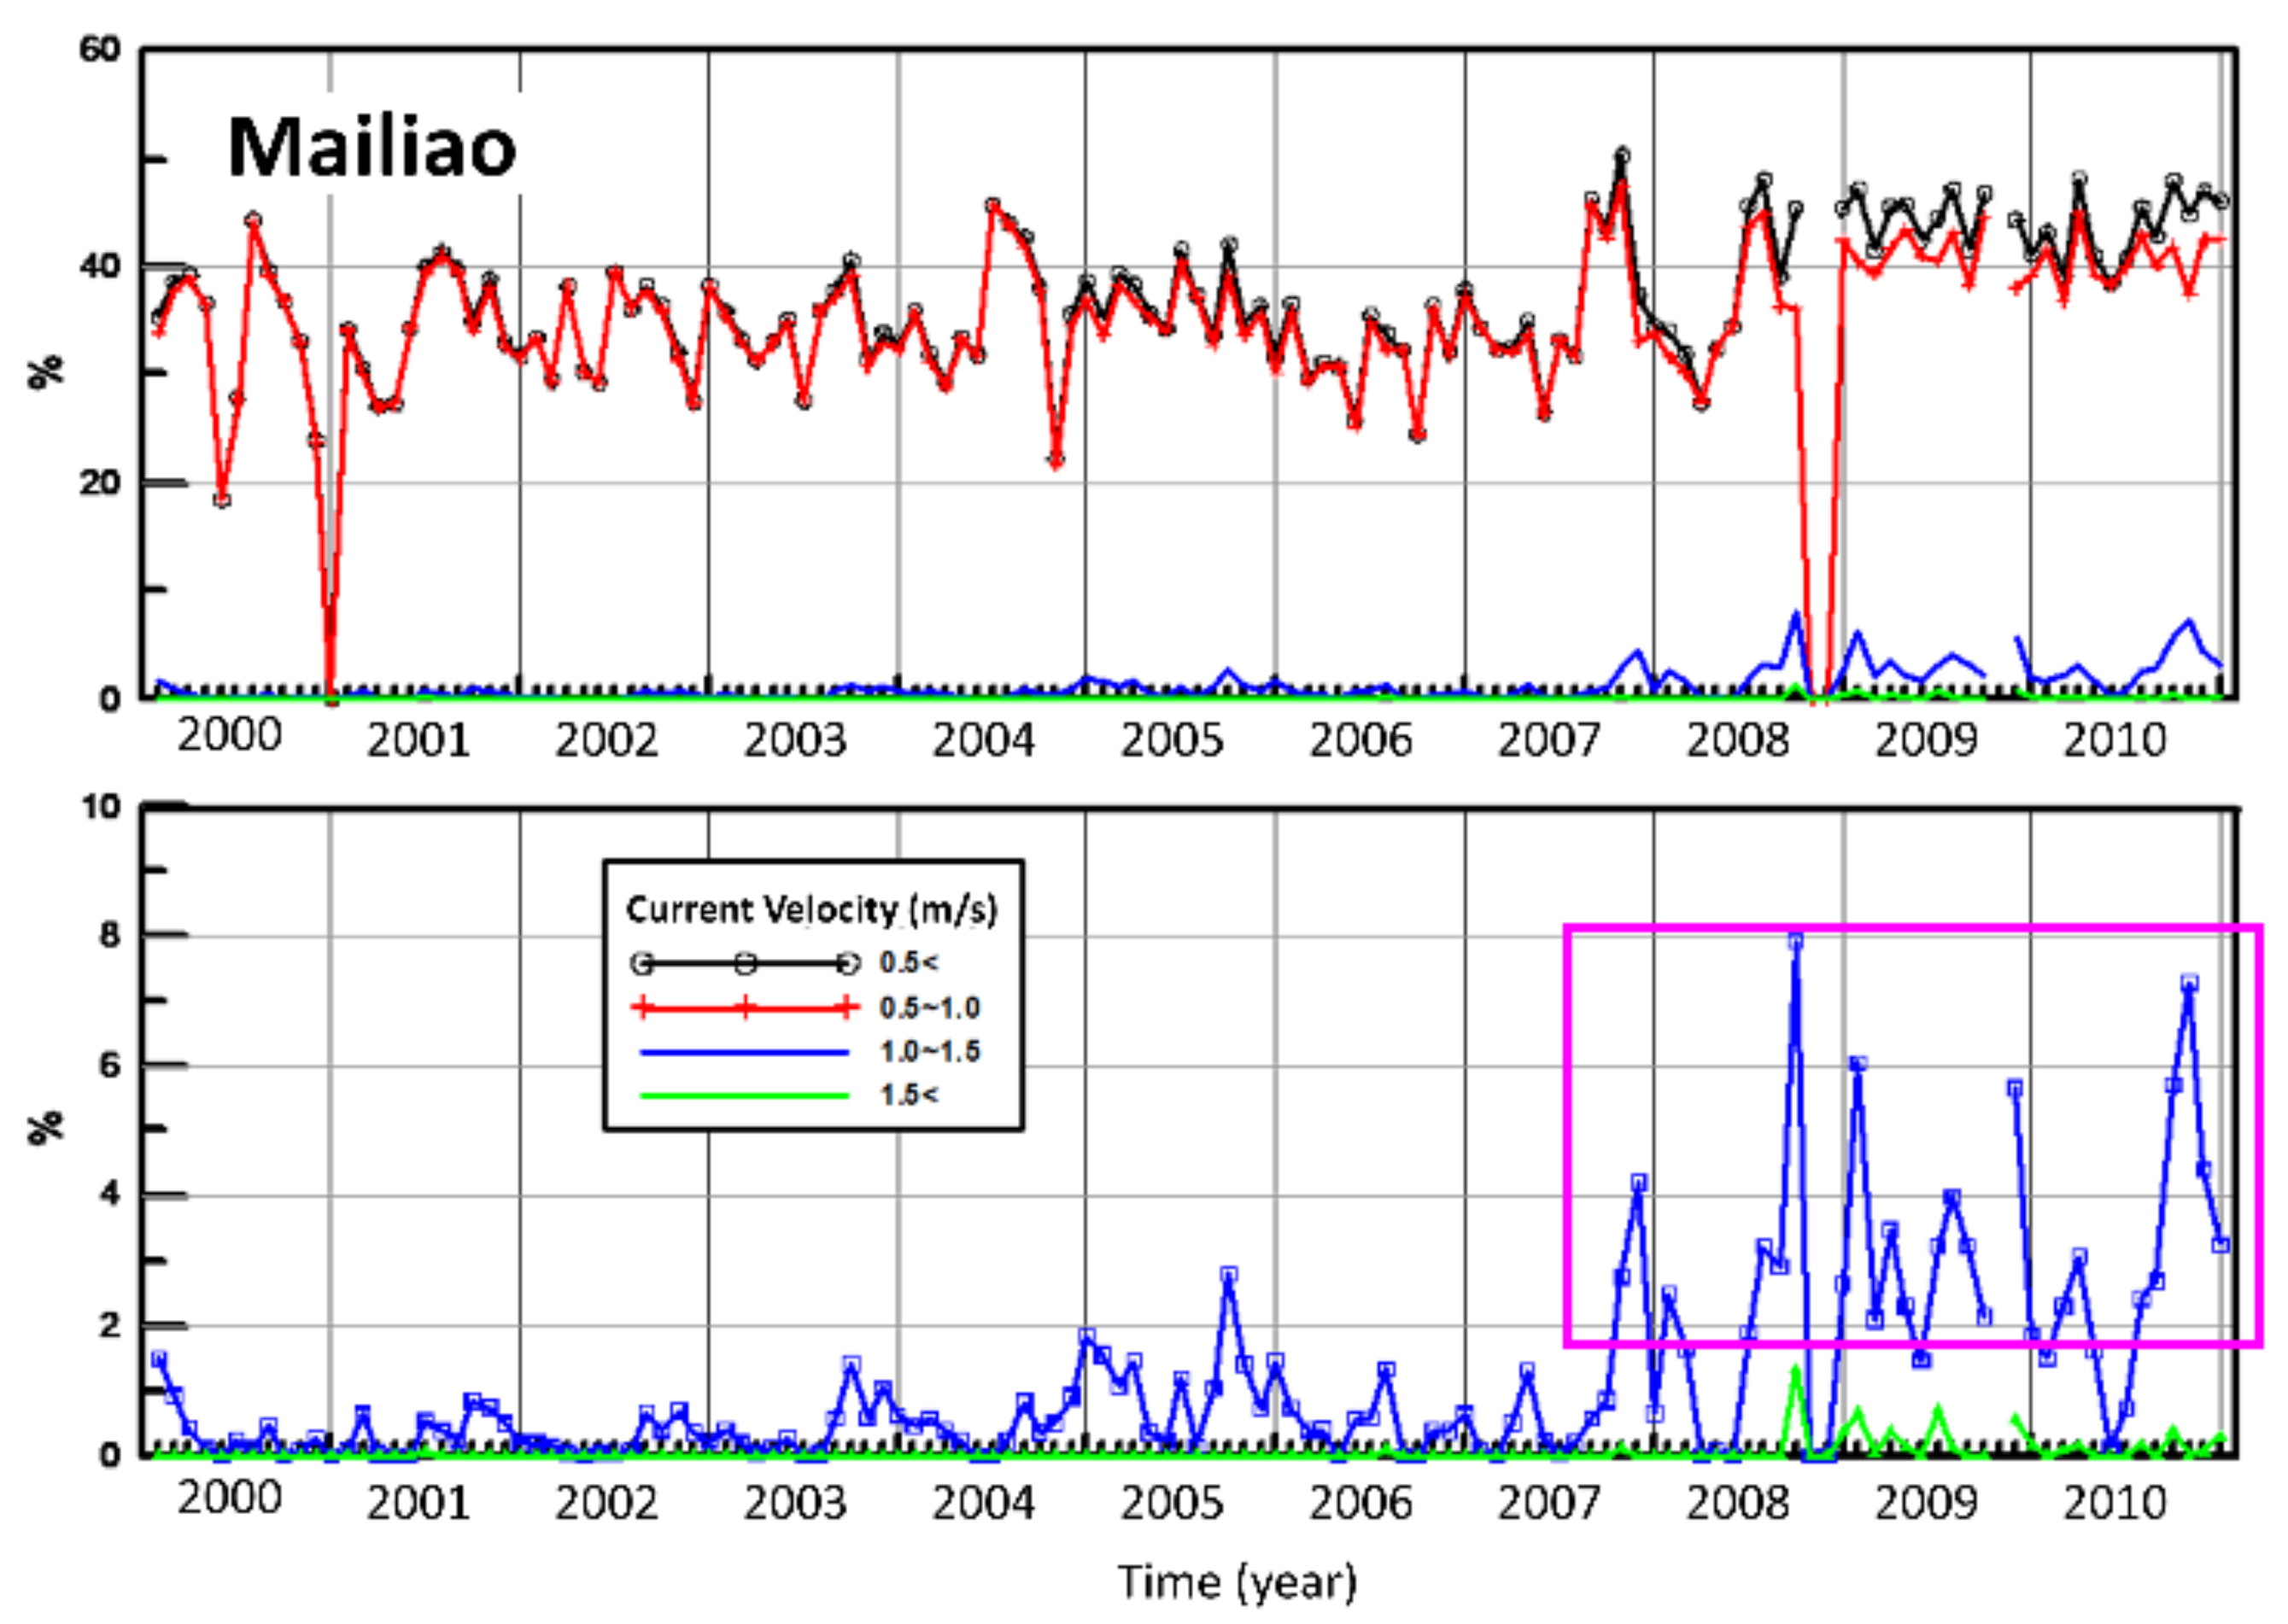
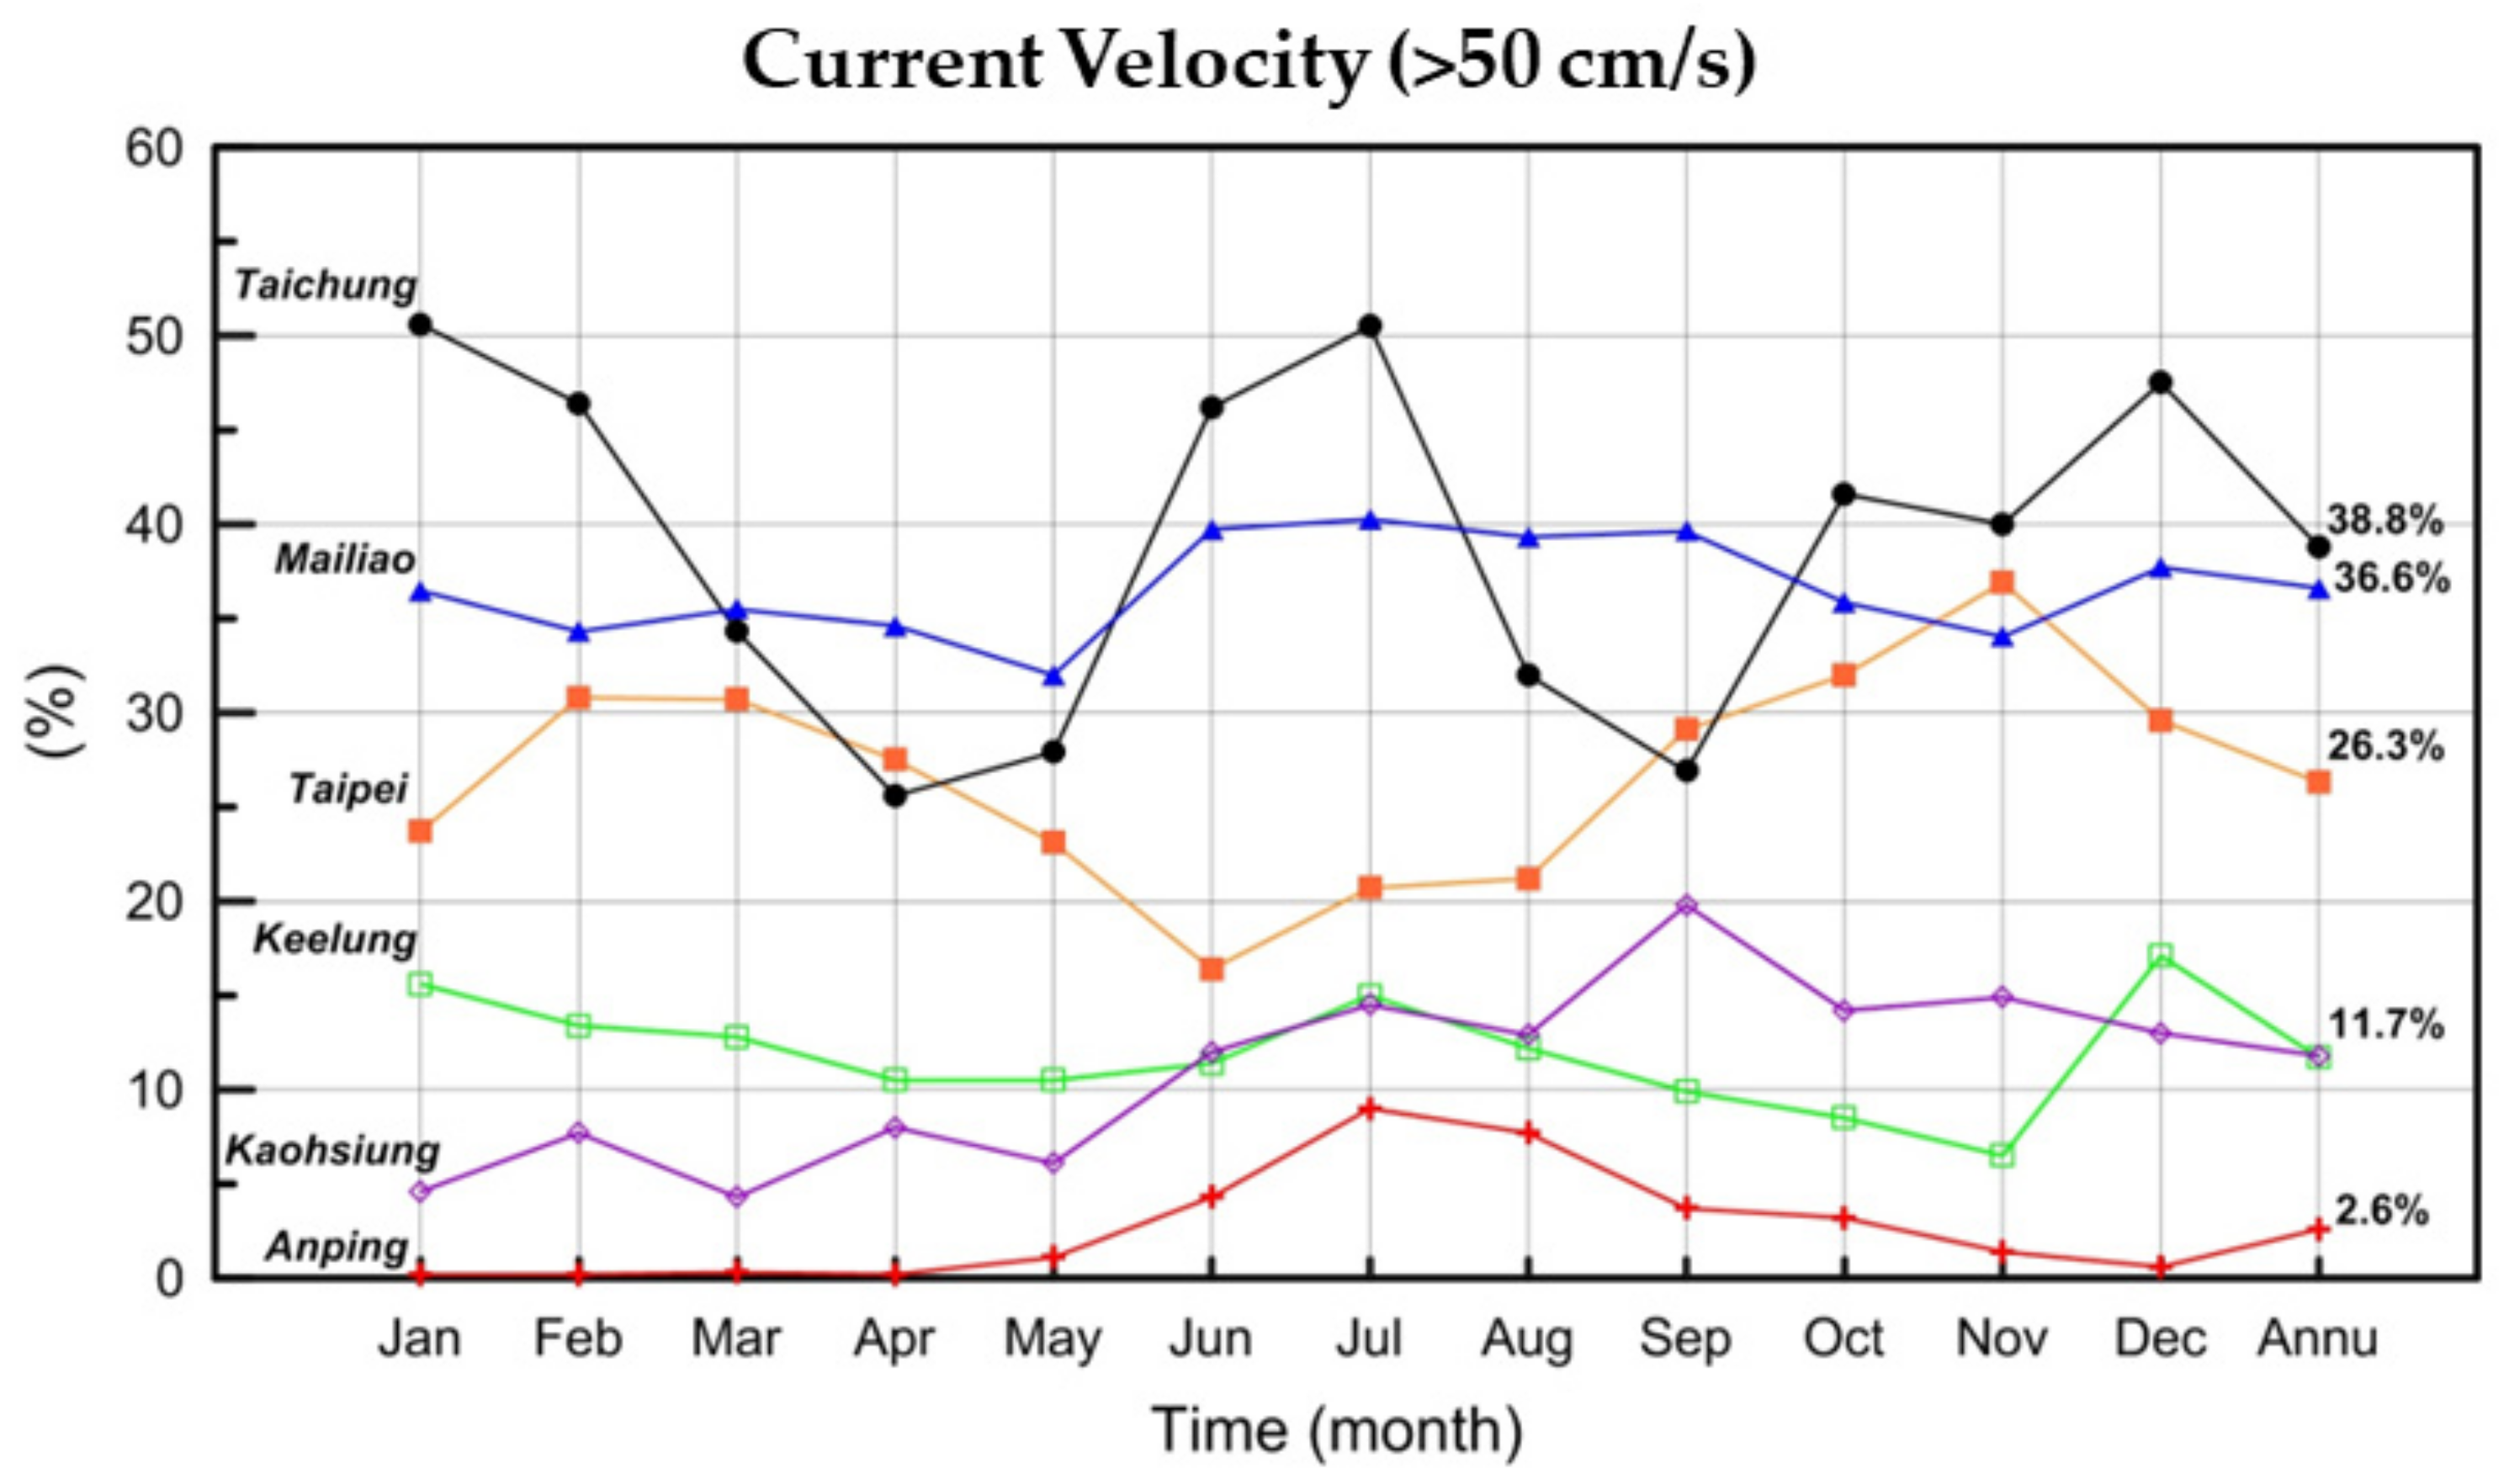
4.1.2. Current Characteristics of Six Major Ports
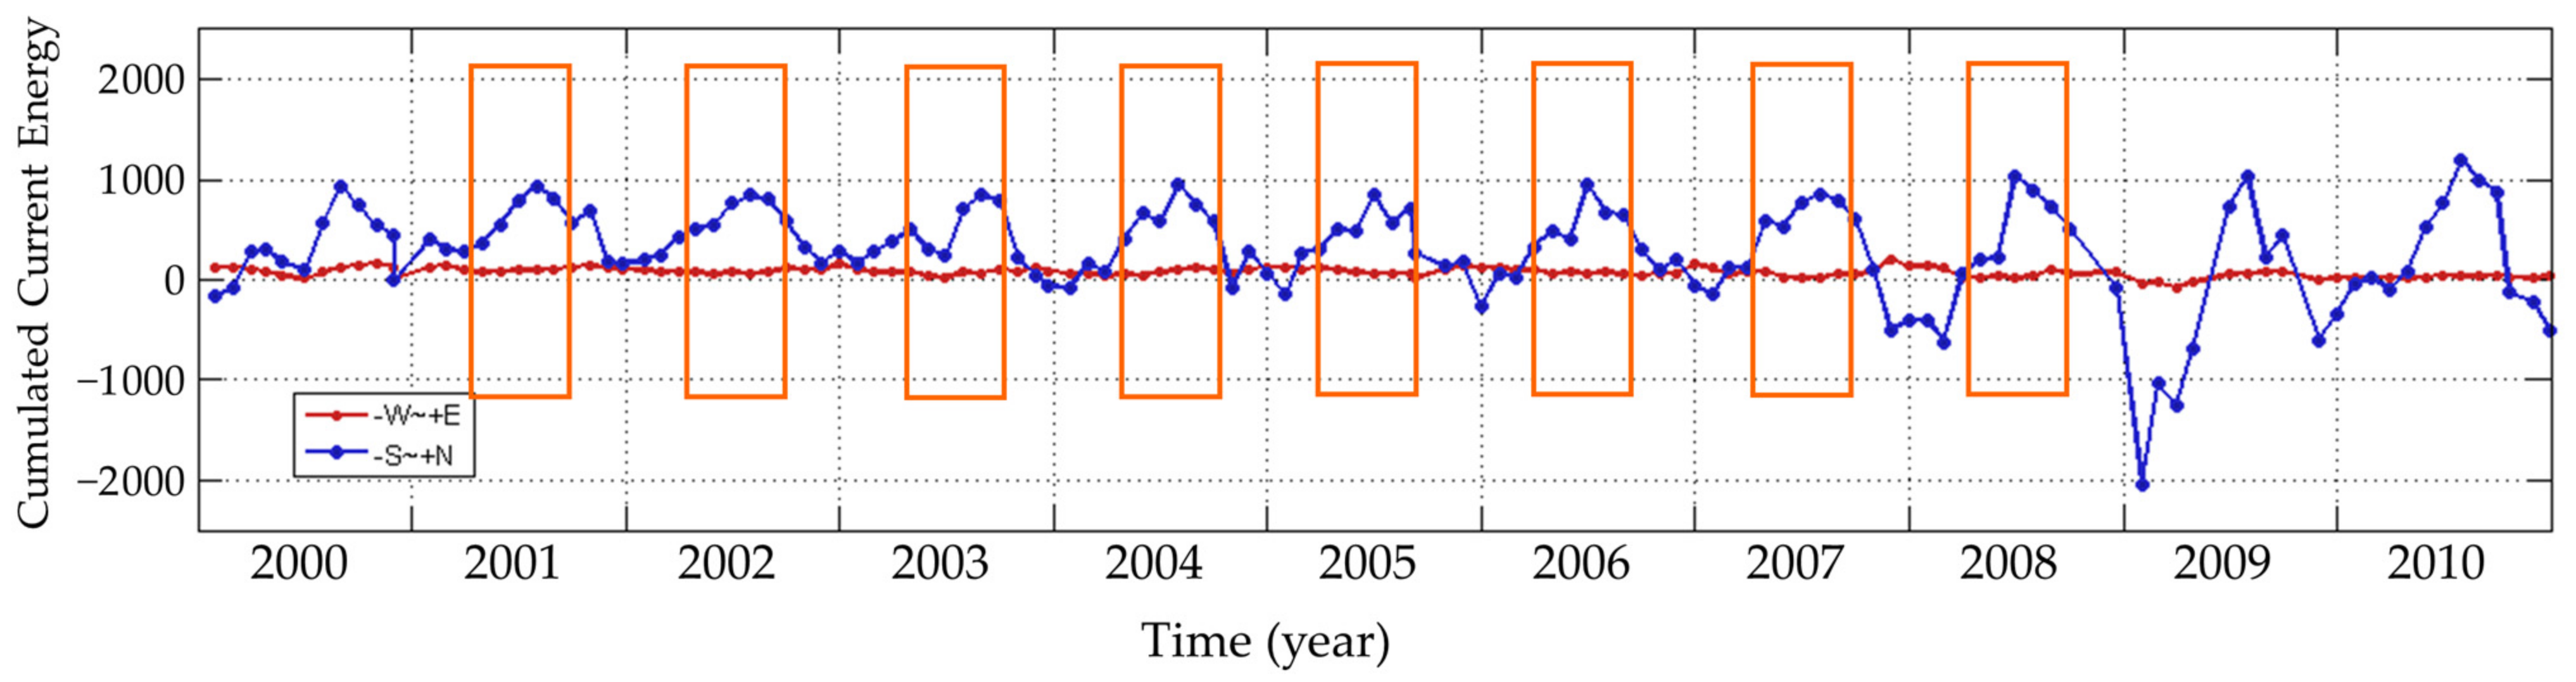
4.1.3. Relationship between Current Energy and Erosion
- (1)
- Calculation of the current energy
- (2)
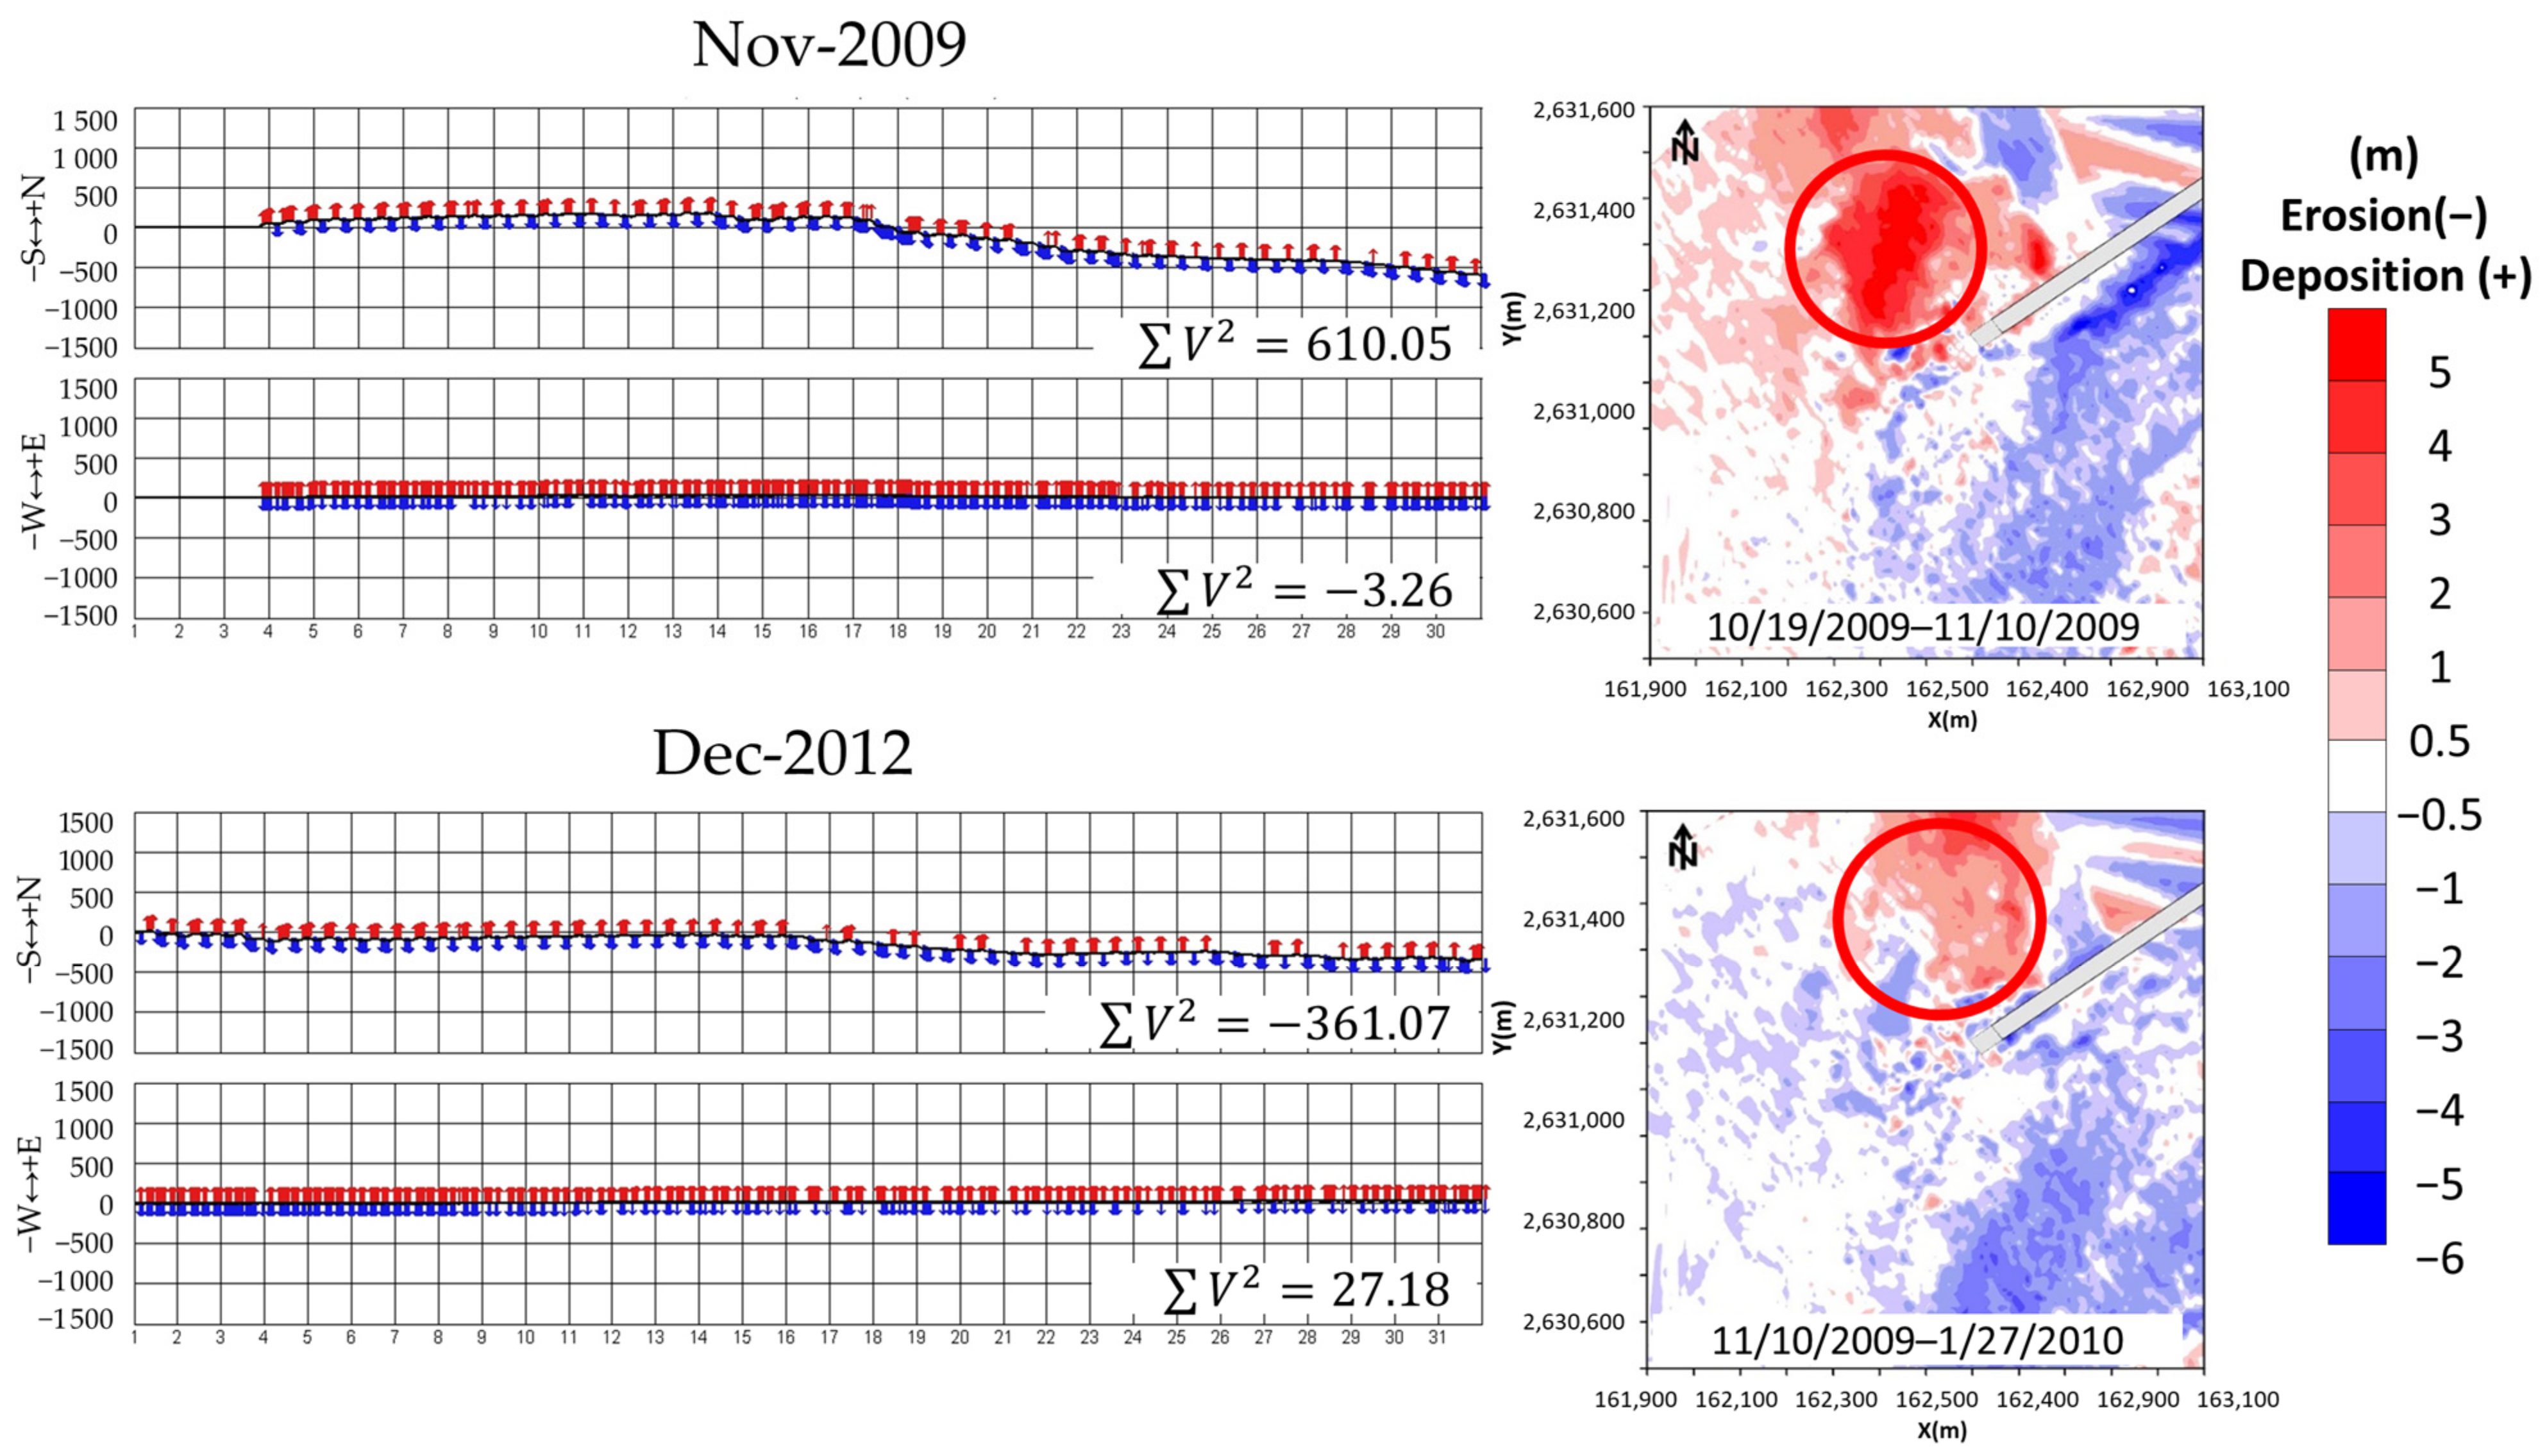
- The seasonal trend of current energy and erosion
4.2. Hydraulic Test of Wave Field
4.2.1. Monsoon Waves
- (1)
- Wave field and current field
- (2)
- Topographic changes
4.2.2. Typhoon Waves
- (1)
- Wave and current field
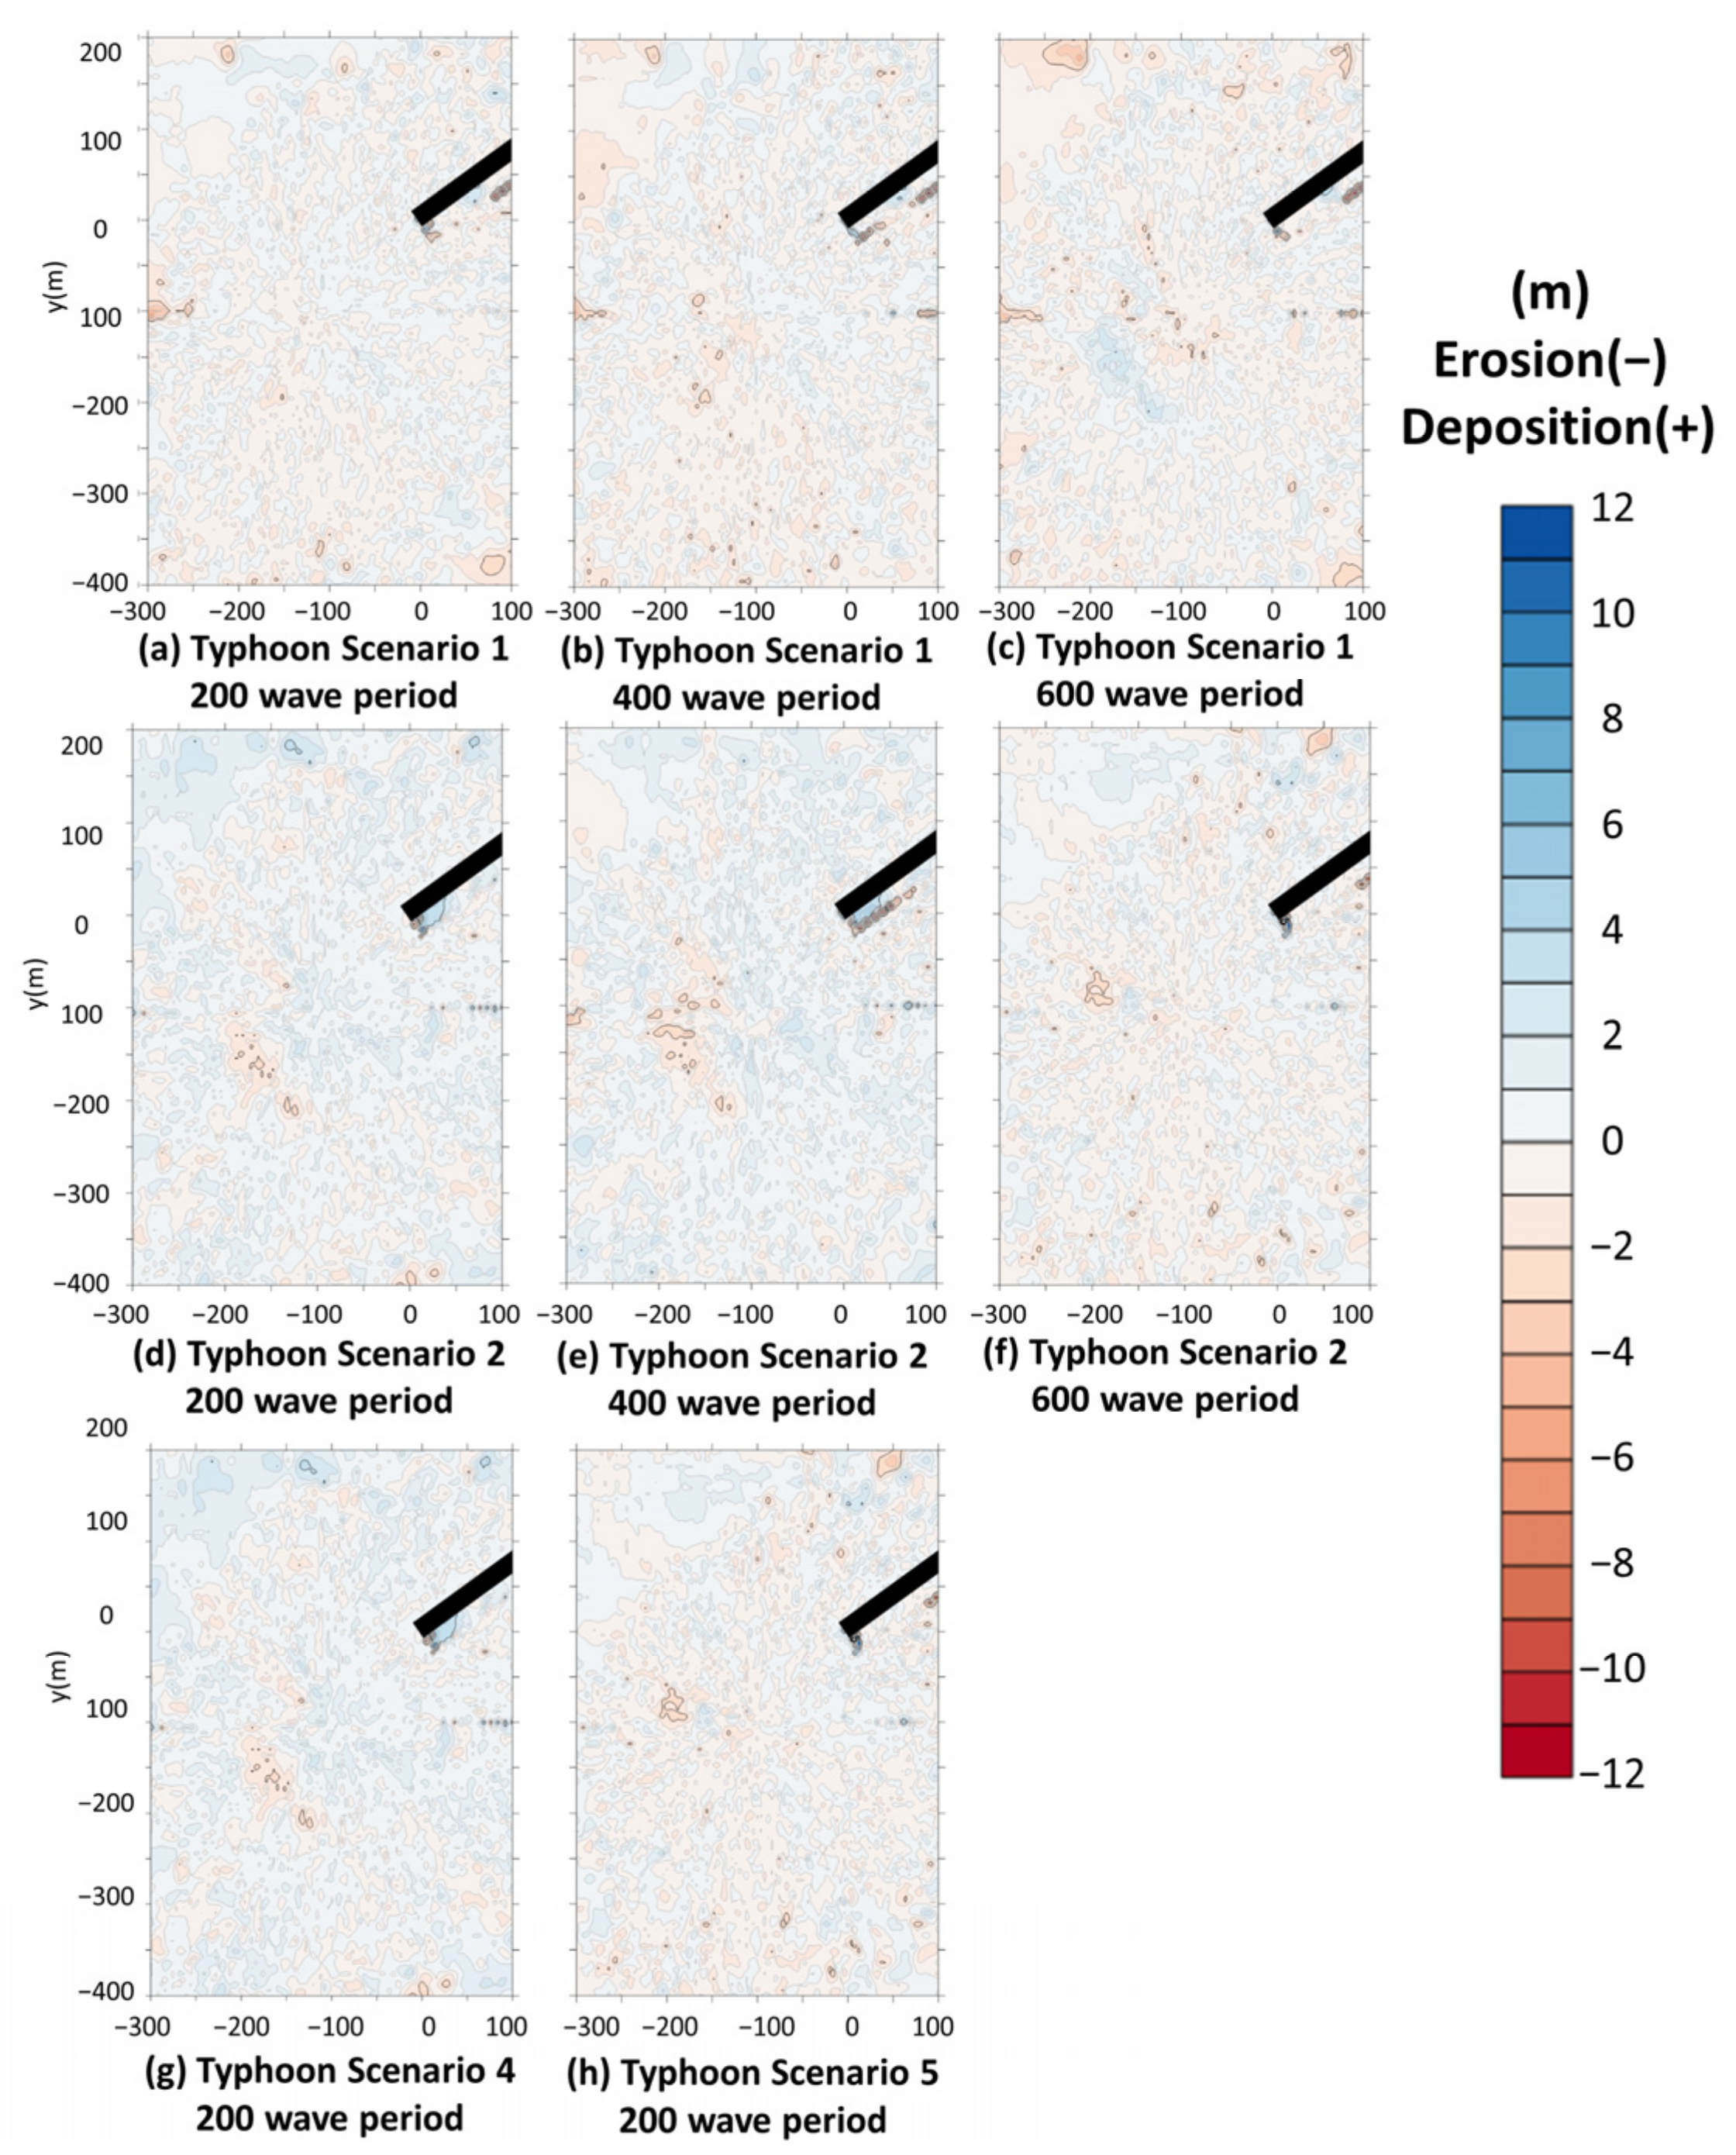
- (2)
- Topographic changes
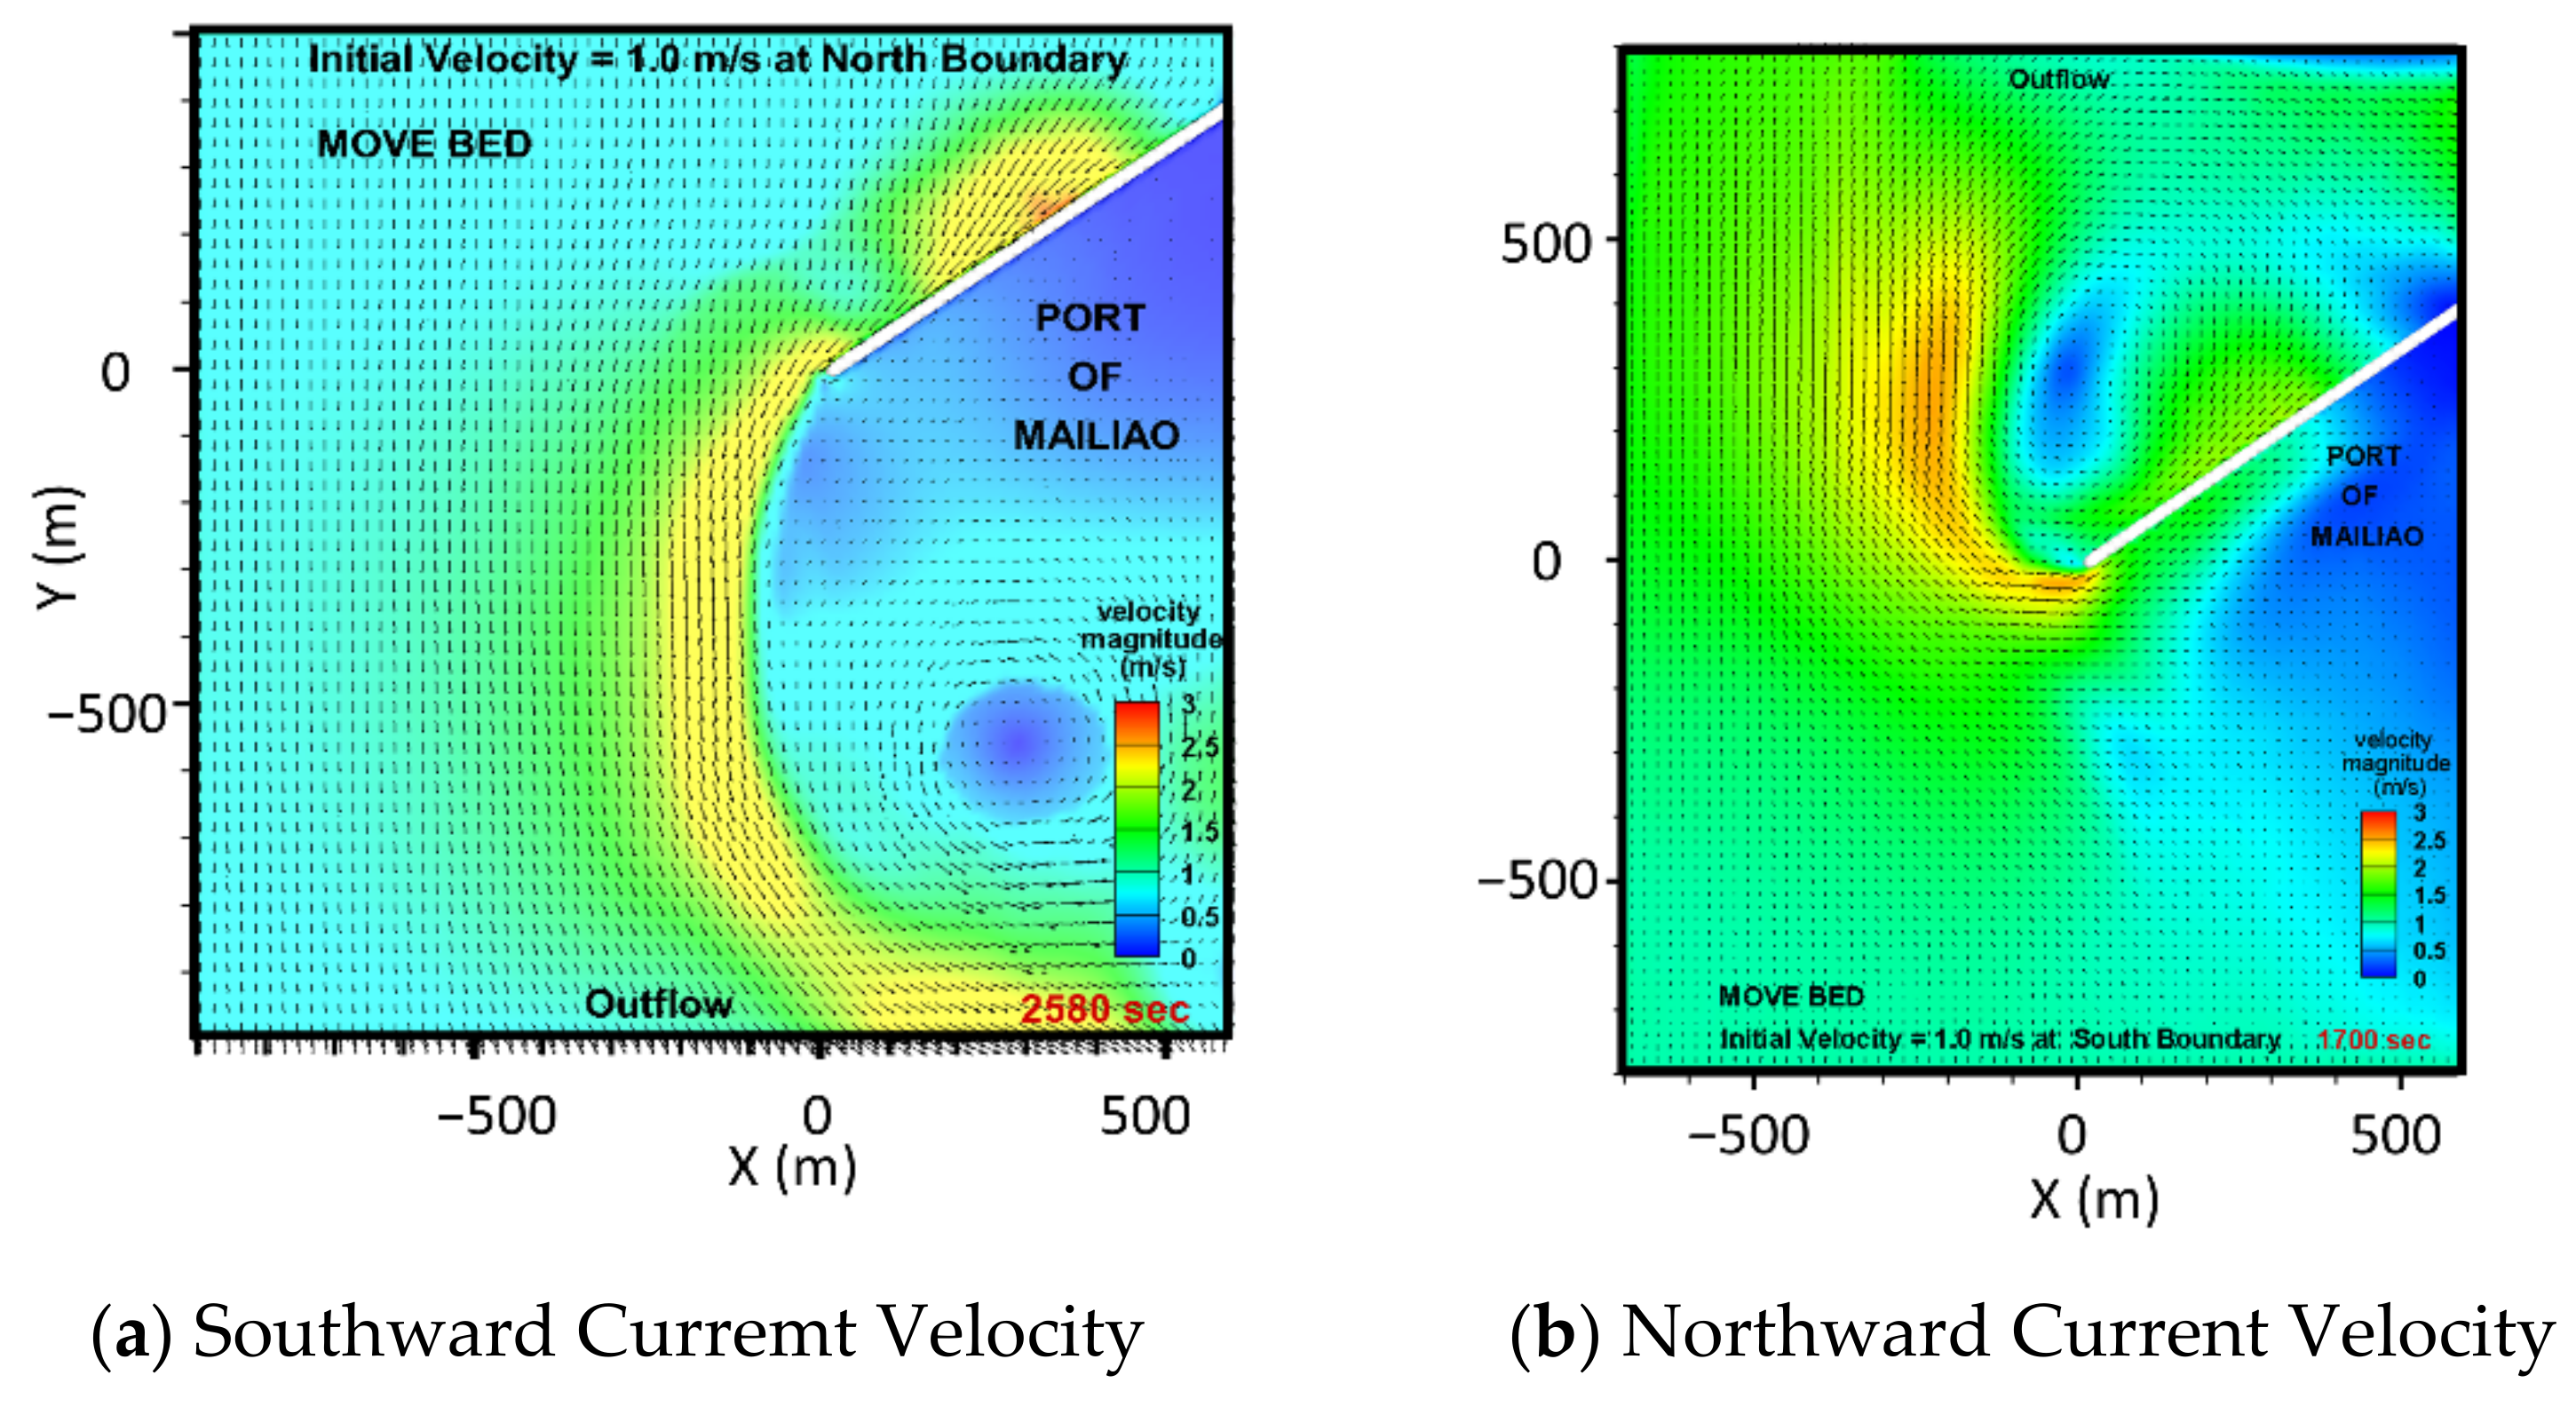
4.3. Hydraulic Test of Current Field
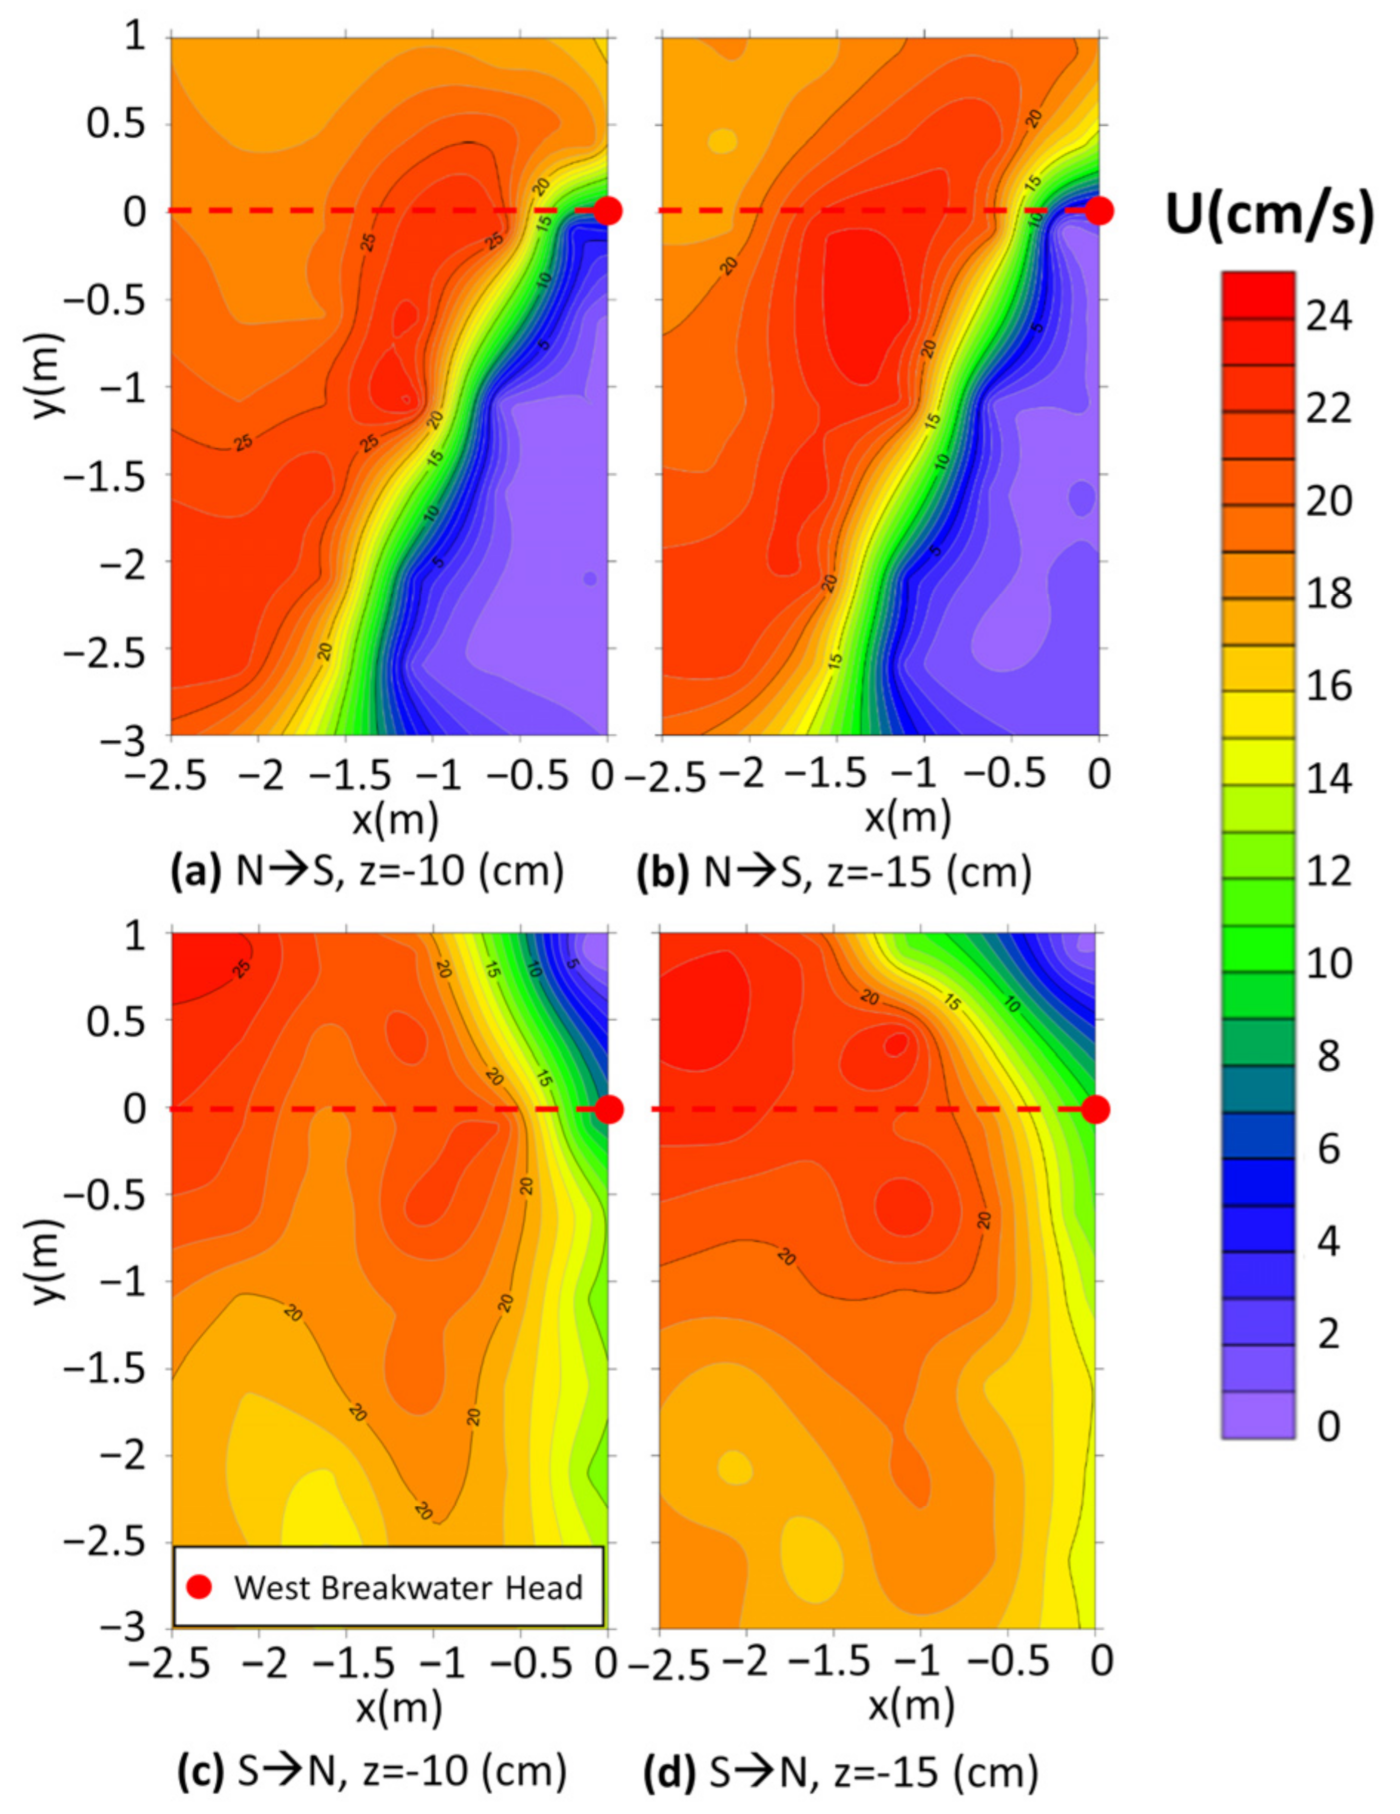
4.3.1. Current Field
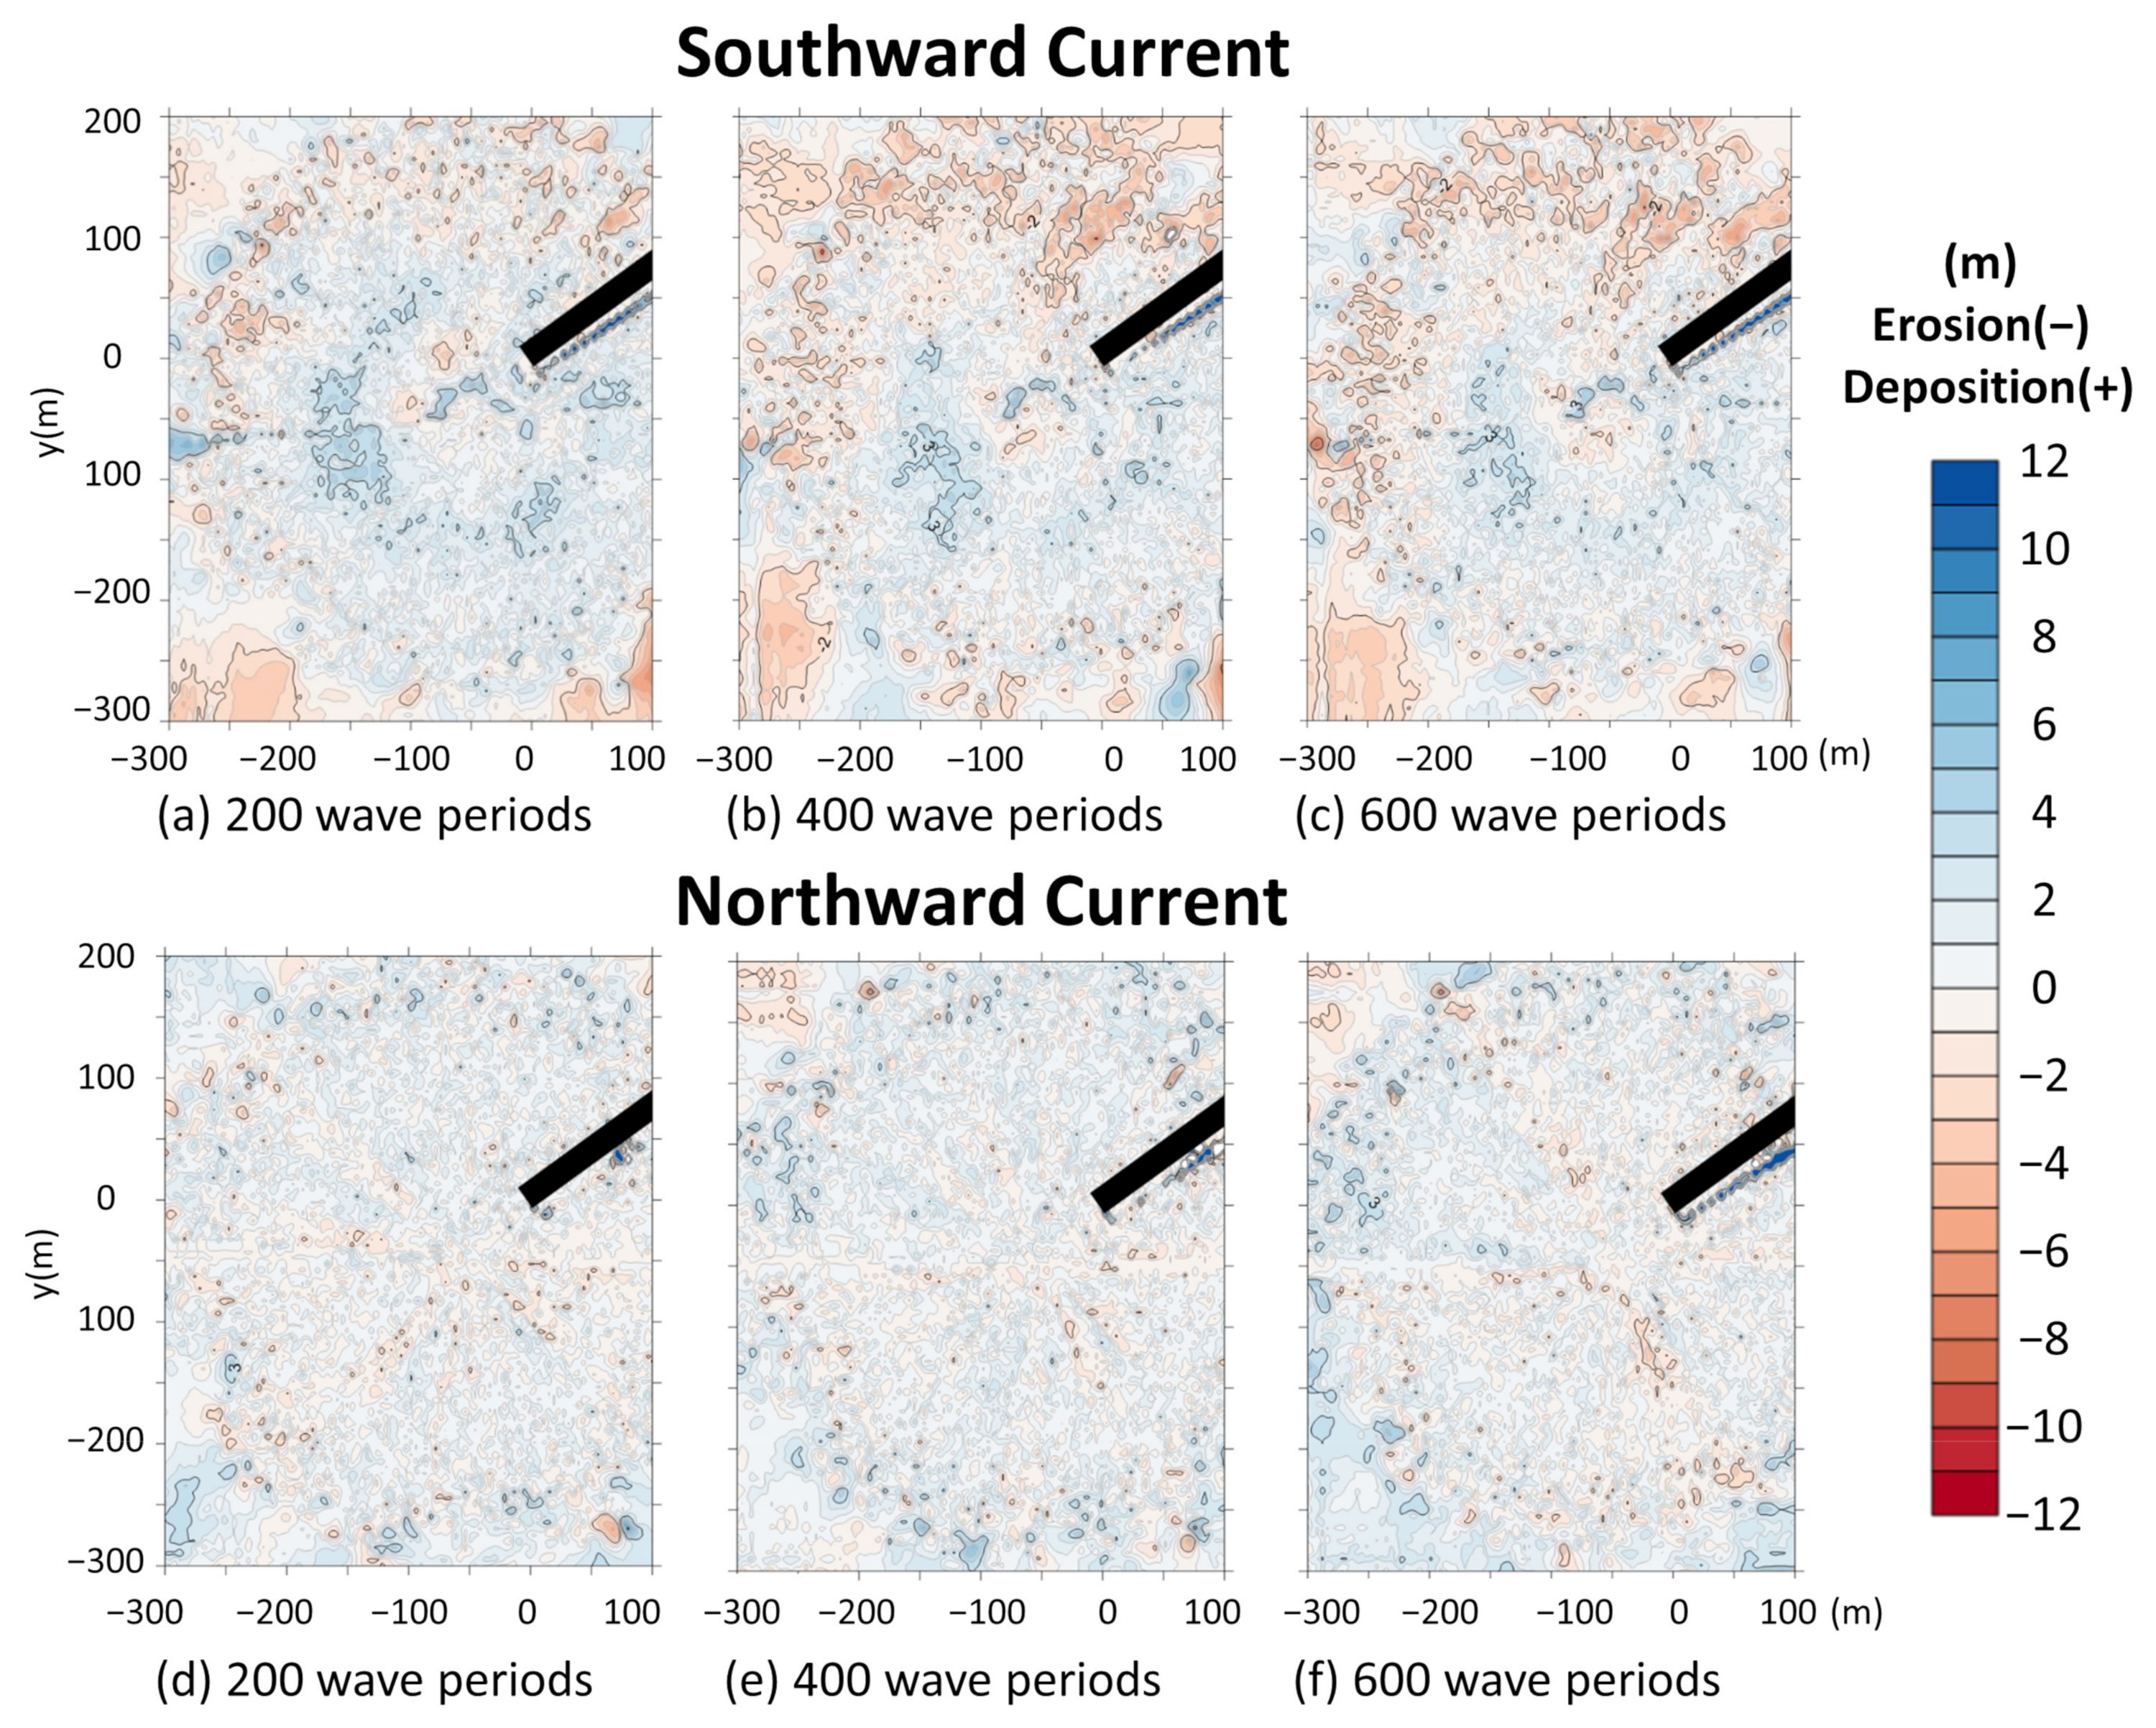
4.3.2. Topographic Changes
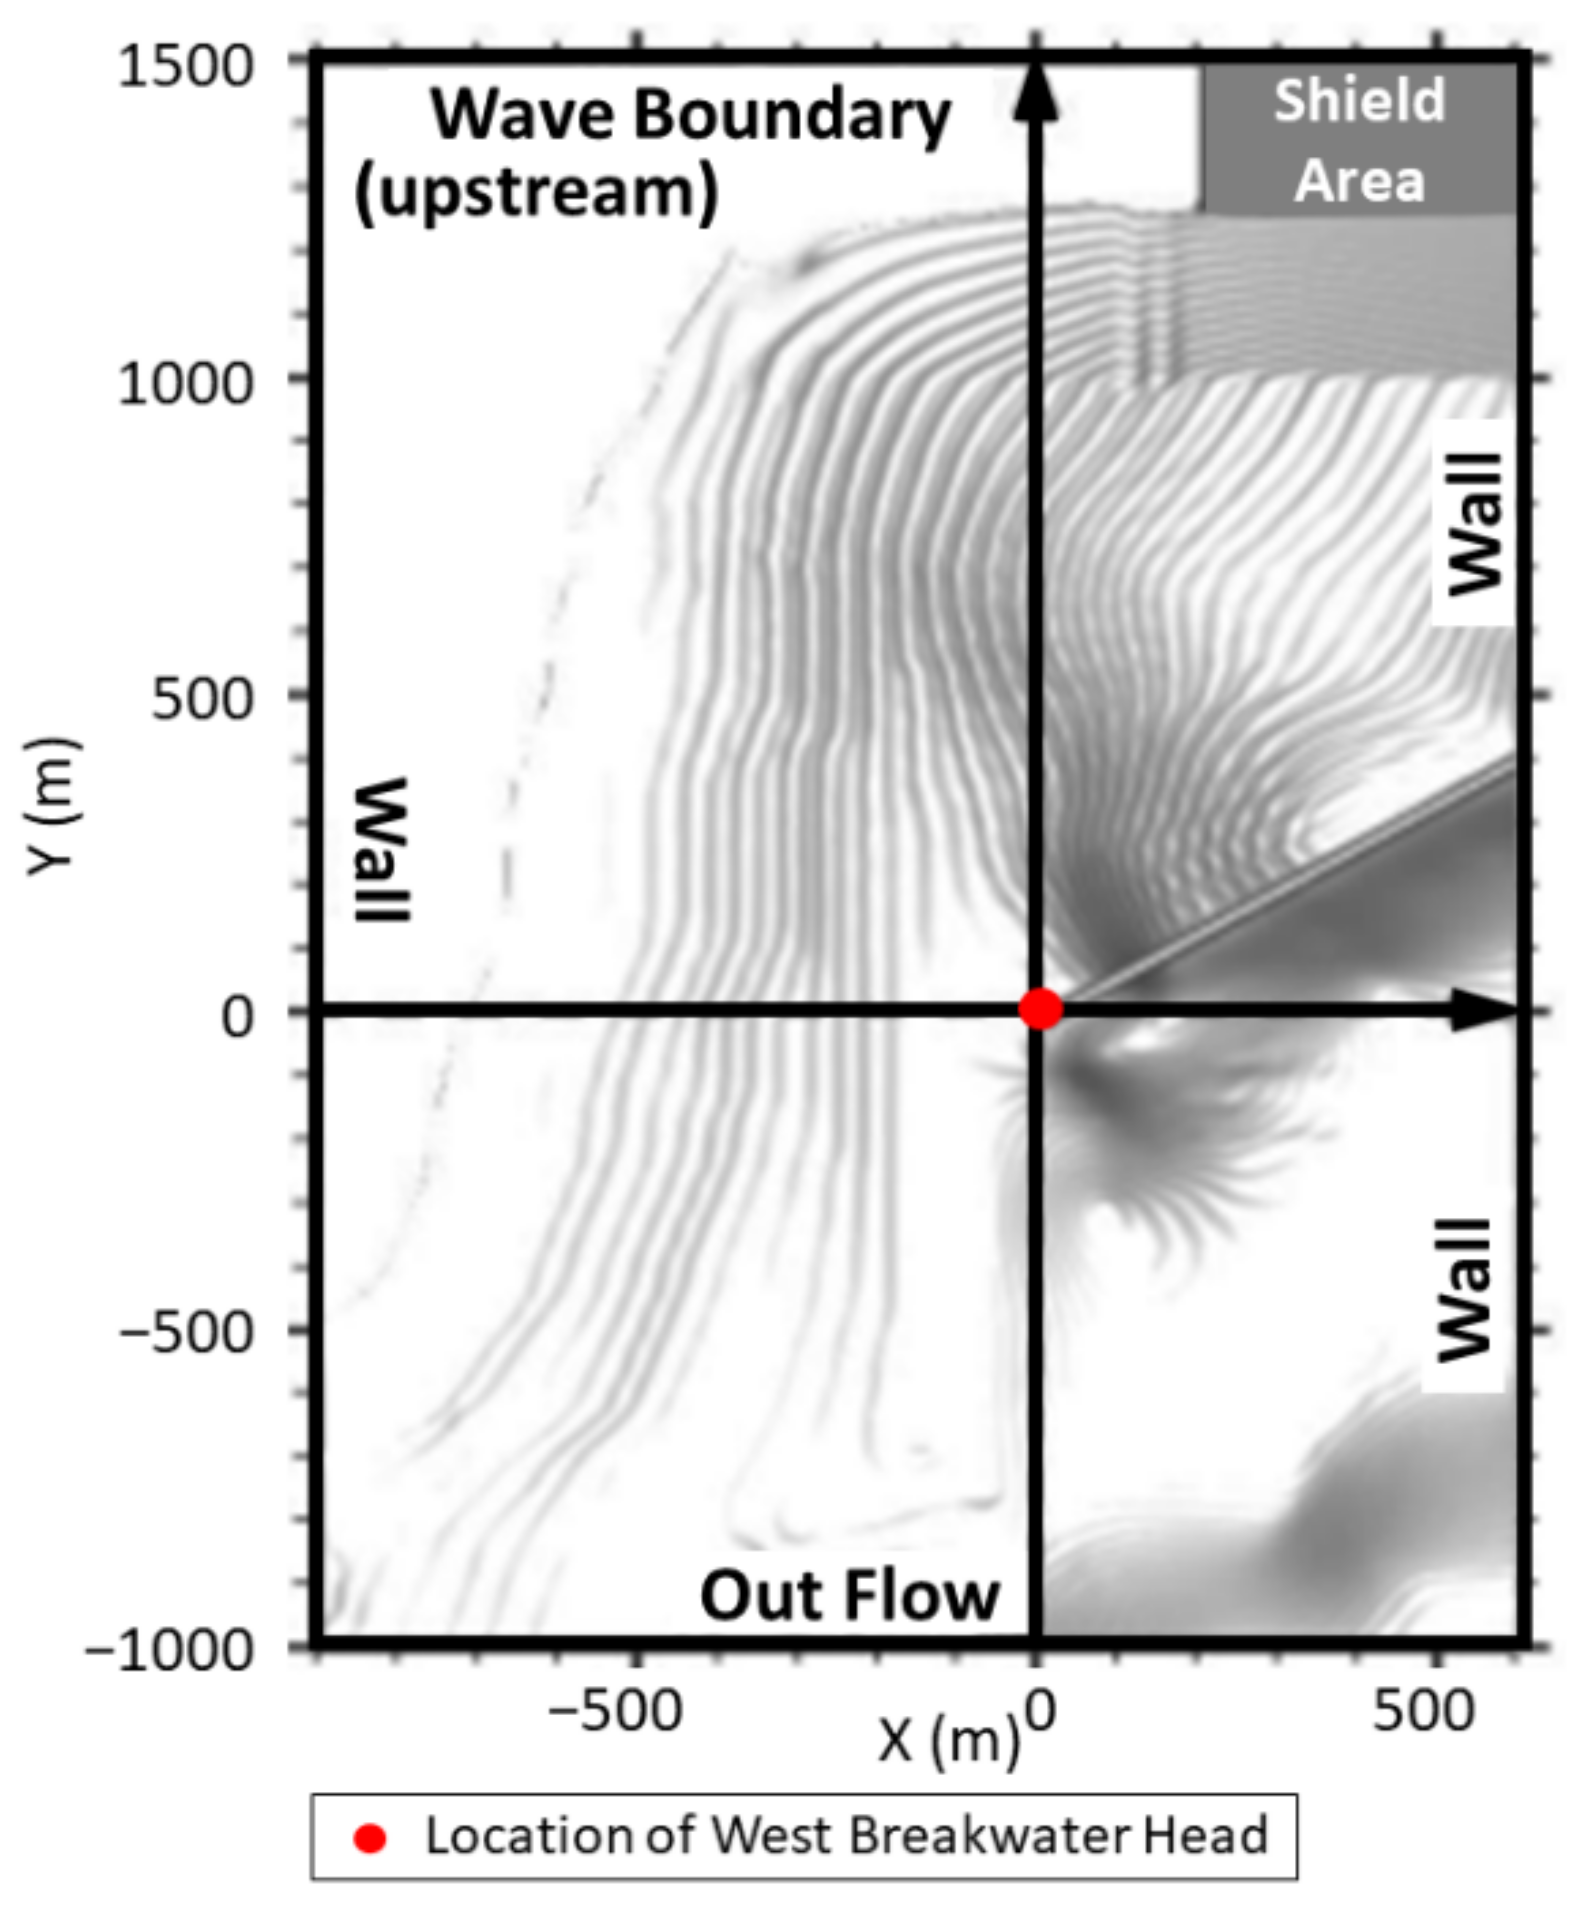
4.4. Numerical Simulation of Wave Field
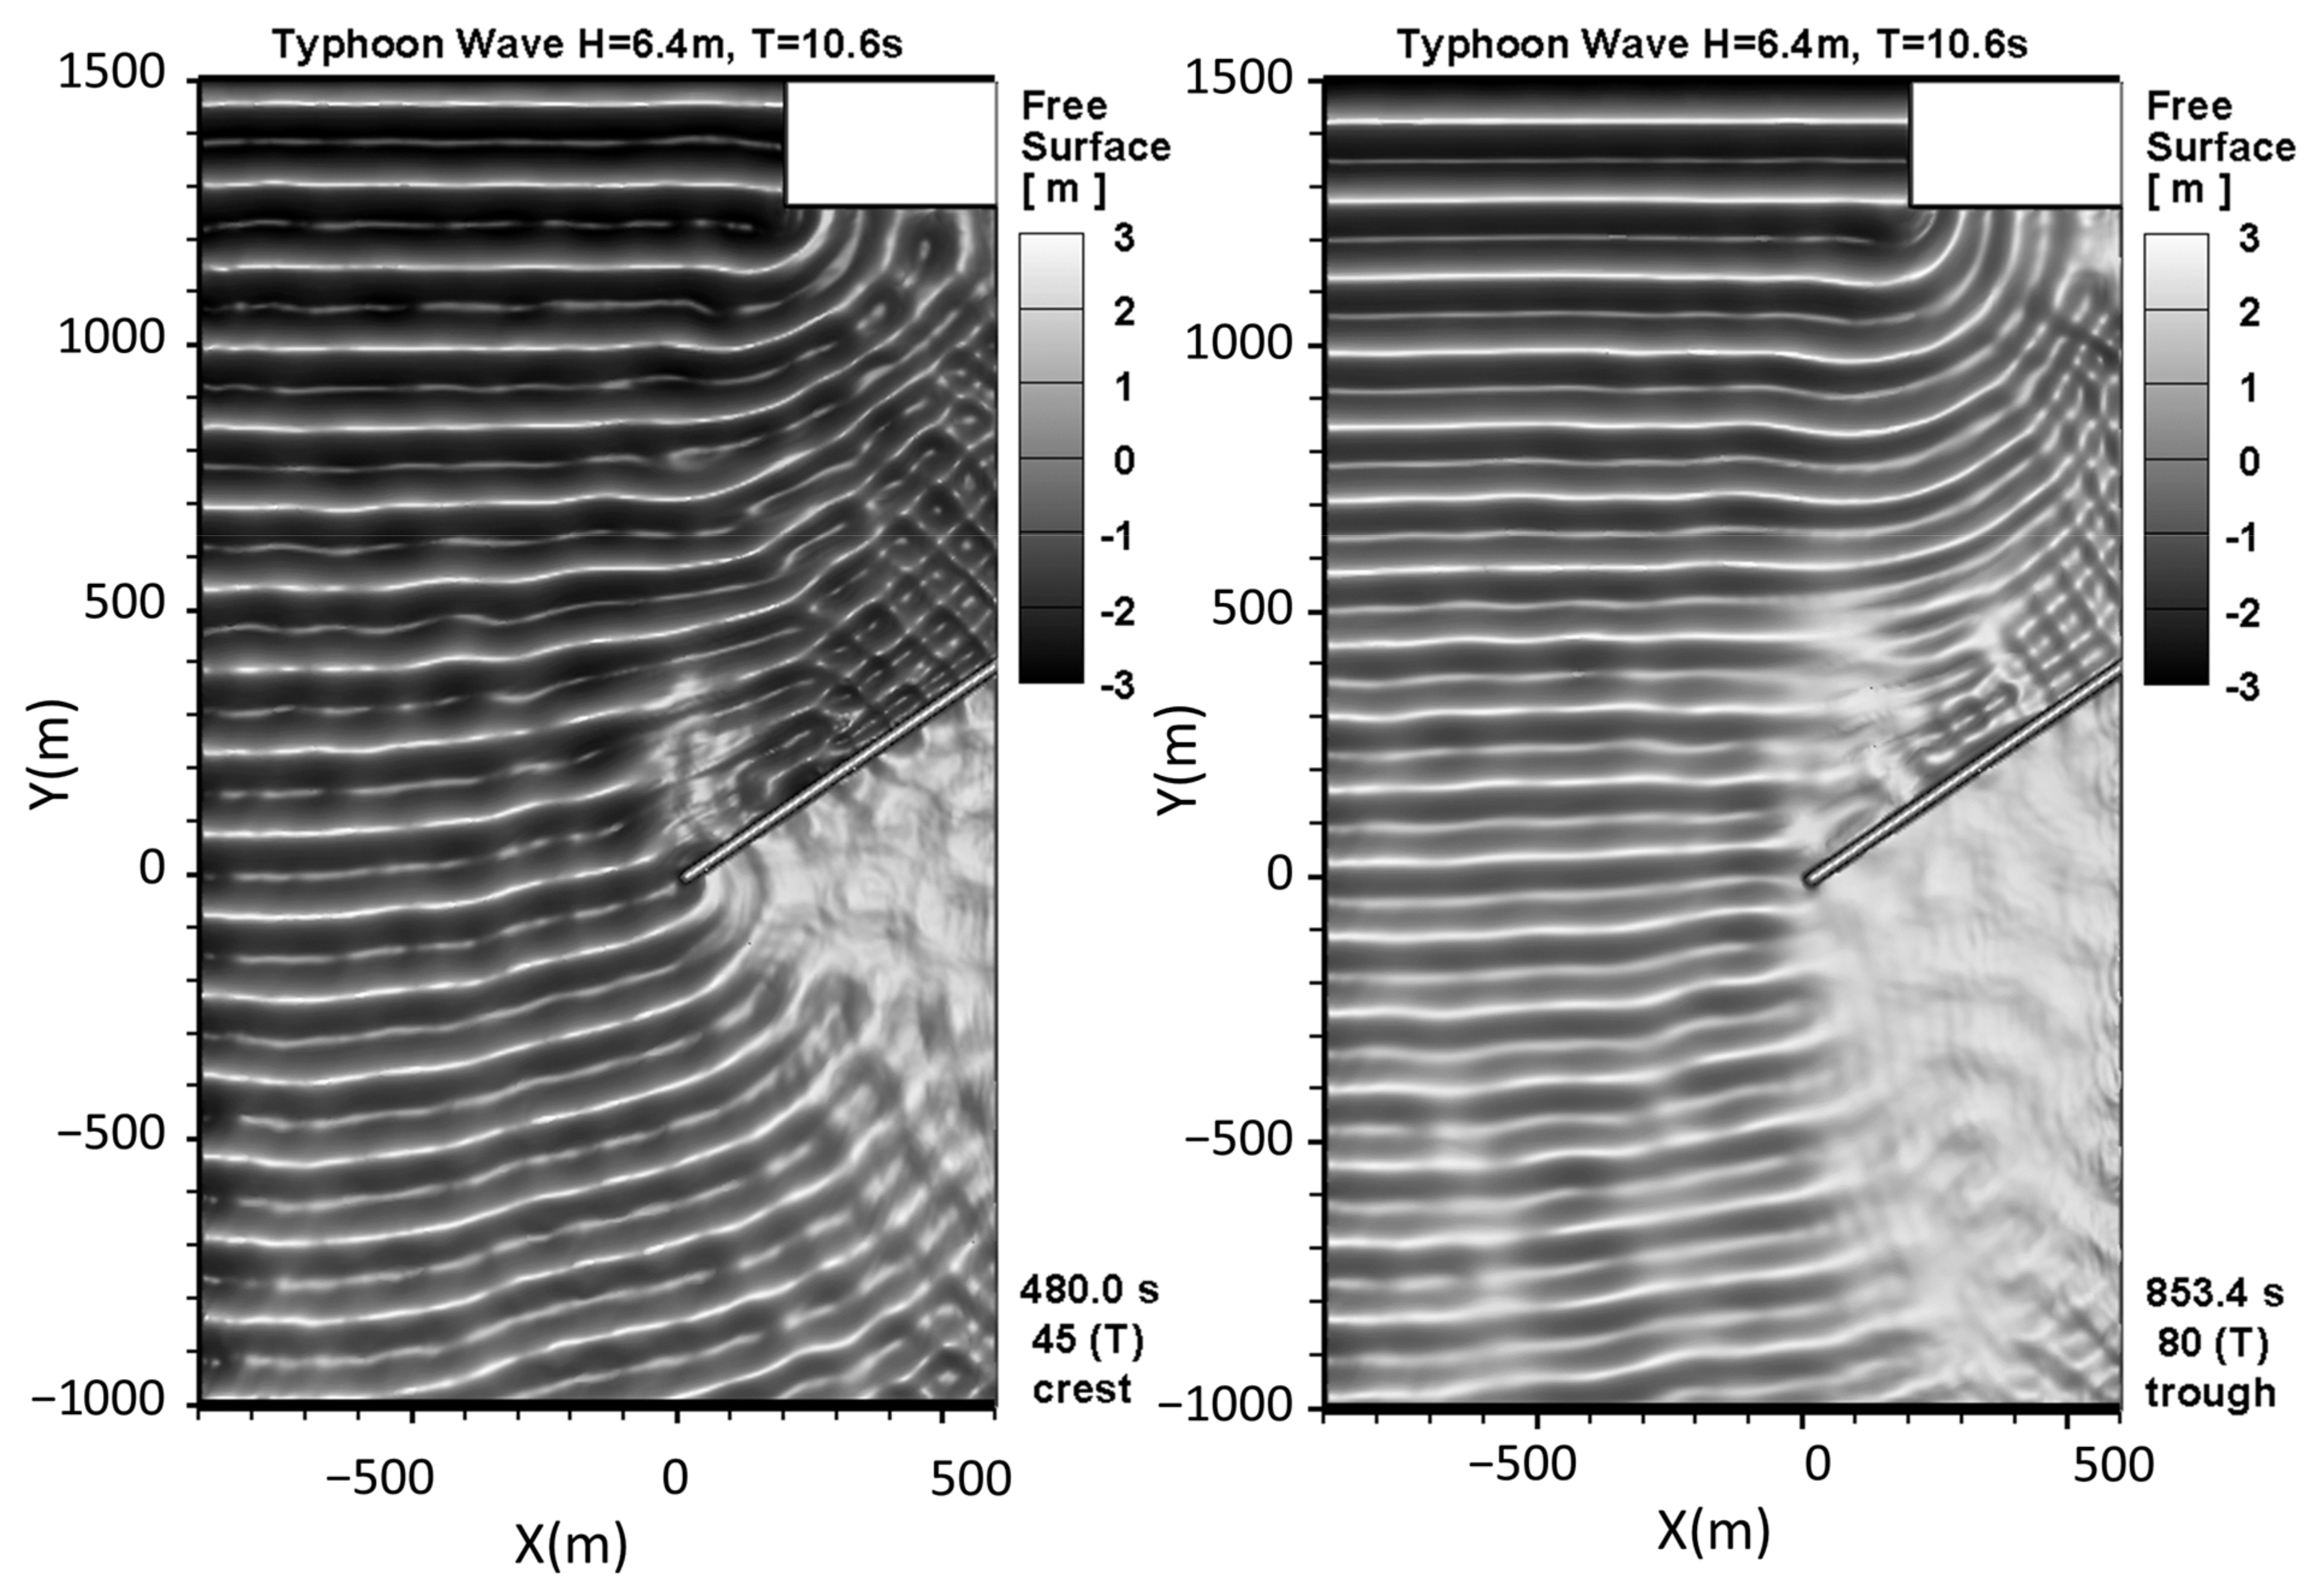
4.4.1. Water Surface Elevation
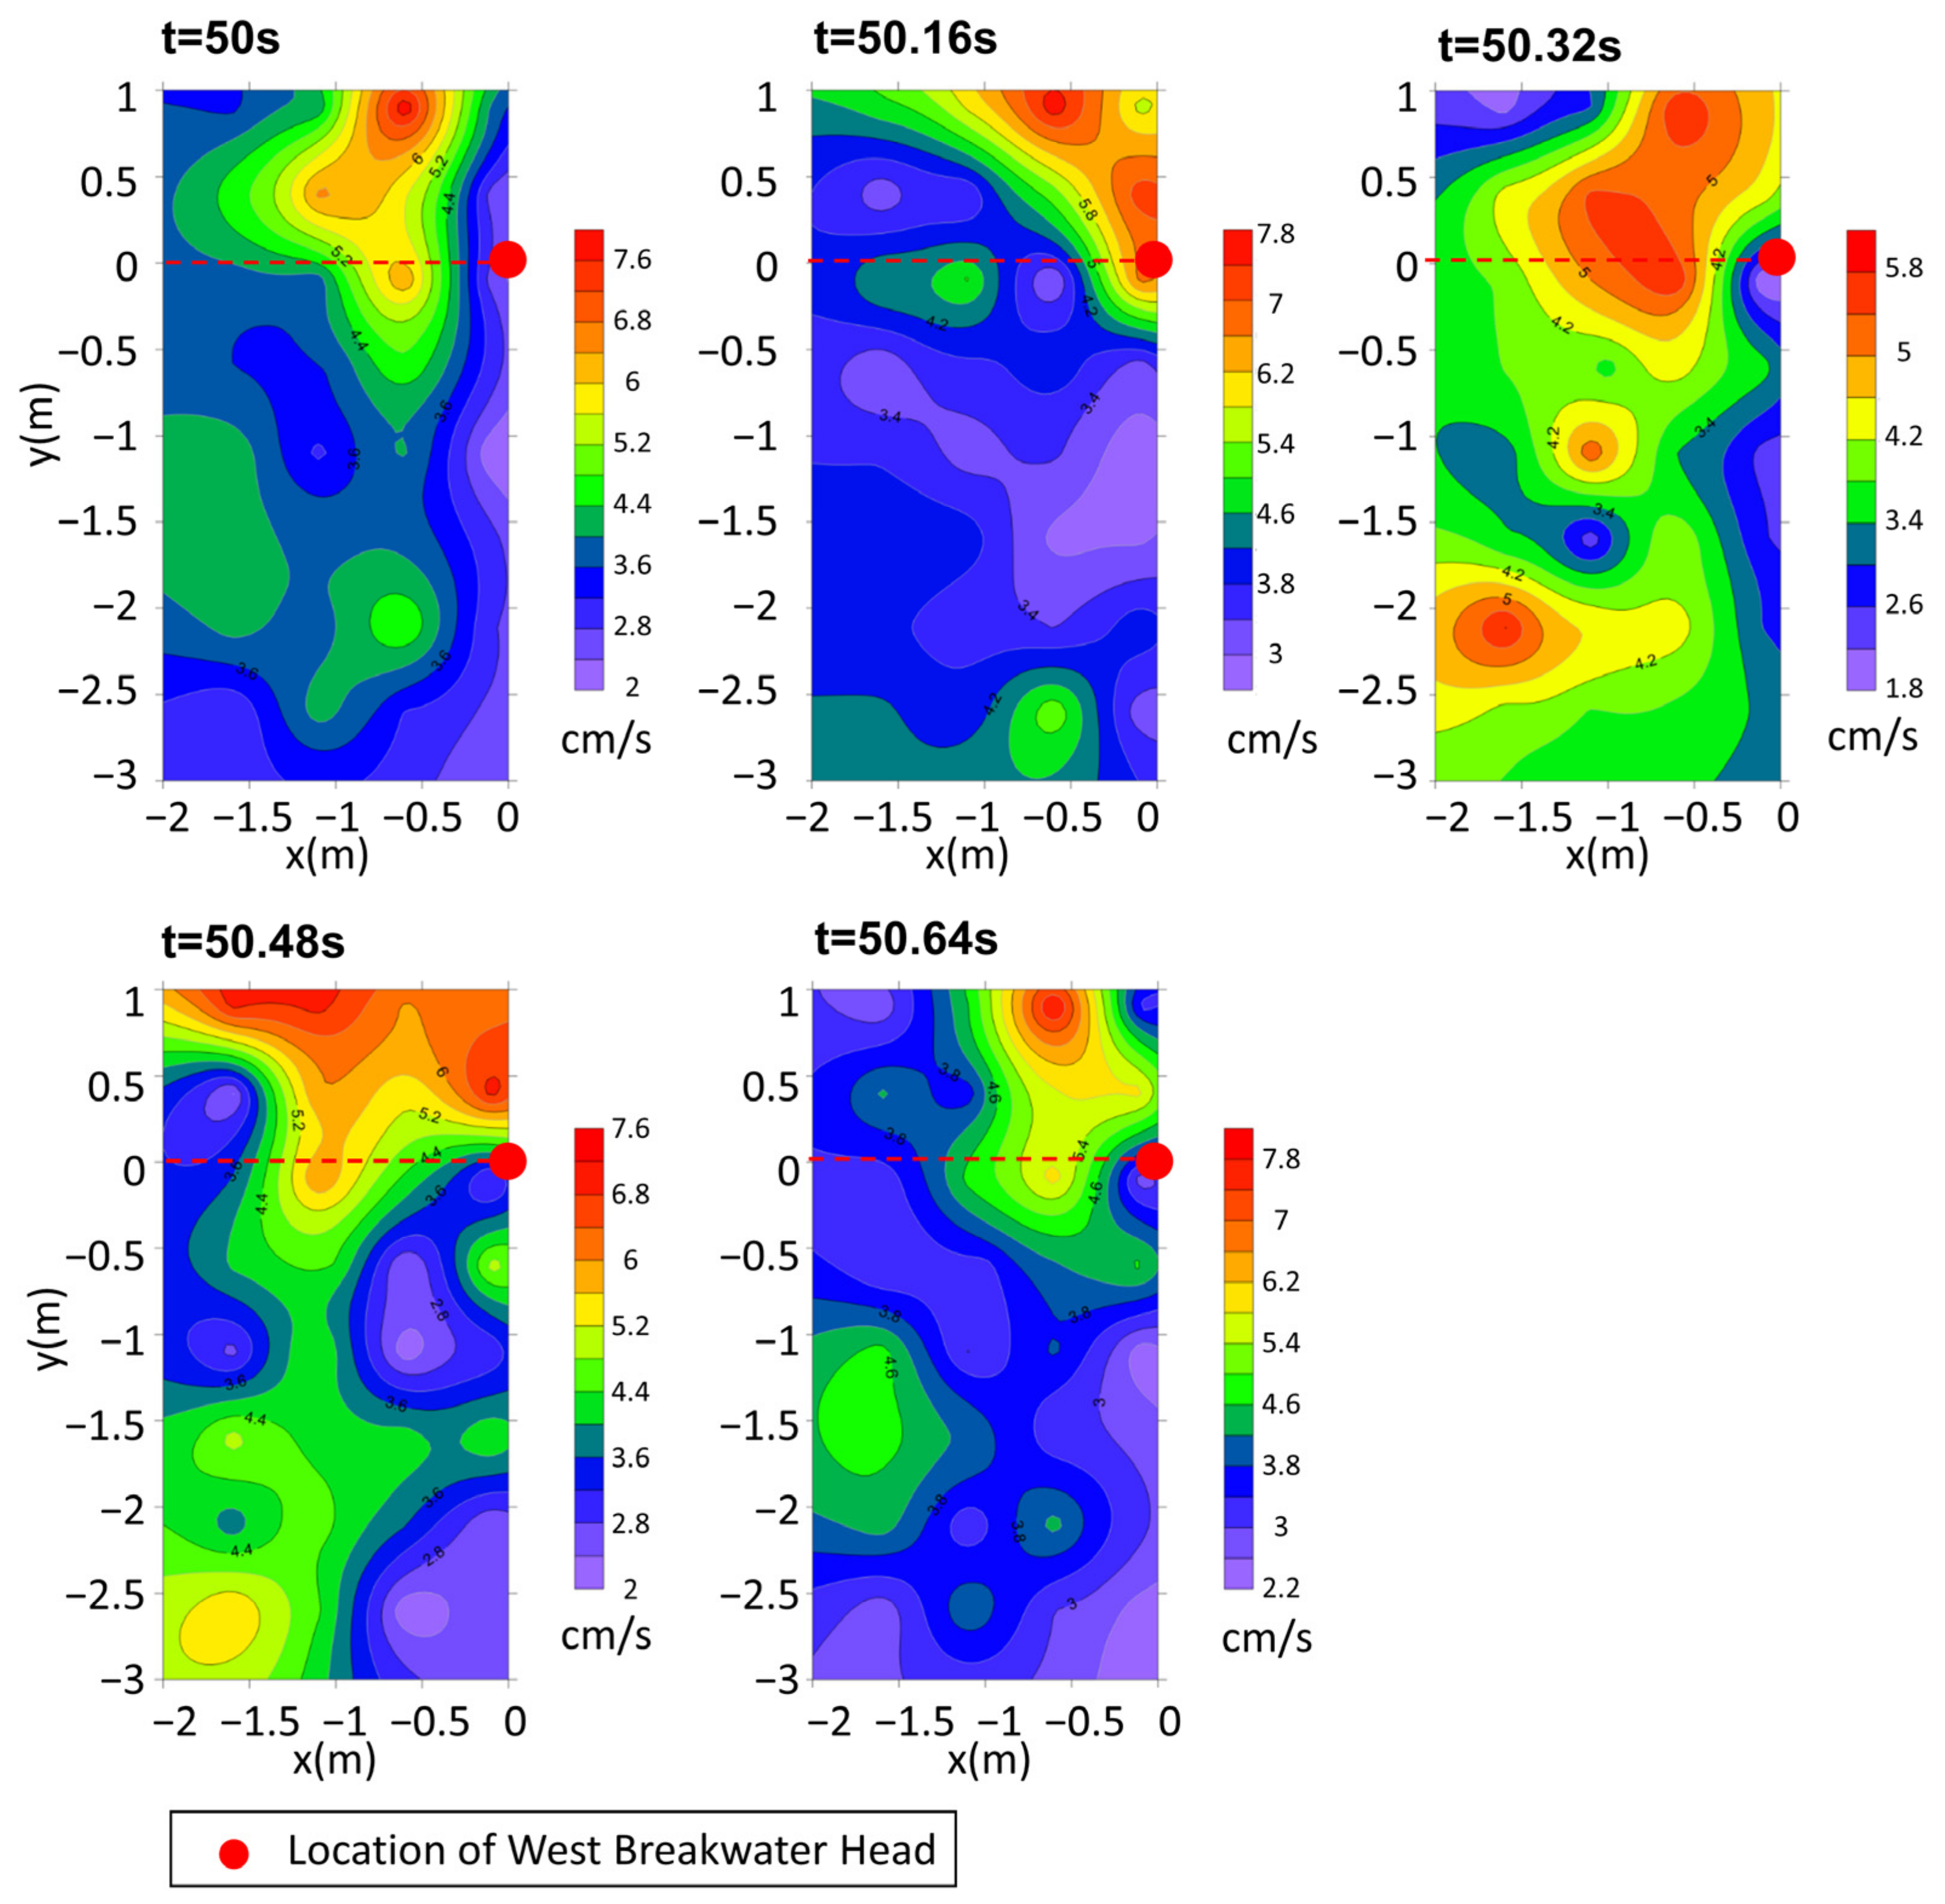
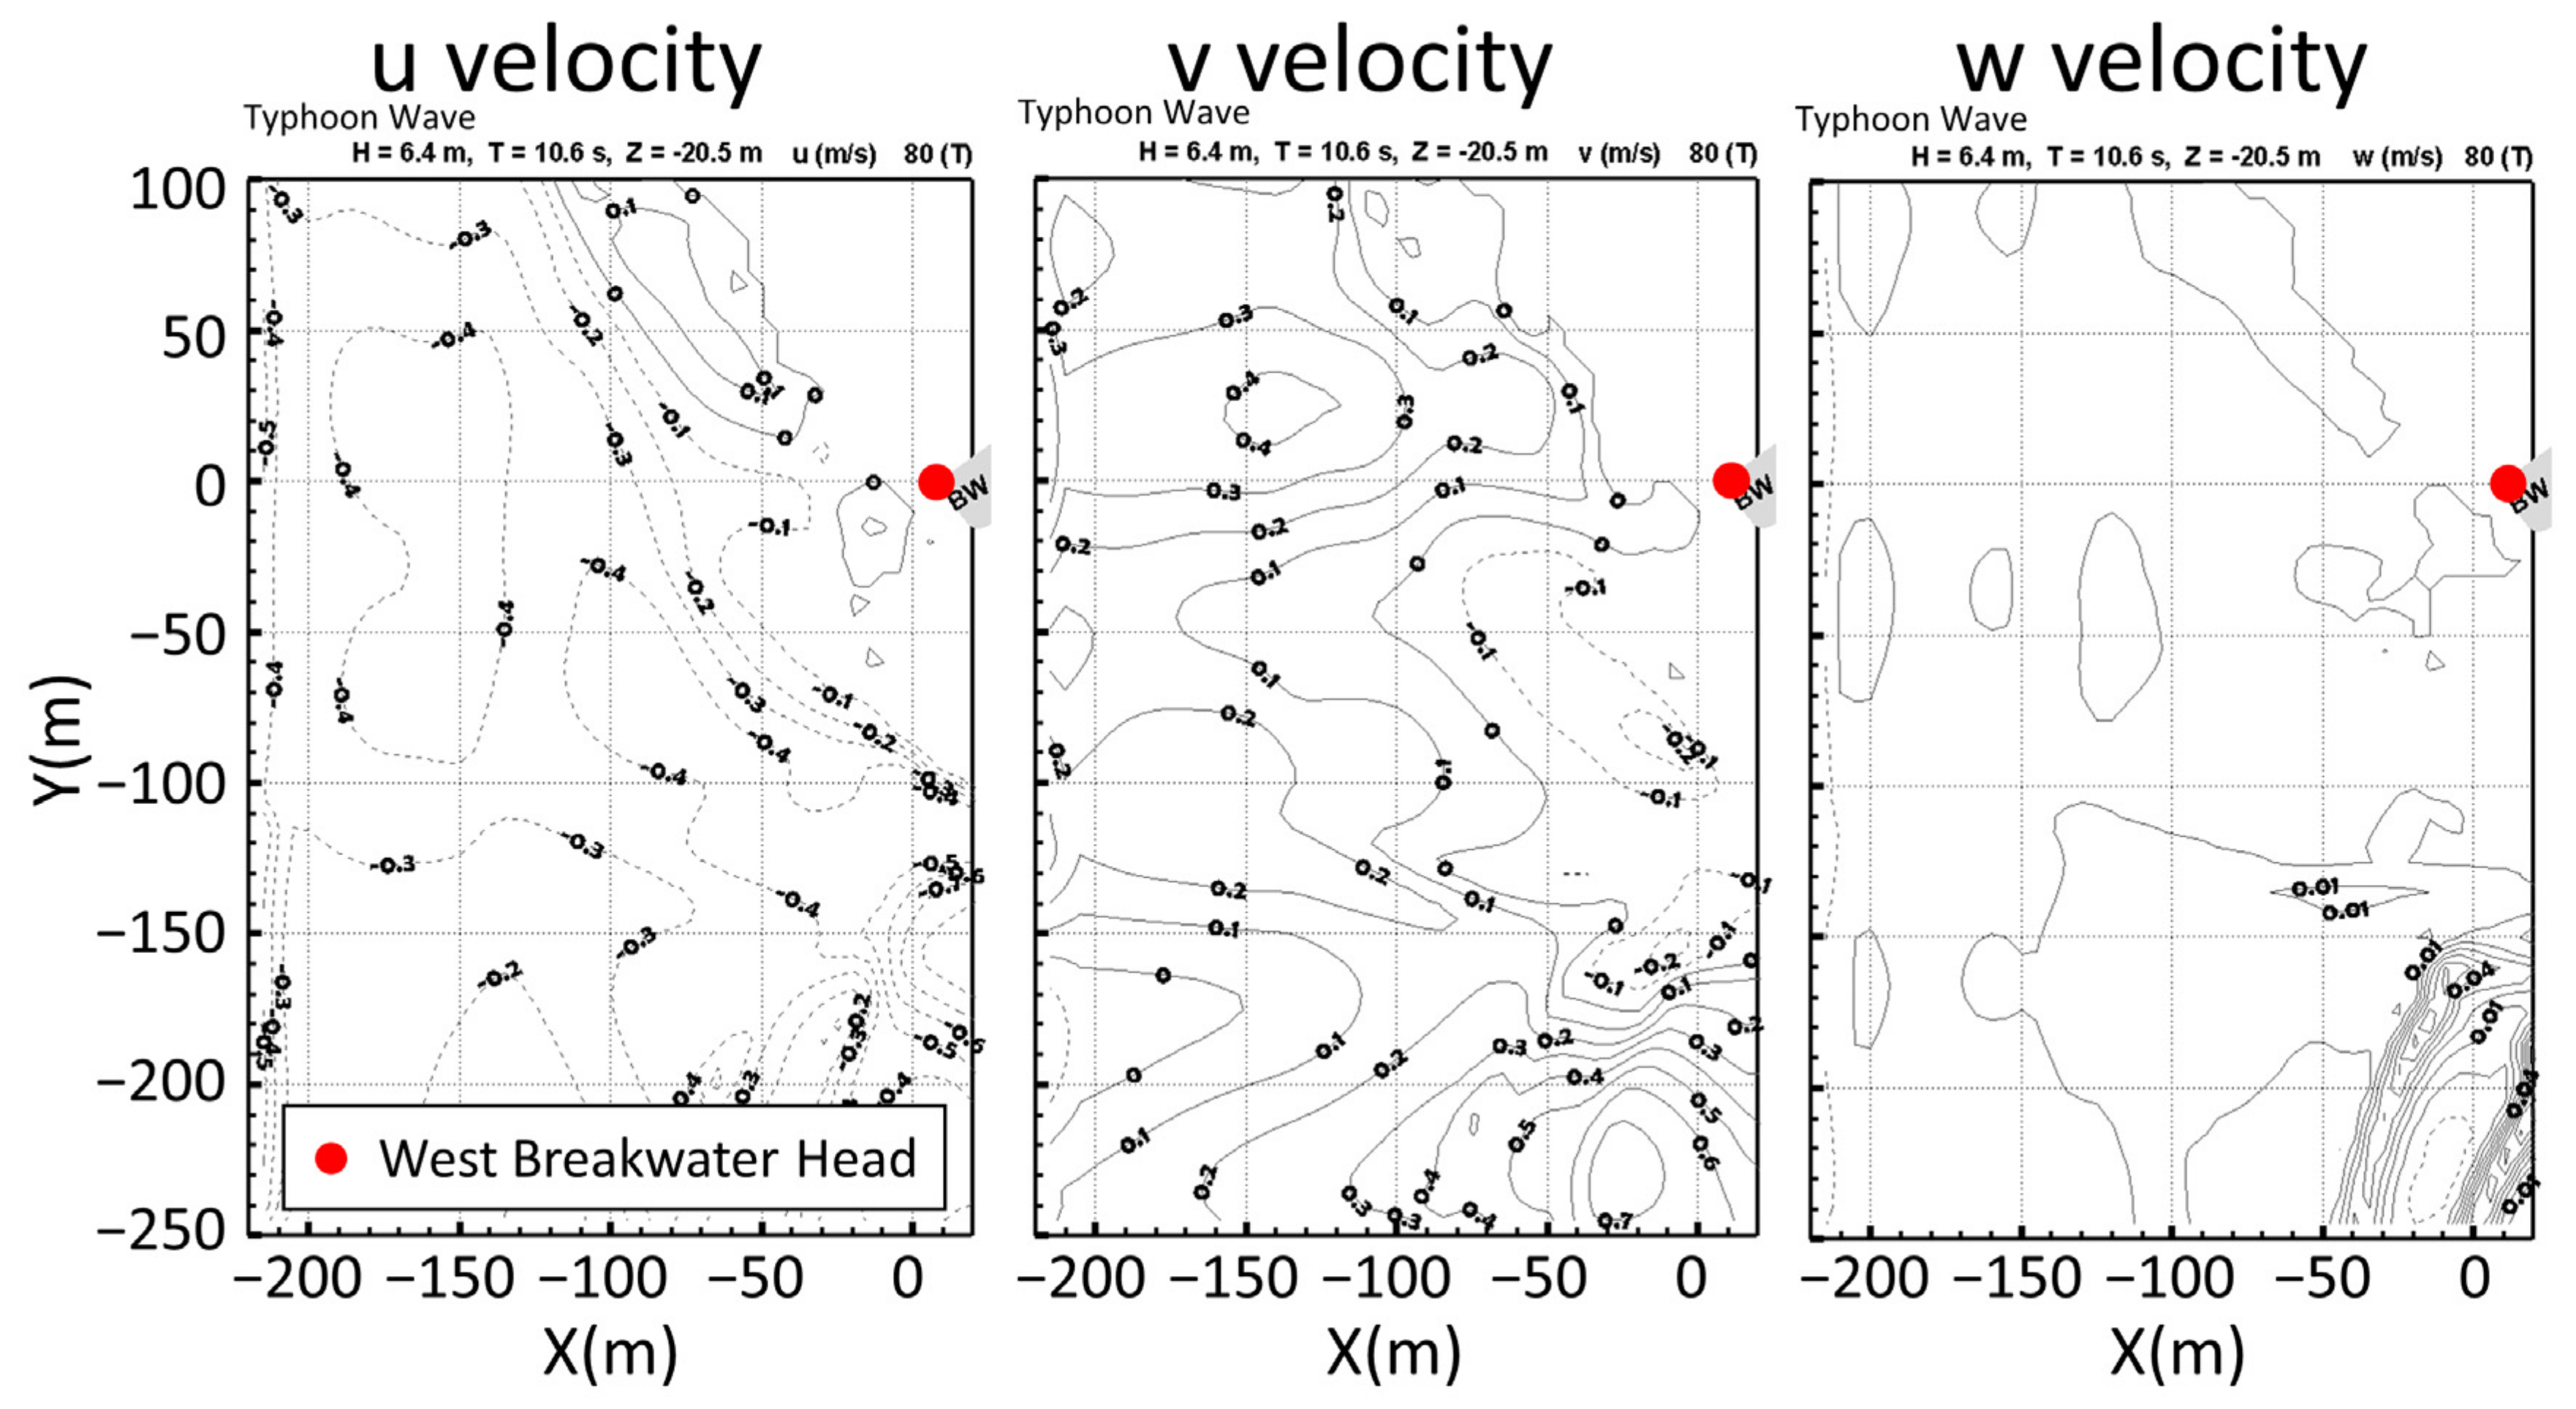
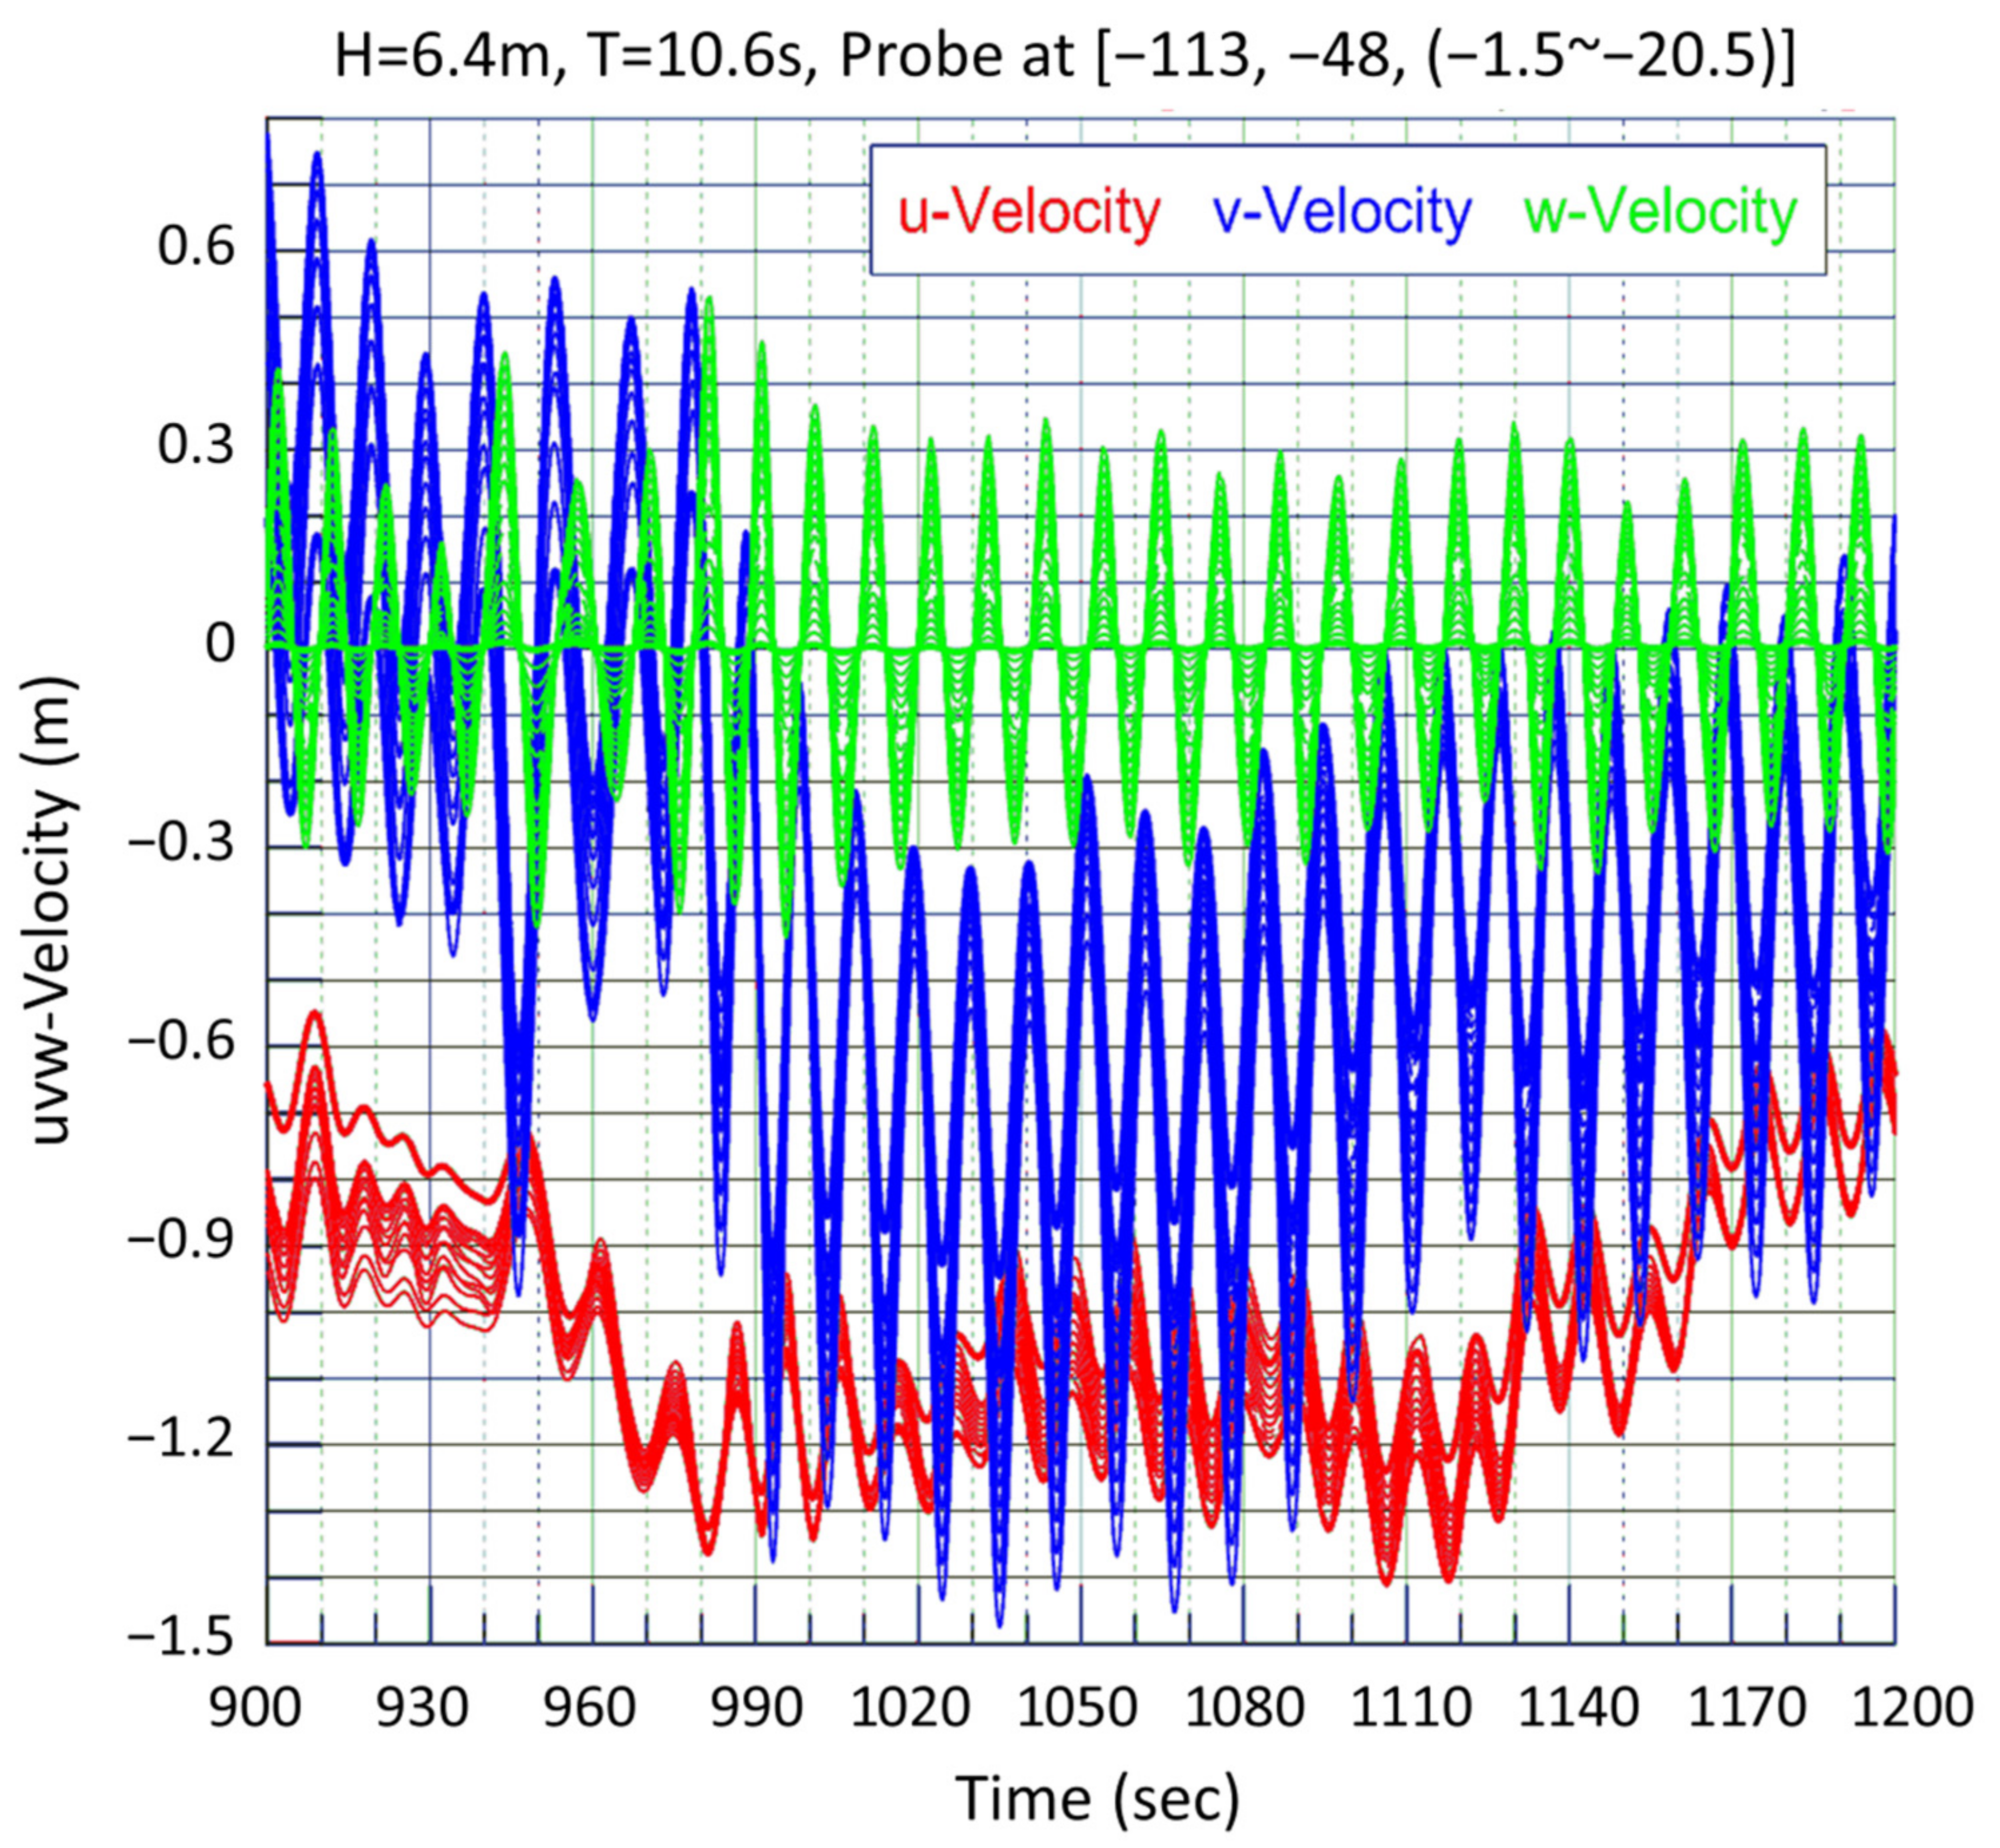
4.4.2. Wave-Induced Current Field
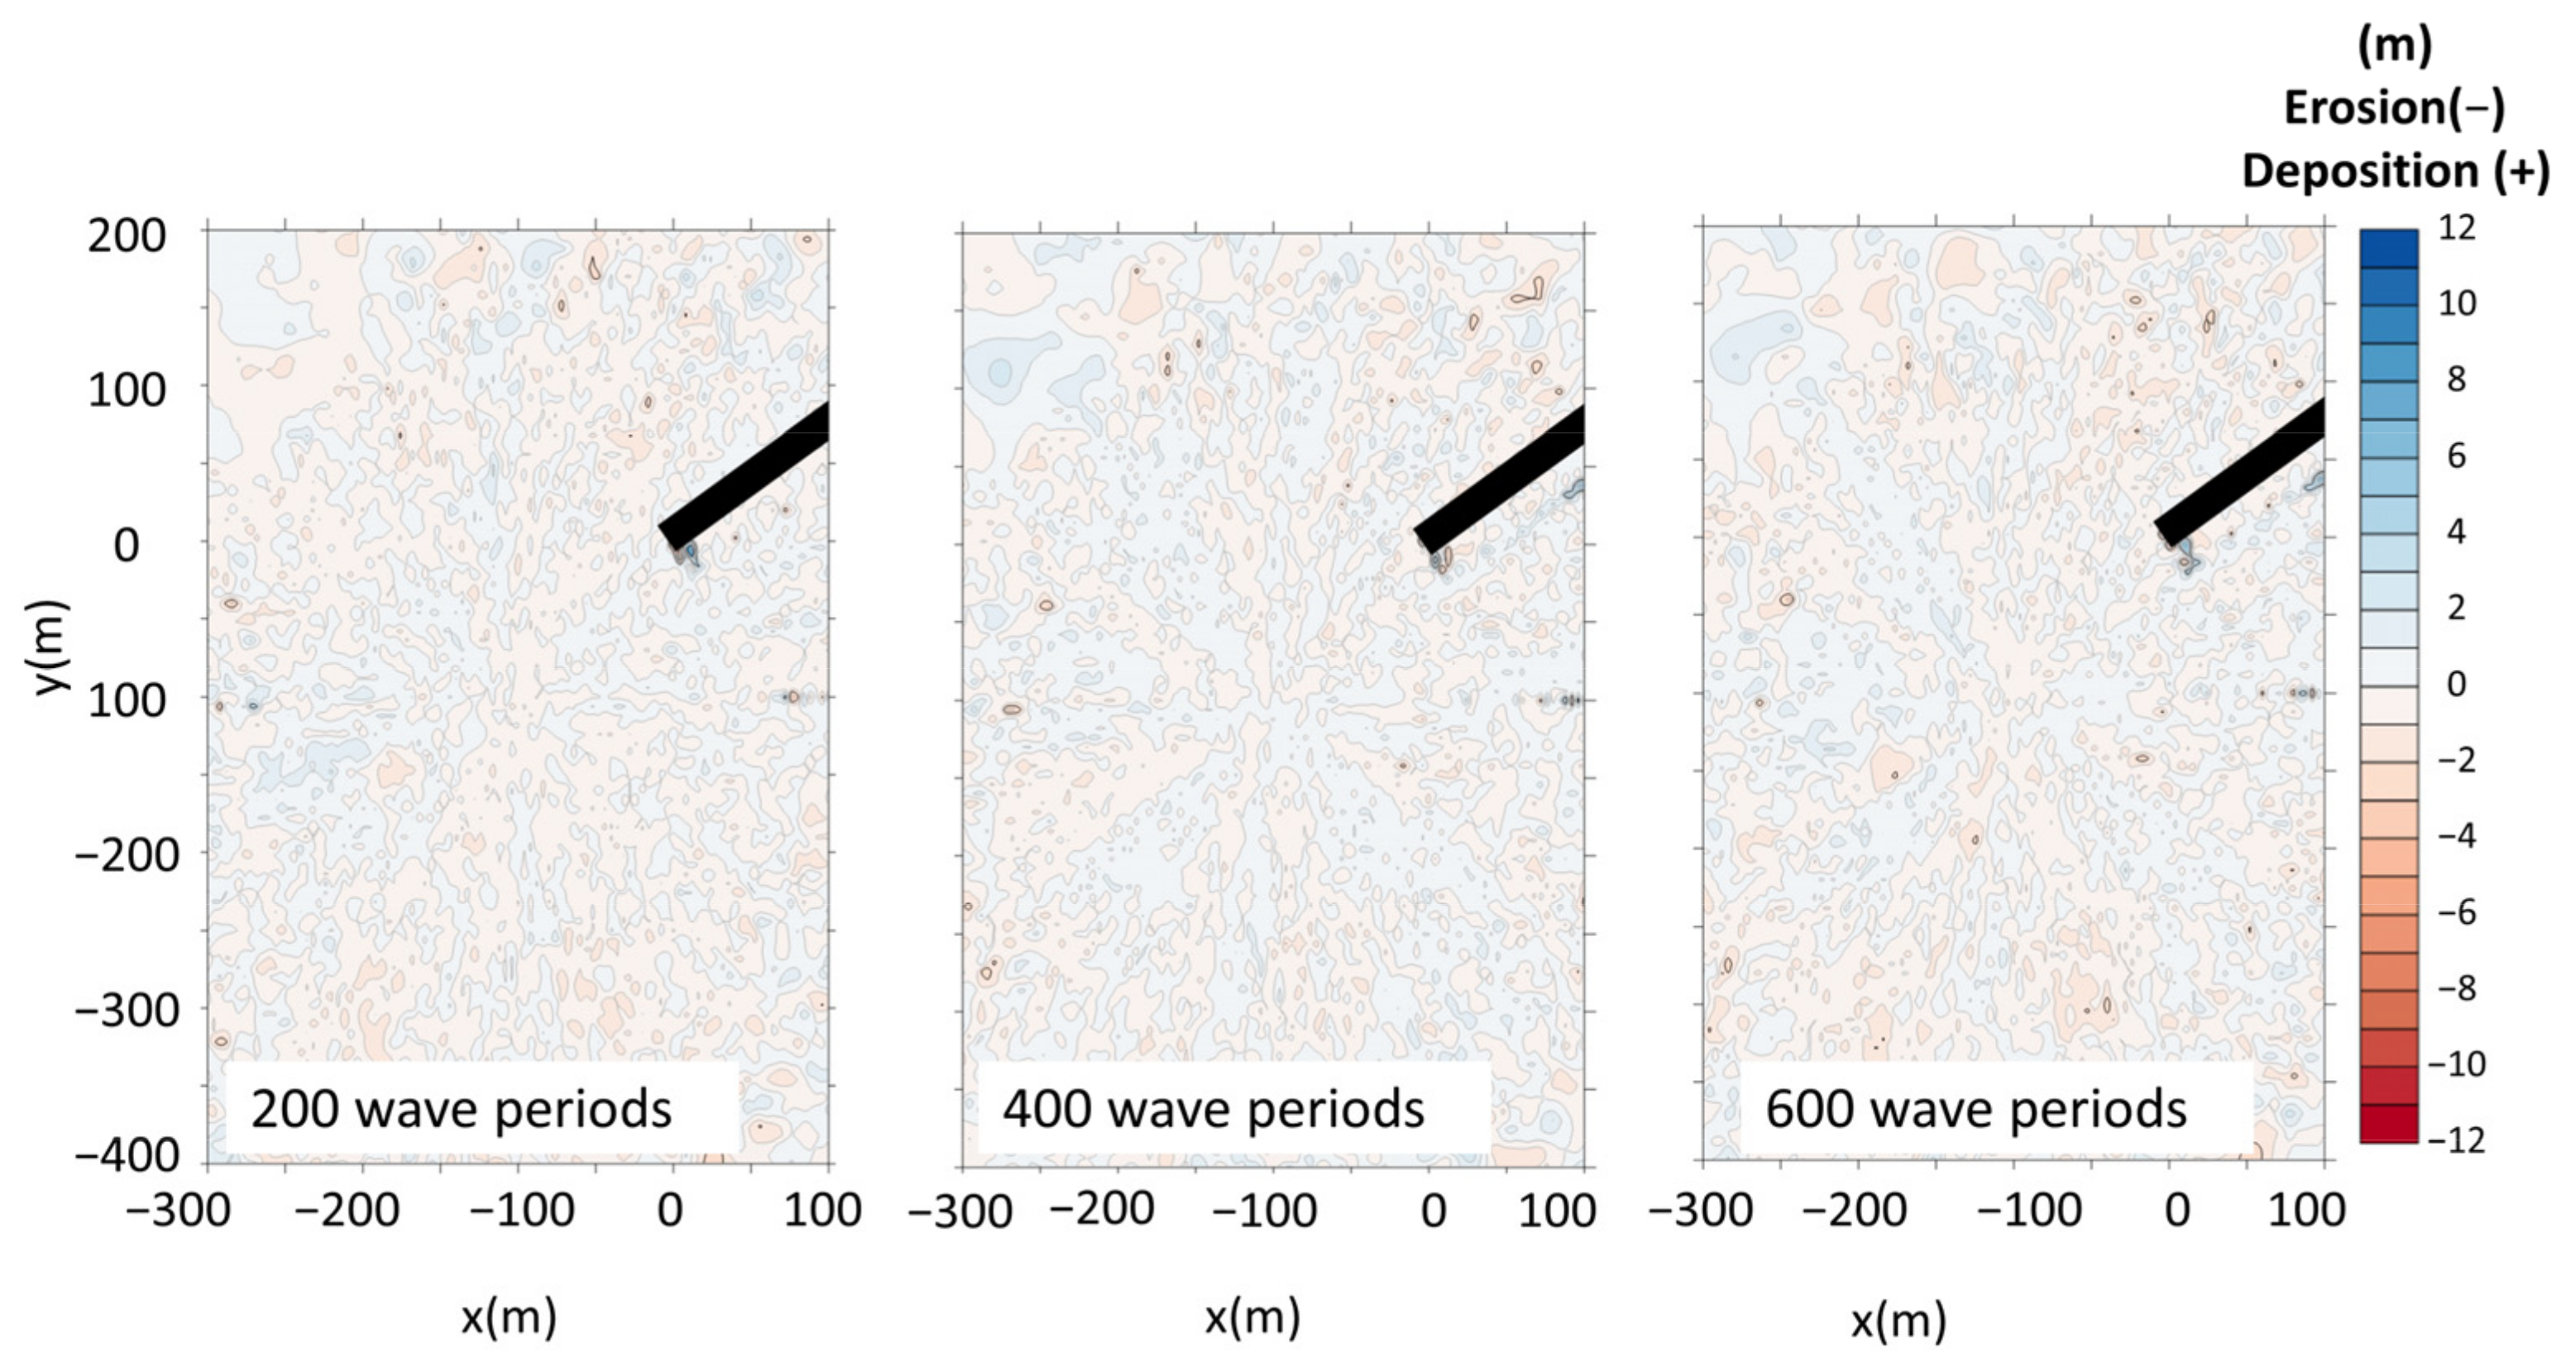
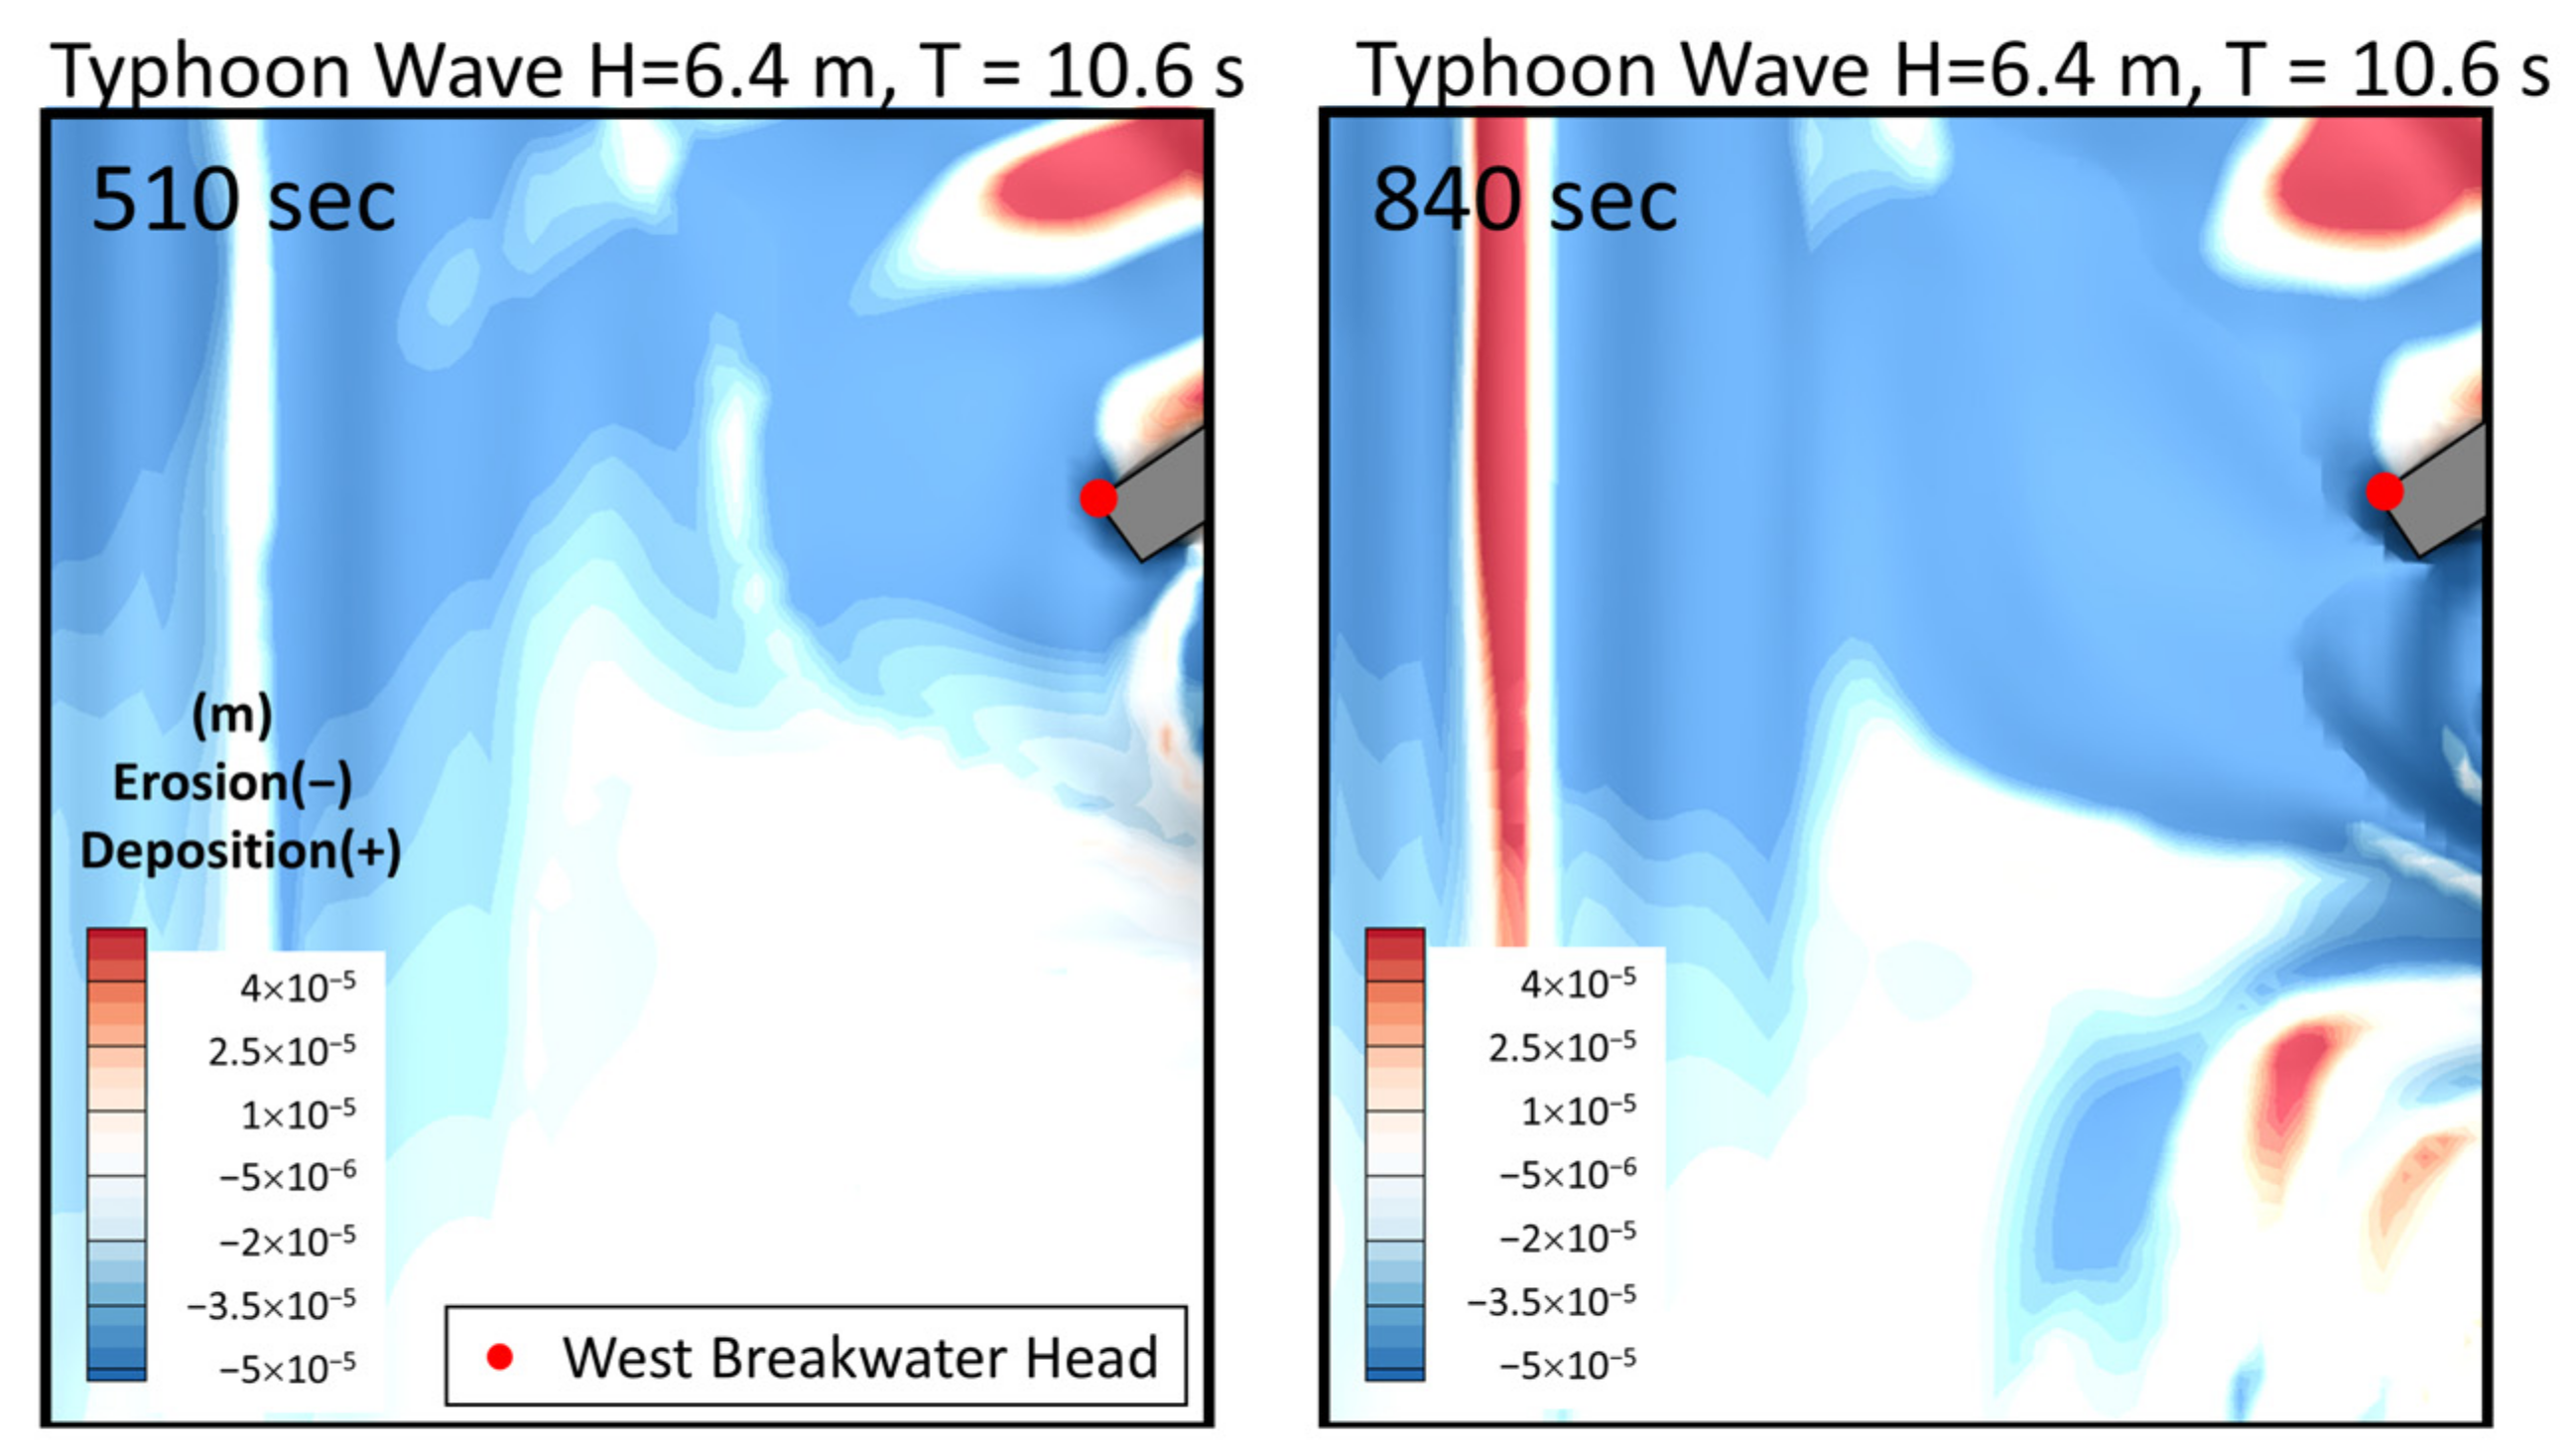
4.4.3. Topographic Change
4.5. Numerical Simulation of Current Field
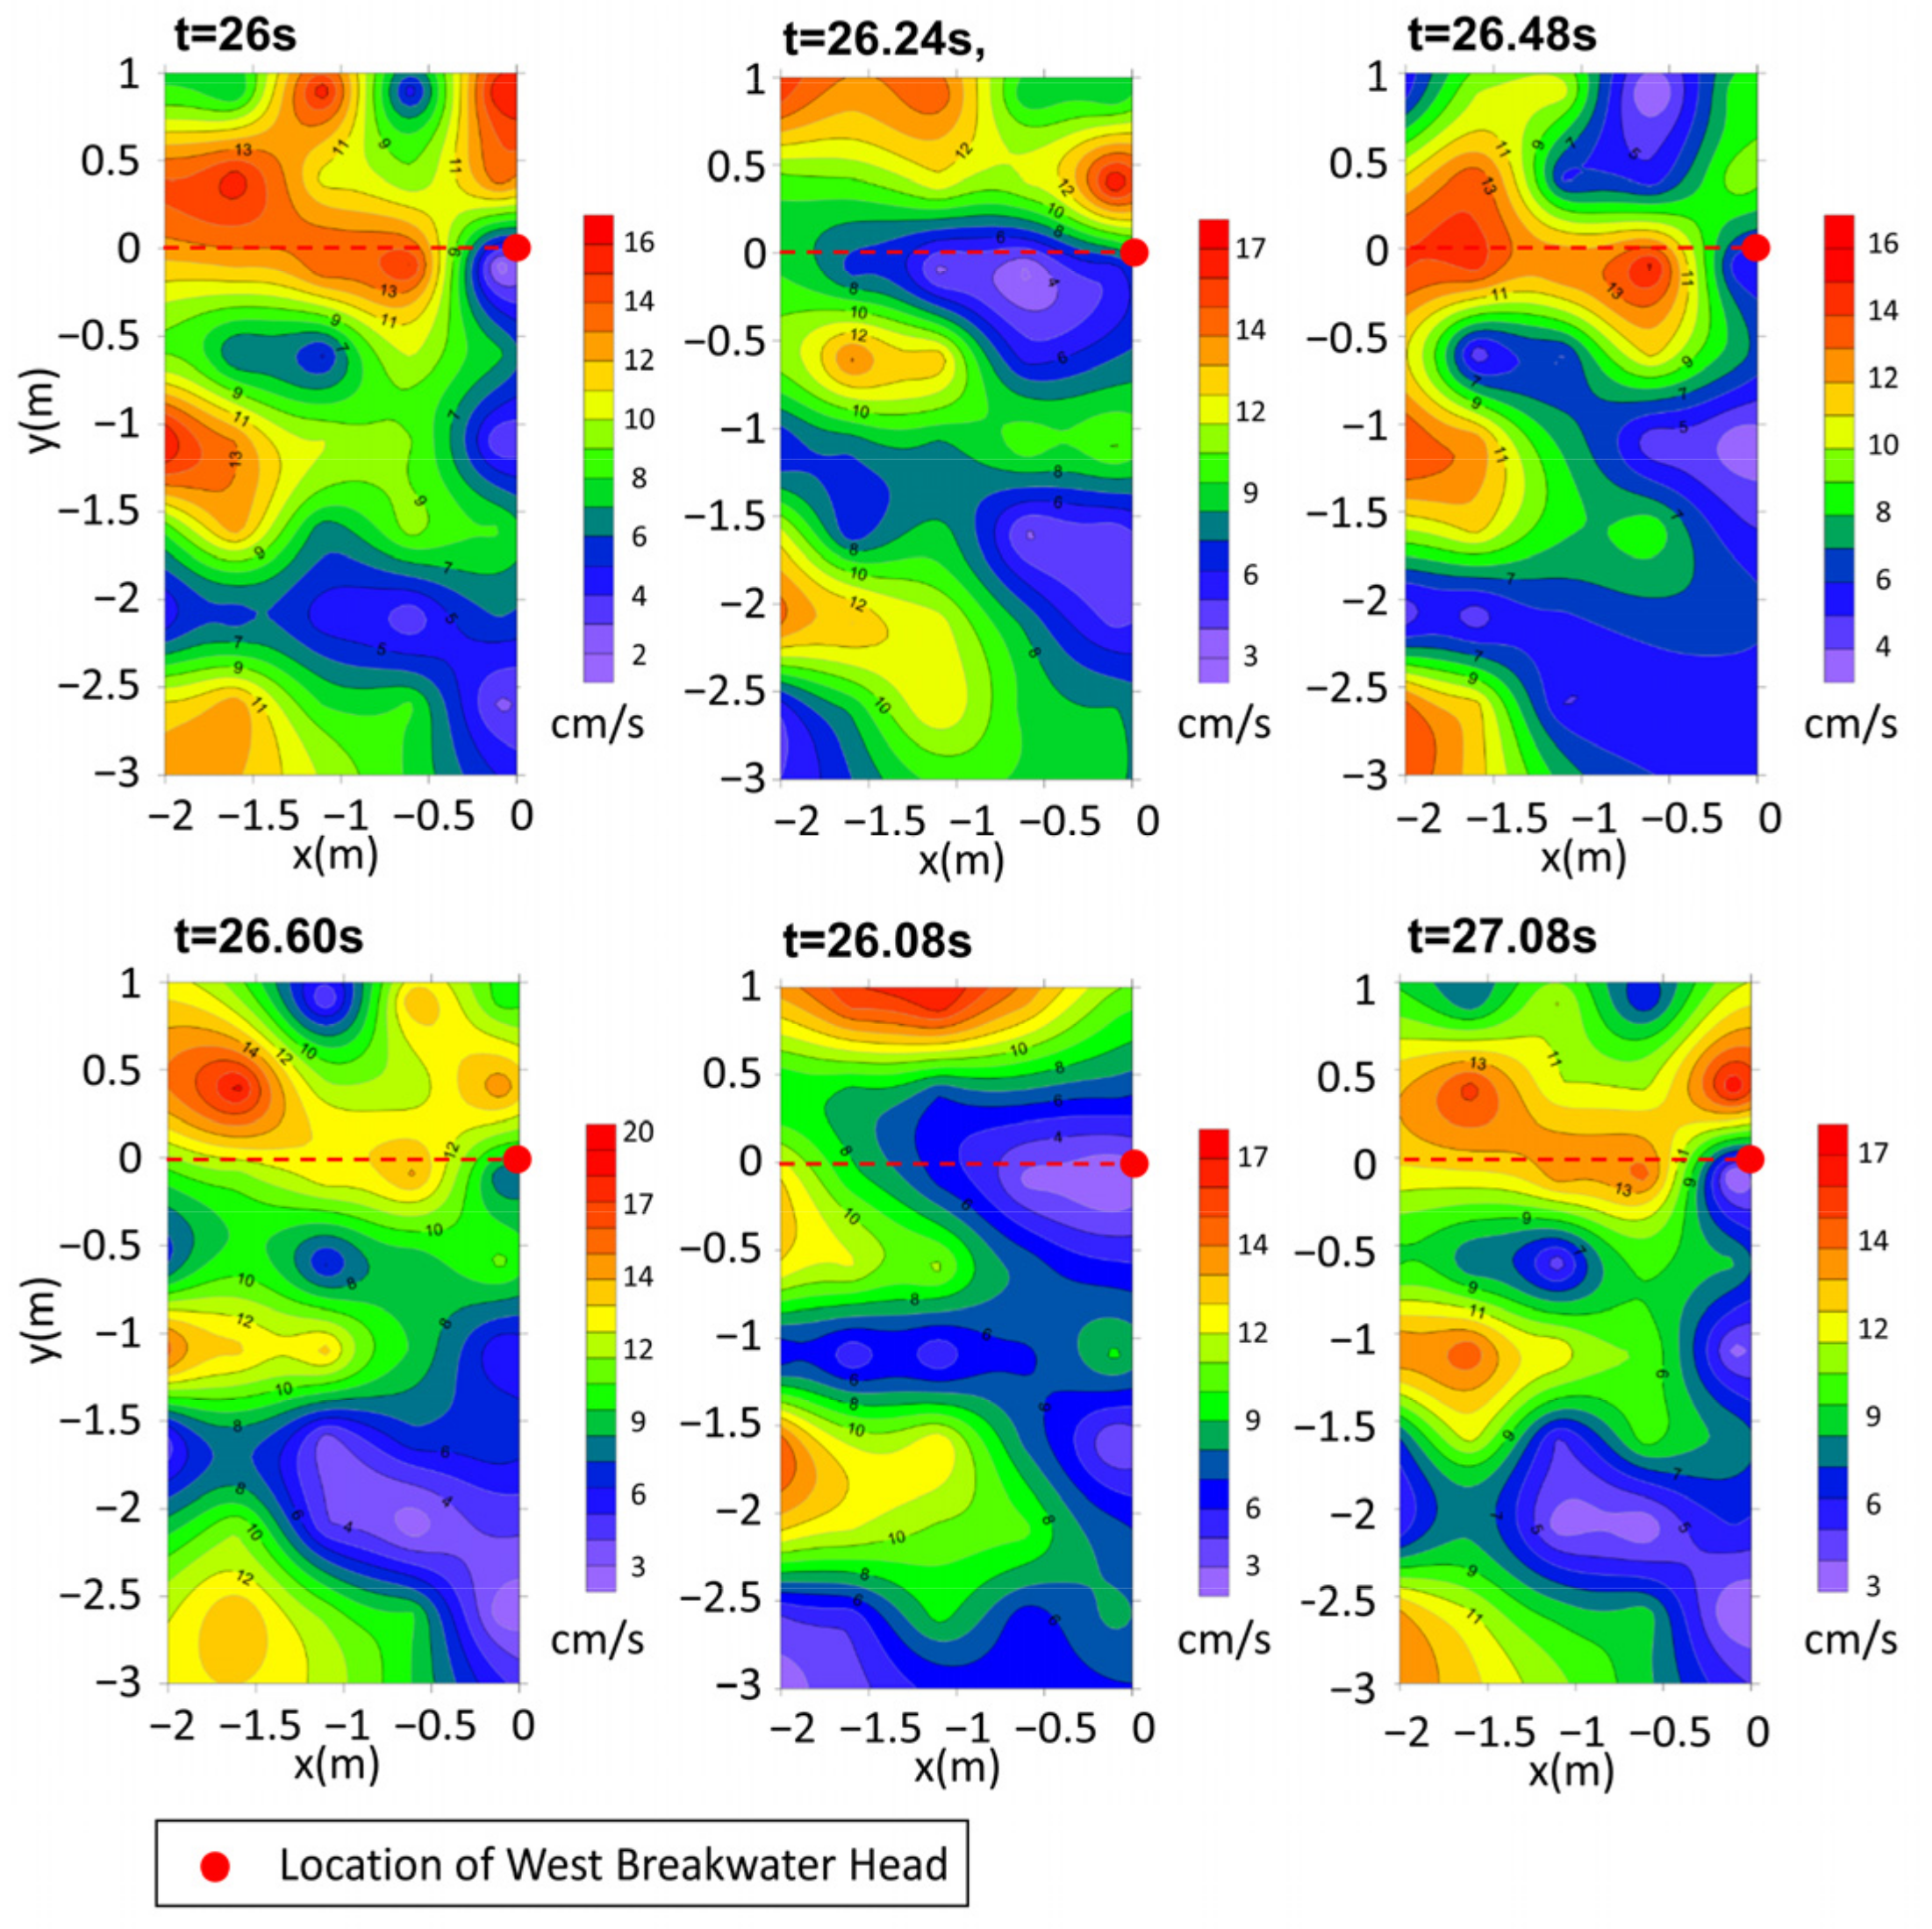
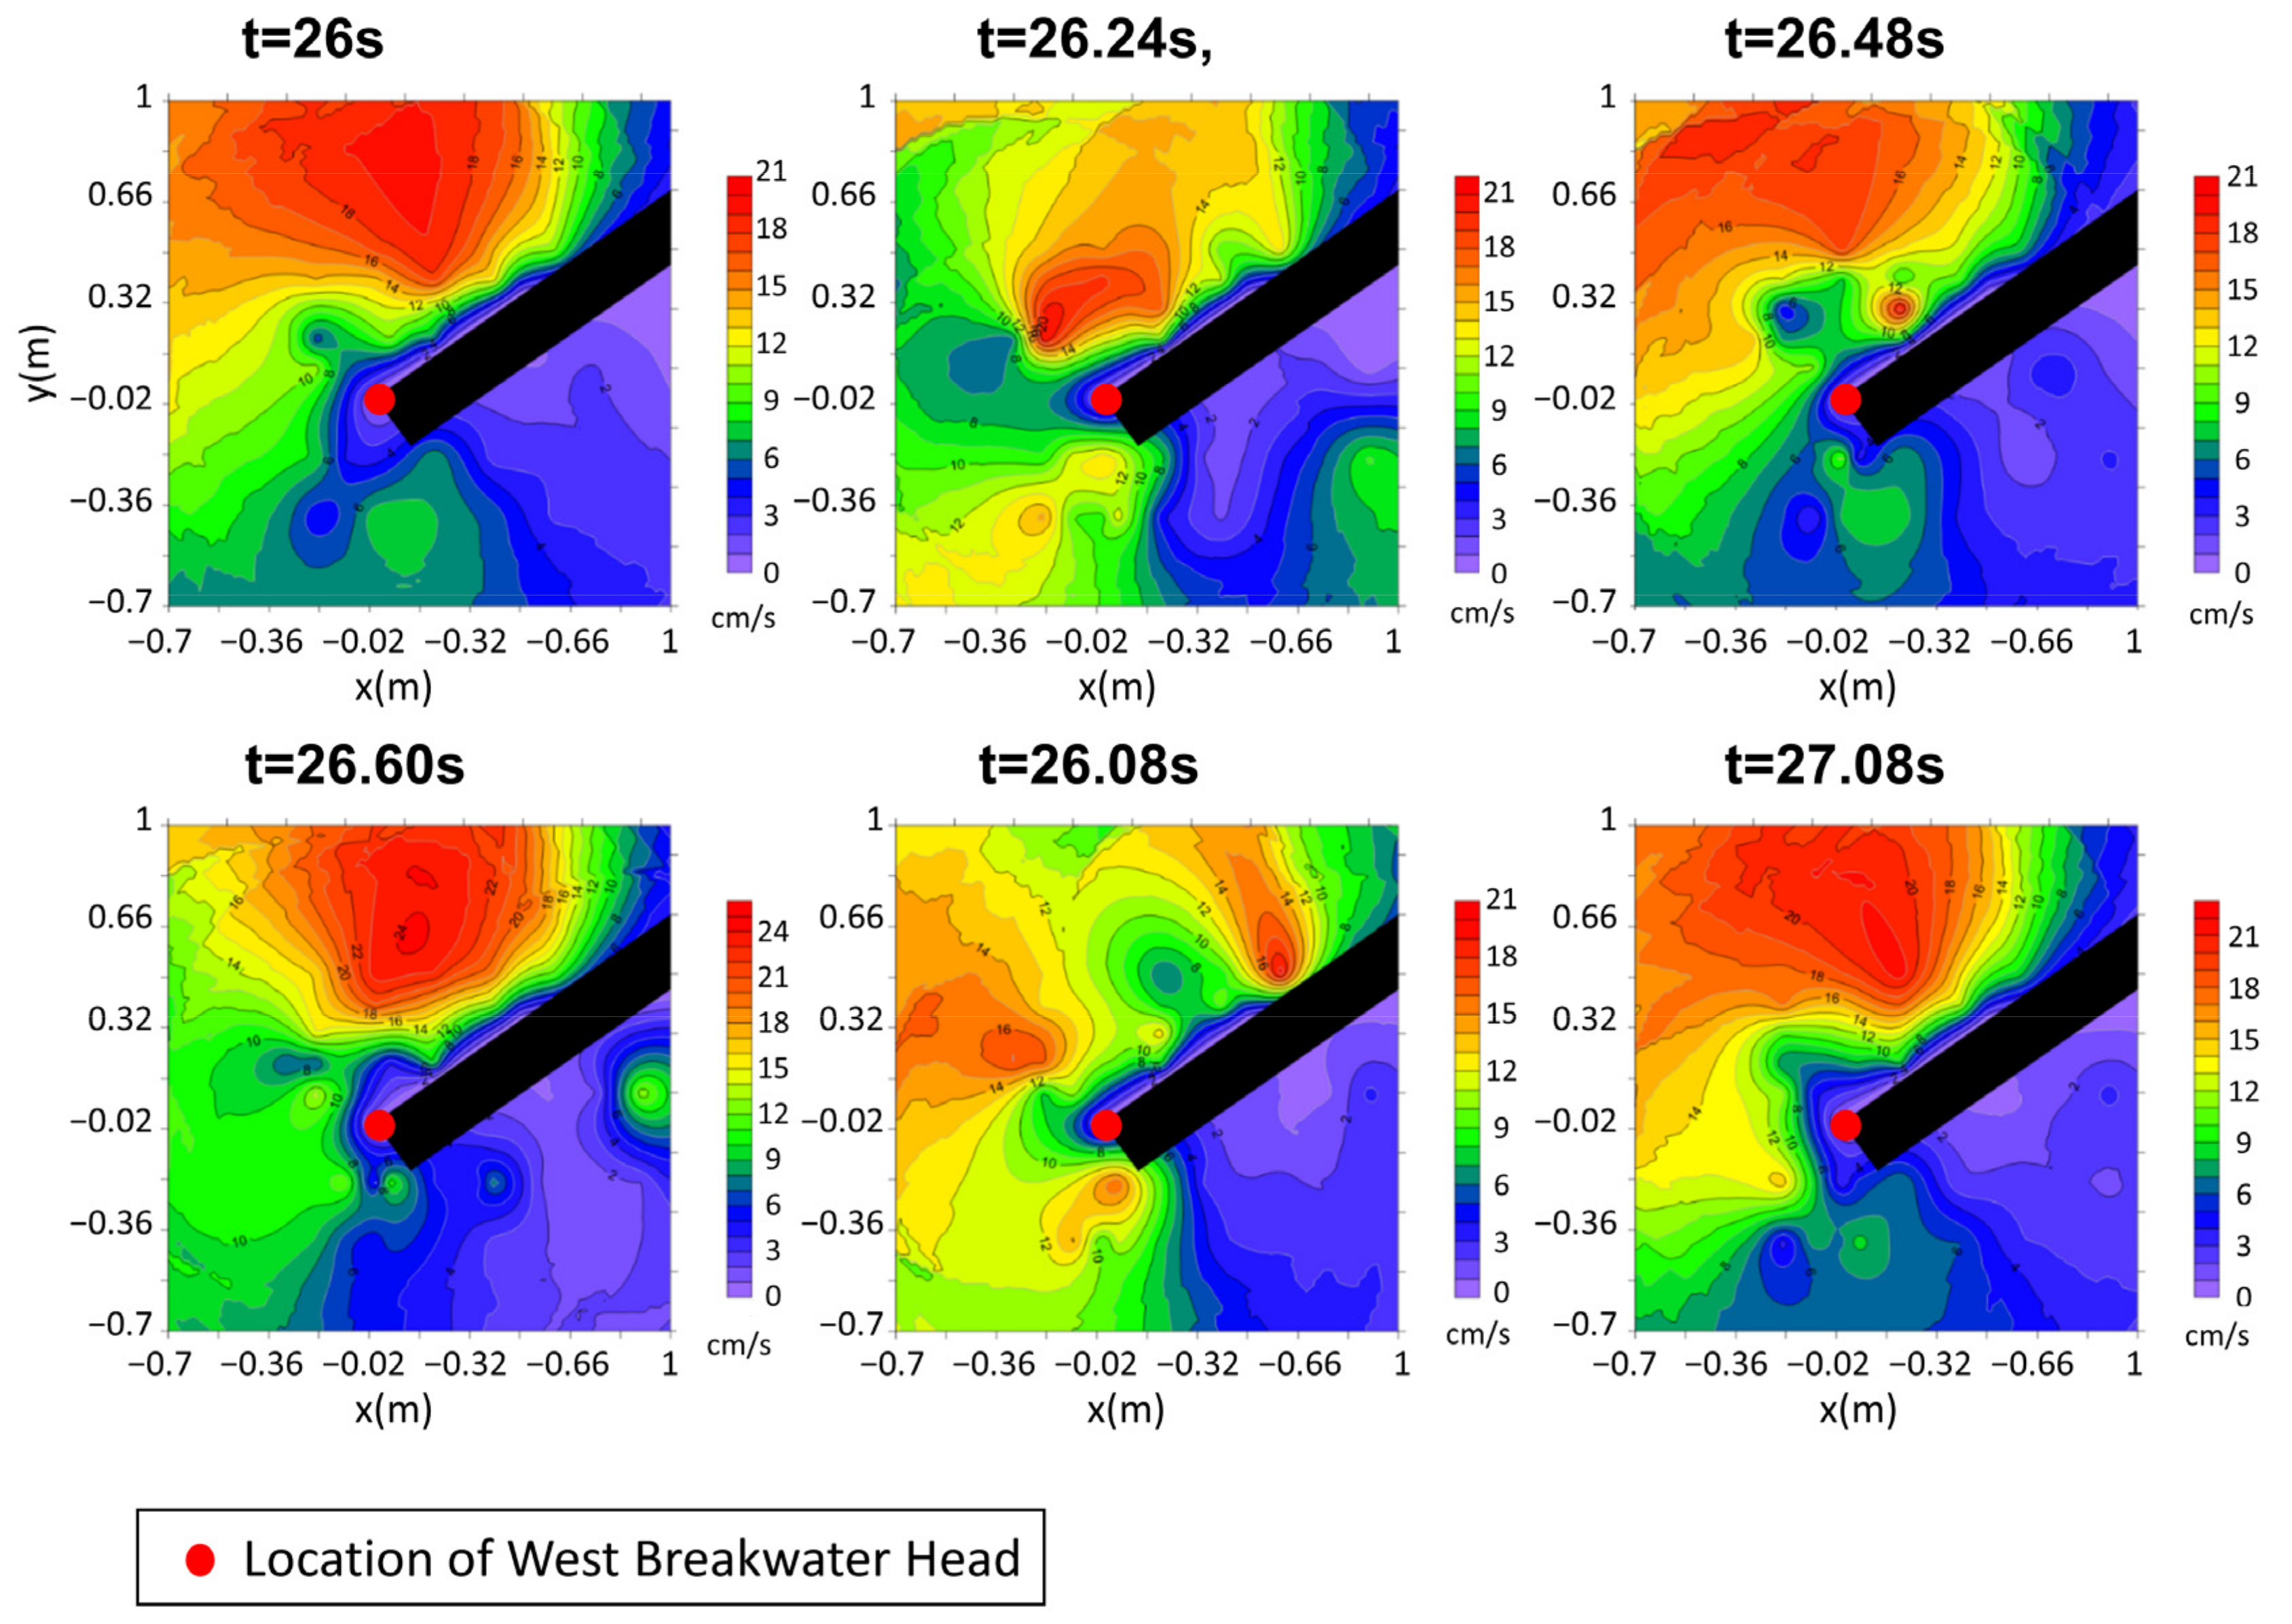
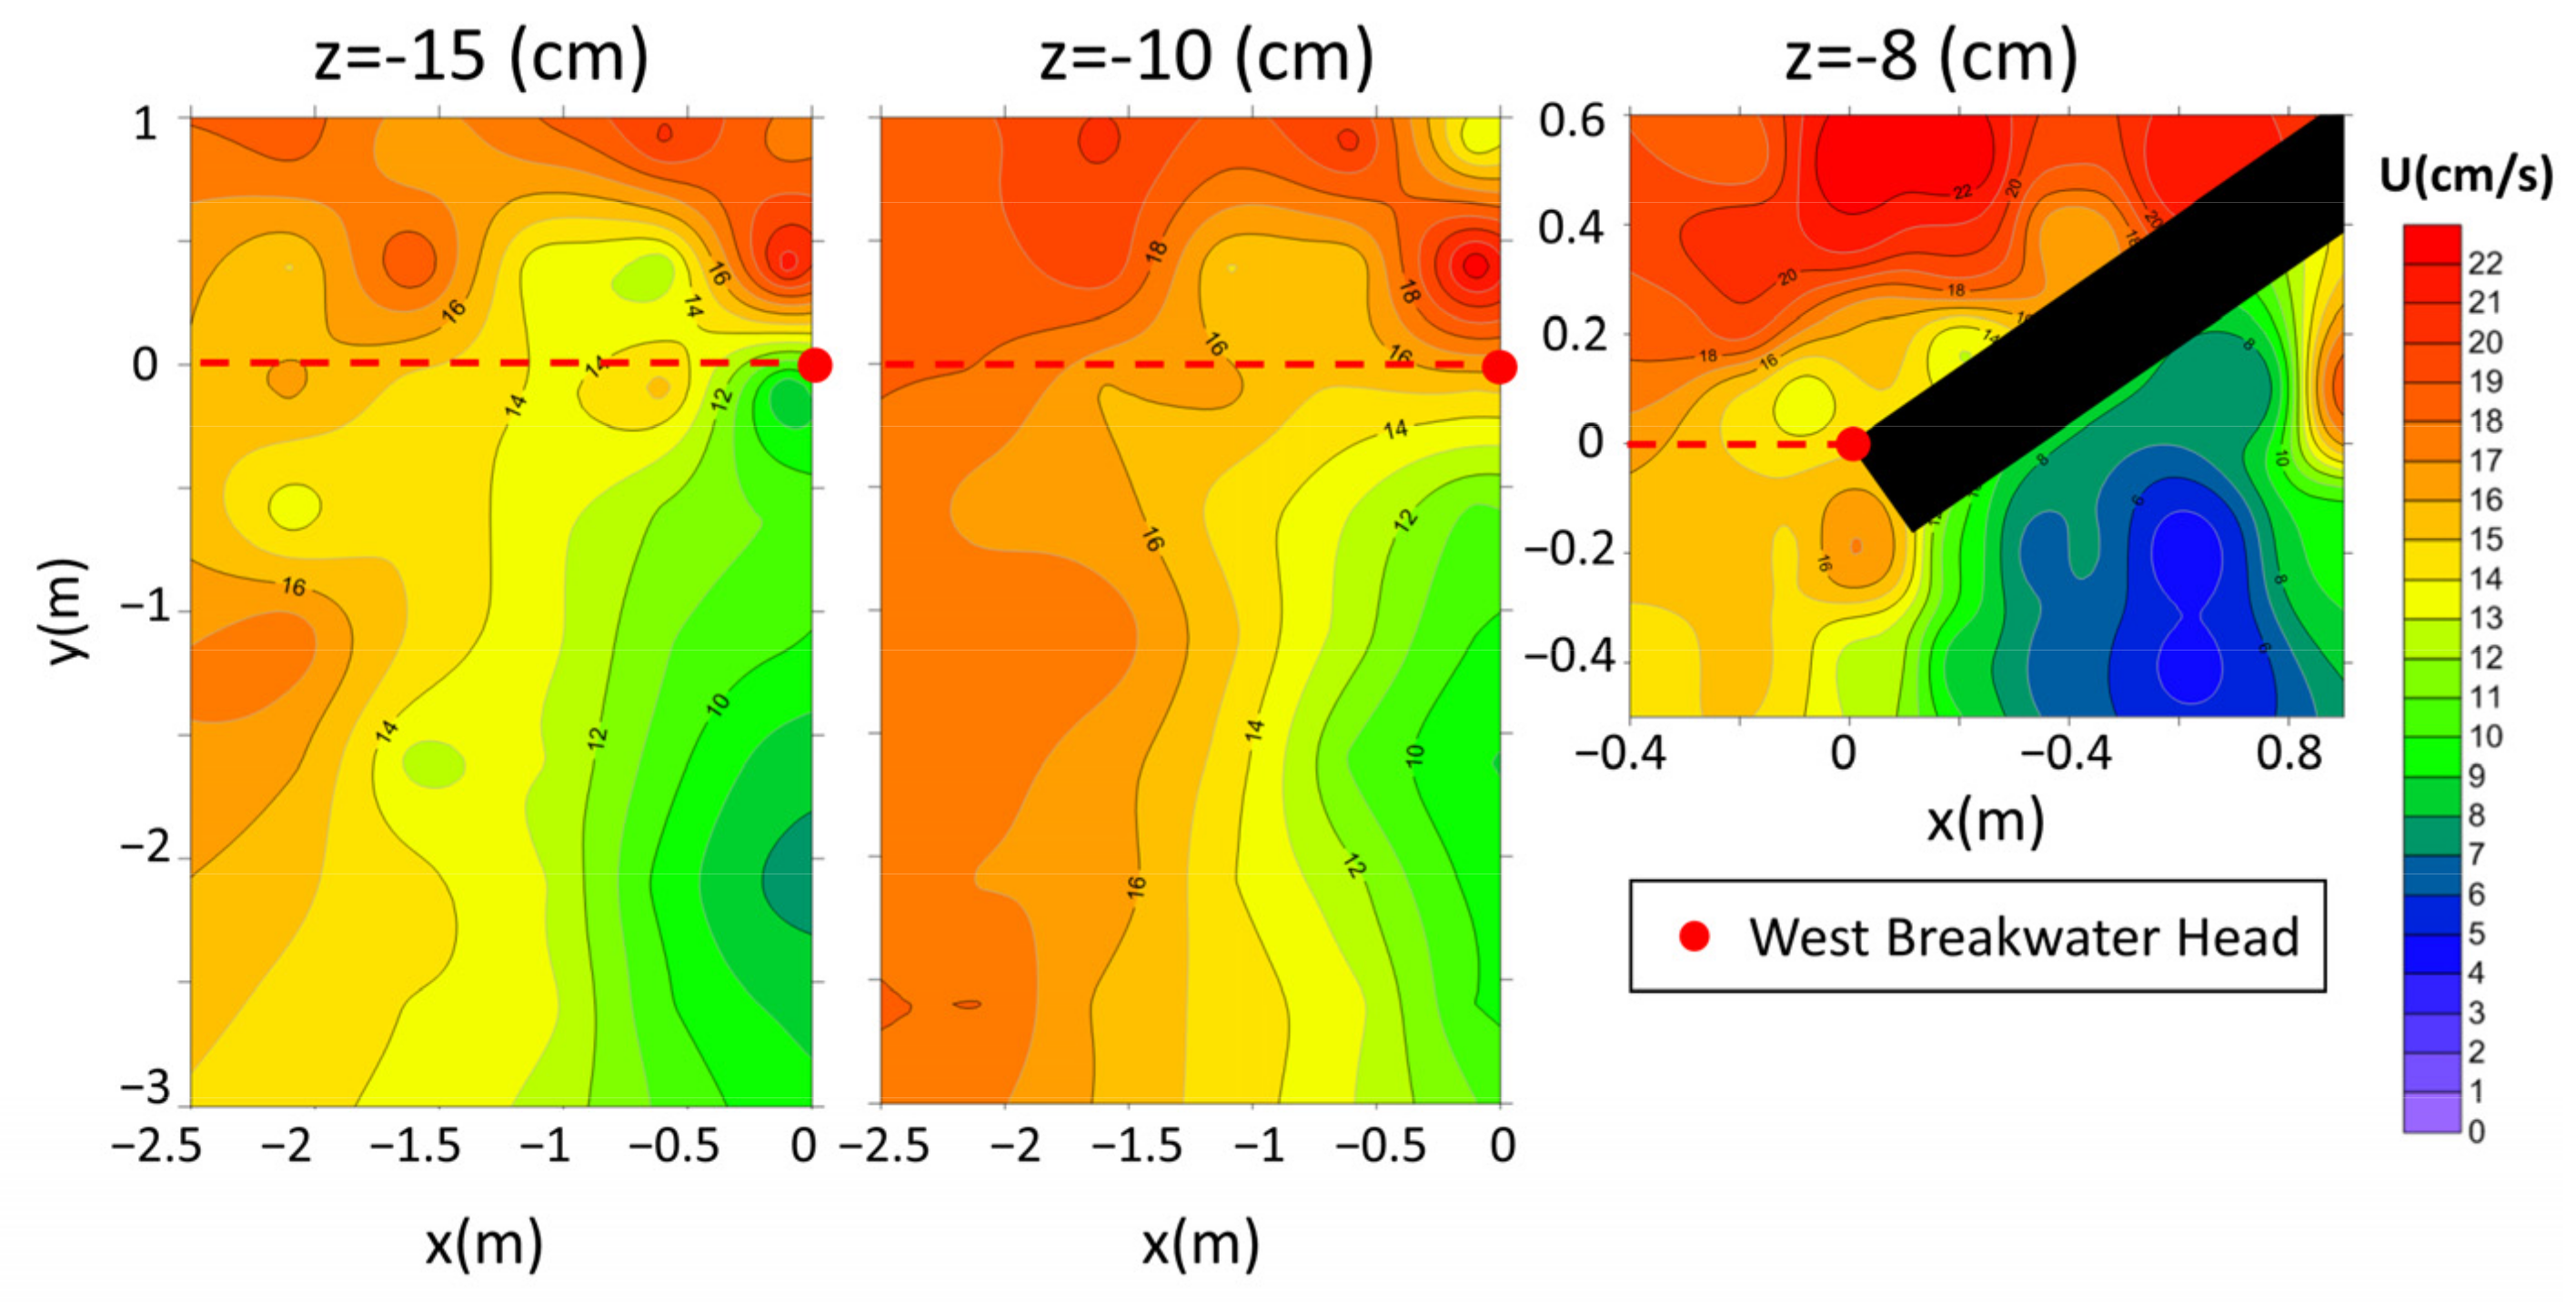
4.5.1. Current Field
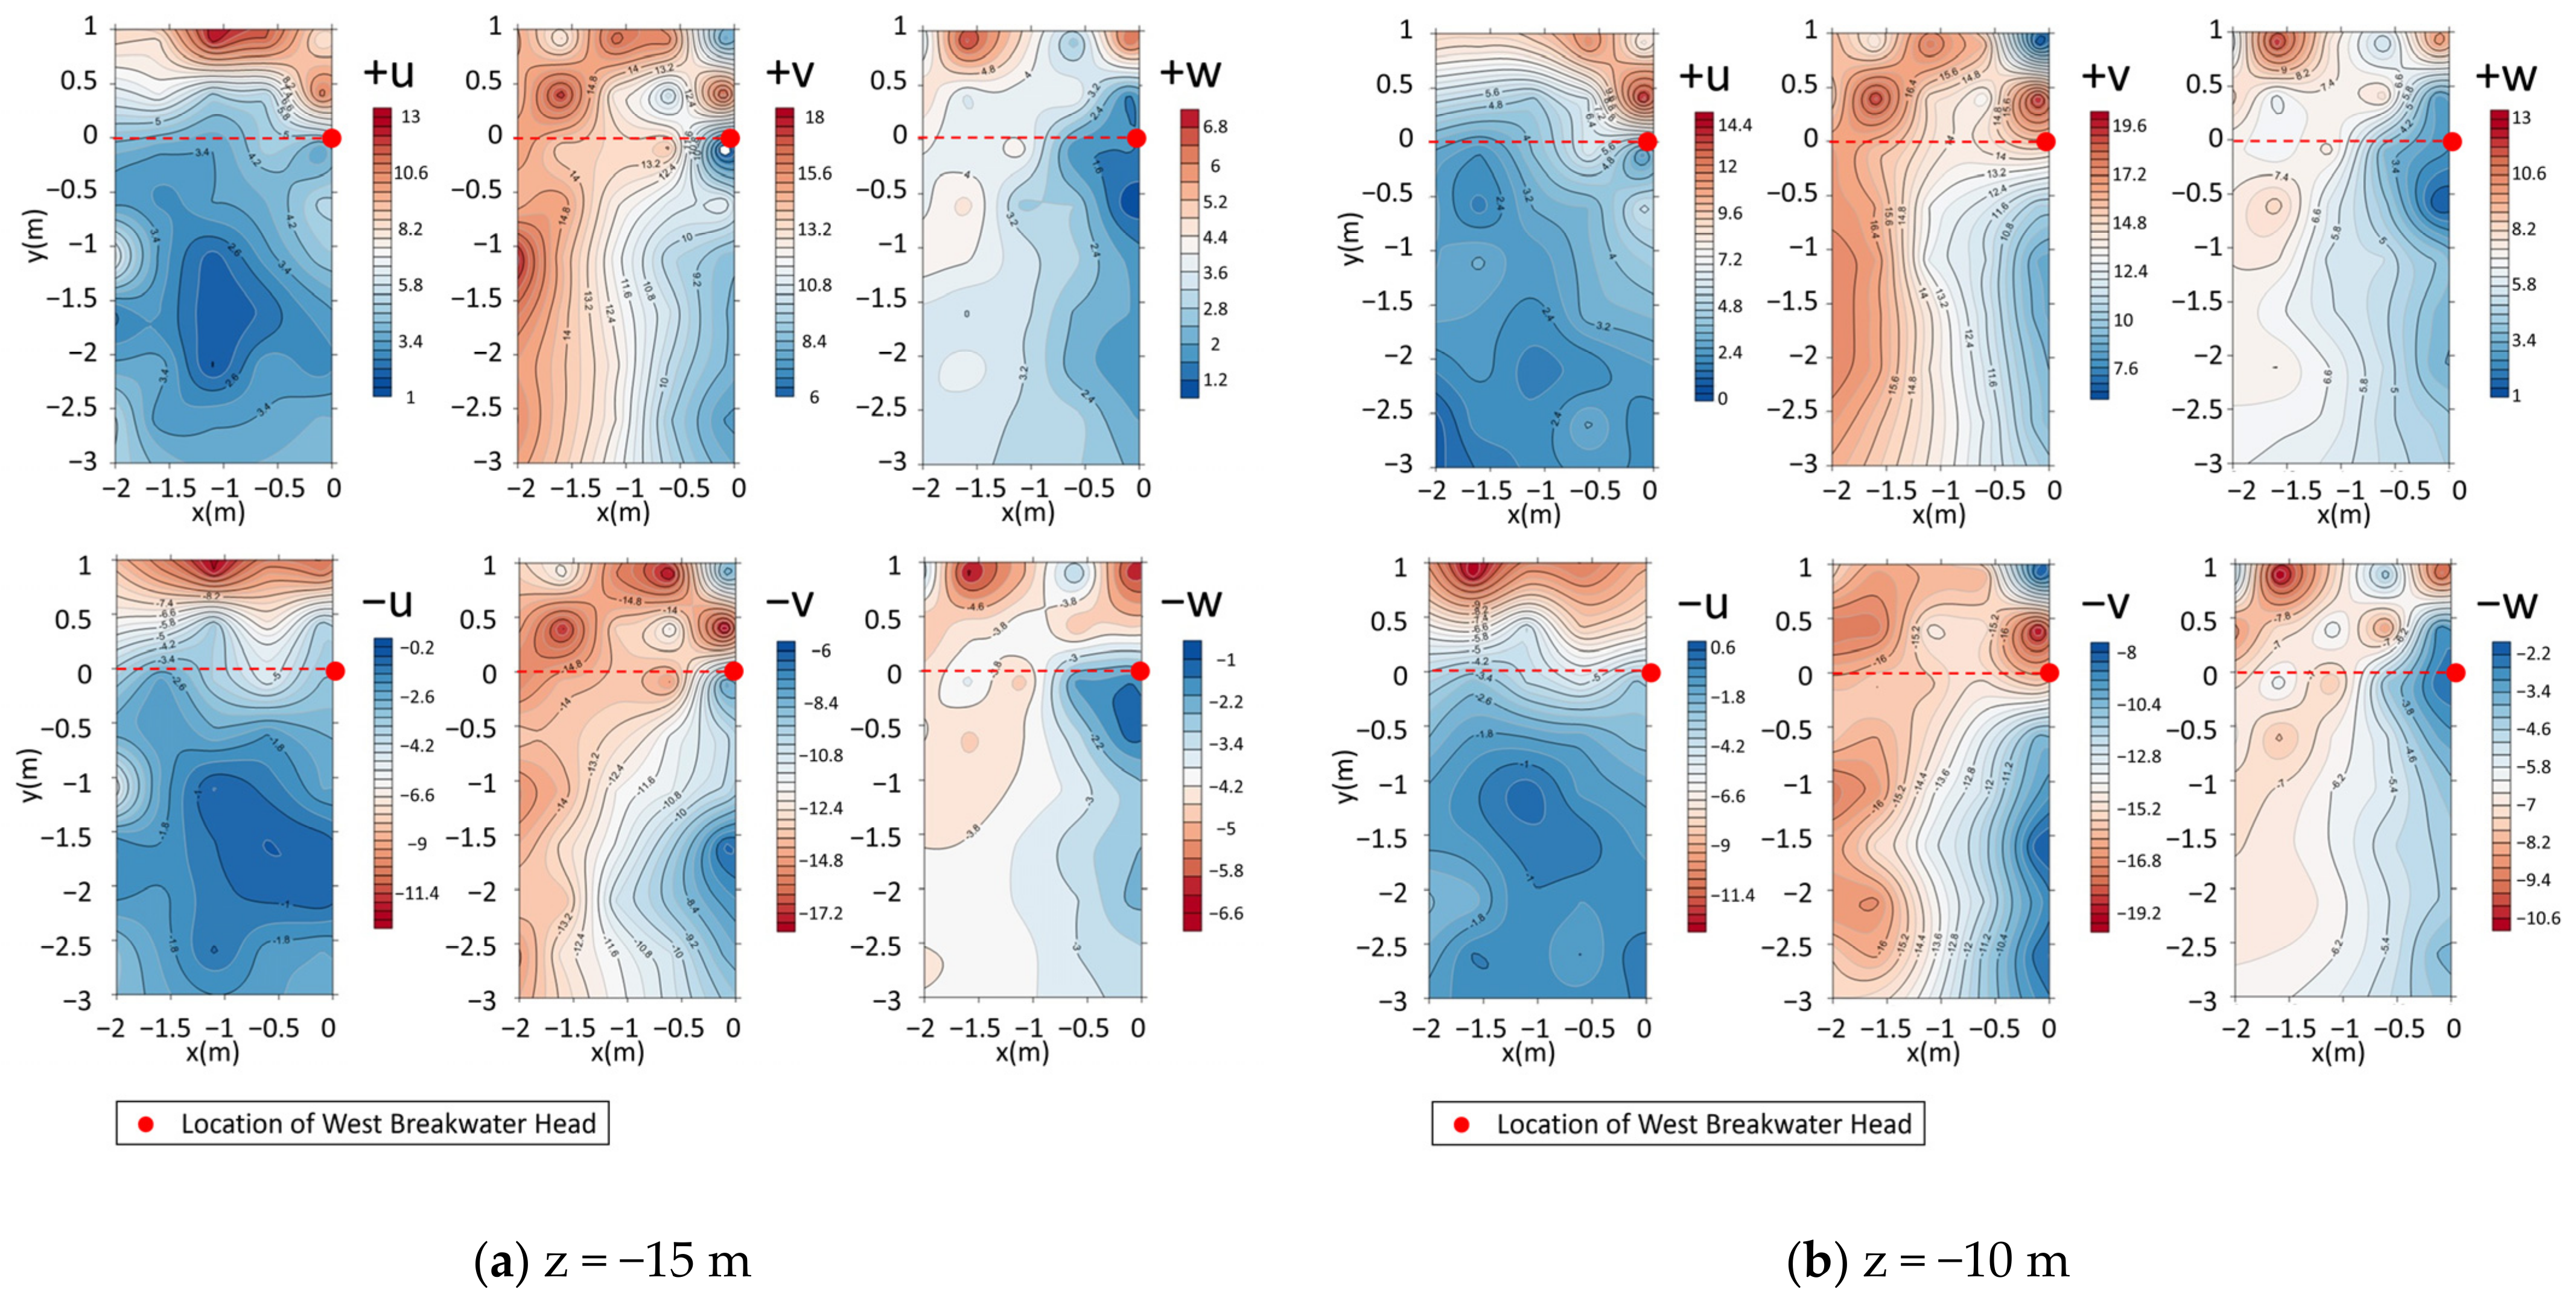
4.5.2. Current Velocity at Different Depths
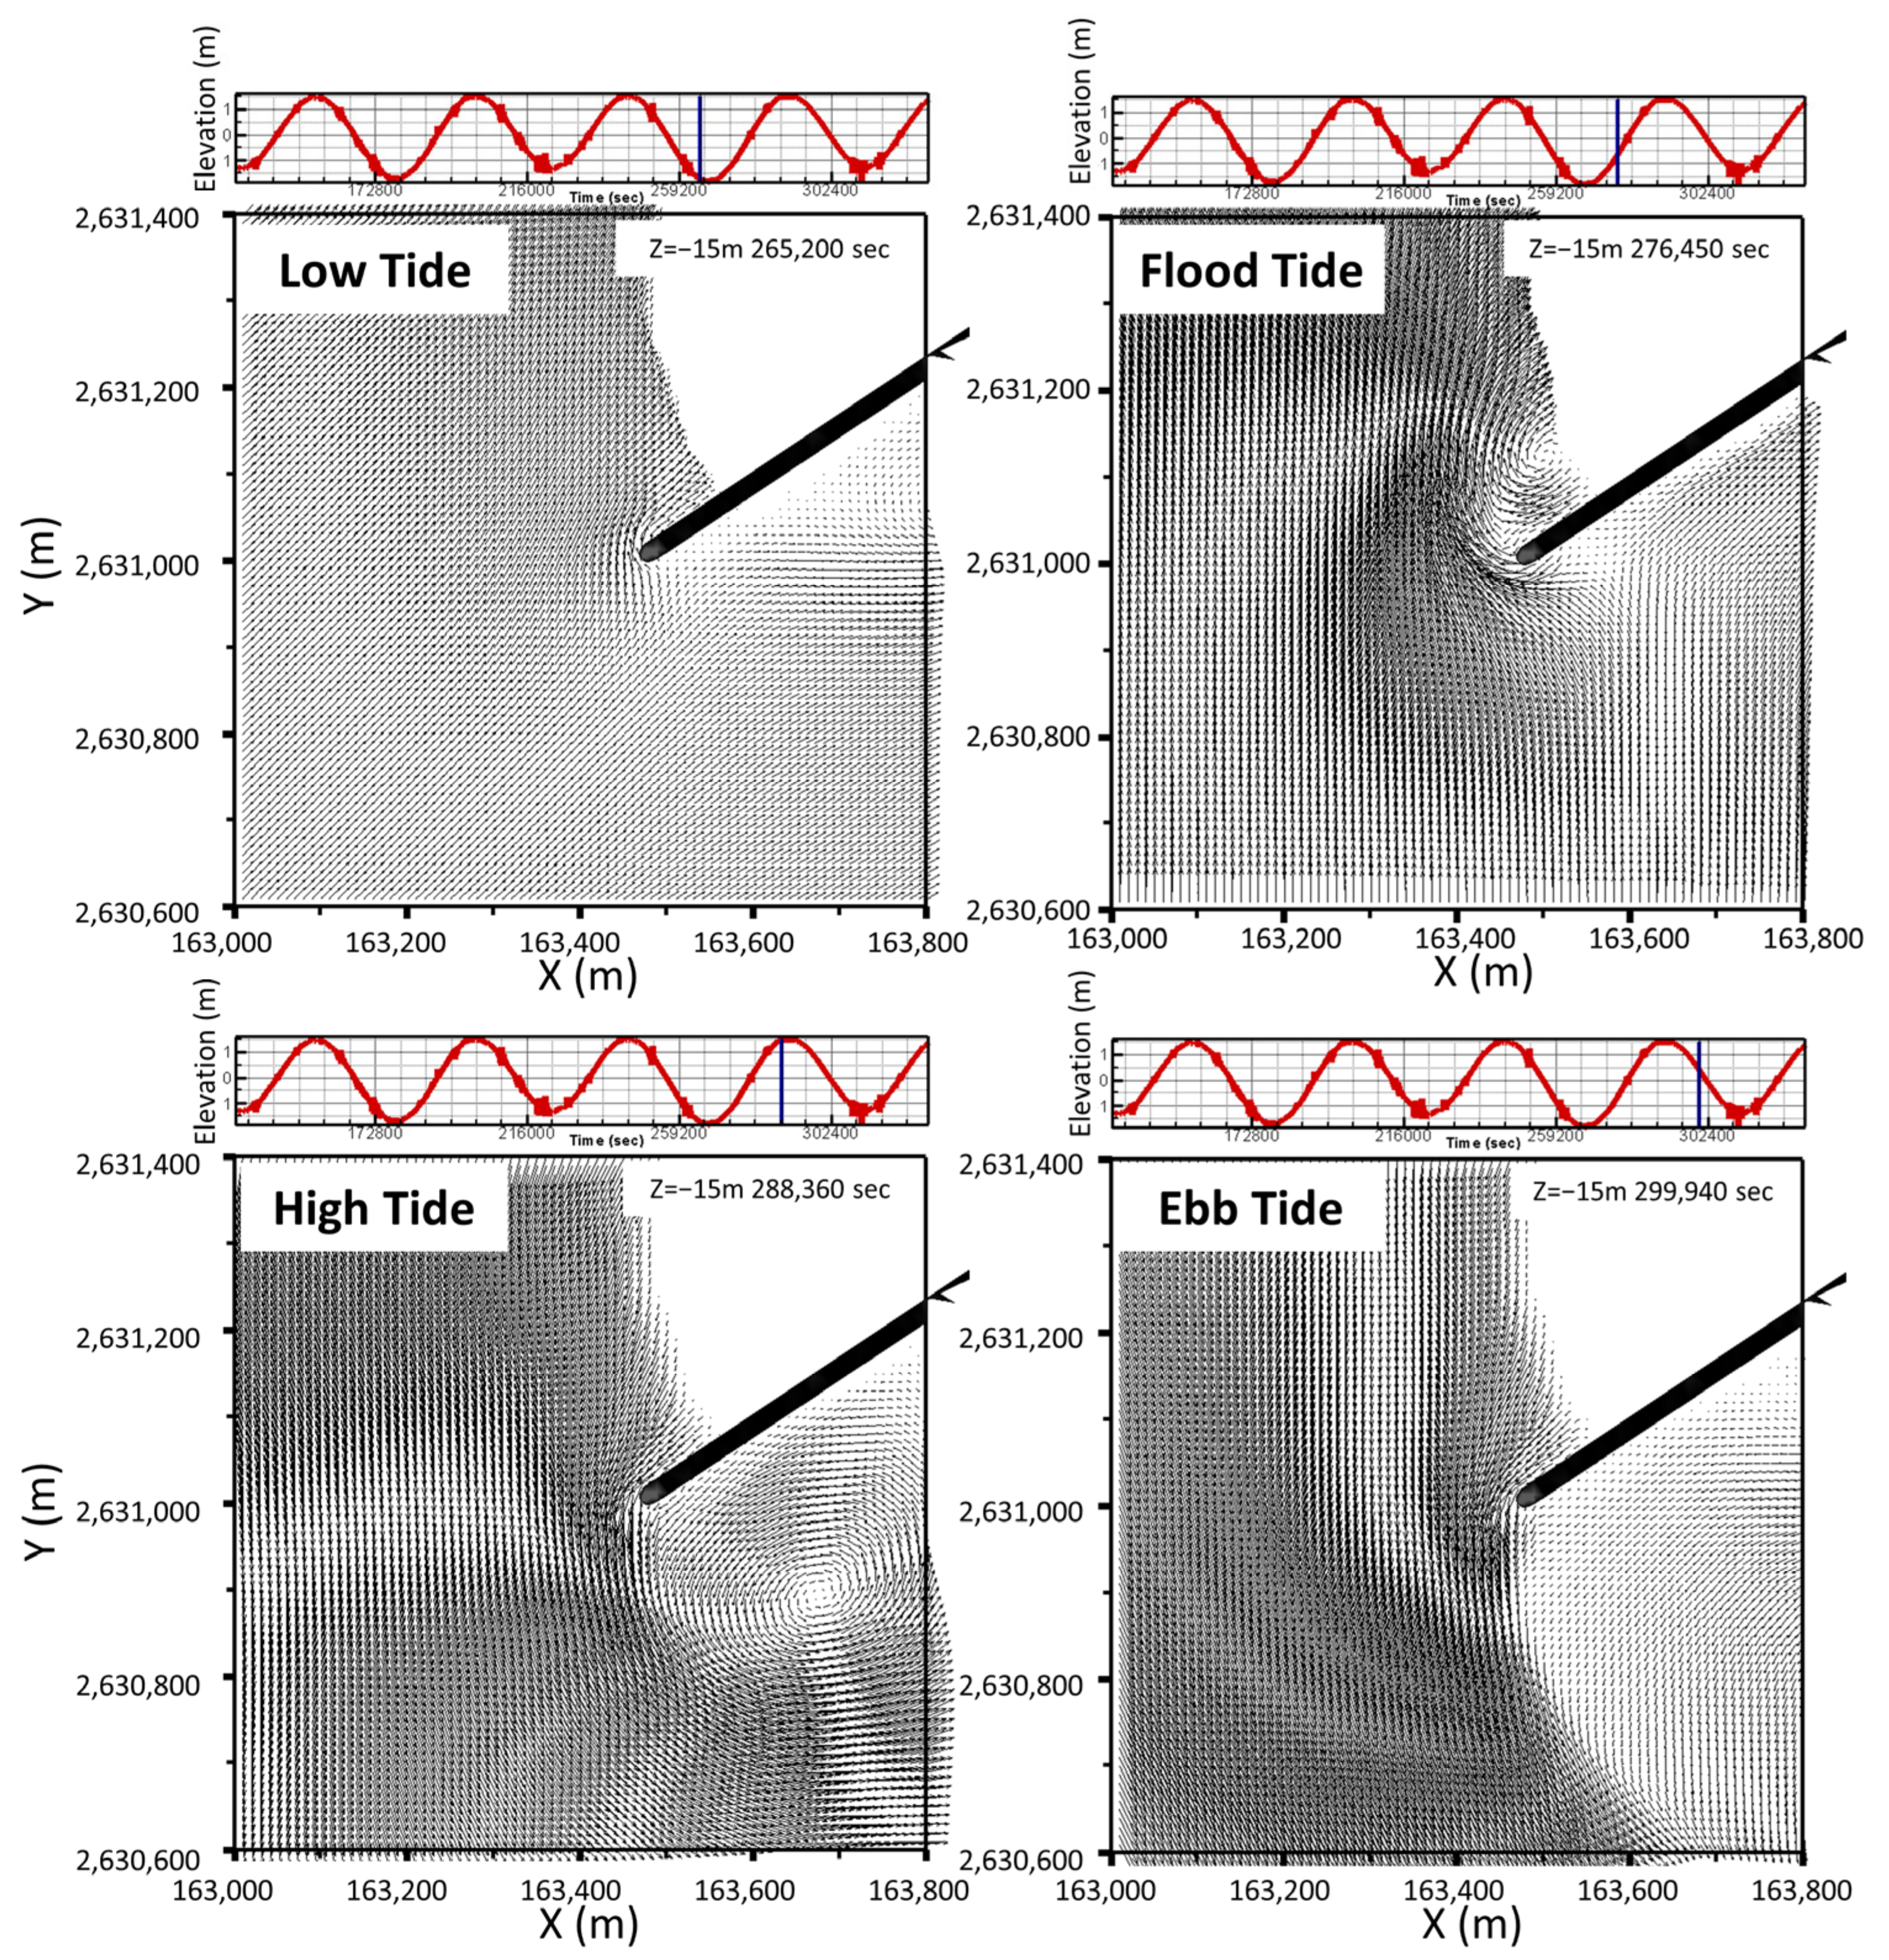
4.5.3. Tidal Effect on the Current Field
- (1)
- At Low Tide Stage
- (2)
- At Flood Tide Stage
- (3)
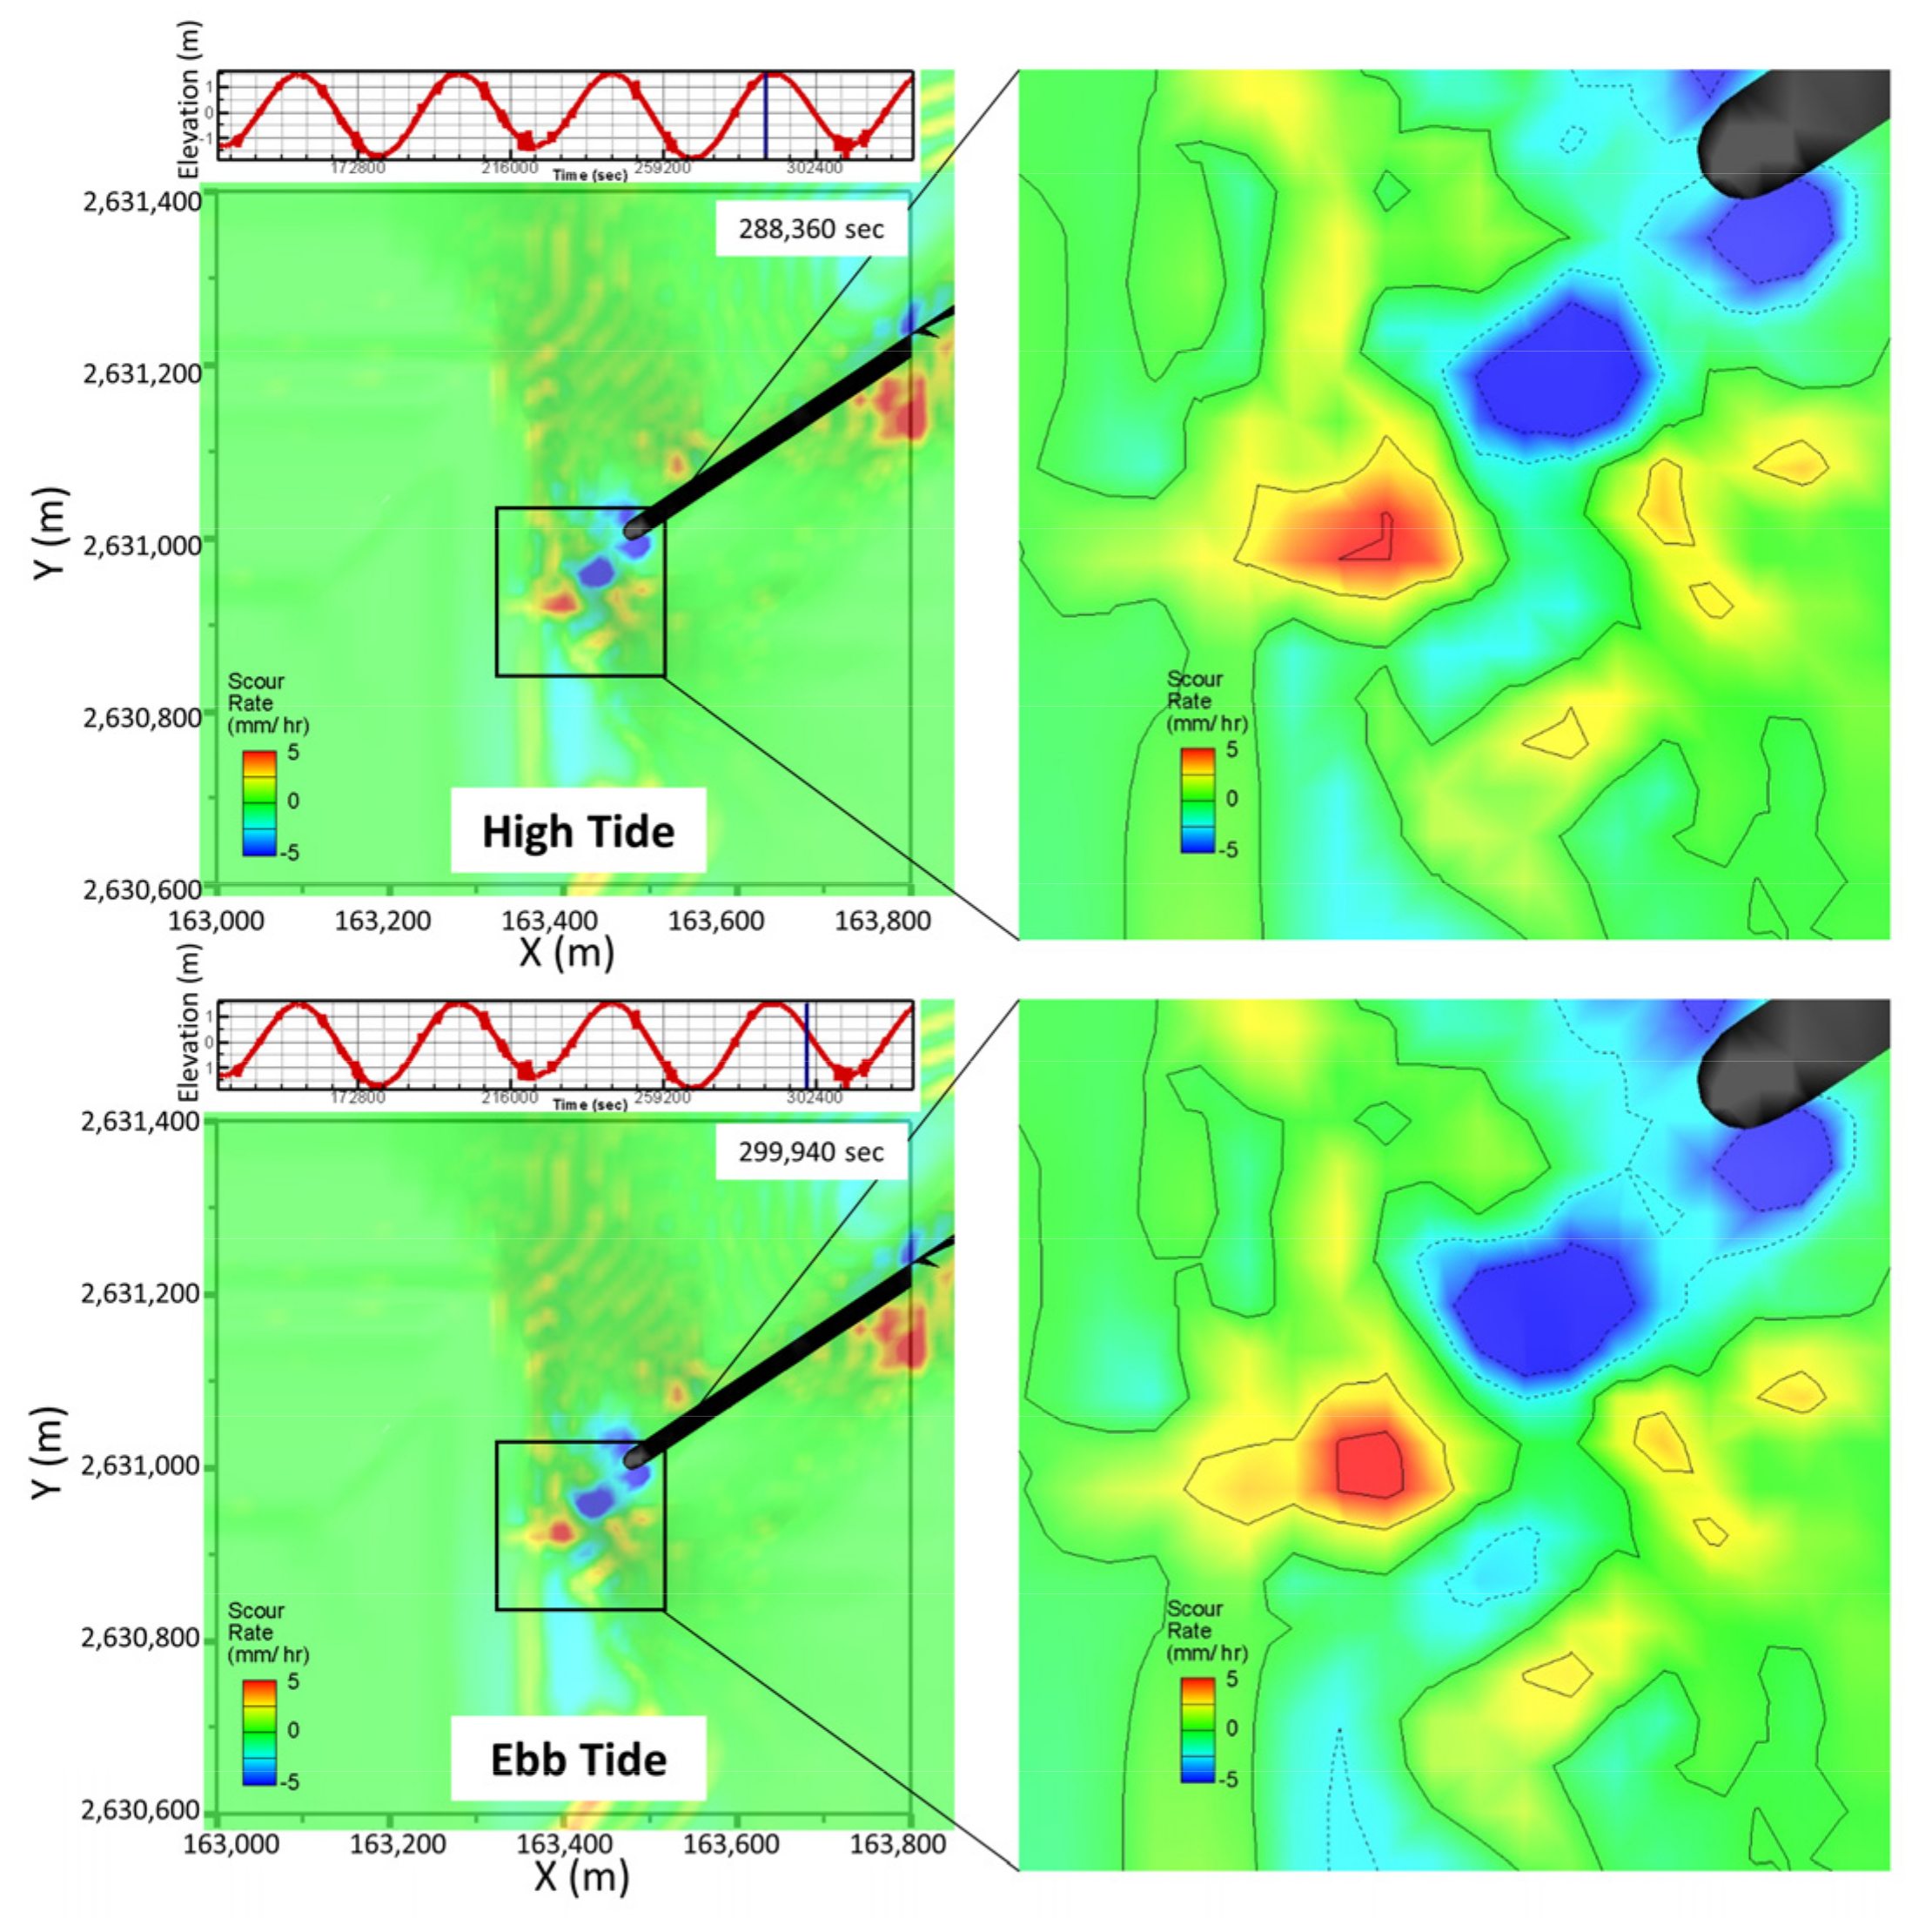
- At High Tide Stage
- (4)
- At Ebb Tide Stage
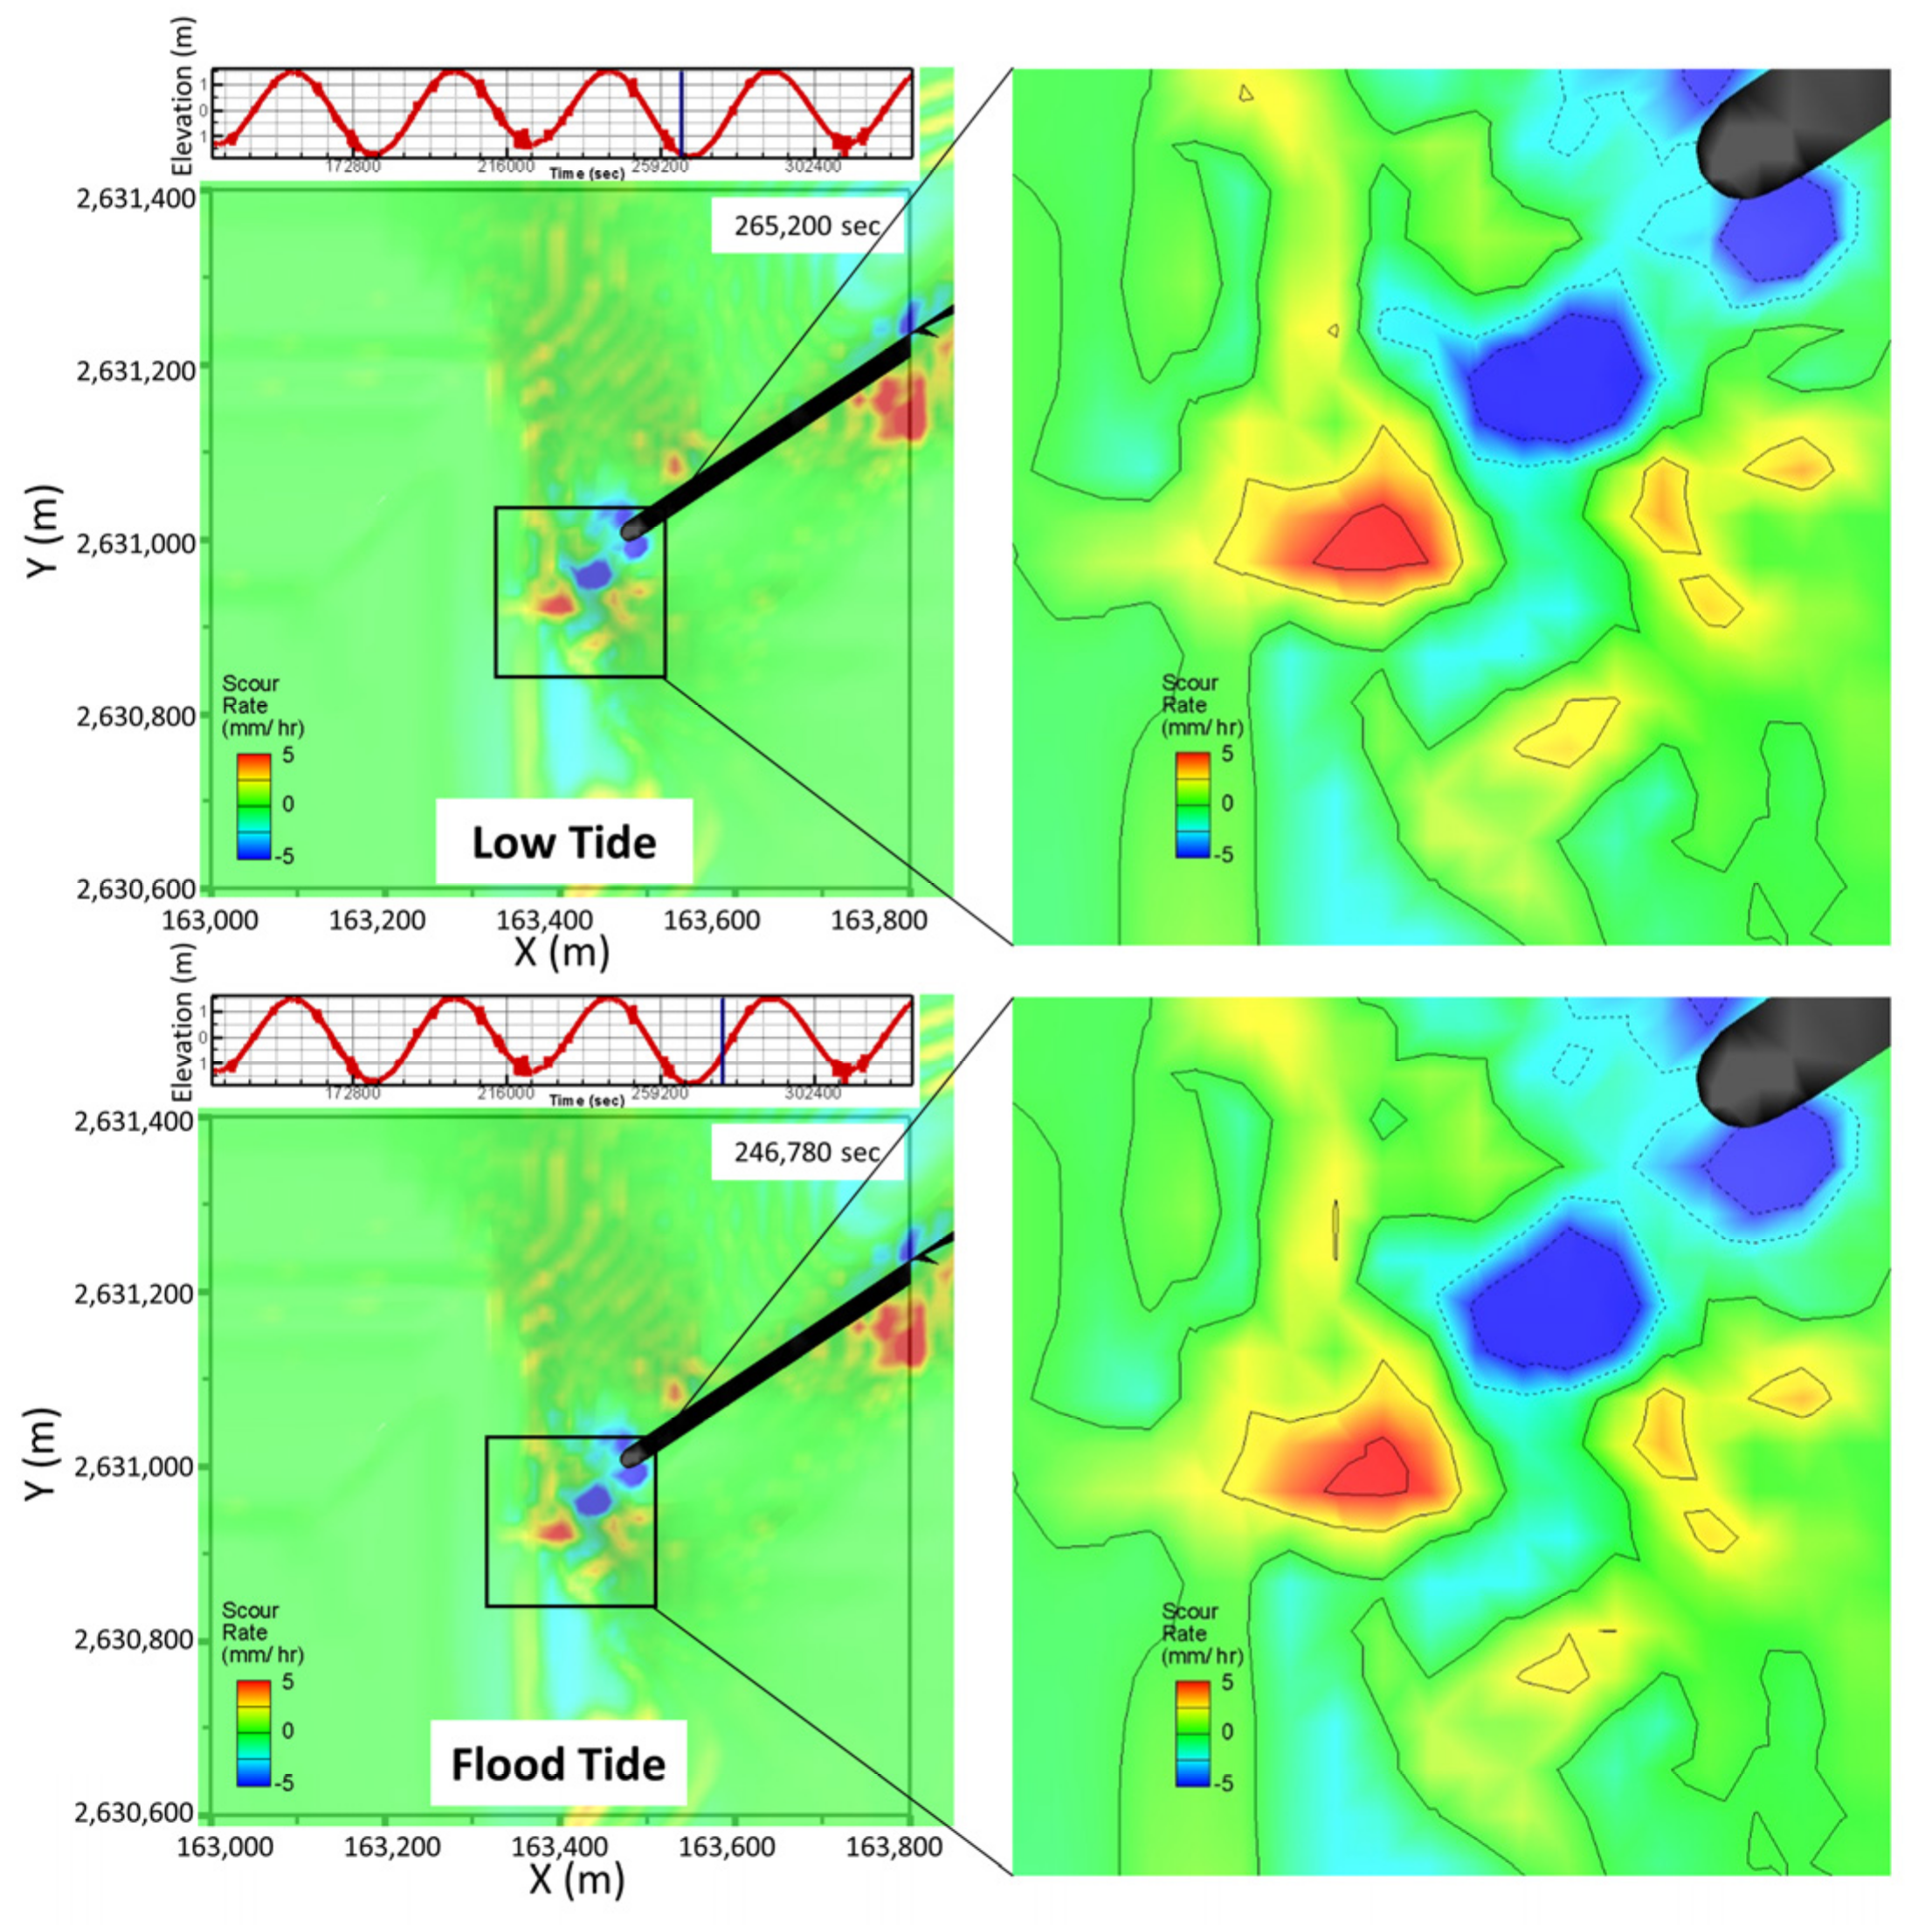
4.5.4. Topographic Changes
5. Discussion
5.1. Field Data Analysis
5.2. Hydraulic Test of Wave Field
5.3. Hydraulic Test of Current Field
5.4. Numerical Simulation of Wave and Current Field
6. Conclusions
Author Contributions
Funding
Institutional Review Board Statement
Informed Consent Statement
Data Availability Statement
Acknowledgments
Conflicts of Interest
References
- Sato, S.; Tanaka, N.; Irie, I. Study on Scouring at the Foot of Coastal Structures. Coast. Eng. Jpn. 1969, 12, 83–98. [Google Scholar] [CrossRef]
- Xie, S.L. Scouring Patterns in Front of Vertical Breakwaters and Their Influence on the Stability of the Foundations of the Breakwaters Report; Department of Civil Engineering, Delft University of Technology: Delft, The Netherlands, 1981; p. 61. [Google Scholar]
- Irie, I.; Nadaoka, K. Laboratory reproduction of seabed scour in front of breakwaters. Coast. Eng. Proc. 1984, 1, 116. [Google Scholar] [CrossRef]
- Sumer, B.M.; Fredsøe, J. Scour at the head of a vertical-wall breakwater. Coast. Eng. 1997, 29, 201–230. [Google Scholar] [CrossRef]
- Fredsøe, J.; Sumer, B.M. Scour at the round head of a rubble-mound breakwater. Coast. Eng. 1997, 29, 231–262. [Google Scholar] [CrossRef]
- Sumer, B.M.; Fredsøe, J. Experimental study of 2D scour and its protection at a rubble-mound breakwater. Coast. Eng. 2000, 40, 59–87. [Google Scholar] [CrossRef]
- Herbich, J.B.; Ko, S.C. Scour of sand beaches in front of seawalls. Coast. Eng. Proc. 1968, 1, 40. [Google Scholar] [CrossRef]
- Hales, L.Z. Erosion Control of Scour during Construction: Report 2. Literature Survey of Theoretical, Experimental and Prototype Investigations; US Army Engineer Waterways Experiment Station: Vicksburg, MS, USA, 1980. [Google Scholar]
- Eckert, J.W. Design of Toe Protection for Coastal Structures. Coast. Struct. 1983, 83, 331–341. [Google Scholar]
- Sumer, B.M.; Whitehouse, R.J.S.; Tørum, A. Scour around coastal structures: A summary of recent research. Coast. Eng. 2001, 44, 153–190. [Google Scholar] [CrossRef]
- Lin, M.; Jeng, D.S. A 3-D model for ocean waves over a Columb-damping poroelastic seabed. Ocean Eng. 2004, 31, 561–585. [Google Scholar] [CrossRef]
- Burcharth, H.F.; Kramer, M.; Lamberti, A.; Zanuttigh, B. Structural stability of detached low crested breakwaters. Coast. Eng. 2006, 53, 381–394. [Google Scholar] [CrossRef]
- Myrhaug, D.; Ong, M.C. Random wave-induced scour at the trunk section of a breakwater. Coast. Eng. 2009, 56, 688–692. [Google Scholar] [CrossRef]
- Sumer, B.M.; Fredsøe, J.; Lamberti, A.; Zanuttigh, B.; Dixen, M.; Gislason, K.; Di Penta, A.F. Local scour at roundhead and along the trunk of low crested structures. Coast. Eng. 2005, 52, 995–1025. [Google Scholar] [CrossRef]
- Lee, K.-H.; Mizutani, N. Experimental study on scour occurring at a vertical impermeable submerged breakwater. Appl. Ocean Res. 2008, 30, 92–99. [Google Scholar] [CrossRef]
- Myrhaug, D.; Rue, H.; Tørum, A. Tentative engineering approach to scour around breakwaters in random waves. Coast. Eng. 2004, 51, 1051–1065. [Google Scholar] [CrossRef]
- Gokce, T.; Sumer, B.M.; Fredsøe, J. Scour around coastal structures: A summary of recent research. In Proceedings of the International Conference on Hydro-Technical Engineering for Port and Harbor Construction, Yokosuka, Japan, 19–21 October 1994; pp. 1097–1116. [Google Scholar]
- Shoji, S.; Isao, I. Variation of topography of sea-bed caused by the construction of breakwaters. Coast. Eng. Proc. 1970, 1, 81. [Google Scholar] [CrossRef]
- Dentale, F.; Donnarumma, G.; Carratelli, E.P. Wave Run Up and Reflection on Tridimensional Virtual Breakwaters. J. Hydrogeol. Hydrol. Eng. 2012, 1, 1–9. [Google Scholar] [CrossRef]
- Lai, J.-W.; Hsu, T.W.; Lan, Y.-J. Experimental and numerical studies on wave propagation over coarse grained sloping beach. Coast. Eng. Proc. 2011, 1, waves.26. [Google Scholar]
- Acharya, A. Experimental Study and Numerical Simulation of Flow and Sediment Transport around a Series of Spur Dikes. Ph.D. Thesis, University of Arizona, Tucson, AZ, USA, 2011. [Google Scholar]
- Hirt, C.W.; Sicilian, J.M. A porosity technique for the definition obstacles in rectangular cell meshes. In Proceedings of the Fourth International Conference on Numerical Ship Hydrodynamics, Washington, DC, USA, 24–27 September 1985; pp. 450–568. [Google Scholar]
- Lin, I.-F.; Tseng, I.-F.; Lee, C.-P.; Chen, G.-Y. Seabed scour around a breakwater a case study in mailiao harbor. J. Mar. Sci. Technol. 2015, 23, 846–854. [Google Scholar] [CrossRef]


| Author(s) | Derivation Principle | NT | NH |
|---|---|---|---|
| Goddet and Jaffary (1960) | Bed Sediment Kinematic Similarity | ||
| Valembois (1960) | Suspended Sediment Kinematic Similarity | ||
| Yalin (1963) | Dimensional Analysis | ||
| Fan and LeMehaute (1969) | Bed Sediment Kinematic Similarity | ||
| Noda (1972) | Bed Sediment Kinematic Similarity | ||
| Dalrymple and Thompson (1976) | Similarity |
| Simulation Scenario | Prototype (Model) | |||||
|---|---|---|---|---|---|---|
| Wave Direction | Wave Height | Wave Period | Tide Elevation | Distorted Scale Ratio | Grain Size | |
| Monsoon | Southward | 2.65 m (2.65 cm) | 6.32 s (0.632 s) | 0.35 m (0.35 cm) | 1 | 0.25 mm |
| Typhoon1 | Southward | 6.4 m (6.40 cm) | 10.6 s (1.06 s) | 2.1 m (2.1 cm) | 1 | 0.25 mm |
| Typhoon 2 | Southward | 6.38 m (9.12 cm) | 10.6 s (1.267 s) | 3.0 m (3.0 cm) | 3 | 0.15 mm |
| Typhoon 3 | Southward | 6.30 m (9.00 cm) | 8.9 s (1.06 s) | 2.1 m (2.1 cm) | 3 | 0.15 mm |
| Typhoon 4 | Southward | 7.97 m (11.38 cm) | 10.6 s (1.267 s) | 2.1 m (2.1 cm) | 3 | 0.15 mm |
| Scenario | Wave Height (H) | Wave Period (T) | Wave Direction | Simulation Time |
|---|---|---|---|---|
| 50-year Return Period Typhoon at Mailiao | 6.4 m | 10.6 s | Northward | 80 T |
Publisher’s Note: MDPI stays neutral with regard to jurisdictional claims in published maps and institutional affiliations. |
© 2022 by the authors. Licensee MDPI, Basel, Switzerland. This article is an open access article distributed under the terms and conditions of the Creative Commons Attribution (CC BY) license (https://creativecommons.org/licenses/by/4.0/).
Share and Cite
Tseng, I.-F.; Hsu, C.-H.; Yeh, P.-H.; Lin, T.-C. Physical Mechanism for Seabed Scouring around a Breakwater—A Case Study in Mailiao Port. J. Mar. Sci. Eng. 2022, 10, 1386. https://doi.org/10.3390/jmse10101386
Tseng I-F, Hsu C-H, Yeh P-H, Lin T-C. Physical Mechanism for Seabed Scouring around a Breakwater—A Case Study in Mailiao Port. Journal of Marine Science and Engineering. 2022; 10(10):1386. https://doi.org/10.3390/jmse10101386
Chicago/Turabian StyleTseng, I-Fan, Chih-Hung Hsu, Po-Hung Yeh, and Ting-Chieh Lin. 2022. "Physical Mechanism for Seabed Scouring around a Breakwater—A Case Study in Mailiao Port" Journal of Marine Science and Engineering 10, no. 10: 1386. https://doi.org/10.3390/jmse10101386
APA StyleTseng, I.-F., Hsu, C.-H., Yeh, P.-H., & Lin, T.-C. (2022). Physical Mechanism for Seabed Scouring around a Breakwater—A Case Study in Mailiao Port. Journal of Marine Science and Engineering, 10(10), 1386. https://doi.org/10.3390/jmse10101386