1. Introduction
Pipelines are widely used in coastal and ocean engineering, and usually installed in trenches for safety and stability, while sand is often used as the backfill material in practice. The backfill depth has a great influence on the in-situ stability of the pipeline. In general, thick backfill depth can protect the pipeline better, but it significantly increases the cost. Though thin backfill depth is economical, the pipeline may be unstable in this scenario. Therefore, how to backfill a trench under wave and current load to appropriately and economically protect the pipeline needs to be investigated.
In the past decades, extensive studies have been conducted to investigate effective stress and distribution of excess pore pressure around the pipeline within the seabed induced by wave loading. Cheng et al. [
1] studied the wave-induced seepage force on soil responses around a rigid and deformable pipeline using the boundary element method. They found that the uplift seepage force could reach up to 60% of the drainage weight if the pipeline was close to the seabed surface. McDougal et al. [
2] proposed an analytical model to calculate the wave-induced pore pressure and pressure force around the buried pipeline. Magda [
3,
4,
5] studied the saturation effect on the dynamic responses within the seabed around the submarine pipelines using the finite element method. He developed an empirical formula for computing the lifting force of the buried pipelines under different saturation conditions. Note that all the above studies assumed the pipeline was rigid and fixed, and only wave-induced pore pressure and uplift force were considered for evaluating pipeline safety. Yang et al. [
6] (2014) conducted laboratory experiments to investigate the protection of the unidirectional flow generated-induced scour around the pipe by placing a rubber plate beneath the pipe. They found that when the length of the rubber plate reached a critical value, there was no scour taking place around the pipe. Using laboratory experiments, Sun et al. [
7] investigated the wave-induced soil response around a partially buried pipeline in a trench. Gao et al. [
8] investigated the wave-induced pore pressure around a buried or partially buried pipeline in a silty bed. They found that the residual pore pressure dominated the soil liquefaction in their study. Recently, Zhai et al. [
9] carried out experiments and performed a numerical simulation to investigate the wave-induced pore pressure around twin pipelines. They found that the distance between two pipes had a great effect on the pore pressure and effective stress around the pipelines.
However, the other dynamic responses such as effective stress, pipeline deformation and uplift force, are also crucial to the stability of the pipelines [
10]. For example, shear failure could happen near the pipeline due to effective stress. Jeng and Cheng [
11] studied wave-induced soil responses around the pipeline, including effective stress and soil displacement, by using a finite element model. They found that the potential shear failure around the pipelines could be evaluated through the Mohr–Coulomb yield criterion. A two-dimensional finite element numerical model was established by Jeng [
12] to calculate the wave-induced soil dynamics around an elastic pipeline. The results presented were that when the depth function of shear modulus remained unchanged, the permeability effect on the wave-induced pore pressure along the pipeline surface, within a coarse sand seabed, was greater than that within a fine sand seabed. Seabed response induced by cnoidal wave was modeled by Zhou et al. [
13] with the finite element method. They found that the difference between the maximum pore pressure and vertical effective stress, caused by the cnoidal wave and Stokes wave, could be up to 60–70%. Gao et al. [
14] considered the influence of overburden geometry and the property of backfill material on the pipeline surface and the stress inside the pipeline caused by waves, as well as the nonlinear effect of waves. Zhai et al. [
15] analyzed the relationship of the seepage action around the pipeline, wave parameters and the pipeline size. The stronger wave action, the larger seabed permeability and pipeline diameter, and the smaller flow gap ratio would lead to the movement of soil particles. Under wave actions, the seepage changes periodically along the seabed surface. The horizontal seepage discontinuity exists at the bottom of the pipeline where the flow rate is 0.
Lin et al. [
16] studied the stability of pipelines laid in trenches under wave load using the finite element method. They found that half-buried or even fully buried pipelines cannot plenarily decrease the excess pore pressure. However, when the thickness of the overlying soil layer was more than 1.375 times of the pipeline diameter, the backfill sand could effectively protect the pipelines from liquefaction. Based on the generalized Biot model, Luan et al. [
17] evaluated the momentary liquefaction potential around a buried pipeline by the finite element method. A two-dimensional coupling model was developed by Duan [
18] to study the liquefaction potential around partially buried pipelines in the trench of a non-cohesive seabed. Biot’s consolidation equation and the Reynolds-Averaged Navier–Stokes (RANS) equation were adopted to govern the dynamic response within the seabed, as well as the wave motion. Similarly, a three-dimensional hybrid model, combining the RANS equation with Biot’s consolidation equation, was established by Li et al. [
19]. The numerical simulation showed that the liquefaction depth increases with the decreasing saturation degree and wave height. Under the anisotropic seabed condition, there is a nonlinear relationship between the maximum liquefaction depth and the seabed permeability. Wang et al. [
20] applied a meshfree model to assess the relationship of wave parameters, soil characteristics and the liquefaction depth. Under the same wave action, the excess pore pressure is relatively great within the seabed with low saturation and permeability. The liquefaction depth around the pipeline increases with the increases of wave height and wave period. It was also found that the probability of liquefaction instability decreases with the increase of backfill depth. Apart from regular waves, Lin and Wang [
21] established a two-dimensional numerical model to study the pore pressure and seepage force around the pipeline under the solitary wave action. The pore pressure gradient within the dense seabed soils is smaller when compared with the loose seabed. The larger permeability coefficient corresponds to the smaller Young’s modulus, and the more significant the vertical force on the pipeline. With the increase of the permeability coefficient and wave amplitude, the downward vertical force apparently increases, while the upward force decreases slightly. The vertical force is an order of magnitude greater than the horizontal force.
All these studies mentioned above were carried out for investigating the wave–seabed–pipeline interaction. However, as one of the most important marine environmental loads, the current effect on the dynamic response within the seabed around the pipeline cannot be ignored [
22]. Mostafa [
23] modified a coupled BEM–FEM to simulate the interaction among nonlinear-wave, current and pipelines. The model explained the sand beneath the pipeline could be washed away due to the large pressure gradient induced by the gap of seabed and pipelines. Compared with different buried depths of pipelines built above the flat seabed, more and more studies have been conducted about trench backfilling. Zhou et al. [
24] studied the wave–current-induced responses within the seabed soil around the pipeline under different soil characteristics and embedment conditions. Half-buried pipeline showed the resistance to soil liquefaction in the fine sand seabed. Under the same pipeline–seabed configuration, the comparison of the liquefaction depth and scour depth beneath the pipeline showed that the occurrence of liquefaction was accompanied by larger scour depth. Ye et al. [
25] investigated the soil responses within the poro-elastic seabed under the wave–current interaction. They found that the following current led to a higher possibility of seabed instability. Foo et al. [
26] considered the effect of the current on wave–seabed–pipeline interaction. They found that the increase of current velocity would lead to the increase of the pore pressure amplitude. The looser seabed soil and the lower relative density caused the higher residual pore pressure, but it had little effect on the oscillating pore pressure. Hu et al. [
27] used an ionic soil stabilizer (ISS) to solidify the soil and to improve the pipeline stability in combined waves and current. However, it tends to cause liquefaction as the seabed soil becomes dense. Recently, Gao et al. [
28] performed a numerical simulation to investigate the combined wave–current- induced pore pressure around the twin pipelines. They found that when the forward current velocity exceeds a threshold, the residual pore pressure and liquefaction depth increases with the increase of the current velocity.
The afore-discussed previous studies focused on exploring the dynamic response around the pipeline under the fixed buried condition and wave actions in a homogeneous seabed. Recent studies have taken the co-existence of currents and waves into account. However, most of the researches adopted numerical simulation and analytical solutions to reflect the wave–current–seabed–pipeline interaction, where assumptions and simplifications are usually made in order to run the numerical calculation or obtain analytical solutions. In this regard, an experimental model can better represent the dynamic characteristics of the seabed under combined wave–current conditions, which motivates this study. In this study, we investigate the dynamic response of backfill depths, backfill materials and current properties on the seabed soil around the pipeline, under different wave–current conditions, which is significant for pipeline stability.
2. Experimental Setup
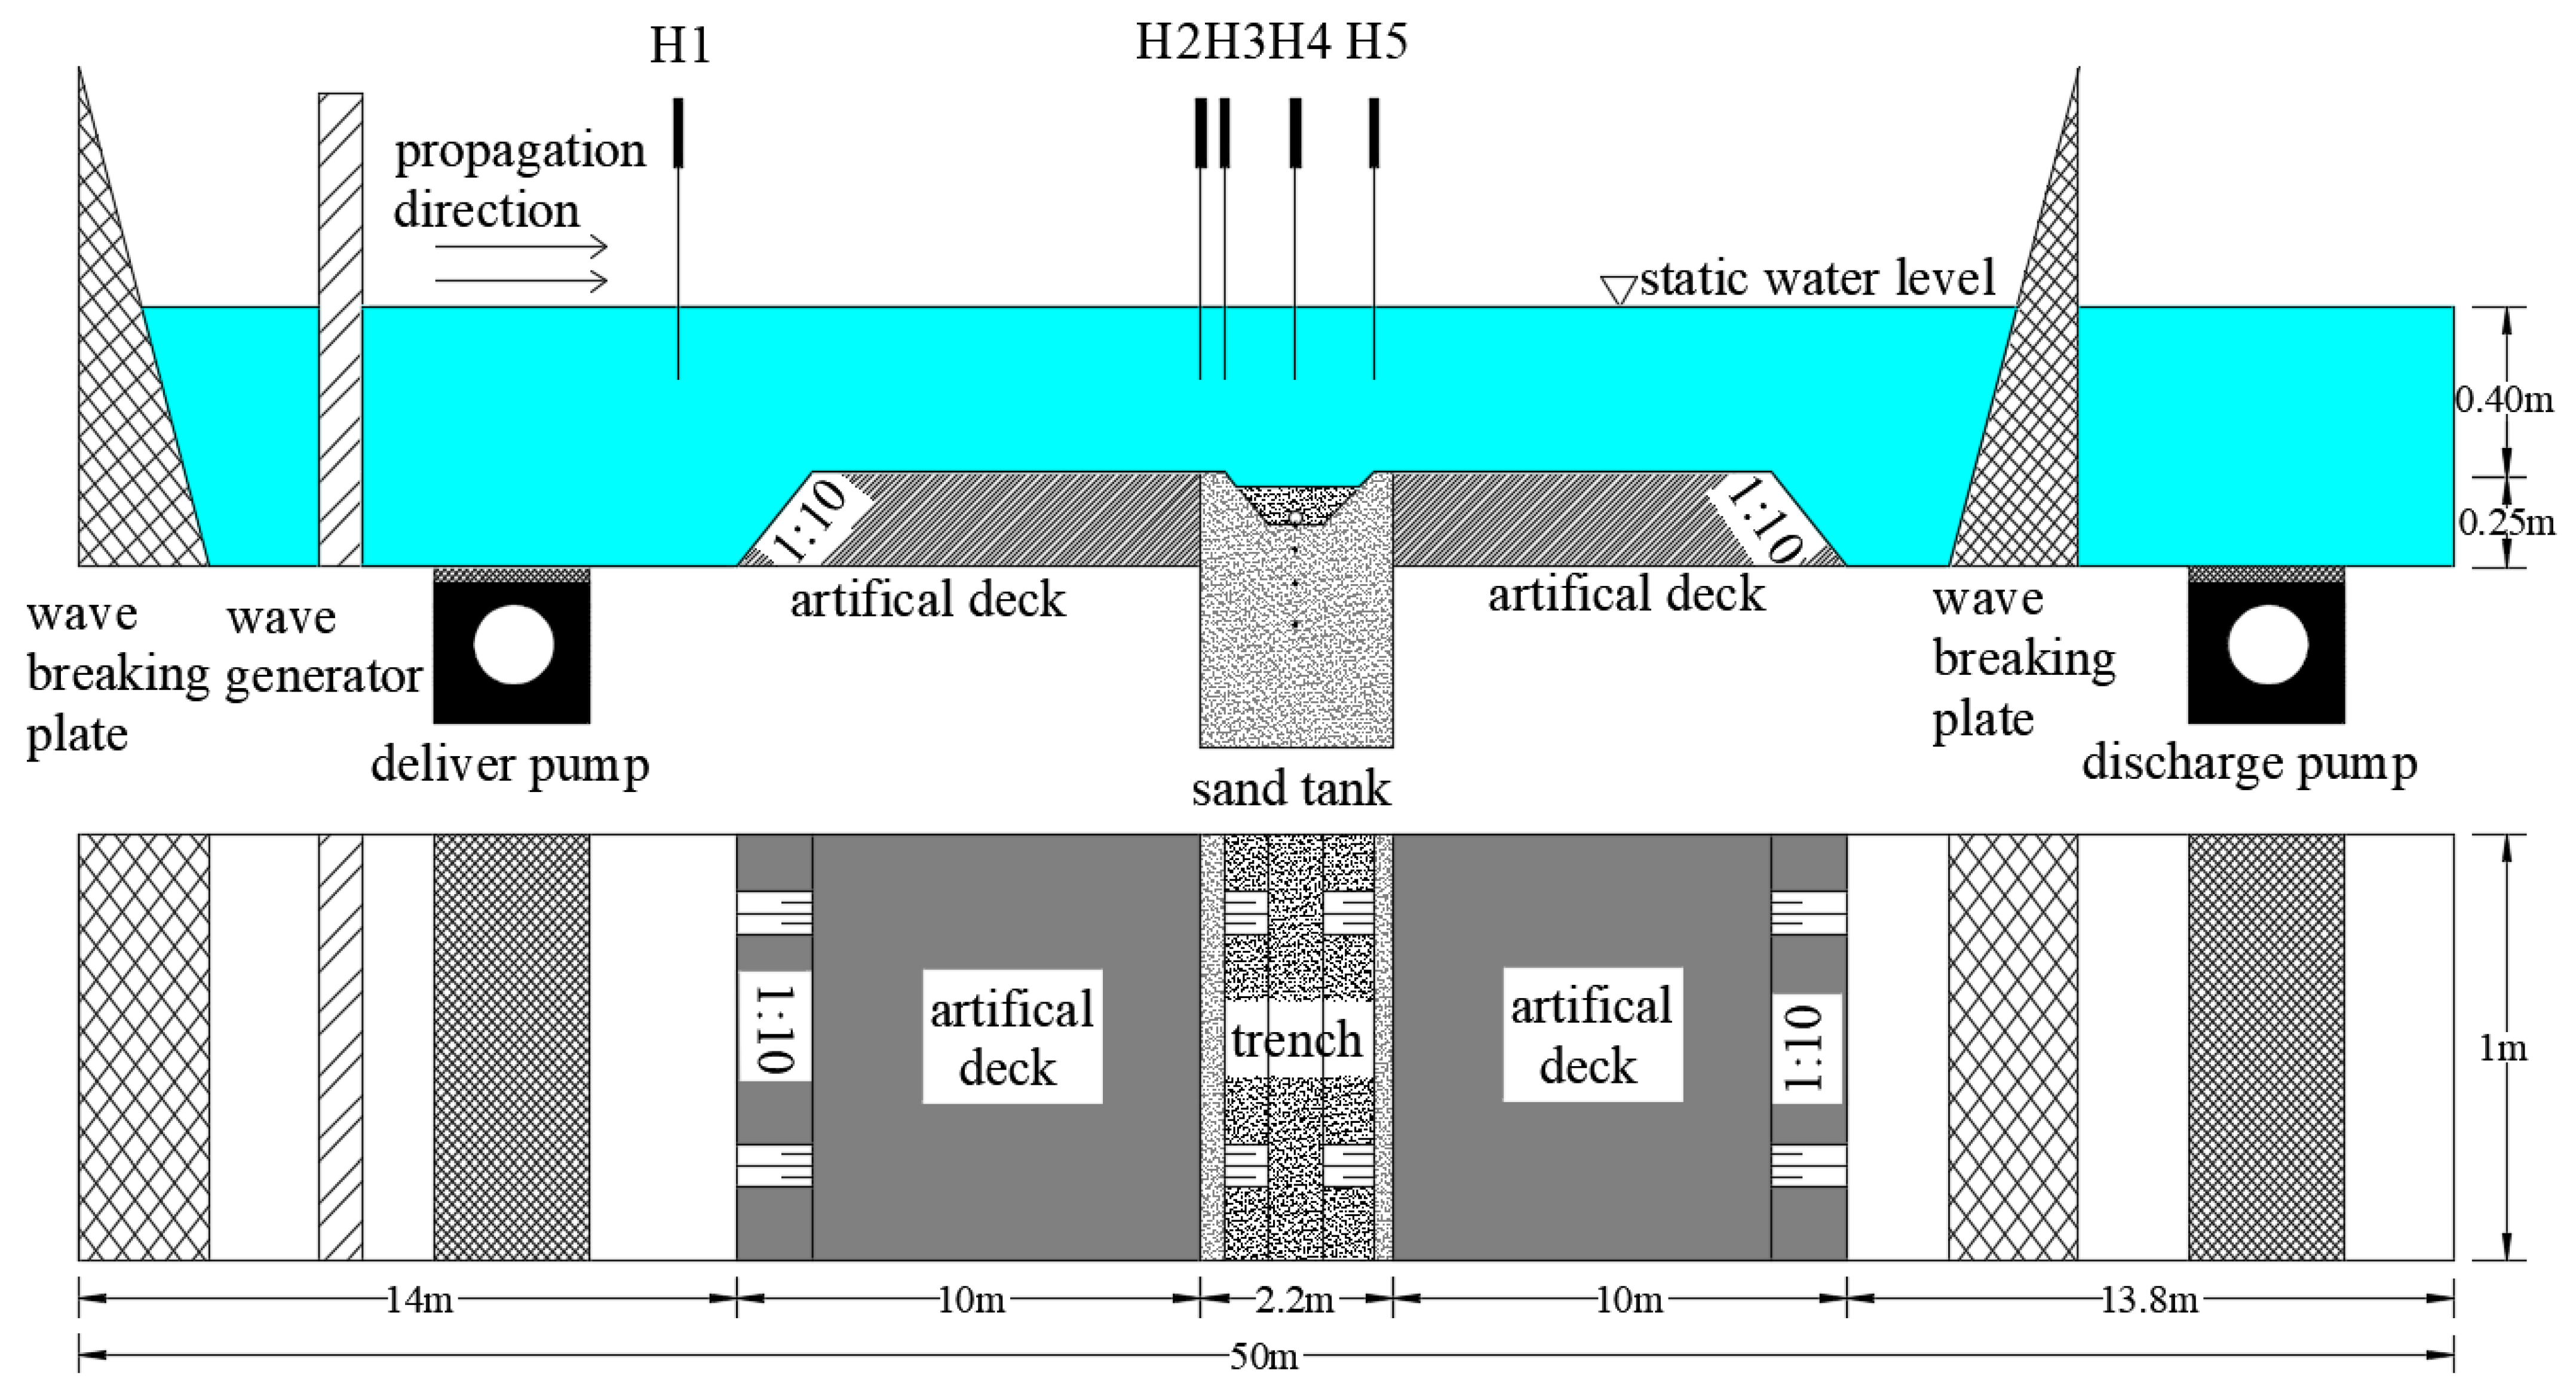
Figure 1 shows the experimental wave flume, which was 50 m long, 1 m wide and 1.3 m high. The upstream end of the wave flume was equipped with a hydraulic piston-type wave-maker. The ranges of wave period and wave height were 0.5~5 s and 2~40 cm, respectively. The deviation between the maximum wave height and the average wave height were within 3%, and the deviation between the maximum wave period and the average wave period were within 2%. The downstream end had a sponge-type wave absorber to dissipate the energy of the incident wave and reduce the wave reflection effect. The bidirectional flow generation system was composed of the pumps, the flow pipe, the valve and the control system. The maximum discharge of the flow generation system was 2000 m³/h and the maximum operating frequency was 50 Hz with the accuracy of 3%.
A sand tank was located in the middle of the wave flume; the tank was 2.2 m long, 0.75 m wide and 0.33 m deep. The top of the sand tank was raised by 0.25 m through constructing a plywood floor on both sides. Two plywood ramps, with a gradient of 1:10, were built at the end of the floors to ensure a smooth transition of waves before entering the measurement section.
The sand tank was filled with uniform quartz sand to model the sandy seabed. To prepare the highly saturated soil sample, the sand was slowly poured into the sediment basin and stirred with water. The soil sample was then gradually introduced into the sand tank until the soil surface was level with the rigid surface. The soil was consolidated for 72 h under the water column with 0.4 m depth so that the settlement of the soil surface was negligible. The pipeline was installed in the trench after the soil consolidation and wave flume was filled with water to the designed depth. The basic physical parameters of the backfill soils are summarized in
Table 1.
In the experiment, wave height of 0.08 m, wave period of 1.2 s and water depth of 0.4 m were set as scenario T0. In scenario T0, fine sand with a median particle diameter of 0.15 mm was chosen as the seabed soil. The pipeline was made of acrylic with a smooth surface and its diameter D was 8 cm, the trench depth was 16 cm and the backfill depth was
, as shown in
Figure 2. Current velocity of 0.1 m/s, 0.2 m/s and 0.3 m/s, both the co-current actions (scenario A1–A3) and counter-current actions (scenario A4–A6), were investigated in this study. As shown in
Figure 2, the pore pressure around the pipeline was collected by four pore pressure gauges, denoted as P1, P2, P3 and P4, respectively. The pore pressure gauges beneath the pipeline with distances of 3 cm, 8 cm and 18 cm, corresponding to P5, P6 and P7, respectively, were used to measure pore pressure. The maximum range of the pore pressure gauge was 30 kPa with an accuracy of 0.1%. The free surface elevation and the vertical velocity were measured by wave height gauges and acoustic doppler velocity profilers (ADVP), respectively. The wave height measurement system consisted of the wave height gauge, the data acquisition toolbox and the analysis software. The measuring range of the wave height gauge was 50 cm, the measurement accuracy was 0.001 mm, and the sampling frequency was 400 Hz. The profile resolution of ADVP was 1 mm with the sampling frequency of 100 Hz, the flow velocity range was 0–3 m/s and the accuracy was 1 mm/s.
After opening the wave-making system with the wave reaching a steady state, the flow generation system was started. By reading the ADVP data, pore pressure could be collected when the wave–current action was stable.
5. Conclusions
In this study, the variation of the pore pressure around the pipeline under the wave-current interaction was explored by physical model tests. The influence of the backfill depth, the properties of backfill sands and current parameters on the dynamic response within the seabed were investigated.
With the increase of the backfill depth, the dimensionless pore pressure amplitude within the seabed gradually decreases, and it also decreases at adjacent backfill depths under all wave–current actions. This means the backfilling effect gradually weakens. Under the pure wave action, the dimensionless pore pressure amplitude beneath the pipeline decreases by more than 40% when the backfill depth increases from 0 to half of the pipeline diameter. When the relative backfill depth increases to 3/2 and 2, the pore pressure amplitude has almost no attenuation beyond one pipeline diameter beneath the pipeline.
With the increase of the backfill depth, the amplification/reduction of the pore pressure amplitude decreases under the co-current/counter-current actions, which means the current effect on the dynamic response within the seabed decreases. The reduction of the pore pressure amplitude at the adjacent backfill depth increases/decreases with the increase of the co-current/counter-current velocity. Similarly, the amplitude attenuation of the pore pressure increases with the increase of the co-current velocity along the depth direction, and vice versa.
When the trench was backfilled with medium sand, the pore pressure amplitude around the pipeline showed little difference from that without backfill, even when the relative backfill depth reached 2. This indicates that medium sand is not suitable to be used as backfill material for pipeline protection. The attenuation gradient of the pore pressure amplitude in silt seabed, within the range of half pipeline diameter beneath the pipeline, was greater than that in the fine sand seabed when the pipeline was half or completely buried.
The pore pressure amplitudes at the wave-approach and wave-back sides increased slightly within the silty seabed under co-current actions. However, there was little difference of the response degree on the current within the fine and medium sand seabed. The maximum increase was about 10% in the co-current actions, and the maximum decrease was about 20% in the counter-current actions along the pipeline surface when compared to the pure wave action. Beneath the pipeline, the response of silt and fine sand on the current was basically the same, and it was smaller than that of medium sand under the co-current actions. The decrease of the dimensionless pore pressure within the fine sand was greater than that of the other backfill materials under the counter-current actions.


