
Design of an Innovative Hybrid Sandwich Protective Device for Offshore Structures

 , ,
, ,  ,
,  ,
,  and
and 
Abstract
:1. Introduction
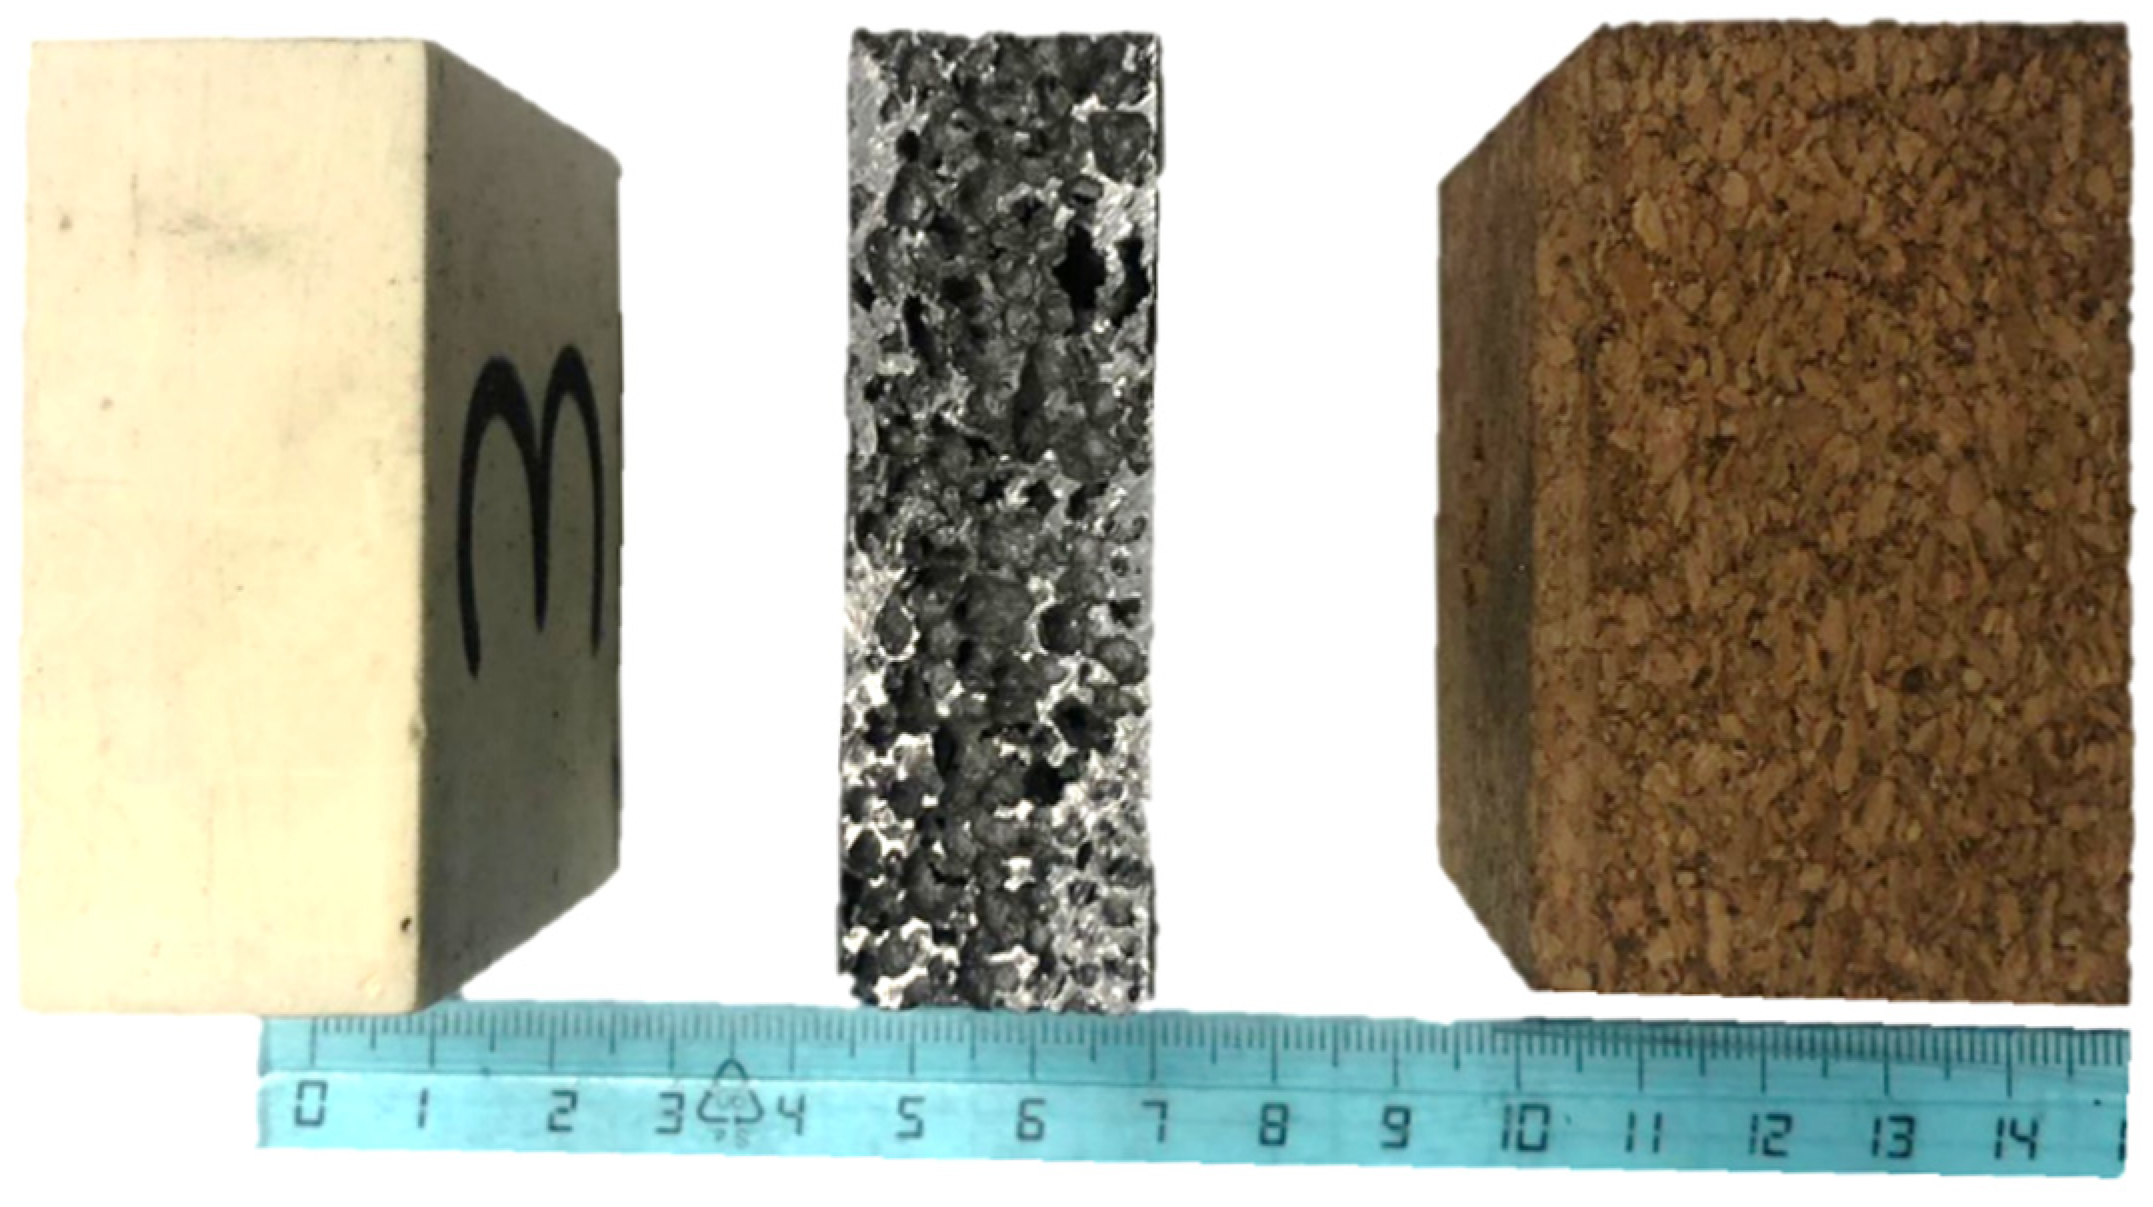
2. Materials and Methods
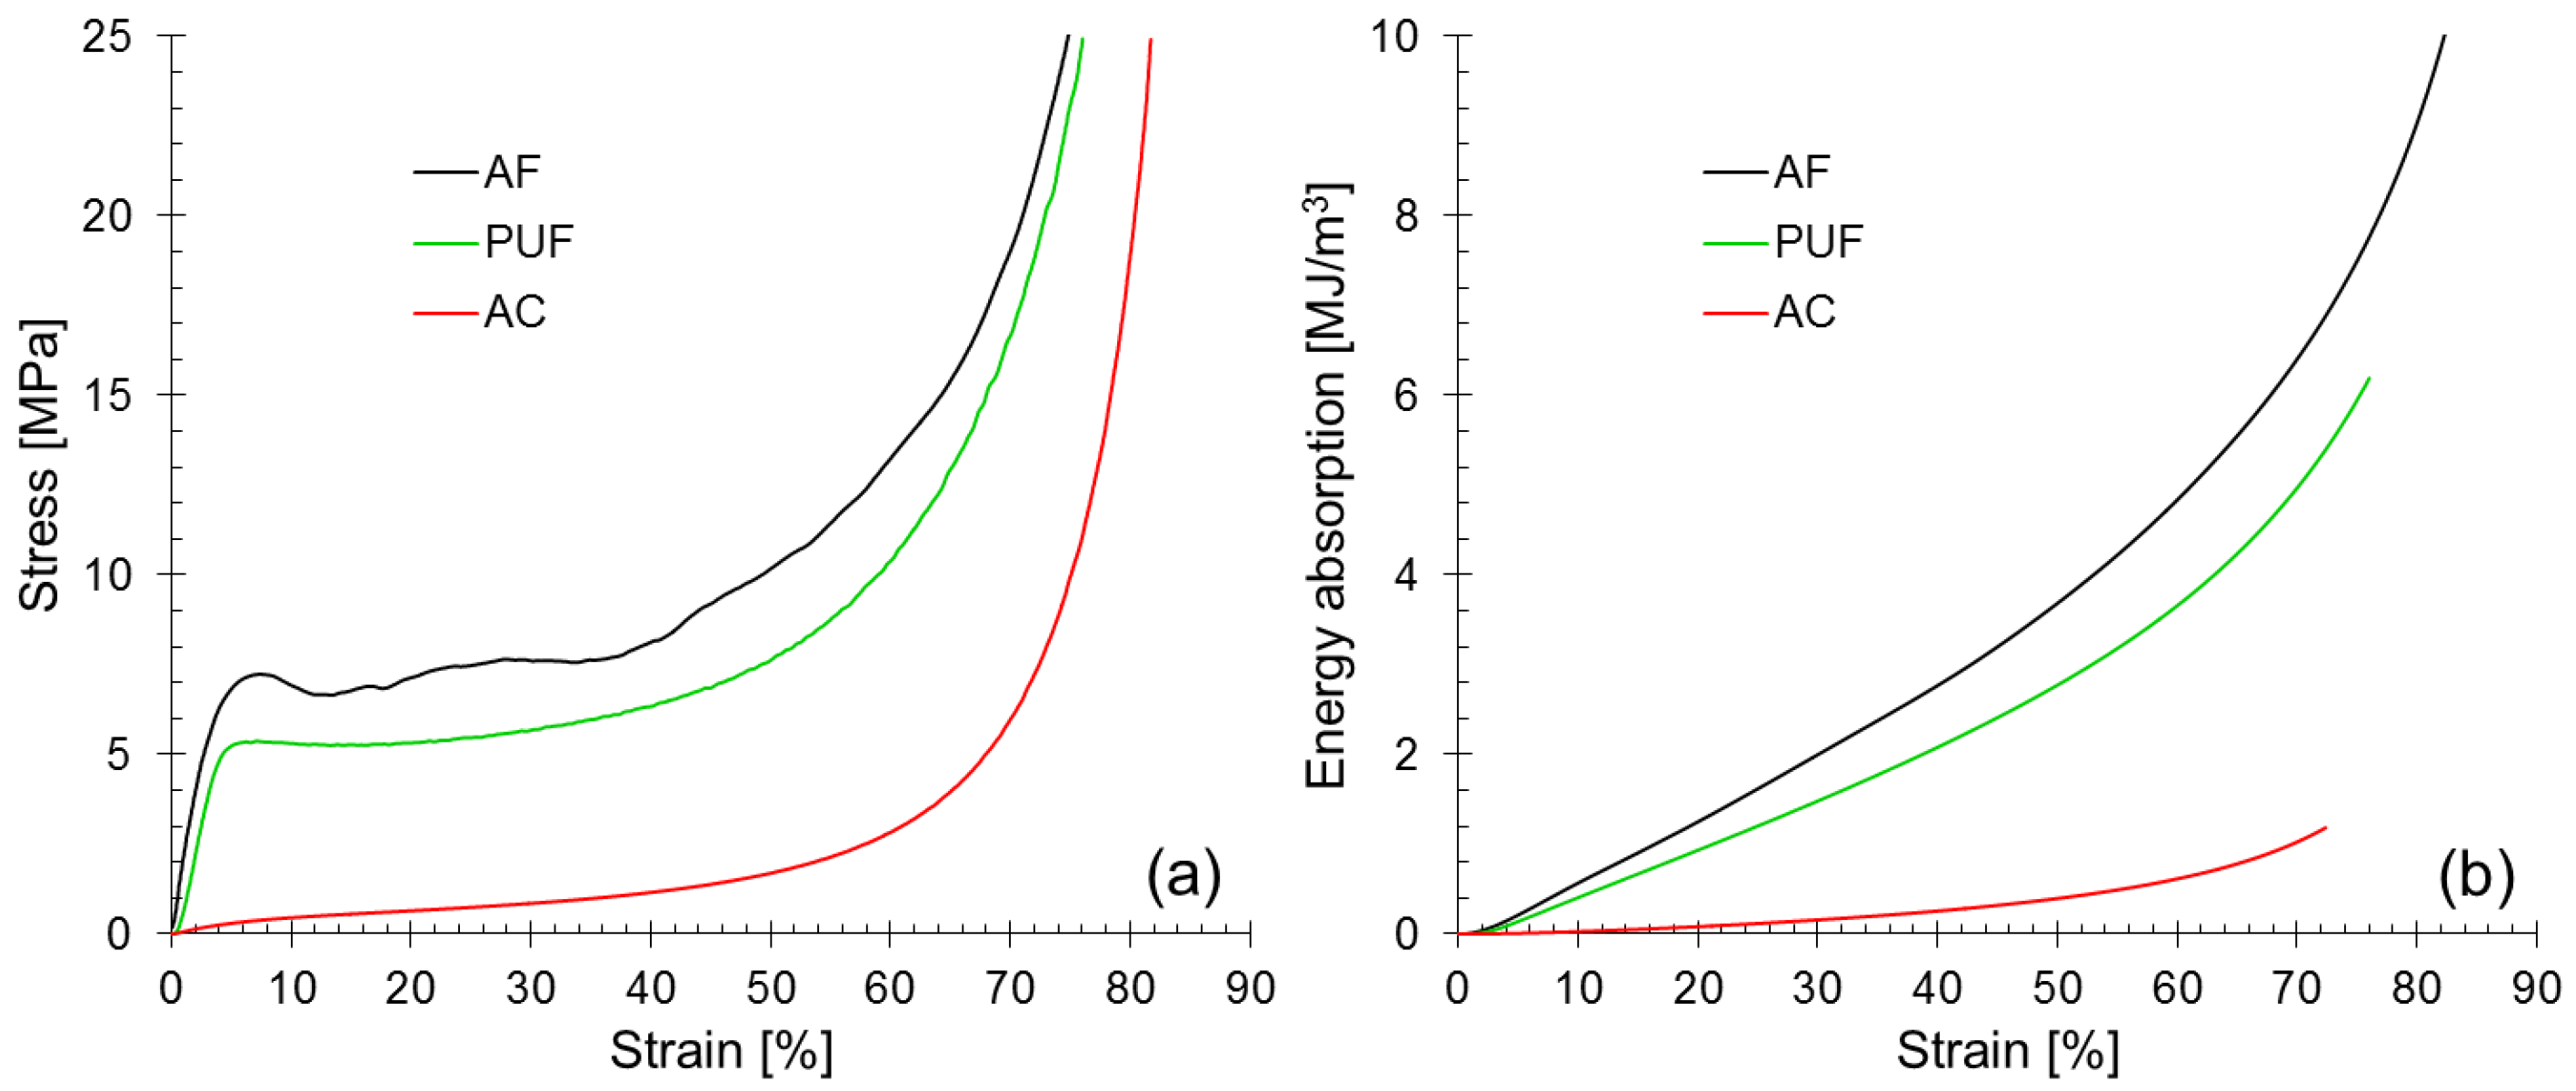
3. Results and Discussions
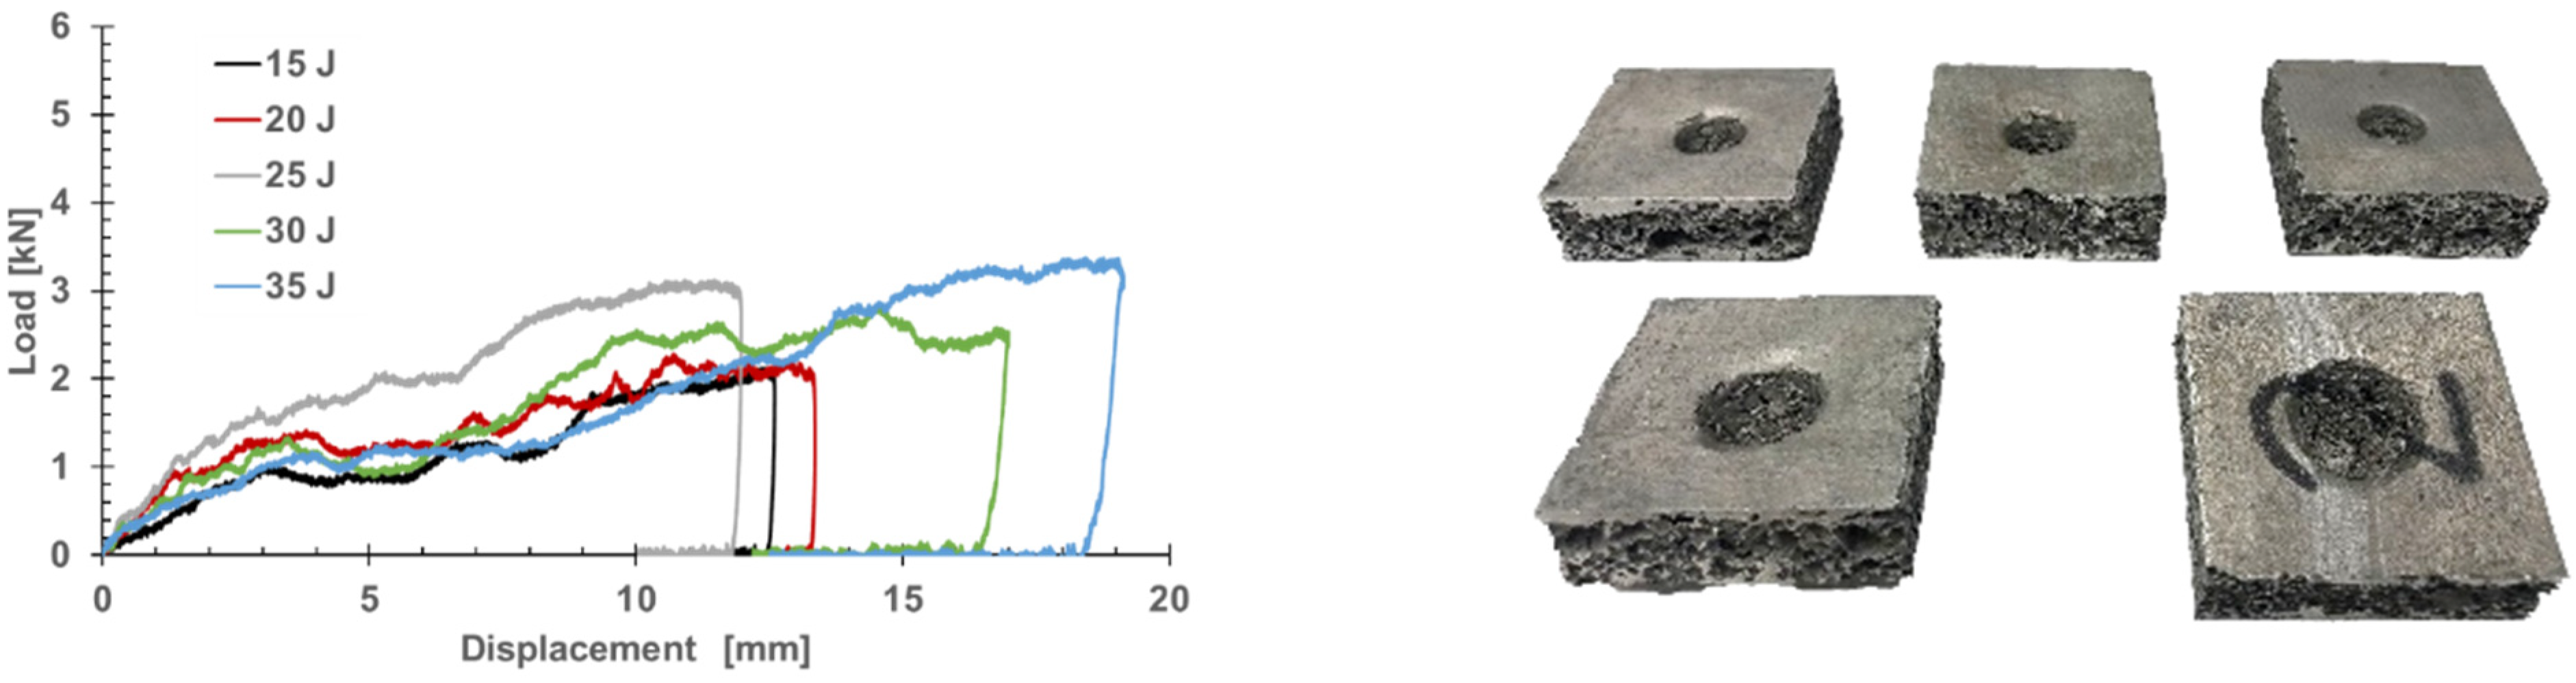
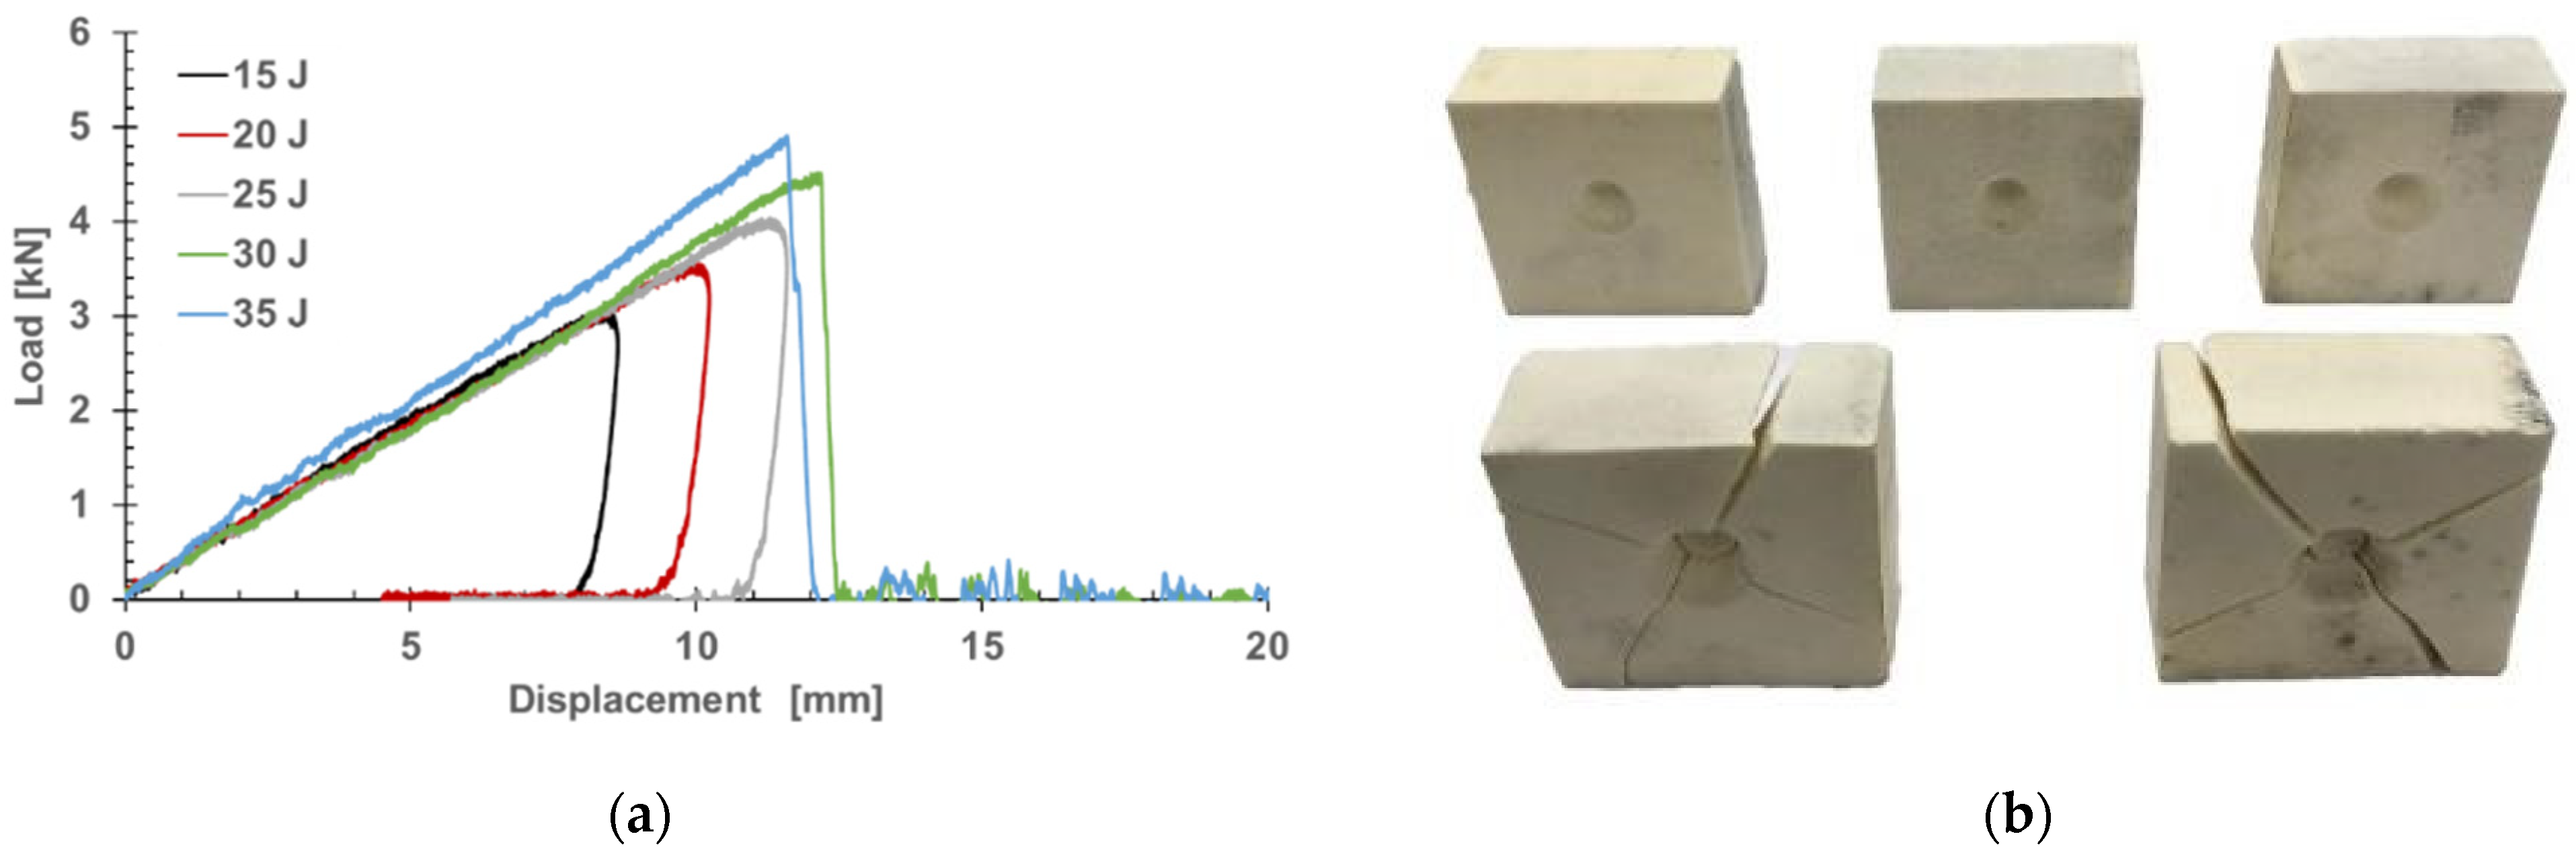
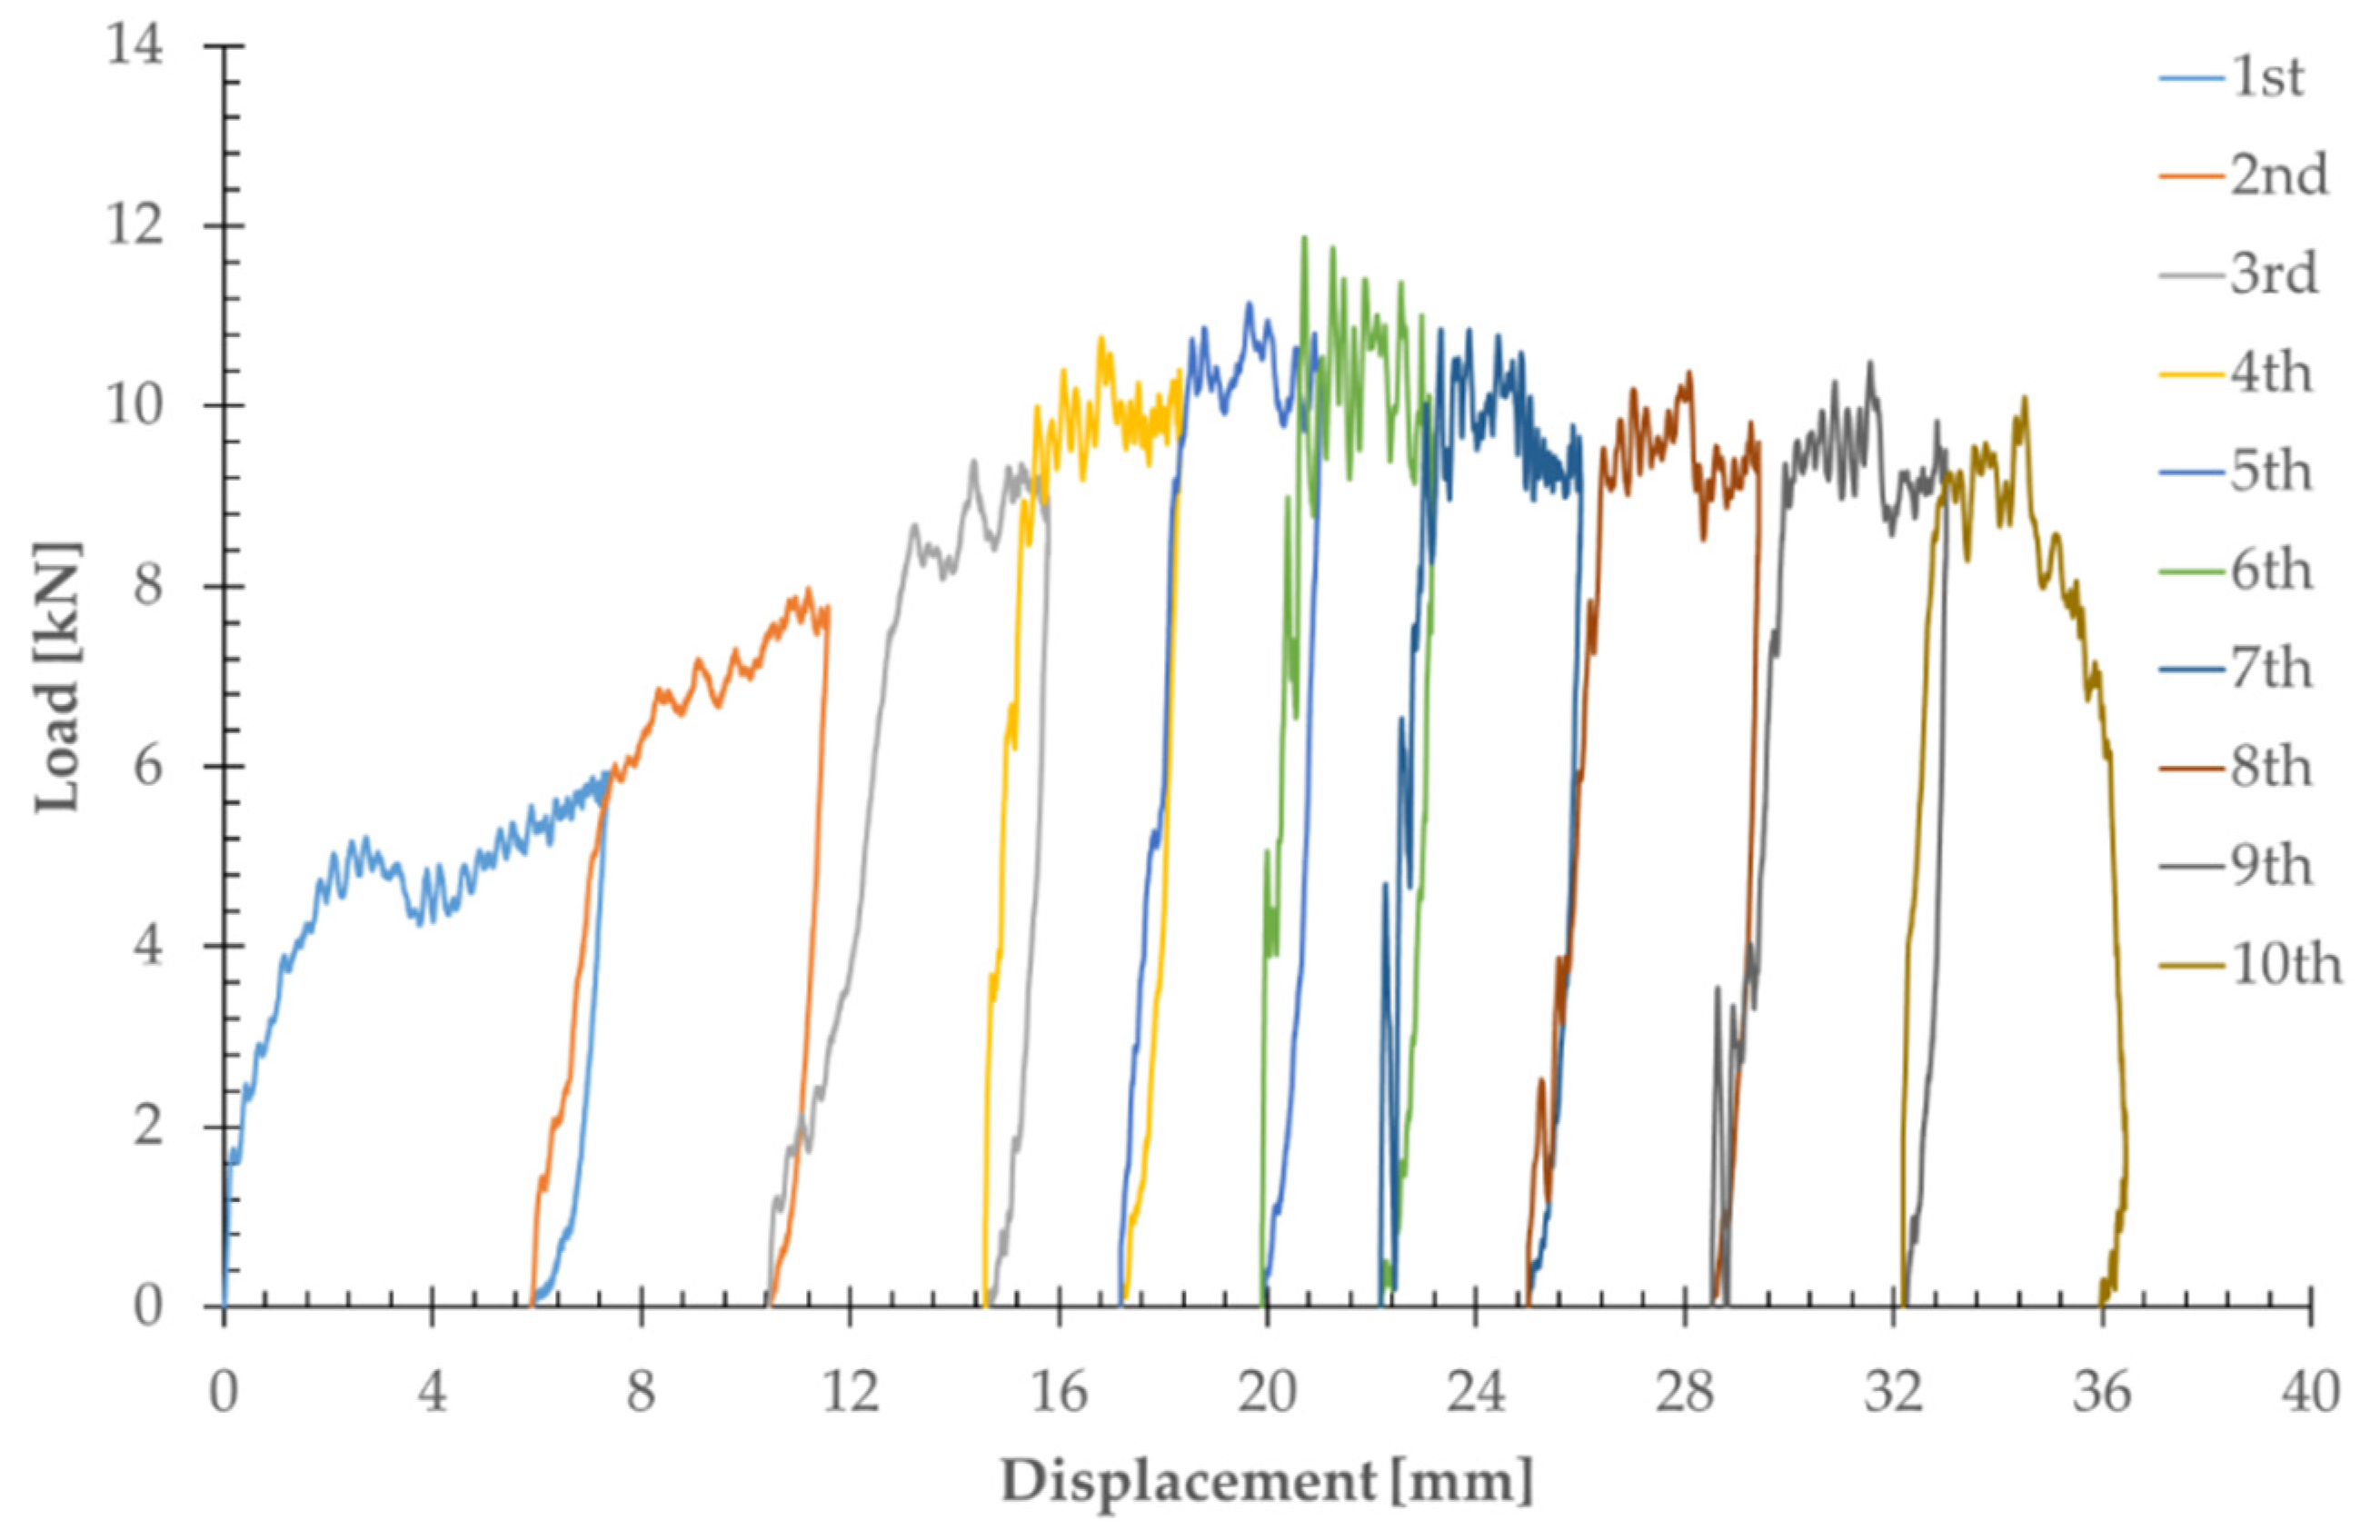
3.1. Experimental Tests
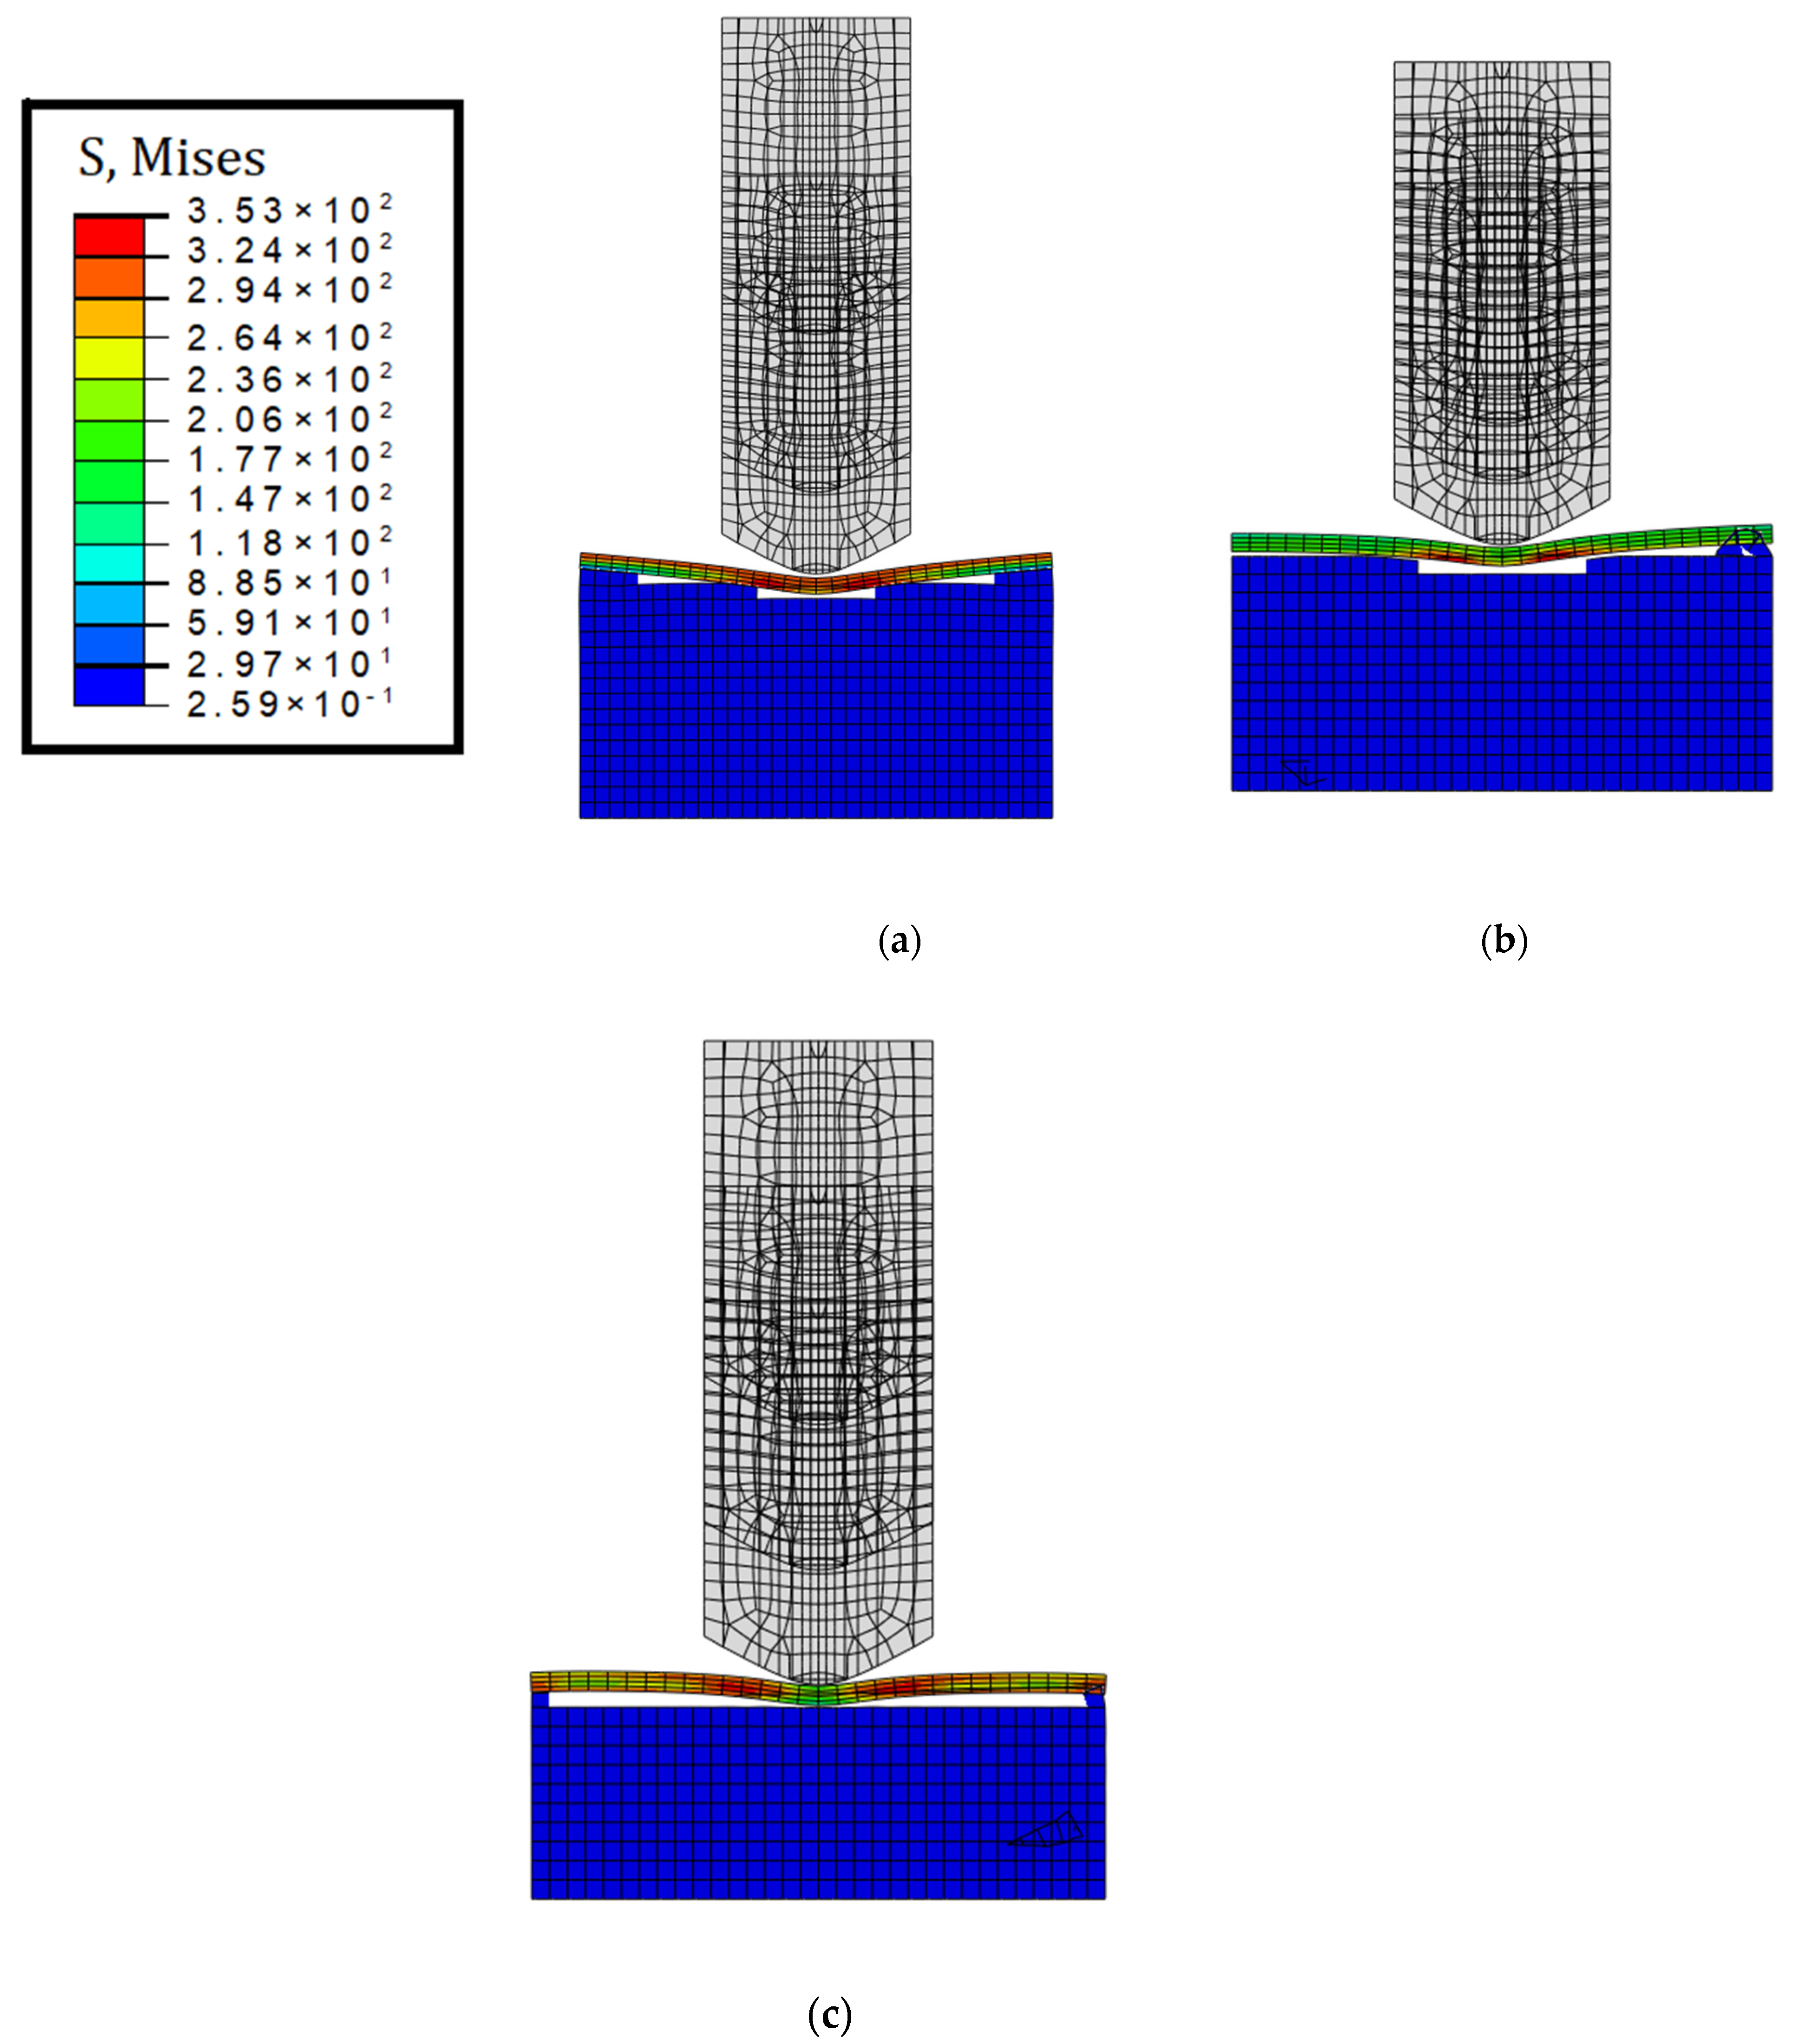
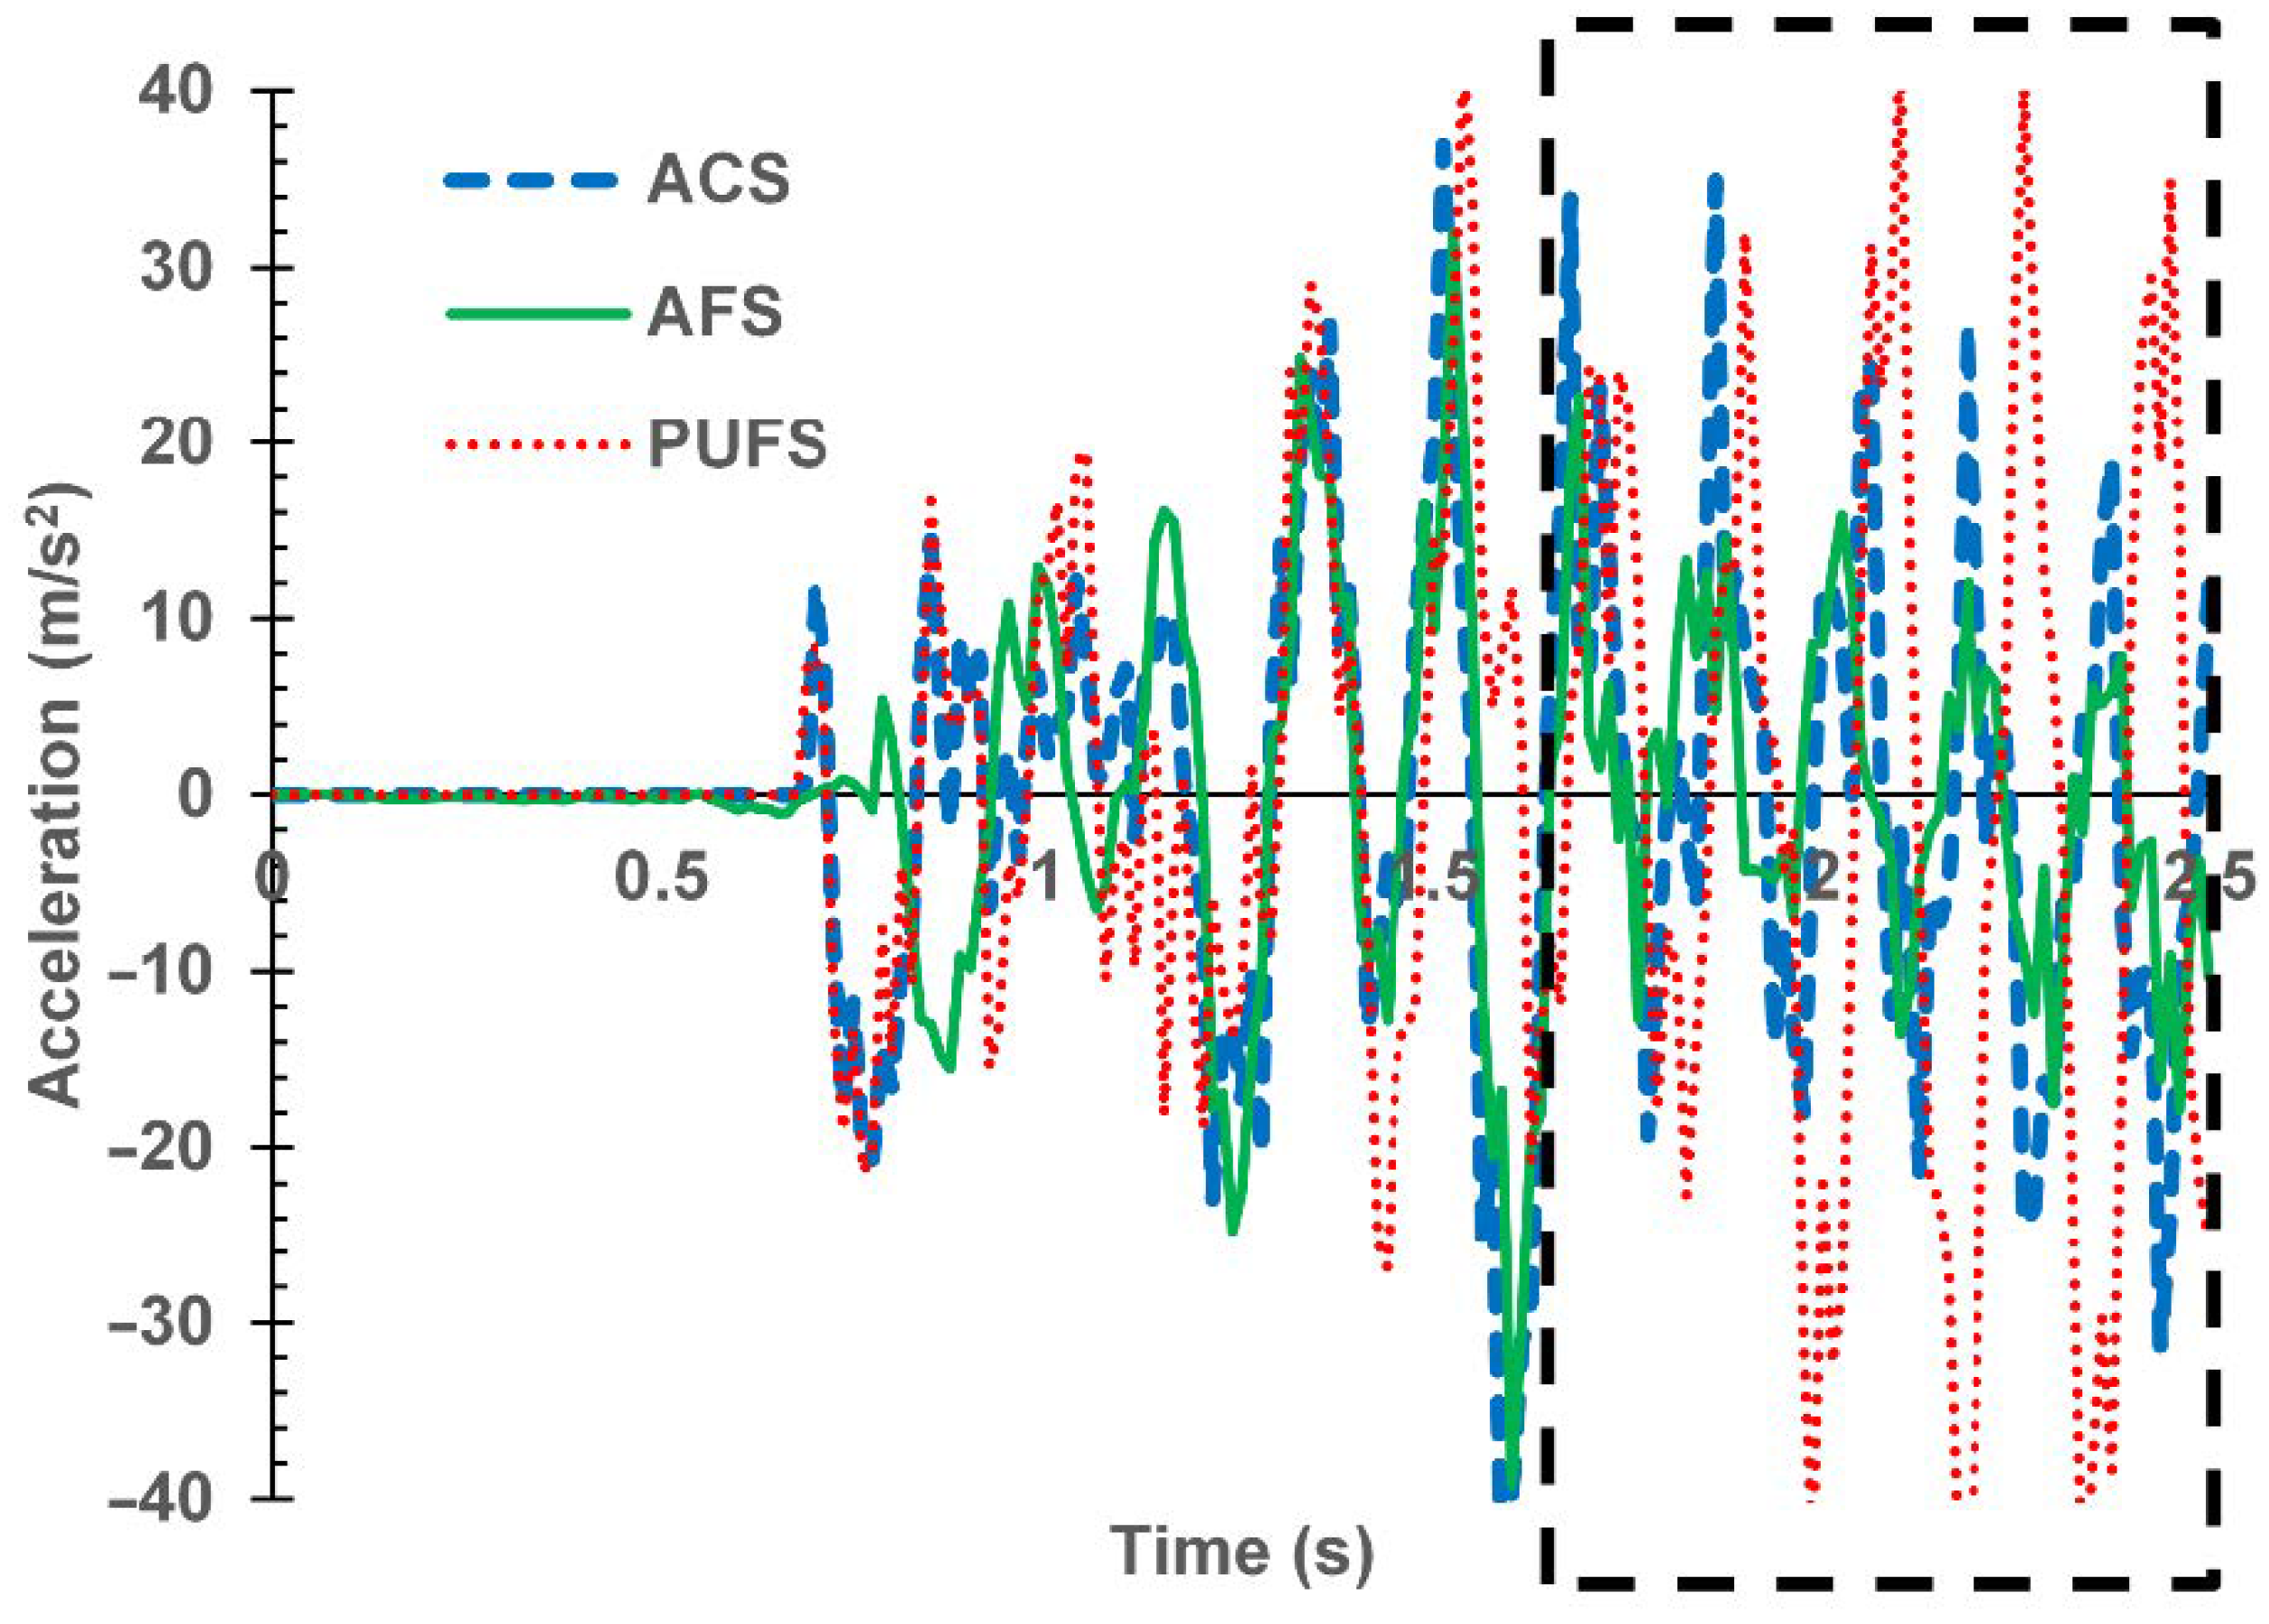
3.2. Finite Element Analyses of Lightweight Panels under Single and Multiple Impacts
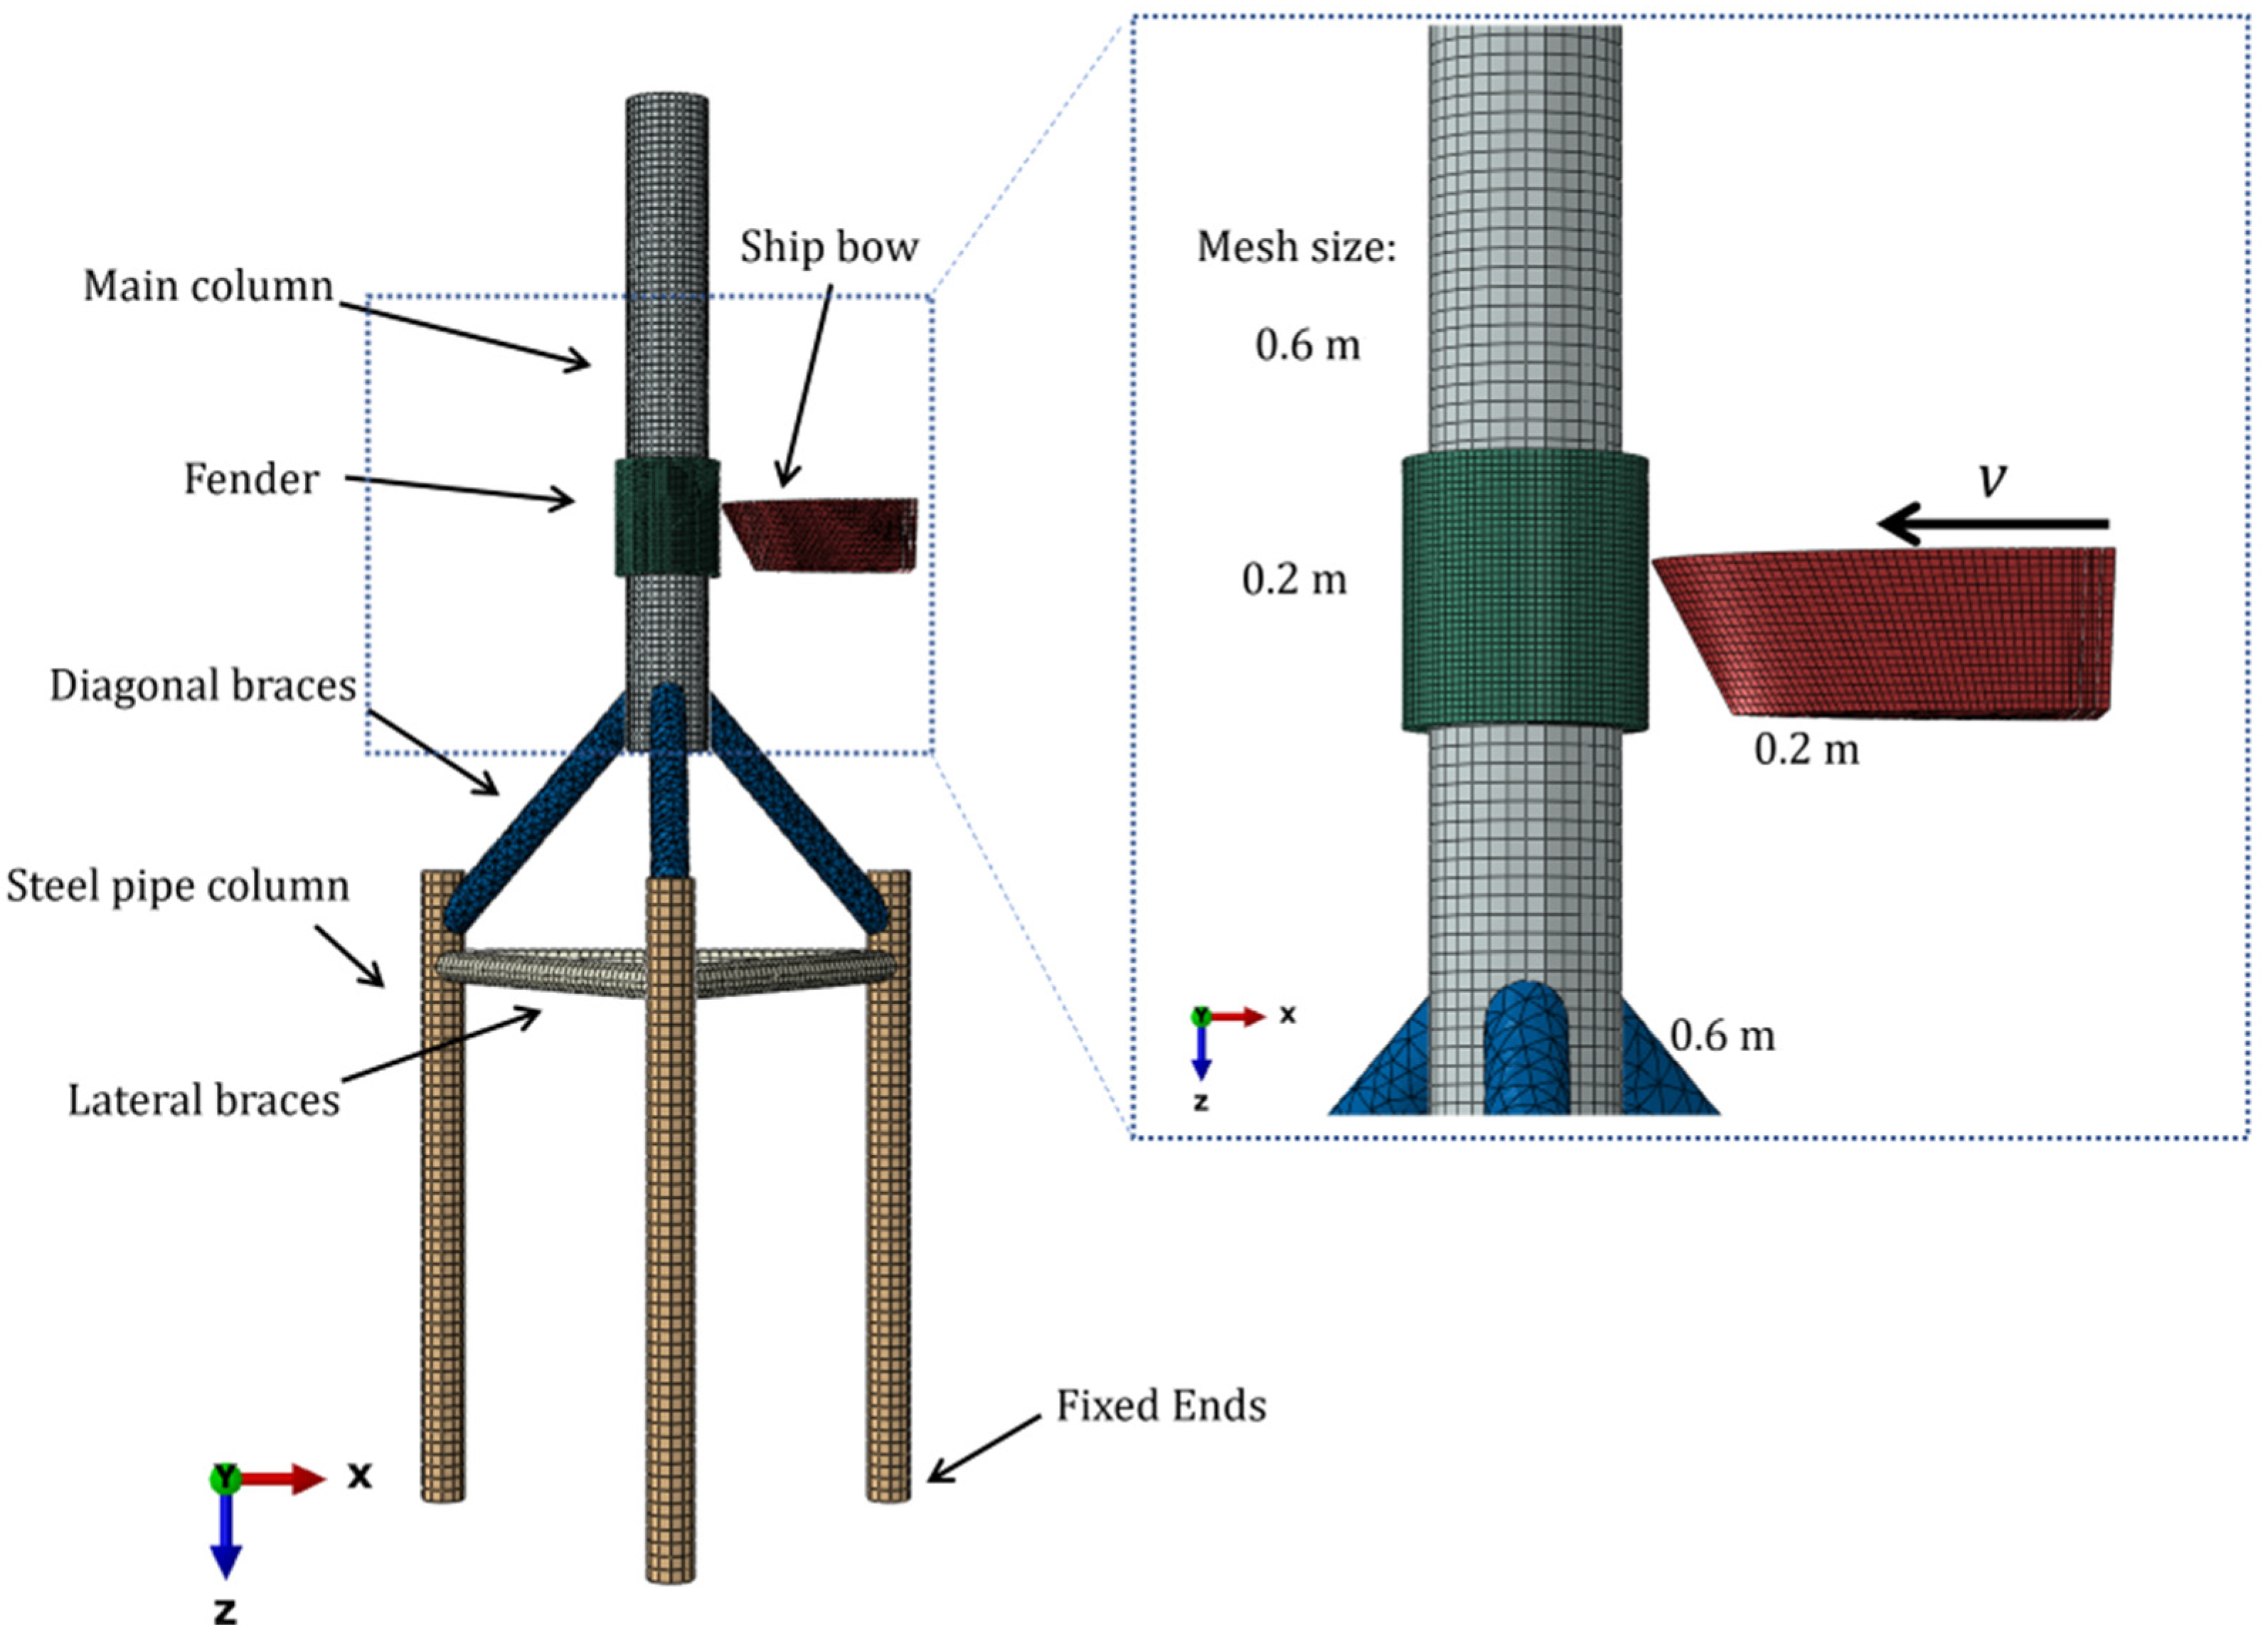
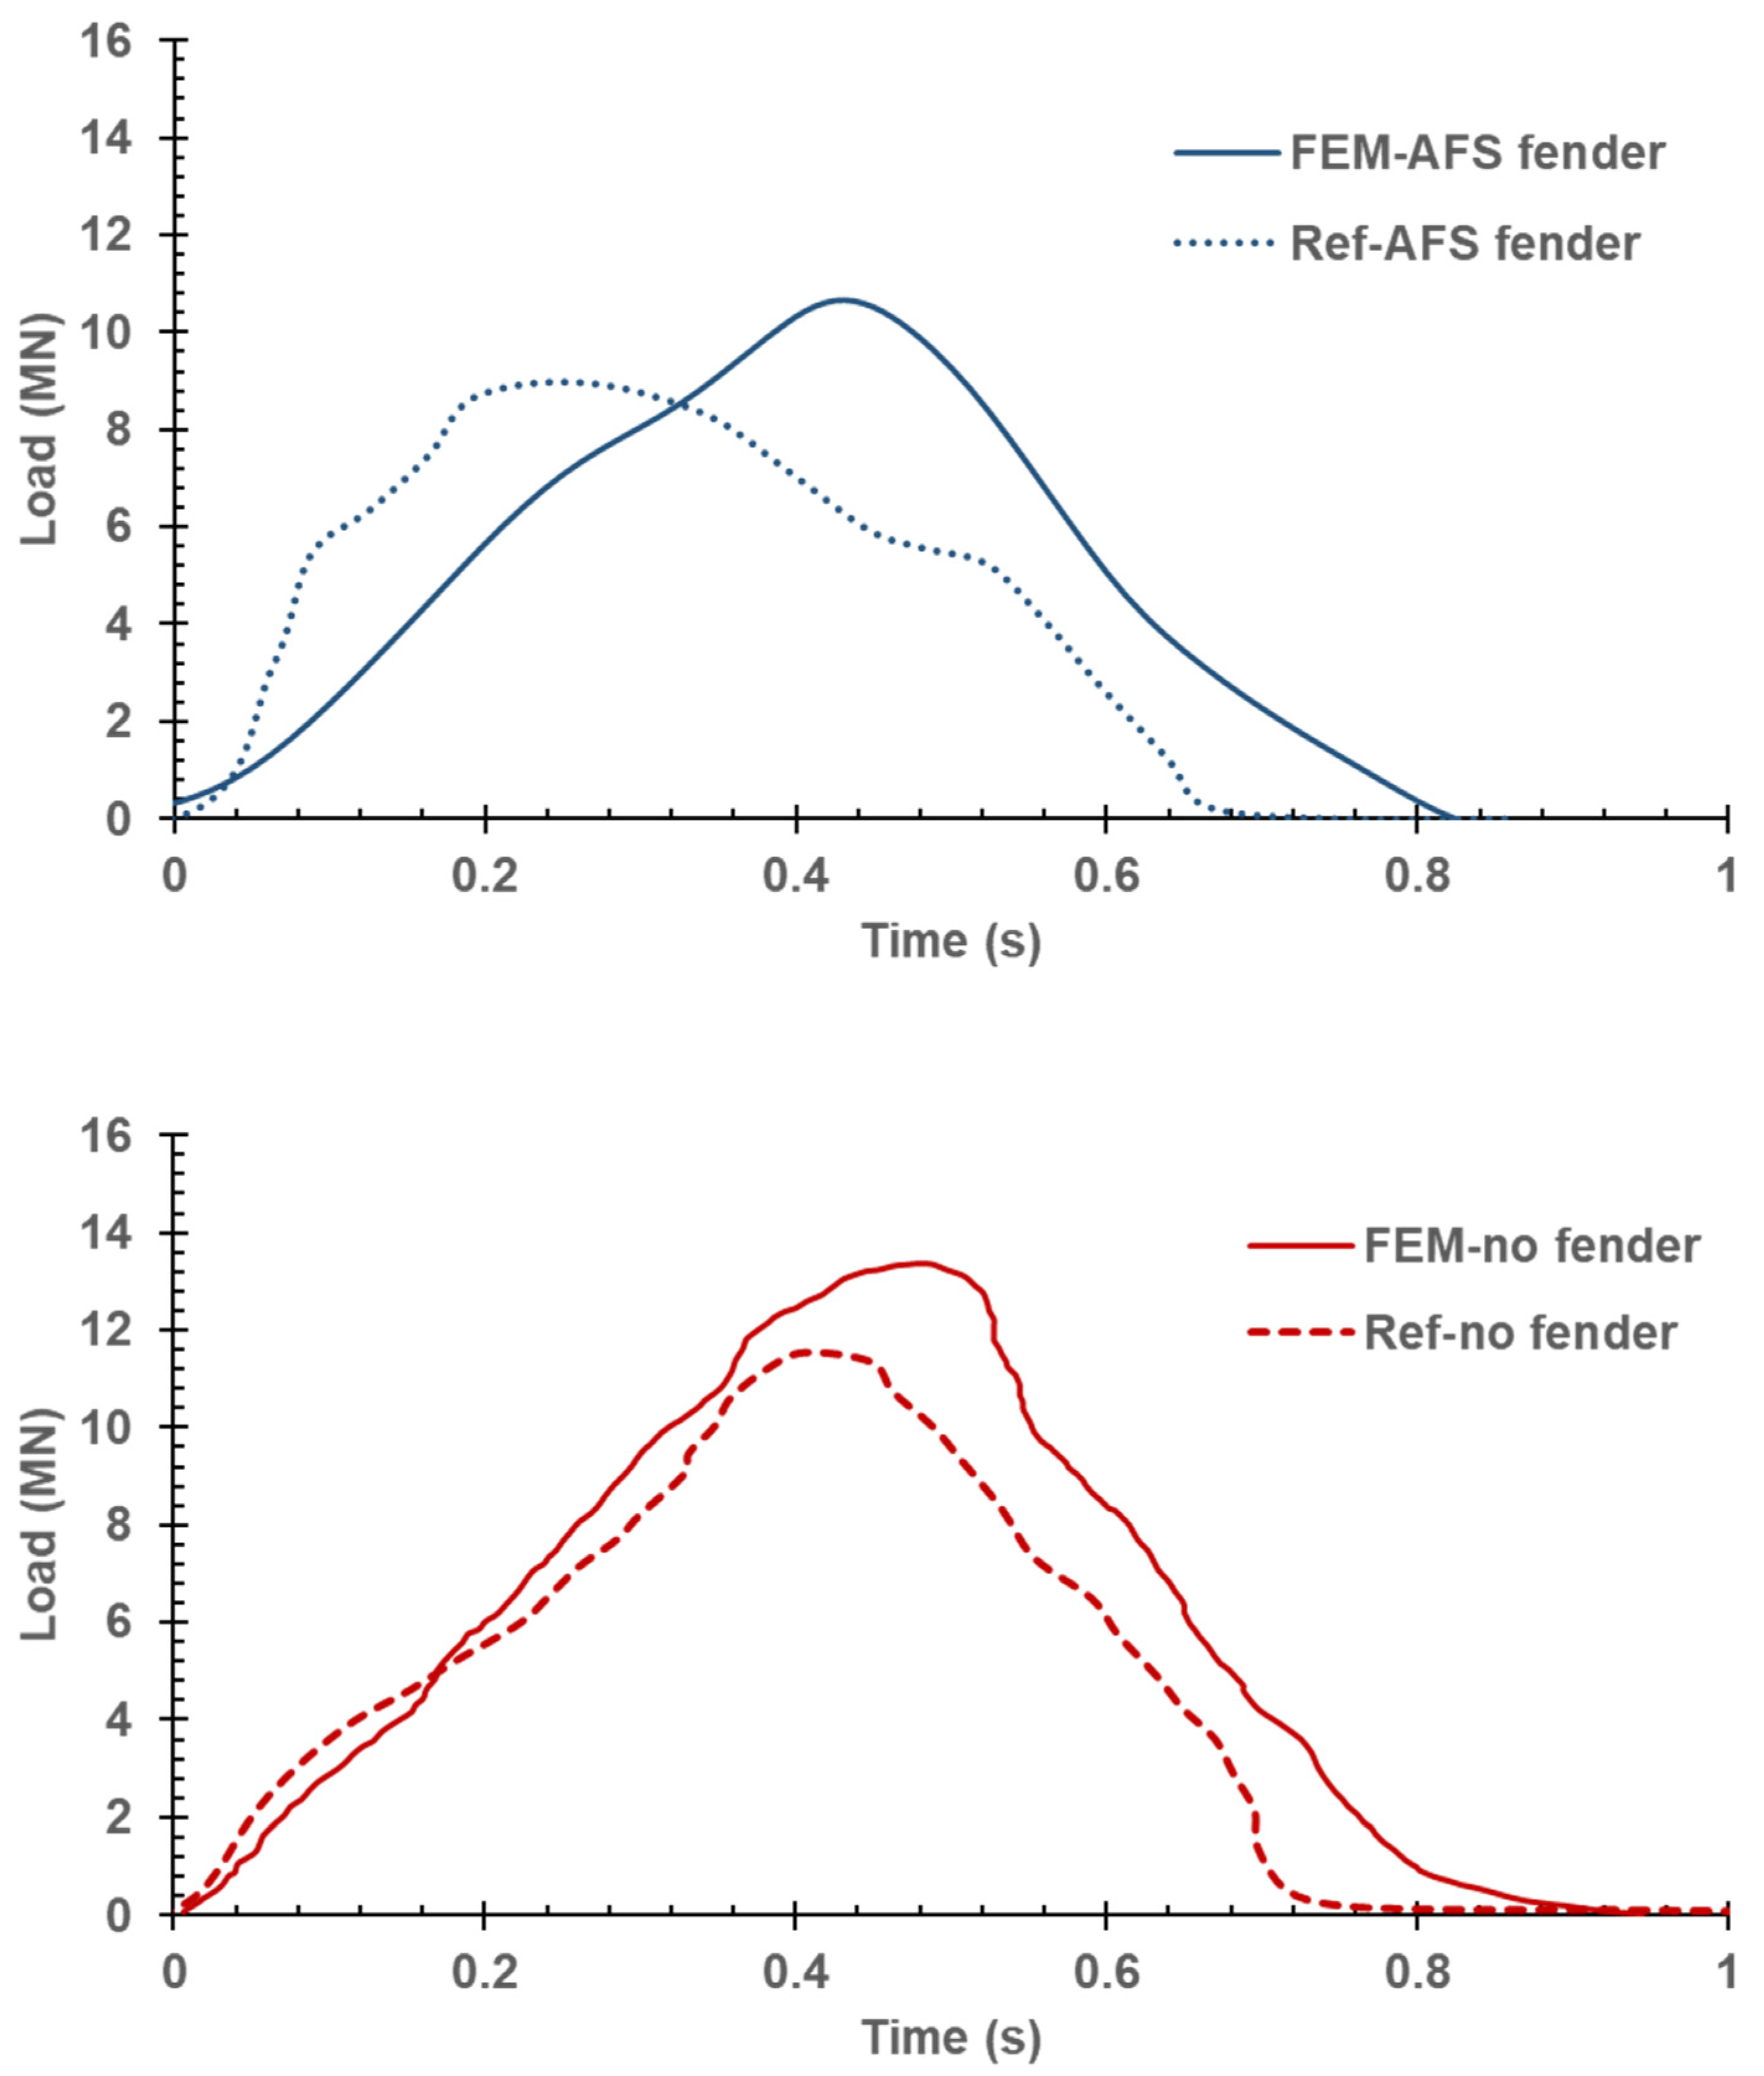
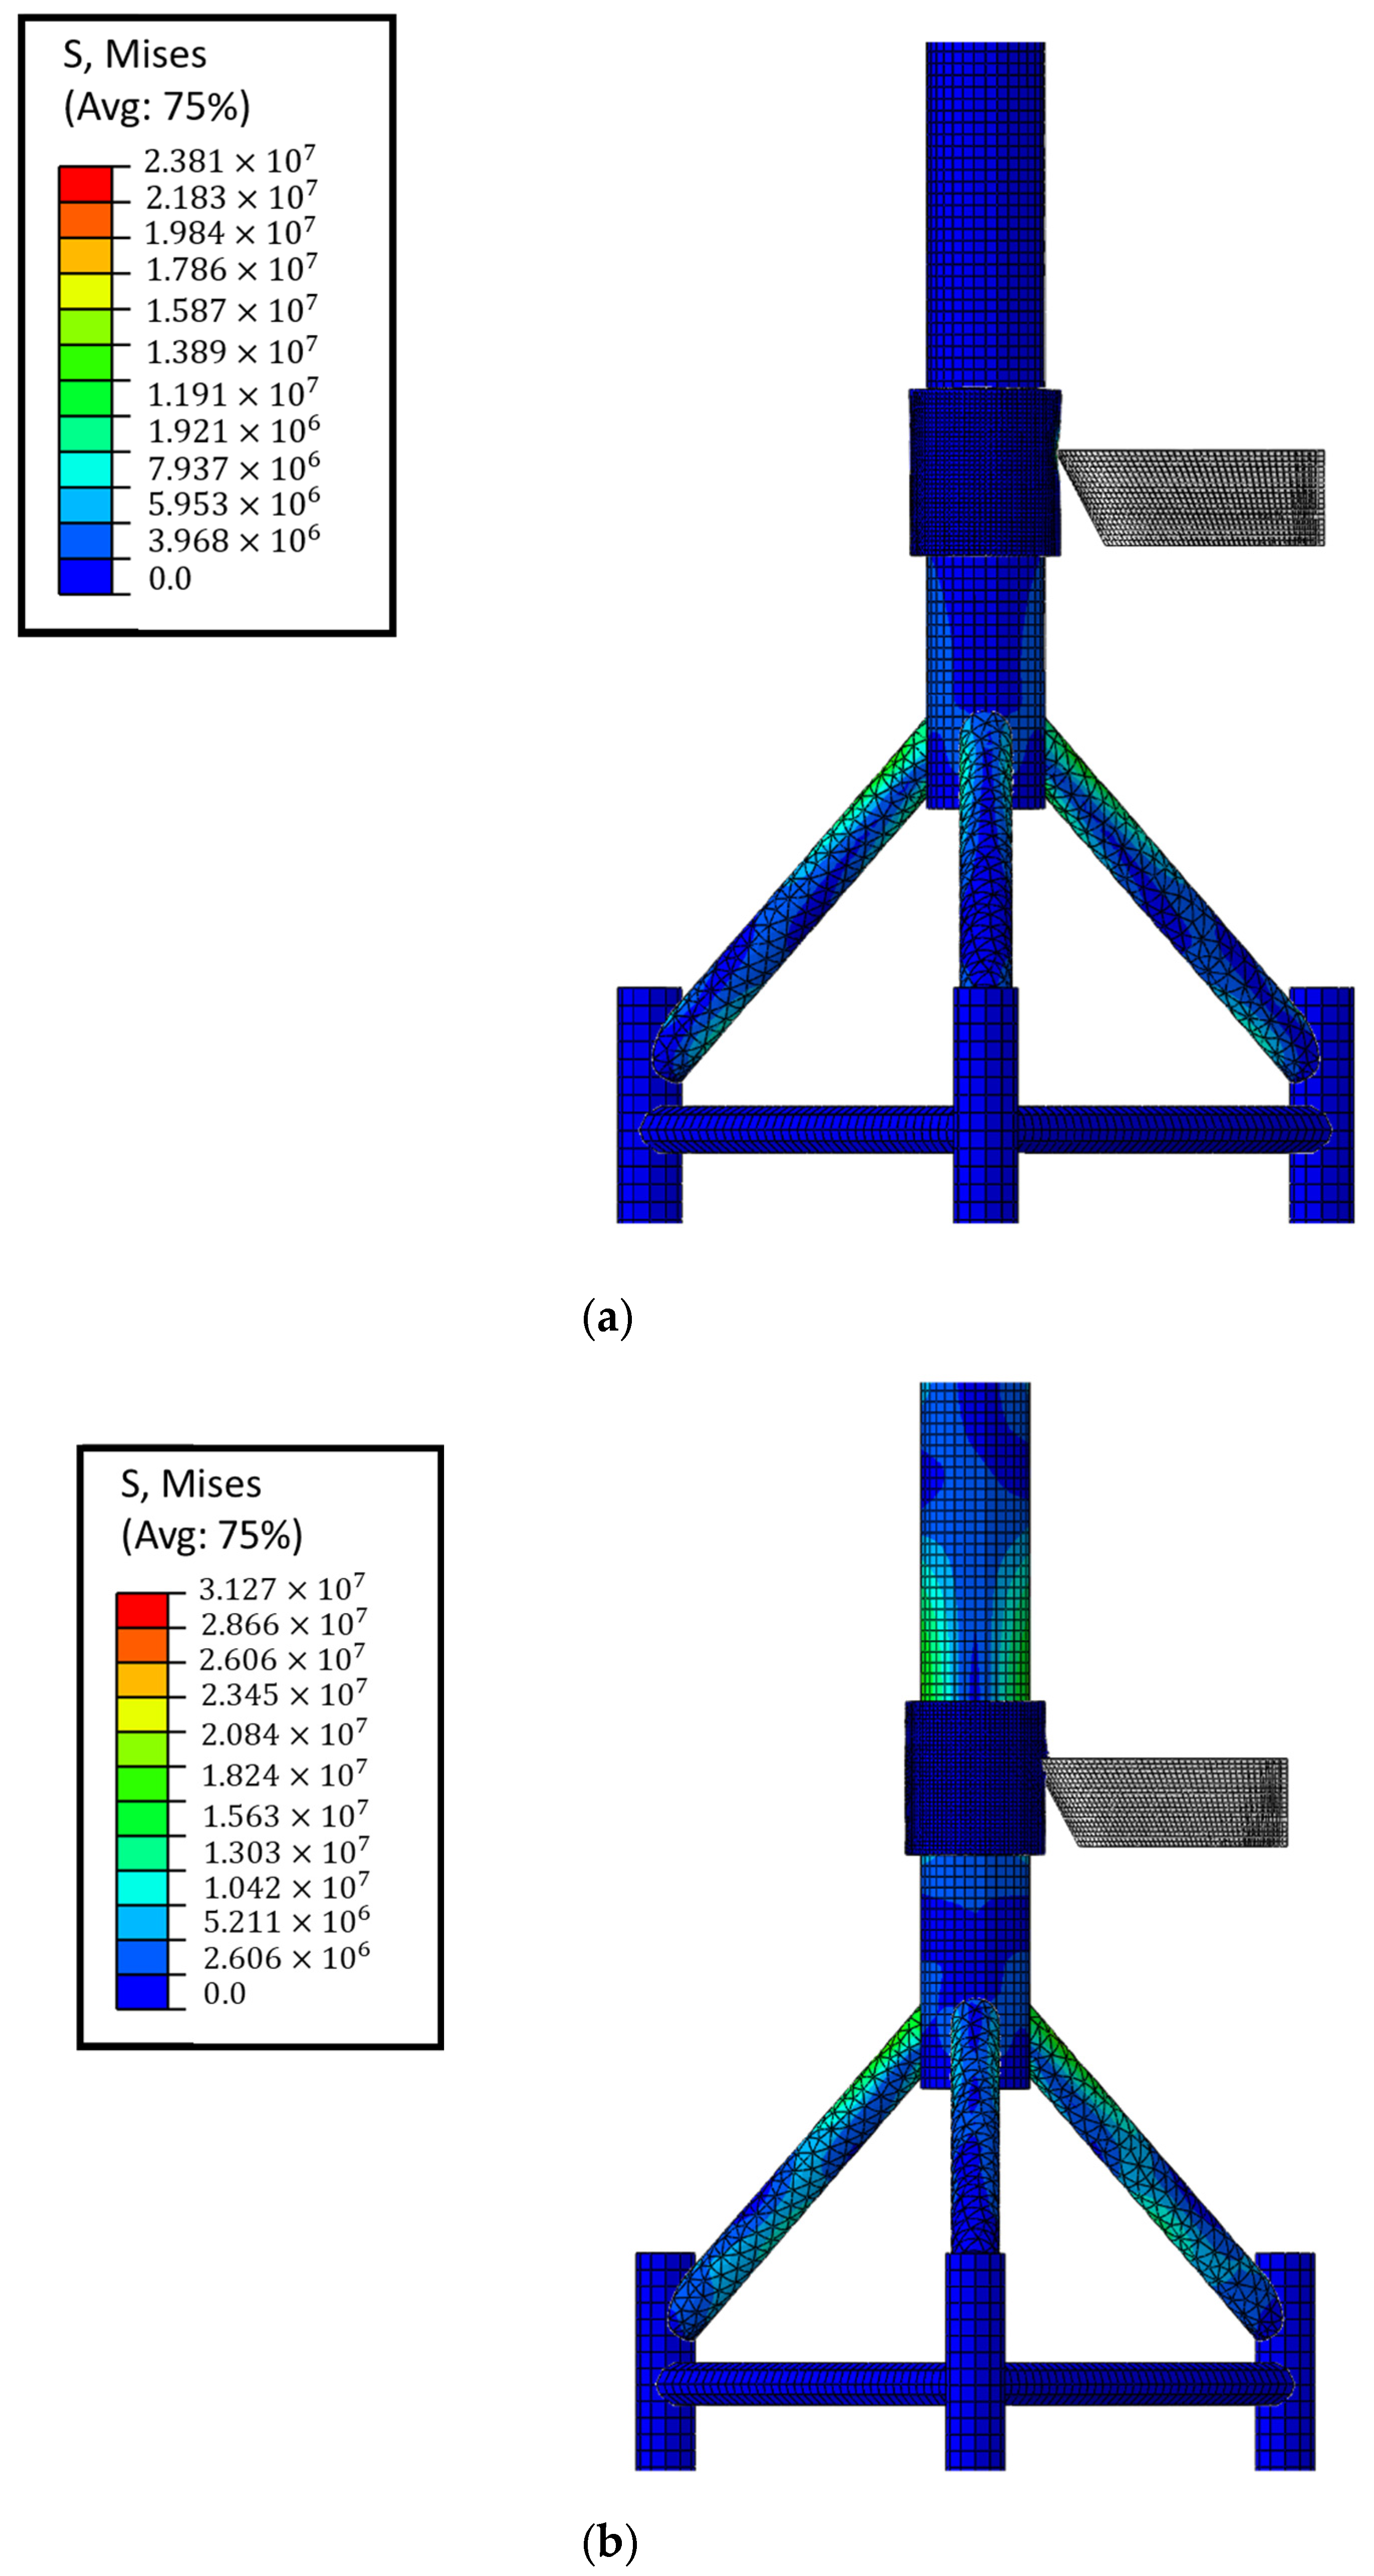
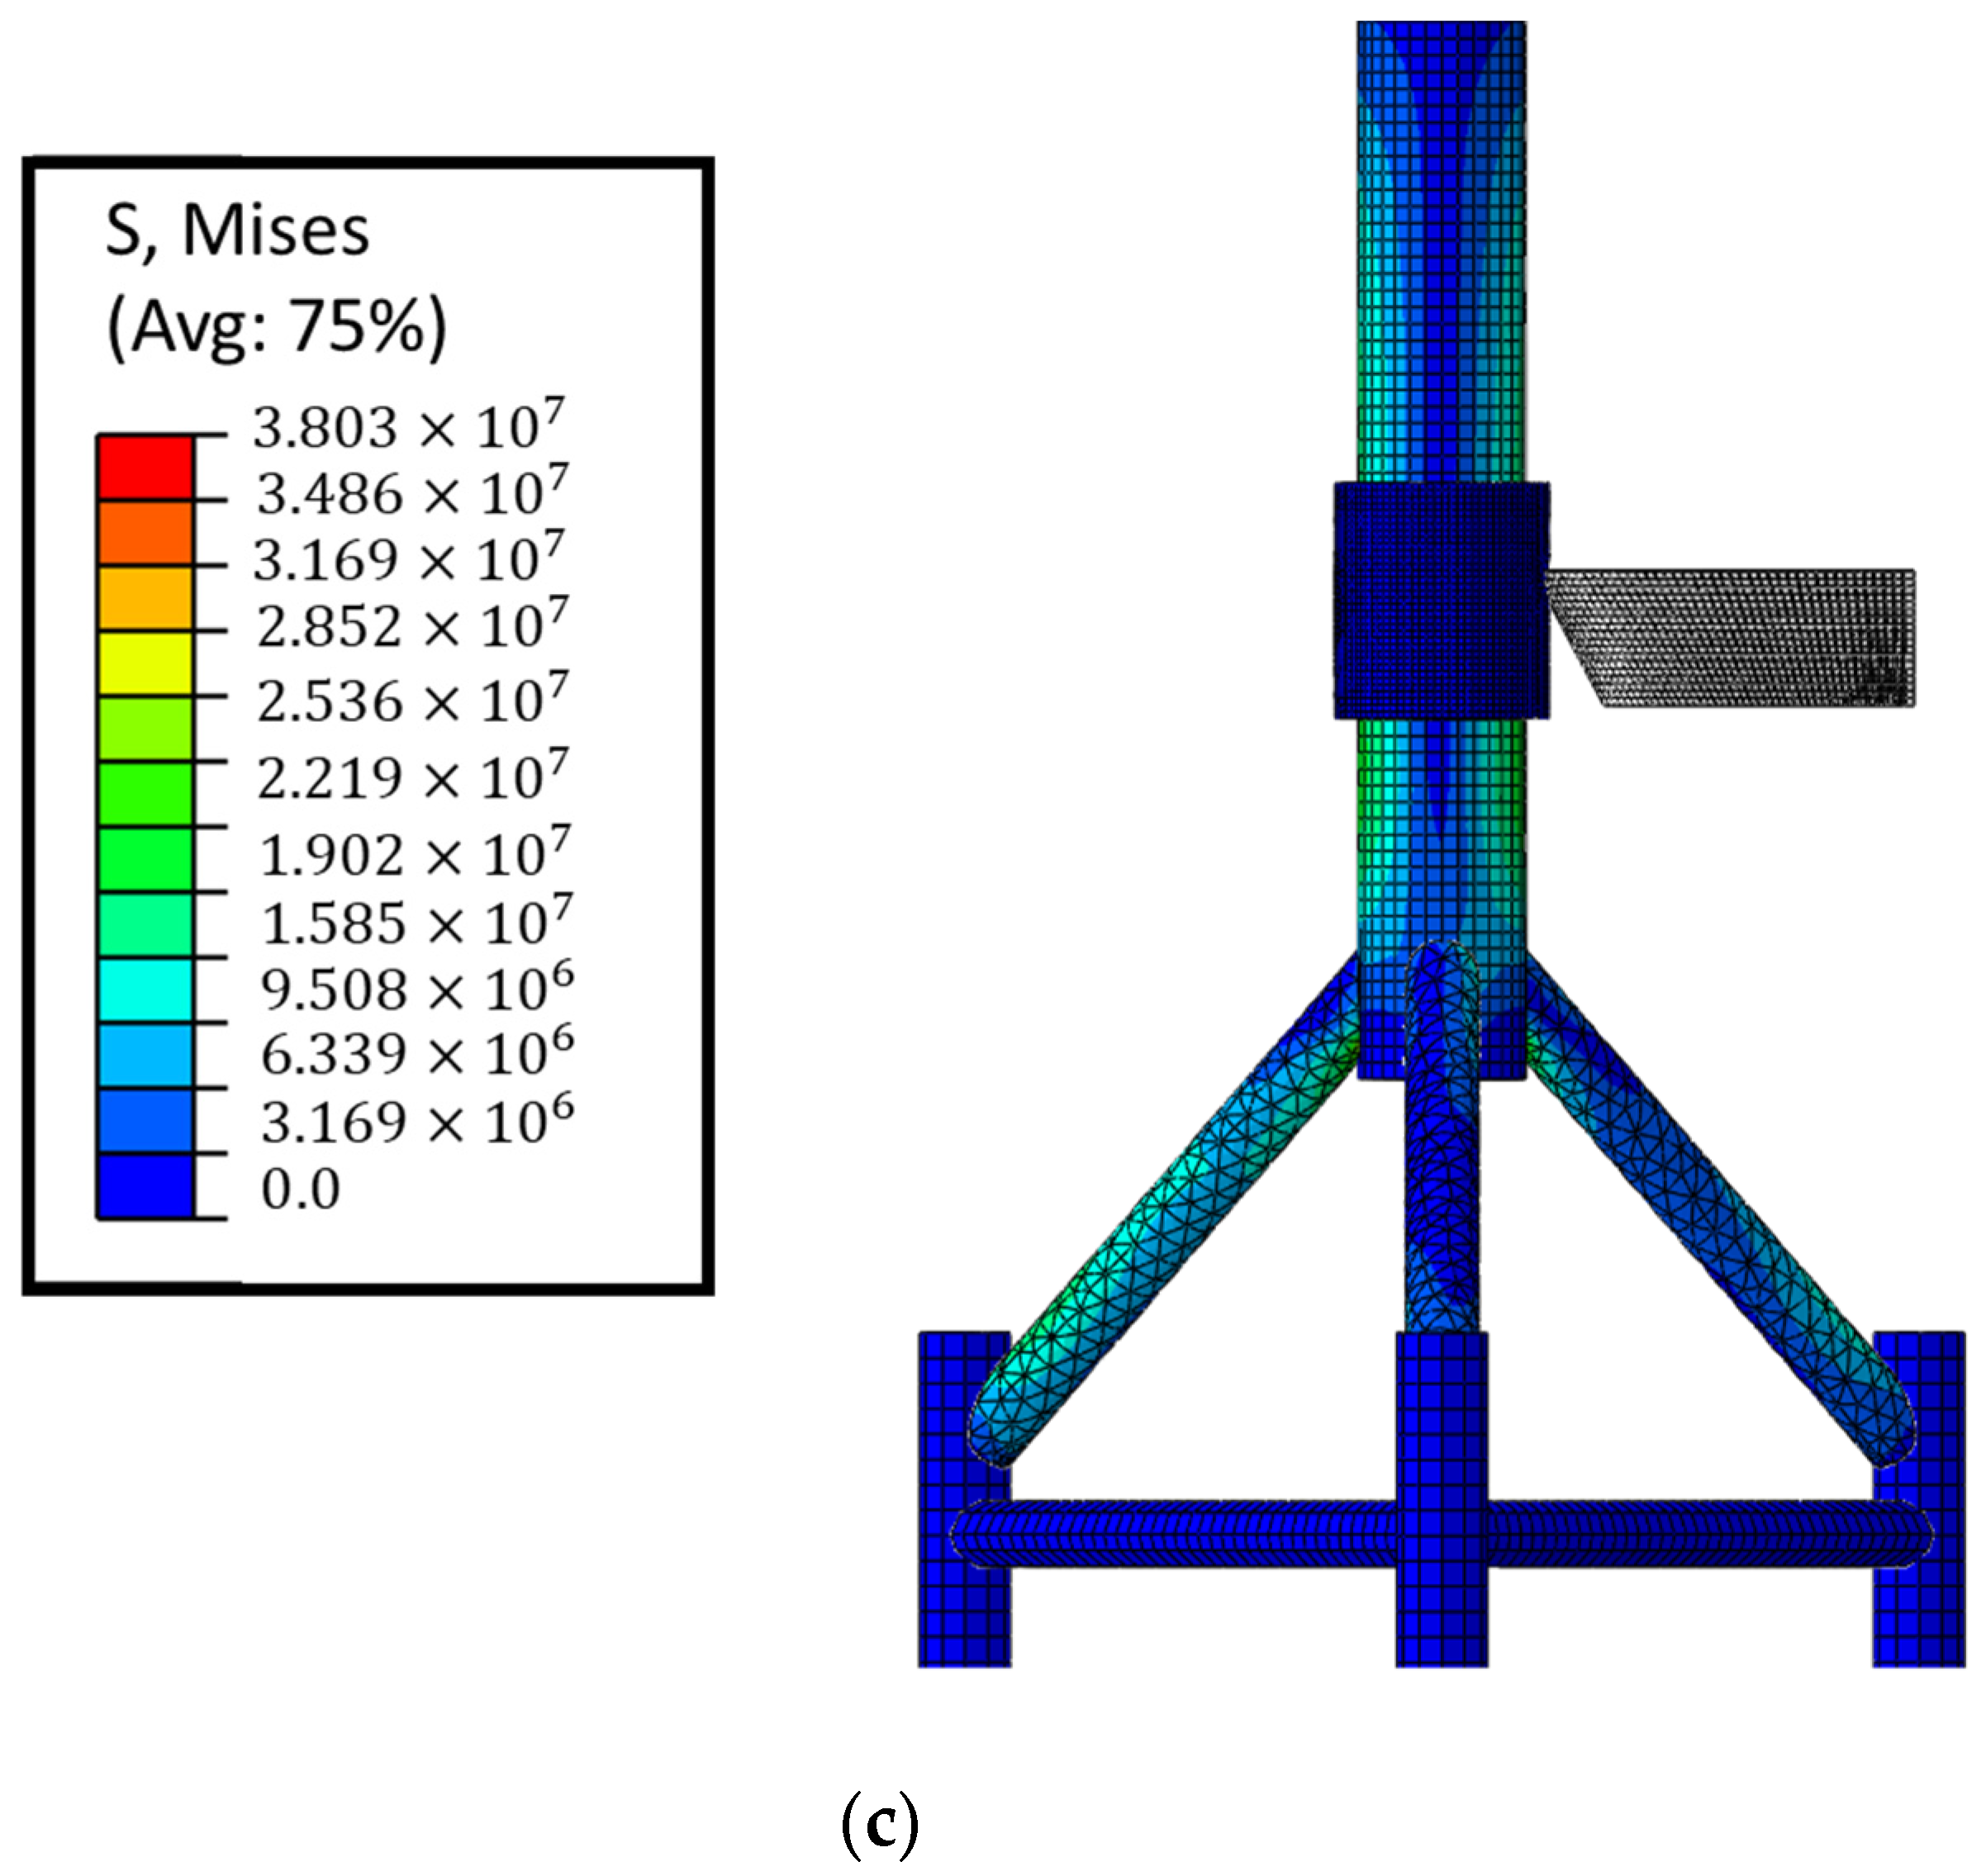
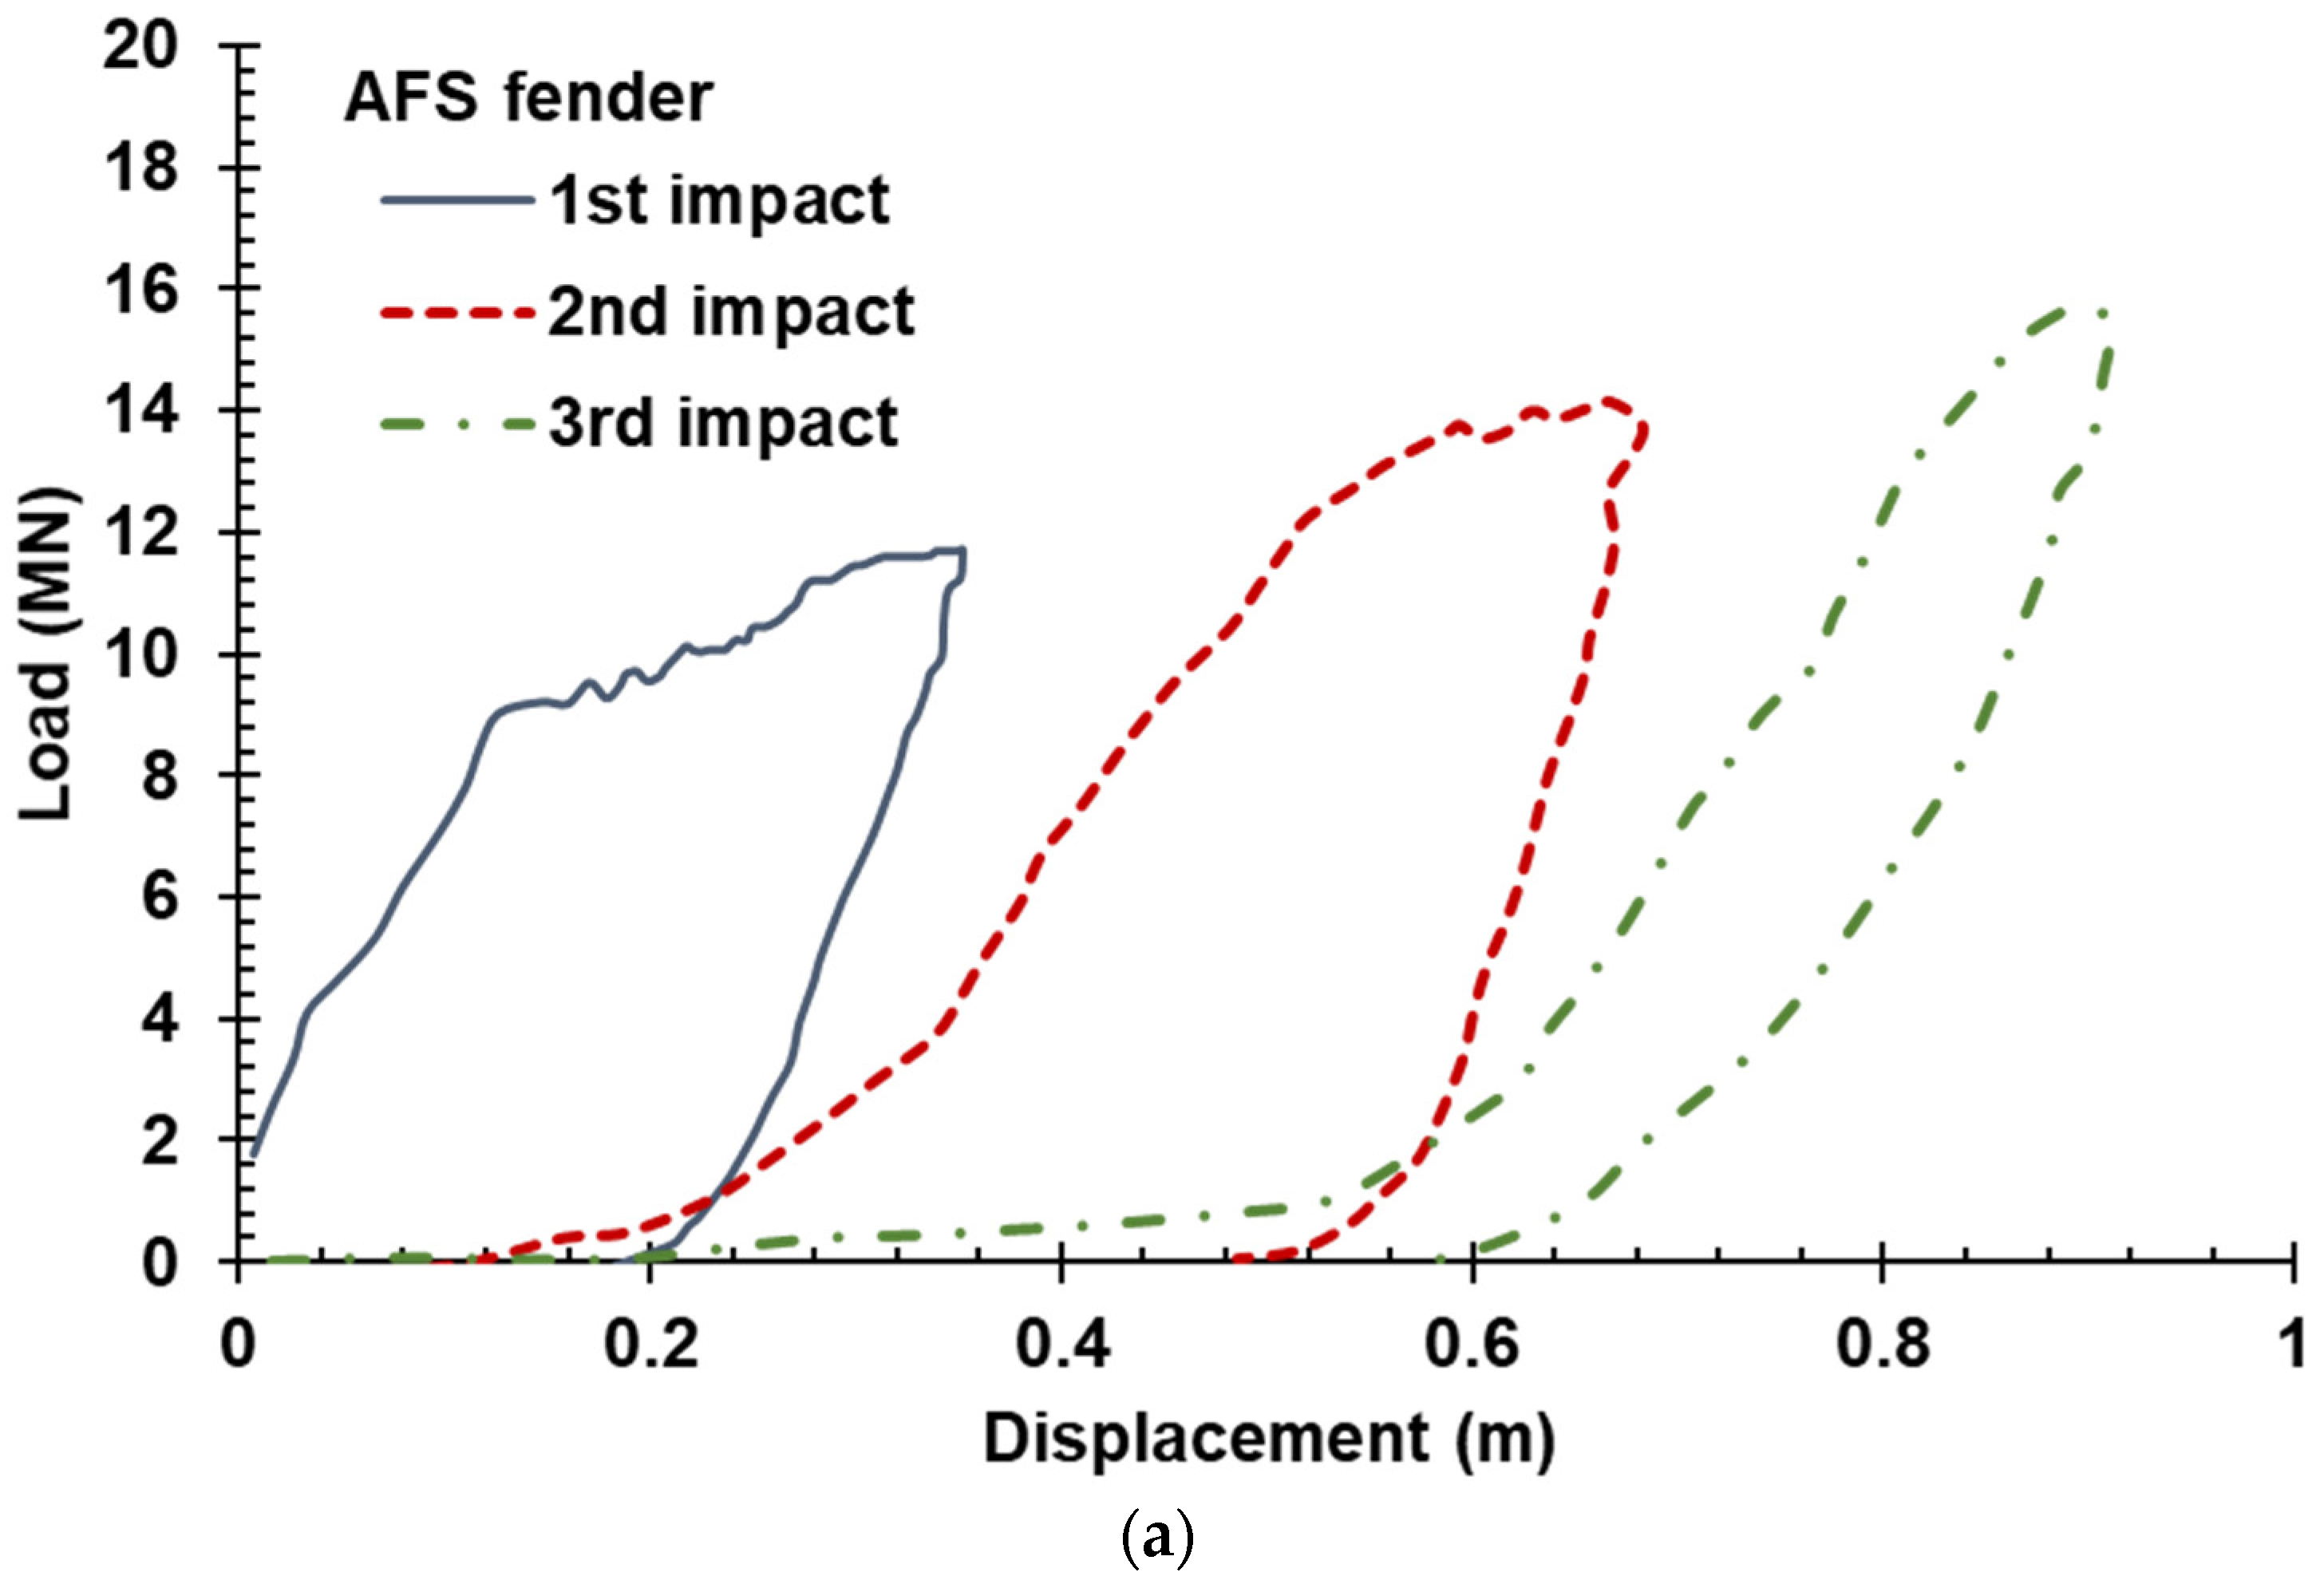
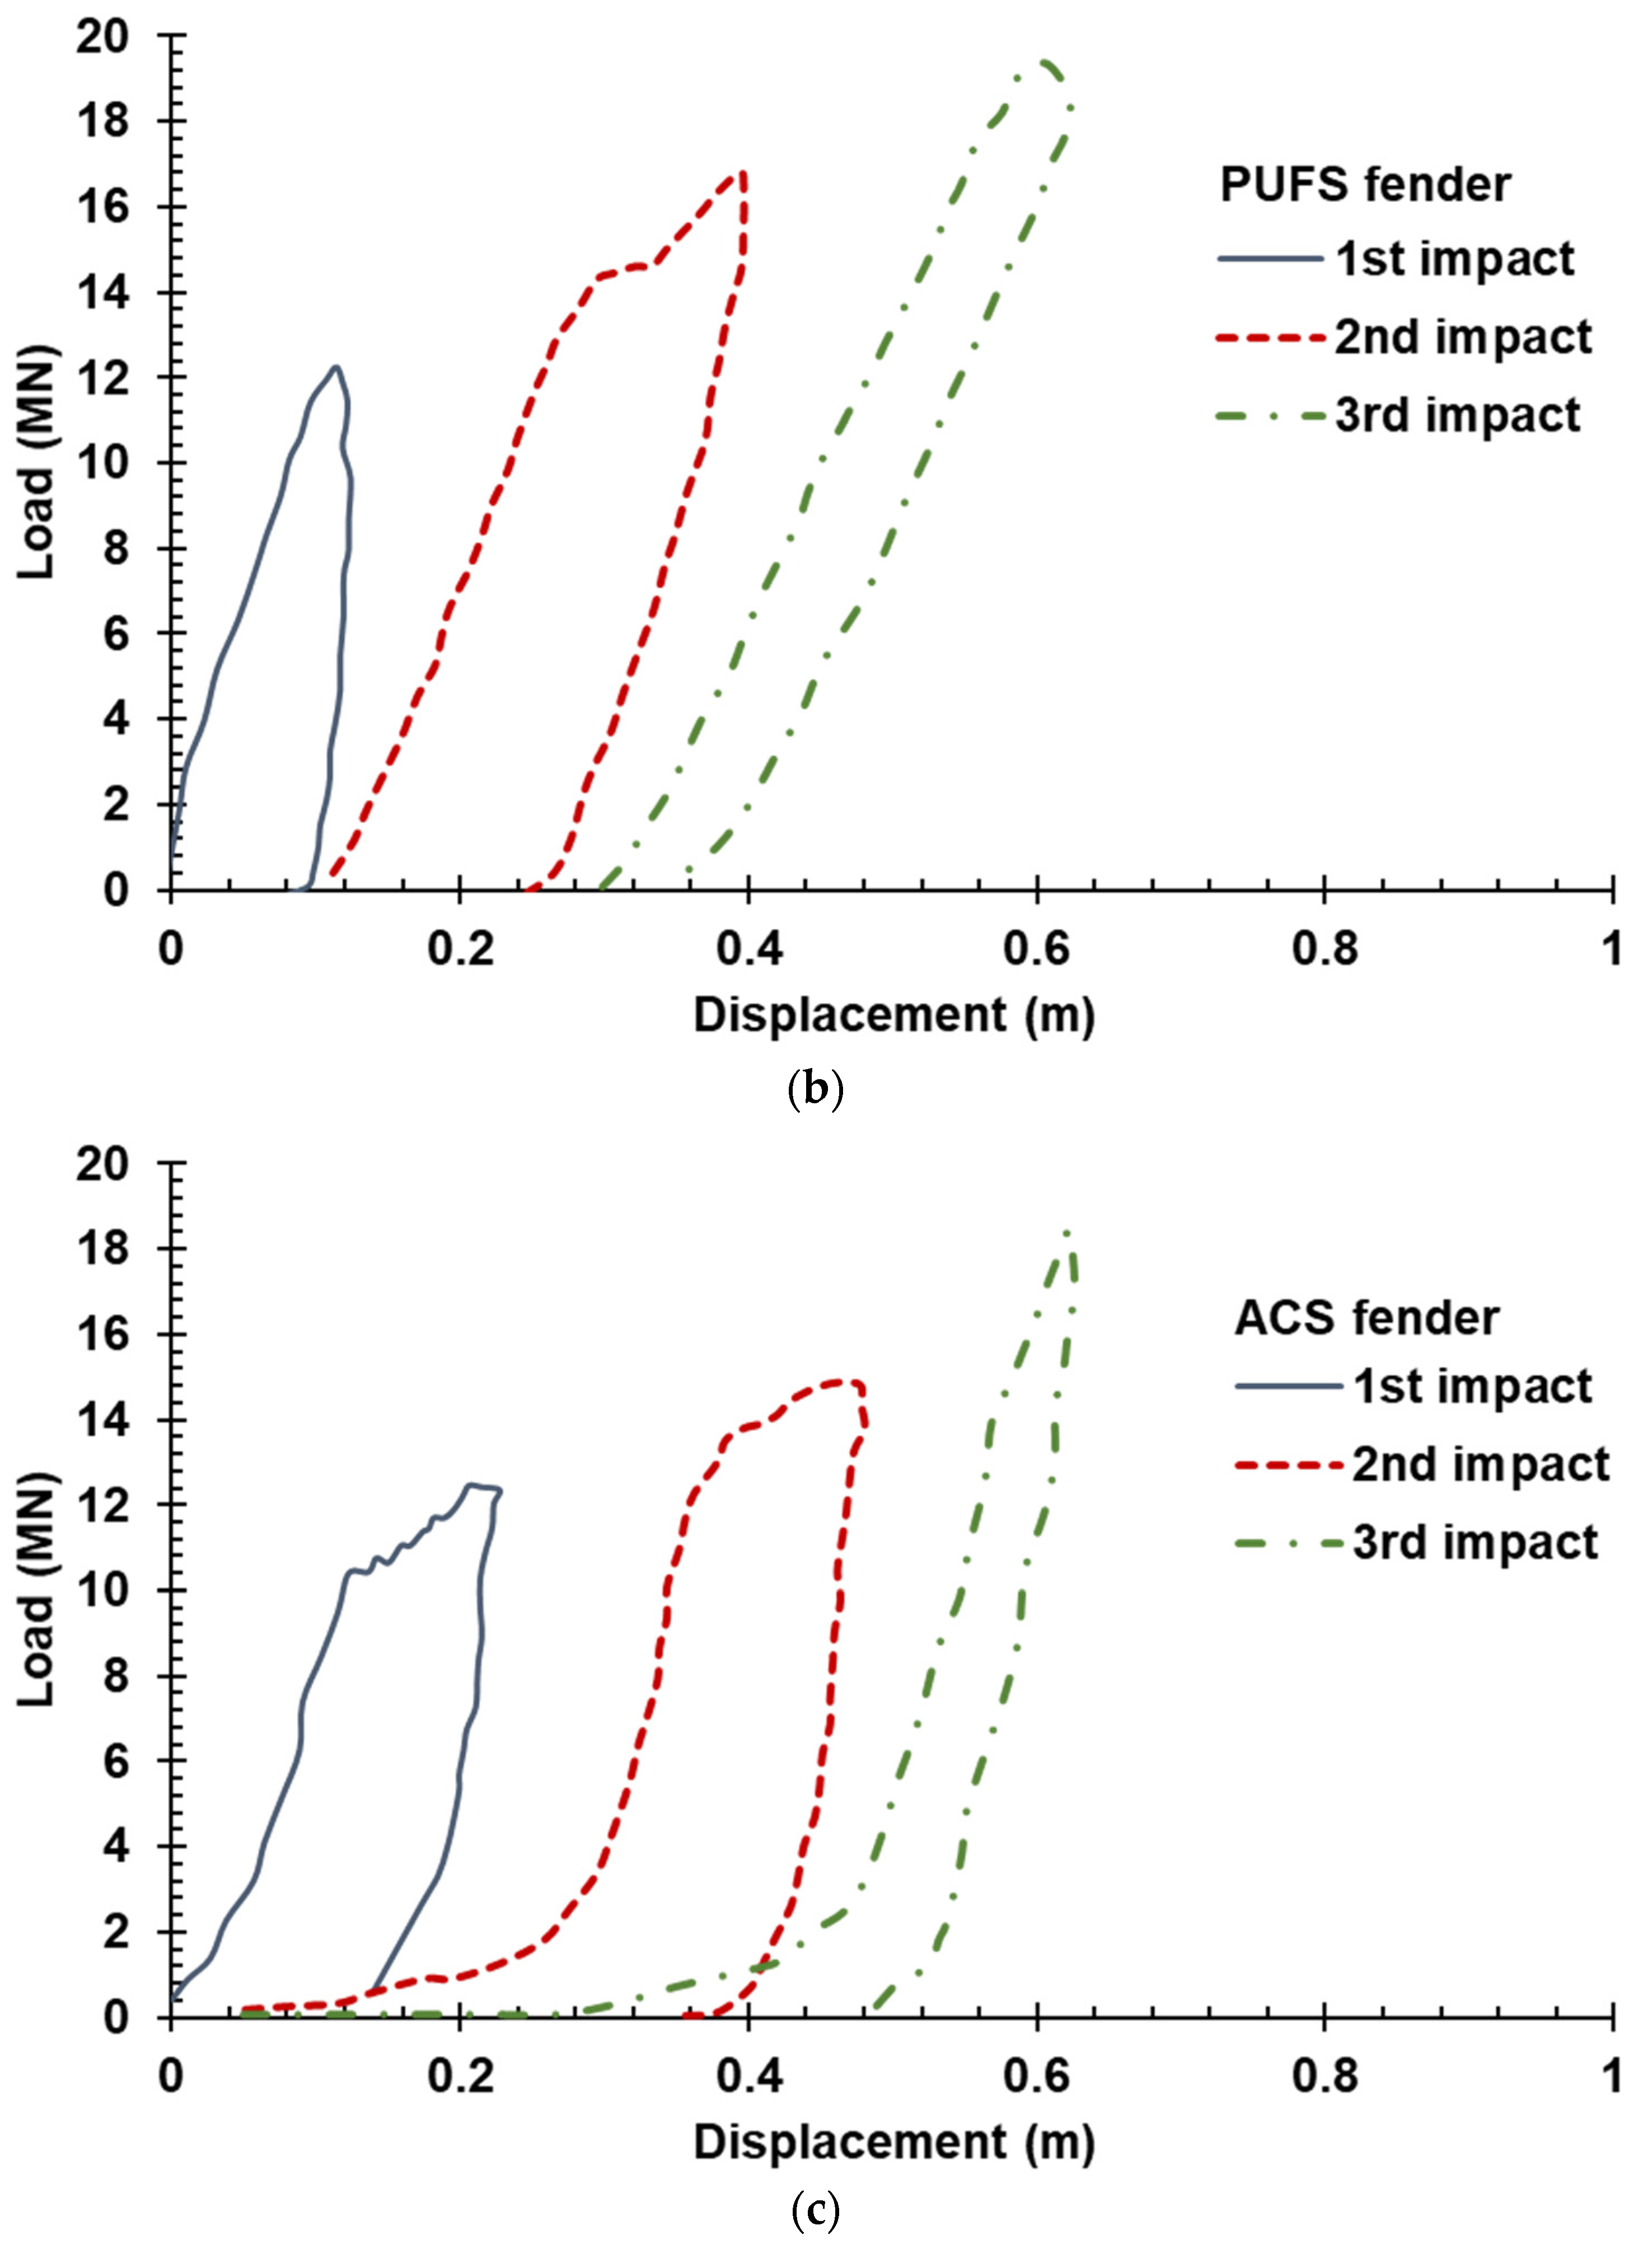
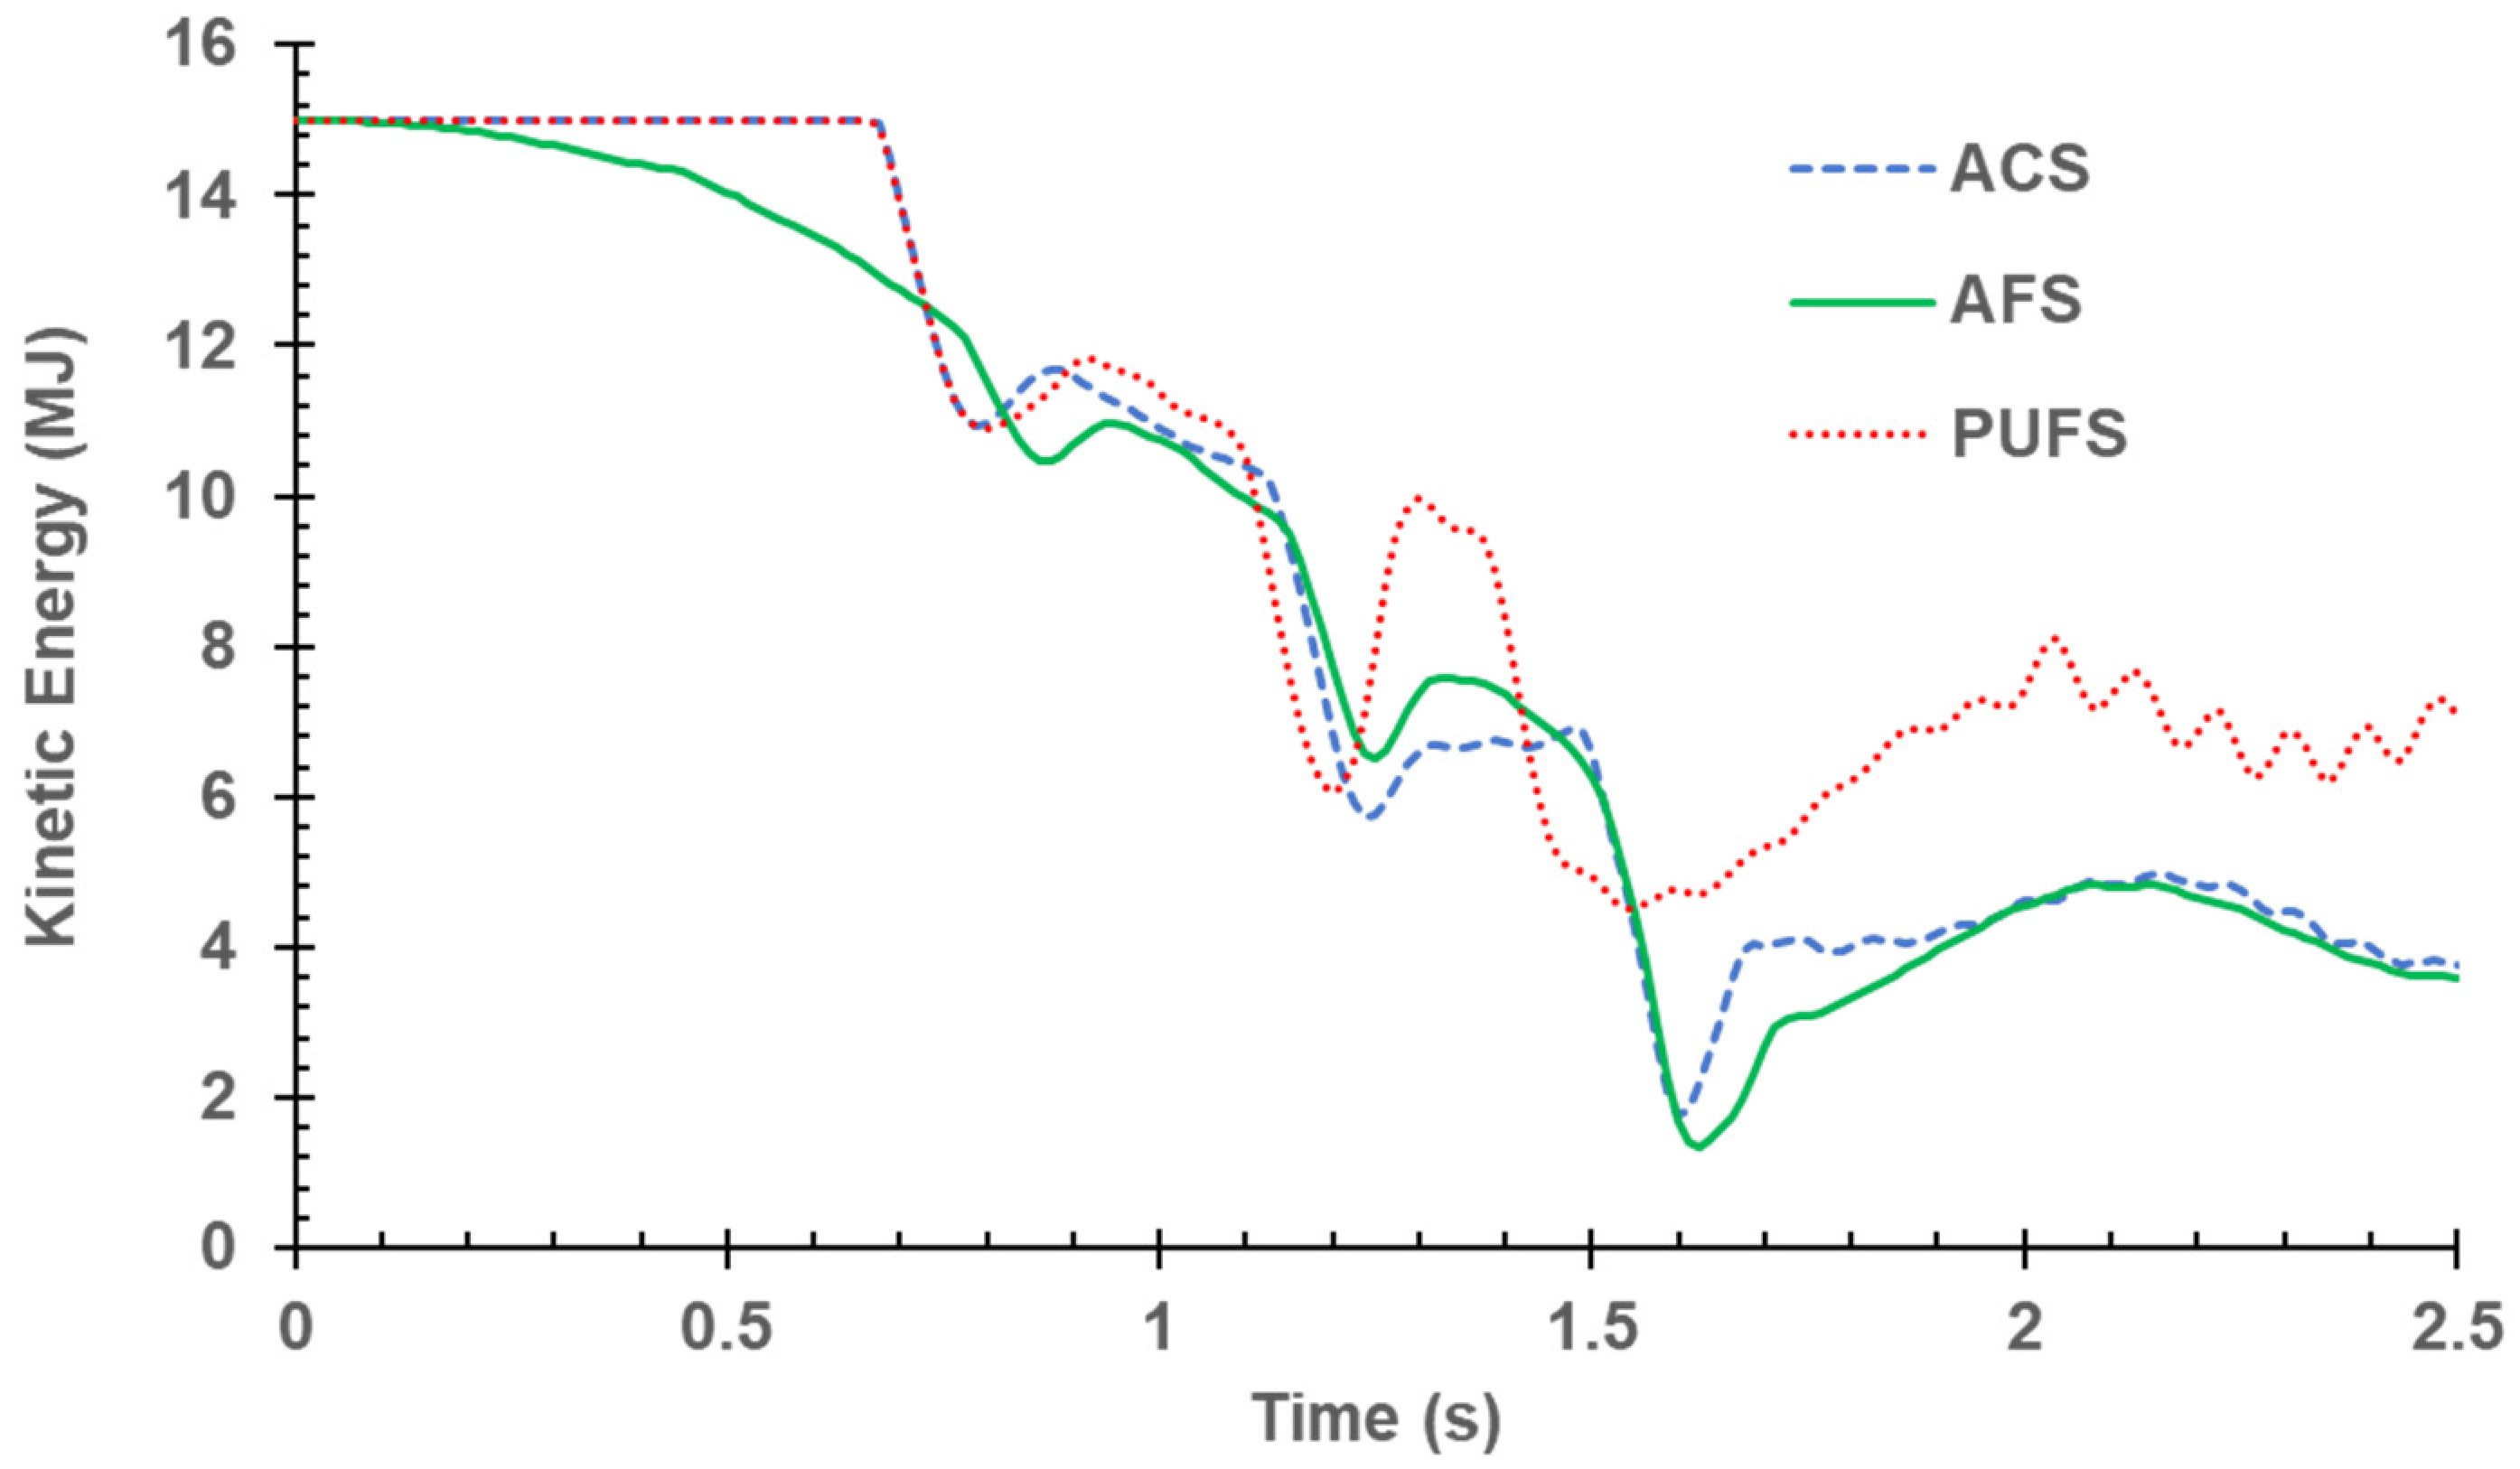
3.3. Finite Element Analyses of Ship Bow-OWT Collision Scenario
4. Conclusions
Author Contributions
Funding
Institutional Review Board Statement
Informed Consent Statement
Data Availability Statement
Conflicts of Interest
References
- Palomba, G.; Epasto, G.; Crupi, V. Lightweight sandwich structures for marine applications: A review. Mech. Adv. Mater. Struct. 2021, 1–26. [Google Scholar] [CrossRef]
- Birman, V.; Kardomateas, G.A. Review of current trends in research and applications of sandwich structures. Compos. Part B Eng. 2018, 142, 221–240. [Google Scholar] [CrossRef]
- Sharma, N.; Gibson, R.F.; Ayorinde, E.O. Fatigue of Foam and Honeycomb Core Composite Sandwich Structures: A Tutorial. J. Sandw. Struct. Mater. 2006, 8, 263–319. [Google Scholar] [CrossRef]
- Harte, A. The fatigue strength of sandwich beams with an aluminium alloy foam core. Int. J. Fatigue 2001, 23, 499–507. [Google Scholar] [CrossRef]
- Demelio, G.; Genovese, K.; Pappalettere, C. An experimental investigation of static and fatigue behaviour of sandwich composite panels joined by fasteners. Compos. Part B Eng. 2001, 32, 299–308. [Google Scholar] [CrossRef]
- Epasto, G.; Distefano, F.; Mozafari, H.; Linul, E.; Crupi, V. Nondestructive evaluation of aluminium foam panels subjected to impact loading. Appl. Sci. 2021, 11, 1148. [Google Scholar] [CrossRef]
- Hazizan, A.; Cantwell, W.J. The low velocity impact response of an aluminium honeycomb sandwich structure. Compos. Part B 2003, 34, 679–687. [Google Scholar] [CrossRef]
- Hazizan, A.; Cantwell, W.J. The low velocity impact response of foam-based sandwich structures. Compos. Part B 2002, 33, 193–204. [Google Scholar] [CrossRef]
- Foo, C.C.; Seah, L.K.; Chai, G.B. Low-velocity impact failure of aluminium honeycomb sandwich panels. Compos. Struct. 2008, 85, 20–28. [Google Scholar] [CrossRef]
- Linul, E.; Marsavina, L.; Kováčik, J. Collapse mechanisms of metal foam matrix composites under static and dynamic loading conditions. Mater. Sci. Eng. A 2017, 690, 214–224. [Google Scholar] [CrossRef]
- Sun, G.; Huo, X.; Wang, H.; Hazell, P.J.; Li, Q. On the structural parameters of honeycomb-core sandwich panels against low-velocity impact. Compos. Part B Eng. 2021, 216, 108881. [Google Scholar] [CrossRef]
- Gilioli, A.; Sbarufatti, C.; Manes, A.; Giglio, M. Compression after impact test (CAI) on NOMEXTM honeycomb sandwich panels with thin aluminum skins. Compos. Part B Eng. 2014, 67, 313–325. [Google Scholar] [CrossRef]
- Sun, M.; Wowk, D.; Mechefske, C.; Alexander, E.; Kim, I.Y. Surface and honeycomb core damage in adhesively bonded aluminum sandwich panels subjected to low-velocity impact. Compos. Part B Eng. 2022, 230, 109506. [Google Scholar] [CrossRef]
- Baral, N.; Cartié, D.D.R.; Partridge, I.K.; Baley, C.; Davies, P. Improved impact performance of marine sandwich panels using through-thickness reinforcement: Experimental results. Compos. Part B Eng. 2010, 41, 117–123. [Google Scholar] [CrossRef]
- Li, Y.; Wu, X.; Xiao, W.; Wang, S.; Zhu, L. Experimental study on the dynamic behaviour of aluminium honeycomb sandwich panel subjected to ice wedge impact. Compos. Struct. 2022, 282, 115092. [Google Scholar] [CrossRef]
- Wu, X.; Li, Y.; Cai, W.; Guo, K.; Zhu, L. Dynamic responses and energy absorption of sandwich panel with aluminium honeycomb core under ice wedge impact. Int. J. Impact Eng. 2022, 162, 104137. [Google Scholar] [CrossRef]
- Palomba, G.; Epasto, G.; Sutherland, L.; Crupi, V. Aluminium honeycomb sandwich as a design alternative for lightweight marine structures. Ships Offshore Struct. 2021, 1–12. [Google Scholar] [CrossRef]
- Palomba, G.; Scattareggia Marchese, S.; Crupi, V.; Garbatov, Y. Cost, Energy Efficiency and Carbon Footprint Analysis of Hybrid Light-Weight Bulk Carrier. J. Mar. Sci. Eng. 2022, 10, 957. [Google Scholar] [CrossRef]
- Han, Z.; Li, C.; Deng, Y.; Liu, J. The analysis of anti-collision performance of the fender with offshore wind turbine tripod impacted by ship and the coefficient of restitution. Ocean Eng. 2019, 194, 106614. [Google Scholar] [CrossRef]
- Zhang, Y.; Li, Y.; Guo, K.; Zhu, L. Dynamic mechanical behaviour and energy absorption of aluminium honeycomb sandwich panels under repeated impact loads. Ocean Eng. 2021, 219, 108344. [Google Scholar] [CrossRef]
- He, X.; Soares, C.G. Experimental study on the dynamic behavior of beams under repeated impacts. Int. J. Impact Eng. 2021, 147, 103724. [Google Scholar] [CrossRef]
- Zhu, L.; Guo, K.; Li, Y.; Yu, T.X.; Zhou, Q. Experimental study on the dynamic behaviour of aluminium foam sandwich plates under single and repeated impacts at low temperature. Int. J. Impact Eng. 2018, 114, 123–132. [Google Scholar] [CrossRef]
- Guo, K.; Zhu, L.; Li, Y.; Yu, T.X.; Shenoi, A.; Zhou, Q. Experimental investigation on the dynamic behaviour of aluminum foam sandwich plate under repeated impacts. Compos. Struct. 2018, 200, 298–305. [Google Scholar] [CrossRef]
- Sun, X.; Huang, D.; Wu, G. The current state of offshore wind energy technology development. Energy 2012, 41, 298–312. [Google Scholar] [CrossRef]
- Lee, J.; Zhao, F. GWEC Global Wind Report 2021; Global Wind Energy Council: Brussels, Belgium, 2021. [Google Scholar]
- Hao, E.; Liu, C. Evaluation and comparison of anti-impact performance to offshore wind turbine foundations: Monopile, tripod, and jacket. Ocean Eng. 2017, 130, 218–227. [Google Scholar] [CrossRef]
- Liu, C.; Hao, E.; Zhang, S. Optimization and application of a crashworthy device for the monopile offshore wind turbine against ship impact. Appl. Ocean Res. 2015, 51, 129–137. [Google Scholar] [CrossRef]
- Storheim, M.; Amdahl, J. Design of offshore structures against accidental ship collisions. Mar. Struct. 2014, 37, 135–172. [Google Scholar] [CrossRef]
- Buldgen, L.; Le Sourne, H.; Pire, T. Extension of the super-elements method to the analysis of a jacket impacted by a ship. Mar. Struct. 2014, 38, 44–71. [Google Scholar] [CrossRef]
- Jia, H.; Qin, S.; Wang, R.; Xue, Y.; Fu, D.; Wang, A. Ship collision impact on the structural load of an offshore wind turbine. Glob. Energy Interconnect. 2020, 3, 43–50. [Google Scholar] [CrossRef]
- Bela, A.; Le Sourne, H.; Buldgen, L.; Rigo, P. Ship collision analysis on offshore wind turbine monopile foundations. Mar. Struct. 2017, 51, 220–241. [Google Scholar] [CrossRef]
- Mo, R.; Li, M.; Kang, H. Transient behaviour of grouted connections of offshore wind turbines subject to ship impact. Appl. Ocean Res. 2018, 76, 159–173. [Google Scholar] [CrossRef]
- Qiu, A.; Lin, W.; Ma, Y.; Zhao, C.; Tang, Y. Novel material and structural design for large-scale marine protective devices. Mater. Des. 2015, 68, 29–41. [Google Scholar] [CrossRef]
- Zhu, L.; Liu, W.; Fang, H.; Chen, J.; Zhuang, Y.; Han, J. Design and simulation of innovative foam-filled Lattice Composite Bumper System for bridge protection in ship collisions. Compos. Part B Eng. 2019, 157, 24–35. [Google Scholar] [CrossRef]
- Lin, H.; Han, C.; Yang, L.; Karampour, H.; Luan, H.; Han, P.; Xu, H.; Zhang, S. Dynamic Performance and Crashworthiness Assessment of Honeycomb Reinforced Tubular Pipe in the Jacket Platform under Ship Collision. J. Mar. Sci. Eng. 2022, 10, 1194. [Google Scholar] [CrossRef]
- Epasto, G.; Distefano, F.; Gu, L.; Mozafari, H.; Linul, E. Design and optimization of Metallic Foam Shell protective device against flying ballast impact damage in railway axles. Mater. Des. 2020, 196, 109120. [Google Scholar] [CrossRef]
- Duarte, I.; Vesenjak, M.; Krstulović-Opara, L. Dynamic and quasi-static bending behaviour of thin-walled aluminium tubes filled with aluminium foam. Compos. Struct. 2014, 109, 48–56. [Google Scholar] [CrossRef]
- Miller, W.; Zhuang, L.; Bottema, J.; Wittebrood, A.; De Smet, P.; Haszler, A.; Vieregge, A. Recent development in aluminium alloys for the automotive industry. Mater. Sci. Eng. A 2000, 280, 37–49. [Google Scholar] [CrossRef]
- Simancik, F.; Rajner, W.; Laag, R. Alulight—Aluminum Foam for Lightweight Construction; SAE International: Warrendale, PA, USA, 2000. [Google Scholar]
- Banhart, J.; García-Moreno, F.; Heim, K.; Seeliger, H.W. Light-Weighting in Transportation and Defence Using Aluminium Foam Sandwich Structures. In Light Weighting for Defense, Aerospace, and Transportation; Indian Institute of Metals Series; Gokhale, A.A., Prasad, N., Basu, B., Eds.; Springer: Singapore, 2019; pp. 61–72. [Google Scholar]
- Moulas, D.; Shafiee, M.; Mehmanparast, A. Damage analysis of ship collisions with offshore wind turbine foundations. Ocean Eng. 2017, 143, 149–162. [Google Scholar] [CrossRef]
- ISO 13314; Mechanical Testing of Metals—Ductility testing—Compression Test for Porous and Cellular Metals. ISO: Geneva, Switzerland, 2011.
- ISO 844; Rigid Cellular Plastics—Determination of Compression Properties. ISO: Geneva, Switzerland, 2011.
- ASTM D 1621; Standard test method for compressive properties of rigid cellular plastics. ASTM: West Conshohocken, PA, USA, 2000.
- He, X.; Rong, J.; Xiang, D. Damage Analysis of Aluminium Foam Panel Subjected to Underwater Shock Loading. Shock Vib. 2017, 2017, 6031414. [Google Scholar] [CrossRef]
- Hooputra, H.; Gese, H.; Dell, H.; Werner, H. A comprehensive failure model for crashworthiness simulation of aluminium extrusions. Int. J. Crashworthiness 2004, 9, 449–464. [Google Scholar] [CrossRef]
- Roven, H.J.; Nesboe, H.; Werenskiold, J.C.; Seibert, T. Mechanical properties of aluminium alloys processed by SPD: Comparison of different alloy systems and possible product areas. Mater. Sci. Eng. A 2005, 410–411, 426–429. [Google Scholar] [CrossRef]


| Sample Type | Compressive Modulus [MPa] | Compressive Strength [MPa] | Plateau Stress [MPa] | Densification Strain [%] | Densification Stress [MPa] | Energy Absorption [MJ/m3] |
|---|---|---|---|---|---|---|
| AF | 183.56 ± 10.03 | 7.24 ± 0.04 | 7.63 ± 0.06 | 48.87 ± 0.11 | 9.92 ± 0.08 | 3.69 ± 0.04 |
| PUF | 176.57 ± 17.08 | 5.87 ± 0.83 | 5.83 ± 0.04 | 49.79 ± 0.07 | 7.58 ± 0.18 | 2.77 ± 0.04 |
| AC | 7.94 ± 0.17 | 0.65 ± 0.01 | 0.90 ± 0.07 | 40.45 ± 0.18 | 1.18 ± 0.04 | 0.40 ± 0.05 |
| Material | Ei [J] | m [g] | t [mm] | l [mm] | b [mm] | ρ [kg/m3] | FMAX [kN] | w [mm] | SAE [Jm3/kg] | SAEw [J/kg] |
|---|---|---|---|---|---|---|---|---|---|---|
| AF | 15 | 32.49 | 19.57 | 60.72 | 60.51 | 451.84 | 2.12 | 12.60 | 0.033 | 461.7 |
| AF | 20 | 32.68 | 20.31 | 60.65 | 60.58 | 438.00 | 2.29 | 13.38 | 0.046 | 612.0 |
| AF | 25 | 31.76 | 20.12 | 60.68 | 60.59 | 429.39 | 3.13 | 11.97 | 0.058 | 787.2 |
| AF | 30 | 33.16 | 20.05 | 60.43 | 60.42 | 452.98 | 2.84 | 16.98 | 0.066 | 904.7 |
| AF | 35 | 31.98 | 19.98 | 60.53 | 60.49 | 437.12 | 3.38 | Perforated | 0.078 | 1068.2 |
| PUF | 15 | 28.86 | 25.28 | 60.86 | 60.69 | 309.11 | 3.05 | 8.62 | 0.049 | 519.8 |
| PUF | 20 | 28.62 | 25.32 | 60.74 | 60.65 | 306.80 | 3.55 | 10.23 | 0.065 | 698.8 |
| PUF | 25 | 28.62 | 25.26 | 60.73 | 60.49 | 308.45 | 4.04 | 11.59 | 0.081 | 873.5 |
| PUF | 30 | 28.51 | 25.34 | 60.78 | 60.59 | 305.47 | 4.51 | Perforated | 0.091 | 972.6 |
| PUF | 35 | 28.48 | 25.25 | 60.68 | 60.22 | 308.65 | 4.91 | Perforated | 0.093 | 1010.2 |
| AC | 15 | 33.27 | 34.97 | 64.29 | 59.20 | 249.94 | 1.32 | 18.39 | 0.060 | 450.9 |
| AC | 20 | 32.21 | 35.04 | 64.31 | 59.10 | 241.89 | 1.35 | 24.02 | 0.083 | 620.9 |
| AC | 25 | 32.74 | 34.94 | 64.32 | 58.27 | 250.01 | 1.49 | Perforated | 0.098 | 746.0 |
| AC | 30 | 34.18 | 34.91 | 63.87 | 59.24 | 258.73 | 1.40 | Perforated | 0.097 | 731.4 |
| AC | 35 | 31.82 | 34.44 | 64.27 | 57.96 | 248.03 | 1.55 | Perforated | 0.101 | 786.2 |
| FMAX [N] | FMAX Error [%] | w [mm] | w Error [%] | |
|---|---|---|---|---|
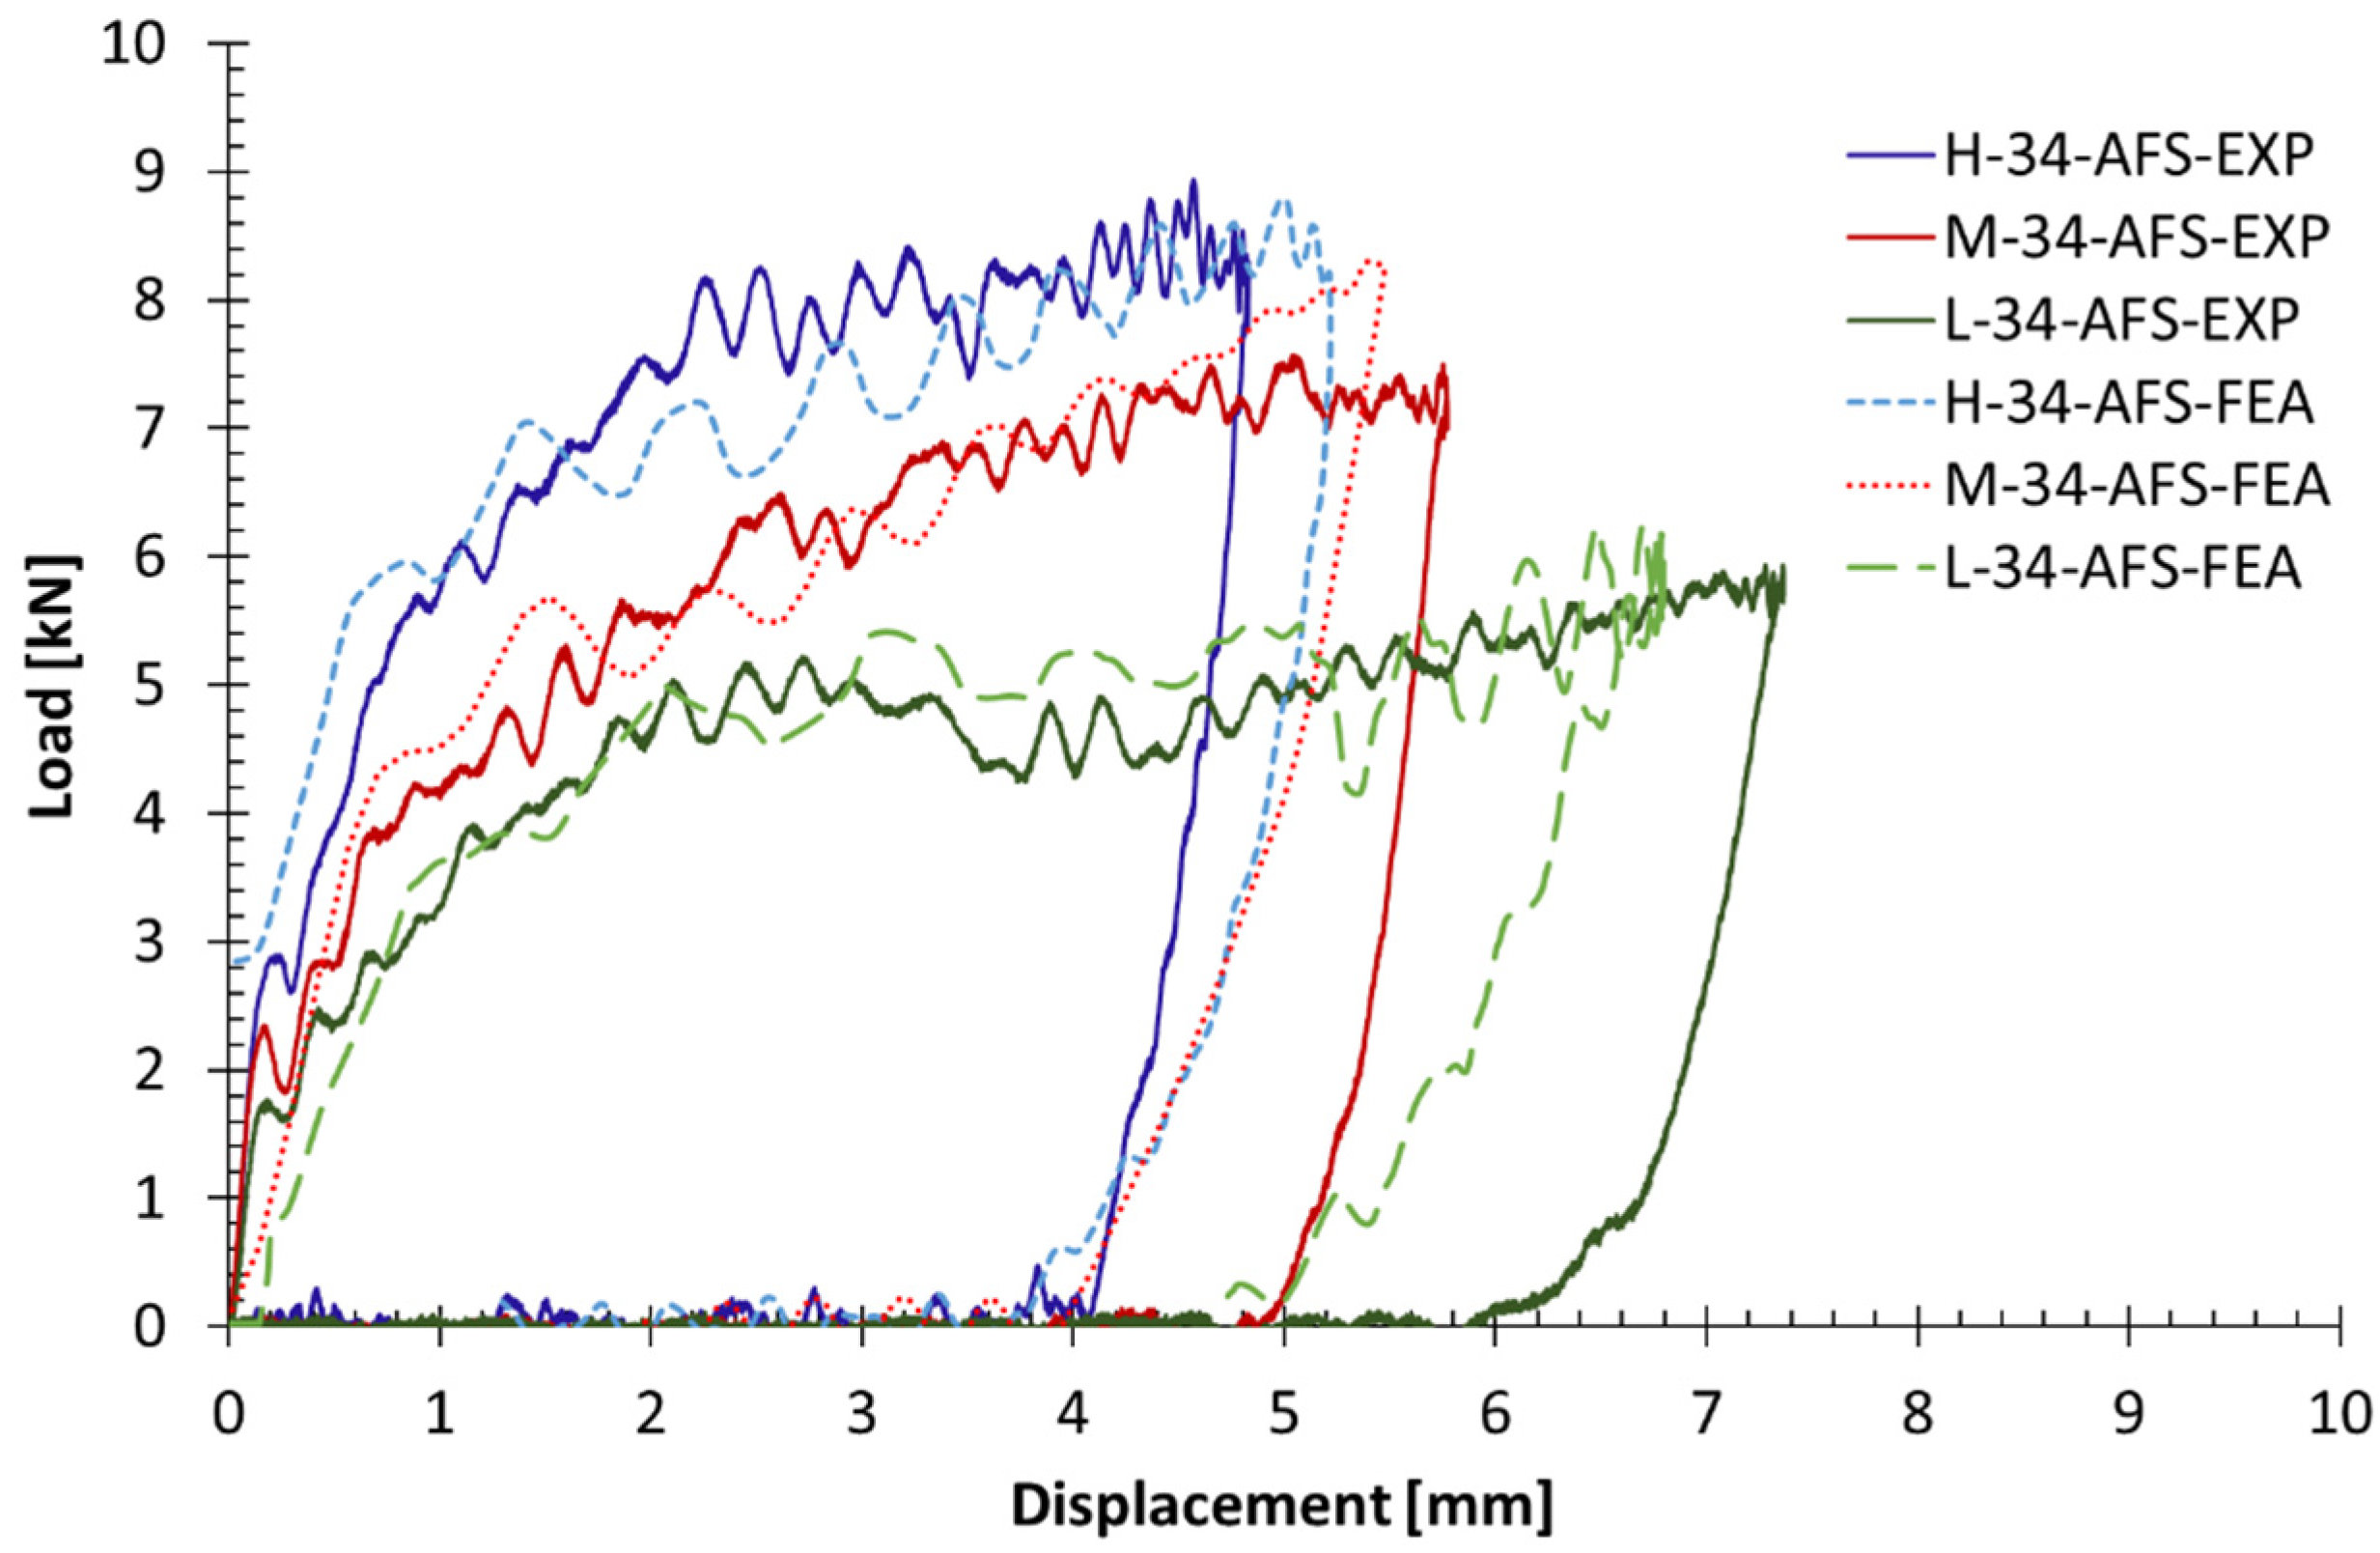
| L-34-AFS-EXP | 5934.4 | 5.12 | 7.4 | −8.11 |
| L-34-AFS-FEA | 6238.1 | 6.8 | ||
| M-34-AFS-EXP | 7567.2 | 9.79 | 5.8 | −5.17 |
| M-34-AFS-FEA | 8308.4 | 5.5 | ||
| H-34-AFS-EXP | 8936.7 | −1.62 | 4.8 | 8.33 |
| H-34-AFS-FEA | 8791.6 | 5.2 |
| FMAX [N] | FMAX Error [%] | w [mm] | w Error [%] | |
|---|---|---|---|---|
| AFS-I-EXP | 5934.4 | −1.77 | 7.4 | 5.6 |
| AFS-I-FEA | 5829.5 | 7.01 | ||
| AFS-II-EXP | 7982.7 | 0.25 | 5.7 | 7.9 |
| AFS-II-FEA | 8002.7 | 6.19 | ||
| AFS-III-EXP | 9399.0 | 0.35 | 5.4 | 0.7 |
| AFS-III-FEA | 9431.8 | 6.36 |
Publisher’s Note: MDPI stays neutral with regard to jurisdictional claims in published maps and institutional affiliations. |
© 2022 by the authors. Licensee MDPI, Basel, Switzerland. This article is an open access article distributed under the terms and conditions of the Creative Commons Attribution (CC BY) license (https://creativecommons.org/licenses/by/4.0/).
Share and Cite
Mozafari, H.; Distefano, F.; Epasto, G.; Gu, L.; Linul, E.; Crupi, V. Design of an Innovative Hybrid Sandwich Protective Device for Offshore Structures. J. Mar. Sci. Eng. 2022, 10, 1385. https://doi.org/10.3390/jmse10101385
Mozafari H, Distefano F, Epasto G, Gu L, Linul E, Crupi V. Design of an Innovative Hybrid Sandwich Protective Device for Offshore Structures. Journal of Marine Science and Engineering. 2022; 10(10):1385. https://doi.org/10.3390/jmse10101385
Chicago/Turabian StyleMozafari, Hozhabr, Fabio Distefano, Gabriella Epasto, Linxia Gu, Emanoil Linul, and Vincenzo Crupi. 2022. "Design of an Innovative Hybrid Sandwich Protective Device for Offshore Structures" Journal of Marine Science and Engineering 10, no. 10: 1385. https://doi.org/10.3390/jmse10101385
APA StyleMozafari, H., Distefano, F., Epasto, G., Gu, L., Linul, E., & Crupi, V. (2022). Design of an Innovative Hybrid Sandwich Protective Device for Offshore Structures. Journal of Marine Science and Engineering, 10(10), 1385. https://doi.org/10.3390/jmse10101385