
Effect of the Dry-Wet Cycle on the Performance of Marine Waste Silt Solidified by Calcium Carbide Residue and Plant Ash


Abstract
:1. Introduction
2. Materials and Methods
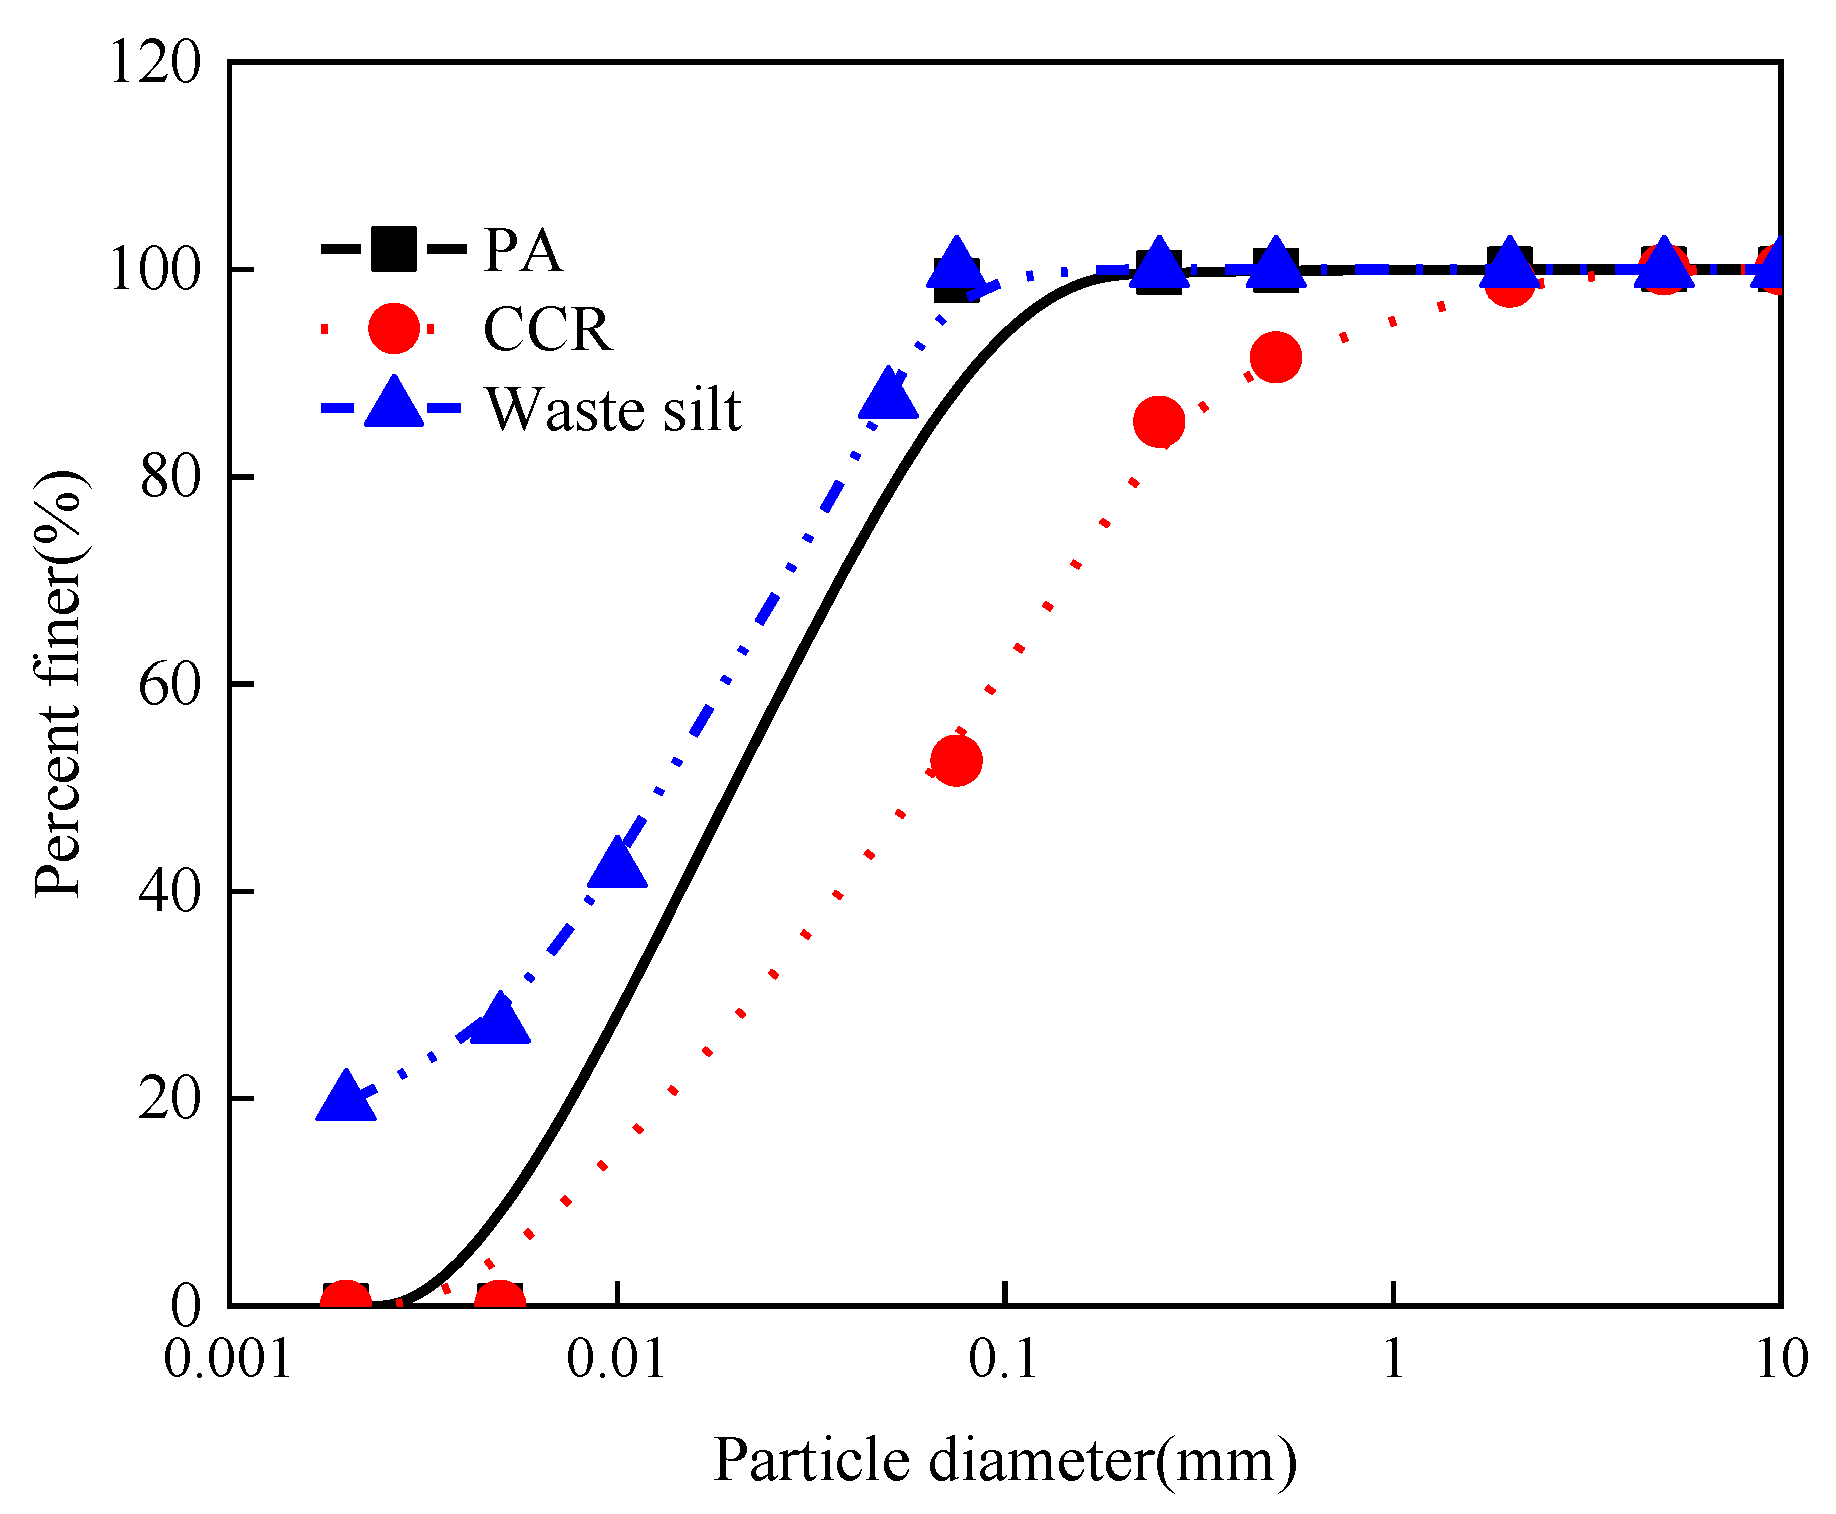
2.1. Materials
2.2. Test Plan
2.3. Methodology
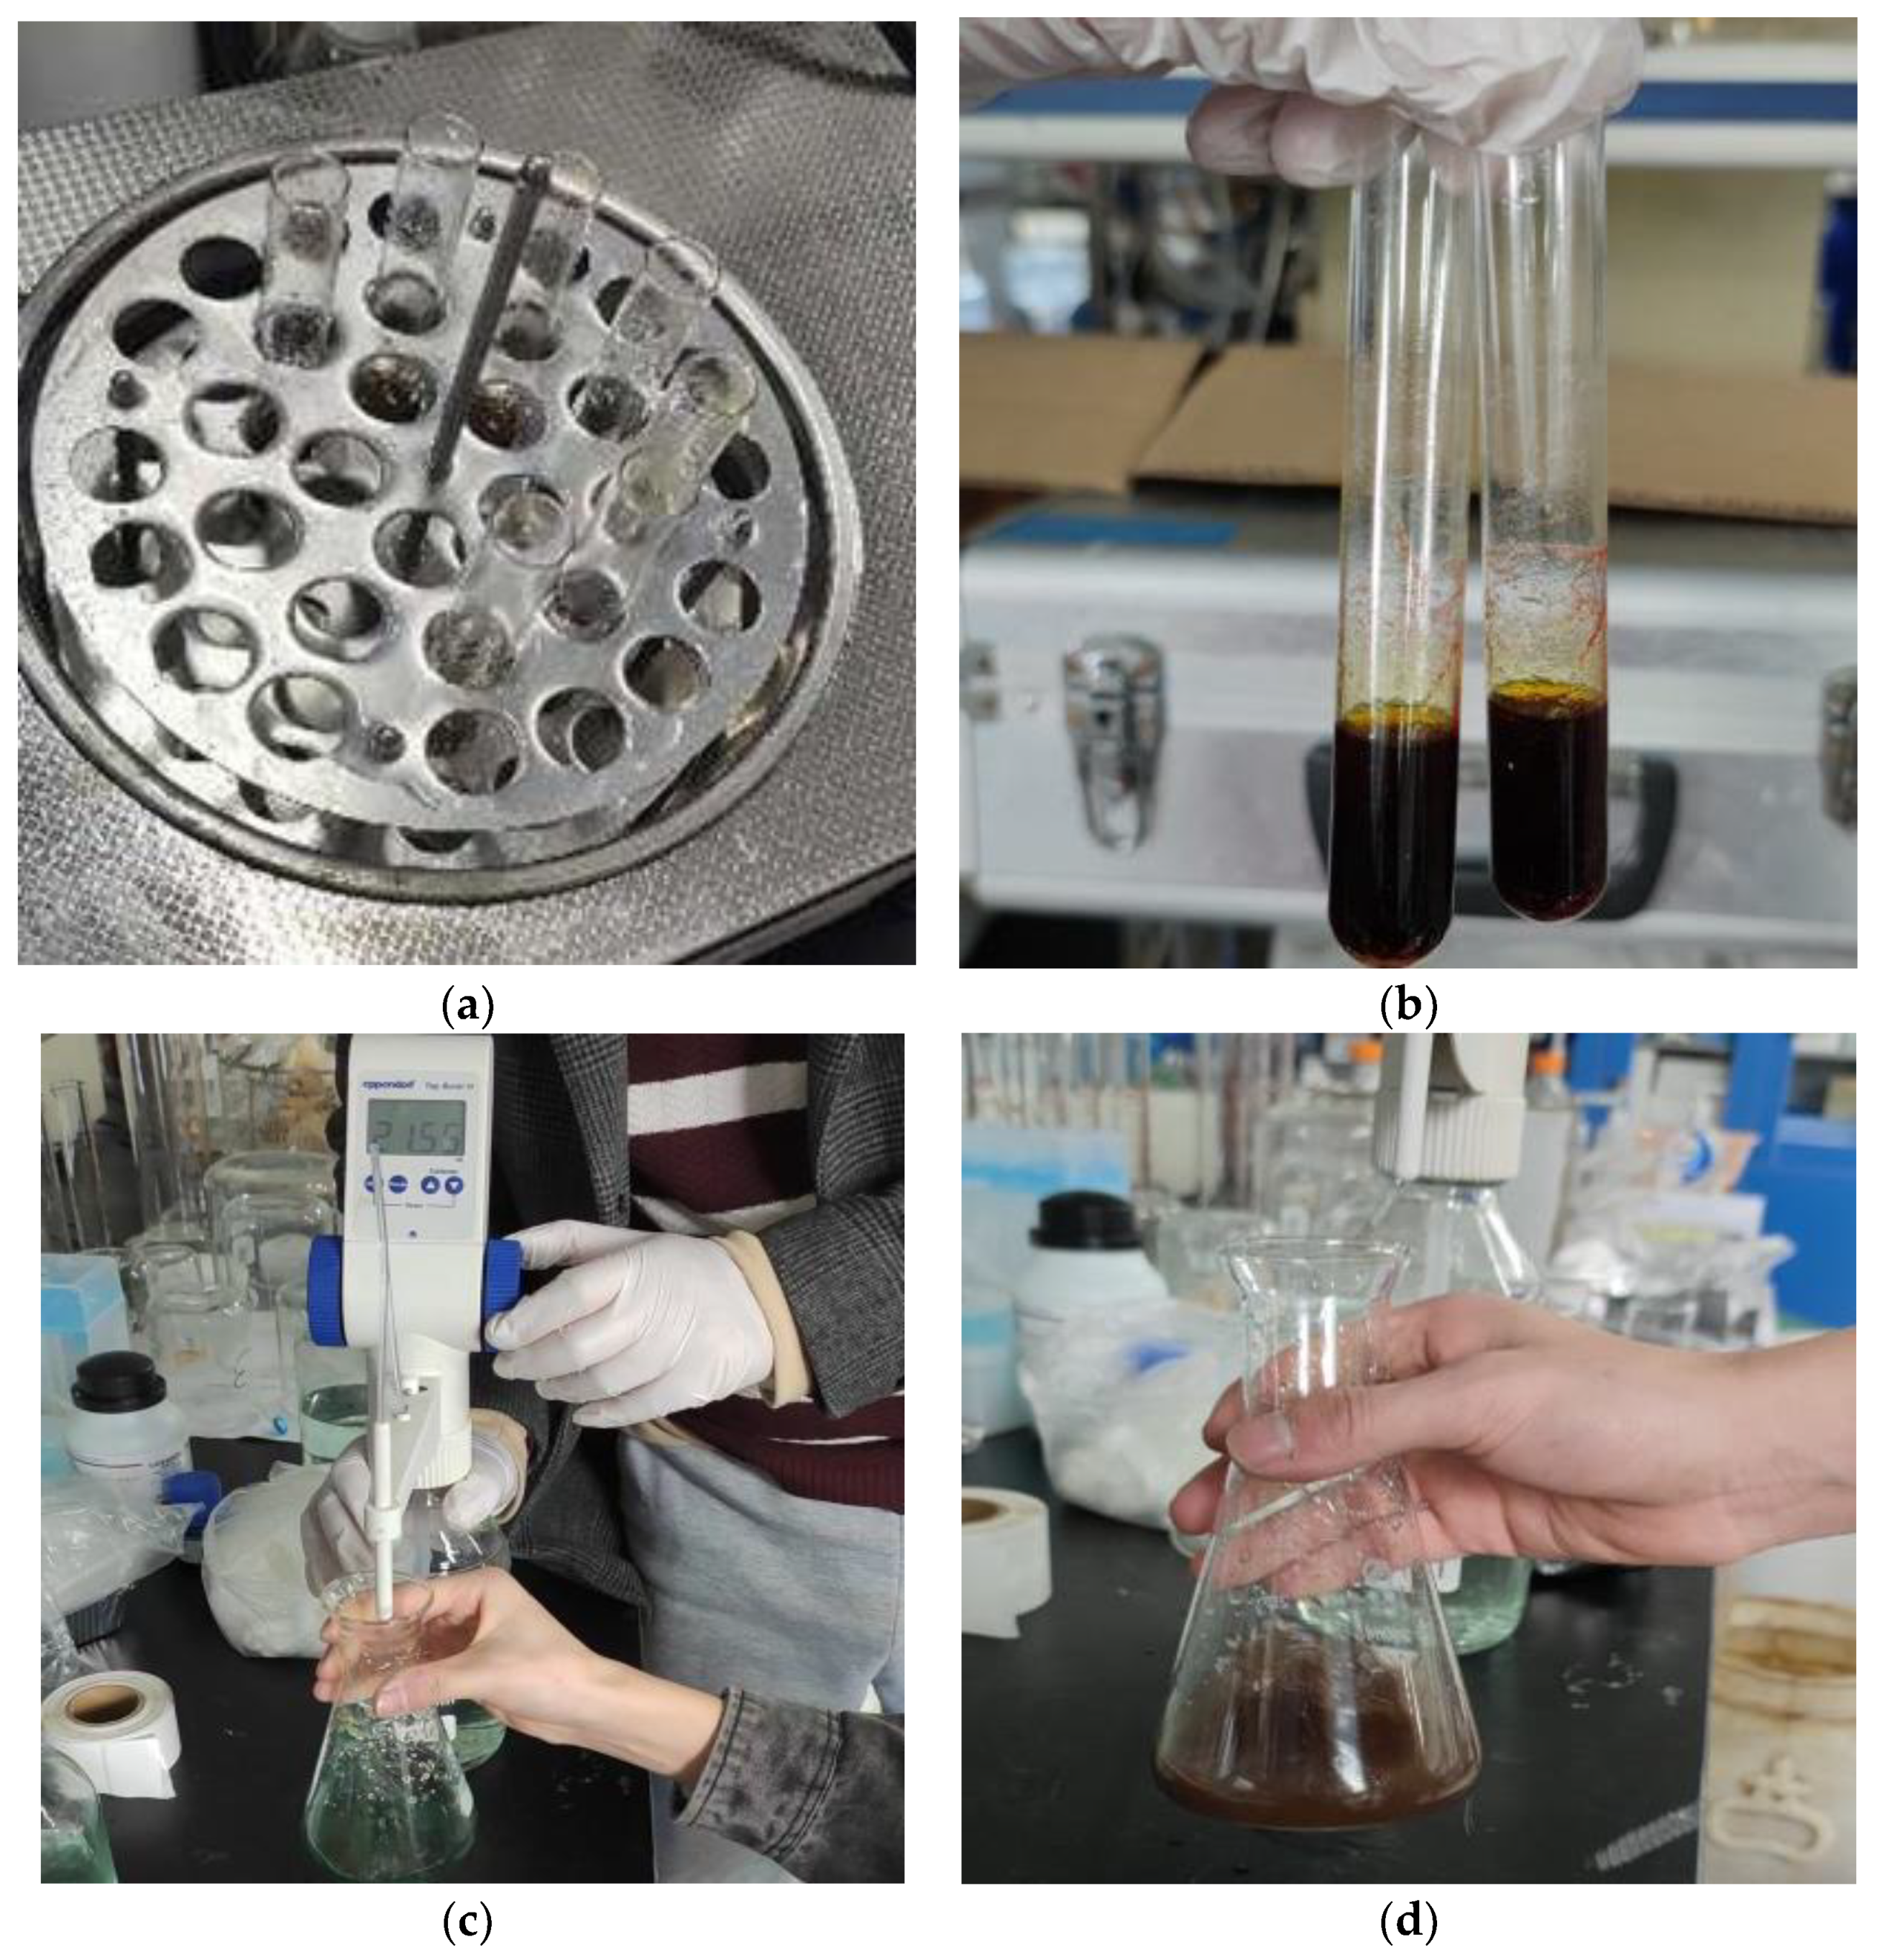
2.3.1. Organic Matter Test
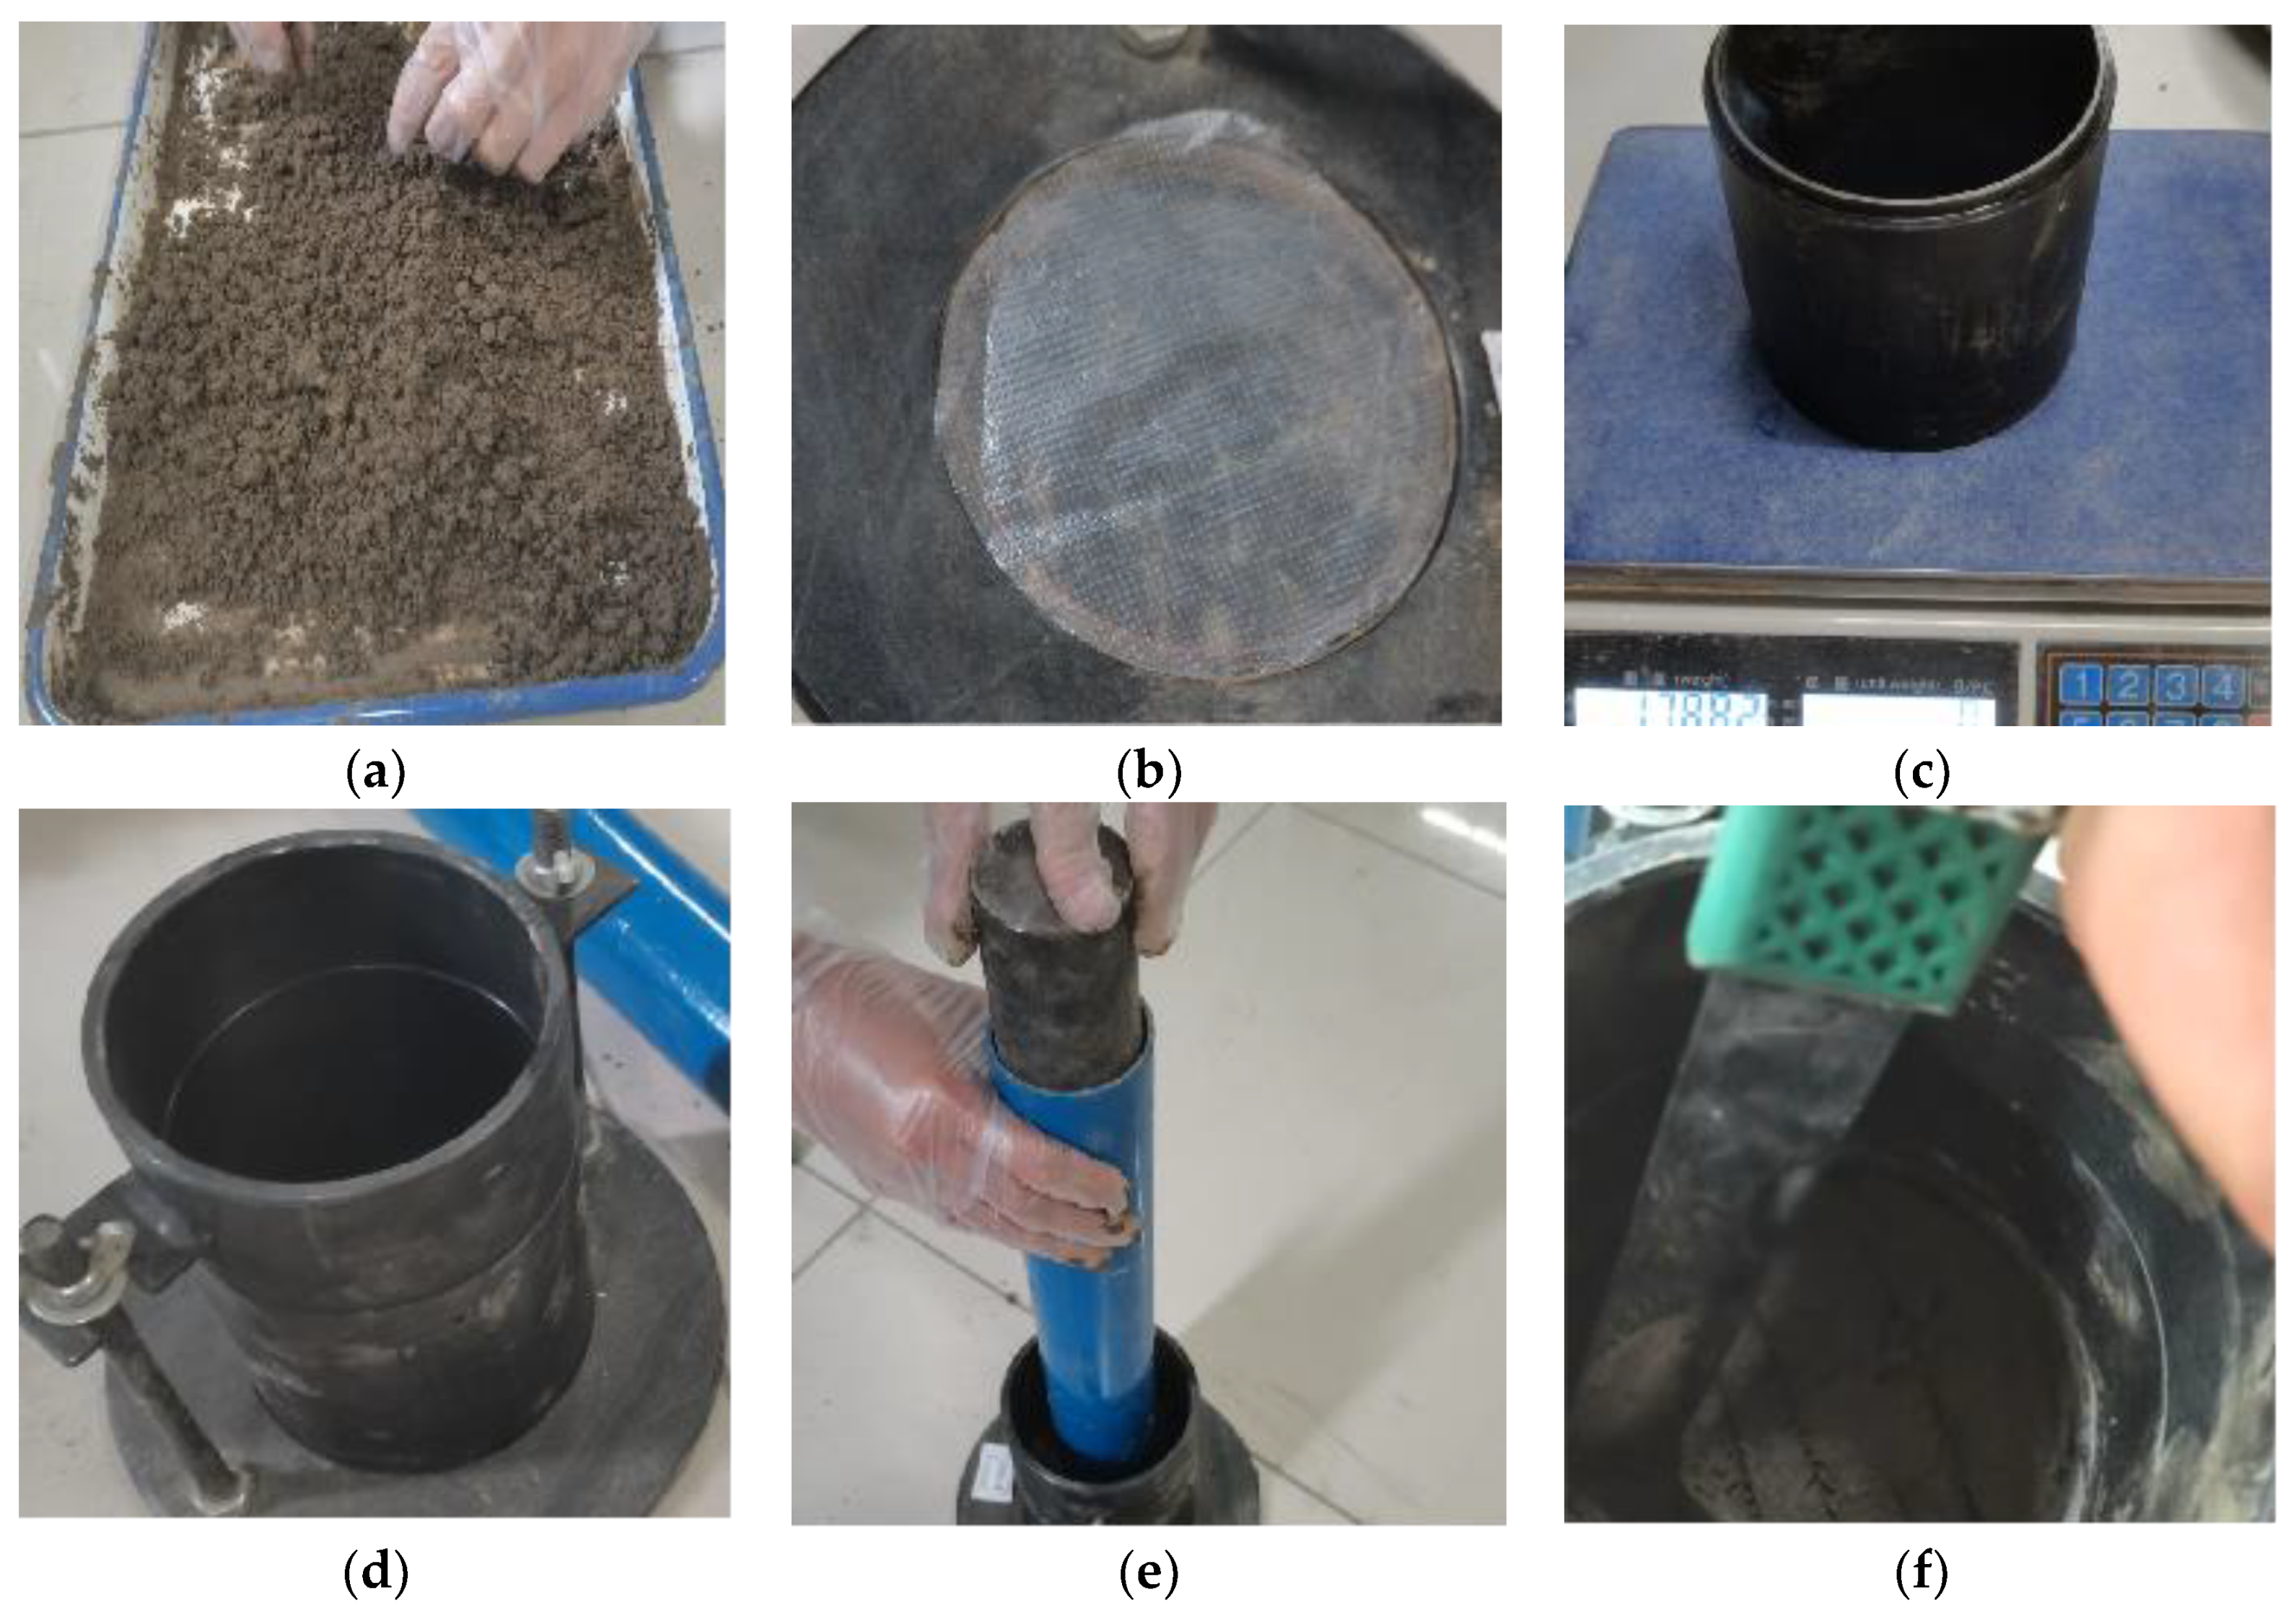
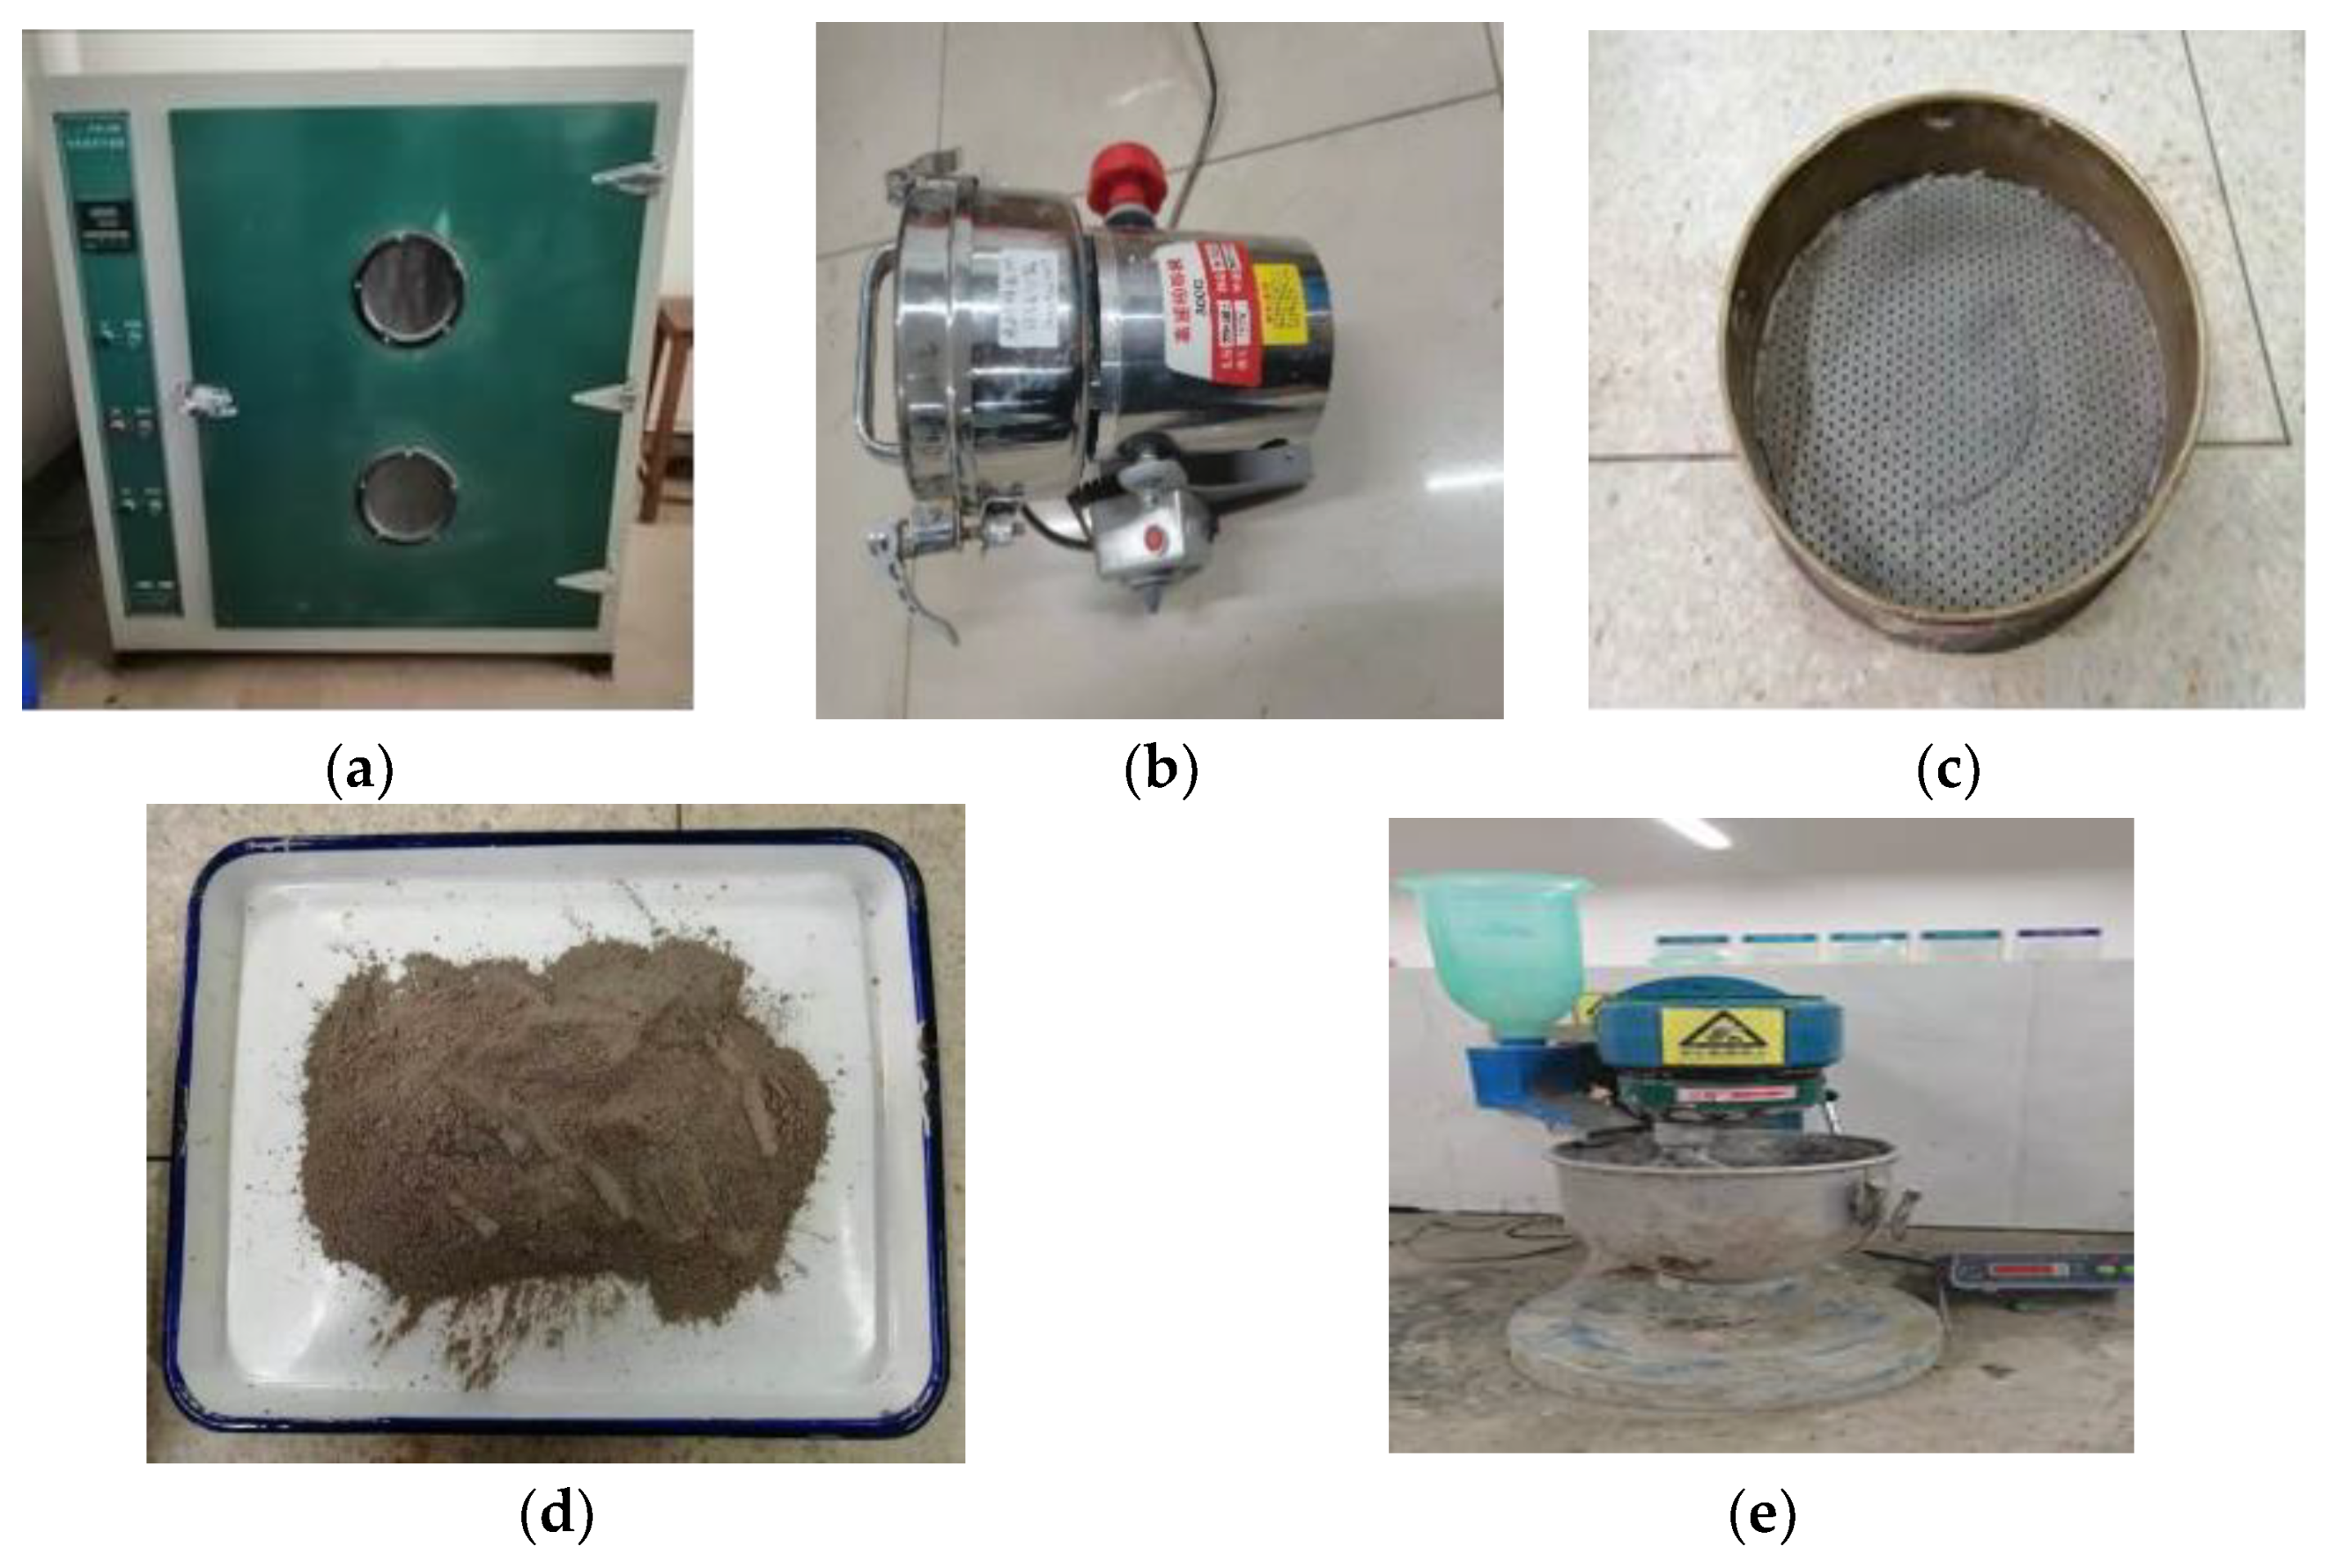
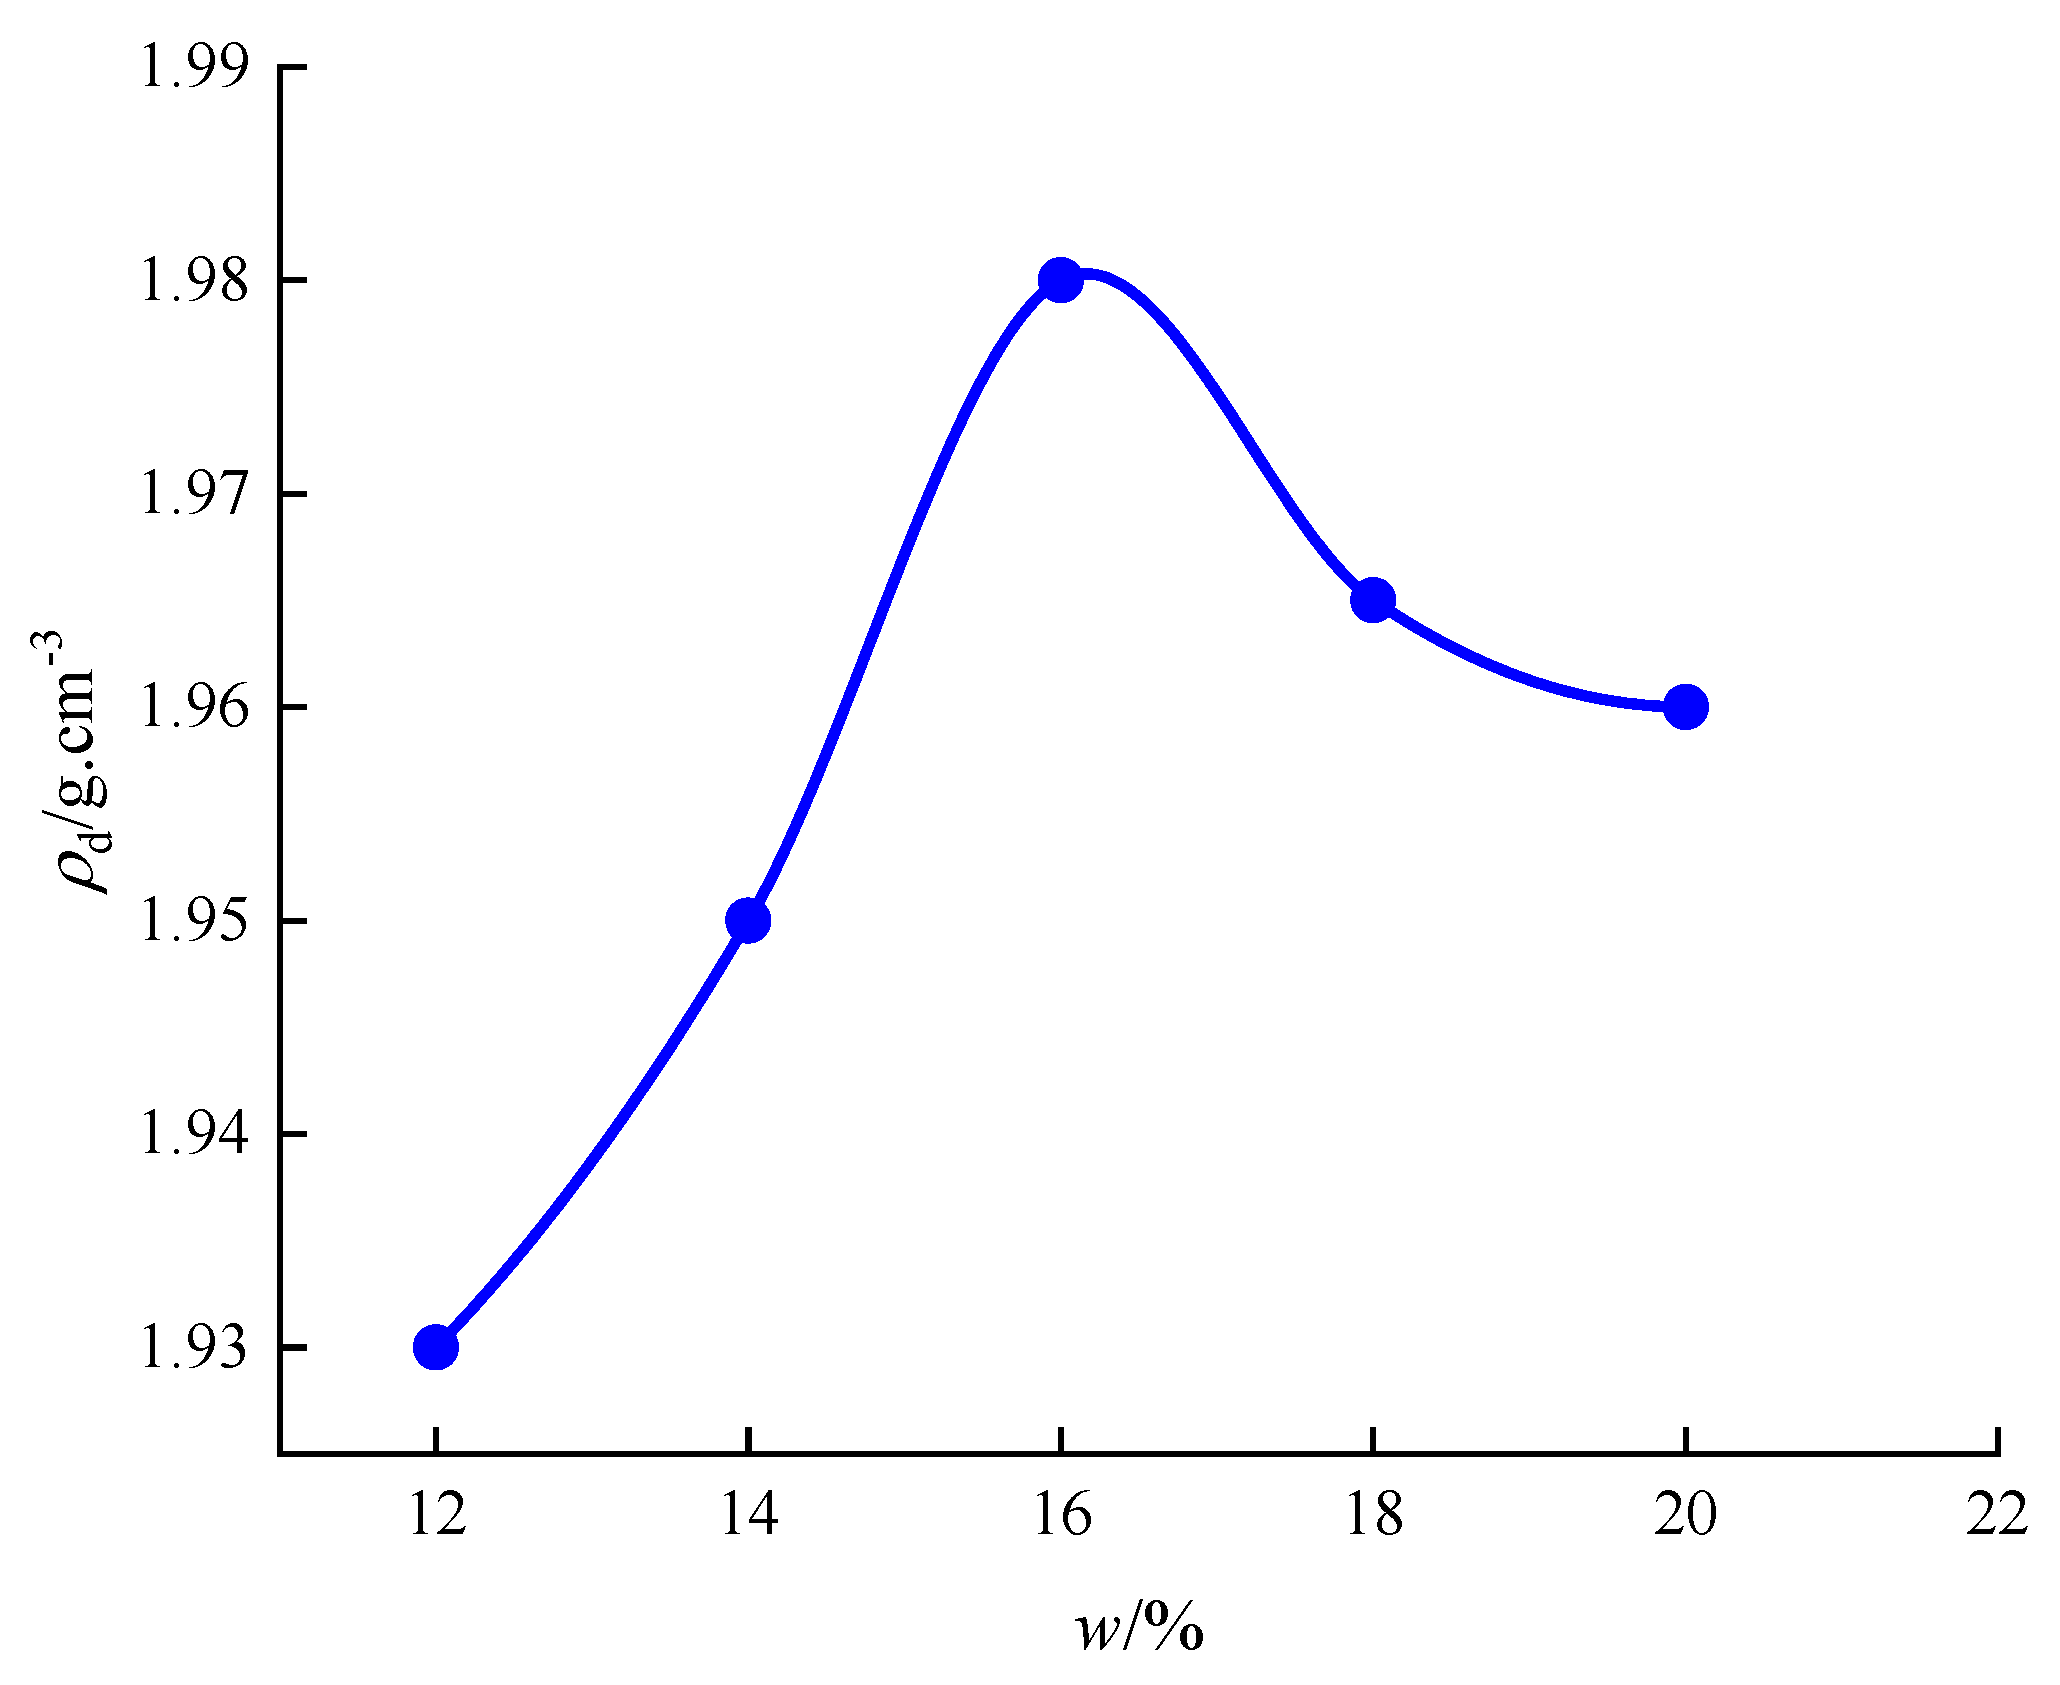
2.3.2. Compaction Test
- (1)
- The marine engineering waste silt was dried, broken into pieces, and then passed through a 40 mm sieve.
- (2)
- Soil samples with water contents of 12%, 14%, 16%, 18%, and 20% were prepared by even and good mixing for backup, respectively.
- (3)
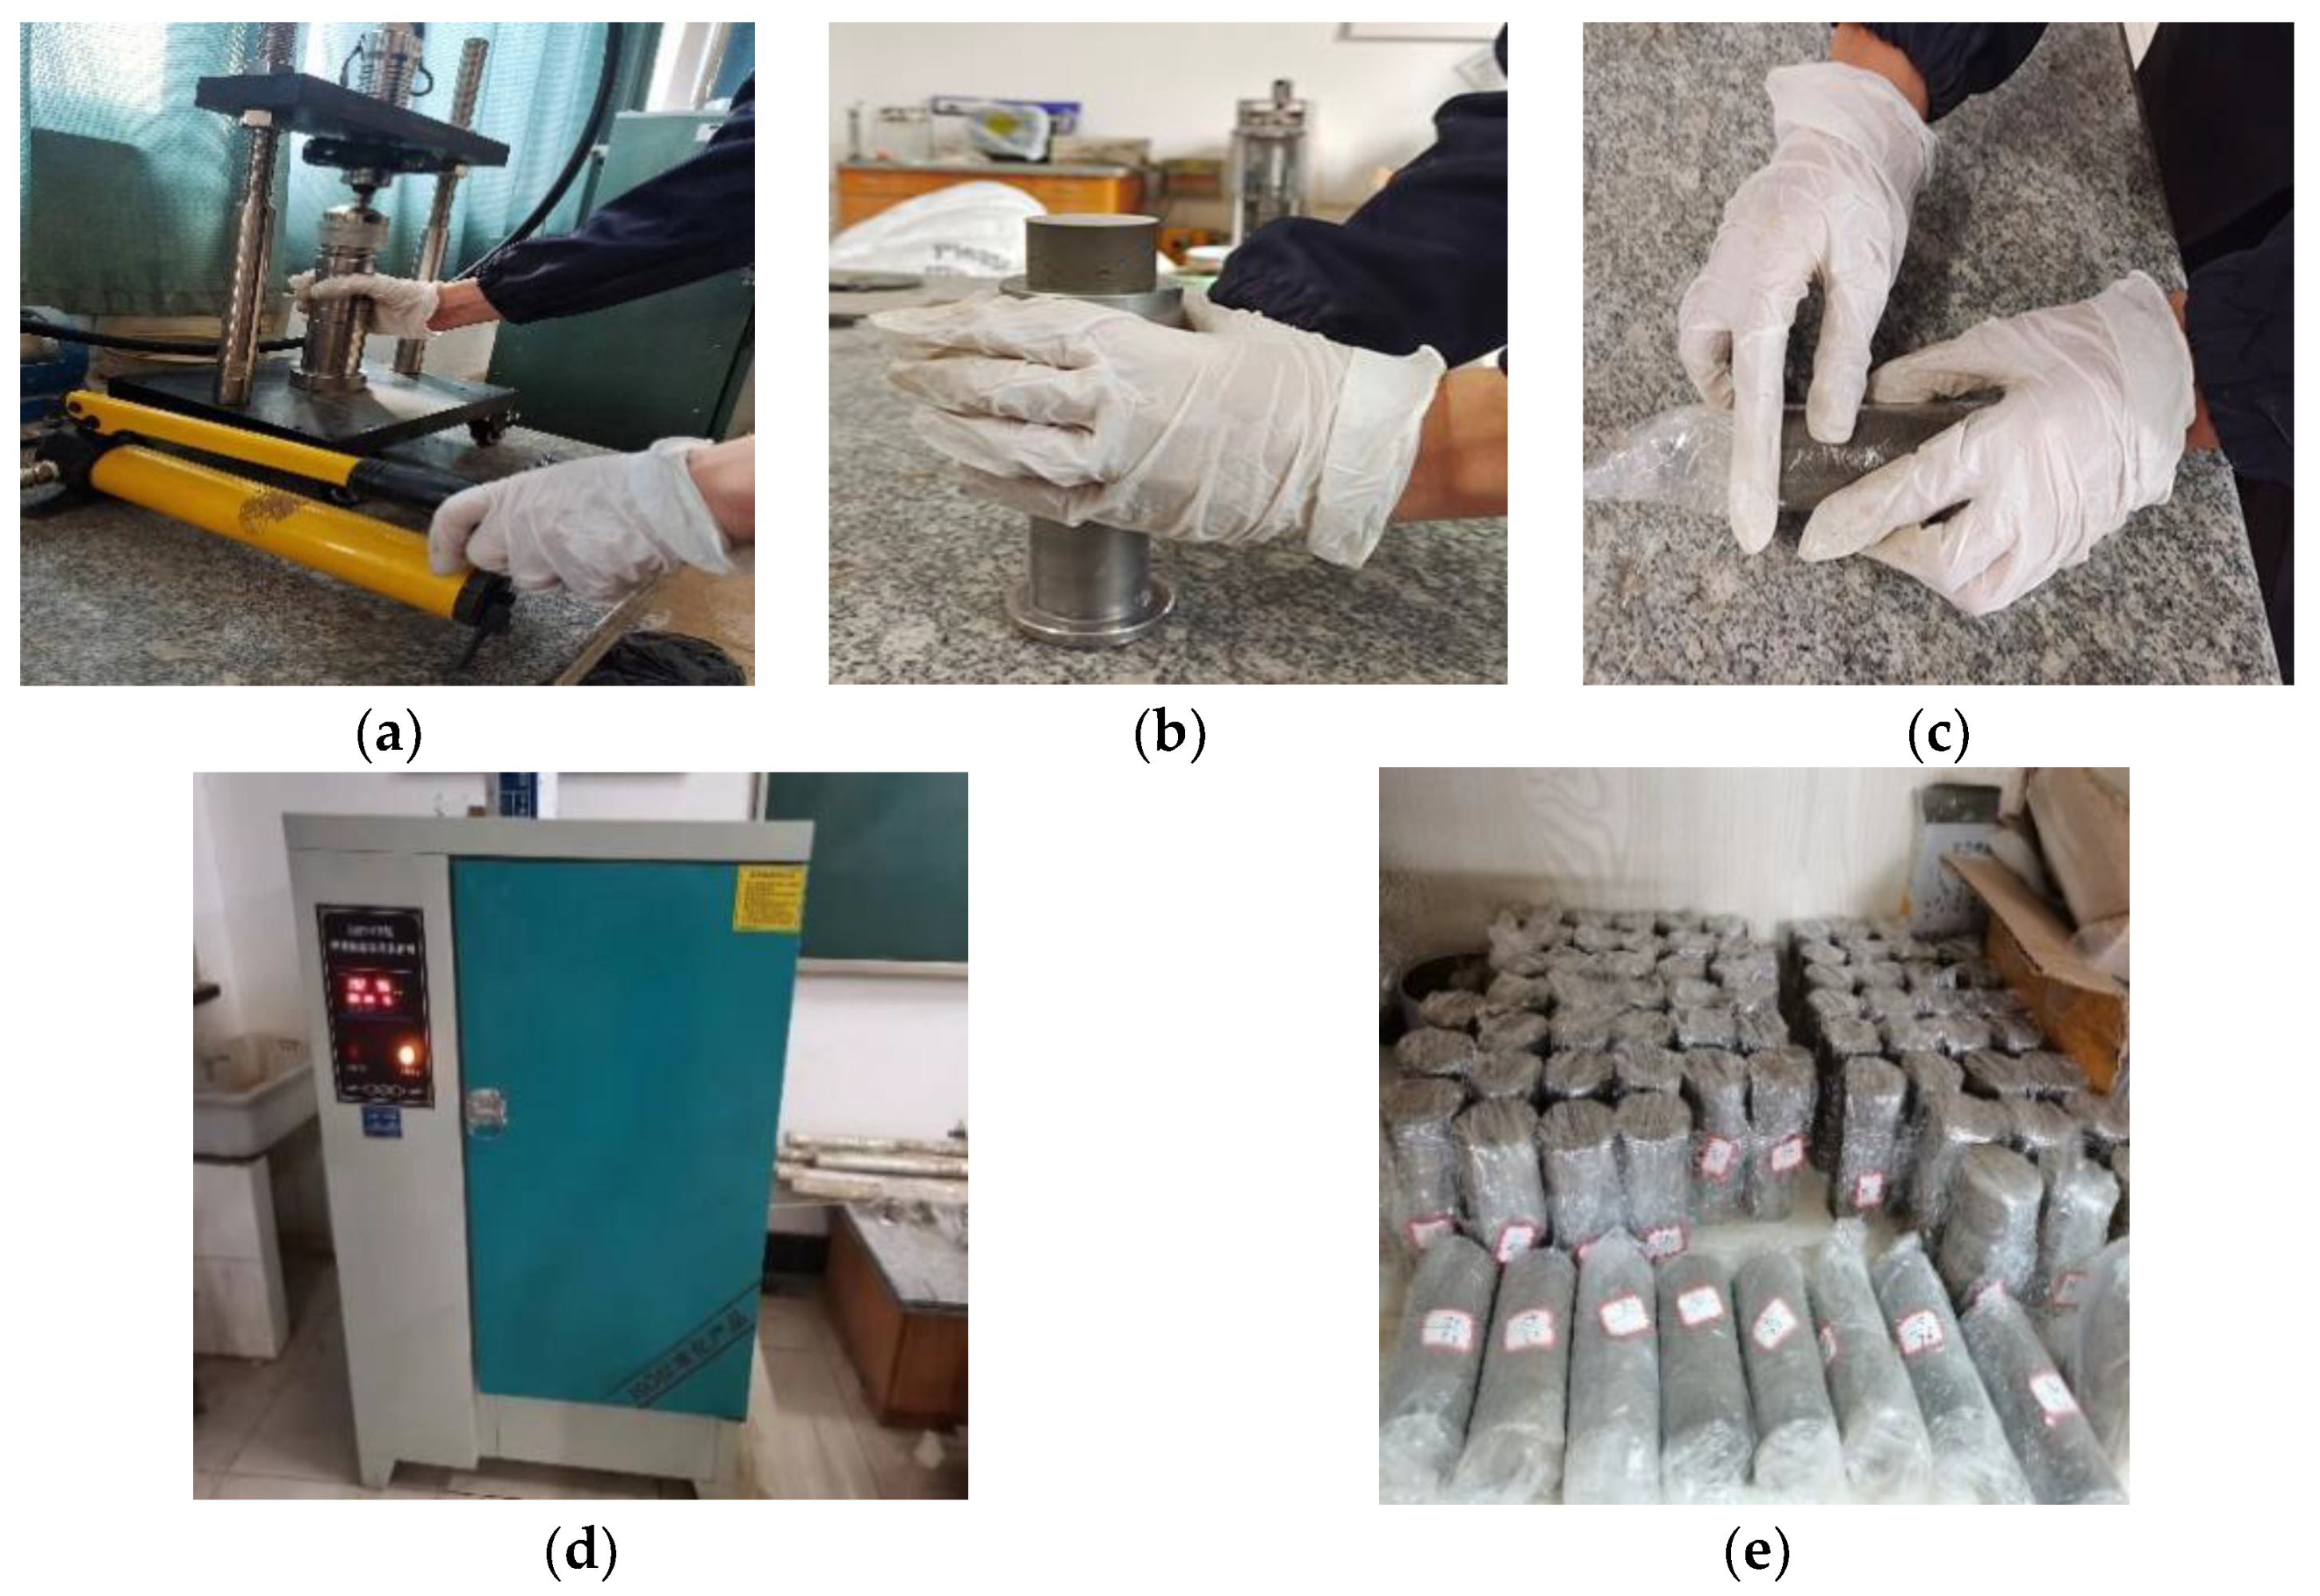
- The net weight of the compaction cylinder with an inner diameter of 102 mm and a height of 116 mm was weighed and numbered as m1, and then, the compaction cylinder was placed on hard, horizontal ground.
- (4)
- A thin layer of Vaseline was wiped around the inside wall of the compaction cylinder, and a plastic film was placed on the bottom plate.
- (5)
- A specific amount of dry soil with the designed water content was poured into the compaction cylinder in three layers, during which the soil surface was flattened and compacted layer by layer. During the compaction process, it should be noted that the hammer is free to plumb down, and the hammering point should be evenly distributed on the soil surface. The height of each layer after compaction should be roughly equal, and the soil surface at the interface of the two layers should be roughened to increase the interlock of each layer.
- (6)
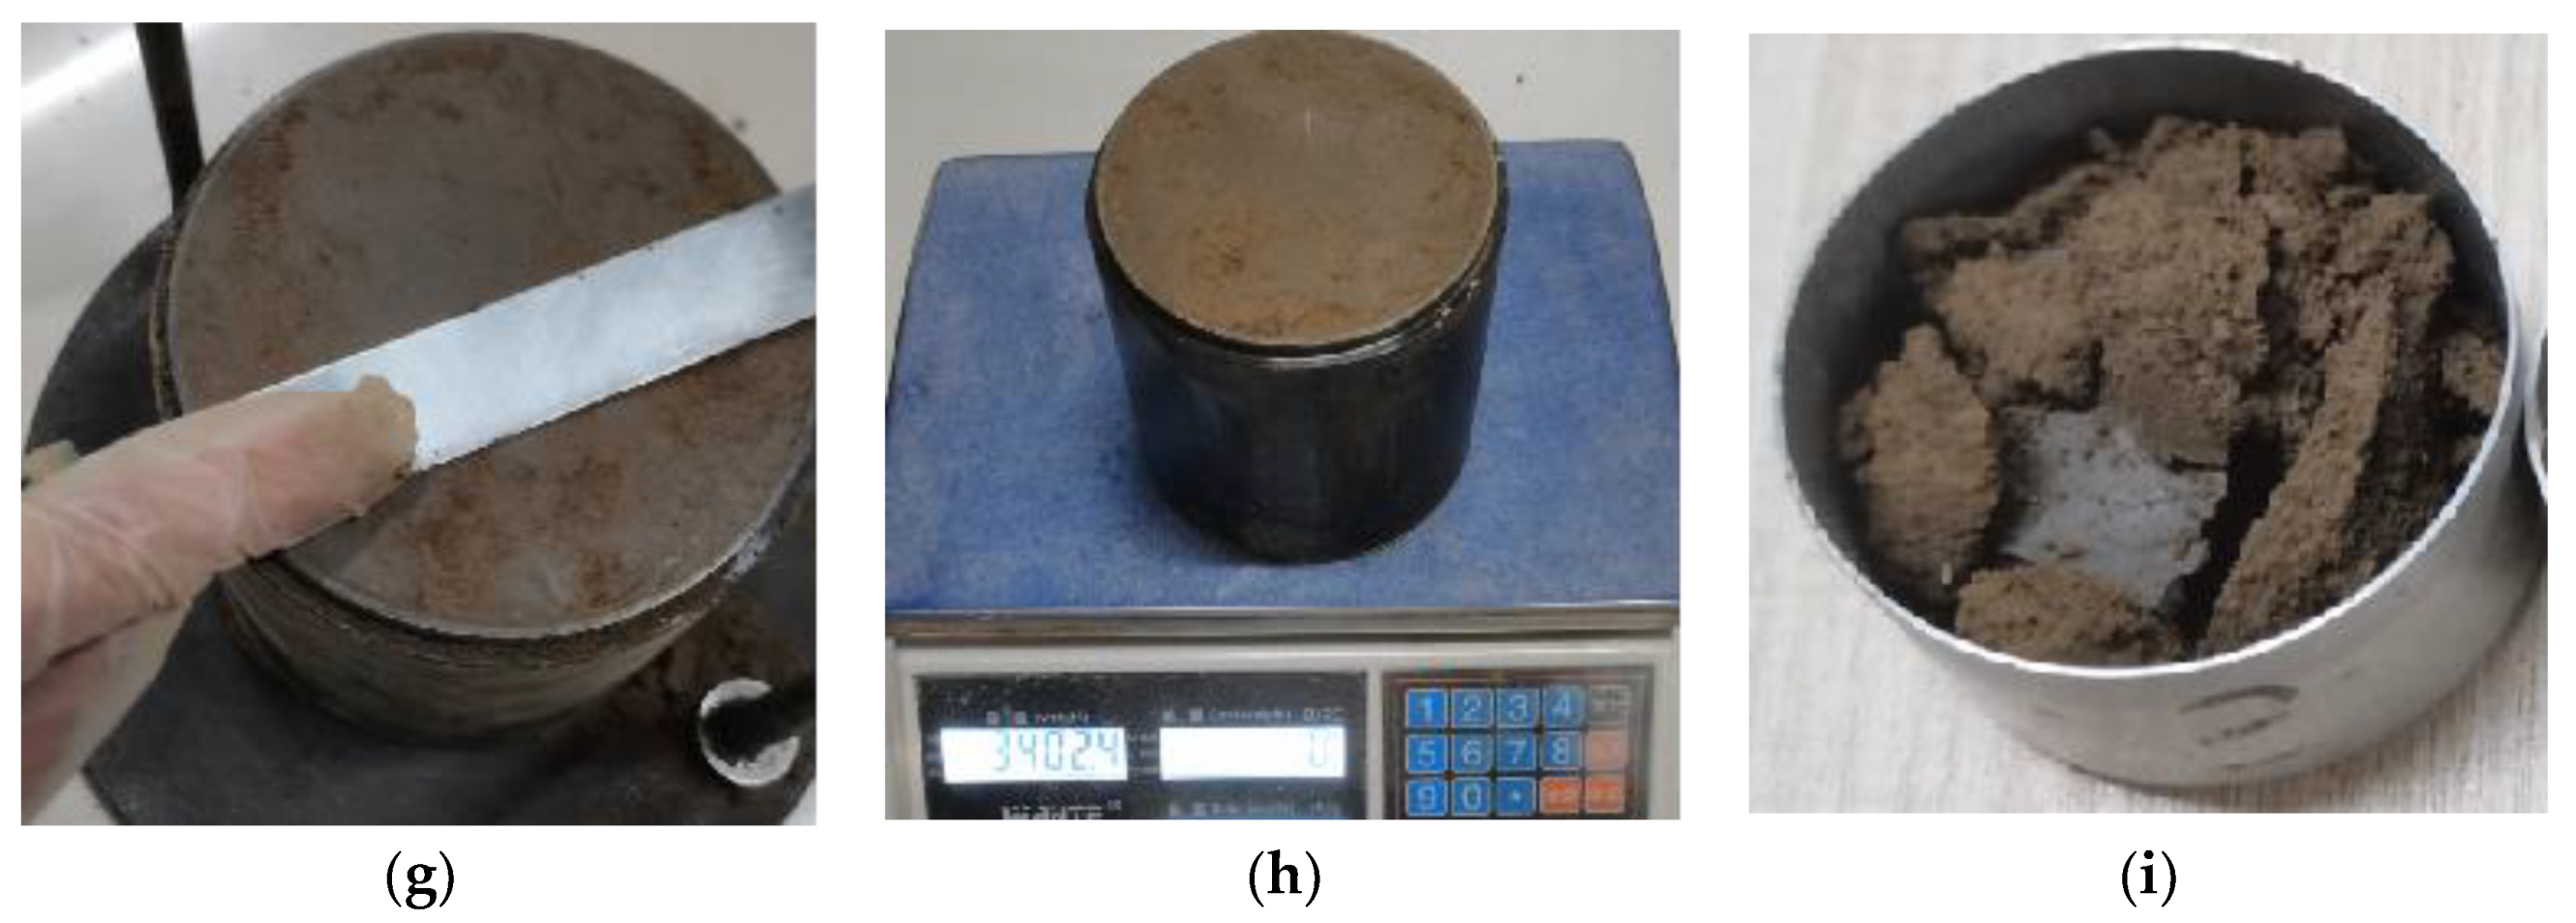
- After compaction, the sample height beyond the top of the compaction cylinder should be removed. After cutting and digging along the inner wall of the casing with a soil cutter, the casing was twisted and taken down to measure the super-elevation and average the multiple measured values to ensure that the value was less than the specification limit of 6 mm.
- (7)
- Carefully trim the sample along the tap top and remove the bottom plate. When the bottom surface of the sample exceeds the outside of the tube, it should be repaired.
- (8)
- Clean the outer wall of the cylinder, weigh it, and set the mass to m2. Then, two soil samples of 15~30 g were taken from the center of the soil mass, and the moisture content of the soil (w) was measured in parallel. As the cylinder volume, V, is constant, the density can be calculated by the following equation:
2.3.3. Solidified Soil Specimen Preparation
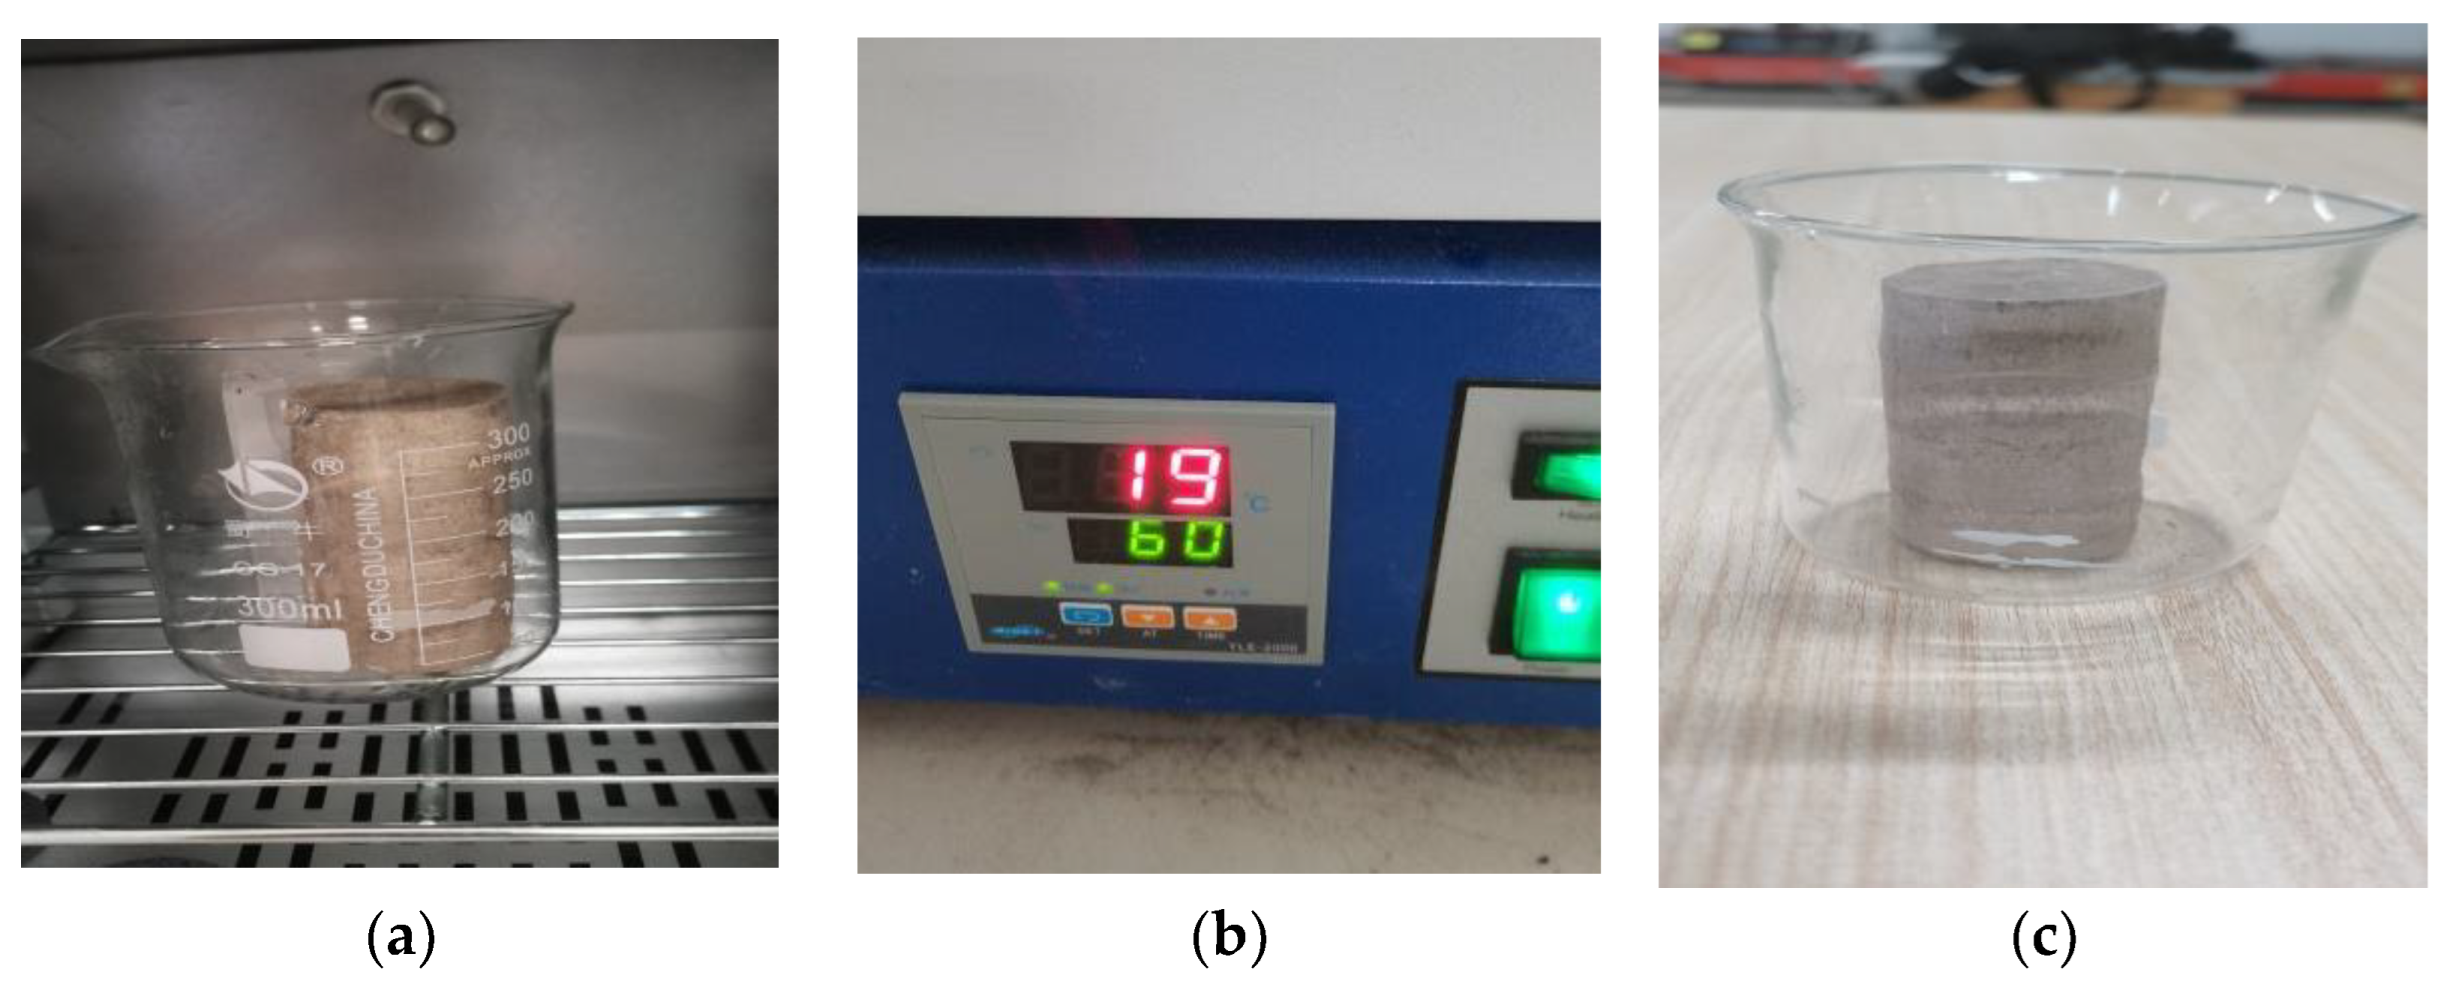
2.3.4. Dry-Wet Cycles
2.3.5. Scanning Electron Microscopy Test
2.3.6. X-ray Diffraction (XRD) Test
2.3.7. Unconfined Compressive Strength Test (UCS)
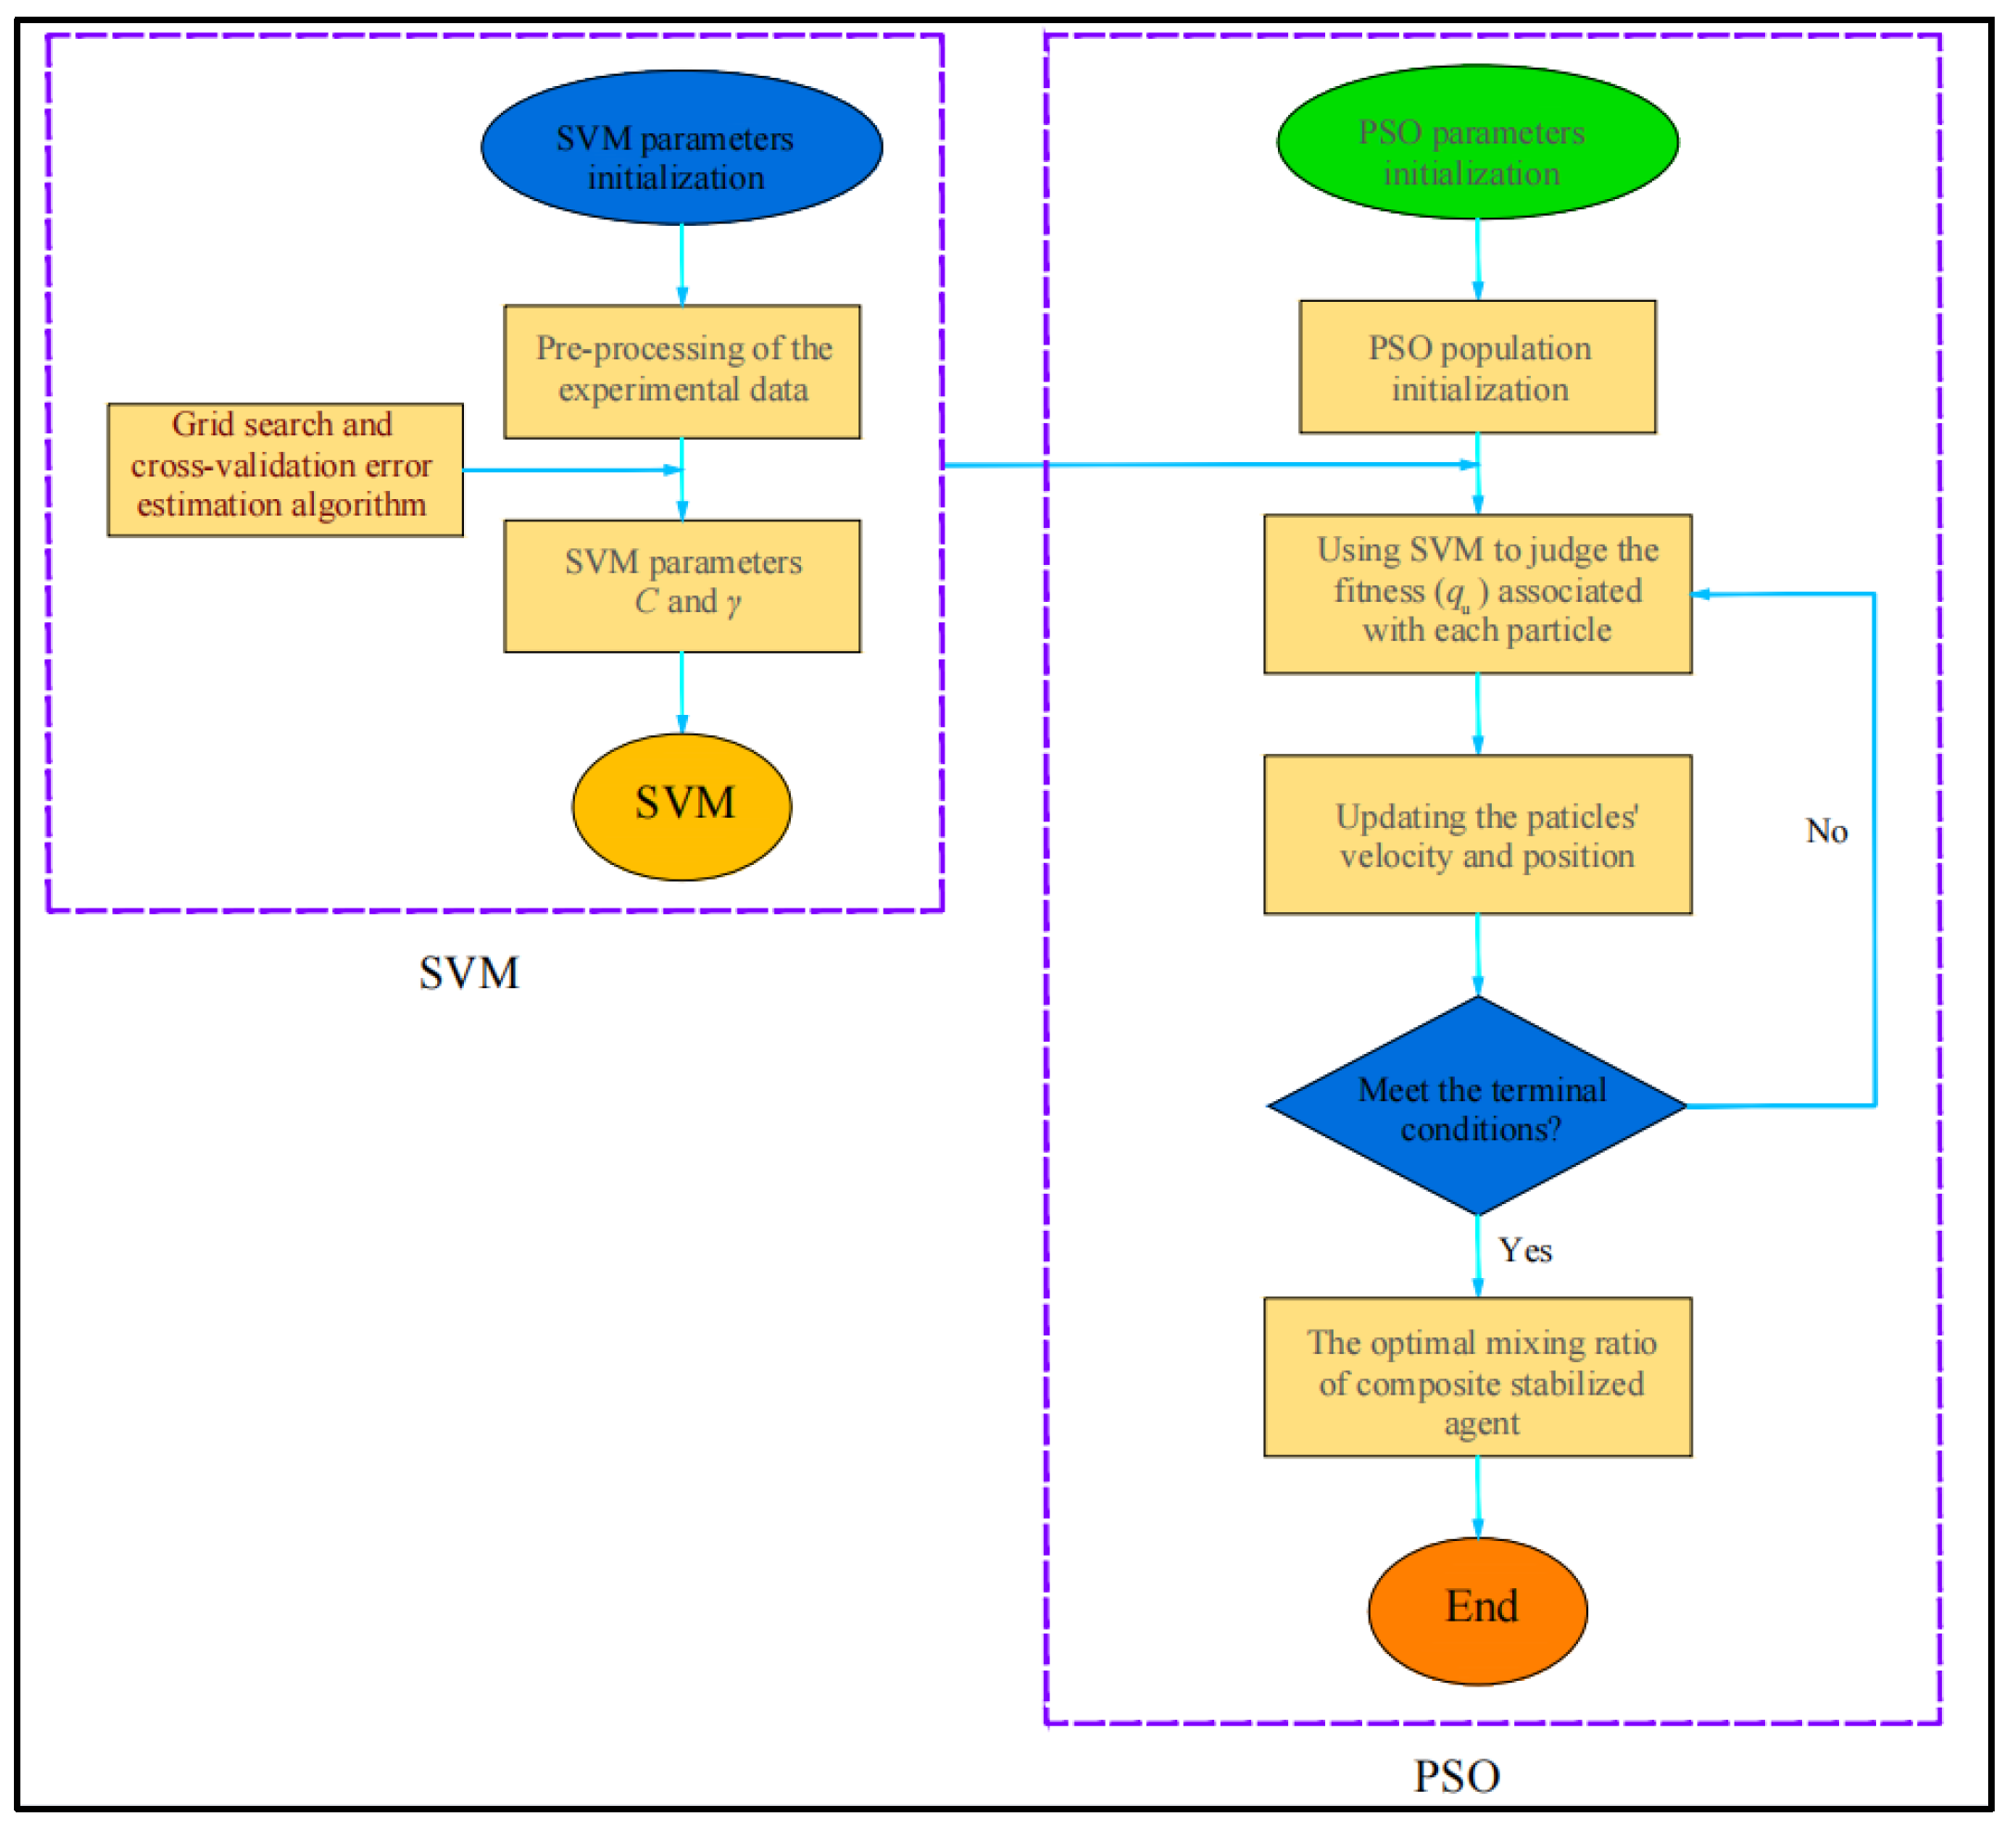
2.3.8. PSO–SVM
2.3.9. Image Processing
- (1)
- Abundance (C)
- (2)
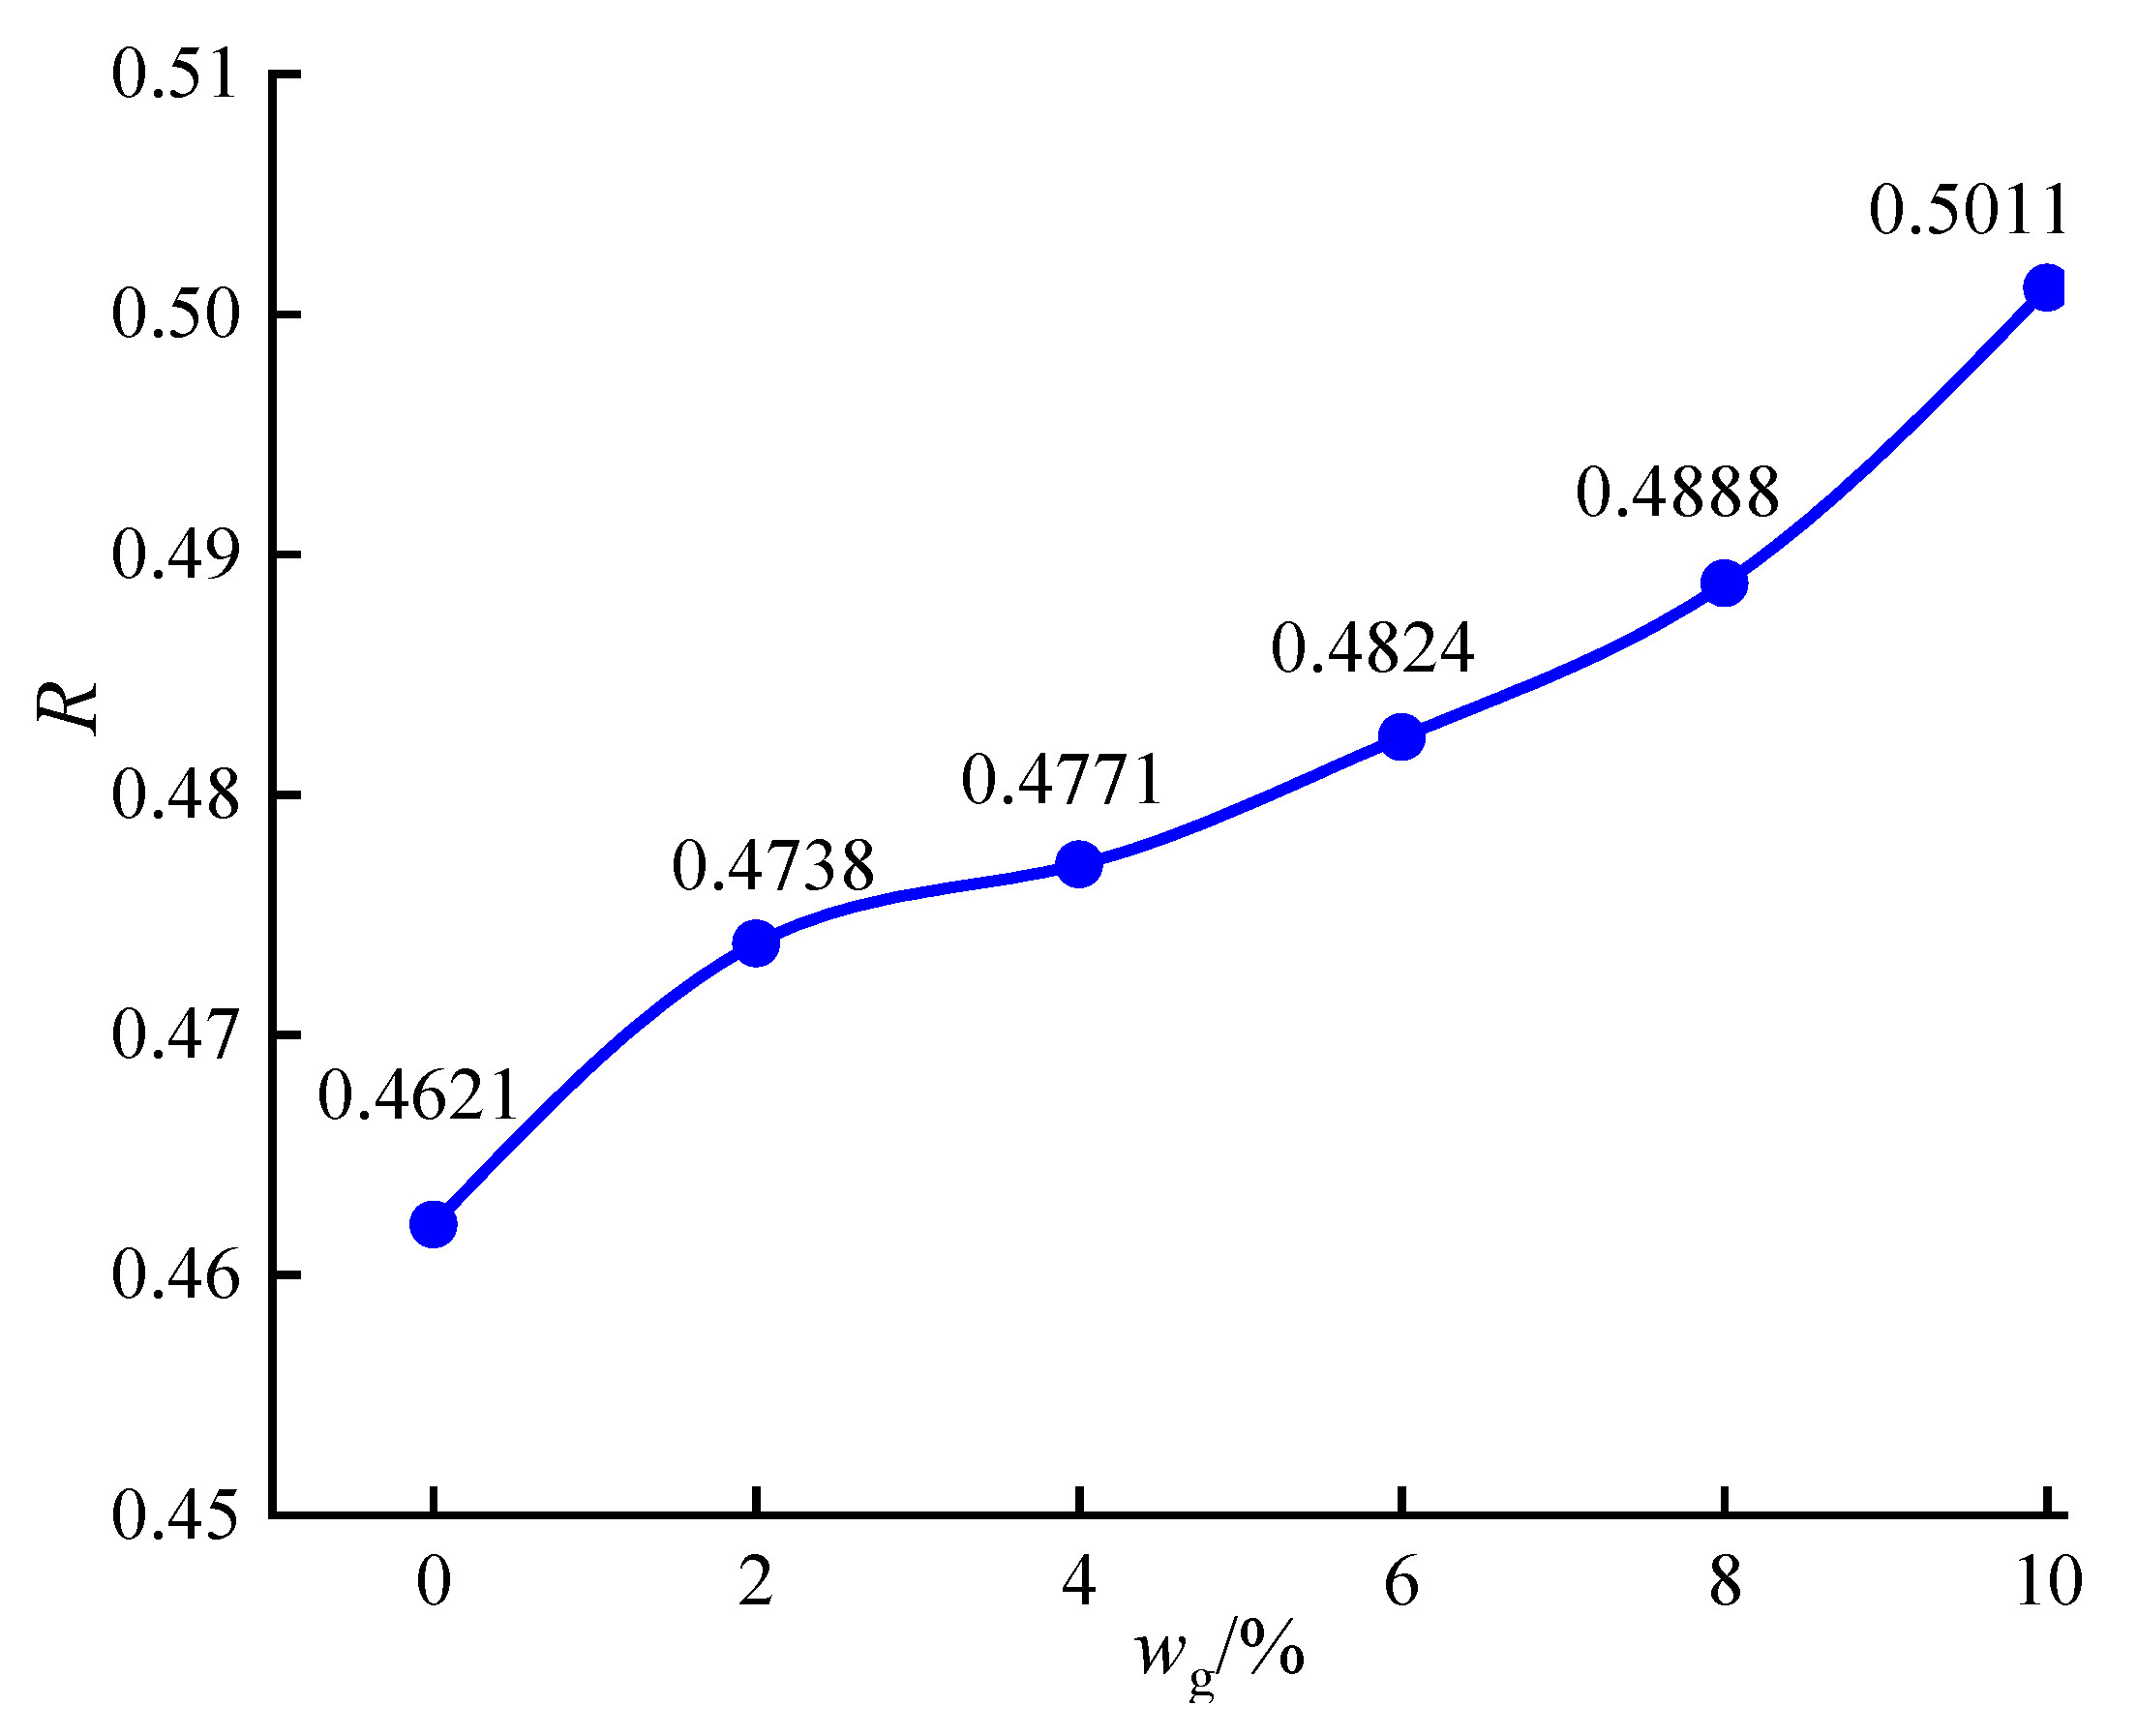
- Roundness (R)
- (3)
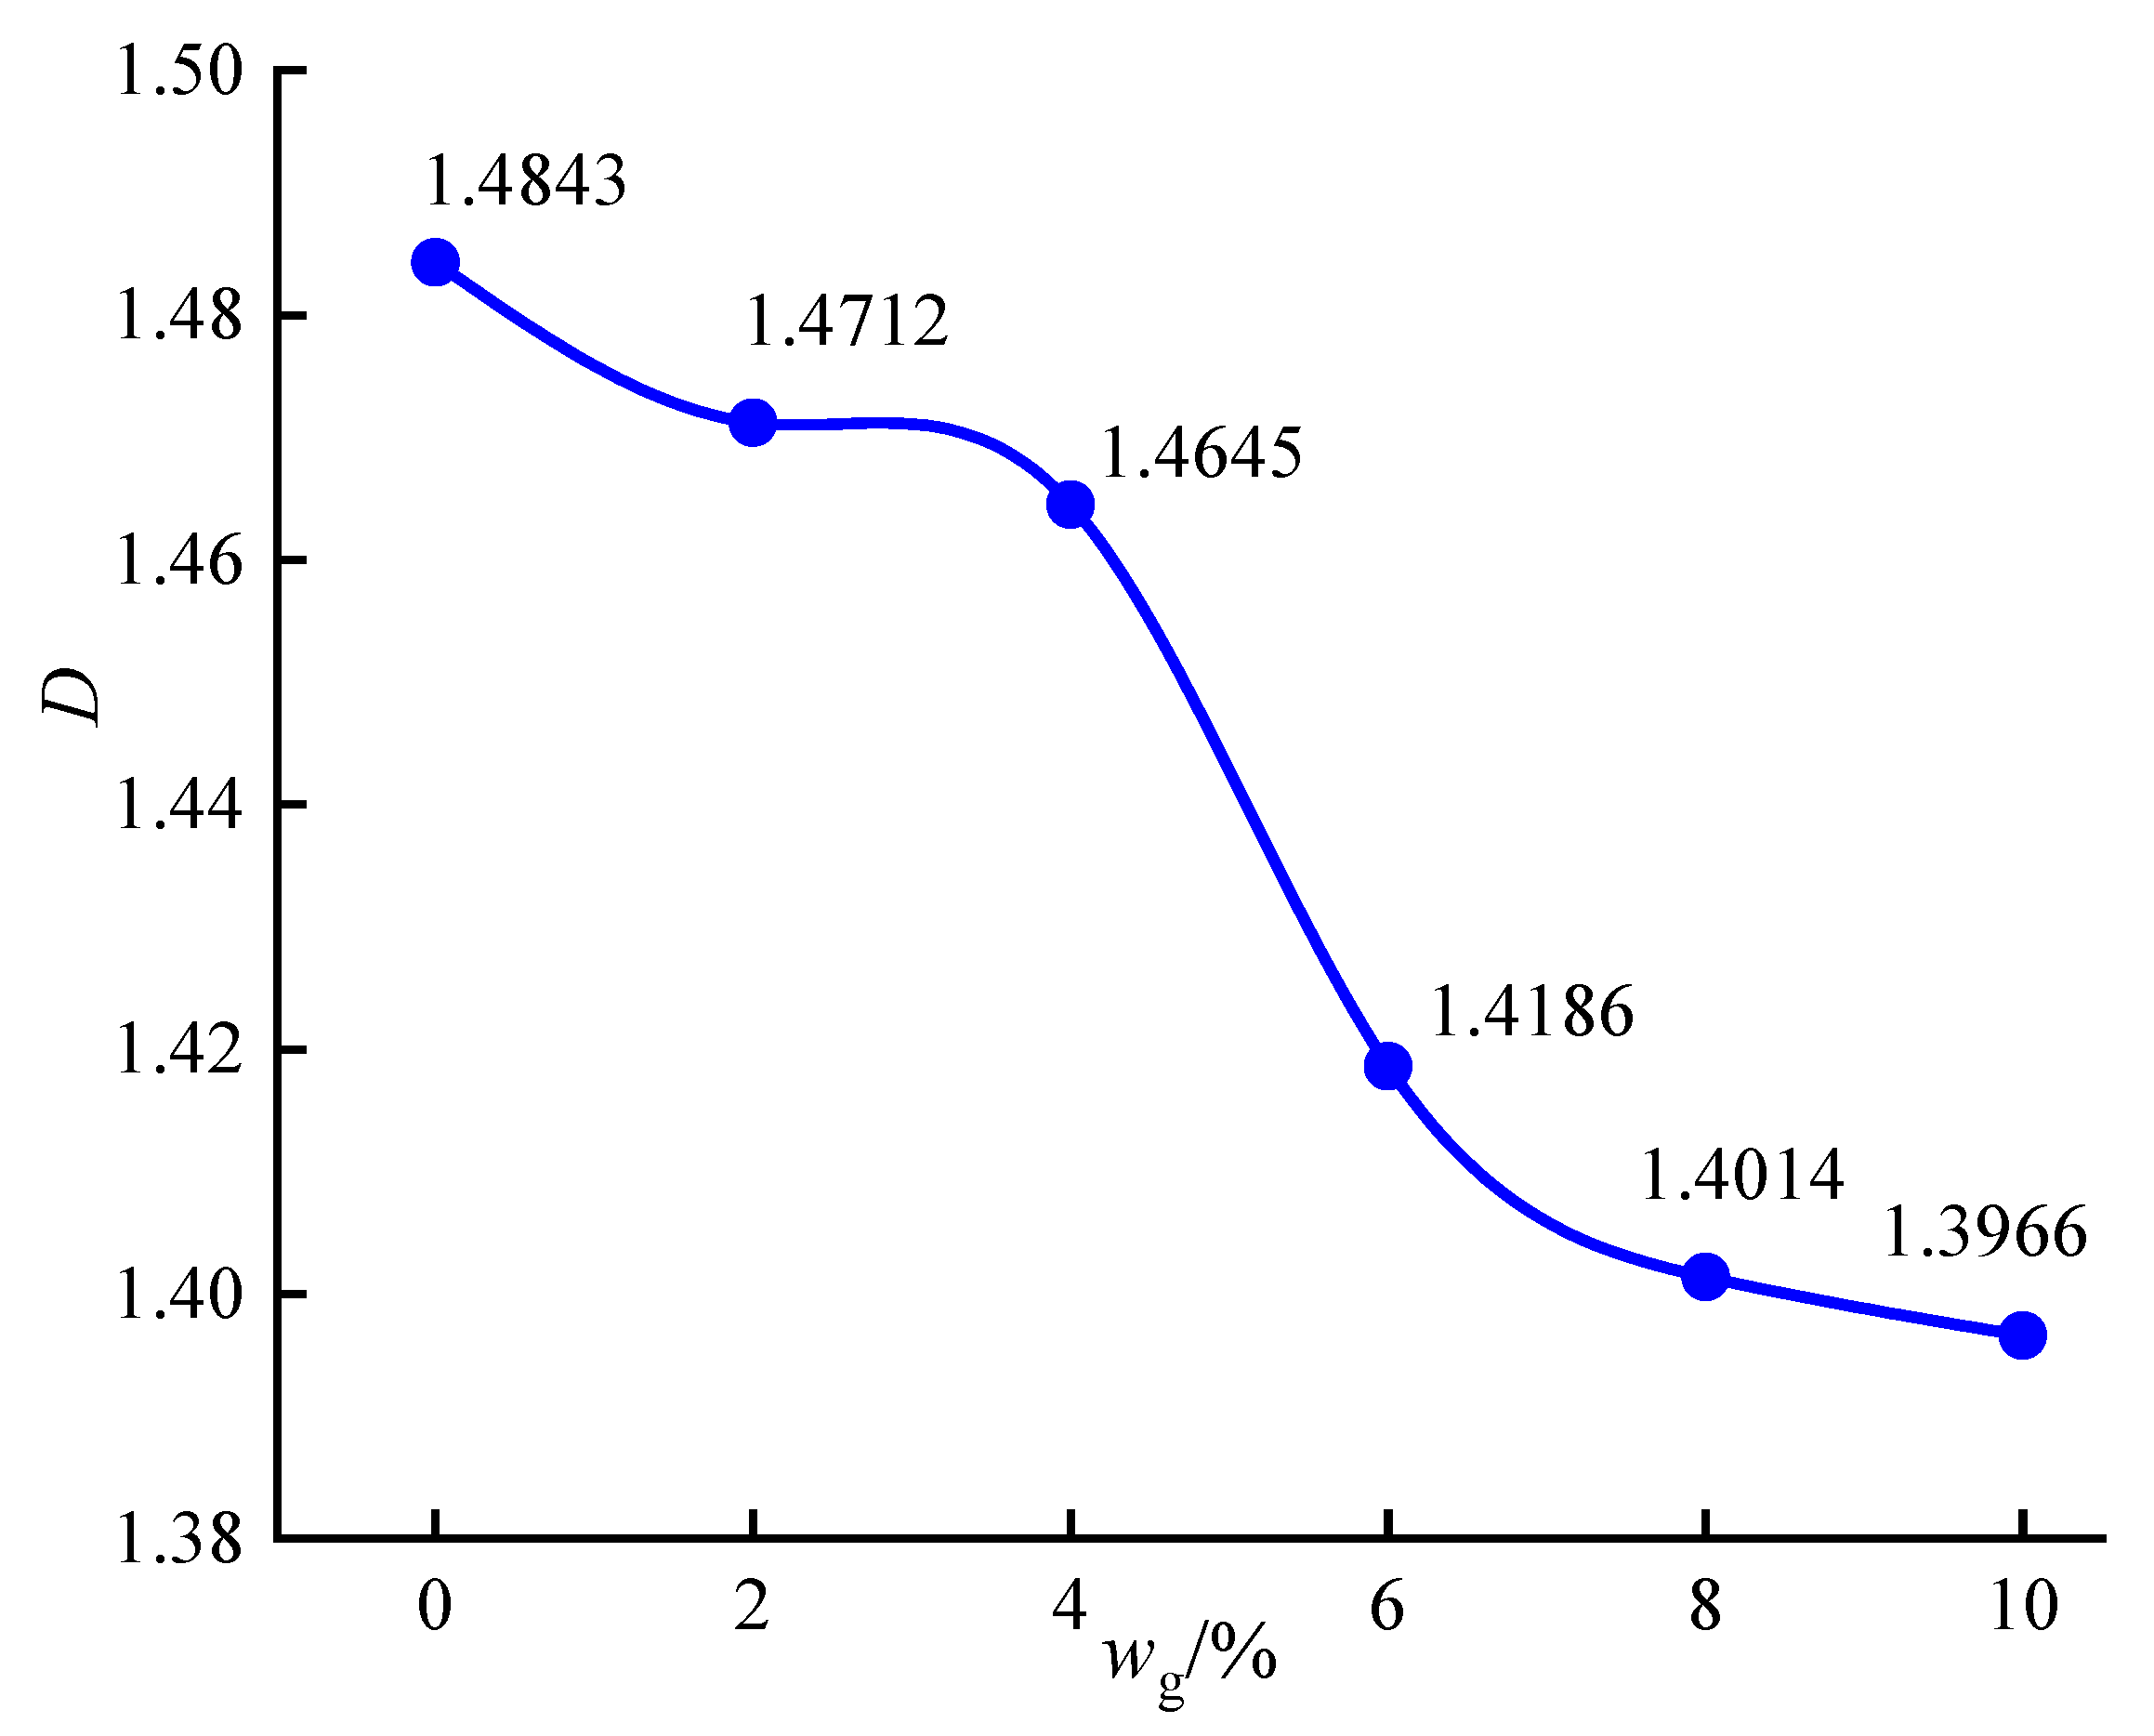
- Fractal dimension (D)
3. Results and Discussion
3.1. Optimum Ratio of Additives
3.2. Organic Matter Content of Marine Waste Silt
3.3. Compaction Test Results
3.4. Curing Mechanism of PZ-1 Stabilized Waste Silt
3.4.1. Chemical Compositions Analysis
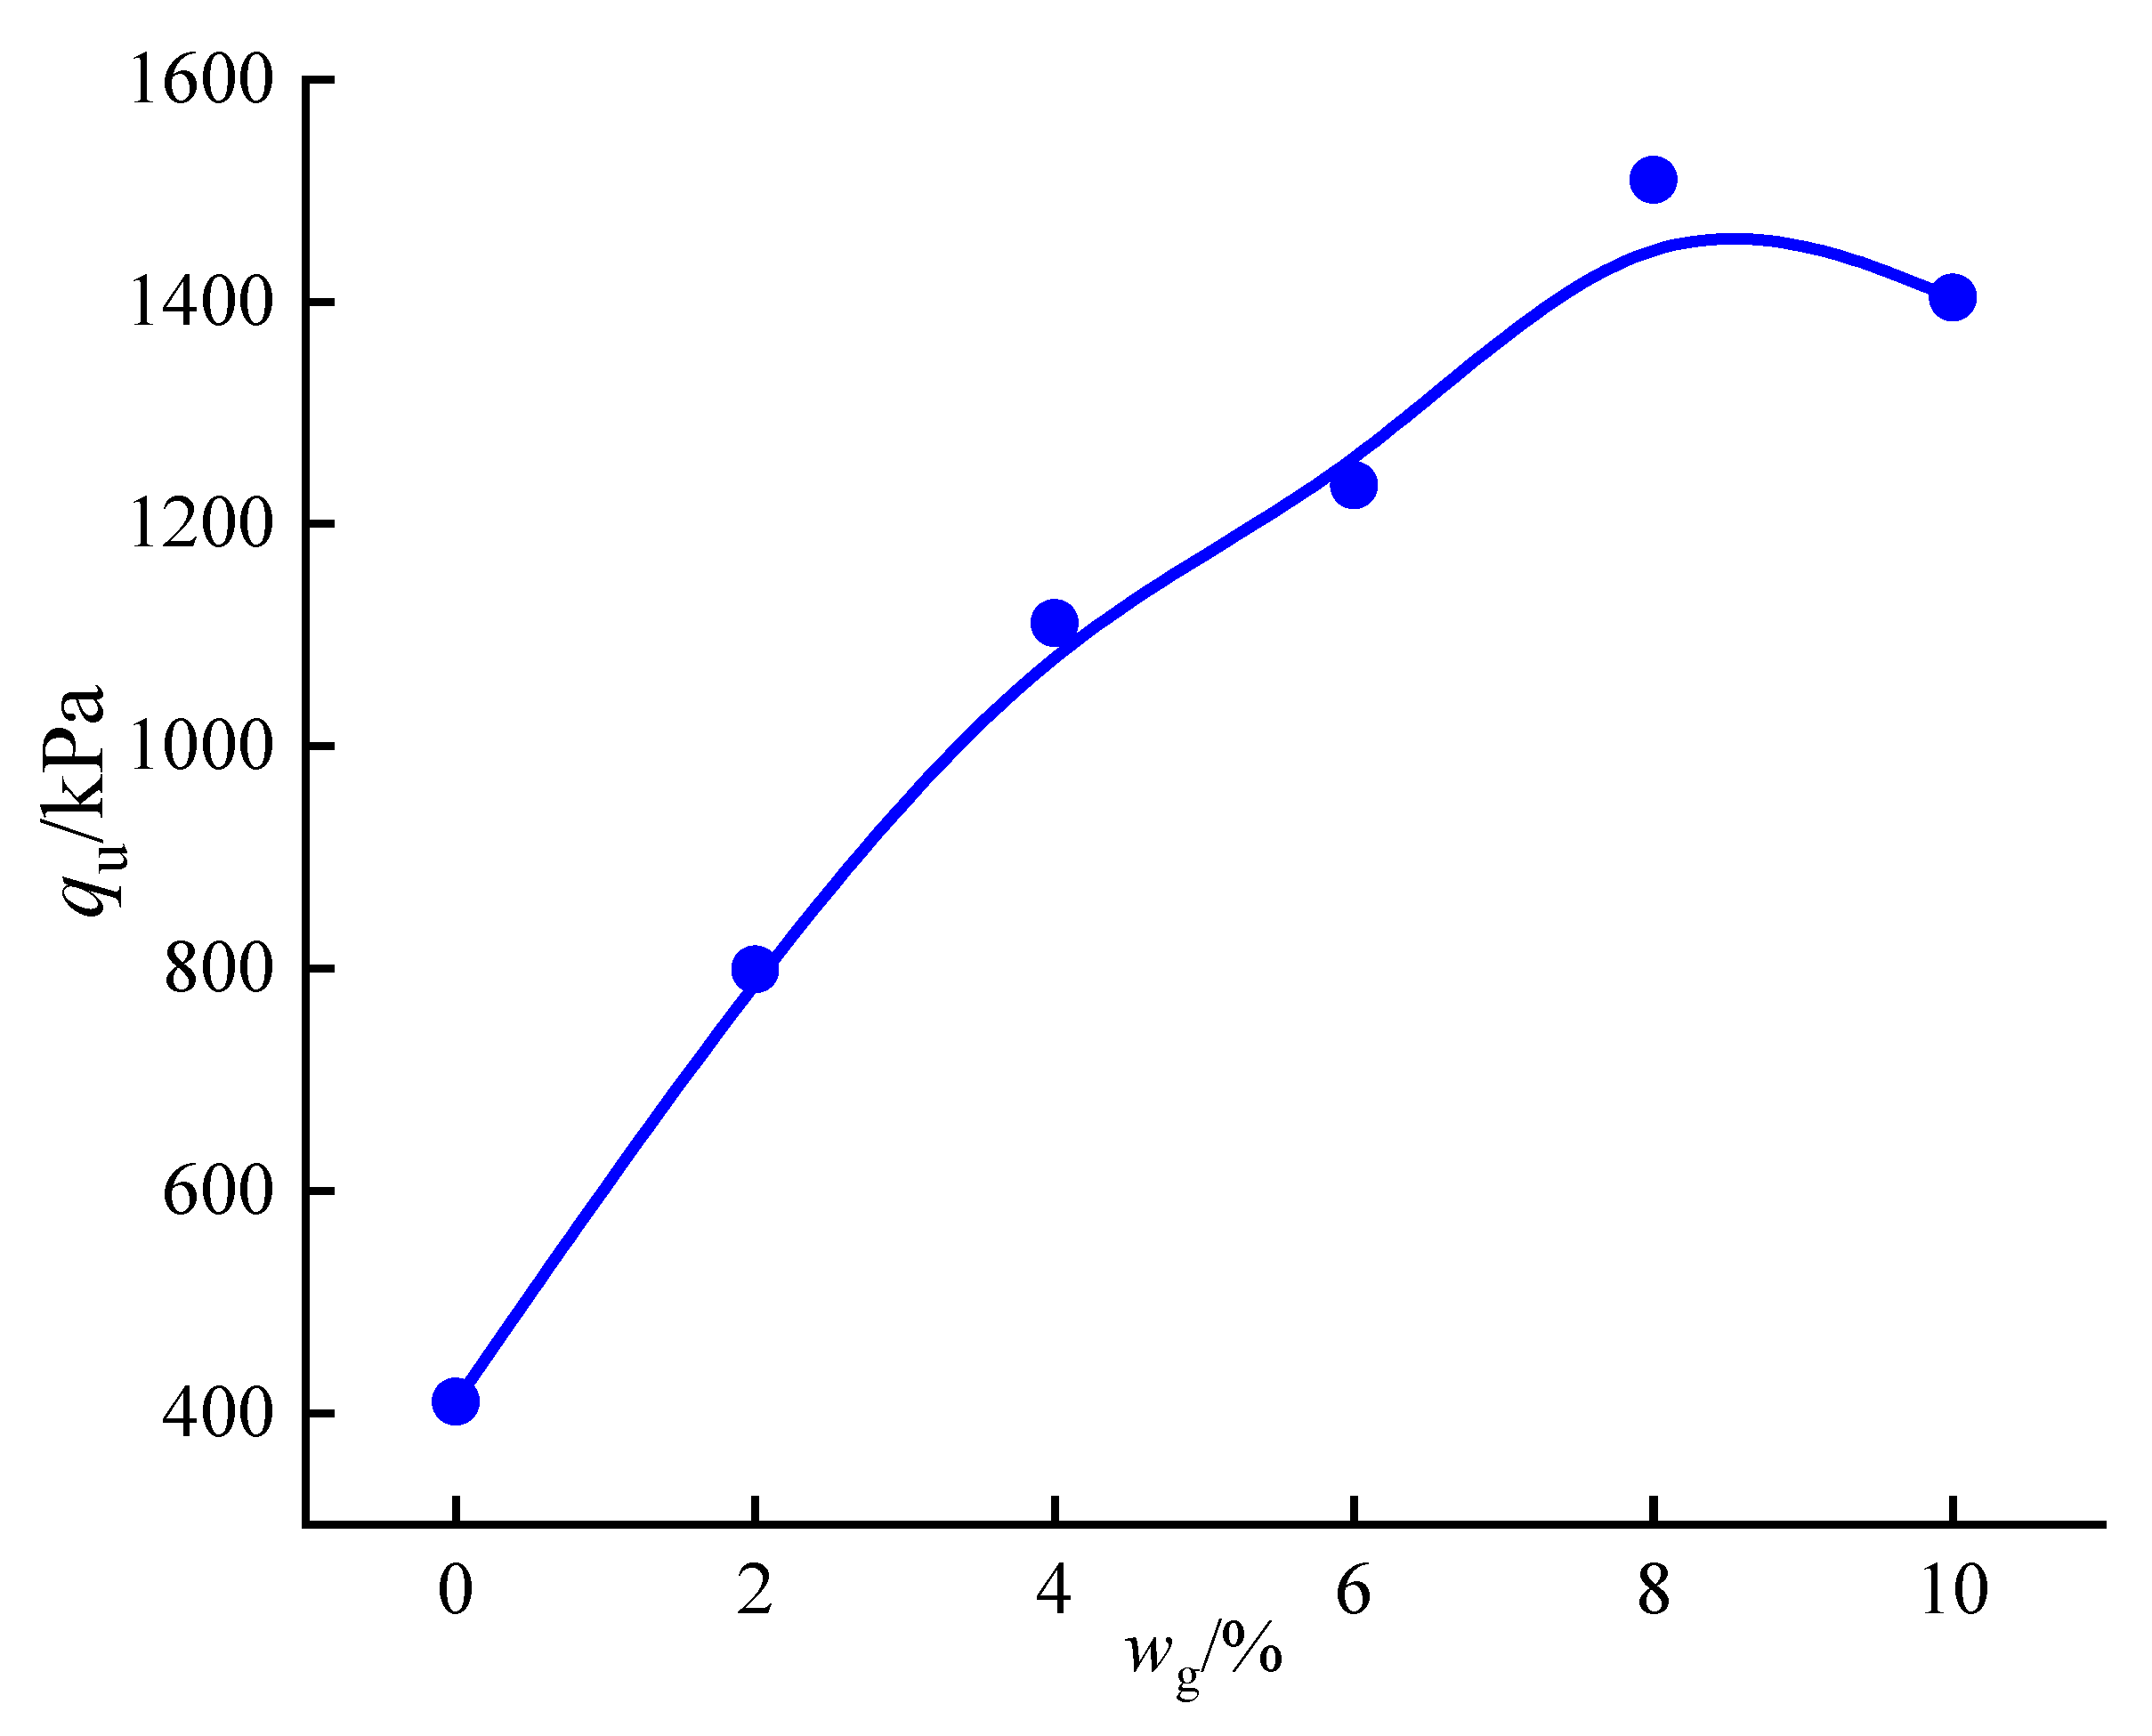
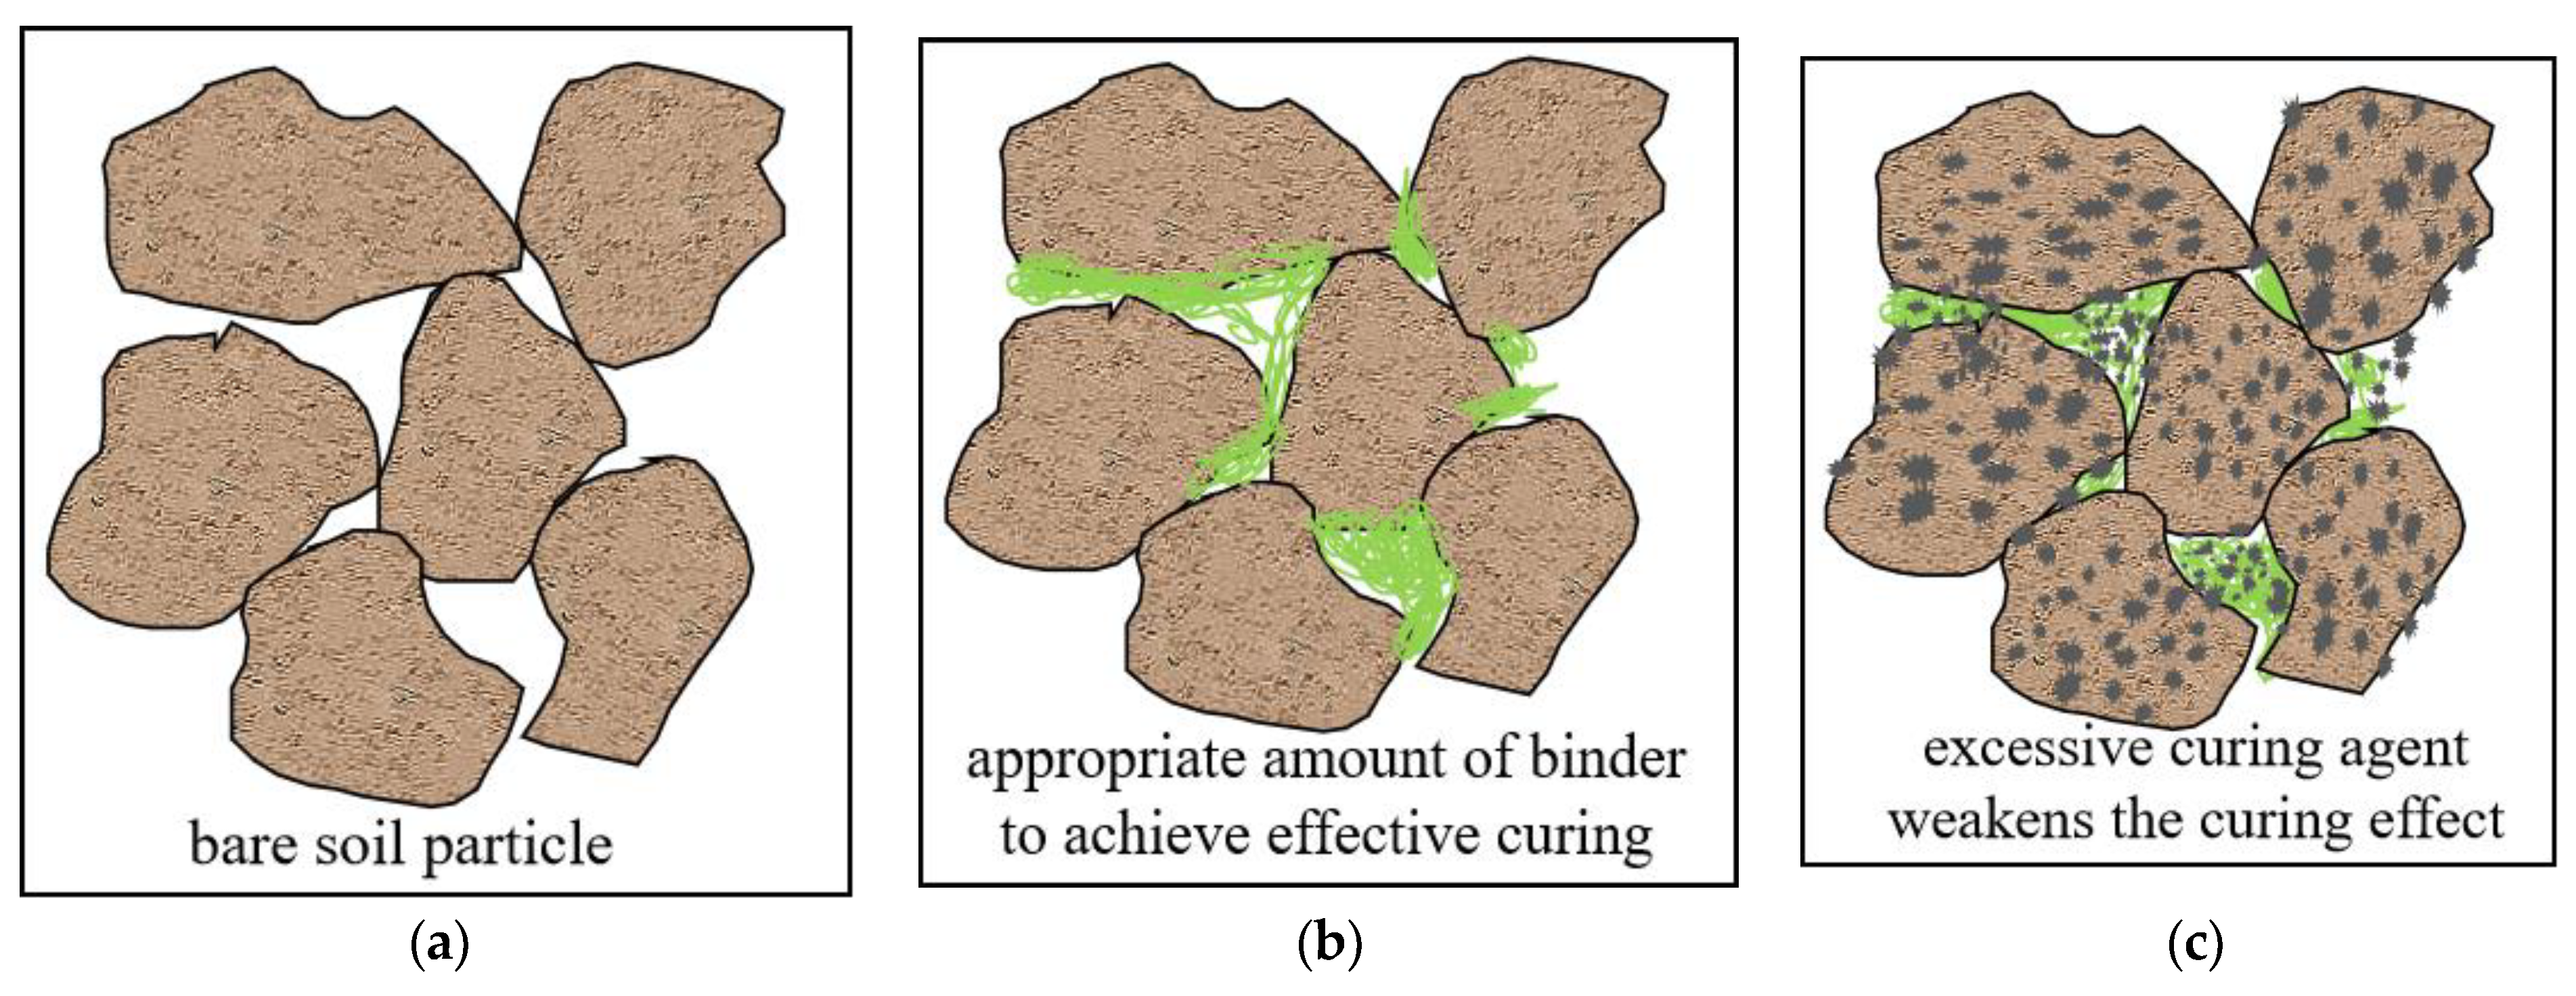
3.4.2. Effect of Curing Agent Dosage
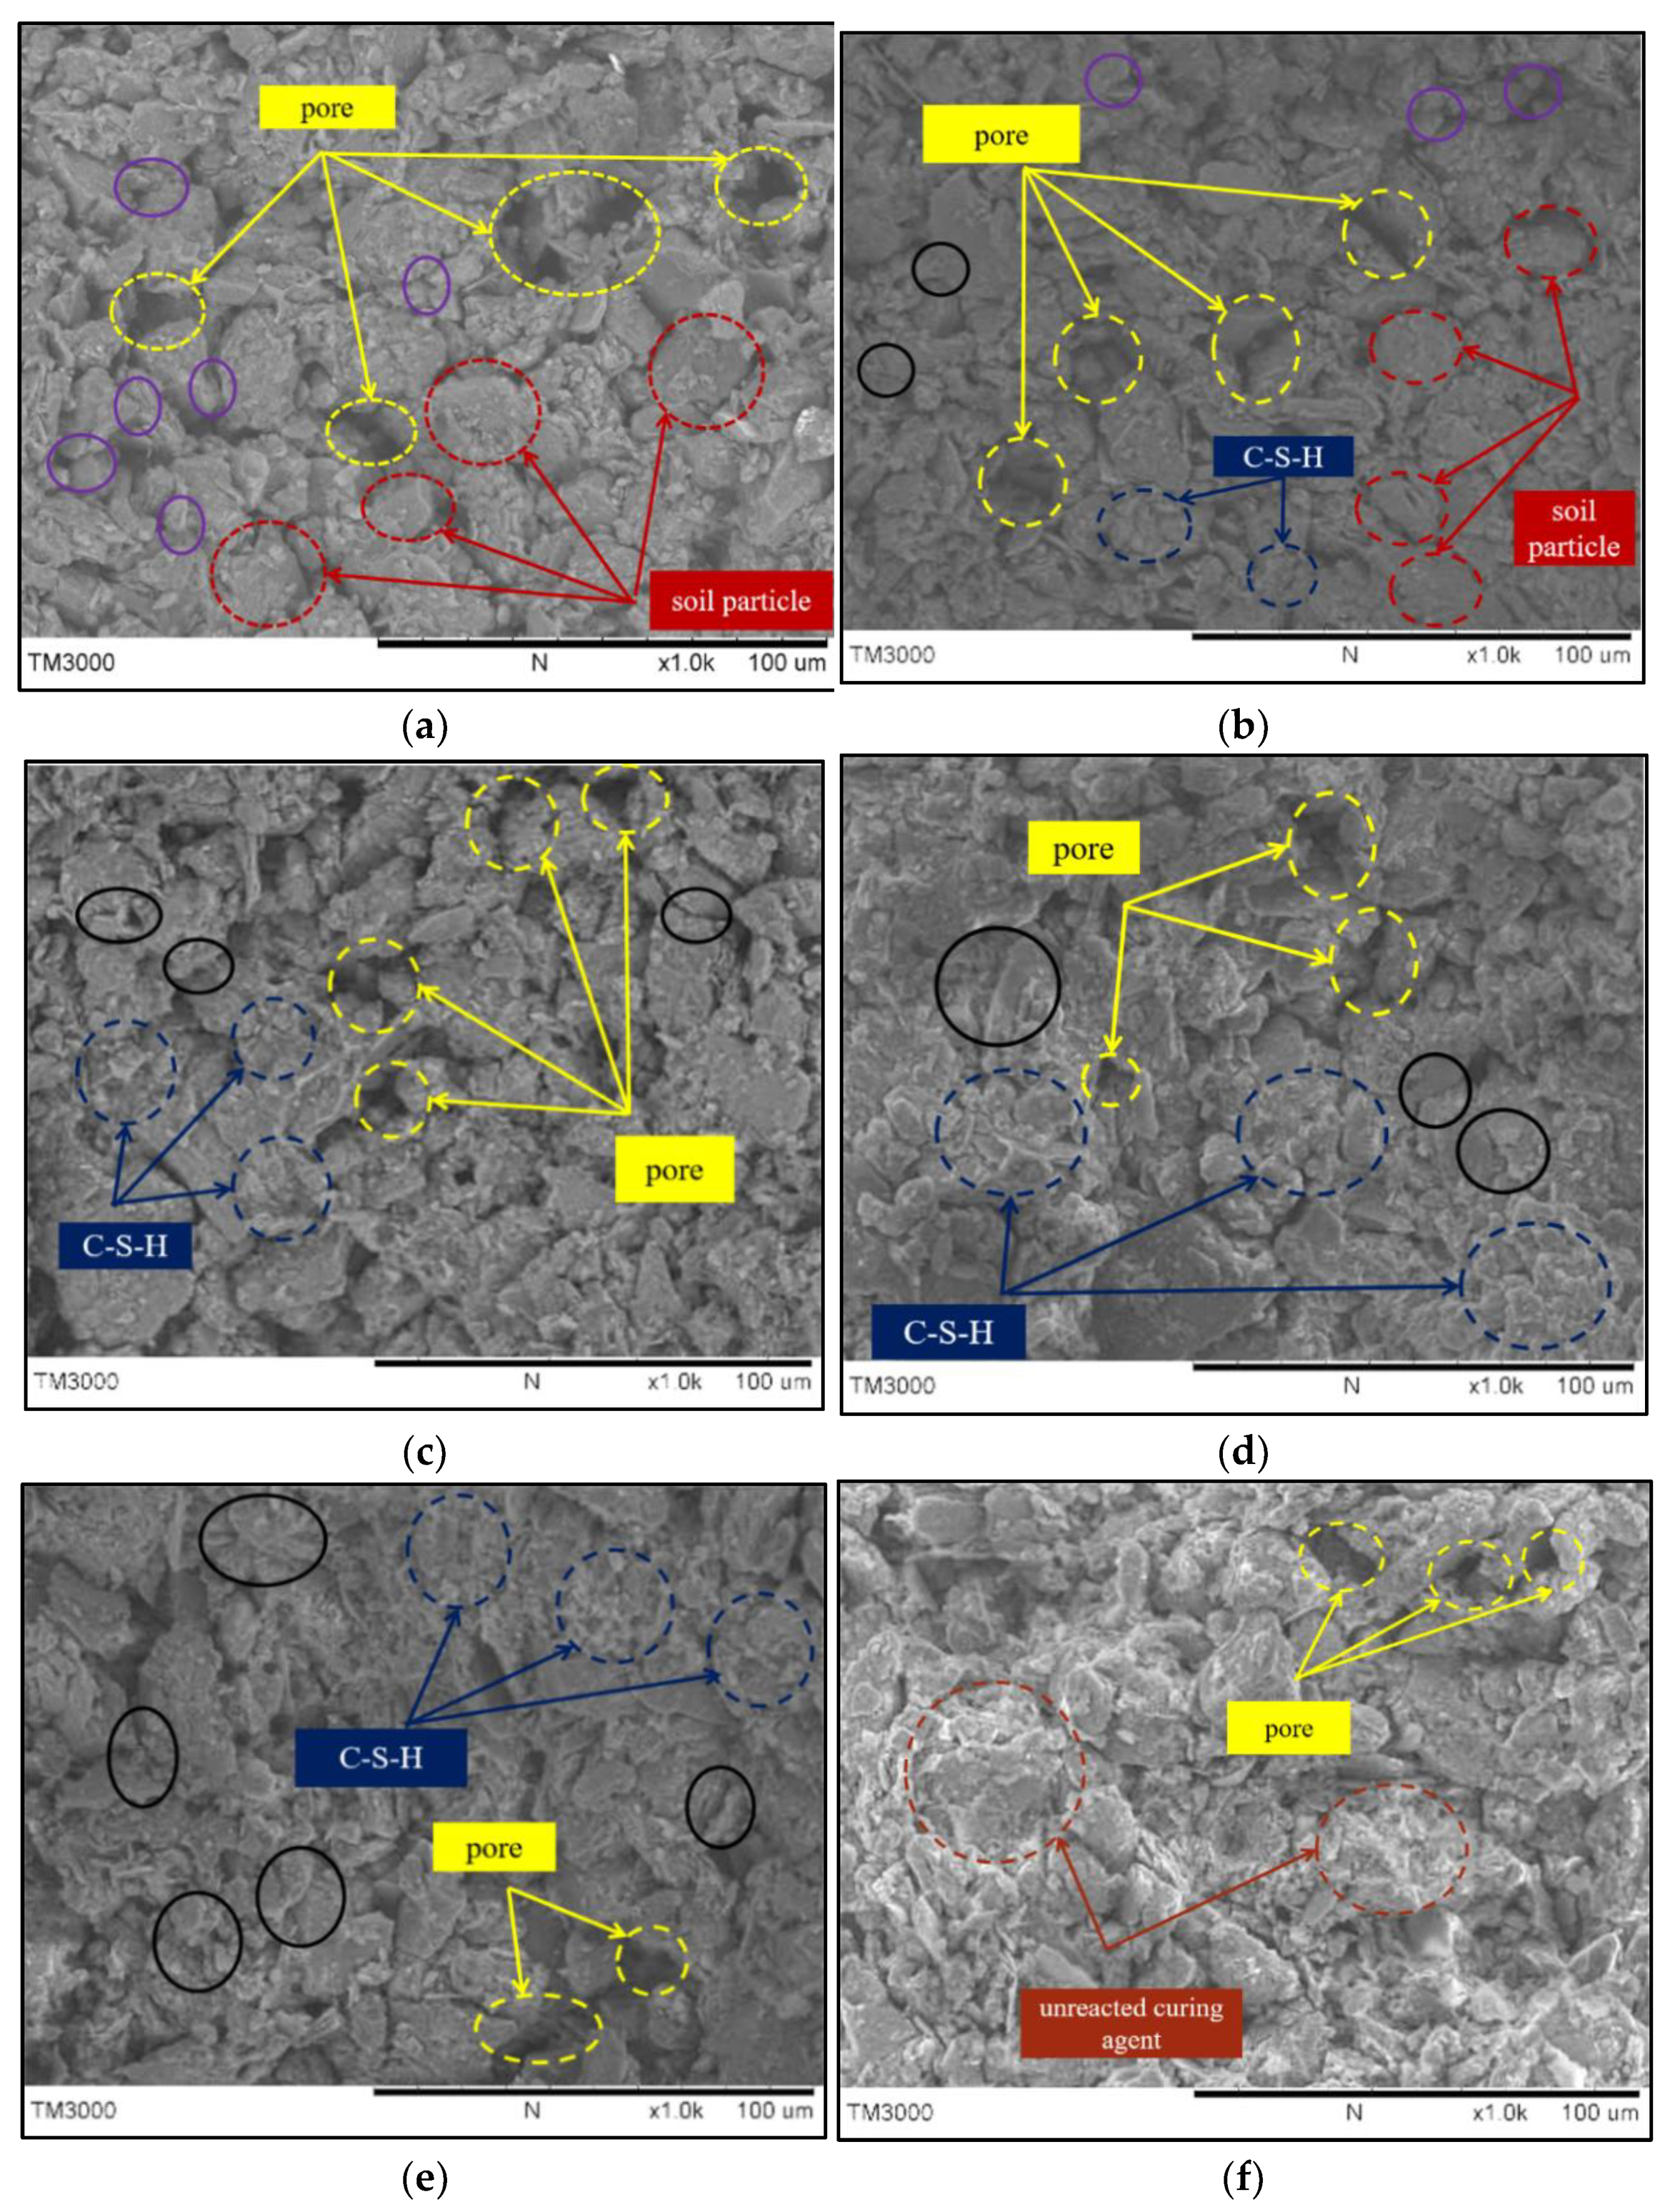
3.4.3. SEM of the Stabilized Silt
3.4.4. Microscopic Quantitative Analysis
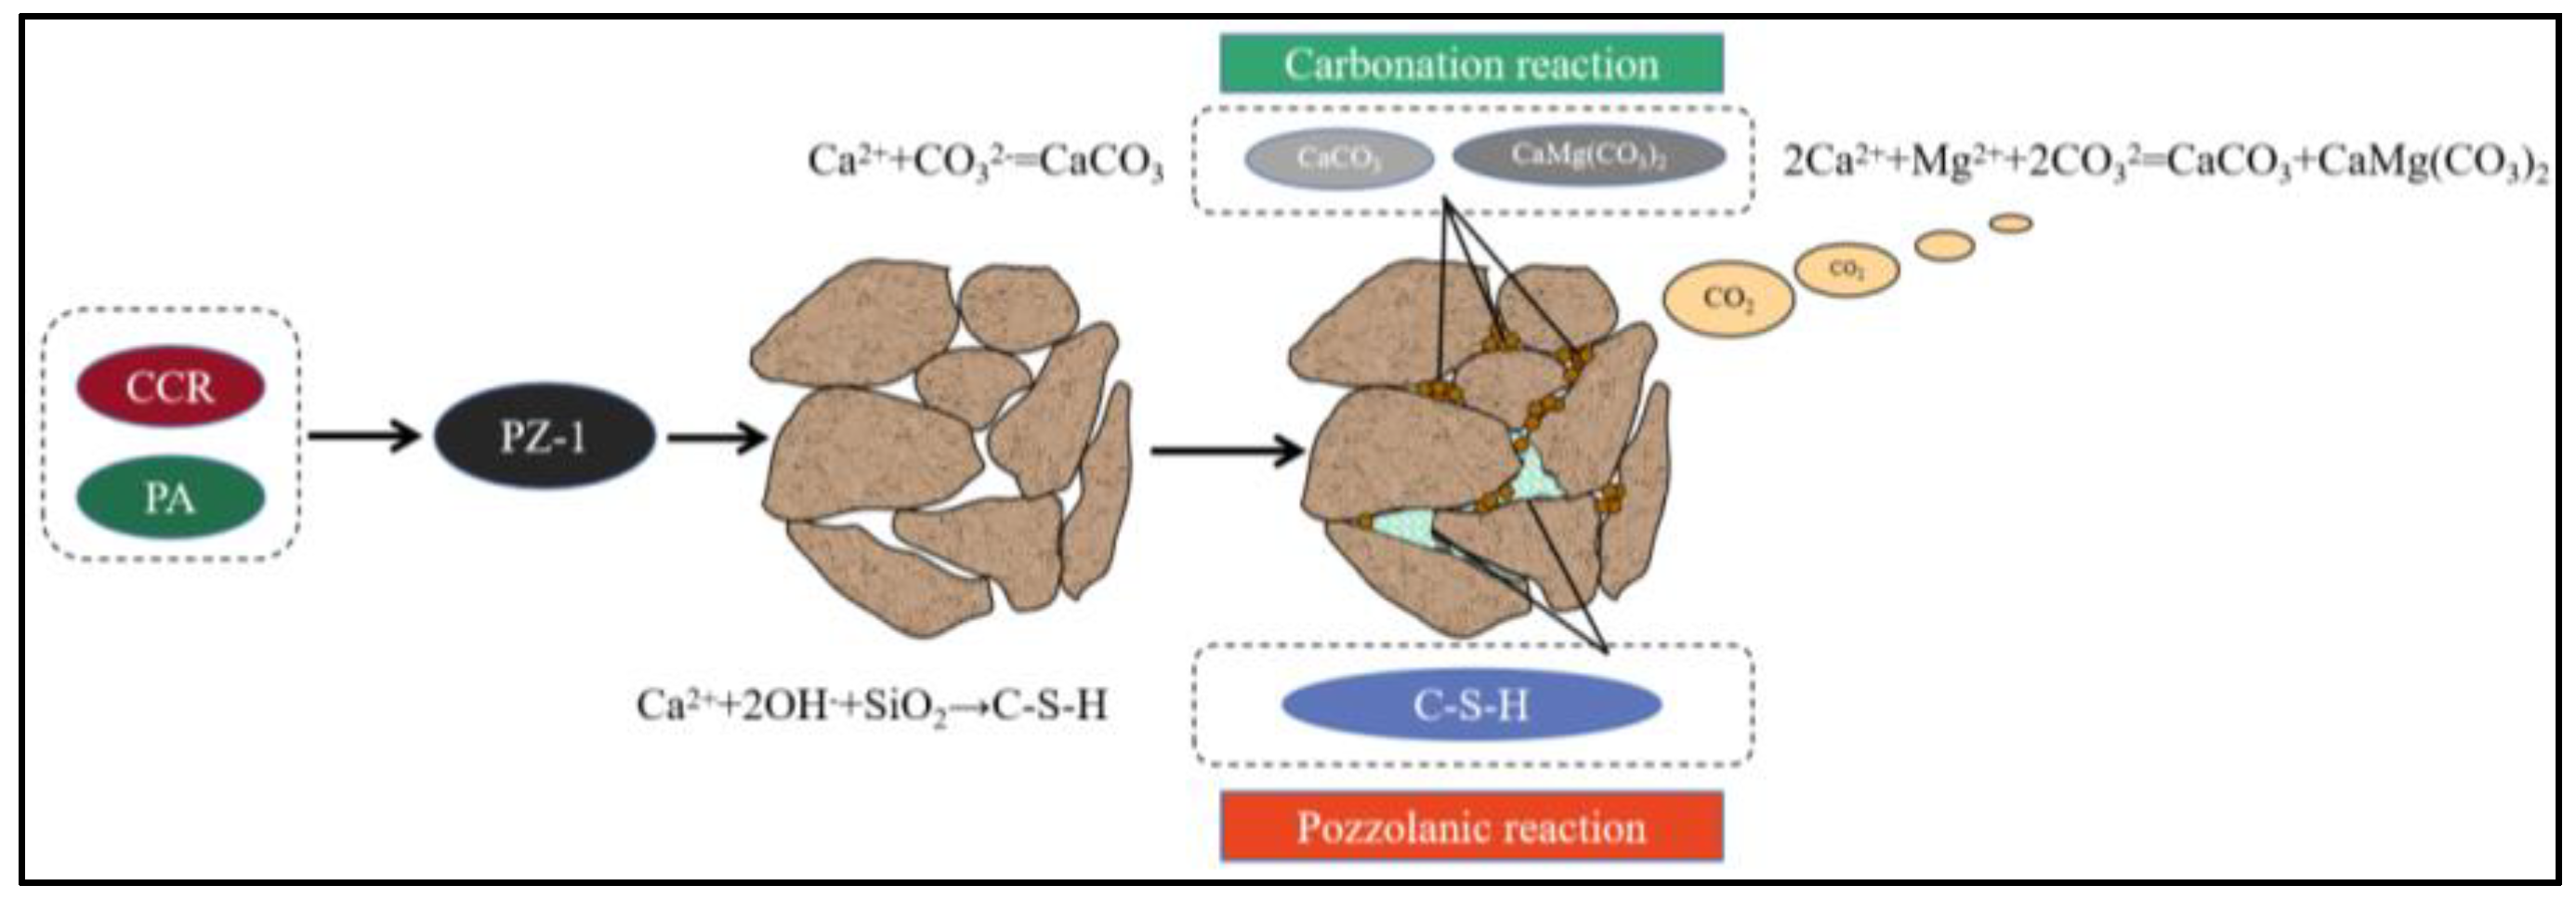
3.4.5. Stabilized Mechanism of PZ-1
3.5. Dry-Wet Cycles of Stabilized Silt
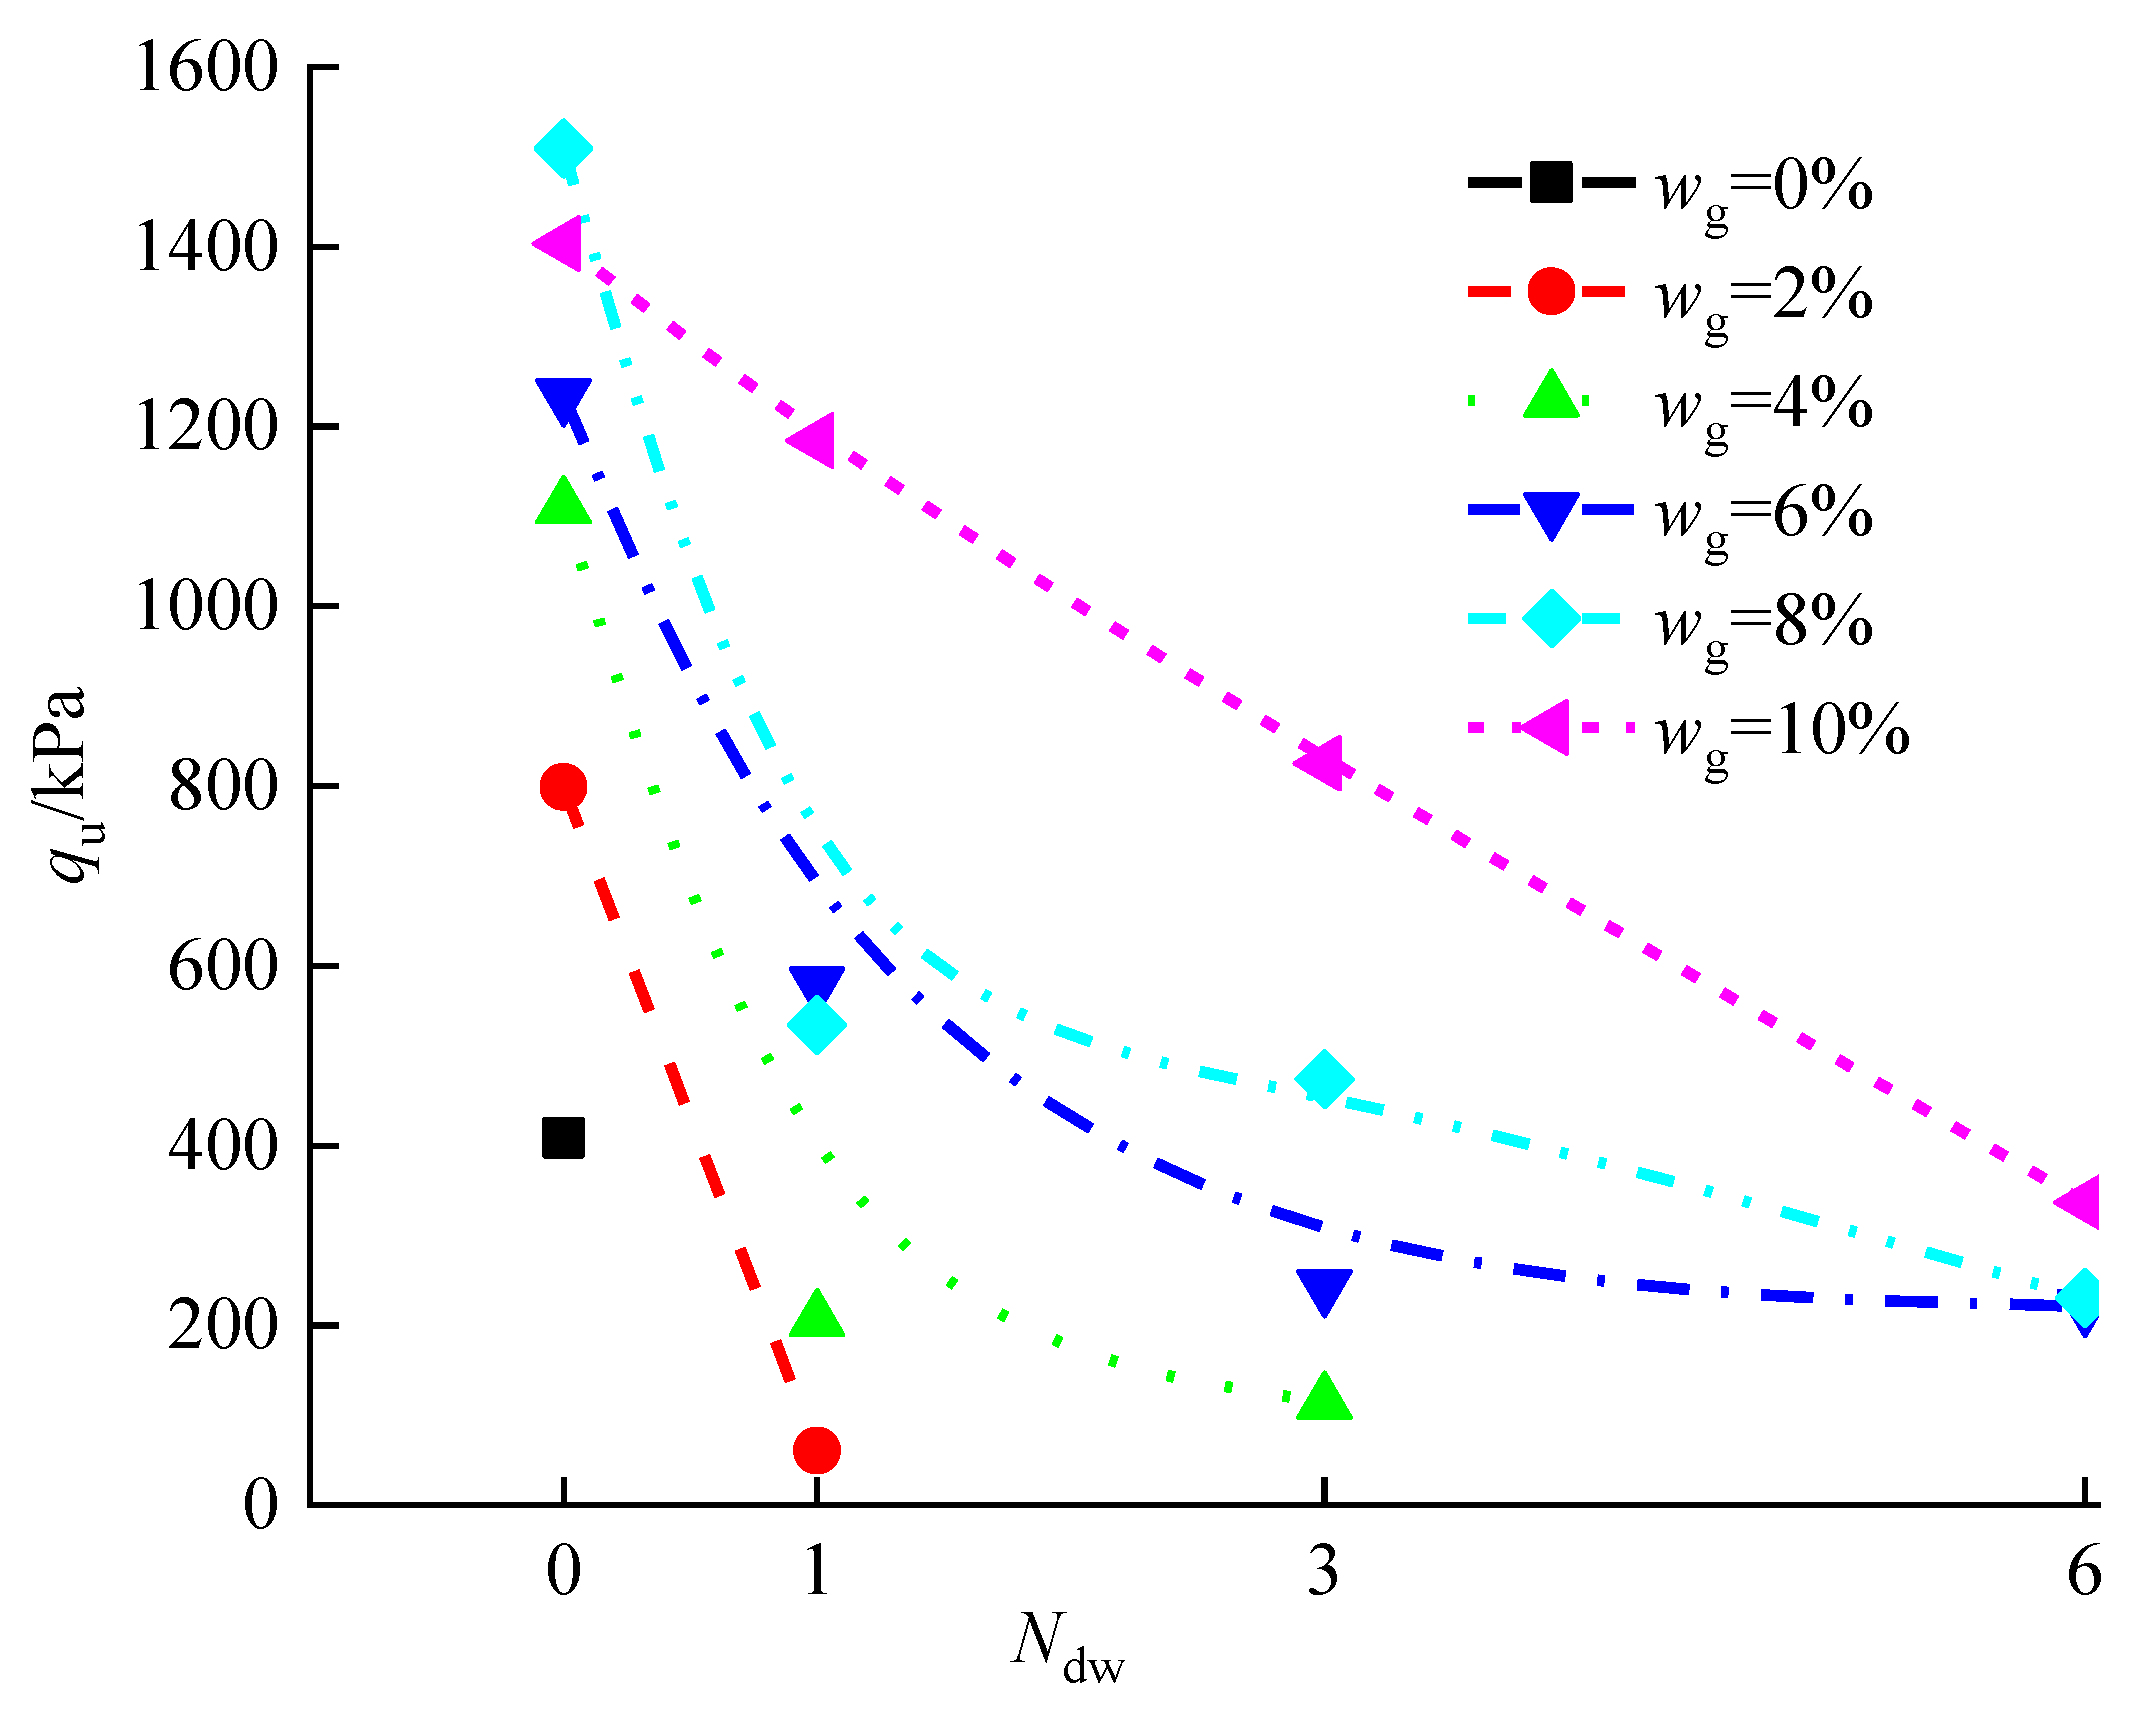
3.5.1. Effect of Dry-Wet Cycles on qu of Stabilized Silt
3.5.2. Characterization of Morphology of the Stabilized Silt during Dry-Wet Cycles
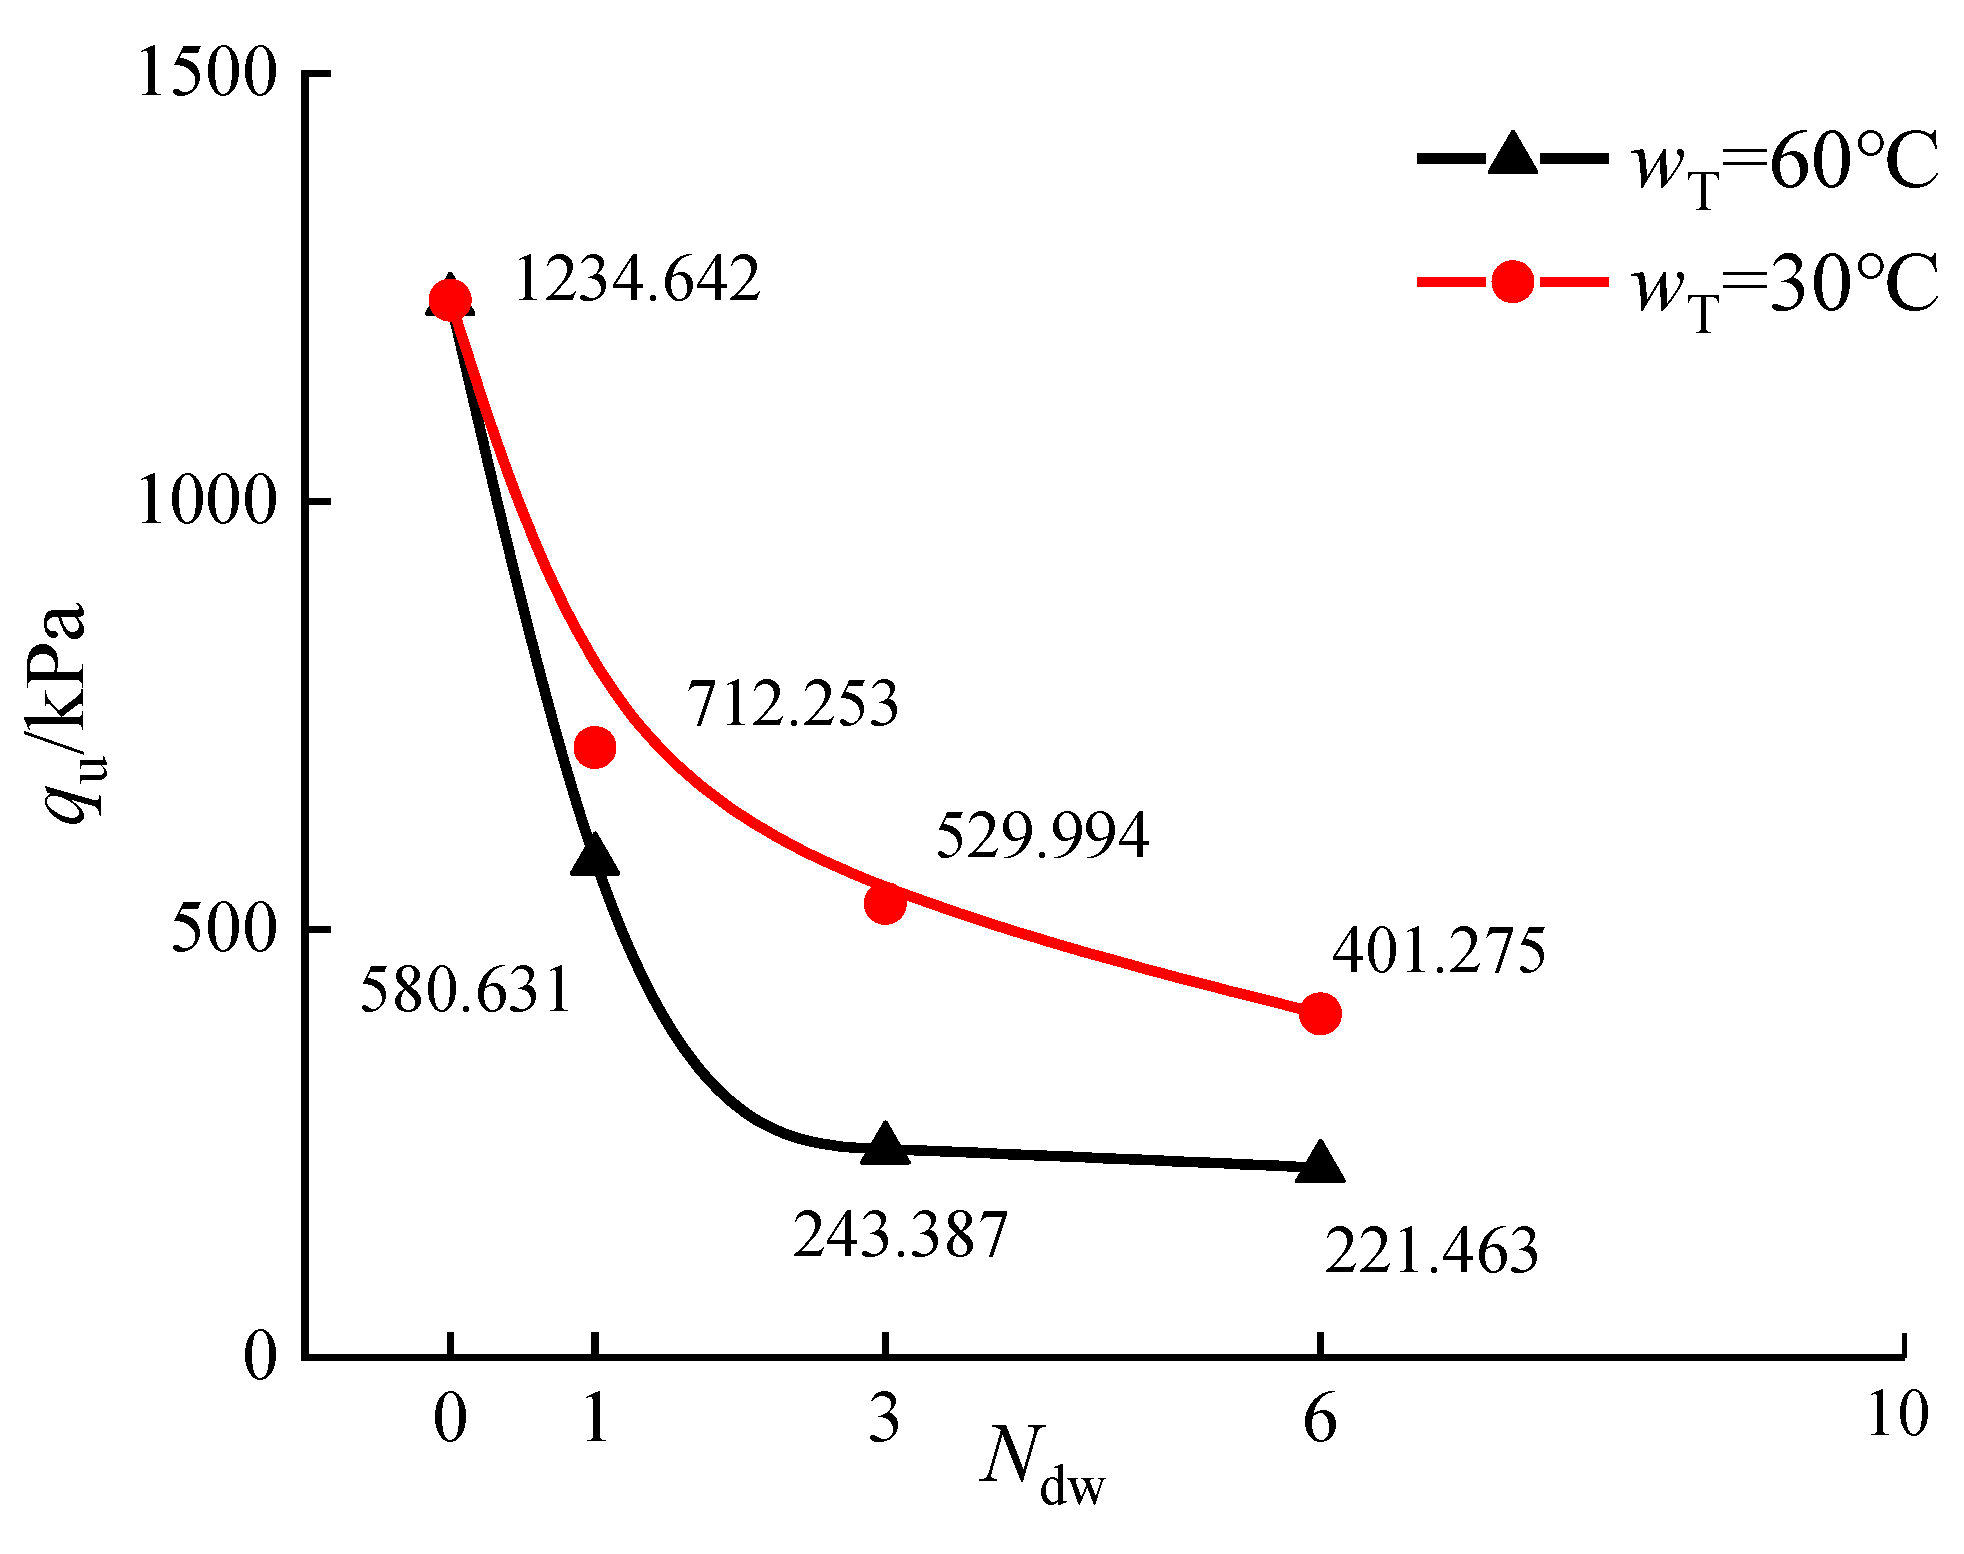
3.5.3. Effect of Temperature on the Water Resistance of Stabilized Silt
3.5.4. Effect of Organic Matter Content on the Water Resistance of Stabilized Silt
4. Conclusions
- (1)
- The optimal ratio of CCR and PA addressed by PSO-SVM is CCR:PA = 13.35:16.06, and the associated compound curing agent was named PZ-1.
- (2)
- The main stabilized mechanism of PZ-1 on marine waste silt is that the Ca(OH)2 from the CCR can react with the SiO2 from the PA and further active the mineral composition of waste silt to form cementitious substances such as calcium silicate hydrate (C-S-H) and Ettringite. Moreover, Ca2+ and Mg2+ will carbonize under an alkaline environment to form CaCO3 and CaMg(CO3)2 to fill pores and cement soil particles and then enhance the soil structure.
- (3)
- With the increase in curing agent content, the qu of the solidified silt first increases and then decreases, with the qu peak value appearing in the content range of 8–10%, which is due to the optimal reacting condition between PZ-1 and silt. However, the qu of the solidified silt begins to drop when wg exceeds 10% because of the inhibiting effect of the relatively insufficient soil water on the hydration of the redundant PZ-1.
- (4)
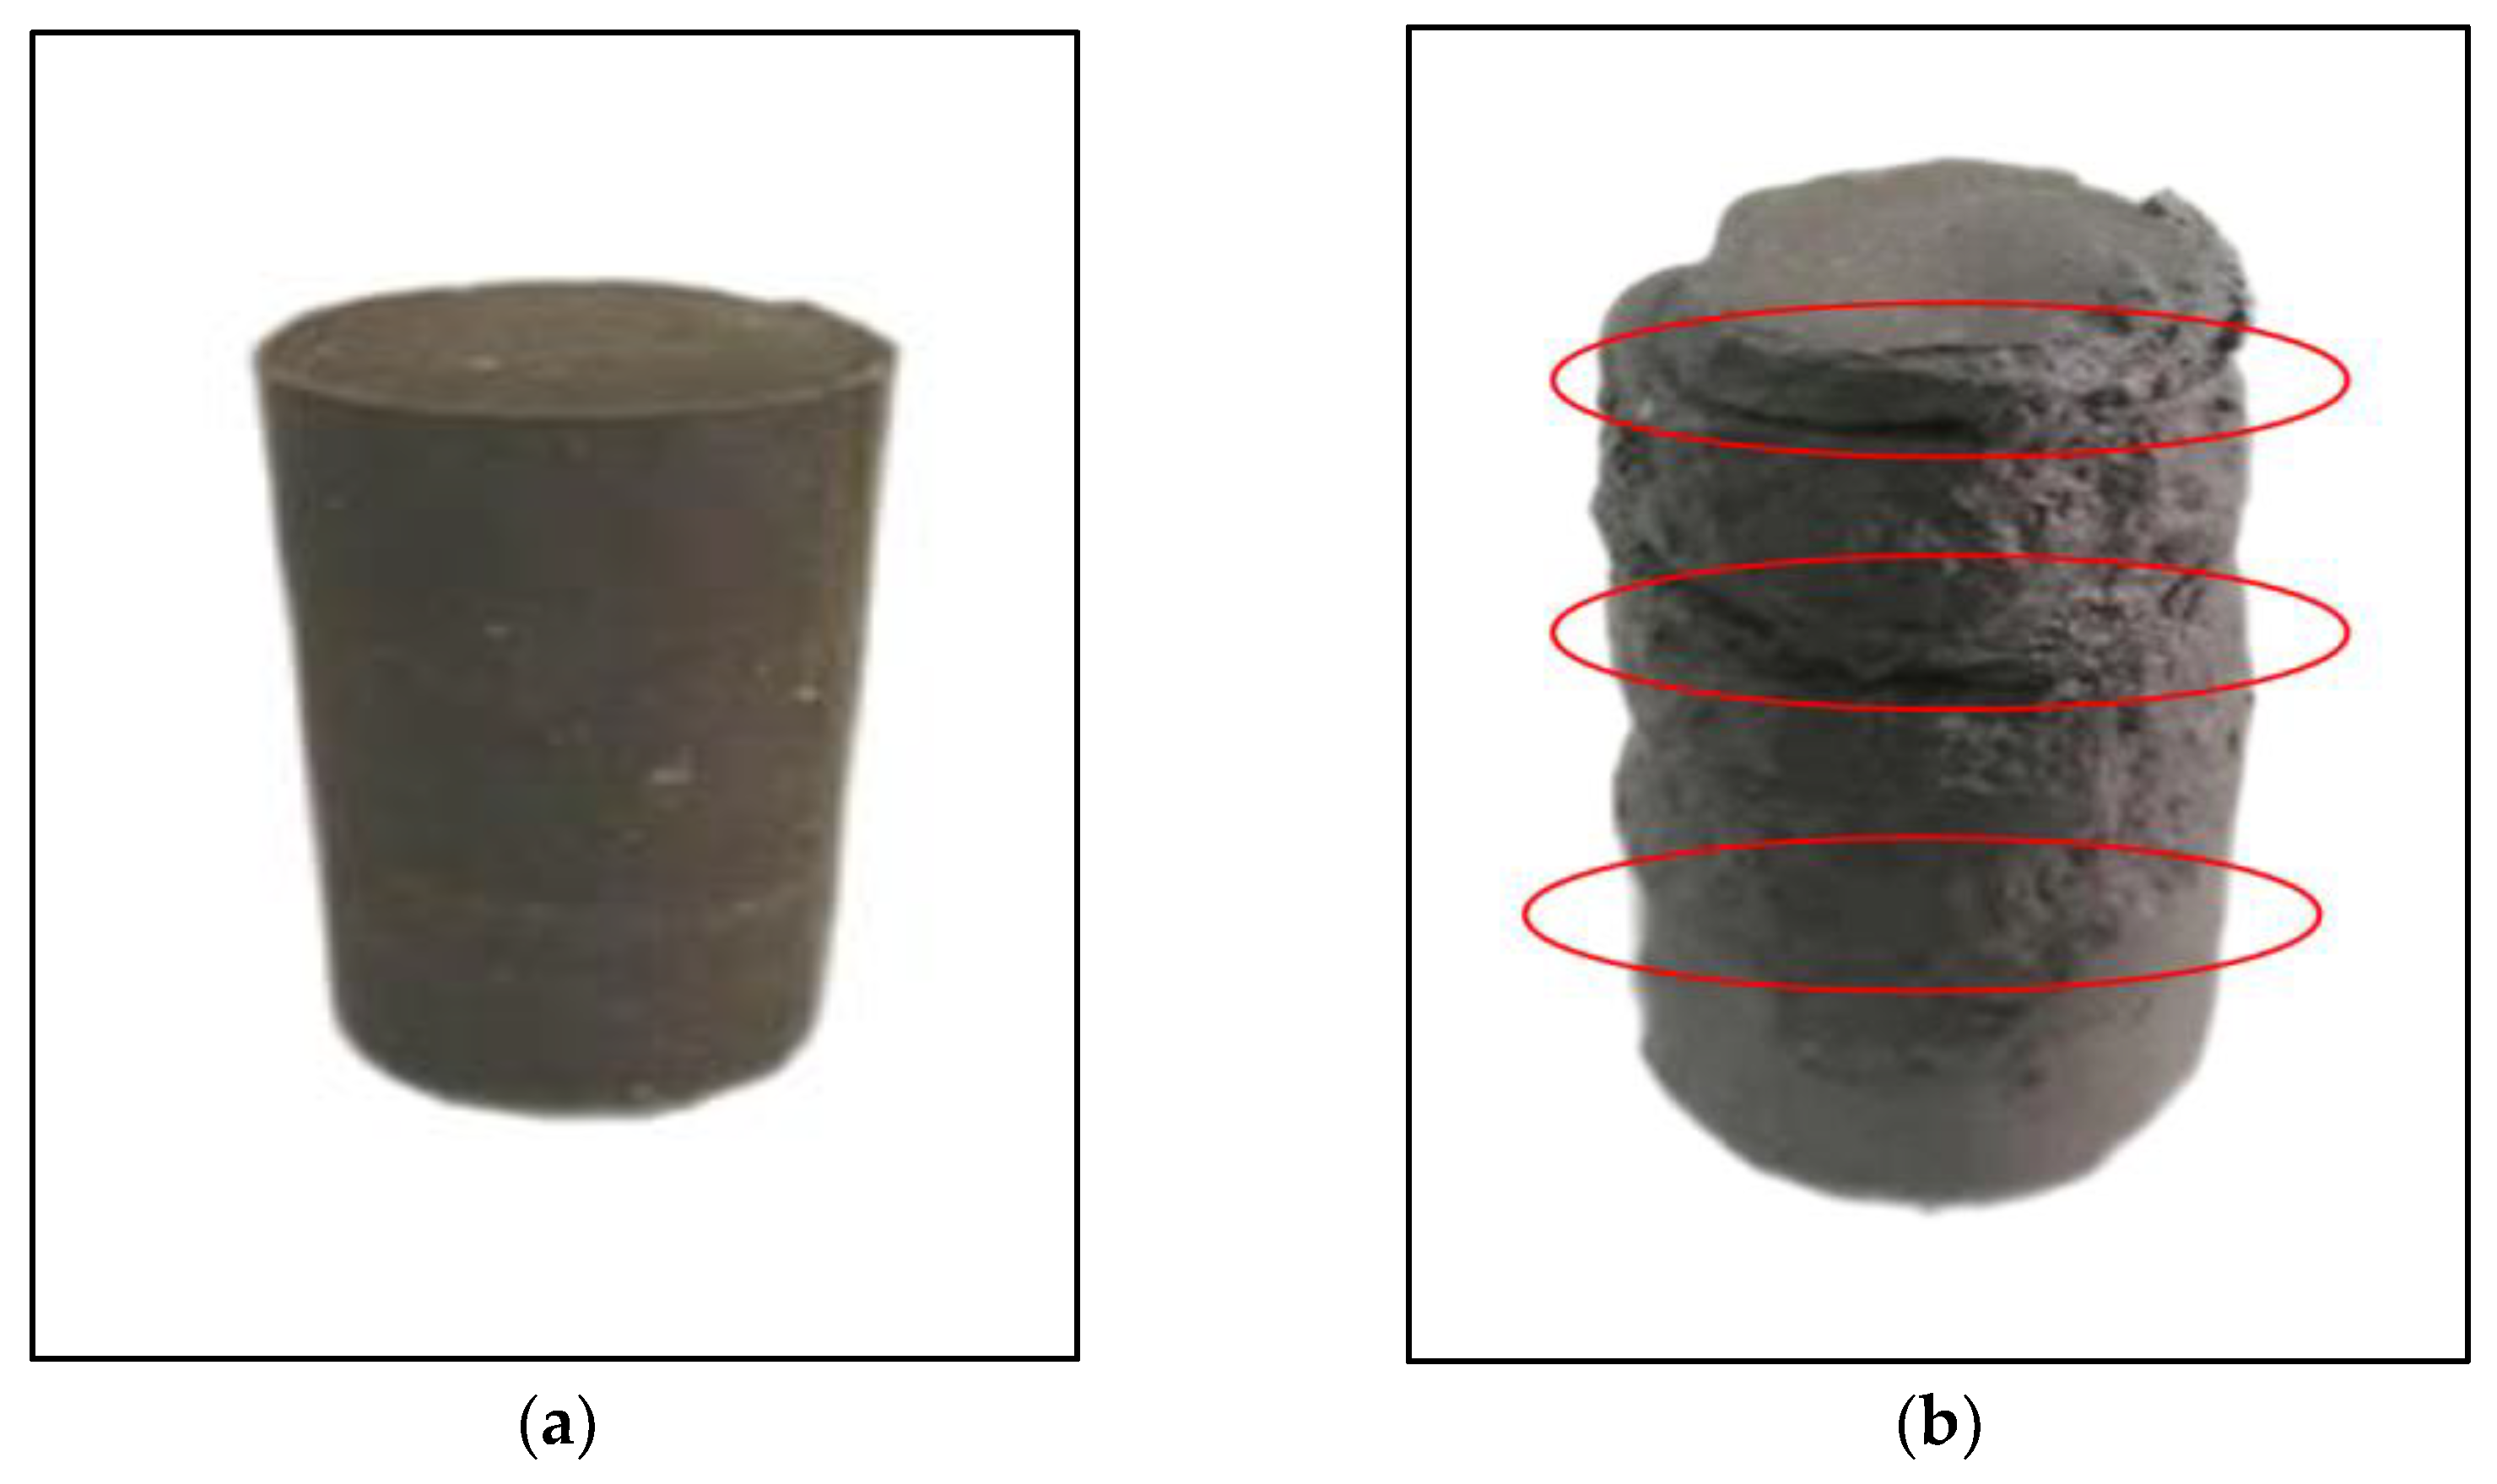
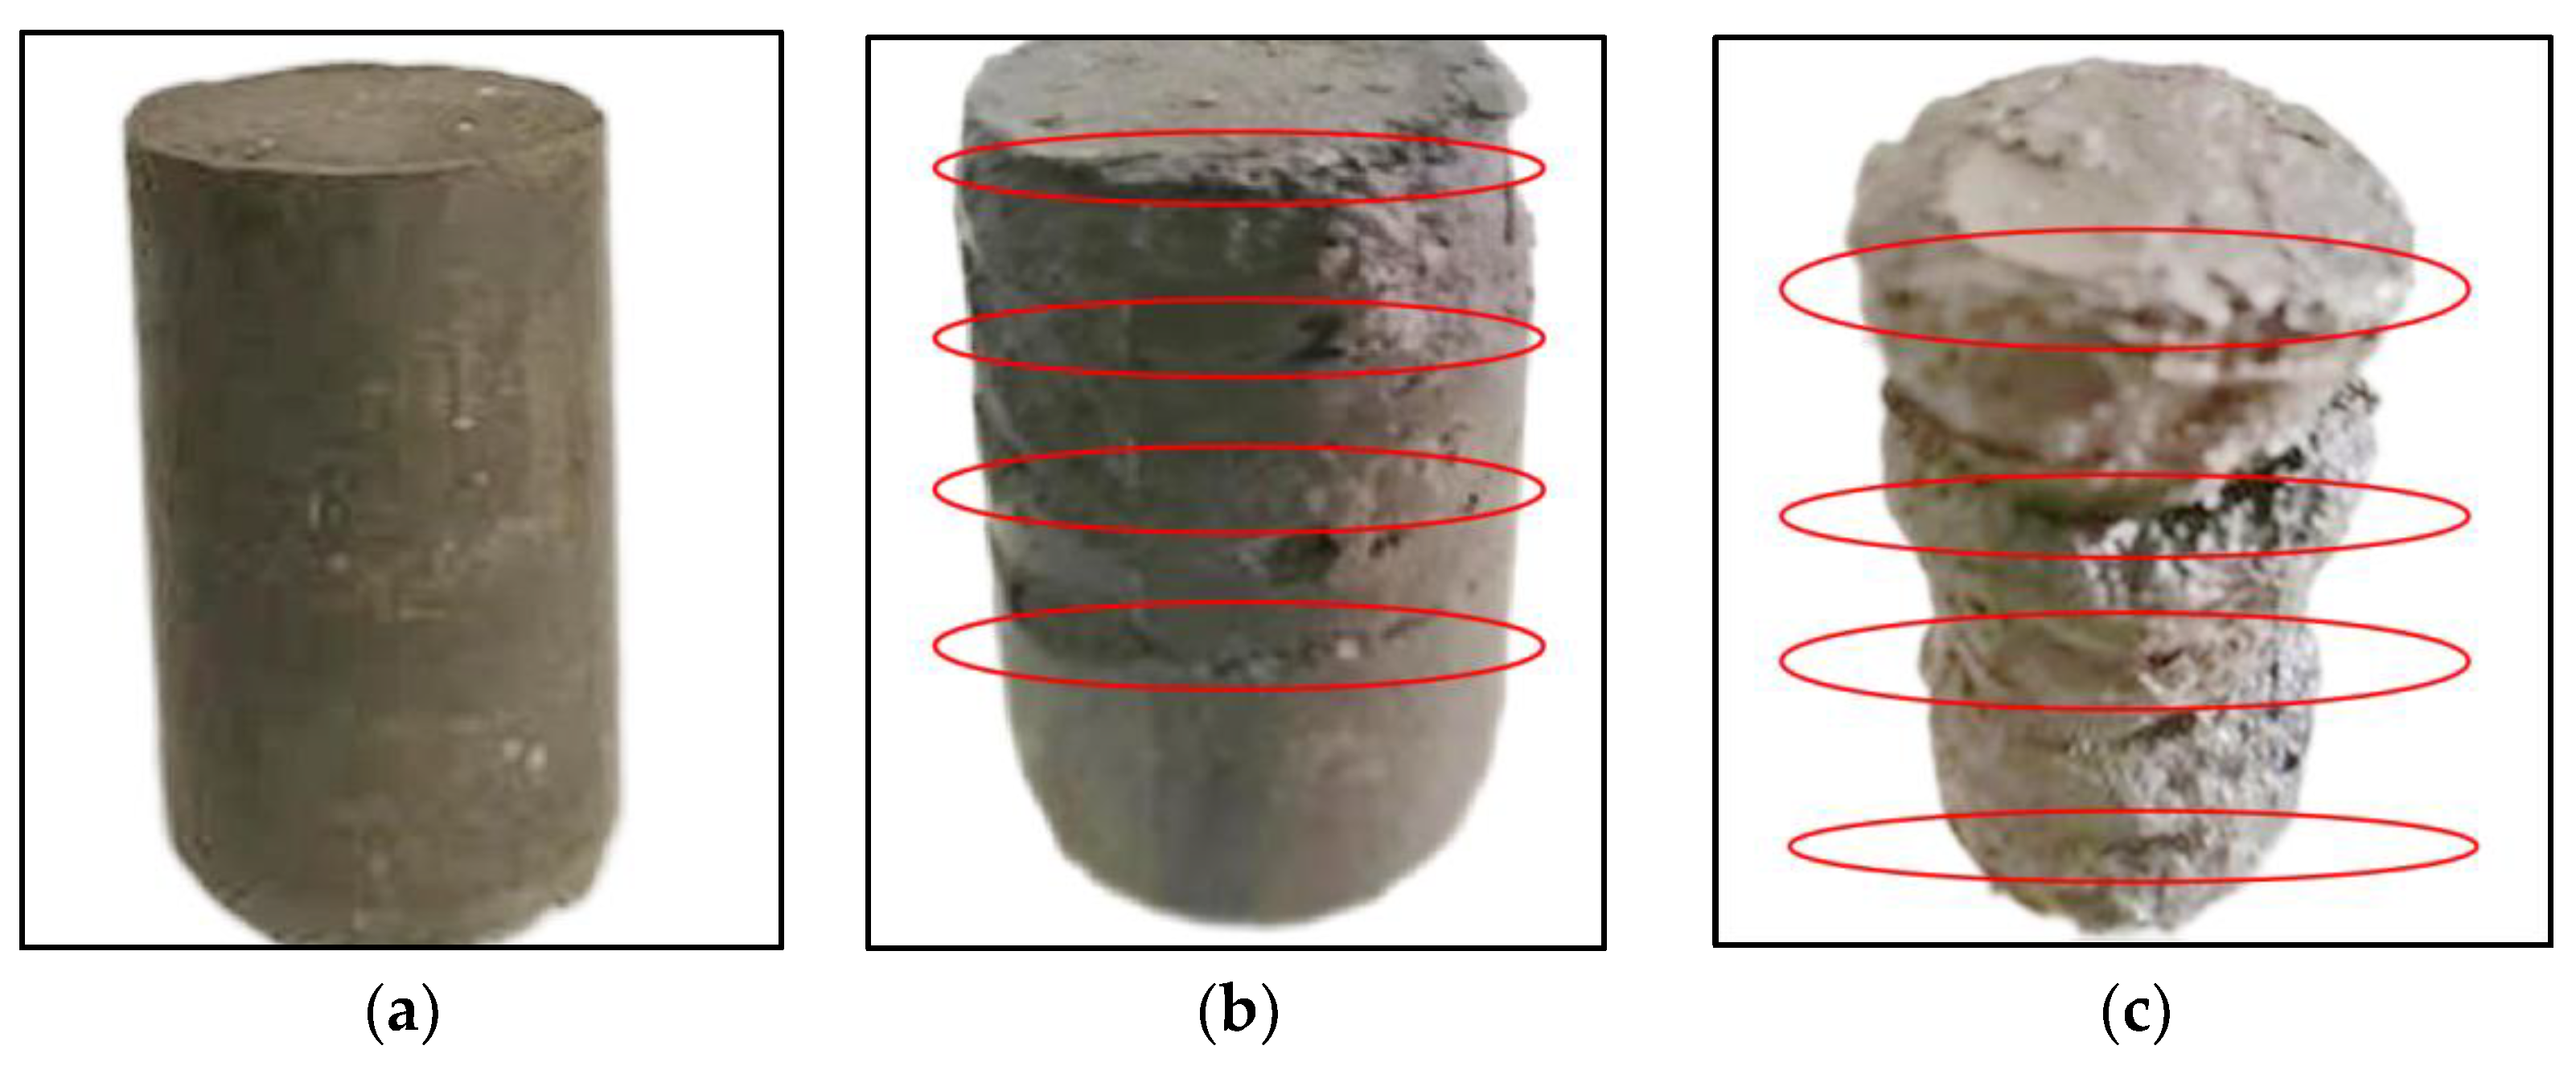
- The initial damage to the specimen occurred in the corner of the specimen and the contact part of each layer in the dry-wet cycles. Generally, the stronger water resistance of the stabilized silt was obtained with the increase in the curing agent content, wg, which is different from the hump-curve relationship between the qu and wg of Figure 12. It should be noted that the qu attained with a wg of 10% is larger than that with wg of 8% due to the fact that the redundant curing agent in the former case continues to hydrate and further enhance the water tolerance of the stabilized silt.
- (5)
- Organic matter has a significant negative effect on the water resistance of stabilized soil. The water resistance of solidified soil in the actual project at about 30 °C is higher than that at 60 °C.
Author Contributions
Funding
Institutional Review Board Statement
Informed Consent Statement
Data Availability Statement
Conflicts of Interest
Abbreviations
| wg | curing agent dosage |
| wo | organic matter content |
| w | water content |
| C | Abundance |
| D | fractal dimension |
| R | Roundness |
| qu | unconfined compressive strength |
| T | curing time |
| Ndw | number of dry-wet cycles |
| wT | Temperature |
References
- Wu, T.Y.; Cai, Y.Q.; Guo, L.; Lin, D.; Wang, J. Influence of shear stress level on cyclic deformation behavior of intact Wenzhou soft clay under traffic loading. Eng. Geol. 2017, 228, 61–70. [Google Scholar] [CrossRef]
- Zhang, D.W.; Cao, Z.G.; Fan, L.B.; Liu, S.Y.; Liu, W.Z. Evaluation of the influence of salt concentration on cement stabilized clay by electrical resistivity measurement method. Eng. Geol. 2014, 170, 80–88. [Google Scholar] [CrossRef]
- Rajasekaran, G.; Narasimha-Rao, S. Strength characteristics of lime treated marine clay. Ground Improv. 2000, 3, 127–136. [Google Scholar] [CrossRef]
- Jahandari, S.; Saberian, M.; Zivari, F.; Li, J.; Ghasemi, M.; Vali, R. Experimental study of the effects of curing time on geotechnical properties of stabilized clay with lime and geogrid. Int. J. Geotech. Eng. 2017, 13, 172–183. [Google Scholar] [CrossRef]
- Jahandari, S.; Li, J.; Saberian, M.; Shahsavarigoughari, M. Experimental study of the effects of geogrids on elasticity modulus, brittleness, strength, and stress–strain behavior of lime stabilized kaolinitic clay. GeoResJ 2017, 13, 49–58. [Google Scholar] [CrossRef]
- Jahandari, S.; Saberian, M.; Tao, Z.; Mojtahedi, S.F.; Li, J.; Ghasemi, M.; Rezvani, S.S.; Li, W.G. Effects of saturation degrees, freezing thawing, and curing on geotechnical properties of lime and lime–cement concretes. Cold Reg. Sci. Technol. 2019, 160, 242–251. [Google Scholar] [CrossRef]
- Çevikbilen, G.; Başar, H.M.; Karadoğan, Ü.; Teymur, B.; Dağlı, S.; Tolun, L. Assessment of the use of dredged marine materials in sanitary landfills: A case study from the Marmara sea. Waste Manag. 2020, 113, 70–79. [Google Scholar] [CrossRef]
- Cultrone, G. The use of Mount Etna volcanic ash in the production of bricks with good physical–mechanical performance: Converting a problematic waste product into a resource for the construction industry. Ceram. Int. 2022, 48, 5724–5736. [Google Scholar] [CrossRef]
- Hossain, K.M.A. Volcanic ash and pumice as cement additives: Pozzolanic, alkali–silica reaction and autoclave expansion characteristics. Cem. Concr. Res. 2005, 35, 1141–1144. [Google Scholar] [CrossRef]
- Alqarni, A.S. A comprehensive review on properties of sustainable concrete using volcanic pumice powder ash as a supplementary cementitious material. Constr. Build. Mater. 2022, 323, 126533. [Google Scholar] [CrossRef]
- Liu, L.K.; Zhou, Z.W.; Guo, J.F.; Sun, X.W.; Jiang, X.S.; Sun, H.L.; Chen, S. Hydrothermal–processed volcanic ash–based geopolymers for immobilization of sodium salt wastes containing Cs. Ann. Nucl. Energy 2021, 158, 108251. [Google Scholar] [CrossRef]
- Ghadir, P.; Zamanian, M.; Mahbubi, M.N.; Saberian, M.; Li, J.; Ranjbar, N. Shear strength and life cycle assessment of volcanic ash–based geopolymer and cement stabilized soil: A comparative study. Transp. Geotech. 2021, 31, 100639. [Google Scholar] [CrossRef]
- Lemougna, P.N.; Kenneth, J.D.; Mackenzie, U.F.; Chinje, M. Synthesis and thermal properties of inorganic polymers (geopolymers) for structural and refractory applications from volcanic ash. Ceram. Int. 2011, 37, 3011–3018. [Google Scholar] [CrossRef]
- Wang, F.T.; Li, K.Q.; Liu, Y. Optimal water–cement ratio of cement–stabilized soil. Constr. Build. Mater. 2022, 320, 126211. [Google Scholar] [CrossRef]
- Amini, O.; Ghasemi, M. Laboratory study of the effects of using magnesium slag on the geotechnical properties of cement stabilized soil. Constr. Build. Mater. 2019, 223, 409–420. [Google Scholar] [CrossRef]
- Lemougna, P.N.; Wang, K.T.; Tang, Q.; Melo, U.C.; Cui, X.M. Recent developments on inorganic polymers synthesis and applications. Ceram. Int. 2016, 42, 15142–15159. [Google Scholar] [CrossRef]
- Horpibulsuk, S.; Phetchuay, C.; Chinkulkijniwat, A. Soil stabilization by calcium carbide residue and fly ash. J. Mater. Civ. Eng. 2012, 24, 184–193. [Google Scholar] [CrossRef]
- Ye, H.; Chu, C.F.; Xu, L.; Guo, K.L.; Li, D. Experimental studies on drying-wetting cycle characteristics of expansive soils improved by industrial wastes. Adv. Civ. Eng. 2018, 2018, 2321361. [Google Scholar] [CrossRef] [Green Version]
- Govedarica, O.; Aškrabić, M.; Hadnađev-Kostić, M.; Vulić, T.; Lekić, B.; Rajaković-Ognjanović, V.; Zakić, D. Evaluation of solidified wastewater treatment sludge as a potential SCM in pervious concrete pavements. Materials 2022, 15, 4919. [Google Scholar] [CrossRef]
- Meng, J.; Zhong, L.; Wang, L.; Liu, X.; Tang, C.; Chen, H.J.; Xu, J.M. Contrasting effects of alkaline amendments on the bioavailability and uptake of Cd in rice plants in a Cd–contaminated acid paddy soil. Environ. Sci. Pollut. Res. 2018, 25, 8827–8835. [Google Scholar] [CrossRef]
- Zhang, Y.L.; Liu, X.M.; Xu, Y.T.; Tang, B.W.; Wang, Y.G.; Mukiza, E. Synergic effects of electrolytic manganese residue–red mud–carbide slag on the road base strength and durability properties. Constr. Build. Mater. 2019, 220, 364–374. [Google Scholar] [CrossRef]
- Horpibulsuk, S.; Chinkulkijniwat, A.; Cholphatsorn, A.; Suebsuk, J.; Martin, D.L. Consolidation behavior of soil cement column improved ground. Comput. Geotech. 2012, 43, 37–50. [Google Scholar] [CrossRef] [Green Version]
- Sun, X.G.; Liu, J.; Qiu, J.P.; Wu, P.Q.; Zhao, Y.Q. Alkali activation of blast furnace slag using a carbonate–calcium carbide residue alkaline mixture to prepare cemented paste backfill. Constr. Build. Mater. 2022, 320, 126234. [Google Scholar] [CrossRef]
- Suttiprapa, P.; Tangchirapat, W.; Jaturapitakkul, C.; Ubolluk, R.; Peerapong, J. Strength behavior and autogenous shrinkage of alkali–activated mortar made from low–calcium fly ash and calcium carbide residue mixture. Constr. Build. Mater. 2021, 312, 125438. [Google Scholar] [CrossRef]
- Liu, Y.Y.; Chang, C.W.; Namdar, A.; She, Y.X.; Lin, C.H.; Yuan, X.; Yang, Q. Stabilization of expansive soil using cementing material from rice husk ash and calcium carbide residue. Constr. Build. Mater. 2019, 221, 1–11. [Google Scholar] [CrossRef]
- Phetchuay, C.; Horpibulsuk, S.; Arulrajah, A.; Suksiripattanapong, C.; Udomchai, A. Strength development in soft marine clay stabilized by fly ash and calcium carbide residue based geopolymer. Appl. Clay Sci. 2016, 127–128, 134–142. [Google Scholar] [CrossRef]
- Apichit, K.; Suksun, H.; Avirut, C.; Shen, S.L. Engineering properties of recycled Calcium Carbide Residue stabilized clay as fill and pavement materials. Constr. Build. Mater. 2013, 46, 203–210. [Google Scholar]
- He, J.; Shi, X.K.; Li, Z.X.; Zhang, L.; Feng, X.Y.; Zhou, L.R. Strength properties of dredged soil at high water content treated with soda residue, carbide slag, and ground granulated blast furnace slag. Constr. Build. Mater. 2020, 242, 118126. [Google Scholar] [CrossRef]
- Abolhasani, A.; Samali, B.; Dehestani, M.; Libre, N.A. Effect of rice husk ash on mechanical properties, fracture energy, brittleness and aging of calcium aluminate cement concrete. Structures 2022, 36, 140–152. [Google Scholar] [CrossRef]
- Jamsawang, M.; Poorahong, H.; Yoobanpot, N.; Songpiriyakij, S.; Jongpradist, P. Improvement of soft clay with cement and bagasse ash waste. Constr. Build. Mater. 2017, 154, 61–71. [Google Scholar] [CrossRef]
- Jain, A.; Choudhary, A.K.; Jha, J.N. Influence of Rice Husk Ash on the swelling and strength characteristics of expansive soil. Geotech. Geol. Eng. 2020, 38, 2293–2302. [Google Scholar] [CrossRef]
- Masuka, S.; Gwenzi, W.; Rukuni, T. Development, engineering properties and potential applications of unfired earth bricks reinforced by coal fly ash, lime and wood aggregates. J. Build. Eng. 2018, 18, 312–320. [Google Scholar] [CrossRef]
- Vichan, S.; Rachan, R.; Horpibulsuk, S. Strength and microstructure development in Bangkok clay stabilized with calcium carbide residue and biomass ash. Sci. Asia 2013, 39, 186–193. [Google Scholar] [CrossRef] [Green Version]
- Chai, J.; Roongreung, B. Cementing material from calcium carbide residue–rice husk ash. J. Mater. Civ. Eng. 2003, 15, 470–475. [Google Scholar]
- Rattanashotinunt, C.; Thairit, P.; Tangchirapat, W.; Jaturapitakkul, C. Use of calcium carbide residue and bagasse ash mixtures as a new cementitious material in concrete. Mater. Des. 2013, 46, 106–111. [Google Scholar] [CrossRef]
- JTG 3430-2020; Test Methods of Soils for Highway Engineering. Ministry of Transport of the People’s Republic of China: Beijing, China, 2020.
- Zhu, J.F.; Tao, Y.L.; Xu, R.Q.; Yang, H.; Pan, B.J. Investigation on the optimal formulation and mechanism of marine organic silt improved with magnesium–cement–based stabilizer. Constr. Build. Mater. 2022, 341, 127233. [Google Scholar] [CrossRef]
- Arasan, S.; Akbulut, S.; Hasiloglu, A.S. The relationship between the fractal dimension and shape properties of particles. J. Civ. Eng. 2011, 15, 1219–1225. [Google Scholar] [CrossRef]
- Cox, E.P. A method of assigning numerical and percentage values to the degree of roundness in sand grains. J. Paleontol. 1927, 1, 179–183. [Google Scholar]
- Krumbein, W.C. Measurement and geologic significance of shape and roundness of sedimentary particles. J. Sediment. Petrol. 1941, 11, 64–72. [Google Scholar] [CrossRef]
- Rousé, P.C.; Fannin, R.J.; Shuttle, D.A. Influence of roundness on the void ratio and strength of uniform sand. Géotechnique 2008, 58, 227–231. [Google Scholar] [CrossRef]
- Russell, R.D.; Taylor, R.E. Roundness and Shape of Mississippi River Sands. J. Geol. 1937, 45, 225–267. [Google Scholar] [CrossRef]
- Xu, J.; Li, Y.F.; Ren, C.; Lan, W. Damage of saline intact loess after dry-wet and its interpretation based on SEM and NMR. Soils Found. 2020, 60, 911–928. [Google Scholar] [CrossRef]
- Macías-García, A.; Díaz-Díez, M.A.; Alfaro-Domínguez, M.; Carrasco–Amador, J.P. Influence of chemical composition, porosity and fractal dimension on the electrical conductivity of carbon blacks. Heliyon 2020, 6, e04024. [Google Scholar] [CrossRef]
- Wang, R.; Singh, A.K.; Kolan, S.R.; Tsotsas, E. Fractal analysis of aggregates: Correlation between the 2D and 3D box–counting fractal dimension and power law fractal dimension. Chaos Solitons Fractals 2022, 160, 112246. [Google Scholar] [CrossRef]
- Air, A.; Akbulut, S. Effect of fractal dimension on sand–geosynthetic interface shear strength. Powder Technol. 2022, 401, 117349. [Google Scholar]
- Boris, G.; Anna, G.; Evgenij, K.; Arkadij, A. Strength equation of composite materials and fractal dimension of cracks. Energy Rep. 2021, 7, 569–578. [Google Scholar]
- Vichan, S.; Rachan, R. Chemical stabilization of soft Bangkok clay using the blend of calcium carbide residue and biomass ash. Soils Found. 2013, 53, 272–281. [Google Scholar] [CrossRef] [Green Version]
- Chindaprasirt, P.; Kampala, A.; Jitsangiam, P.; Horpibulsuk, S. Performance and evaluation of calcium carbide residuest abilized lateritic soil for construction materials. Case Stud. Constr. Mater. 2020, 13, e00389. [Google Scholar]
- Chen, H.; Zhang, J.; Yan, H. Quantitative evaluation of microstructure characteristics of cement consolidated soil. Bull. Eng. Geol. Environ. 2013, 72, 233–236. [Google Scholar] [CrossRef]
- Jiang, N.; Wang, C.M.; Wang, Z.P.; Li, B.L.; Liu, Y.A. Strength characteristics and microstructure of cement stabilized soft soil Admixed with Silica Fume. Materials 2021, 14, 1929. [Google Scholar] [CrossRef]
- Han, Y.M.; Xia, J.W.; Chang, H.F.; Xu, J. The Influence Mechanism of Ettringite crystals and microstructure characteristics on the strength of calcium–based stabilized soil. Materials 2021, 14, 1359. [Google Scholar] [CrossRef]
- Yang, A.W.; Yang, S.K.; Xu, G.F.; Zhang, W. Study of the long–term deformation characteristics of municipal sludge solidified soil under the coupling action of dry-wet cycles and initial static deviatoric stress. Adv. Civ. Eng. 2020, 2020, 8824414. [Google Scholar] [CrossRef]
- Yun, D.; Bao, T.W. Test study on mechanical properties of the lime stabilized expansive soil under wet and dry cycle. Appl. Mech. Mater. 2012, 1801, 174–177. [Google Scholar]
- Tan, Y.Z.; Ke, R.; Ming, H.J. Improving the durability of organic matter in cement–treated sludge using metakaolin and lime. Mar. Georesour. Geotechnol. 2021, 39, 293–301. [Google Scholar] [CrossRef]
- Oliveira, P.J.V.; Correia, A.A.S.; Garcia, M.R. Effect of organic matter content and curing conditions on the creep behavior of an artificially stabilized soil. J. Mater. Civ. Eng. 2012, 24, 868–875. [Google Scholar] [CrossRef]


| Property Classification | Value |
|---|---|
| Natural water content (%) | 45.5 |
| Initial void ratio | 1.32 |
| Wet unit weight (kN/m3) | 17.2 |
| Liquid limit (%) | 36.2 |
| Plastic limit (%) | 22.6 |
| Plasticity index (%) | 13.6 |
| Group Numbers | w/% | T/d | wg/% |
|---|---|---|---|
| U1 | 16 | 28 | 0 |
| U2 | 2 | ||
| U3 | 4 | ||
| U4 | 6 | ||
| U5 | 8 | ||
| U6 | 10 |
| Group Numbers | w/% | T/d | wg/% |
|---|---|---|---|
| S1 | 16 | 28 | 0 |
| S2 | 2 | ||
| S3 | 4 | ||
| S4 | 6 | ||
| S5 | 8 | ||
| S6 | 10 |
| Symbol | Test Material |
|---|---|
| X1 | Marine soft clay |
| X2 | PA |
| X3 | CCR |
| X4 | Stabilized silt by PZ-1 |
| Group Numbers | w/% | T/d | wg/% | wT/°C | wo/% | Ndw |
|---|---|---|---|---|---|---|
| DW1 | 16 | 28 | 0 | 60 | 2, 4, 6, 8, 10 | 0, 1, 3, 6 |
| DW2 | 2 | |||||
| DW3 | 4 | |||||
| DW4 | 6 | |||||
| DW5 | 8 | |||||
| DW6 | 10 | |||||
| DW7 | 16 | 28 | 0 | 30 | – | 0, 1, 3, 6 |
| DW8 | 2 | |||||
| DW9 | 4 | |||||
| DW10 | 6 | |||||
| DW11 | 8 | |||||
| DW12 | 10 |
| Group Number | woi | woia |
|---|---|---|
| 1 | 0.567% | 0.558% |
| 2 | 0.556% | |
| 3 | 0.552% |
Publisher’s Note: MDPI stays neutral with regard to jurisdictional claims in published maps and institutional affiliations. |
© 2022 by the authors. Licensee MDPI, Basel, Switzerland. This article is an open access article distributed under the terms and conditions of the Creative Commons Attribution (CC BY) license (https://creativecommons.org/licenses/by/4.0/).
Share and Cite
Yang, H.; Zhu, J.; Tao, Y.; Wang, Z.; Zheng, Q. Effect of the Dry-Wet Cycle on the Performance of Marine Waste Silt Solidified by Calcium Carbide Residue and Plant Ash. J. Mar. Sci. Eng. 2022, 10, 1442. https://doi.org/10.3390/jmse10101442
Yang H, Zhu J, Tao Y, Wang Z, Zheng Q. Effect of the Dry-Wet Cycle on the Performance of Marine Waste Silt Solidified by Calcium Carbide Residue and Plant Ash. Journal of Marine Science and Engineering. 2022; 10(10):1442. https://doi.org/10.3390/jmse10101442
Chicago/Turabian StyleYang, Hao, Jianfeng Zhu, Yanli Tao, Zhengqing Wang, and Qiqi Zheng. 2022. "Effect of the Dry-Wet Cycle on the Performance of Marine Waste Silt Solidified by Calcium Carbide Residue and Plant Ash" Journal of Marine Science and Engineering 10, no. 10: 1442. https://doi.org/10.3390/jmse10101442
APA StyleYang, H., Zhu, J., Tao, Y., Wang, Z., & Zheng, Q. (2022). Effect of the Dry-Wet Cycle on the Performance of Marine Waste Silt Solidified by Calcium Carbide Residue and Plant Ash. Journal of Marine Science and Engineering, 10(10), 1442. https://doi.org/10.3390/jmse10101442