Article

Regulation of 17α-Hydroxyprogesterone Production during Induced Oocyte Maturation and Ovulation in Amur Sturgeon (Acipenser schrenckii)

Graduate School of Fisheries Sciences, Hokkaido University, Minato-cho 3-1-1, Hakodate 041-8611, Japan
*
Author to whom correspondence should be addressed.
J. Mar. Sci. Eng. 2022, 10(1), 86; https://doi.org/10.3390/jmse10010086
Submission received: 10 December 2021 / Revised: 5 January 2022 / Accepted: 7 January 2022 / Published: 10 January 2022

Abstract

:
In several teleosts, 17α, 20β-dihydroxy-4-pregnen-3-one (DHP) has been identified as a maturation-inducing steroid. DHP is synthesized from 17α-hydroxyprogesterone (17OHP) by 17β-hydroxysteroid dehydrogenase type 12-like (hsd17b12L). Along with 3β-hydroxysteroid dehydrogenase/Δ5-4 isomerase (3β-HSD), 17α-hydroxylase and C17-20 lyase are associated with 17OHP production. This study aimed to determine the roles of Amur sturgeon hsd3b, P450c17-I (cyp17a1), and P450c17-II (cyp17a2) in 17OHP production and to examine their enzyme activity and mRNA expression pattern during oocyte maturation. In the sturgeons used in this study, hsd3b encoded 3β-HSD, cyp17a1 catalyzed 17α-hydroxylase production with C17-20 lyase activity, and cyp17a2 processed 17α-hydroxylase activity alone. In the ovarian follicles of individuals that underwent induced ovulation, hsd3b mRNA levels increased rapidly, cyp17a1 expression was downregulated, and cyp17a2 expression was upregulated during oocyte maturation. Finally, an in vitro study revealed that salmon pituitary extract (SPE) stimulation rapidly induced hsd3b expression, whereas cyp17a1 expression was downregulated. In vitro, cyp17a2 expression did not rapidly increase with SPE stimulation. This rapid upregulation of hsd3b during oocyte maturation was first observed in teleosts. It was suggested that hsd17b12L expression is upregulated after 17OHP production, which is regulated by hsd3b, cyp17a1, and cyp17a2, resulting in DHP production.

1. Introduction

Sturgeons (Acipenseriformes) have attracted significant attention owing to the high commercial value of caviar present in the female gonads. Natural sturgeon stocks are decreasing dramatically, and these widespread declines are the result of overexploitation, habitat deterioration, and river fragmentation [1,2,3]. Since 1998, sturgeons have been listed in the Appendices of the Convention on International Trade in Endangered Species of Wild Fauna and Flora (CITES), which monitors and controls international trade. Sturgeons are considered an endangered species, based on the International Union for Conservation of Nature (IUCN) assessments in 2009. Consequently, a stable supply of sturgeon products is required, as well as sturgeon conservation, and the development of sturgeon aquaculture has, therefore, become important. Sturgeons usually do not ovulate under aquaculture conditions, and oocytes at the late-vitellogenic stage are degenerated without oocyte maturation. Therefore, oocyte maturation and ovulation are stimulated by treatment with exogenous hormones, such as a luteinizing hormone-releasing hormone (LHRH) and its analog LHRHa [4,5]. However, ovarian development among individuals and the quality of collected eggs is highly variable, and selecting proper females for inducing ovulation is difficult. Therefore, understanding the process of oocyte maturation in sturgeons is necessary to successfully obtain good quality eggs. However, the MIS has not been identified in sturgeons, and the regulation mechanism of oocyte maturation is currently unclear.
In female teleosts, oocyte growth proceeds under the action of estrogen and androgen produced in the follicular tissues surrounding the oocytes. Estradiol-17β (E2) is essential for oocyte growth via the hepatic synthesis of vitellogenin [6]. Testosterone (T) is a precursor of E2 and 11-ketotestosterone (11KT). In Japanese eel (Anguilla japonica), it plays a role in lipid incorporation into oocytes [7]. In the oocyte maturation phase, a luteinizing hormone (LH) triggers the production of maturation-inducing steroids (MIS), which regulate oocyte maturation and ovulation [8]. The 17α,20β-dihydroxy-4-pregnen-3-one (DHP) has been identified as an MIS in several fish species [9,10,11]. DHP is synthesized from 17α-hydroxyprogesterone (17OHP) via pregnenolone (P5), progesterone (P4), and 17α-hydroxypregnenolone (17OHP5). The 3β-hydroxysteroid dehydrogenase/Δ5–4 isomerase (3β-HSD) is responsible for the synthesis of P4 and 17OHP from P5 and 17OHP5, respectively. Both 17α-hydroxylase and C17–20 lyase regulate dehydroepiandrosterone (DHEA) and androstenedione (A4) production from P5 and P4, respectively (Figure 1).
The hsd3b genes, encoding 3β-HSD, are necessary for the production of glucocorticoids and sex steroids [12]. In zebrafish (Danio rerio), hsd3b is expressed in the head kidneys, and gonads [13]. In addition, a progressive increase in hsd3b transcripts occurs throughout ovarian development of salmonids and mRNA levels peak at the pre-oocyte maturational stage [14,15].
Cytochrome P450c17-Ⅰ catalyzes 17α-hydroxylase and C17-20 lyase activities required for androgen and estrogen synthesis in the gonads [16,17]. P450c17-Ⅱ processes only 17α-hydroxylase, and lacks C17-20 lyase activity in Nile tilapia (Oreochromis niloticus) and medaka (Oryzias latipes) [18,19]. P450c17-Ⅰ and P450c17-Ⅱ are encoded by cyp17a1 and cyp17a2, respectively. In Nile tilapia, cyp17a2 catalyzes the conversion of P5 and P4. Medaka cyp17a2 can catalyze the conversion of the Δ−5 steroid, but it cannot catalyze the conversion of the Δ−4 steroid [18,19]. In Nile tilapia and Japanese eel, cyp17a1 was strongly expressed in the gonads, whereas cyp17a2 was expressed in the gonads and the kidneys [18,20,21]. In Nile tilapia and medaka, cyp17a1 expression peaked at the vitellogenic stage and declined during oocyte maturation. Furthermore, cyp17a2 mRNA levels in the two organisms were highest during oocyte maturation, suggesting that switching in the pattern of cyp17a1 and cyp17a2 expression governs the steroidogenic shift from E2 to DHP during oocyte maturation [18,19]. However, it remains unknown whether the simultaneous downregulation of cyp17a1 and upregulation of cyp17a2 for steroidogenic shift is exhibited in all Actinopterygii.
We have previously analyzed the expression pattern of the 17β-hydroxysteroid dehydrogenase type 12-like gene (hsd17b12L) in Amur sturgeon during oocyte maturation. In vivo experiments have suggested that hsd17b12L expression in ovarian follicles was considerably increased during oocyte maturation and that it was related to DHP production. However, in vitro experiments did not show a correlation between DHP production and hsd17b12L expression, suggesting that hsd17b12L alone does not regulate DHP production. Therefore, we hypothesized that 17OHP production regulates DHP production in sturgeons [22].
In the aforementioned studies, cyp17a1 and cyp17a2 were shown to be related to 17OHP production in Nile tilapia and medaka. However, it was not revealed whether the switching cyp17a1 and cyp17a2 expression systems are common in Actinopterygii, and their expression patterns are correlated with the steroidogenic shift in the follicles. Furthermore, 3β-HSD is an essential enzyme for 17OHP production, but its regulation during oocyte maturation has not been examined, except in salmonids. Therefore, this study aimed to characterize Amur sturgeon hsd3b and cyp17a1/2, determine their roles in 17OHP production, and clarify the mechanism by which DHP production regulates the success of sturgeons in oocyte maturation and ovulation.

2. Materials and Methods

2.1. Animals

Female Amur sturgeons (Acipenser schrenckii; individuals A1–A18) and a male Amur sturgeon (A19 and A20) were reared in three locations. Individuals numbered A1–A4 and A6–A11 (body weight (BW): 22–26 kg) were reared at Shimizu River Trout Farms, Hachimantai, Iwate, Japan, in outdoor tanks under natural day length with a supply of river water at 10 ± 8 °C. Fish A5 and A12–A20 were obtained from a commercial supplier (Fujikin Incorporated, Tsukuba, Japan), and Fish A5, A12, and A13 (BW: 8–12 kg) were reared in indoor tanks with a supply of river water at 11 ± 4 °C in the Sturgeon Museum, Bifuka, Hokkaido, Japan. Fish A14–A20 (BW: 2–16 kg) were reared at Nanae Freshwater Laboratory, Hokkaido, Japan, in outdoor tanks under natural day length with a supply of river water at 10 ± 9 °C. Amur sturgeons whose oocytes reached the late-vitellogenic stage were administered low-dose LHRHa (2 μg/kg BW) (Sigma-Aldrich, St. Louis, MO, USA) and high-dose LHRHa (50 μg/kg BW) 24 h after the low-dose LHRHa injection. Ovarian follicles were collected from Amur sturgeons (individuals A1–A16) just before and 24 h after LHRHa injection. In addition, ovarian follicles were collected from individuals A6–A10 at 8 h after injection and from individuals A1–A5 and A12–A16 at 32 h after injection. Sampling was performed as described previously [22]. Briefly, all individuals were anesthetized with 2-phenoxyethanol, and ovaries and ovarian follicles were collected by biopsy and immediately incubated in Ringer’s solution modified for sturgeons at 4 °C. From A17 and A18, tissues other than those of the testes were isolated, and testes were isolated from A19 and A20. Collected samples were immersed in RNAlater™ stabilization solution (Ambion, Thermo Fisher Scientific, Waltham, MA, USA) and Bouin’s solution. Ovaries fixed in Bouin’s solution were embedded in paraffin, and 5 µm-thick sections were stained with hematoxylin and eosin. The diameter of 50 follicles from each individual was measured, and the average diameter of the largest 20 follicles was calculated. Five ovarian developmental stages (perinucleolus, oil droplet, early vitellogenic, mid-vitellogenic, and late-vitellogenic) were classified according to a previous study [23]. All experimental procedures complied with the guidelines of Animal Research Reporting in vivo experiments.

2.2. Cloning of Amur Sturgeon hsd3b, cyp17a1 and cyp17a2 cDNA

To amplify Amur sturgeon hsd3b cDNA within the coding region, PCR was performed using Q5 High-Fidelity DNA Polymerase (New England Biolabs, Ipswich, MA, USA) with the primer sets 1F and 1R based on the sterlet hsd3b (XM_034011206.2) sequence derived from GenBank (National Center for Biotechnology Information). To amplify Amur sturgeon cyp17a1 cDNA within the coding region, PCR was performed using Q5 High-Fidelity DNA Polymerase with the primer sets 4F and 4R based on the Chinese sturgeon cyp17a1 sequence (MF630999.1). A partial cyp17a2 sequence was obtained from the Amur sturgeon ovary expressed sequence tagged (EST) database. RNA was extracted from Amur sturgeon ovaries at the perinucleolus stage using ISOGEN (Nippon Gene, Toyama, Japan). cDNA libraries for 5′ rapid amplification of cDNA ends (RACE) were constructed using the Smart RACE cDNA amplification kit (Takara Bio Inc., Otsu, Japan), and reverse transcription (RT) was performed using SMART-Scribe reverse transcriptase (Takara Bio). RT was performed with the gene-specific primer (GSP) 7R. The primers were designed based on the partial cyp17a2 sequence for the first RACE-PCR. RACE-PCR was performed using GSP 8R for the first amplification and 9R for nested PCR. Amur sturgeon cyp17a2 cDNA was re-amplified by PCR using KOD FX NEO polymerase (TOYOBO Co. Ltd., Osaka, Japan) with the primer sets 10F and 10R. Amur sturgeon hsd3b and cyp17a1/2 coding regions were inserted into the pSI expression vector (Promega Corp., Madison, WI, USA) using HiFi DNA Assembly Master Mix (New England Biolabs).

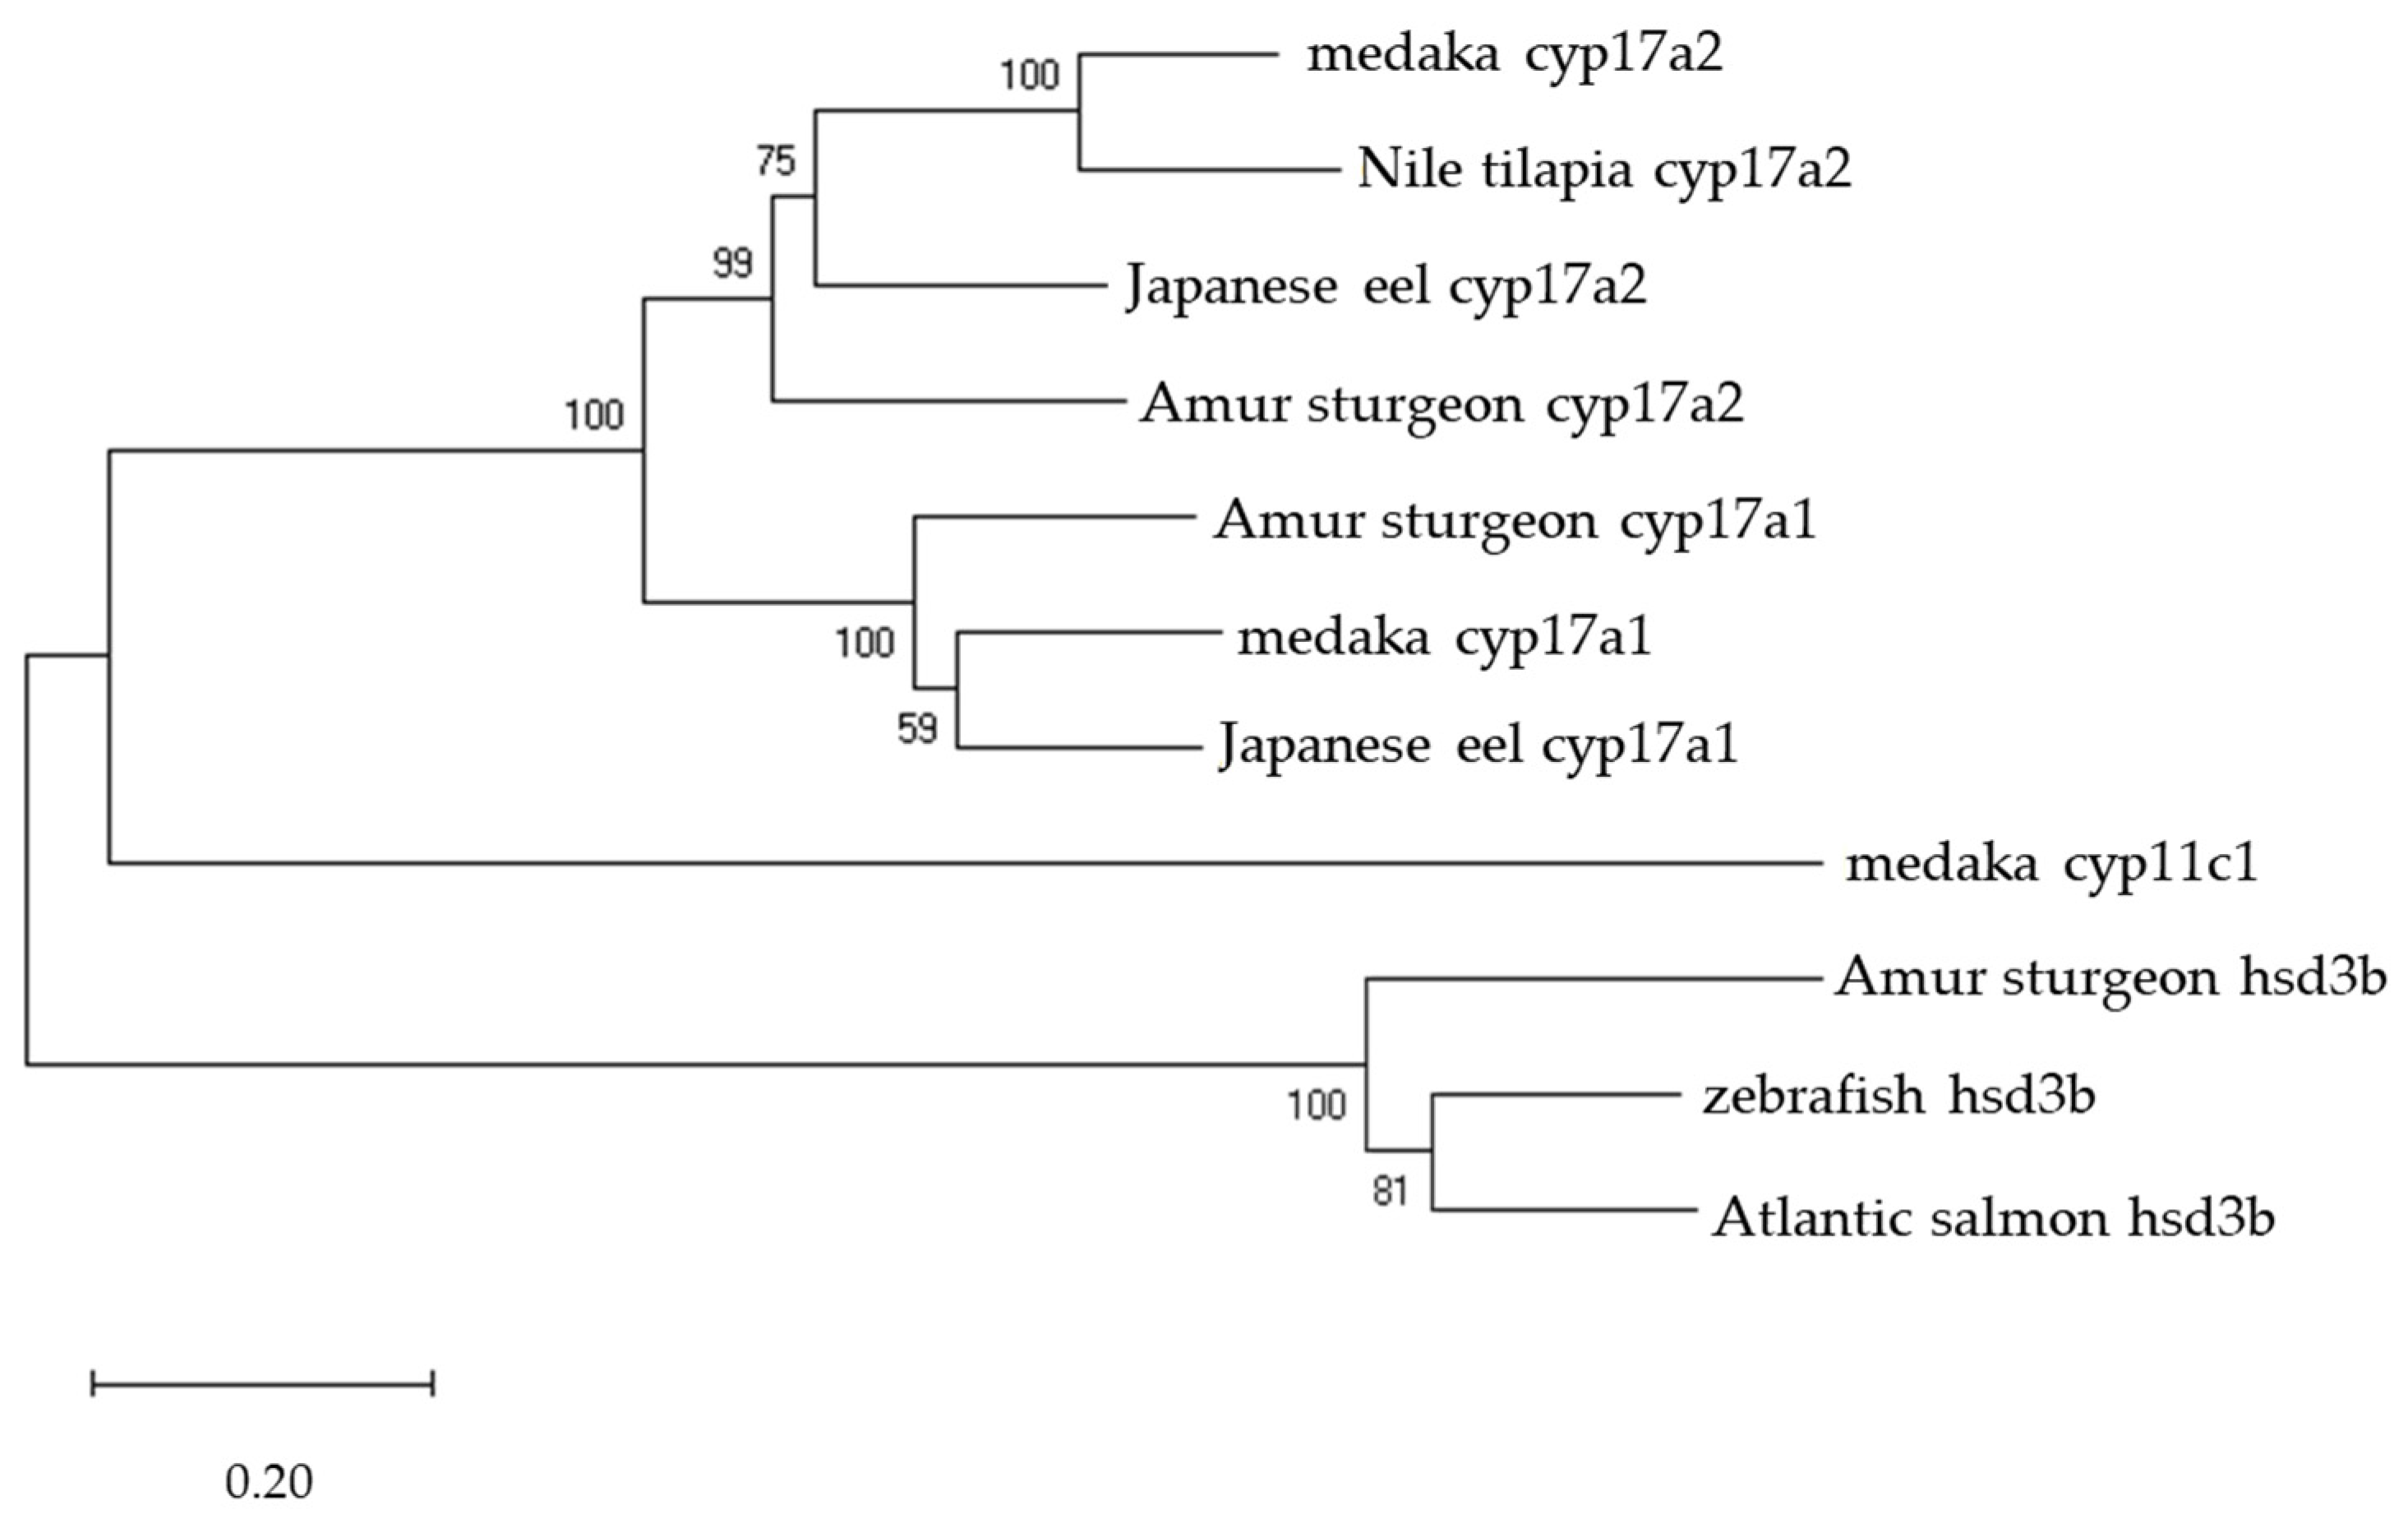
2.3. Phylogenetic Analysis

The cyp17a1 amino acid sequence of the Amur sturgeon, rainbow trout (Oncorhynchus mykiss), medaka, and Japanese eel; the cyp17a2 amino acid sequence of the Amur sturgeon, medaka, Japanese eel, and Nile tilapia; the hsd3b amino acid sequence of the Amur sturgeon, zebrafish (Danio rerio), and Atlantic salmon (Salmo salar); and the cyp11c1 amino acid sequence of medaka as an outgroup were aligned using the Molecular Evolutionary Genetics Analysis software (http://www.megasoftware.net (accessed on 11 November 2021)). A phylogenetic tree was constructed by the neighbor-joining method using the aforementioned software. Numbers are the percentage of 1000 replicates in which the associated taxa clustered together in the bootstrap test, indicating the reliability of each branch. The GenBank accession number of the nine sequences are as follows: rainbow trout cyp17a1 (NP_001118219.1), medaka cyp17a1 (P70085.1), Japanese eel cyp17a1 (XP_035282250.1), medaka cyp17a2 (ABQ96161.1), Japanese eel cyp17a2 (AJQ25355.1), Nile tilapia cyp17a2 (ABQ96160.1), zebrafish hsd3b (AAI52681.1), Atlantic salmon hsd3b (XP_014029529.1) and medaka cyp11c1 (BAC87755.1).

2.4. Enzyme Activity Determined via Liquid Chromatography/Mass Spectrometry (LC/MS)

Amur sturgeon hsd3b and cyp17a1/2 expression vectors were transfected into HEK293T cells using ScreenFectTM A plus (FUJIFILM Wako Pure Chemical Corporation, Osaka, Japan) transfection reagent. Cells were incubated in 24-well cell culture plates containing 500 μL of DMEM (Dulbecco’s Modified Eagle media; FUJIFILM Wako) with 10% fetal bovine serum (FBS), 100 U/mL penicillin (FUJIFILM Wako), and 100 μg/mL streptomycin (FUJIFILM Wako) at 37 °C and 5% CO2. At 24 h after transfection with these expression vectors, cell incubation was performed in DMEM without FBS, including 1000 ng/mL P5, 17OHP5, P4, 17OHP, A4, T, DHEA, and A5, respectively, for 18 h. Steroid metabolite was extracted from the media as described previously [22]. Briefly, steroid metabolites were extracted using dichloromethane and resuspended in LC/MS-grade methanol (FUJIFILM Wako). The resulting suspension was filtered through a 0.22 μm micropore filter.

2.5. LC/MS

All procedures were performed according to the method described previously [22]. Briefly, liquid chromatography was performed using a DGU-20A-5R degassing unit, and steroids were separated on a polar C18 column (2.6 μm, 100 × 2.1 mm) with methanol and 0.1% (v/v) formic acid in water with elution at 0.25 mL/min. Mass spectrometry analyses were conducted using the Triple TOF 5600 + system. Total ion chromatograms were recorded using the Analyst TF software. LC/MS data were analyzed using PeakView 2.1 software, and quantification was carried out using MultiQuant software.

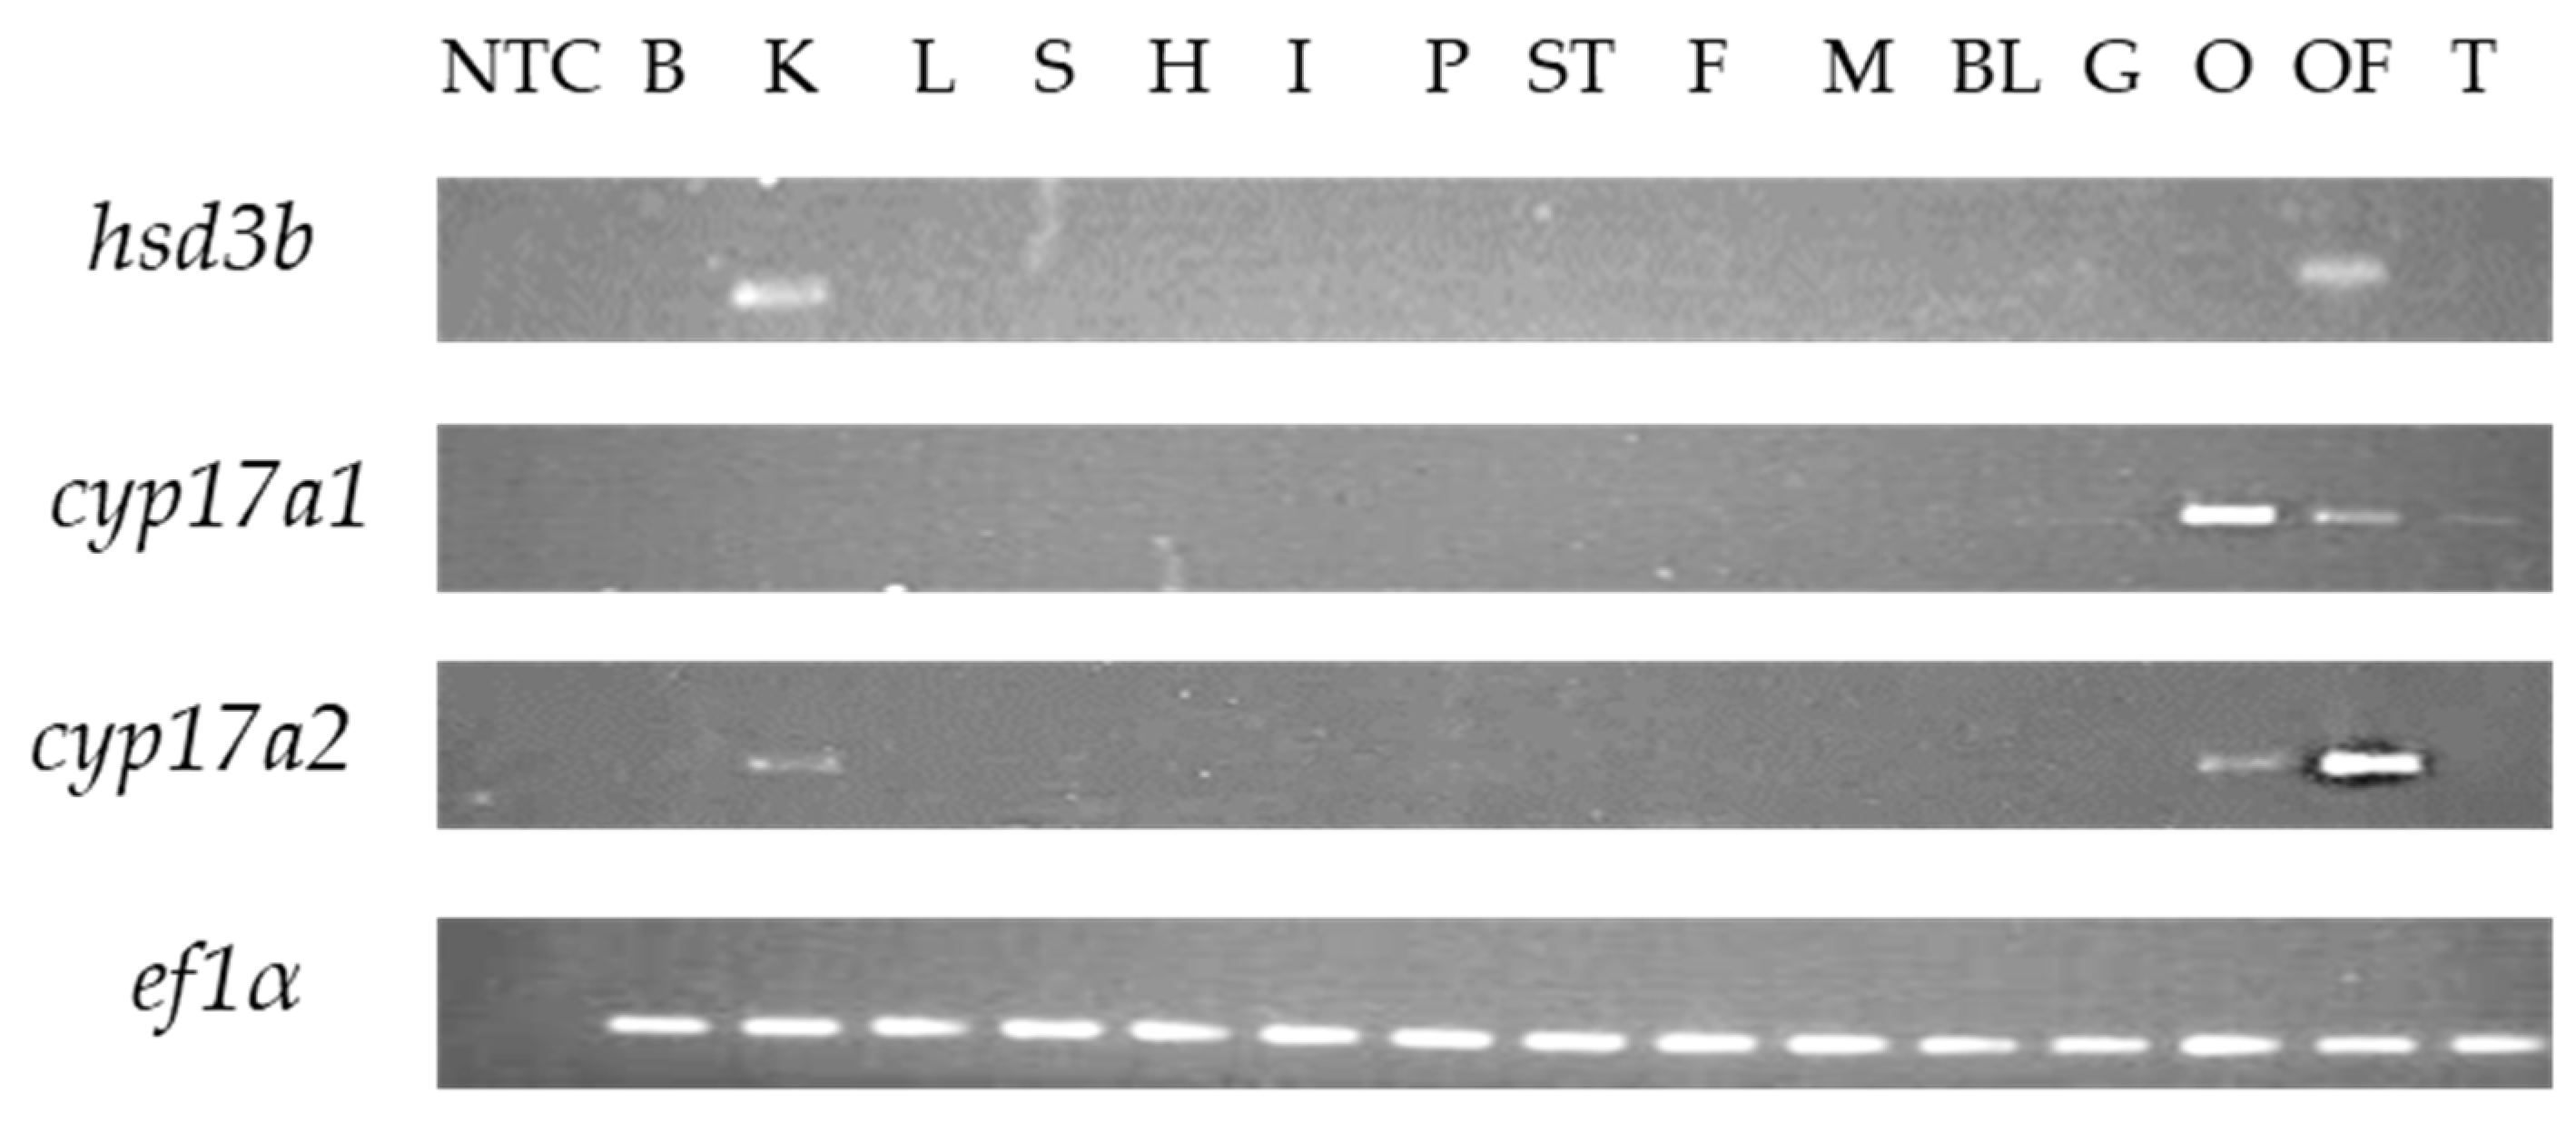
2.6. Tissue-Specific hsd3b and cyp17a1/2 mRNA Expression

RNA extraction was performed as described previously [22]. Briefly, total RNA was isolated from 16 tissues using ISOGEN. Total RNA (500 ng) was reverse-transcribed using random hexamer primers and Revertra Ace. PCR was performed using the KAPA Taq EXTRA DNA Polymerase under the following conditions: 94 °C for 2 min, 30 cycles at 94 °C (15 s), annealing at 52 °C (15 s) and 72 °C (24 s), followed by a final elongation step at 72 °C (24 s). Hsd3b, cyp17a1, and cyp17a2 were amplified using primers pairs 2F–2R, 5F–5R, and 11F–11R, respectively. Primers were designed with a common sequence among cDNA types, and the primers included an intron/exon boundary to eliminate genomic amplification. Ef1α was used as an internal control (ef1α1F–1R). PCR was also carried out using water as the template for the negative control. The PCR products were electrophoresed on a 1.5% agarose gel, stained with ethidium bromide.

2.7. DHP Measurement

Metabolites were extracted from the serum and medium using diethyl ether, according to a previously described method [24]. The DHP concentration was determined using time-resolved fluoroimmunoassay (TR-FIA), as described previously [25]. Cross-reaction with other steroids and the inter/intra coefficients of variation in DHP TR-FIA were determined as reported previously [22].

2.8. Serum E2, T, and 11KT Measurement

Metabolite extraction from the serum and determination of serum E2 concentration using TR-FIA are described in Section 2.7. The cross-reactions of T and E1 in E2 TR-FIA were 0.8% and 0.05%, respectively. Serum T and 11KT concentrations were determined by LC/MS analyses.

2.9. In Vivo Experiment

The ovarian follicles were collected from Amur sturgeons (A1–A16) immediately before LHRHa injection, and at 24 and 32 h post-injection. In individuals A6–A10, the ovarian follicles were collected 8 h after injection, in addition to the aforementioned timepoints. Ovarian follicles were immersed in RNAlater™ solution. In addition, ovarian follicles were immediately fixed with Bouin’s fluid for 48 h and used to calculate the germinal vesicle breakdown (GVBD) rates. Simultaneously, blood was collected from individuals (A1–A16) at the aforementioned timepoints. The blood samples were stored at 4 °C for 24 h before serum collection.
The ovaries and ovarian follicles at five developmental stages were collected from Amur sturgeons.

2.10. Incubation of Ovarian Follicles

The ovarian follicles were collected from Amur sturgeon (A6–A8) 8 h after LHRHa injection. Incubation of ovarian follicles was performed as described previously [22]. Briefly, after 3 h pre incubation in Ringer’s solution, single follicles were incubated in each well of 24-well plates containing 1 mL of Leibovitz’s L-15 culture medium. Ovarian follicles were incubated in L-15 culture media alone as a control or in the presence of 500 μg/mL salmon pituitary extract (SPE). Follicles isolated were incubated at 12 °C for 3, 6, 9, 12, 24, and 36 h. Incubations were conducted in triplicate for each time-point.

2.11. cDNAs Synthesis and Quantitative PCR

cDNA synthesis and quantitative PCR (qPCR) were performed as described previously [22]. Briefly, total RNA (700 ng) from each follicle was reverse-transcribed as described in Section 2.6. The RT reaction mixture diluted 50 times was used as a template to obtain 10 μL of qPCR mixture. qPCR was performed using the Power Up SYBR Green Master Mix and the StepOnePlus Real-Time PCR system with StepOne Software. qPCR of hsd3b, cyp17a1, and cyp17a2 was performed with a known plasmid copy number (103–107 copies) using the qPCR primer sets 3F–3R, 6F–6R, and 12F–12R, respectively, including intron/exon boundaries (Table 1). Primers were designed for common sequences among cDNA types.

2.12. Statistical Analyses

Student’s t-test was performed to evaluate the differences between the control and SPE groups. Differences among groups were analyzed using the Tukey–Kramer test. Differences among groups were statistically significant at p < 0.05. Bell Curve for Excel version 7.0 was used for statistical analyses.

3. Results

3.1. Isolation of hsd3b and cyp17a1/2 cDNA from Amur Sturgeon

Three types of hsd3b cDNA (types I–Ⅲ), six types of cyp17a1 cDNA (types I–VI), and two types of cyp17a2 cDNA (types I–Ⅱ) were isolated from Amur sturgeon ovarian follicles (n = 1) (Supplemental Figures S1–S3). Amur sturgeon hsd3b type-I, cyp17a1 types I, II, IV, and cyp17a2 type-I were isolated frequently, and the others were isolated once. The GenBank accession number of these sequences are as follows: hsd3b type I (LC663549.1), cyp17a1 type I (LC663550.1), and cyp17a2 type I (LC663548.1). In the phylogenetic analysis, Amur sturgeon hsd3b belonged to the same clade as that of the Japanese eel and medaka. Amur sturgeon cyp17a1 type-I is located within the same clade as rainbow trout, medaka, and Japanese eel cyp17a1. Amur sturgeon cyp17a2 type-Ⅰ belonged to the same clade as that of Japanese eel, medaka, and Nile tilapia (see Figure 2).

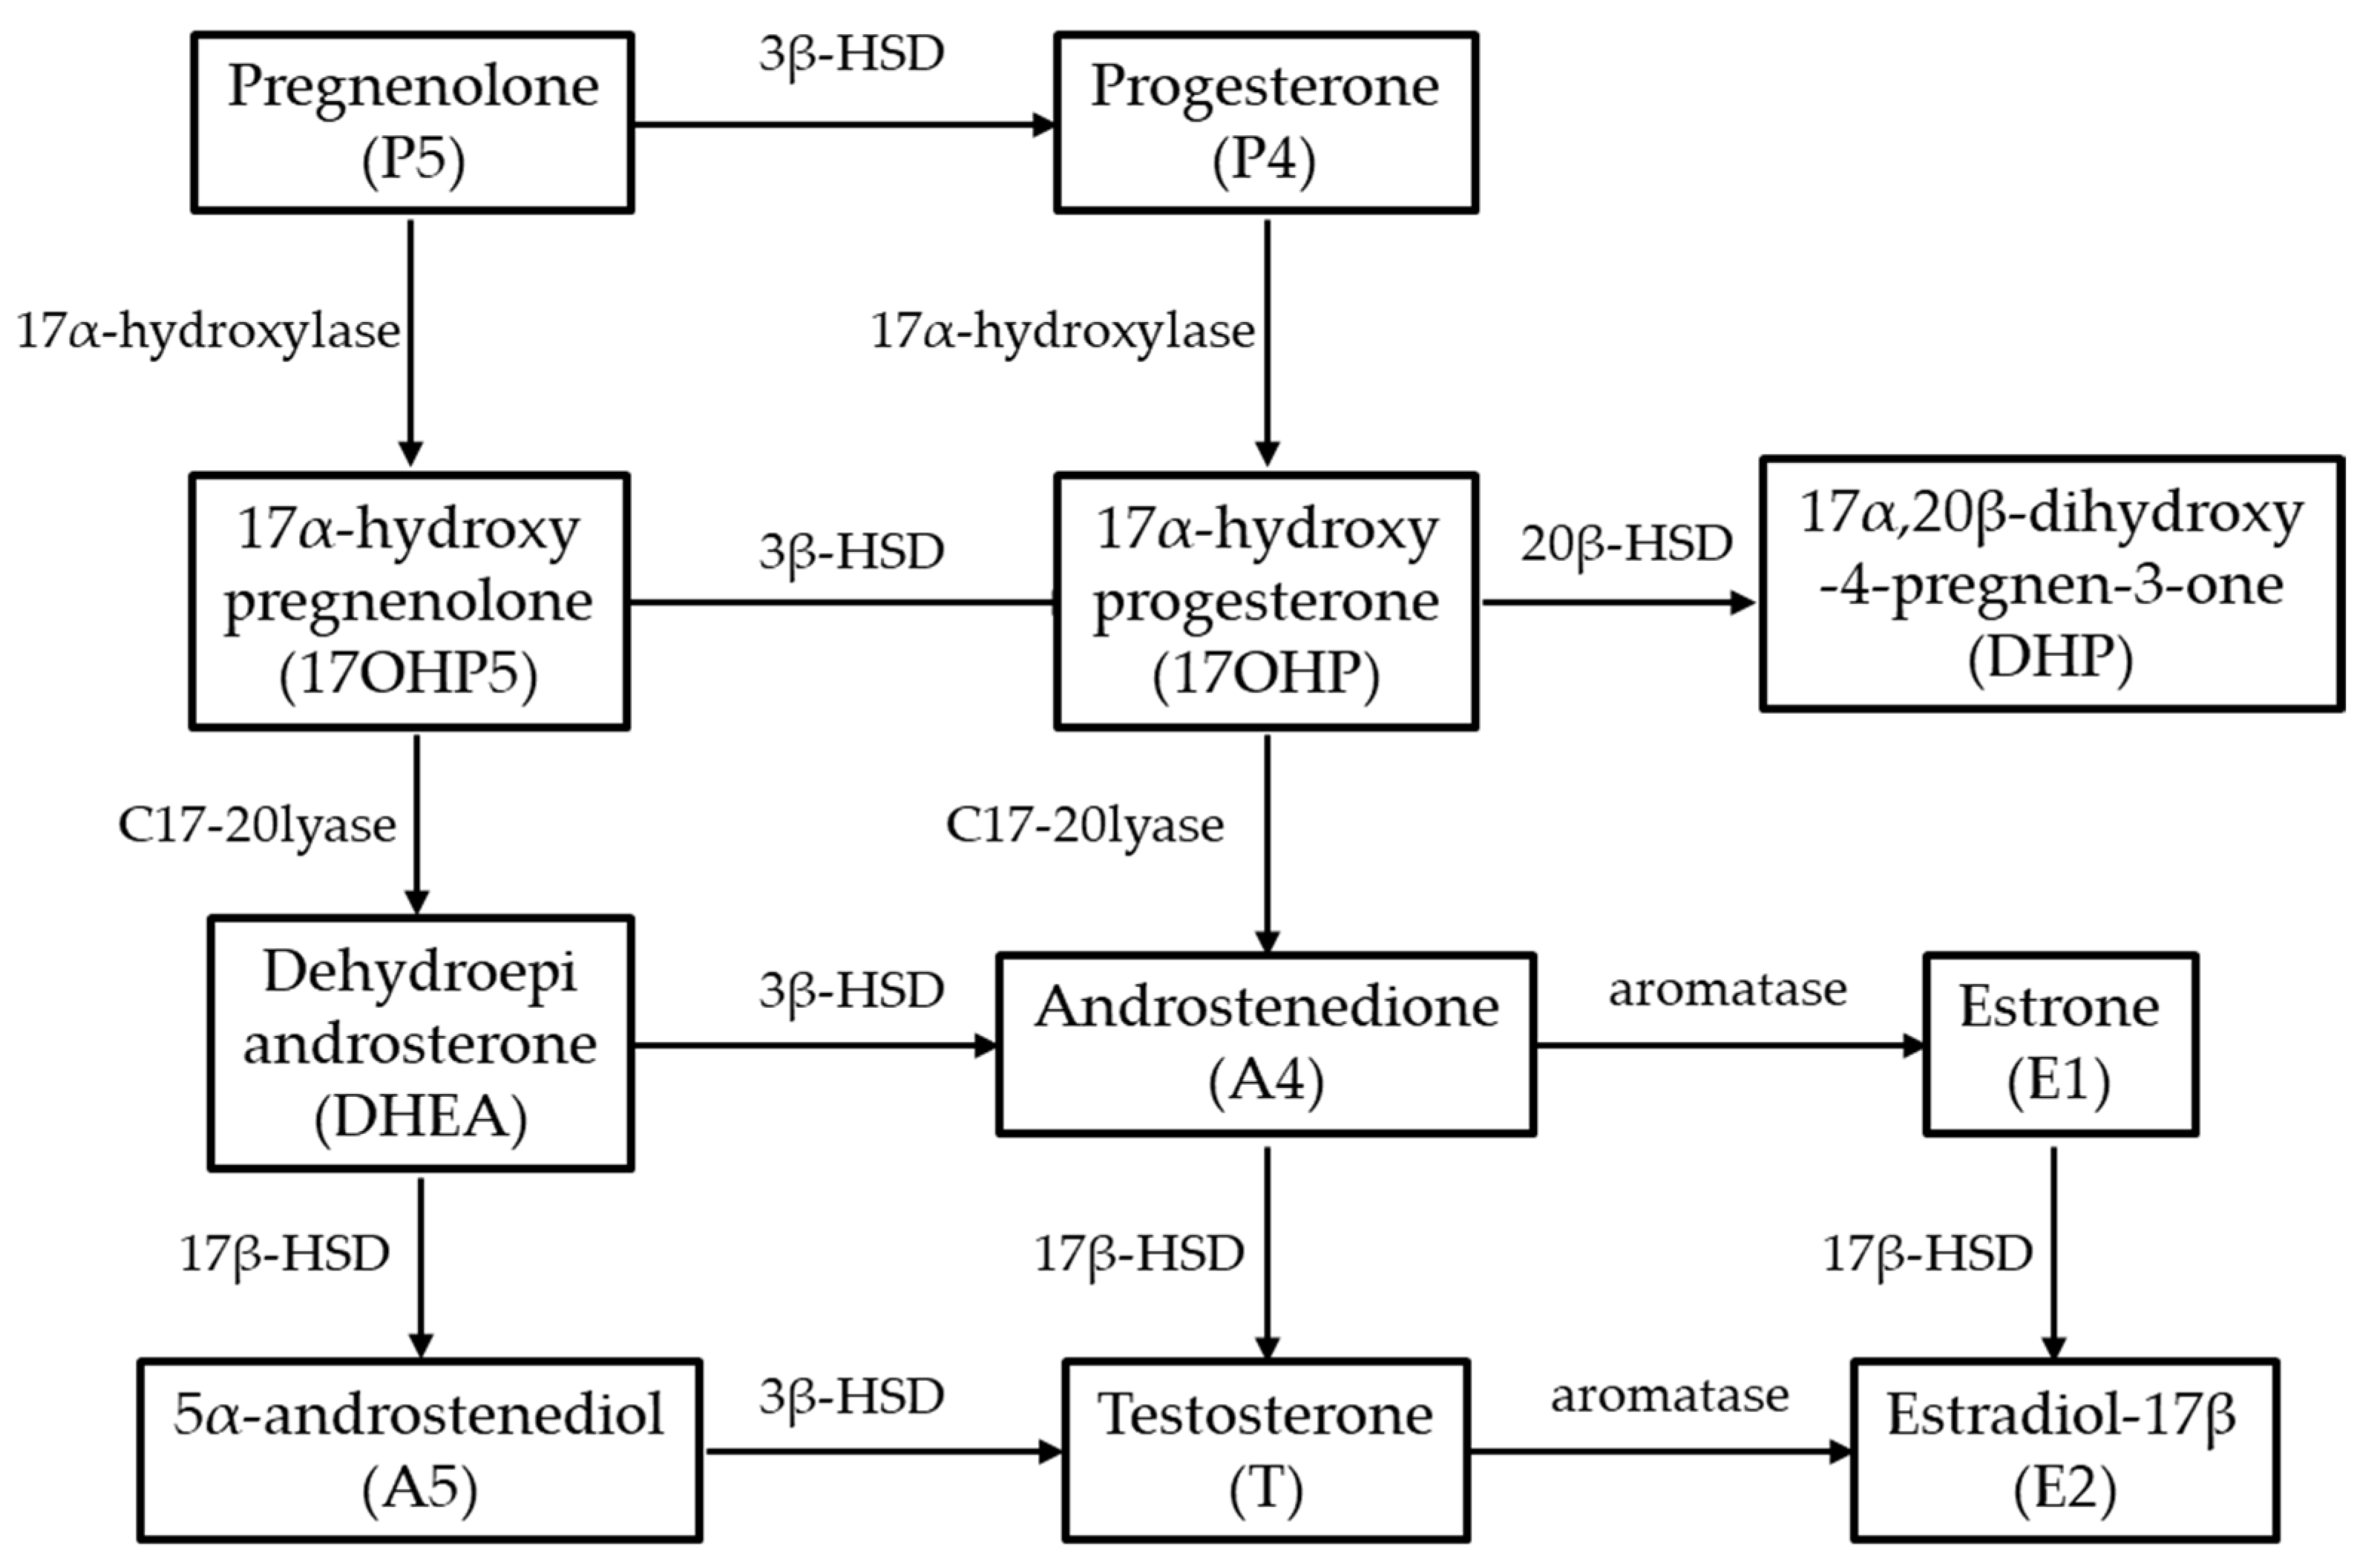
3.2. Enzyme Activity Determined via LC/MS Analysis

Substrate specificities of Amur sturgeon hsd3b type-I and cyp17a1/2 type-I are shown in Table 2. Amur sturgeon hsd3b exhibited a high conversion rate of P5 to P4, 17OHP5 to 17OHP, DHEA to A4, and A5 to T, while it did not exhibit conversion of P4 to P5, 17OHP to 17OHP5, A4 to DHEA, and T to A5. Amur sturgeon cyp17a1 type-I exhibited a low conversion rate of P5 to 17OHP5 and DHEA, and of P4 to 17OHP and A4. Amur sturgeon cyp17a2 type-Ⅰ exhibited a high conversion rate of P4 to 17OHP, but a low conversion rate of P5 to 17OHP5. Furthermore, Amur sturgeon cyp17a2 type-I did not exhibit the conversion of P5 to DHEA and P4 to A4. Amur sturgeon cyp17a1 type-I and cyp17a2 type-I did not exhibit the conversion of 17OHP5 to P5 and of 17OHP to P4 (Table 2). Amur sturgeon hsd3b types Ⅱ–Ⅲ and Amur sturgeon cyp17a1 types Ⅱ–Ⅵ exhibited similar enzyme activities as that of hsd3b type-I and cyp17a1 type-I, respectively (Tables S1 and S2). Amur sturgeon cyp17a2 type-II did not show 17α-hydroxylase activity, converting P5 to 17OHP5, and P4 to 17OHP (Table S1).

3.3. Tissue-Specific hsd3b and cyp17a1/2 mRNA Expression

Tissue-specific hsd3b and cyp17a1/2 mRNA expression between two individuals were the same, indicating the result from one individual. In Amur sturgeon, cyp17a1 mRNA expression was observed in the ovary and ovarian follicles, and faint amplification was observed in the testis; cyp17a2 mRNA expression was observed in the kidneys, ovaries, and ovarian follicles; and hsd3b mRNA was expressed in the kidney and ovarian follicles (Figure 3).

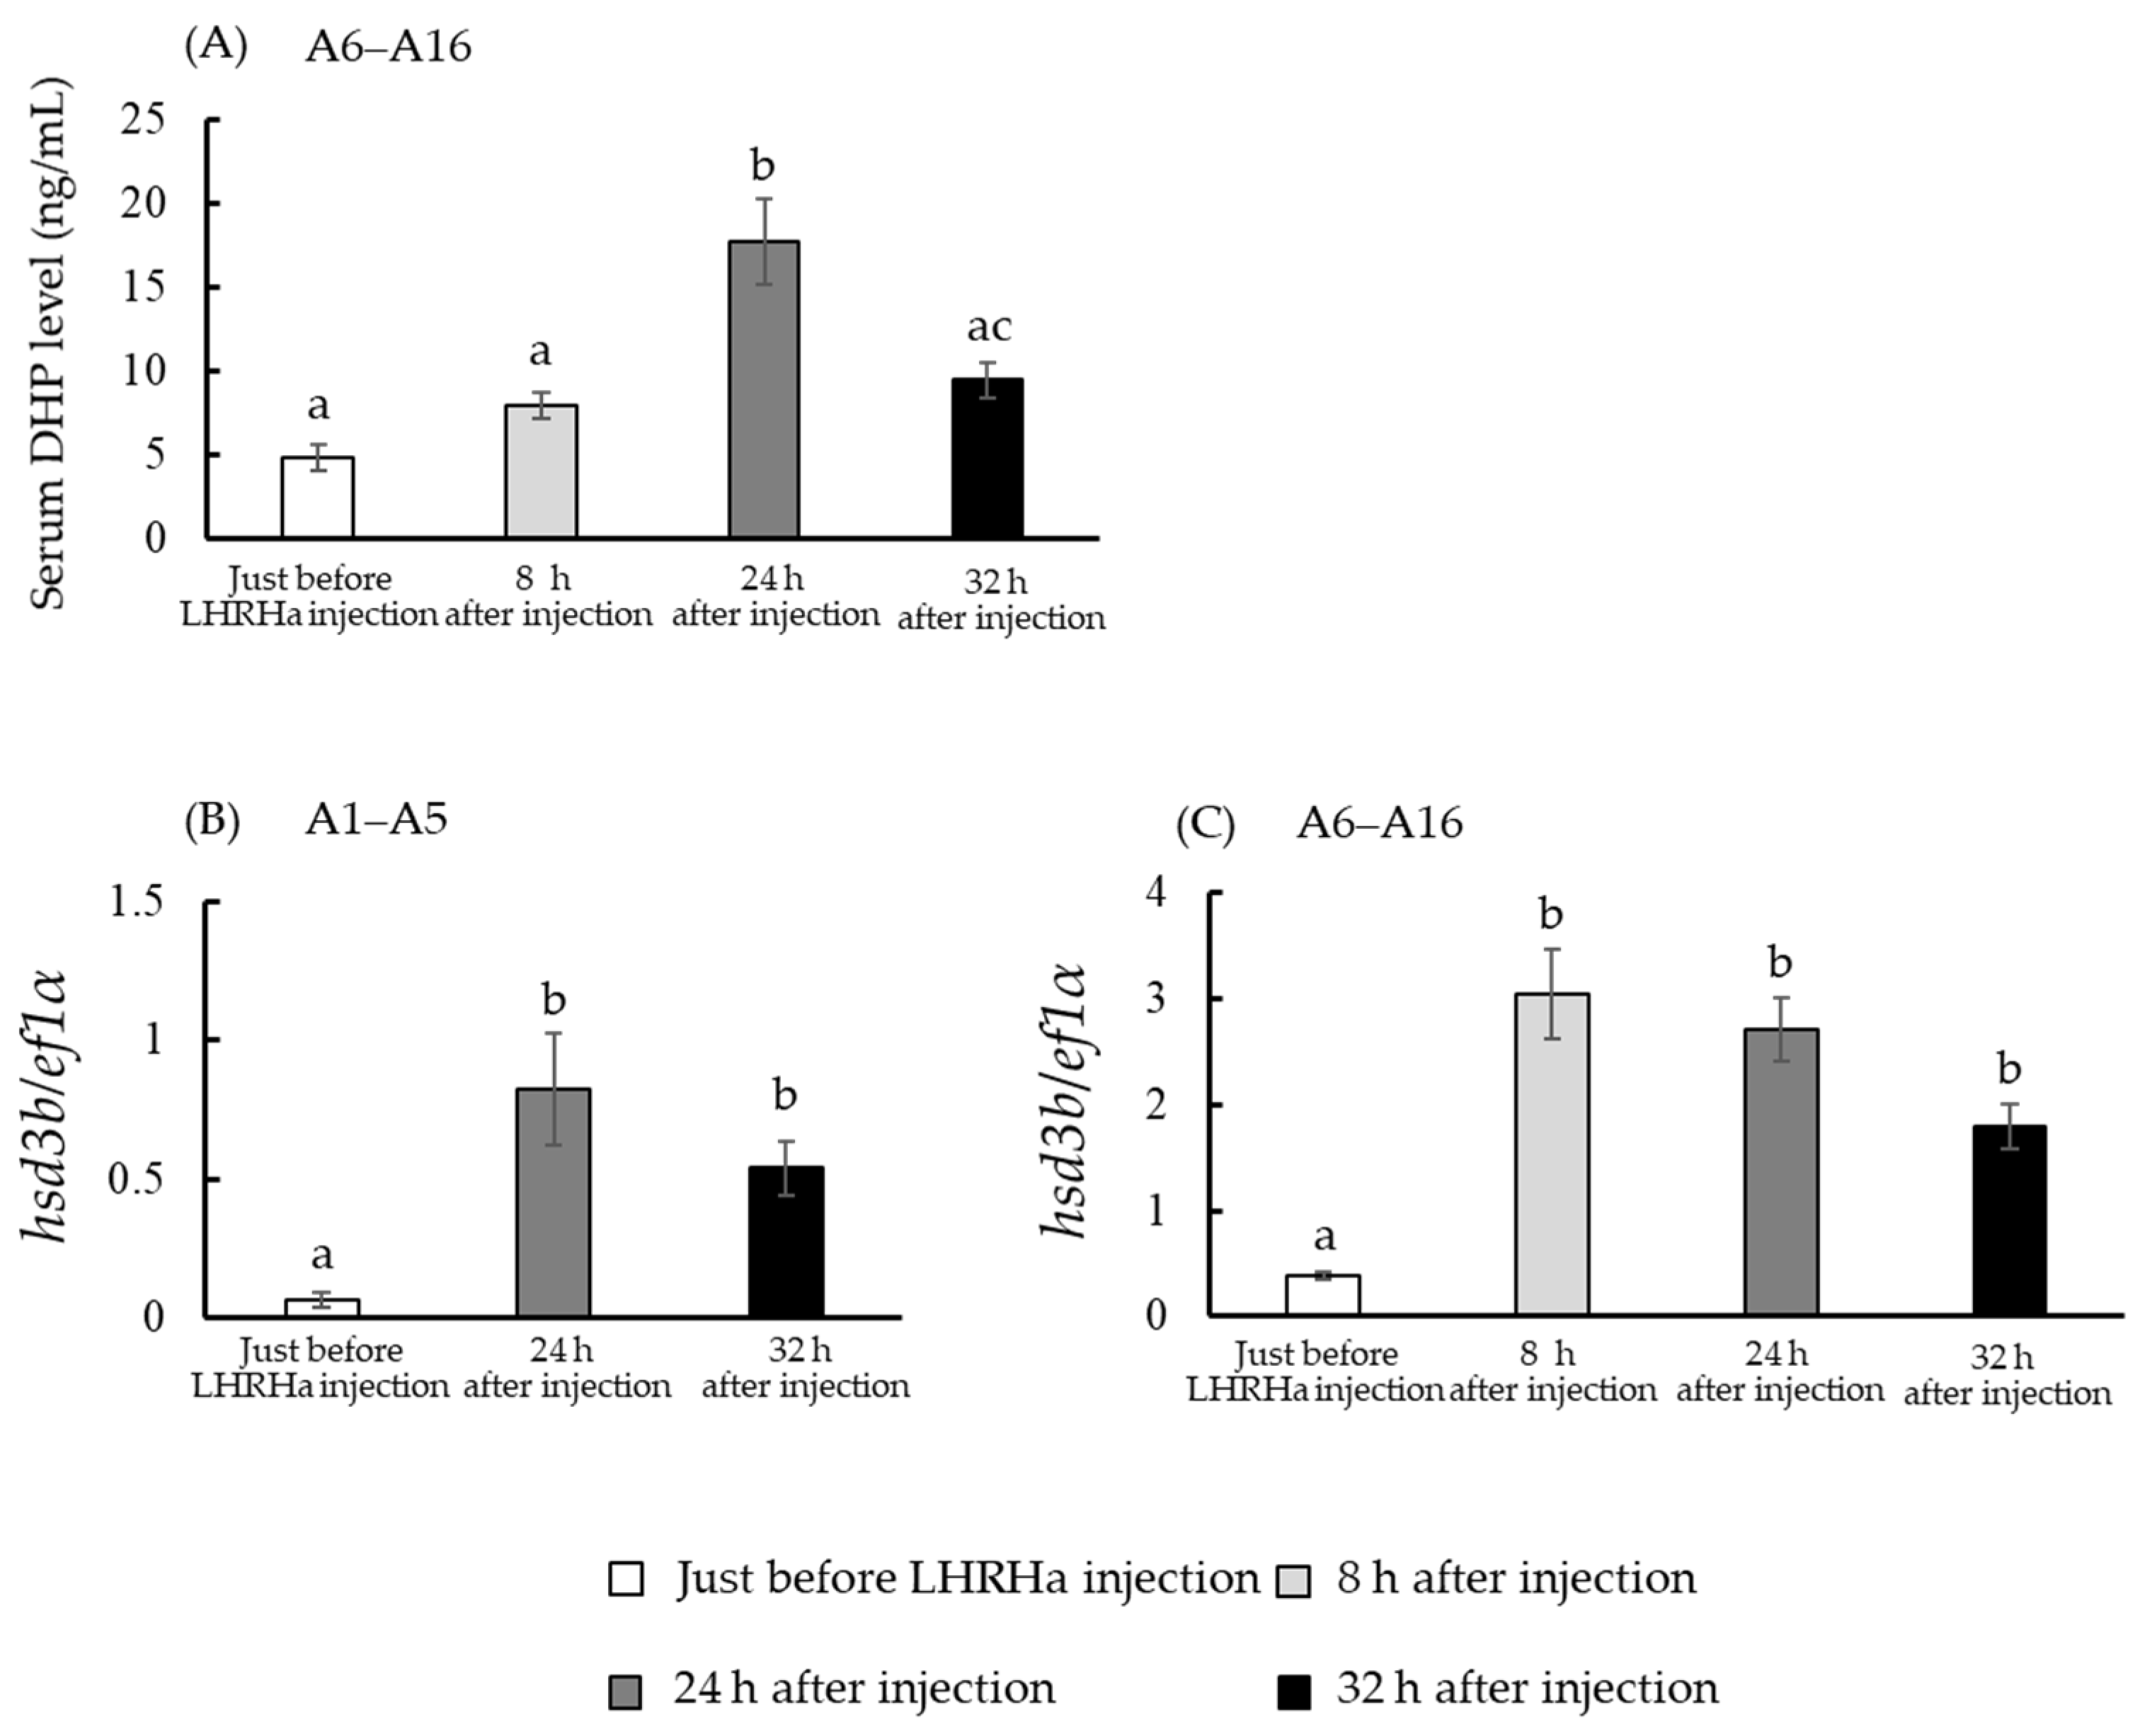
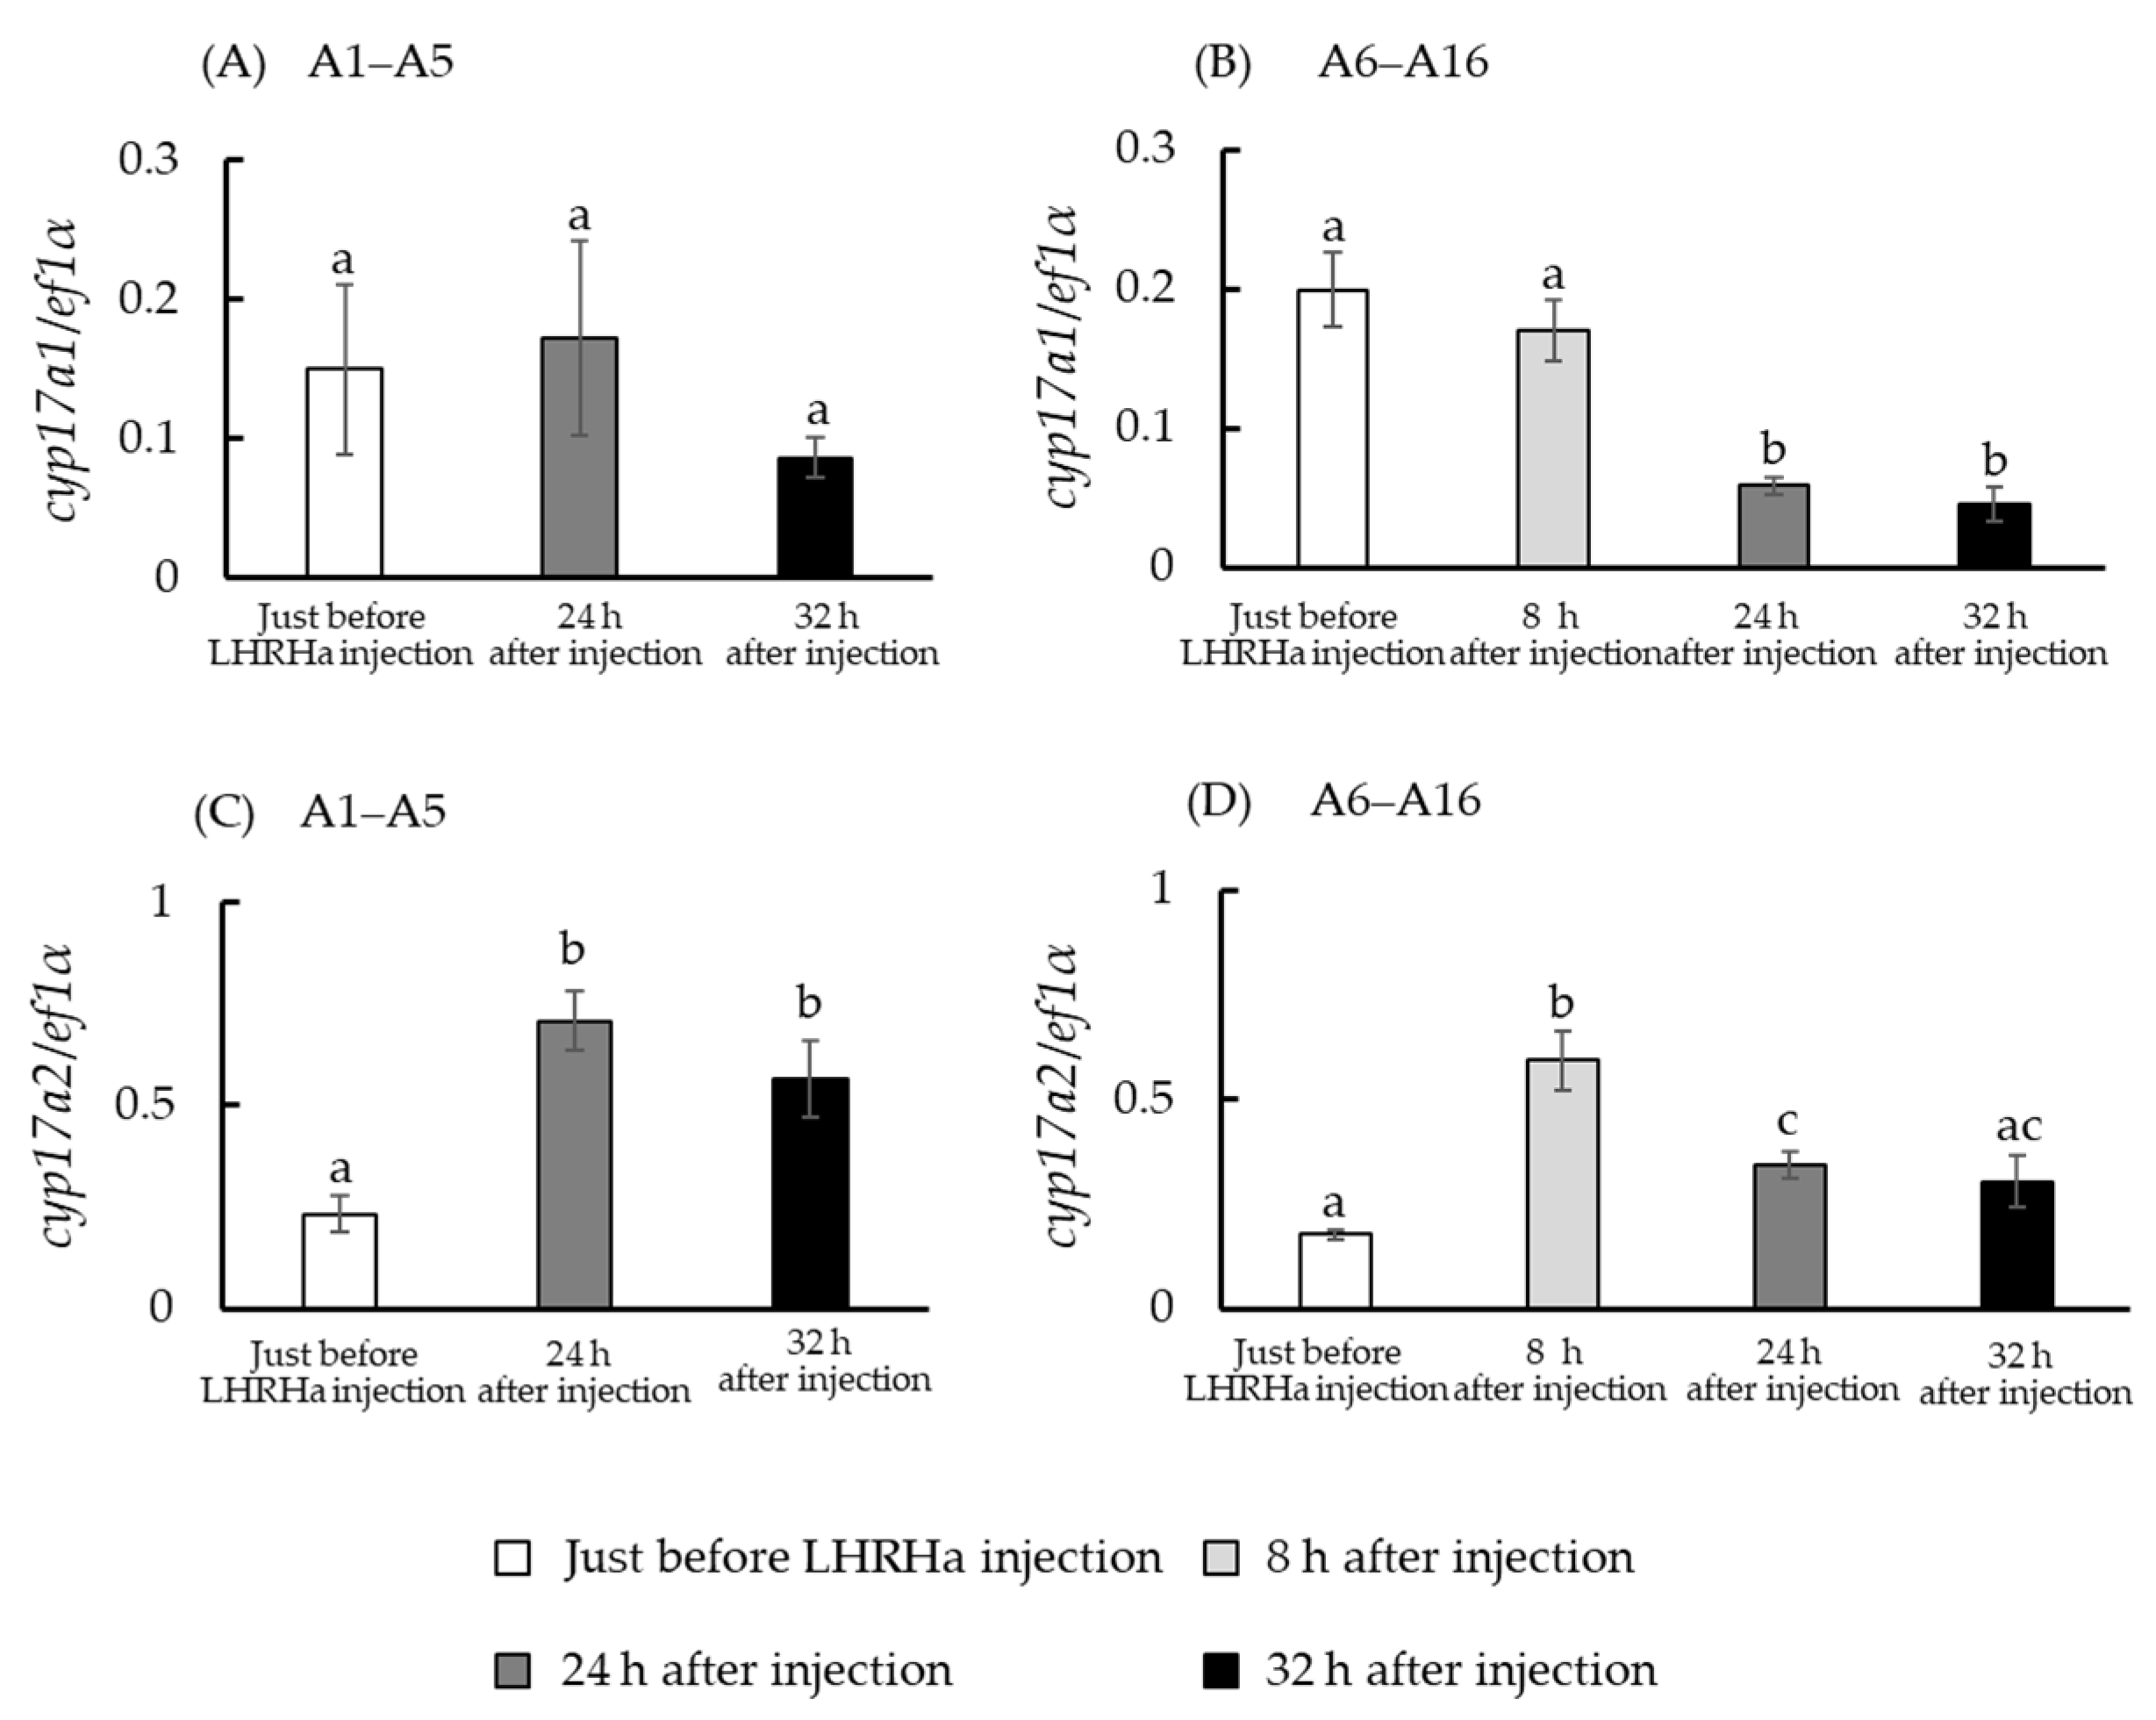
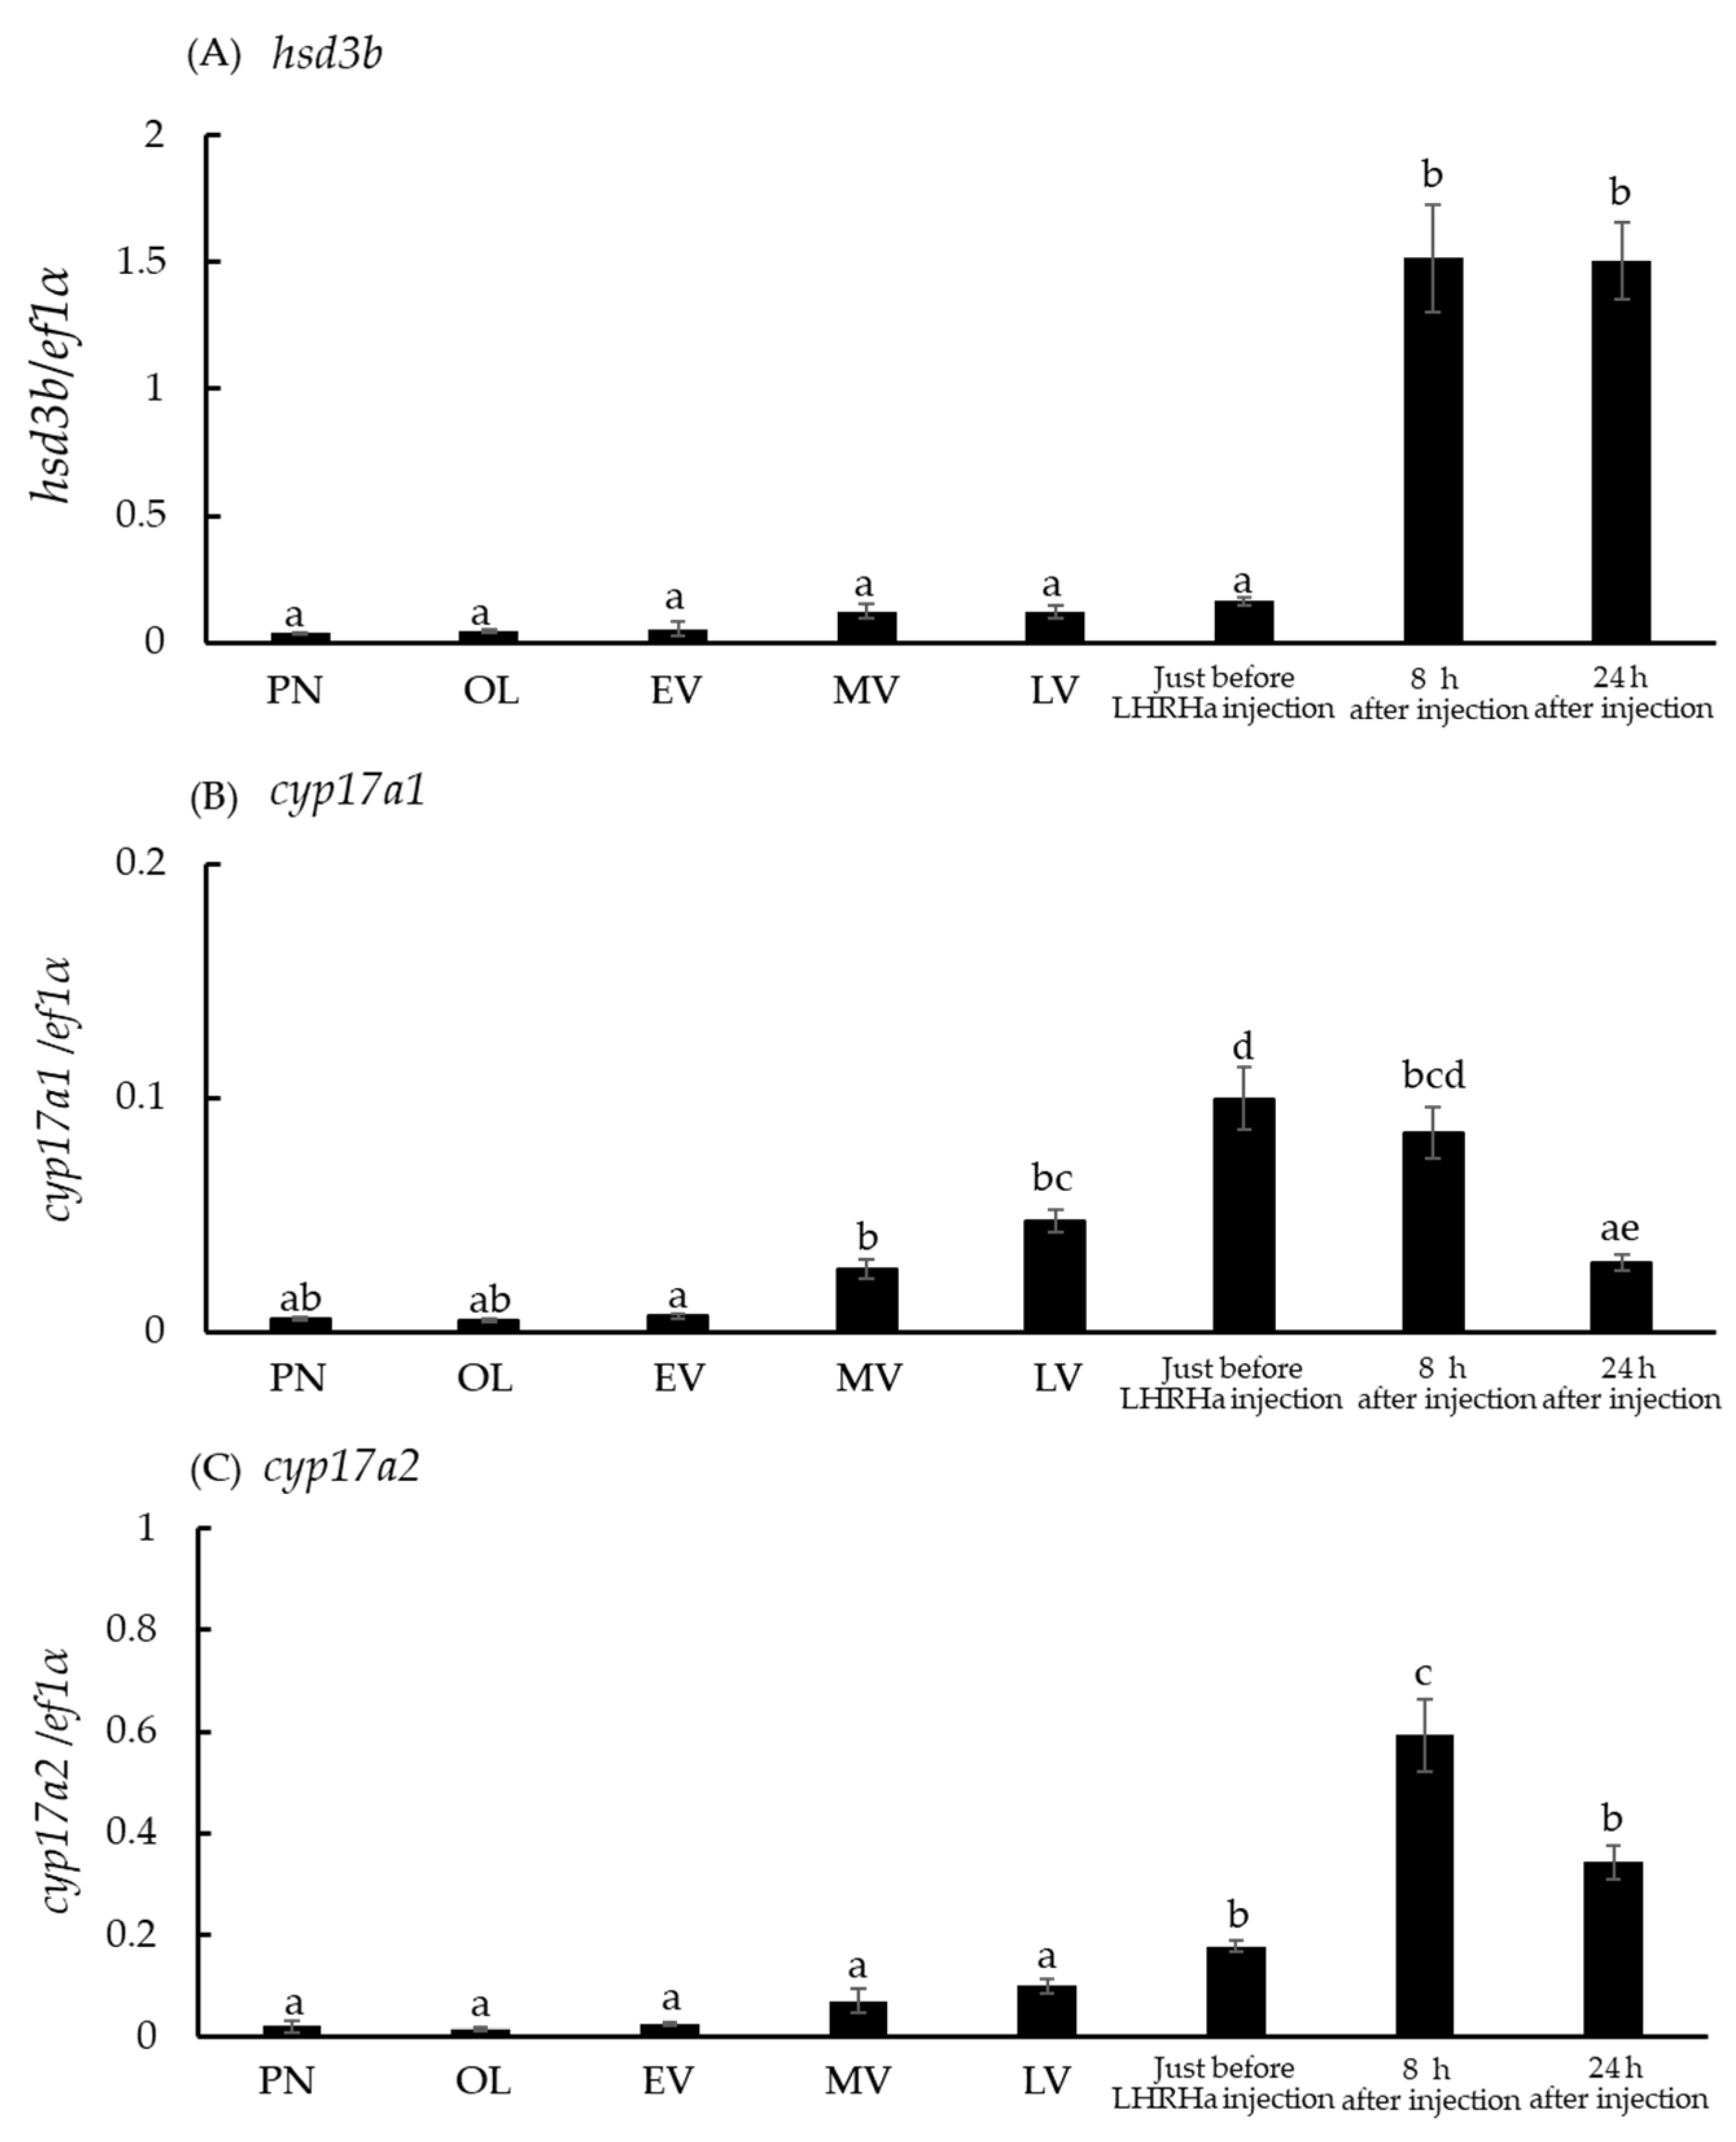
3.4. In Vivo hsd3b and cyp17a1/2 mRNA Levels

The serum DHP concentration in individuals that did not ovulate (A1–A5) has been presented elsewhere [22]. In individuals that reached ovulation (A6–A16), the serum DHP concentrations at 8 h and 32 h were not higher than that before the injection. However, DHP concentrations at 24 h were higher than those before the injection (Figure 4A). Figure 4 and Figure 5 show the hsd3b and cyp17a1/2 mRNA levels in the ovarian follicles collected from individuals (A1–A16) before, and 8 h, 24 h, and 32 h after LHRHa injection. In individuals A1–A5 and A6–A16, hsd3b mRNA levels at 8, 24, and 32 h after the injection were higher than those before the injection (Figure 4B,C). In individuals A1–A5, cyp17a1 mRNA levels at 24 h and 32 h after the injection were not significantly different from those before the injection (Figure 5A). In individuals A6–A16, cyp17a1 mRNA levels at 24 h and 32 h after the injection were lower than those before the injection (Figure 5B). Furthermore, in individuals A6–A16, cyp17a1 mRNA levels at 8 h after the injection did not show a significant difference compared to those before the injection (Figure 5B). In individuals A1–A5 and A6–A16, cyp17a2 mRNA levels at 24 h after LHRHa injection were higher than those before the injection (Figure 5C,D). In individuals A6–A16, cyp17a2 mRNA levels at 8 h after the injection were higher than those before the injection, and 24 h and 32 h after the injection (Figure 5D). Furthermore, the cyp17a2 expression levels detected in individuals A1–A5 were higher than those in individuals A6–A16.

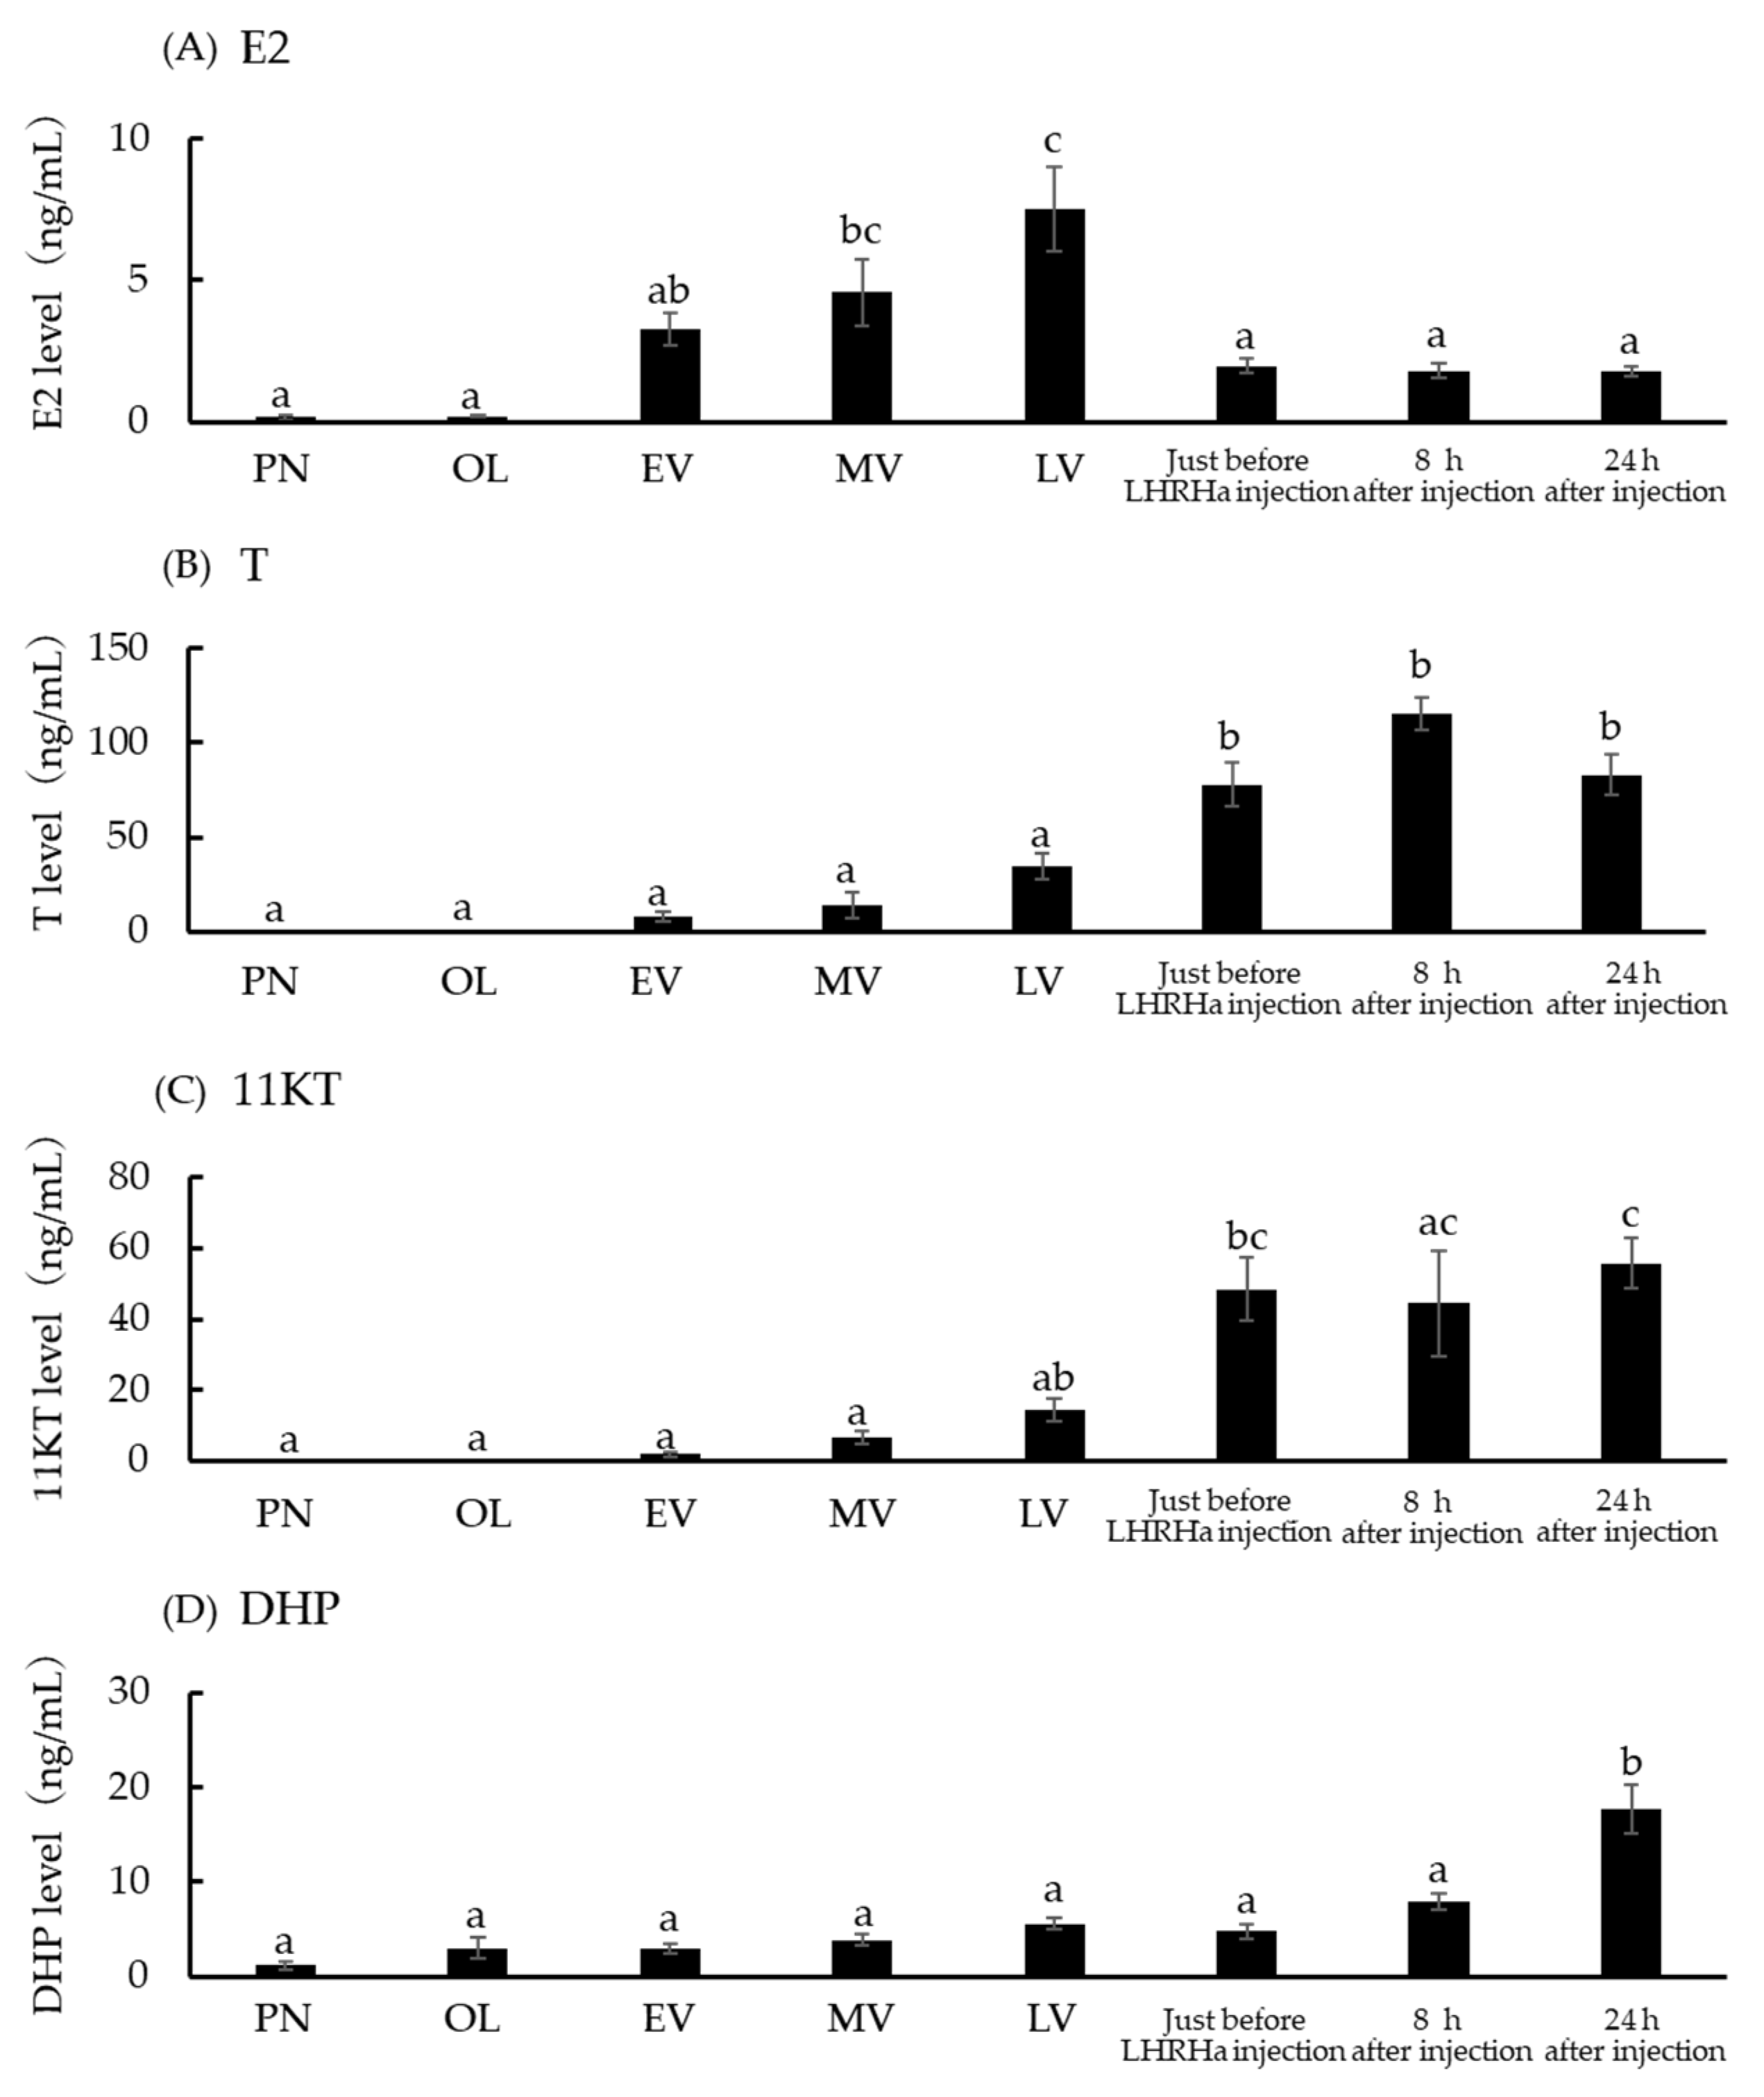
3.5. Serum E2, T, 11KT, and DHP Concentration at Five Ovarian Developmental Stages

Figure 6 shows the serum E2, T, 11KT, and DHP concentrations at the five ovarian developmental stages. Serum E2 concentrations just before the injection, and at 8 h and 24 h after the injection were lower than those at mid- and late-vitellogenic stages. Serum E2 concentration before injection, and 8 h and 24 h after the injection did not show a significant difference (Figure 6A). Serum T concentrations just before LHRHa injection, and 8 h and 24 h after the injection were higher than those at the perinucleolus, oil droplet, and early-, mid-, and late-vitellogenic stages. Serum T concentrations among individuals before injection, and 8 h and 24 h after the injection were similar (Figure 6B). Serum 11KT concentrations in individuals before injection and 24 h after injection were higher than those at the perinucleolus stage, oil droplet stage, and early- and mid-vitellogenic stages. Serum 11KT concentration before the injection, and 8 h and 24 h after the injection did not show a significant difference (Figure 6C). Serum DHP concentrations at 24 h after injection were higher than those at other stages. Serum DHP concentrations among individuals at the oil droplet, early-, mid-, and late-vitellogenic stages and before the injection were similar (Figure 6D).

3.6. Hsd3b and Cyp17a1/2 mRNA Levels in Ovaries at the Five Developmental Stages

Figure 7 shows the hsd3b and cyp17a1/2 mRNA levels in the ovaries at the five developmental stages. The hsd3b mRNA levels in ovarian follicles before low-dose LHRHa injection did not show significant differences compared to those in ovaries at all developmental stages but those in ovarian follicles at 8 h and 24 h after the injection were higher than those observed in ovaries and ovarian follicles at all stages. Furthermore, hsd3b mRNA levels in ovarian follicles at 8 h and 24 h after injection were considerably higher than those just before injection (Figure 7A). The cyp17a1 mRNA levels in ovarian follicles before injection were higher than those observed in ovaries at all stages while those in ovarian follicles 24 h after injection were lower than those just before the injection (Figure 7B). The cyp17a2 mRNA levels in ovarian follicles just before injection did not show significant differences compared to those of ovaries and ovarian follicles at all stages but the levels in ovarian follicles 8 h after injection were higher than those just before the injection (Figure 7C).

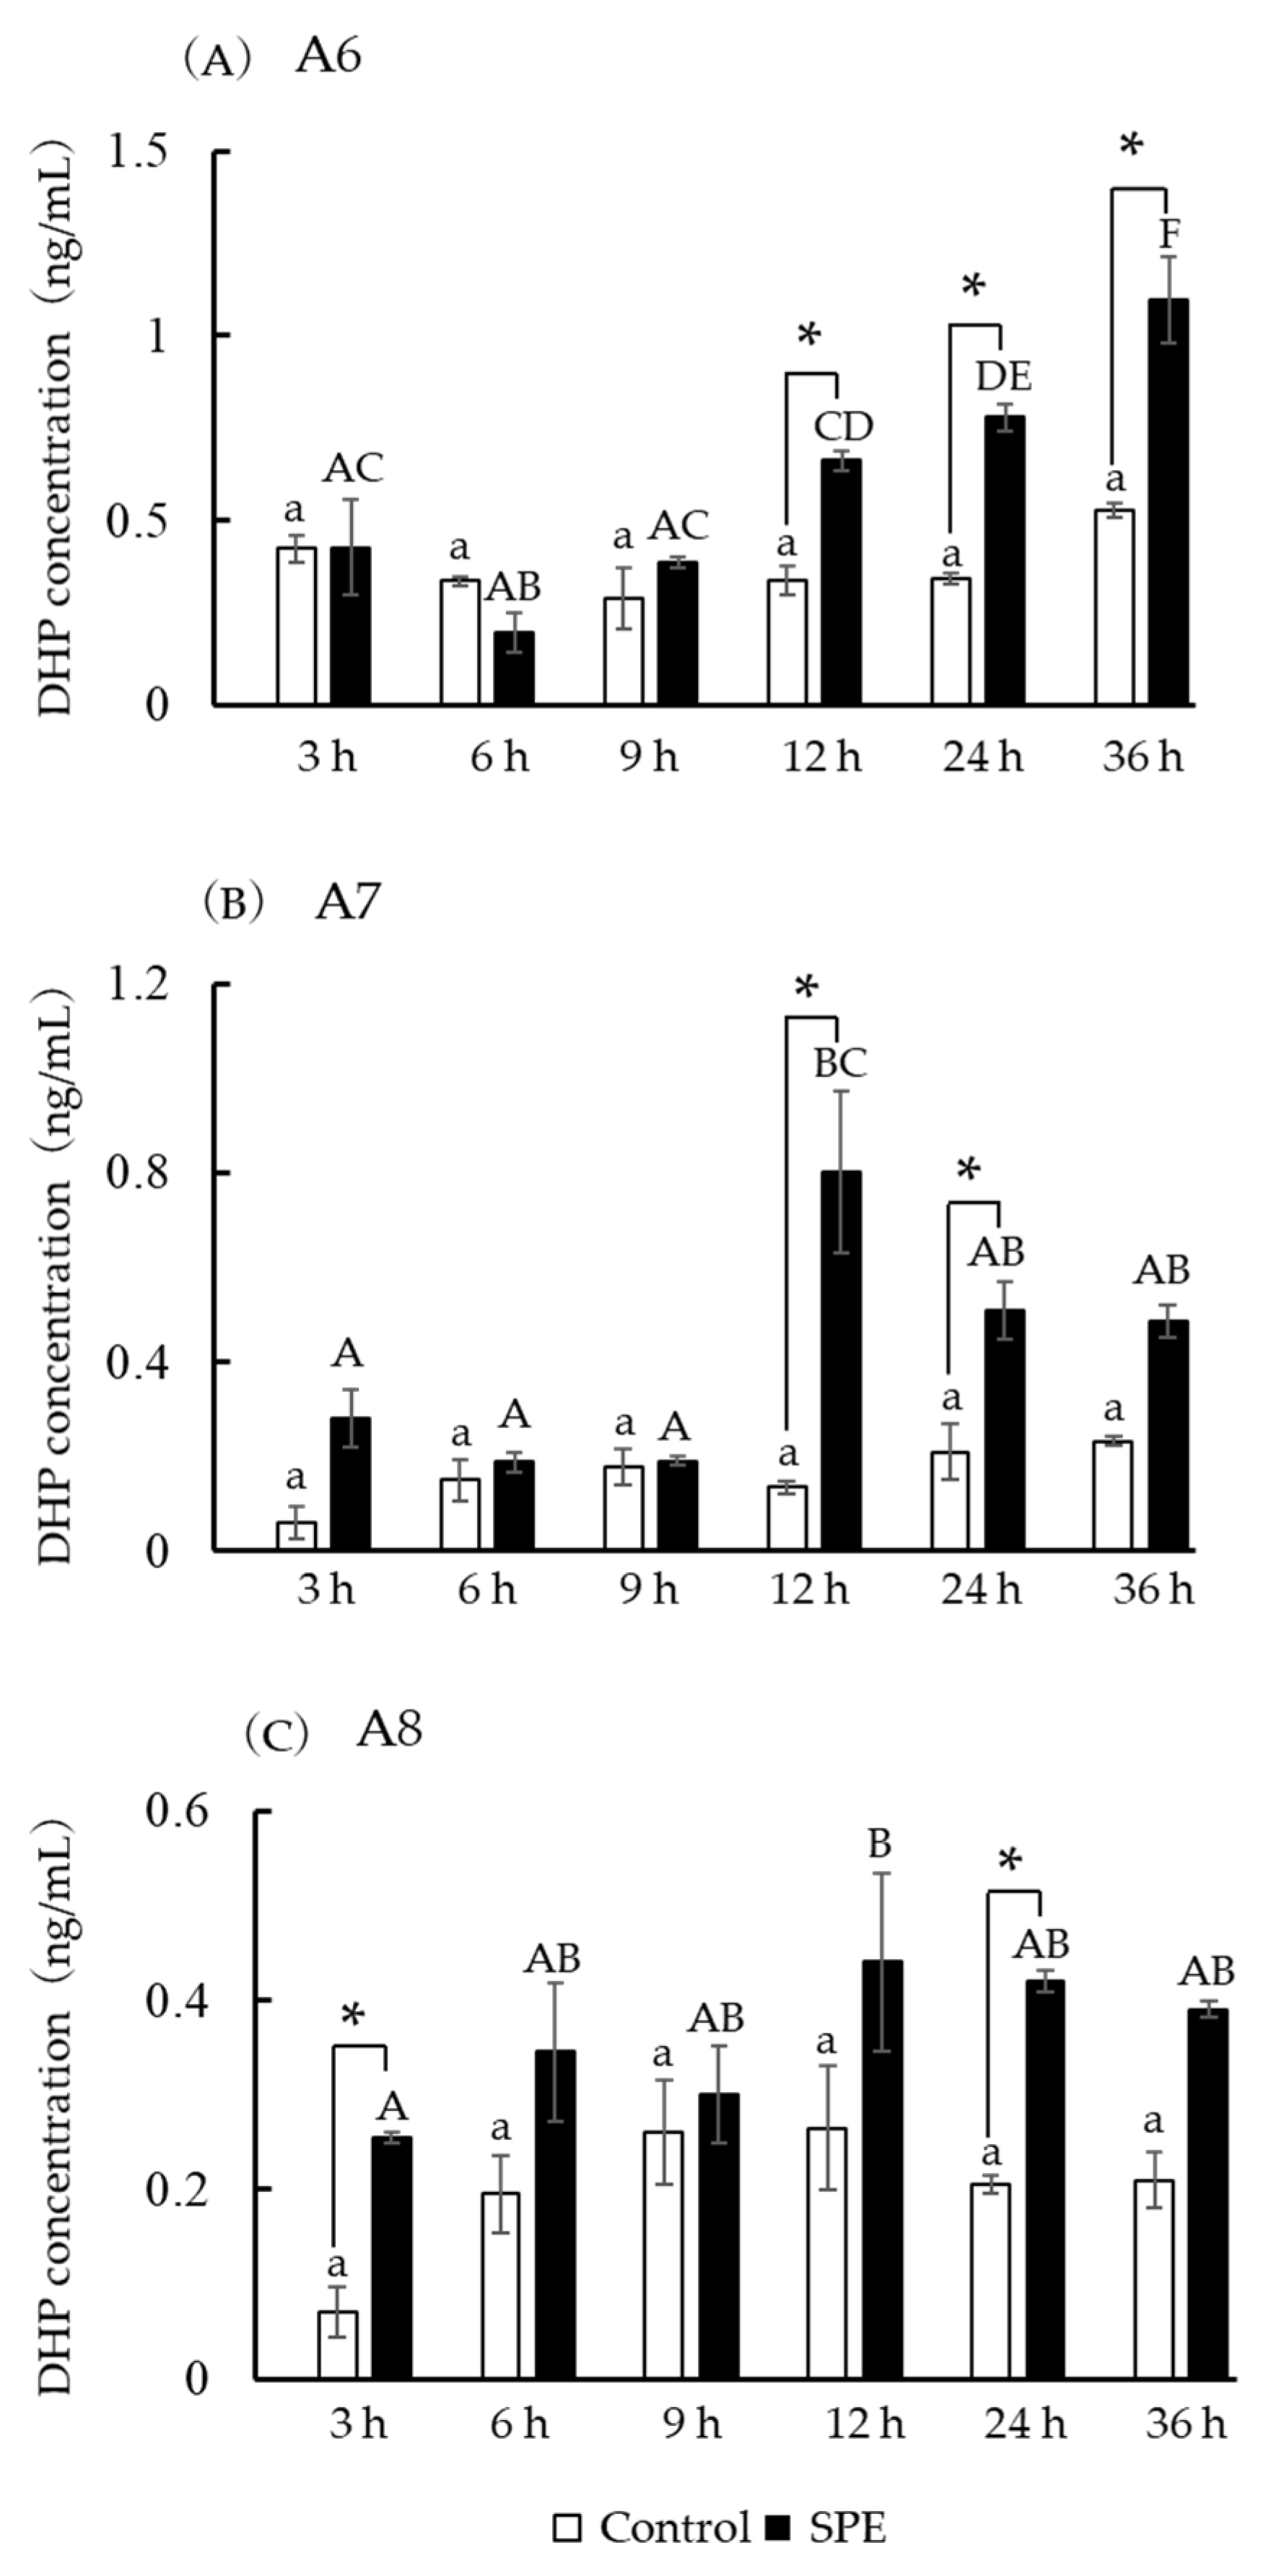
3.7. DHP Concentration in Incubation Media

For individuals A6, A7, and A8, the GVBD rates before incubation were 0%, 8.3%, and 8.3%, respectively (data not shown). Figure 8 shows the DHP concentration in the media of incubated ovarian follicles (individuals A6–A8) collected 8 h after LHRHa injection. For individual A6, the DHP concentrations at 12, 24, and 36 h of incubation with SPE was higher than that detected in the control group (Figure 8A). In individual A7, the DHP concentration in the SPE-treated group at 12 and 24 h of incubation was higher than that in the control group (Figure 8B). In individual A8, the DHP concentration in the SPE-treated group at 3 and 24 h of incubation was higher than that in the control group (Figure 8C).

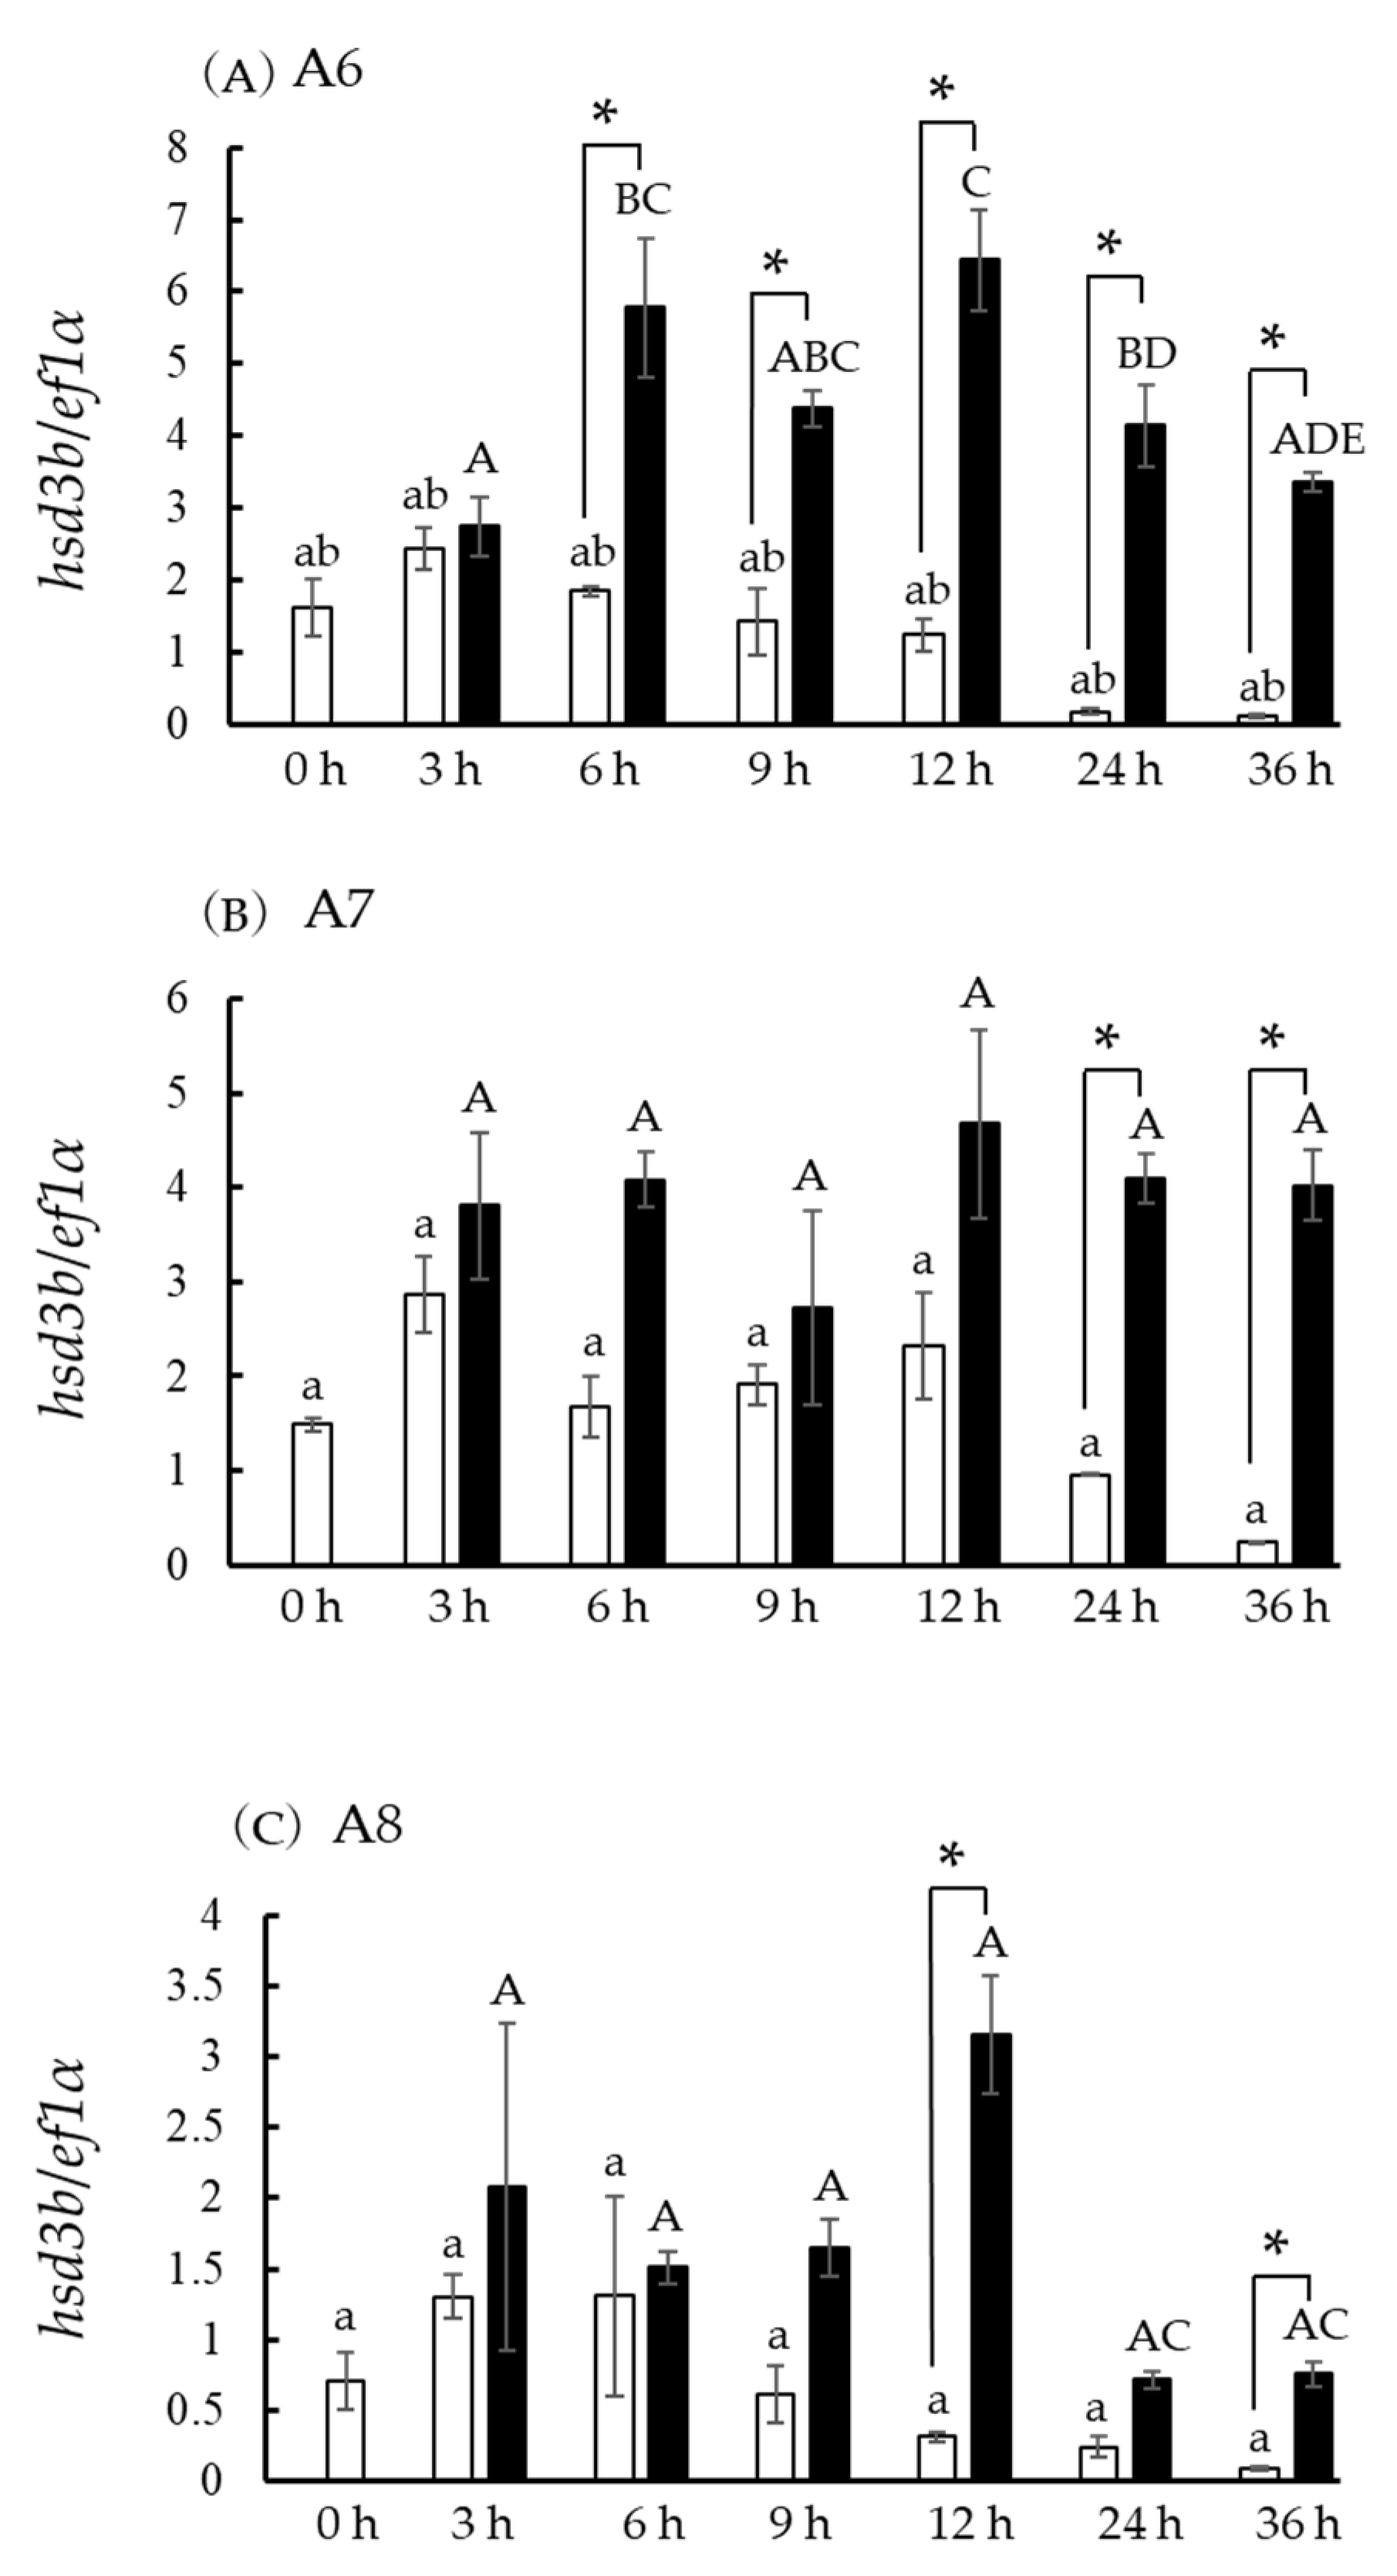
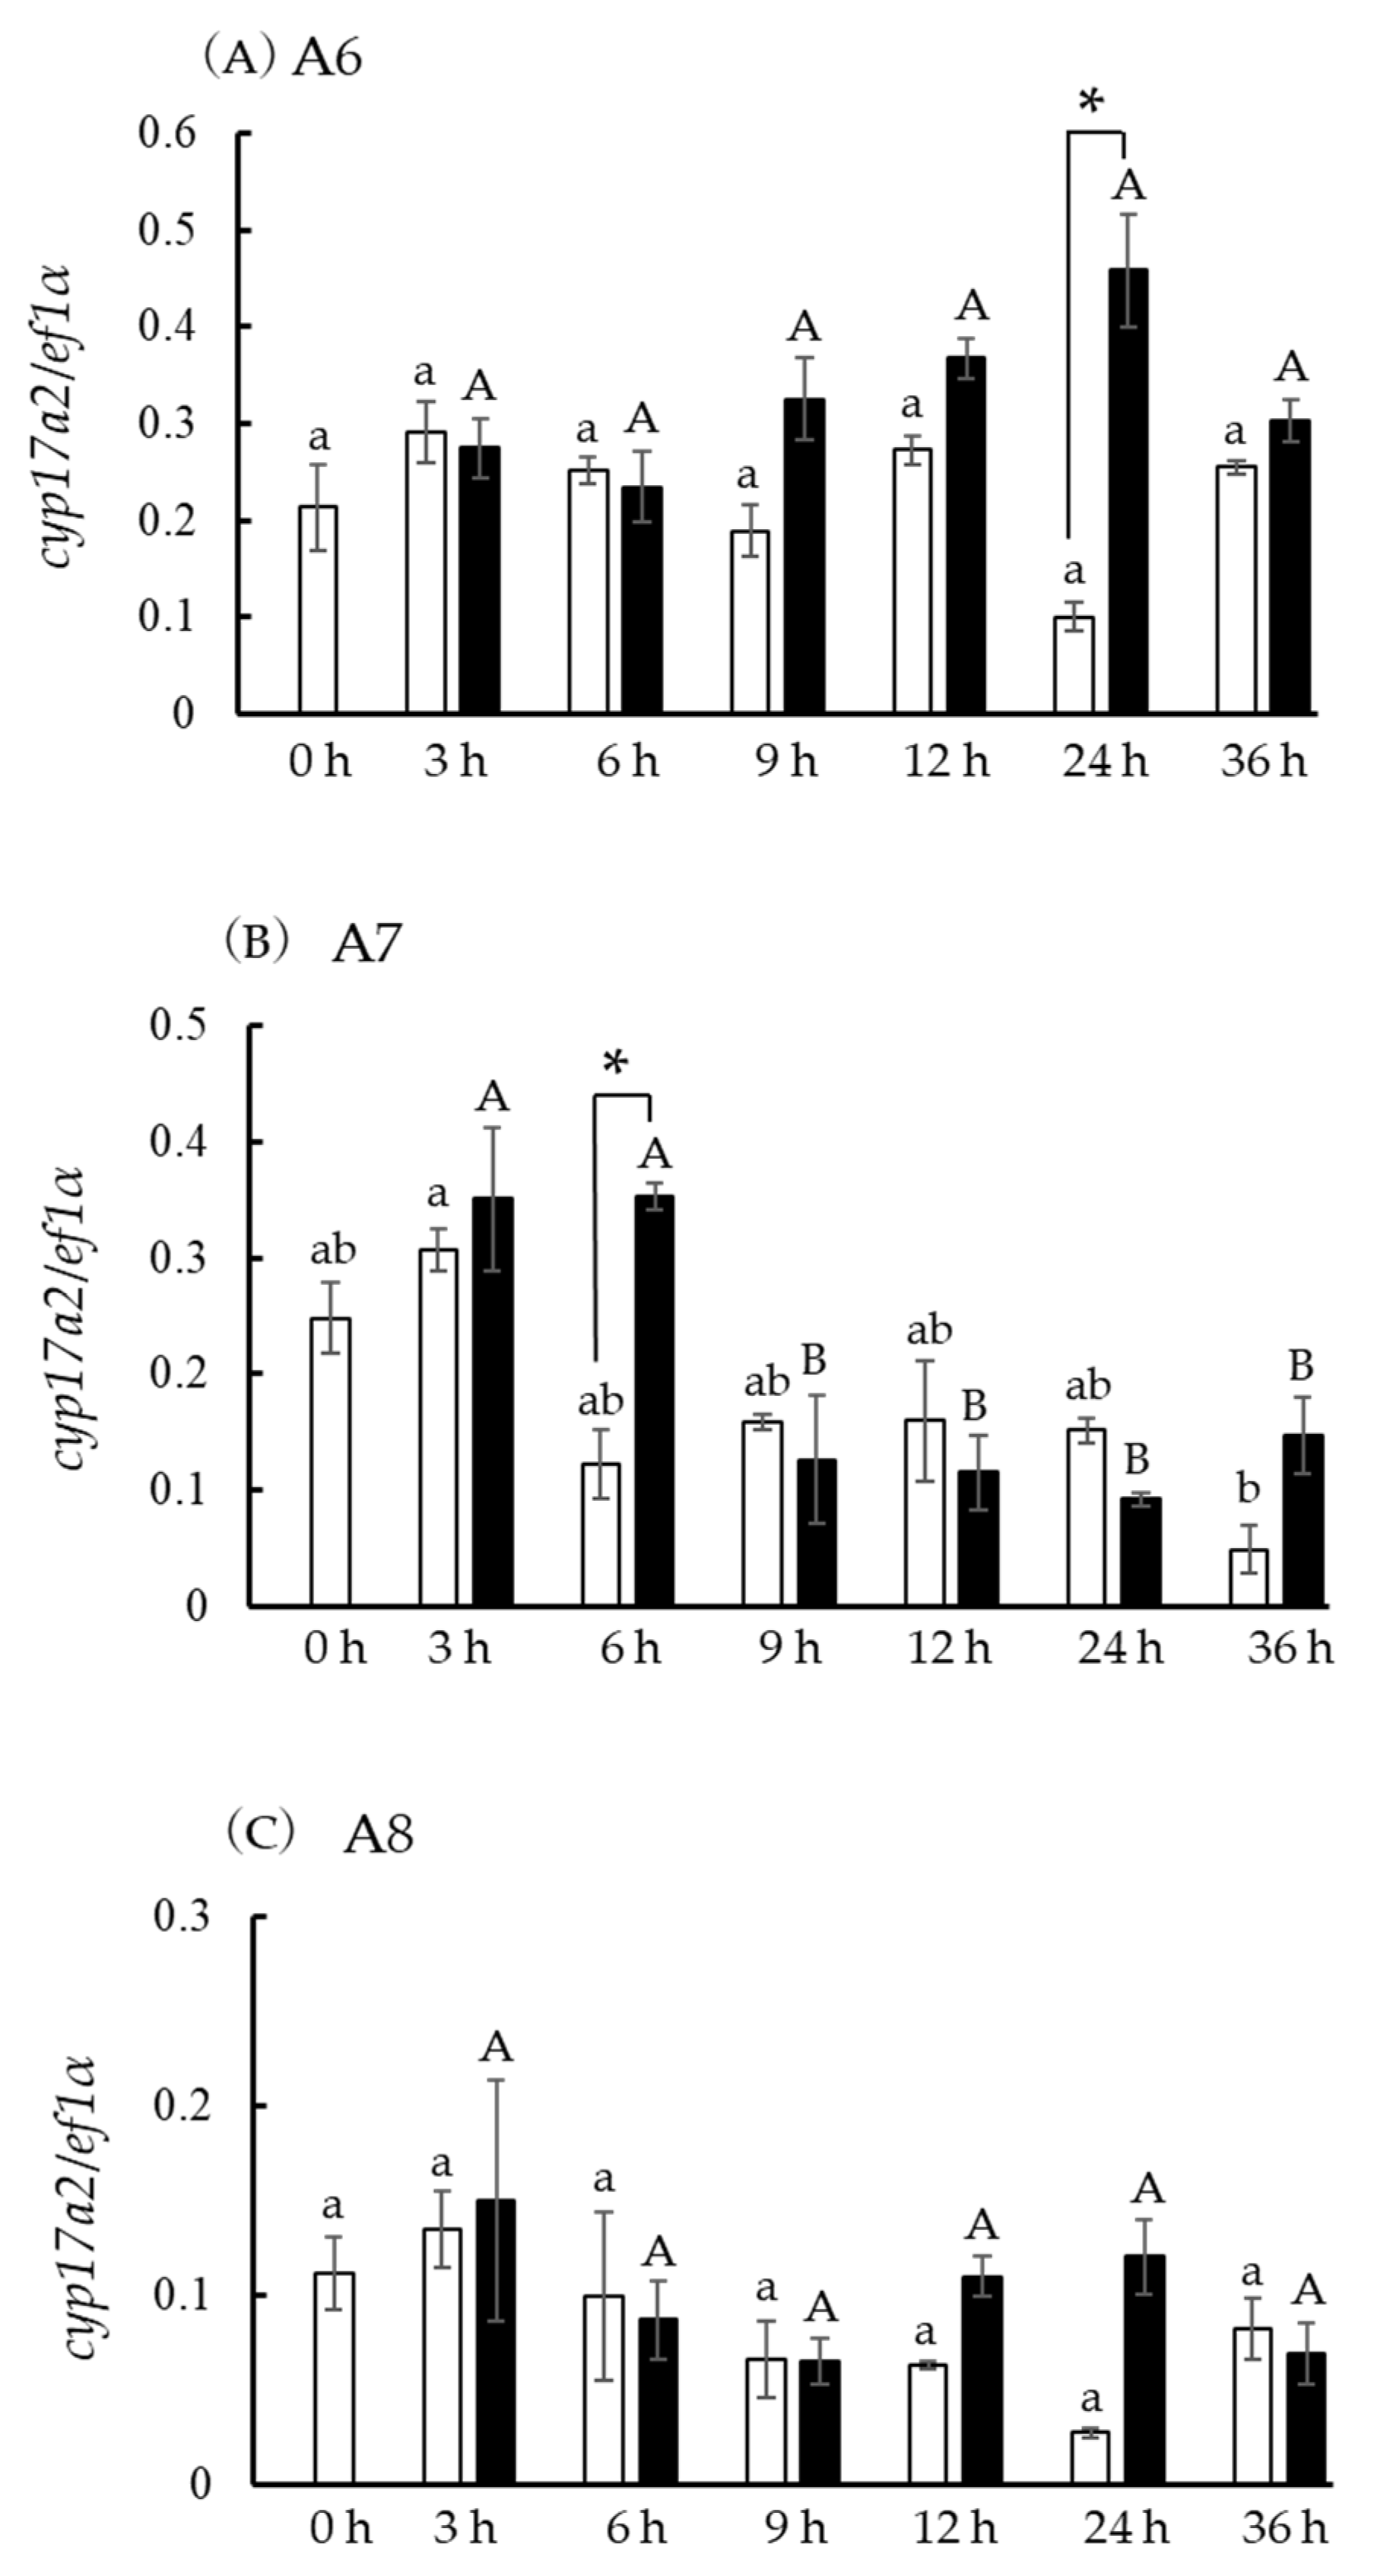
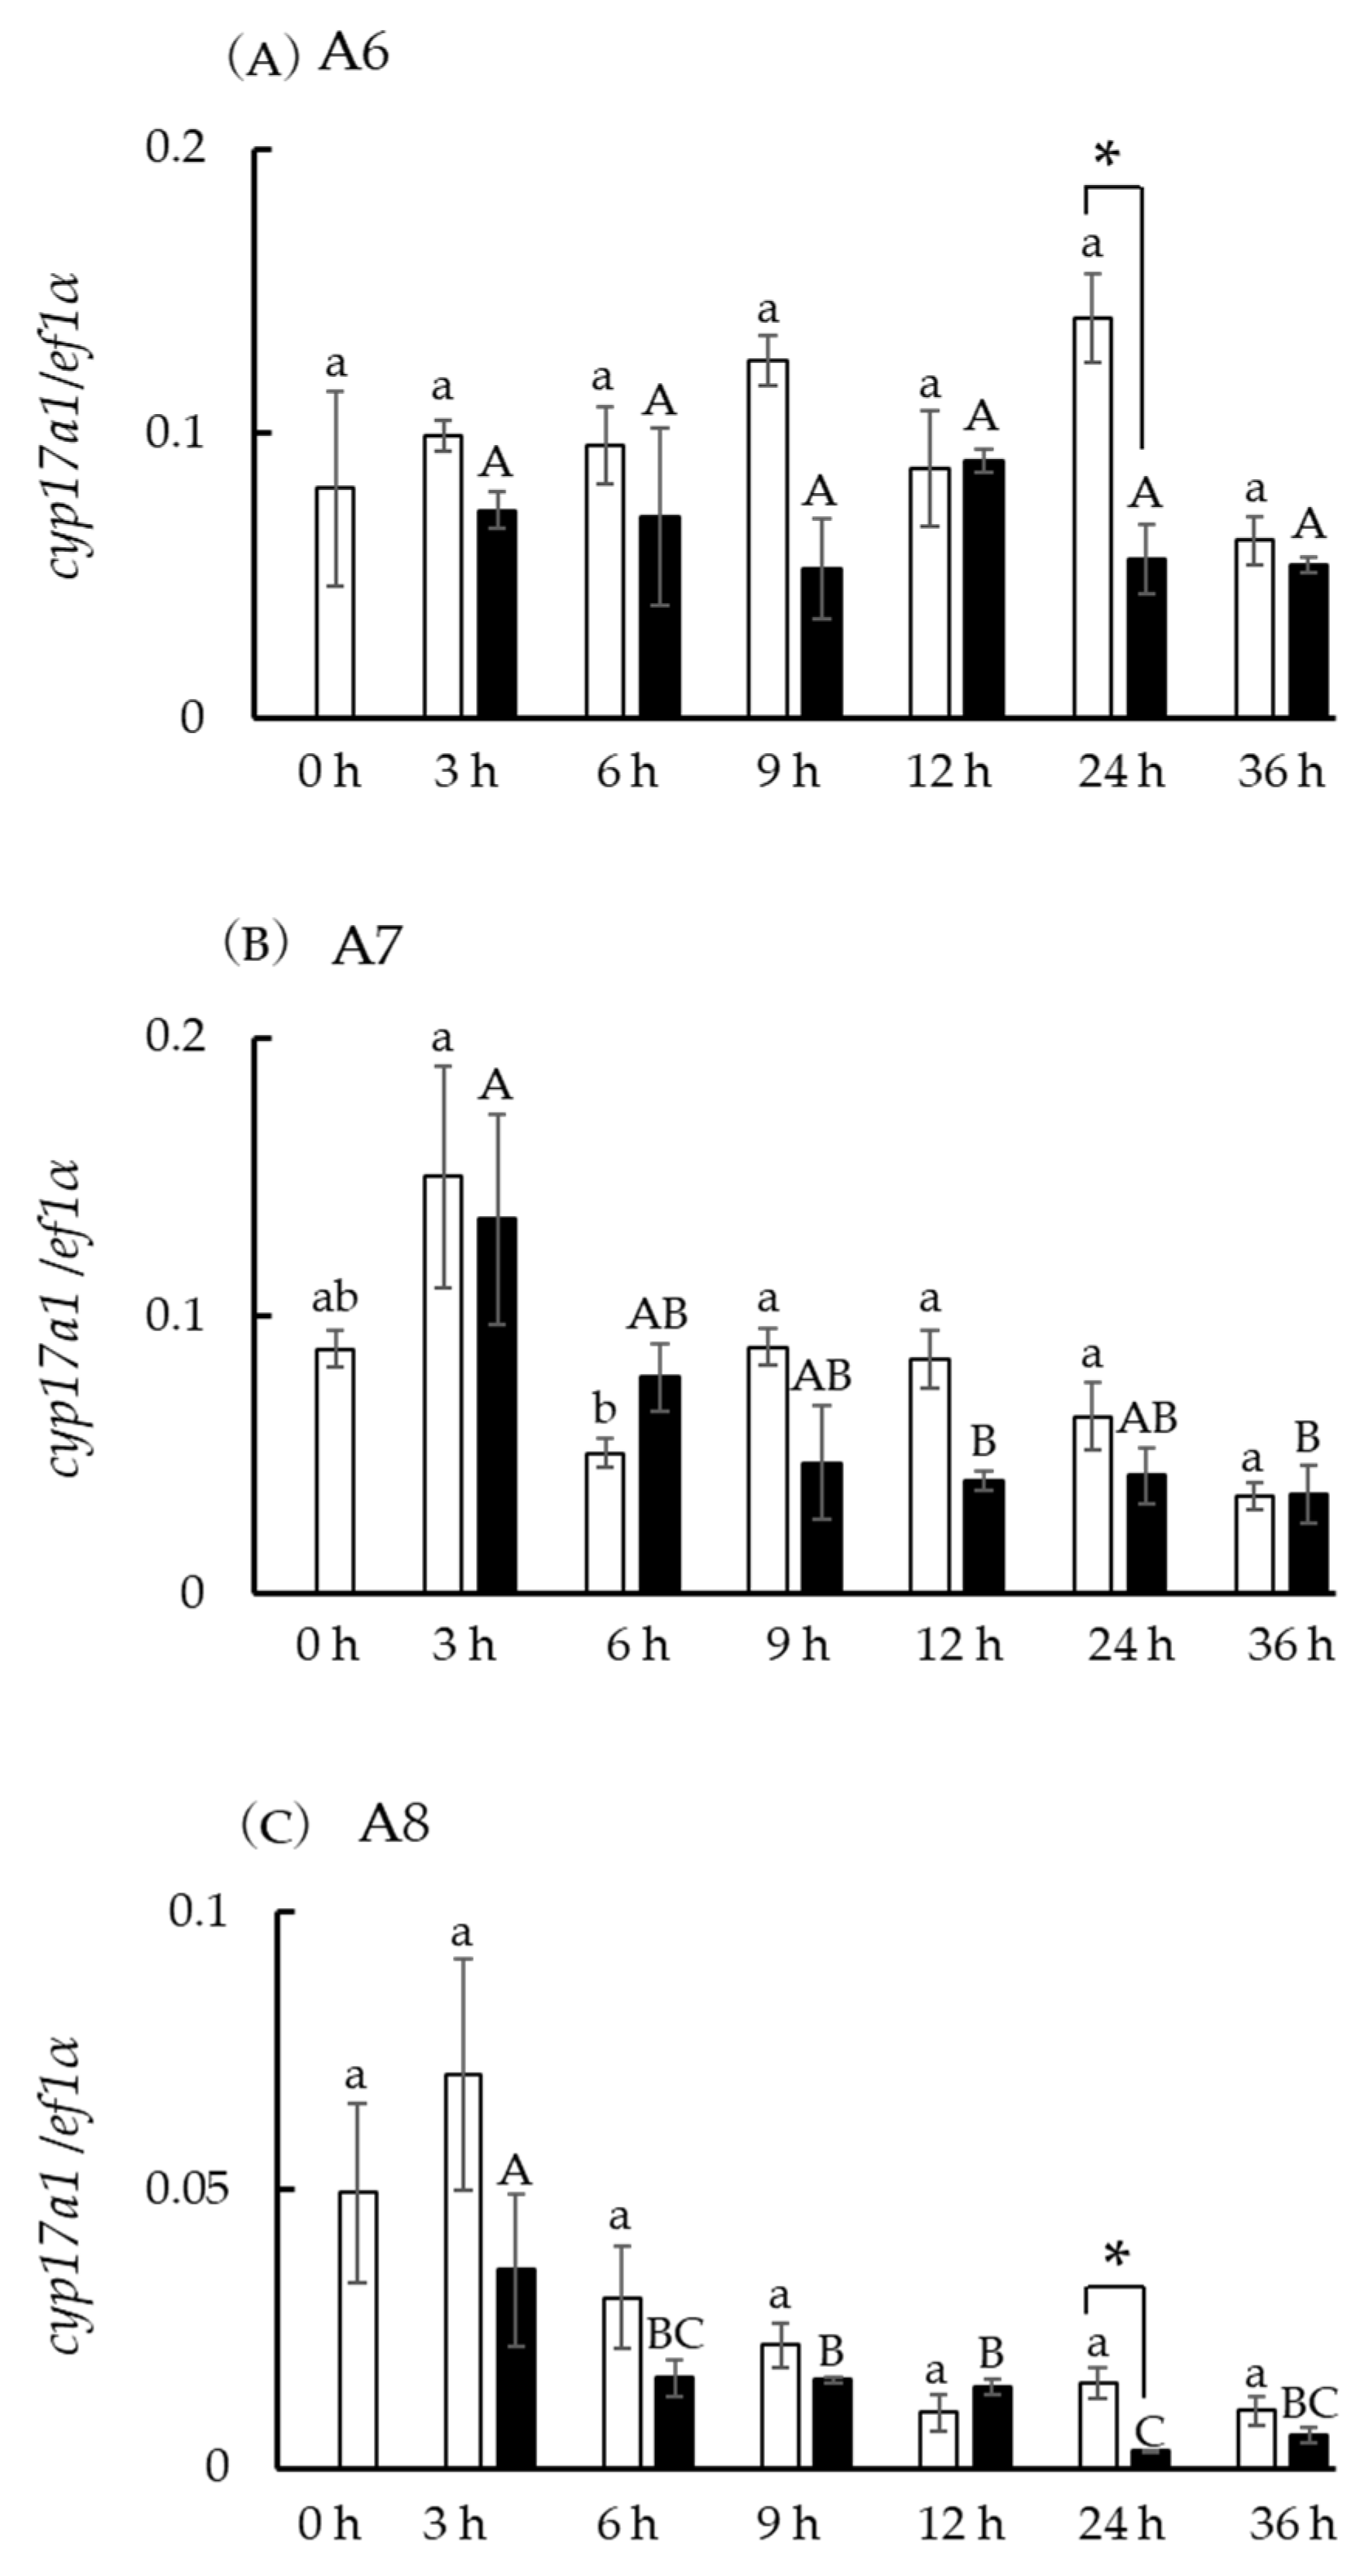
3.8. Hsd3b and cyp17a1/2 Expression in Incubated Ovarian Follicles

Figure 9 shows the hsd3b mRNA levels in the incubated ovarian follicles from individuals A6–A8. In individual A6, hsd3b mRNA levels in the SPE-treated group at 6, 9, 12, 24, and 36 h of incubation were higher than those in the control group (Figure 9A). In individual A7, hsd3b mRNA levels in the SPE-treated group at 24 and 36 h of incubation were higher than those in the control group (Figure 9B). In individual A8, hsd3b mRNA levels in the SPE-treated group at 12 and 36 h of incubation were higher than those in the control group (Figure 9C). Figure 10 shows the cyp17a1 mRNA levels in incubated ovarian follicles. In individuals A6 and A8, cyp17a1 mRNA levels in the SPE-treated group at 24 h of incubation were lower than those in the control group (Figure 10A,C). In individual A7, cyp17a1 mRNA levels did not decrease in the presence of SPE (Figure 10B). Figure 11 shows the cyp17a2 mRNA levels in incubated ovarian follicles. In individual A6, cyp17a2 mRNA levels in the SPE-treated group at 24 h of incubation were higher than those in the control group (Figure 11A). In individual A7, cyp17a2 mRNA levels in the SPE-treated group at 6 h of incubation were higher than those in the control group (Figure 11B). In individual A8, cyp17a2 mRNA levels did not increase in the presence of SPE (Figure 11C).

4. Discussion

In the present study, hsd3b, cyp17a1, and cyp17a2 cDNAs were isolated from Amur sturgeon ovarian follicles. Amur sturgeon cyp17a1 and cyp17a2 include the P450c17 signature Ono sequence [18,26,27], Ozols’ tridecapeptide region [17,18,28] and the cytochromeP450 cysteine heme–iron ligand signature region [18,29,30].
HEK293T cells transfected with Amur sturgeon hsd3b type-I exhibited 3β-HSD activity, converting P5 to P4, 17OHP5 to 17OHP, DHEA to A4, and A5 to T. The 3β-HSD activity was similar in P5, 17OHP5, DHEA, and A5. It is suggested that Amur sturgeon hsd3b type-I encodes 3β-HSD. HEK293T cells transfected with Amur sturgeon cyp17a1 type-I exhibited 17α-hydroxylase activity and C17-20 lyase activity, converting P5 to 17OHP5 and DHEA, and P4 to 17OHP and A4. However, Amur sturgeon cyp17a1 types I–VI exhibited a low conversion rate of P5 to 17OHP5 and DHEA, and P4 to 17OHP and A4. It is possible that other types of cyp17a1 exhibit stronger enzymatic activity against P5 and P4. We isolated cyp17a1 from the sterlet ovary, and the enzyme activity of sterlet cyp17a1 was also measured. Sterlet cyp17a1 exhibited low enzyme activity, converting P4 to 17OHP and A4 (data not shown). We then examined another type from the sterlet genome (ID: 22920) derived from GenBank, but other sequences containing variation with sterlet cyp17a1 that we isolated were not obtained. Therefore, it is possible that cyp17a1, another type that exhibited strong activity in converting P4 to 17OHP and A4, did not exist. In addition, genes showing high identity with cyp17a1 were examined from the sterlet genome, and the sequence showed high identity with cyp17a1, except for cyp17a2. Therefore, sturgeon cyp17a1 possesses low enzyme activity, converting P5 to 17OHP5 and DHEA, and P4 to 17OHP and A4. HEK293T cells transfected with Amur sturgeon cyp17a2 type-I exhibited 17α-hydroxylase activity, converting P5 to 17OHP5, and P4 to 17OHP. Amur sturgeon cyp17a2 did not exhibit C17-20 lyase activity and encoded 17α-hydroxylase alone. Amur sturgeon cyp17a1 and cyp17a2 exhibited a lower conversion rate of P5 than that of P4. Therefore, it is suggested that the potential pathway toward 17OHP and A4 production is via P4. Furthermore, medaka cyp17a2 catalyzes the conversion of P5 to 17OHP5, but does not catalyze the conversion of P4 to 17OHP. Nile tilapia cyp17a2 catalyzes the conversion of both P5 and P4 [18,19]. Amur sturgeon cyp17a2 exhibited stronger enzyme activity against P4 than against P5, suggesting that the substrate specificity of cyp17a2 differs among fish species.
Amur sturgeon hsd3b mRNA is expressed in the ovarian follicles and kidneys. Knocking down zebrafish hsd3b resulted in a reduction in cortisol production [18]. It is suggested that hsd3b is involved in the biosynthesis of sex steroids in gonads and cortisol in the inter-renal tissue of the kidney. In Amur sturgeon, cyp17a1 was expressed in the ovaries, ovarian follicles, and testis, and cyp17a2 was expressed in the kidneys and ovarian follicles. Meanwhile, cyp17a1 mRNA was faintly expressed, and cyp17a2 and hsd3b were not expressed in the testes. The present results, obtained using cDNA from immature testes (n = 2), suggested that cyp17a2 and hsd3b mRNA levels were low in immature testes. Further, this result corresponds with the results that cyp17a2 and hsd3b were strongly expressed in ovarian follicles at the maturation stage. Nile tilapia and zebrafish cyp17a1 were expressed in gonads, and Nile tilapia and Japanese eel cyp17a2 were expressed in the gonads and head kidney [18,21,26]. Zebrafish cyp17a1 and Japanese eel cyp17a2 were expressed in the brain, but cyp17a1/2 expression in the brain was weak, compared to that in the gonads [21,26]. Thus, tissue-specific Amur sturgeon cyp17a1/2 expression showed a pattern similar to that of Nile tilapia and Japanese eel.
It has been reported that the tissue distribution of hsd17b12L mRNA shows two patterns in Actinopterygii. The hsd17b12L mRNA expression was limited to the follicles and testes in the maturation stage in Nile tilapia and masu salmon, whereas Amur sturgeon hsd17b12L and zebrafish hsd20b2 were expressed in all tissues [22,31,32,33]. In Amur sturgeon, the major location for cyp17a1 expression is the ovary, and for cyp17a2 is the ovary and the kidney, similar to what has been reported for Nile tilapia and Japanese eel. It is suggested that the tissue distribution of cyp17a1 and cyp17a2 expression is common in all fish species.
Amur sturgeon hsd3b expression showed a rapid increase after low-dose LHRHa injection in both individuals who did not reach ovulation and individuals who did. The expression of hsd3b increased rapidly after LHRHa injection, suggesting that Amur sturgeon hsd3b mRNA expression was strongly induced by LH stimulation. We could not clarify the steroidogenic pathway for 17OHP production, and it remains unclear whether 17OHP was produced via P4 or 17OHP5. However, Amur sturgeon cyp17a1 and cyp17a2 exhibited stronger activity against P4 than against P5, and it is possible that P4 was rapidly induced by 3β-HSD, and 17OHP was produced via P4. In individuals who did not reach ovulation, Amur sturgeon cyp17a1 mRNA levels at 24 and 32 h after LHRHa injection did not show significant differences compared to those before the injection. In individuals who reached ovulation, Amur sturgeon cyp17a1 mRNA levels at 24 and 32 h after LHRHa injection were lower than those before the injection. Therefore, we suggest that Amur sturgeon cyp17a1 mRNA expression is downregulated during oocyte maturation and is related to 17OHP production because of the decline in C17-20 lyase activity. Amur sturgeon cyp17a2 mRNA levels at 8, 24, and 32 h after LHRHa injection were higher than those before injection in all individuals, and those in individuals who did not reach ovulation were higher than those in individuals who did. Amur sturgeon cyp17a2 mRNA levels increased immediately after LHRHa injection, suggesting that it is related to 17OHP production because of an increase in 17α-hydroxylase activity. Thus, Amur sturgeon cyp17a1 expression was suggested to be downregulated and cyp17a2 mRNA expression was upregulated during oocyte maturation. This expression pattern was similar to that exhibited by Nile tilapia and medaka cyp17a1/2 during oocyte maturation. Sturgeons are evolutionally positioned under medaka and Nile tilapia in the teleost lineage, suggesting that the expression pattern of cyp17a1 and cyp17a2 during oocyte maturation is evolutionally higher in fish species than in sturgeons. Furthermore, Amur sturgeon hsd3b and cyp17a2 mRNA levels at 24 h after LHRHa injection in individuals who reached ovulation were not higher than those in individuals who did not. Amur sturgeon cyp17a1 mRNA was downregulated at 24 h after LHRHa injection in individuals who reached ovulation alone. In addition, Amur sturgeon hsd17b12L mRNA levels at 24 h after LHRHa injection in individuals who reached ovulation were higher than those in individuals who did not reach ovulation [22]. Therefore, it is possible that the downregulation of cyp17a1 mRNA expression and rapid upregulation of hsd17b12L mRNA expression resulted in sufficient DHP induction for ovulation, which may be crucial for the induction of ovulation in sturgeons.
The hsd3b mRNA levels in the ovarian follicles collected before LHRHa injection were similar to those observed in the mid- and late-vitellogenic stages. It was suggested that the period during which Amur sturgeon hsd3b mRNA expression was induced limited the oocyte maturation phase. In salmonids, hsd3b mRNA levels in ovarian follicles increased progressively from the peri nucleolus to the mid/late-vitellogenic stages, and hsd3b mRNA levels did not increase from the late-vitellogenic stage to the late-vitellogenic/full-grown stage [14,15]. Thus, rapid upregulation of hsd3b expression during oocyte maturation in Amur sturgeon was first observed in teleosts. The cyp17a1 mRNA level in the ovarian follicles collected before LHRHa injection was higher than that in the ovarian follicles in the mid-/late-vitellogenic stages, suggesting that Amur sturgeon cyp17a1 was not induced by LH stimulation. Serum T concentrations just before LHRHa injection were higher than those at the mid/late-vitellogenic stages. The ovarian follicles collected just before LHRHa injection were classified as being in the migratory nucleus stage. Thus, cyp17a1 mRNA expression in ovarian follicles from the mid-vitellogenic to migratory nucleus stages was associated with T production. Therefore, it is possible that the Amur sturgeon cyp17a1 isolated in this study encodes 17α-hydroxylase and C17-20 lyase activity. Amur sturgeon cyp17a2 mRNA levels increased from the mid-vitellogenic to the migratory nucleus stages. Amur sturgeon cyp17a2 expression in ovarian follicles from mid-vitellogenic to migratory nucleus stages was similar to that of Nile tilapia, medaka, and Japanese eel cyp17a2, suggesting that cyp17a2 mRNA expression patterns before oocyte maturation were similar in all Actinopterygii.
In individuals A6–A8, the DHP concentration in the medium of the SPE-treated group after 24 h of incubation were higher than that of the control group. We did not examine GVBD rates at each time point of incubation, and the time-point at which the ovarian follicles reached GVBD remains unknown. However, DHP production was induced by SPE stimulation from 12 h to 36 h of incubation, suggesting that incubated ovarian follicles until 9 h of incubation were beginning to reach GVBD or pre-oocyte maturation, and almost all ovarian follicles did not reach GVBD. Further, it is suggested that ovarian follicles from 12 to 36 h of incubation are experiencing or have achieved oocyte maturation. The hsd3b mRNA levels in SPE-incubated ovarian follicles at 24 and 36 h of incubation were significantly higher than those in the control group. Thus, hsd3b mRNA expression during oocyte maturation in vitro was associated with in vivo results, suggesting that Amur sturgeon hsd3b mRNA expression during oocyte maturation is induced by LH stimulation. In individuals A6 and A8, cyp17a1 mRNA levels in SPE-incubated ovarian follicles at 24 h of incubation were lower than those in the control group. Amur sturgeon cyp17a1 mRNA expression was downregulated during oocyte maturation in vivo and in vitro, but no rapid decrease was observed in medaka. Therefore, it is possible that rapid upregulation of hsd3b mRNA expression induces sufficient 17OHP production instead of the rapid down-regulation of cyp17a1 mRNA expression. Amur sturgeon cyp17a2 mRNA levels in SPE-incubated ovarian follicles were higher than those in the control group follicles. However, in vitro cyp17a2 mRNA expression did not show a rapid increase after SPE stimulation. In vivo cyp17a2 mRNA expression was induced during oocyte maturation, but it could not be exhibited that in vitro cyp17a2 mRNA expression was rapidly induced via LH stimulation. Therefore, it is possible that Amur sturgeon cyp17a2 mRNA expression was not strongly induced by LH stimulation.

5. Conclusions

The present study demonstrated that in Amur sturgeon, hsd3b exhibits 3β-HSD activity, cyp17a1 exhibits 17α-hydroxylase and C17-20 lyase activity, and cyp17a2 exhibits 17α-hydroxylase activity. Therefore, it was suggested that hsd3b, cyp17a1, and cyp17a2 regulate 17OHP production in Amur sturgeons. In vivo and in vitro experiments in sturgeons indicated that hsd3b expression was upregulated and cyp17a1 expression was downregulated by LH stimulation. In vitro, cyp17a2 mRNA expression did not exhibit rapid increase following SPE stimulation, suggesting that in Amur sturgeons, cyp17a2 expression was not as strongly induced by LH stimulation as was hsd3b expression. The rapid upregulation of hsd3b expression during oocyte maturation in Amur sturgeons reported is the first such report in teleosts. Furthermore, these findings suggested that hsd17b12L expression was upregulated after induction of 17OHP production, which was regulated by hsd3b, cyp17a1, and cyp17a2, resulting in DHP production. These data provide insights for future studies on the control of DHP production, which may induce oocyte maturation, in teleosts.

Supplementary Materials

The following supporting information can be downloaded at: https://www.mdpi.com/article/10.3390/jmse10010086/s1. Supplemental Figure S1. Nucleotide and amino acid sequences of Amur sturgeon hsd3b type I–Ⅲ. Nucleotide variations between these types and corresponding amino acid alterations are indicated. Supplemental Figure S2. Nucleotide and amino acid sequences of Amur sturgeon cyp17a1 type I–VI. Nucleotide variations between these types and corresponding amino acid alterations are indicated. Supplemental Figure S3. Nucleotide and amino acid sequences of Amur sturgeon cyp17a2 type I–II. Nucleotide variations between these types and corresponding amino acid alterations are indicated. (-) indicates the missing nucleotides. Supplemental Table S1. Substrate specificity of Amur sturgeon hsd3b type-II/Ⅲ and cyp17a2 type-II Supplemental Table S2. Substrate specificity of Amur sturgeon cyp17a1 type II–VI.

Author Contributions

Conceptualization, S.I.; methodology, S.I. and S.A.; validation, Y.H.; formal analysis, Y.H.; investigation, Y.H. and R.S.; resources, Y.H. and R.S.; data curation, Y.H.; writing—original draft preparation, Y.H.; writing—review and editing, S.I.; visualization, Y.H.; supervision, S.I.; project administration, S.I.; funding acquisition, Y.H. and S.I. All authors have read and agreed to the published version of the manuscript.

Funding

This research was funded by the Japan Society for the Promotion of Science (JSPS) KAKENHI, grant number 20J11357 and 18H02275. The APC was funded by 18H02275.

Institutional Review Board Statement

Not applicable.

Informed Consent Statement

Not applicable.

Data Availability Statement

Not applicable.

Acknowledgments

This study was conducted with the collaborative efforts of the members in our sturgeon research group. We also thank Tetsuya Konno at the Sturgeon Museum and Seigo Takahashi at Shimizu River Trout Farms for supporting the sampling processes.

Conflicts of Interest

The authors declare no conflict of interest.

References

  1. Pikitch, E.K.; Doukakis, P.; Laucl, L.; Chakrabatory, P.; Erickson, D.L. Status, trends and management of sturgeon and paddlefish fisheries. Fish Fish. 2005, 6, 233–265. [Google Scholar] [CrossRef]
  2. Doukakis, P.; Pikitch, E.K.; Rothschil, A.; Desalle, R.; Amato, G.; Kolokotronis, S.O. Testing the effectivenedd of an international conservation agreement: Marketplace foren-sics and Cites caviar trade regulation. PLoS ONE 2012, 7, e40907. [Google Scholar] [CrossRef] [PubMed] [Green Version]
  3. Ye, Y.; Valbo-Jørgensen, J. Effects of IUU fishing and stock enhancement on and restoration strategies for the stellate stur-geon fishery in the Caspian Sea. Fish. Res. 2012, 131, 21–29. [Google Scholar] [CrossRef]
  4. Fujii, K.; Hirose, K.; Hara, A.; Shiraishi, M.; Maruyama, T. Use of vitellogenine level as a maturational indicator for artificial spawning of cultured hybrid sturgeon, Huso huso × Acipenser ruthenus. In Acipenser; CEMAGREF Publication: Bordeaux, France, 1991; pp. 381–388. [Google Scholar]
  5. Omoto, N.; Maebayashi, M.; Adachi, S.; Arai, K.; Yamauchi, K. The influence of oocyte maturational stage on hatching and triploidy rates in hybrid (bester) sturgeon, Huso huso × Acipenser ruthenus. Aquaculture 2005, 245, 287–294. [Google Scholar] [CrossRef]
  6. Wallace, R.A. Vitellogenesis and oocyte growth in non-mammalian vertebrates. In Developmental Biology; Browder, L.W., Ed.; Plenum Publishing Corporation: New York, NY, USA, 1985; Chapter 3; Volume 1, pp. 127–177. [Google Scholar]
  7. Endo, T.; Todo, T.; Lokman, P.M.; Kudo, H.; Ijiri, S.; Adachi, S.; Yamauchi, K. Androgens and very low density lipoprotein are essential for the growth of previtellogenic oocytes from Japanese eel, Anguilla japonica, in vitro. Biol. Reprod. 2011, 84, 816–825. [Google Scholar] [CrossRef]
  8. Nagahama, Y. Gonadotropin action on gametogenesis and steroidogenesis in teleost gonad. Zool. Sci. 1987, 4, 209–222. [Google Scholar]
  9. Nagahama, Y.; Adachi, S. Identification of maturation-inducing steroid in a teleost, the amago salmon (Oncorhynchus rhodurus). Dev. Biol. 1985, 109, 428–435. [Google Scholar] [CrossRef]
  10. Nagahama, Y. Cytodifferentiation of ovarian follicle cells during oocyte growth and maturation. Cell. Differ. Dev. 1988, 25, 9–14. [Google Scholar] [CrossRef]
  11. Adachi, S.; Ijiri, S.; Kazeto, Y.; Yamauchi, Y. Oogenesis in the Japanese eel, Anguilla japonica. In Eel Biology; Aida, K., Tsukamoto, K., Yamauchi, K., Eds.; Springer: Tokyo, Japan, 2003; pp. 301–317. [Google Scholar]
  12. Simard, J.; Ricketts, M.L.; Gingras, S.; Soucy, P.; Feltus, F.A.; Melner, M.H. Molecular biology of the 3beta-hydroxysteroid dehydrogenase/delta5-delta4 isomerase gene family. Endocr. Rev. 2005, 26, 525–582. [Google Scholar] [CrossRef] [PubMed] [Green Version]
  13. Lin, J.C.; Hu, S.; Ho, P.H.; Hsu, H.J.; Ostlethwait, J.H.; Chung, B. Two zebrafish hsd3b genes are distinct in function, expression, and evolution. Endocrinology 2015, 156, 2854–2862. [Google Scholar] [CrossRef] [Green Version]
  14. Nakamura, I.; Evans, J.C.; Kusakabe, M.; Nagahama, Y.; Young, G. Changes in steroidogenic enzyme and steroidogenic acute regulatory protein messenger RNAs in ovarian follicles during ovarian development of rainbow trout (Oncorhynchus mykiss). Gen. Comp. Endocrinol. 2005, 144, 224–231. [Google Scholar] [CrossRef] [PubMed]
  15. Guzmán, J.M.; Luckenbach, J.A.; Yamamoto, Y.; Swanson, P. Expression profiles of Fsh-regulated ovarian genes during oogenesis in coho salmon. PLoS ONE 2014, 9, e114176. [Google Scholar] [CrossRef] [Green Version]
  16. Nakajin, S.; Shinoda, M.; Haniu, M.; Shively, J.E.; Hall, P.F. C21 steroid side chain cleavage enzyme from porcineadrenal microsomes. J. Biol. Chem. 1984, 259, 3971–3976. [Google Scholar] [CrossRef]
  17. Zuber, M.X.; Simpson, E.R.; Waterman, M.R. Expression of bovine 17a-hydroxylase cytochrome P450 cDNA in non-steroidogenic (COS-1) cells. Science 1986, 234, 1258–1261. [Google Scholar] [CrossRef]
  18. Zhou, L.-Y.; Wang, D.-S.; Kobayashi, T.; Yano, A.; Paul-Prasanth, B.; Suzuki, A.; Sakai, F.; Nagahama, Y. A novel type of P450c17 lacking the lyase activity is responsible for C21-steroid biosynthesis in the fish ovary and head kidney. Endocrinology 2007, 148, 4282–4291. [Google Scholar] [CrossRef] [PubMed] [Green Version]
  19. Zhou, L.-Y.; Wang, D.-S.; Shibata, Y.; Paul-Prasanth, B.; Suzuki, A.; Nagahama, Y. Characterization, expression and transcriptional regulation of P450c17-Iand-II in the medaka, Oryzias latipes. Biochem. Biophys. Res. Commun. 2007, 362, 619–625. [Google Scholar] [CrossRef] [PubMed]
  20. Kazeto, Y.; Ijiri, S.; Todo, T.; Adachi, S.; Yamauchi, K. Molecular cloning and characterization of Japanese eel ovarian P450c17 (CYP17) cDNA. Gen. Comp. Endocrinol. 2000, 18, 123–133. [Google Scholar] [CrossRef]
  21. Su, T.; Ijiri, S.; Kanbara, H.; Hagihara, S.; Wang, D.S.; Adachi, S. Characterization and expression of cDNAs encoding P450c17-II (cyp17a2) in Japanese eel during induced ovarian development. Gen. Comp. Endocrinol. 2015, 221, 134–143. [Google Scholar] [CrossRef]
  22. Hasegawa, Y.; Ijiri, S.; Surugaya, R.; Sakai, R.; Adachi, S. 17β-Hydroxysteroid dehydrogenase type 12 is associated with maturation-inducing steroid synthesis during induced oocyte maturation and ovulation in sturgeons. Aquaculture 2022, 546, 15. [Google Scholar] [CrossRef]
  23. Amiri, B.; Maebayashi, M.; Hara, A.; Adachi, S.; Yamauchi, K. Ovarian development and serum sex steroid and vitellogenin profiles in the female cultured sturgeon hybrid, the bester. J. Fish Biol. 1996, 48, 1164–1178. [Google Scholar] [CrossRef]
  24. Kagawa, H.; Takano, K.; Nagahama, Y. Correlation of plasma estradiol-17β and progesterone levels with ultrastructure and histochemistry of ovarian follicles in the white-spotted char, Salvelinus leucomaenis. Cell. Tissue Res. 1981, 218, 315–329. [Google Scholar] [CrossRef] [PubMed]
  25. Yamada, H.; Satoh, R.; Ogoh, M.; Takaji, K.; Fujimoto, Y.; Hakuba, T.; Chiba, H.; Kambegawa, A.; Iwata, M. Circadian changes in serum concentrations of steroids in Japanese char Salvelinus leucomaenis at the stage of final maturation. Zool. Sci. 2002, 19, 891–898. [Google Scholar] [CrossRef] [PubMed]
  26. Ono, H.; Iwasaki, M.; Sakamoto, N.; Mizuno, S. cDNA cloning and sequence analysis of a chicken gene expressed during the gonadal development and homologous to mammalian cytochrome P-450c17. Gene 1988, 66, 77–85. [Google Scholar] [PubMed]
  27. Wang, Y.; GE, W. Cloning of zebrafish ovarian P450c17 (CYP17, 17α-hydroxylase/17, 20-lyase) and characterization of its expression in gonadal and extra-gonadal tissues. Gen. Comp. Endocrinol. 2004, 135, 241–249. [Google Scholar] [CrossRef]
  28. Ozols, J.; Heinemann, F.S.; Johnson, E.F. Amino acid sequence of an analogous peptide from two forms of cytochrome P-450. J. Biol. Chem. 1981, 256, 11405–11408. [Google Scholar] [CrossRef]
  29. Gotoh, O.; Tagashira, Y.; Iizuka, T.; Fujii-Kuriyama, Y. Structural characteristics of cytochrome P-450. Possible location of the heme-binding cysteine in determined amino-acid sequences. J. Biochem. 1983, 93, 807–817. [Google Scholar] [CrossRef]
  30. Miller, W.L. Minireview: Regulation of steroidogenesis by electron transfer. Endocrinology 2005, 146, 2544–2550. [Google Scholar] [CrossRef] [Green Version]
  31. Ijiri, S.; Shibata, Y.; Takezawa, N.; Kazeto, Y.; Takatsuka, N.; Kato, E.; Hagihara, S.; Ozaki, Y.; Adachi, S.; Yamauchi, K.; et al. 17β-HSD type 12-Like is responsible for maturation-inducing hormone synthesis during oocyte maturation in masu salmon. Endocrinology 2017, 158, 627–639. [Google Scholar] [PubMed] [Green Version]
  32. Aranyakanont, C.; Ijiri, S.; Hasegawa, Y.; Adachi, S. 17β-Hydroxysteroid dehydrogenase type 12 is responsible for maturation-inducing steroid synthesis during oocyte maturation in Nile tilapia. Gen. Com. Endocrinol. 2020, 290, 113399. [Google Scholar] [CrossRef]
  33. Tokarz, J.; Mindnich, R.; Norton, W.; Moeller, G.; de Angelis, M.H.; Adamski, J. Discovery of a novel enzyme mediating glucocorticoid catabolism in fish: 20β-Hydroxysteroid dehydrogenase type 2. Mol. Cell. Endocrinol. 2012, 349, 202–213. [Google Scholar] [CrossRef] [PubMed]
Figure 1. Steroidogenic pathway for T production. Pregnenolone, P5; progesterone, P4; 17α-hydroxypregnenolone, 17OHP5; progesterone, P4; 17α-Hydroxyprogesterone, 17OHP; dehydroepiandrosterone, DHEA; androstenedione, A4; 5α-androstenediol, A5; testosterone, T.
Jmse 10 00086 g001
Figure 2. Phylogenetic tree of hsds3b, cyp17a1, cyp17a2, and cyp11c1 in teleosts. Phylogenic relationships among Amur Sturgeon hsd3b, zebrafish hsd3b, Atlantic salmon hsd3b, Amur sturgeon cyp17a1, rainbow trout cyp17a1, Japanese eel cyp17a1, medaka cyp17a1, Amur sturgeon cyp17a2, Japanese eel cyp17a2, medaka cyp17a2, Nile tilapia cyp17a2 and medaka cyp11c1 were determined. Numbers are the percentage of 1000 replicates in which the associated taxa clustered together in the bootstrapping test, indicating reliability. The scale bar is indicated at the bottom.
Jmse 10 00086 g002
Figure 3. Tissue-specific Amur sturgeon cyp17a1, cyp17a2, and hsd3b mRNA expression. The expression in 16 tissues of Amur sturgeon is presented. Ef1α was used as the positive control. NTC, control; B, brain; K, kidney; L, liver; S, spleen; H, heart; I, intestines; P, pyloric appendage; ST, stomach; F, fin; M, muscle; BL, bladder; G, gill; O, ovary; OF, ovarian follicle after removal of yolk; T, testis.
Jmse 10 00086 g003
Figure 4. Serum DHP levels and hsd3b mRNA levels of ovarian follicles. Levels in individuals (A1–A16) just before (white column), and 8 h (light gray column), 24 h (dark gray column), and 32 h (black column) after injection. Some individuals (A1–A5) did not reach ovulation, while other individuals (A6–A16) did. Panels (A,C) show the average serum DHP concentrations and hsd3b mRNA levels between individuals A5–A16. Panel (B) shows the hsd3b mRNA levels between individuals A1–A5. Different letters represent a significant difference among groups (p < 0.05).
Jmse 10 00086 g004
Figure 5. cyp17a1/2 mRNA levels of ovarian follicles. Levels in individuals (A1–A16) just before (white column), and 8 h (light gray column), 24 h (dark gray column), and 32 h (black column) after injection. Some individuals (A1–A5) did not reach ovulation, while other individuals (A6–A16) did. Panels (A,C) show cyp17a1 and cyp17a2 mRNA levels between individuals A1–A5. Panels (B,D) show cyp17a1 and cyp17a2 mRNA levels between individuals A6–A16. Different letters represent a significant difference among groups (p < 0.05).
Jmse 10 00086 g005
Figure 6. Serum E2, T, 11KT, and DHP levels in individuals at different ovarian developmental stages. Serum steroid levels in individuals whose oocytes were in the perinucleolus stage (n = 3), oil droplet stage (n = 4), early-vitellogenic stage (n = 4), mid-vitellogenic (n = 4), and late-vitellogenic stage (n = 6), and in the ovarian follicles collected just before injection (n = 11), 8 h after the first injection (n = 5), and 24 h after the first injection (n = 11). Individuals injected with LHRHa were only those that reached ovulation. (AD) indicate the serum E2, T, 11KT and DHP level, respectively. PN, perinucleolus stage; OL, oil droplet stage; EV, early-vitellogenic stage; MV, mid-vitellogenic stage; LV, late-vitellogenic stage. Different letters represent a significant difference among groups (p < 0.05).
Jmse 10 00086 g006
Figure 7. hsd3b, cyp17a1 and cyp17a2 expression in ovarian follicles. Expression levels in the perinucleolus stage (n = 3), oil droplet stage (n = 4), early-vitellogenic stage (n = 4), mid-vitellogenic stage (n = 4), and late-vitellogenic stage (n = 6), and in the ovarian follicles collected just before injection (n = 11), 8 h after first injection (n = 5), and 24 h after first injection (n = 11). Only those individuals were assessed that reached ovulation after LHRHa injection. (AC) indicate the hsd3b, cyp17a1 and cyp17a2 mRNA levels, respectively. PN, perinucleolus stage; OL, oil droplet stage; EV, early-vitellogenic stage; MV, mid-vitellogenic stage; LV, late-vitellogenic stage. Different letters represent a significant difference among groups (p < 0.05).
Jmse 10 00086 g007
Figure 8. DHP concentration in the medium after different incubation periods. Concentrations of DHP in the medium after incubation: ovarian follicles collected 8 h after the first LHRHa injection were incubated with 500 μg/mL SPE (black column). (AC) indicate the level in individuals A6, A7, and A8, respectively. Each vertical bar represents the mean ± SE of 3 replicate incubations. Different letters (control: a, SPE: A) represent a significant difference among groups (p < 0.05). * p < 0.05.
Jmse 10 00086 g008
Figure 9. hsd3b expression in incubated ovarian follicles from A6, A7, and A8. Levels of mRNA from follicles incubated in media alone (white column) and in 500 μg/mL SPE (black column). Panels (AC) indicate individuals A6, A7, and A8, respectively. Ovarian follicles from A6, A7, and A8 were used at 8 h after injection of LHRHa. Each vertical bar represents the mean ± SE of three replicate incubations. Different letters (control: a, SPE: A) represent a significant difference among groups (p < 0.05). * p < 0.05.
Jmse 10 00086 g009
Figure 10. cyp17a1 expression in incubated ovarian follicles from A6, A7, and A8. Levels of mRNA from follicles incubated in media alone (white column) and in 500 μg/mL SPE (black column). Panels (AC) indicate individuals A6, A7, and A8, respectively. Table A6, A7 and A8 were used at 8 h after injection of LHRHa. Each vertical bar represents the mean ± SE of three replicate incubations. Different letters (control: a, SPE: A) represent a significant difference among groups (p < 0.05). * p < 0.05.
Jmse 10 00086 g010
Figure 11. cyp17a2 expression in incubated ovarian follicles from A6, A7, and A8. Levels of mRNA from follicles incubated in media alone (white column), and in 500μg/mL SPE (black column). Panels (AC) indicate individuals A6, A7, and A8, respectively. Ovarian follicles from A6, A7, and A8 were used at 8 h after injection of LHRHa. Each vertical bar represents the mean ± SE of three replicate incubations. Different letters (control: a, SPE: A) represent a significant difference among groups (p < 0.05). * p < 0.05.
Jmse 10 00086 g011
Table 1. Primers used in this study.
PurposeNameSequence (5′–3′)PCR
Product Sizes
Annealing
Temperature
Hsd3b
Full-cloning1FCTAGCCTCGAGAATTGAGGGA
ATTTGTATCCCACACG
1277 bp62 °C
1RTACCACGCGTGAATTAGCCCA
CAATACGTCAGGCTGG
RT-PCR2FCTGGAGCGTTTGGATTCCTGGG305 bp55 °C
2RCCAGCAAGAACTGGGTACCTT
qPCR3FACCAGCAGCATTGAGGTGGC
3RCTCCCCATTGACCTGTAGAACC
Cyp17a1
Full-cloning4FCTAGCCTCGAGAATTTGCACACC
TAAAGTTTAGGTAAC
1633 bp62 °C
4RTACCACGCGTGAATTGACTGTATA
ATACAAAGCAGTCT
RT-PCR5FTAATCTGTAGAGAAGCCCGCTCC428 bp55 °C
5RTCTGTCAGCCCCACTTCTCTTGC
qPCR6FGTGAATAACTACCAAGATGCC
6RGAATAGAATGTCTGTAGTCACAG
Cyp17a2
5′RACE
RT 7RGTACAGACCAAAGAGGCCCCCA
RACE-PCR
1st round8RTTGCACCCCAGCCTGGTGAAGAG
2nd round9RACGATGGGGAAGGAGGGCAGACA
3′RACE
1st round7FAACCTTGAGGGGAGATATGGGGT
2nd round8FGTAGTCCTGCAGCCAGAAAGCTA
Full-cloning10FCTAGCCTCGAGAATTGTGTGCCTGA
TTTGGGTTGTGCT
1742 bp62 °C
10RTACCACGCGTGAATTCTGGTACACA
AAGACCCTTCCC
RT-PCR11FATGGTGACAACAGCTCTGCTG353 bp55 °C
11RTACTAGGCTTCCTCTGGCGATG
qPCR12FCTTGCTTCATCACCCTGAGGTC
12RCCGATACTGGTATTTTCCAAGG
Ef1αEf1α1FAAACAACCCCCTGCGTCTG
Ef1α1RGGGTACAGTTCCAATACCTCCGA
Table 2. Substrate specificity of Amur sturgeon hsd3b, cyp17a1 and cyp17a2.
SubstrateProductConversion Rate
Amur Sturgeon
hsd3b
Type-I
Amur Sturgeon
cyp17a1
Type-I
Amur Sturgeon
cyp17a2
Type-I
Non-Transfected HEK293T
P517OHP5n.d.1.6%6.2%n.d.
P5DHEAn.d.2.3%n.d.n.d.
P417OHPn.d.4.2%28.1%n.d.
P4A4n.d.5.6%n.d.n.d.
P5P412.6%n.d.n.d.n.d.
P4P5n.d.n.d.n.d.n.d.
17OHP517OHP11.4%--n.d.
17OHP17OHP5n.d.--n.d.
DHEAA418%--n.d.
A4DHEAn.d.--n.d.
A5T17.4%--n.d.
TA5n.d.--n.d.
Eight steroids were used as the substrates. Pregnenolone, P5; 17α-hydroxypregnenolone, 17OHP5; progesterone, P4; 17α-Hydroxyprogesterone, 17OHP; androstenedione, A4; testosterone, T; dehydroepiandrosterone, DHEA; 5α-androstenediol, A5; n.d., no detection.
Publisher’s Note: MDPI stays neutral with regard to jurisdictional claims in published maps and institutional affiliations.

