Article

Experimental and Numerical Study of the Discharge Performance of Particle-Laden Turbulent Flow

1
Research Center of Fluid Machinery Engineering and Technology, Jiangsu University, Zhenjiang 212013, China
2
Shanghai Fire Research Institute of MEM, Shanghai 200032, China
*
Authors to whom correspondence should be addressed.
J. Mar. Sci. Eng. 2022, 10(1), 85; https://doi.org/10.3390/jmse10010085
Submission received: 26 November 2021 / Revised: 3 January 2022 / Accepted: 6 January 2022 / Published: 10 January 2022
(This article belongs to the Special Issue Advances in Ship Waves Modelling)

Abstract

:
In the marine fire suppression system, continuous delivery of dry chemical powder to the fire source with long powder discharge range and high dispersion concentration is essential. The work is devoted to experimental and numerical studies of the flow characteristics of the dry chemical powder jet from a horizontal injector with a wide range of Stokes numbers between 6 to 30 and Reynolds numbers between 4792 to 23,960 by considering the effect of gravitational acceleration. A CFD-based Eulerian–Eulerian multiphase model combined with Standard k- ω turbulence model was used to predict flow characteristics of particle-laden jet using dimensionless numbers, including the solid volume fraction, the normalized velocity magnitude, and the turbulent viscosity ratio. Experimental studies have been carried out for three different inflow velocities (2.06, 2.45, and 2.81 m/s). The results indicate that the particle density plays a significant role in the dispersion of the particles in the radial and axial directions. The transition from U-shaped to V-shaped solid dispersion structure on the ground can be captured with the increase of particle density. Moreover, the higher level turbulence intensity enhances the solid dispersion concentration. Finally, it was found that the Portland cement powder exhibits better discharge performance in terms of solid discharge range and dispersion concentration in comparison with other dry powders. These results have implications in the design of powder-based fire suppression system. Further studies should aim to the in-depth research on the fire extinguishing mechanism of the Portland cement powder, especially the fire suppression effectiveness and thermal decomposition process.

1. Introduction

Two-phase particle-laden turbulent jets have been utilized in a broad range of scientific and engineering applications, such as the mining process, pneumatic transport, particulate pollution control, fluidized bed mixing, and fire suppression process in marine industry. Among these involved applications, discharging powders from a injector is often encountered, especially in the fire suppression in a ship under sea condition. Fire and explosion accidents are two common shipping accident types in maritime transportation. It is reported that 29% and 17% of accidents in maritime transportation are caused by fires and explosions, respectively [1]. The fire and explosion can directly lead to extraordinary damage to people, marine property, and ocean environment. In the fire exhausting process, many fire-extinguishing agents (e.g., water, foam, CO 2 , dry chemical powder) and equipment (e.g., sprinkler, fire hose nozzle) have been investigated and adopted in a wide range of fire protection fields. Among them, the dry chemical powder fire suppression agent receives much attention owning to its low toxicity, low cost, environmental friendliness, and prominent fire-extinguishing performance for suppressing the emergent fire and explosion emergency in maritime transportation [2], see Figure 1. In particular, the fire suppression efficiency of dry chemical powder is almost 40 times that of water and foam, 4 times that of CO 2 , and 2.3 times that of haloalkanes [3]. Moreover, the dry chemical powder is the most effective method for extinguishing the liquefied natural gas (LNG) fire and flammable metals during the marine transportation process due to the existence of sodium/potassium bicarbonate. The main principle of the dry chemical powder fire suppression equipment is to cut or restrict the oxygen supply, which is an essential oxidant for combustion from the flammable products through coating the fuel with a thin layer of inert solid. In particular, the powder particles are propelled by carbon dioxide or nitrogen, and then injected from the nozzle to form a mist-like powder steam, which can inhibit the radical chain reaction in the flame zone, thereby suppressing the fire [4]. Therefore, improving the efficiency of the powder injector, thereby enhancing the fire suppressing performance of dry powders, has become the main object in the marine fire suppression field.
The efficiency of the powder injector is mainly dependent on the powder properties (e.g., size, density, and composition) and the geometry of the injector (e.g., diameter, length, and discharge angle). There has been considerable research into particle-laden jet flow, e.g., see works [5,6,7,8]. Lau and Nathan [9] investigated the particle velocity and concentration distributions in a particle-laden turbulent jet though digital particle image velocimetry (PIV). The comprehensive data revealed that the effective Stokes number in the axial direction is lower than that in the radial direction. Kuang et al. [10] experimentally studied the effectiveness of superfine commercial dry powder in the fire suppression system, and they found that the decreased powder size improves the fire extinguishing effectiveness significantly. Yang et al. [11] conducted detailed experimental investigations to analyze the influence of the injector structural parameters on the injection performance of the gas–solid two-phases flow. They found that the length of the injector is the most significant parameter, and the curve change of pressure can indicate the particle transportation state. AbdEI-hamid et al. [12] has conducted a series of experiments to study the air-solid two-phase flows through three different injectors, and the results indicated that the convergent-constant-divergent injector (Venturi-type injector) can enhance the injection performance. Fang et al. [13] indicated that the granular dispersion fades away with the increase of the injector wall thickness.
The computational fluid dynamics (CFD) has been widely accepted as an excellent tool to describe the powder jet characteristics, with numerous applications ranging from chemical to marine industry [14,15,16,17]. Jebakumar and Abraham [18] carried out two-dimensional (2D) axisymmetric CFD simulations using a k- ε turbulence model to analyze the structure of particle-laden jets for Stokes number = 0.3 to 500. They found that the jet structure is sensitive to the gas phase turbulence intensity at low Stokes number, while the jet structure is sensitive to the inlet particle velocity fluctuations at high Stokes number. Tavangar et al. [19] used a three-dimensional (3D) Eulerian–Lagrangian multiphase model coupled with k- ω shear stress transport (SST) turbulence model to investigate the horizontal motion of particle-laden jets and analyzed the relations between the jet Reynolds number and Stokes number. Patro et al. [20] presented the results of a numerical analysis of the Eulerian–Eulerian multiphase model of the gas–solid free jet flow in vertical downward direction, and they reported that the smaller particles can attenuate turbulence while the large particles enhance turbulence. Zhang et al. [21] investigated jet-to-coflow velocity ratio on the particle-laden coflow jet characteristics using large eddy simulations (LES) approach. The particles are mainly distributed in the center region and less concentrated outside the jet edge under the effect of small jet-to-coflow velocity ratio. Zhang et al. [22] conducted a experimental and numerical study of particle dispersion in a coaxial jet flow, and the particle shape effect has been found less sensitive compared with the size distribution effect on the particle dispersion.
The dry powder fire extinguishing device can be classified as fixed type and portable type according to the specific applications. Most previous studies focus on the fire suppression performance in the internal environment (e.g., factory and laboratory), where a powder nozzle is vertically located on the top wall, and the vertical jet of powder coming out of a nozzle for maximum coverage in a closed area. However, in the marine transportation process, the remote powder fire extinguishing device is more favorable since the portable powder jet nozzle can flexibly extinguish the fire in the external environment (e.g., outside container) and the remaining fire at the blind spot on the board ship.
Through the literature review, it was found that there is a great deal of work aimed at increasing the efficiency of the fixed-type dry powder fire extinguishing device and consequently enhancing the fire suppression performance, either by focusing on the operating conditions, or by the design and study of the device structures. However, there are limited works on the comparative investigation of the discharge performance of portable-type powder fire extinguishing device for different powder agents. Ibrahim et al. [23] experimentally studied the effectiveness of three different commercial dry powders in the portable-type fire suppression system, and they found that the milled Mg(OH) 2 powder shows a better fire extinguishing effectiveness than ABC dry powder and NaHCO 3 powder. Liu et al. [3] conducted a bench-scale experiment to evaluate the performance of three fire suppression agents: Mg(OH) 2 powder, NaHCO 3 powder, and NH 4 H 2 PO 4 powder, and they found that the fire extinguishing times of Mg(OH) 2 powder are much shorter than others powders. However, we note that these works only evaluate the performance of different fire suppression agents through experiments, the behavior and characteristics of the particle-laden jet flow with different fire suppression agents have not been comprehensively investigated, which has to be modeled using advanced mathematical models implemented into CFD software.
Motivated by a lack of solid comparison of 3D simulations results to experimental data, the aim of the present study is to investigate the flow characteristics of the particle-laden turbulent flow from a horizontal injector into the free-stream domain for a wide range of Stokes numbers by considering the effect of gravitational acceleration. Both experimental and numerical studies are compared to enhance the validity of the present research work. Two performance indexes of the discharging process, namely solid discharge range and solid dispersion concentration, are adopted to evaluate the performance of three different powder agents, ABC dry powder, BC dry powder, and Portland cement powder, under various operating conditions. Through the experimental test and numerical simulation, the gas–solid flow characteristics and powder trajectory are revealed, which can provide a reference for the optimization of this particle-laden turbulent flow system.
The rest of the work is organized as follows. The next two sections provide an overview of the experimental setup and the specific numerical methodology. This is then followed by grid-independent test and validation where the computed results are compared with the experimental data. Subsequently, the detailed results and discussion are presented. Finally, the main conclusions are given.

2. Experimental Apparatus and Condition

A schematic representation of the powder pneumatic injection system is shown in Figure 2. The setup consists in a feed hopper, an air compressor, a control valve, a electromagnetic flowmeter, a conveying line, and a gas–solid injector. A stainless steel conical hopper of 50 L capacity is used to hold the tested particles, and the feed speed (up to 2 kg/min) is controlled by the hopper valve. The tested powder is ABC dry powder (NH 4 H 2 PO 4 > 90%), which was purchased commercially from Longxin Fire Equipment Manufacturing Co., Ltd., Zhejiang China. The commercial powders were not filtered before experimental study. The commercial particle size range measured by Mastersizer 3000 laser diffraction analyzer is from 0.4 to 1000 μm, and the medium diameter ( D 50 ) is 24 μm.
An air supply compressor (FBW-1.6/8, Shanghai Jiebao Compressor Manufacturing Co., Ltd., Shanghai, China) with a maximum capacity of 11 KW at ambient temperature was selected to produce air flow into the transportation section. A stainless steel pipe with an inner diameter of 50 mm and a total length of 4.3 m was used as the delivering line, which was located at a 0.84 m height. The total of 2 kg ABC dry powder was stored in the feed hopper (A011, Xinchanglong Machinery Manufacturing Co., Ltd., China) located roughly 0.5 m apart from the injector during the tests, as shown in Figure 3. After passing through the delivering line with control valve, the gas–solid two-phase flow was sufficiently mixed and accelerated in the straight pipe with 580 mm length. In the present study, the Venturi type injector is chosen to study the particle-laden jet flow. The main advantages of using Venturi type injector are a high level of mixing efficiency, low energy requirement, and short mixing length [24,25]. The fully mixed solid–gas flow is beneficial to the fire extinguishing performance.
For the measurements, the air flow rate, Q, is measured in the delivering pipe using a flow meter (WQB-50, Best Instruments Co., Ltd., China) with an accuracy of ±3% FS. The particles are transported into the injector through the feeding system with a fixed solid mass flow rate of 2 kg/min. A total of 200 transparent plastic containers (10 cm × 10 cm square) were placed within the particle dispersion area to collect the dispersed particles. The particle collecting area is over 3.38 m 2 (2.6 m in the discharge direction and 1.3 m in the cross direction). The particle landing position was determined by measuring the mass of each container.
The air moisture has an effect on the flowability of the powder jet flow. A higher level of air moisture will increase the thickness of the adsorbed liquid layer, which enhances the strength of liquid bridges. As a result, the gas–solid flow becomes more cohesive and tends to form agglomeration. The solid discharge range and solid dispersion concentration will be affected as well. Most studies observed a decrease in flowability of the powder jet flow with the increase of air moisture [26,27,28]. In the present study, the experiments were carried out in the experimental laboratory with an averaged humidity of 70%. Further studies will be carried out to investigate the influence of air moisture on the discharge performance of particle-laden jet.

3. Model Formulation

3.1. Conservation of Continuity and Momentum

For the multiphase flow solutions, the Eulerian–Eulerian multiphase model, available in the commercial CFD software ANSYS FLUENT 17.0, was employed to simulate the particle-laden jet flows. The gas phase is considered as a continuous phase and the solid phase is a dispersed phase. Both phases are treated as inter-penetrating continua coexisting in the domain based on the theory of phase volume fraction, and each of these continua is described by a continuity and momentum balance. The solid phase is assumed to be dispersed spherical particles with uniform diameter, and the fluctuating motion of the solid phase is modeled by the kinetic theory of granular flow (KTGF). The gas and solid phases interpenetrated and interacted with each other in the computational domain. The Continuity equation and momentum equation are expressed as follows:
t ( α q ρ q ) + · ( α q ρ q v q ) = 0
t ( α q ρ q v q ) + · ( α q ρ q v q v q ) = α q p q + · α q τ ¯ q ¯ + α q ρ q g + p = 1 n R p q
where α q , ρ q , and v q (q = g—gas or s—solid) represent the volume fraction, density, and velocity, respectively. P is the static pressure. τ ¯ q is the stress tensor, and can be expressed as follows:
τ ¯ q ¯ = α q μ q v q + v q T + α q λ q 2 3 μ q · v q I ¯ ¯
where μ q is the molecular viscosity, I ¯ is the unit tensor.

3.2. Interphase Momentum Exchange Forces

The interphase momentum exchange forces like drag force, turbulence dispersion force, and turbulence interaction force are considered by additional momentum source terms in the present models. The interphase momentum exchange coefficient is expressed as follows:
p = 1 n R p q = p = 1 n K p q v p v q
The fluid–fluid exchange coefficient, K p q , and the fluid–solid exchange coefficient, K l s , are calculated based on the drag function f and the particulate relaxation time τ . In particular, the drag model of gas–solid is chosen as the Syamlal-O’Brien model [29]:
f = C D R e s α g 24
where C D and R e s are drag coefficient and relative Reynolds numbers.
C D = ( 0.63 + 4.8 R e s / v r , s ) 2
R e s = ρ g d s v s v g μ g
The turbulence dispersion force is described by the Simonin model, and the turbulence interaction force is modelled by the Simonin et al. model. In addition, the effect of virtual mass force and the lift force between gas and solid phase are expected to be negligible in this work due to the relatively large particles.
The solid pressure P s , which is given by Syamlal-O’Brien model as follows [30]:
p s = α s ρ s Θ s + 2 ρ s 1 + e s s α s 2 g 0 , s s Θ s
where Θ s is the granular temperature, and g 0 , s s is the radial distribution function. The CFD simulations were performed to study the isothermal particle laden flow. The CFD simulations were performed to study the isothermal particle laden flow. The granular temperature ( Θ s ), which is proportional to the mean square of the random motion of particles, was proposed to measure the kinetic energy associated with the particle velocity fluctuations from the KTGF. The granular temperature transportation equation is reduced to an algebraic formulation, which means that the convection and diffusion are neglected. In this case, the granular temperature is only considering the generation of energy by solid stress tensor, the collisional dissipation of energy, and the energy exchange between the kinetic energy transfer [31]:
Θ s = 1 3 ( v s 2 )
The radial distribution function ( g 0 , s s ) is used to modify the probability of collision between particles, which is given by Syamlal-O’Brien as follows:
g 0 , s s = 1 α s α s , m a x 1 3 1
The solid shear viscosity ( μ s ) for granular flows is the sum of the kinetic viscosity ( μ s , k i n ), collisional viscosity ( μ s , c o l ), and frictional viscosity ( μ s , f r ), which are expressed as follows:
μ s = μ s , k i n + μ s , c o l + μ s , f r
These viscosities take the following forms [30,32]:
μ s , k i n = α s d s ρ s θ s π 6 ( 3 e s s ) [ 1 + 2 5 ( 1 + e s s ) ( 3 e s s 1 ) α s g 0 , s s ]
μ s , c o l = 4 5 α s ρ s d s g 0 , s s ( 1 + e s s ) ( θ s π ) 1 / 2 α s
μ s , f r = p s s i n ϕ 2 I 2 D
The solid bulk viscosity ( λ s ) accounts for the resistance of the particles to compression and expansion, which is given by Lun et al. as follows [33]:
λ s = 4 3 α s ρ s d s g 0 , s s 1 + e s s θ s π 1 / 2
The coefficient of restitution ( e s s ) with a value of 0.9 is adopted for particle–particle interaction and the specularity coefficient ( φ s w ) with a value of 0.1 characterizing the particle–wall interaction [15]. Moreover, the acceleration of the gravity (g = −9.81 m/s 2 ) is set towards the Y-axis direction.

3.3. Turbulence Model

Since the Reynolds number of the particle-laden jet flow can be as high as several ten thousands in the computational flow field, therefore, turbulence effects cannot be neglected during the discharge process. The Reynolds-Averaged Navier-Stokes (RANS) turbulence models, based on the Boussinese eddy viscosity assumption, is the most widely used robust model for describing the physics of turbulence of external and internal flows. To accurately capture the local turbulence characteristics near the wall boundary regions, the standard k- ω dispersed turbulence model is used to predict the gas–solid two-phase turbulent flows in the present study [34].
t ( ρ k ) + x i ( ρ k u i ) = x i ( Γ k k x j ) + G k Y k + S k
t ( ρ ω ) + x i ( ρ ω u i ) = x i ( Γ ω ω x j ) + G ω Y ω + S ω
where k is the turbulent kinetic energy, ω is the specific dissipation rate. G k and G ω represent the generation of k and ω , respectively. Y k and Y ω represent the dissipation of k and ω , respectively.

3.4. Boundary Conditions and Numerical Solution

At the inlet boundary condition, a specific velocity–inlet in the range between 1 to 5 m/s is set for the solid and gas phase. The inlet solid concentration was calculated in the range between 0.2% to 0.37%. The outlet boundary condition is specified as the pressure outlet with a constant value of 1 atm. The specularity coefficient ( φ s w ) with a value of 0.1 is applied for the particle–wall collisions within the injector. The boundary condition for turbulence are specified with turbulent intensity of 5% and turbulent viscosity ratio of 10. As for the initial condition, the volume fraction of the gas phase is set to unity in the computational fluid region, and the gauge pressure of the system is set to atmosphere pressure.
In order to determine the particle-laden jet performance with different types of powder, we use air as the basic fluid material to carry three different particles, namely, ammonium dihydrogen phosphate NH 4 H 2 PO 4 (ABC dry powder), sodium bicarbonate NaHCO 3 (BC dry powder), and calcium oxide CaO (Portland cement powder). It should be noted that “ABC” dry powder is designed to extinguish class A, B, and C fires, while “BC” dry powder is designed to extinguish class B and C fires. For the gas phase, the density ρ g is 1.225 kg/m 3 , and the dynamic viscosity μ g is 1.8 × 10 5 kg/m-s. For the solid phase, the particle density μ s is 1800 kg/m 3 for NH 4 H 2 PO 4 particle, 2200 kg/m 3 for NaHCO 3 particle, and 3340 kg/m 3 for CaO particle. In the experimental study, the tested particle type is ABC dry powder (NH 4 H 2 PO 4 > 90%) with a medium diameter ( D 50 ) of 24 μm. To validate the numerical results obtained in the framework of the Eulerian–Eulerian model, the CFD simulation with particle diameter of 24 μm was conducted to compare the experimental results. It should be noted that for D p = 24 μm, the Stokes number is relatively small ( S t = 1), and the particle will follow the fluid’s velocity. The effect of particle density on the powder jet performance is not clear for such a small Stokes number. Therefore, to evaluate the discharge performance of differ powders under various particle densities, the particle with an uniform diameter of 200 μm was chosen. In particular, S t = 9, 11, and 17 for ρ p = 1800, 2200, and 3340 kg/m 3 , respectively.
The 3D computational geometry is discretized with three hexahedral meshes using fine-volume method with 260,092 (Grid-1), 793,244 (Grid-2), and 2,445,465 (Grid-3) computational cells. The commercial grid-generation tool ICEM CFD is utilized to generate the geometry and the computational grid. The constructed mesh has comparable spacings in radial, azimuthal, and axial directions, and the ratio of mesh size to particle diameter meets the requirement of Eulerian–Eulerian calculation criterion [35]. The computational domain of Grid-2 is present in Figure 4.
The pressure–velocity coupling algorithm of Coupled scheme was employed in the present study. For the spatial discretization, the Least Squares Cell Based scheme was used to calculate gradients, the Quadratic Upwind Interpolation for Convective Kinematics (QUICK) scheme was applied to estimate the volume fraction of gas or solid phase, and the Second Order Upwind scheme was activated to discretize the momentum, turbulent kinetic energy, and specific dissipation rate equations. The numerical calculations were performed for steady state and the numerical computations were carried out on Intel(R) Xeon(R) Gold 6238 CPU processor running at 2.20 GHz with 20 cores and 256 GB RAM memory.

4. Grid Dependence Analysis and Validation of Numerical Simulation

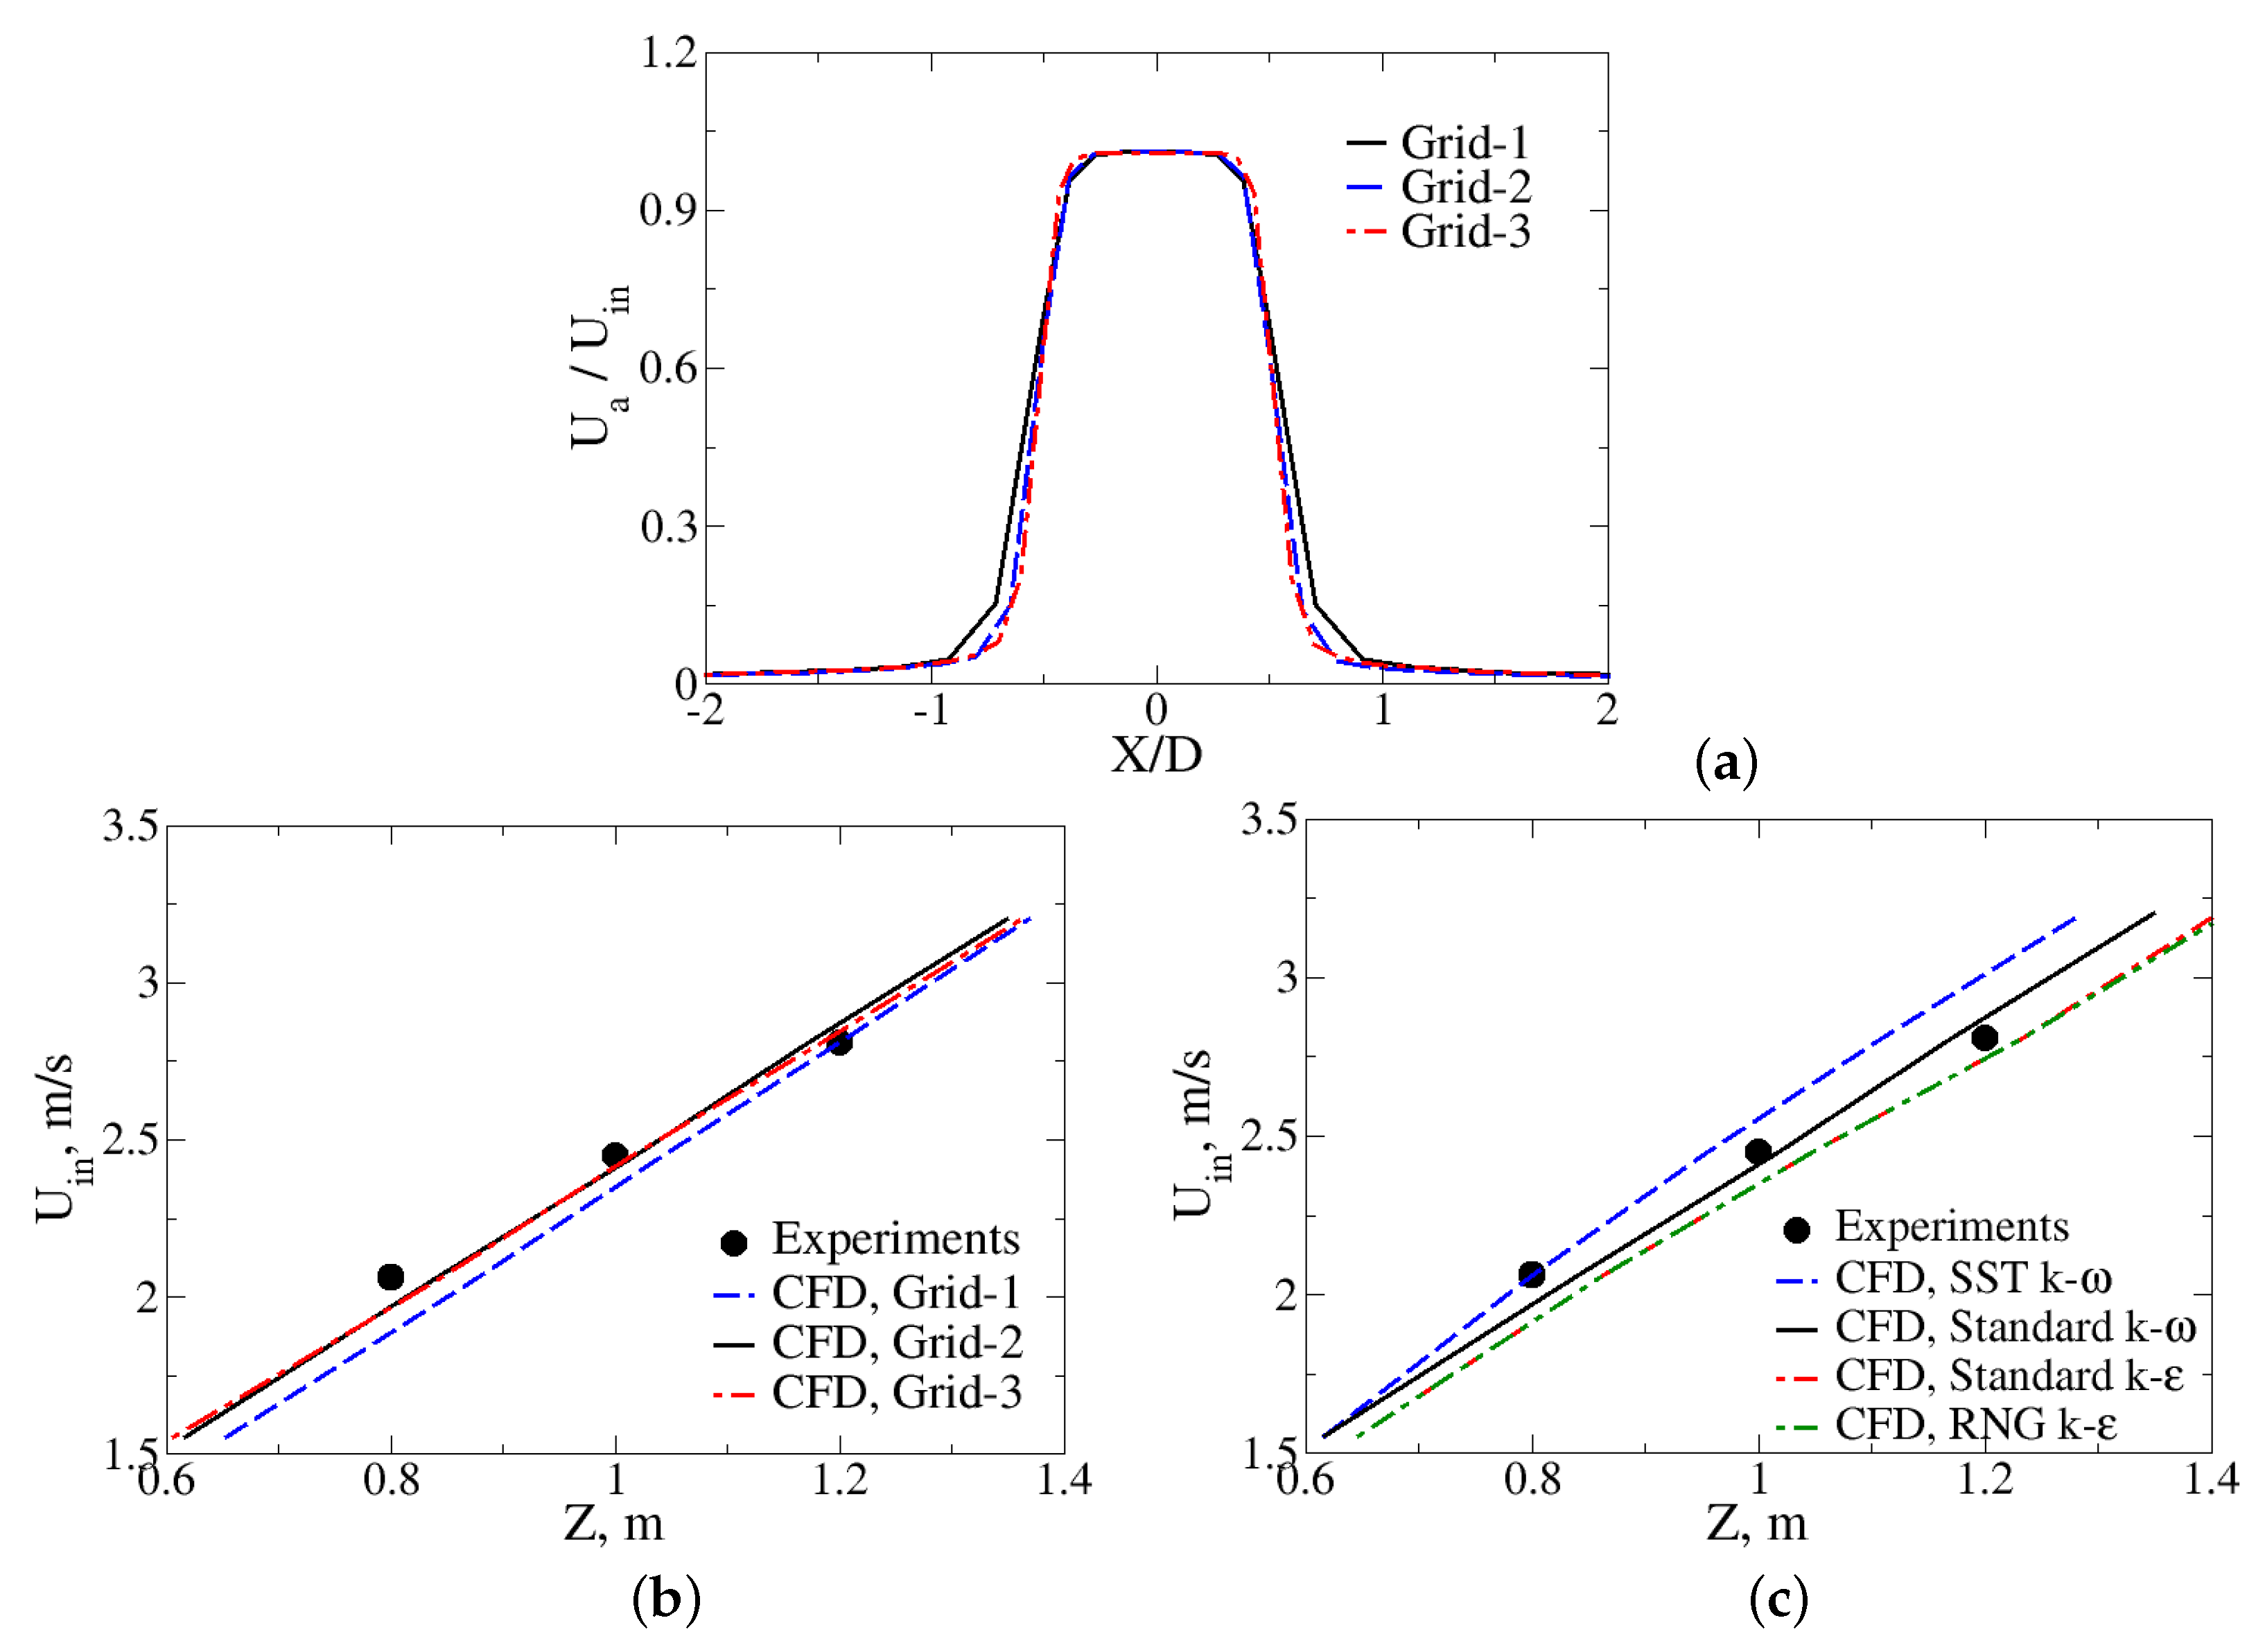
In the present case, we simulated the particle-laden flow in a horizontal direction by considering the effect of gravitational acceleration. Cases of three different grid resolutions (260,092, 793,244, and 2,445,465 cells) are conducted to seek a mesh-independent solution. The radial variation of the normalized air velocity, U a / U i n at Z / D = 3 and Y / D = 0 is presented in Figure 5a. It can be seen that the air velocity distribution is a “n-shaped” structure, with a maximum ( U a / U i n = 1) close to the center of the powder jet and a minimum ( U a / U i n = 0) towards the edge of the jet. Case of 260,092 cells shows a higher air velocity profile than cases of 793,244 and 2,445,465 cells in the center and edge jet joint region, but no apparent difference of the cases of 793,244 and 2,445,465 cells is observed in the axial distributions of the normalized air velocity.
To further ensure the reliability of the numerical model, simulations were performed for comparisons with the measurements of the powder landing position in a 3D particle-laden jet flow. Figure 5b shows the comparison of simulated and experimental powder landing positions under different inlet flow velocities. It should be noted that the experimental study of free powder jet flow is rare from the literature, and the experimental data generated from the present study is not comprehensive enough for an exhaustive evaluation of CFD tools performance. This is mainly due to the limited feed capacity of the feed hopper. The maximum feed capacity of the adopted feed hopper is 2 kg/min, and the dilute dispersion of particle in air can be observed once the feed capacity is lower than 2 kg/min. Therefore, we performed experimental study for the three different inflow velocities (2.06 m/s, 2.45 m/s, and 2.81 m/s) with a maximum particle feeding rate of 2 kg/min to investigate the performance of particle-laden jet. It is observed that the simulated results under three different grids exhibit similar trends in terms of particle landing positions. Clearly, the particle landing distance increases from 0.6 m to 1.4 m as the inlet flow velocity increases from 1.55 m/s to 2.94 m/s. Moreover, Grid-1 underpredicts the inlet flow velocity in most conditions, with a deviation of 8.64%, while Grid-2 and Grid-3 show good agreement with experimental data, with deviations of 3.71% and 2.46%, respectively. Therefore, Grid-2 with 793,244 cells is used in the numerical prediction for free powder jet flow to guarantee a satisfactory degree of computational accuracy.
The main purpose of the model validation is to ensure the global formulations, meaning a set of submodels (e.g., turbulence model) is able to predict the discharge performance under various flow conditions. Four different RANS turbulence models were tested: the Standard k- ε , the Standard k- ω , the RNG k- ε , and the SST k- ω . As can be seen from Figure 5c, the predicted particle landing profile illustrates that there is no apparent difference of the results calculated from Standard k- ε turbulence model and RNG k- ε turbulence model. In comparison, greater difference could be seen in the landing positions for the SST k- ω and the Standard k- ω model. In particular, the predicted results from the Standard k- ω model agree well with the experimental data, with an averaged deviation of 3.71%, whereas the SST k- ω model underpredicts the particle landing position for U i n > 2 m/s, with an averaged deviation of 12.69%. The results suggest that the Standard k- ω dispersed turbulence model is more accurate at predicting free powder jet flows than other turbulence models.

5. Results and Discussion

To unify the results from the computations, two dimensionless parameters, the Reynolds number, R e , and the Stokes number, S t , are applied to understand the hydrodynamic characteristics of the particle-laden jet flow. By definition, the Reynolds number R e is the ratio of inertial forces to viscous forces, and the Stokes number S t expresses the relationship between the particle relaxation time and the fluid characteristic time. The Reynolds number and Stokes number are calculated as follows:
R e = ρ a U i n D μ
S t = ρ p D p 2 U i n 18 μ D
where ρ p and ρ a are the density of particle and air, respectively. D is the diameter of the injector, D p is the diameter of particle, U i n is the inlet flow velocity, and μ is the viscosity of air. In particular, a small Stokes number ( S t ≤ 1) represents that the solid particles will mostly follow the fluid motion acting like a tracer, while a larger Stokes number ( S t ≥ 1) means that the solid particles are not tightly coupled with the fluid. In the free jet region, the particle Stokes number will affect the behavior and performance of the turbulent particle-laden jet flow significantly. In the present study, different cases are considered (summary in Table 1) to investigate the influence of Stokes number and Reynolds number on the dispersion performance of a particle-laden jet.
To characterize the turbulent particle-laden flow characteristics for ABC dry powder (Case-1), BC dry powder (Case-2), and Portland cement powder (Case-3), Figure 6, Figure 7 and Figure 8 show predicted results gained by means of the 3D Eulerian–Eulerian multiphase model coupled with Standard k- ω dispersed turbulence model at R e = 13,466. All particles have a uniform diameter of 200 μm, but different densities in the range between 1800 kg/m 3 and 3340 kg/m 3 . The solid concentration is set as 0.2%. From the figure, the iso-surface contour plot of the solid volume fraction, α s 
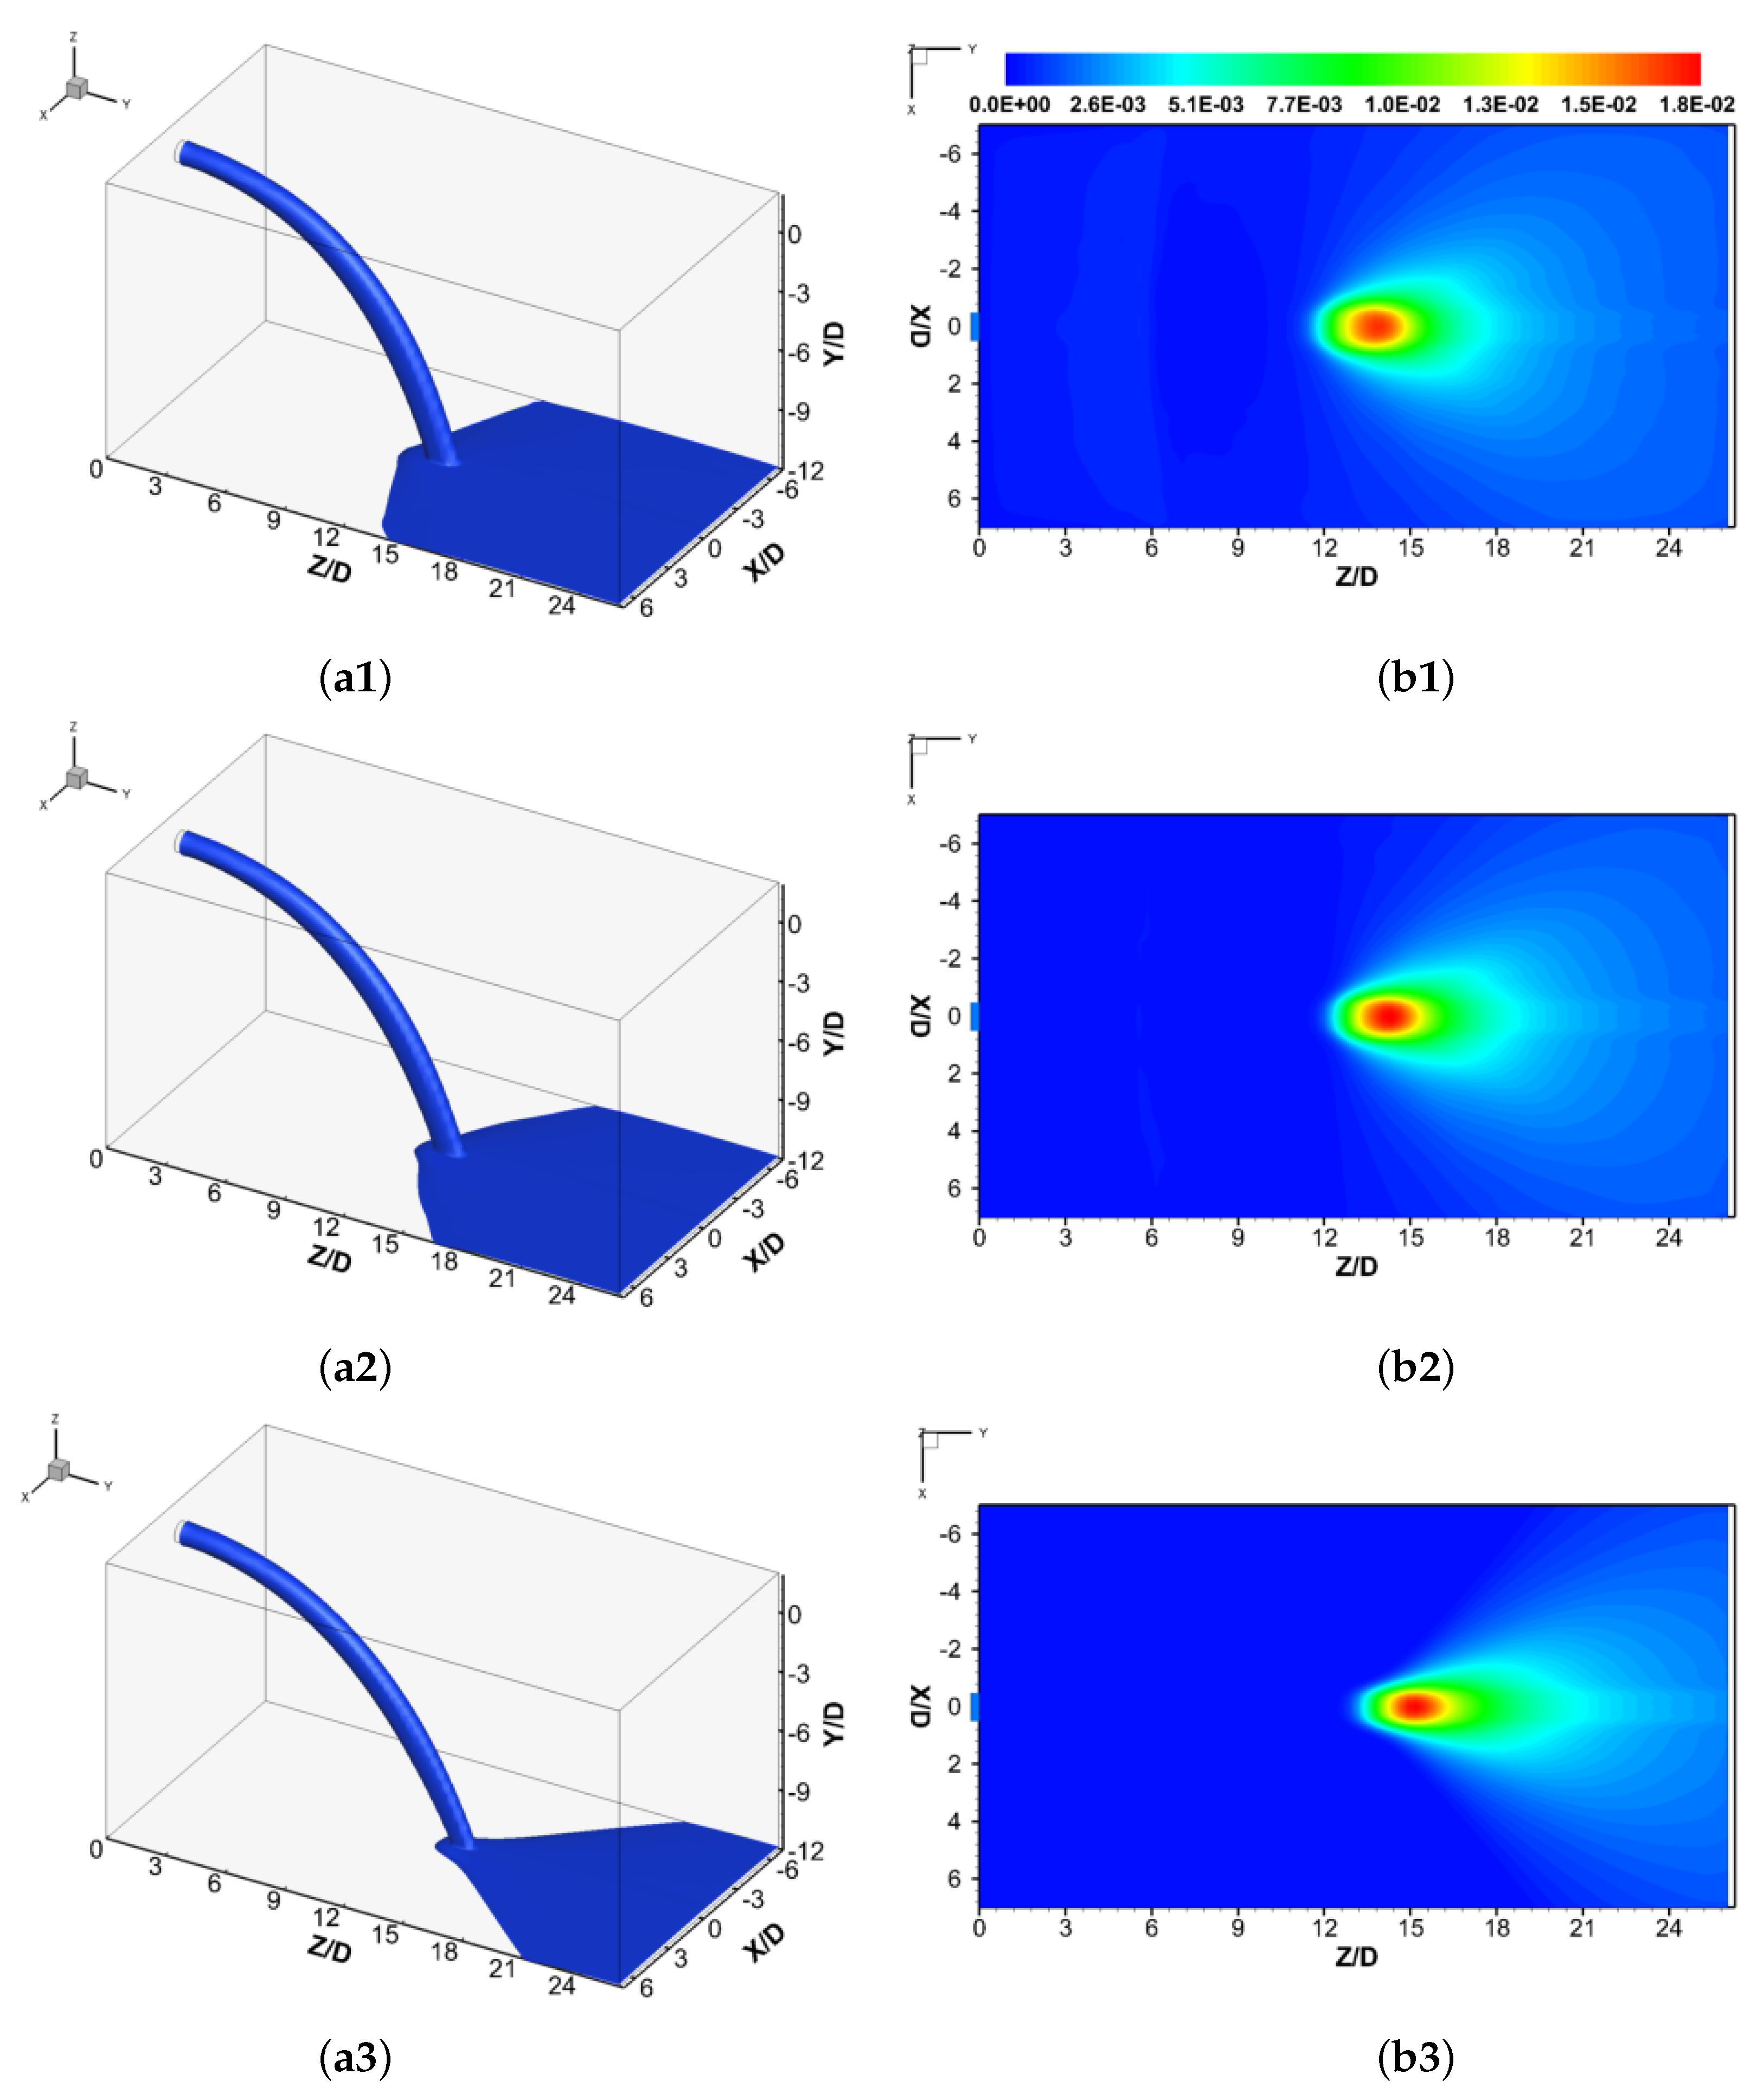
= 0.001, is used to visualize the distribution of the solid particles in the computational domain. As can be seen from Figure 6a, the solid particles are discharged from the injector exit and then travel a certain distance in the air. After that, the solid particles fall down and land on the ground due to the gravitational force, and finally spread toward downstream. Clearly, the similar shape of the trajectories predicted from three different powder agents can be observed, but the distribution of the solid particles on the ground is significantly different. In particular, the solid dispersion concentration is converted from U-shaped for Case-1 to V-shaped structure for Case-3 in the dispersion region.
To further explore the influence of powder agents on the particle concentration distributions, Figure 6b shows contours of solid volume fraction on the ground. As can be seen from the figure, a wide range of solid volume fractions (0–0.18) are distributed on the ground for three different cases. Higher solid concentration is mainly distributed at the landing position, with a maximum value of 0.018, while a lower solid concentration exists downstream of the landing position. The total dimensionless coverage area is A t c A g = 50%, 42%, and 35%, while the highest concentration ( α s ≥ 0.017) coverage area is A h c A g = 0.15%, 0.21%, and 0.24% for ABC dry powder (Case-1), BC dry powder (Case-2), and Portland cement powder (Case-3), respectively. It is noted that the total coverage area decreases significantly by 15%, while the highest concentration coverage area increases slightly by 0.09% as the particle density increases from 1800 to 3340 kg/m 3 . Comparing the results from Case-1, Case-2, and Case-3 shows that the particle landing position moves downstream from Z / D = 13.5 to Z / D = 15.3 (about 12%), which suggests that the Portland cement powder has a greater ability to travel a longer distance than the ABC dry powder and BC dry powder. This is mainly due to the effect of Stokes number. As the Stokes number increases from 9 (Case-1) to 17 (Case-3), the particle-laden flow is controlled by the inertial force and has a poor followability. Hence, the particle landing position is more likely to move downstream with the increase of Stokes number. Additionally, solid particles with small Stokes number are more likely to be entrained by vortex clusters and therefore enhance the radial dispersion on the ground.
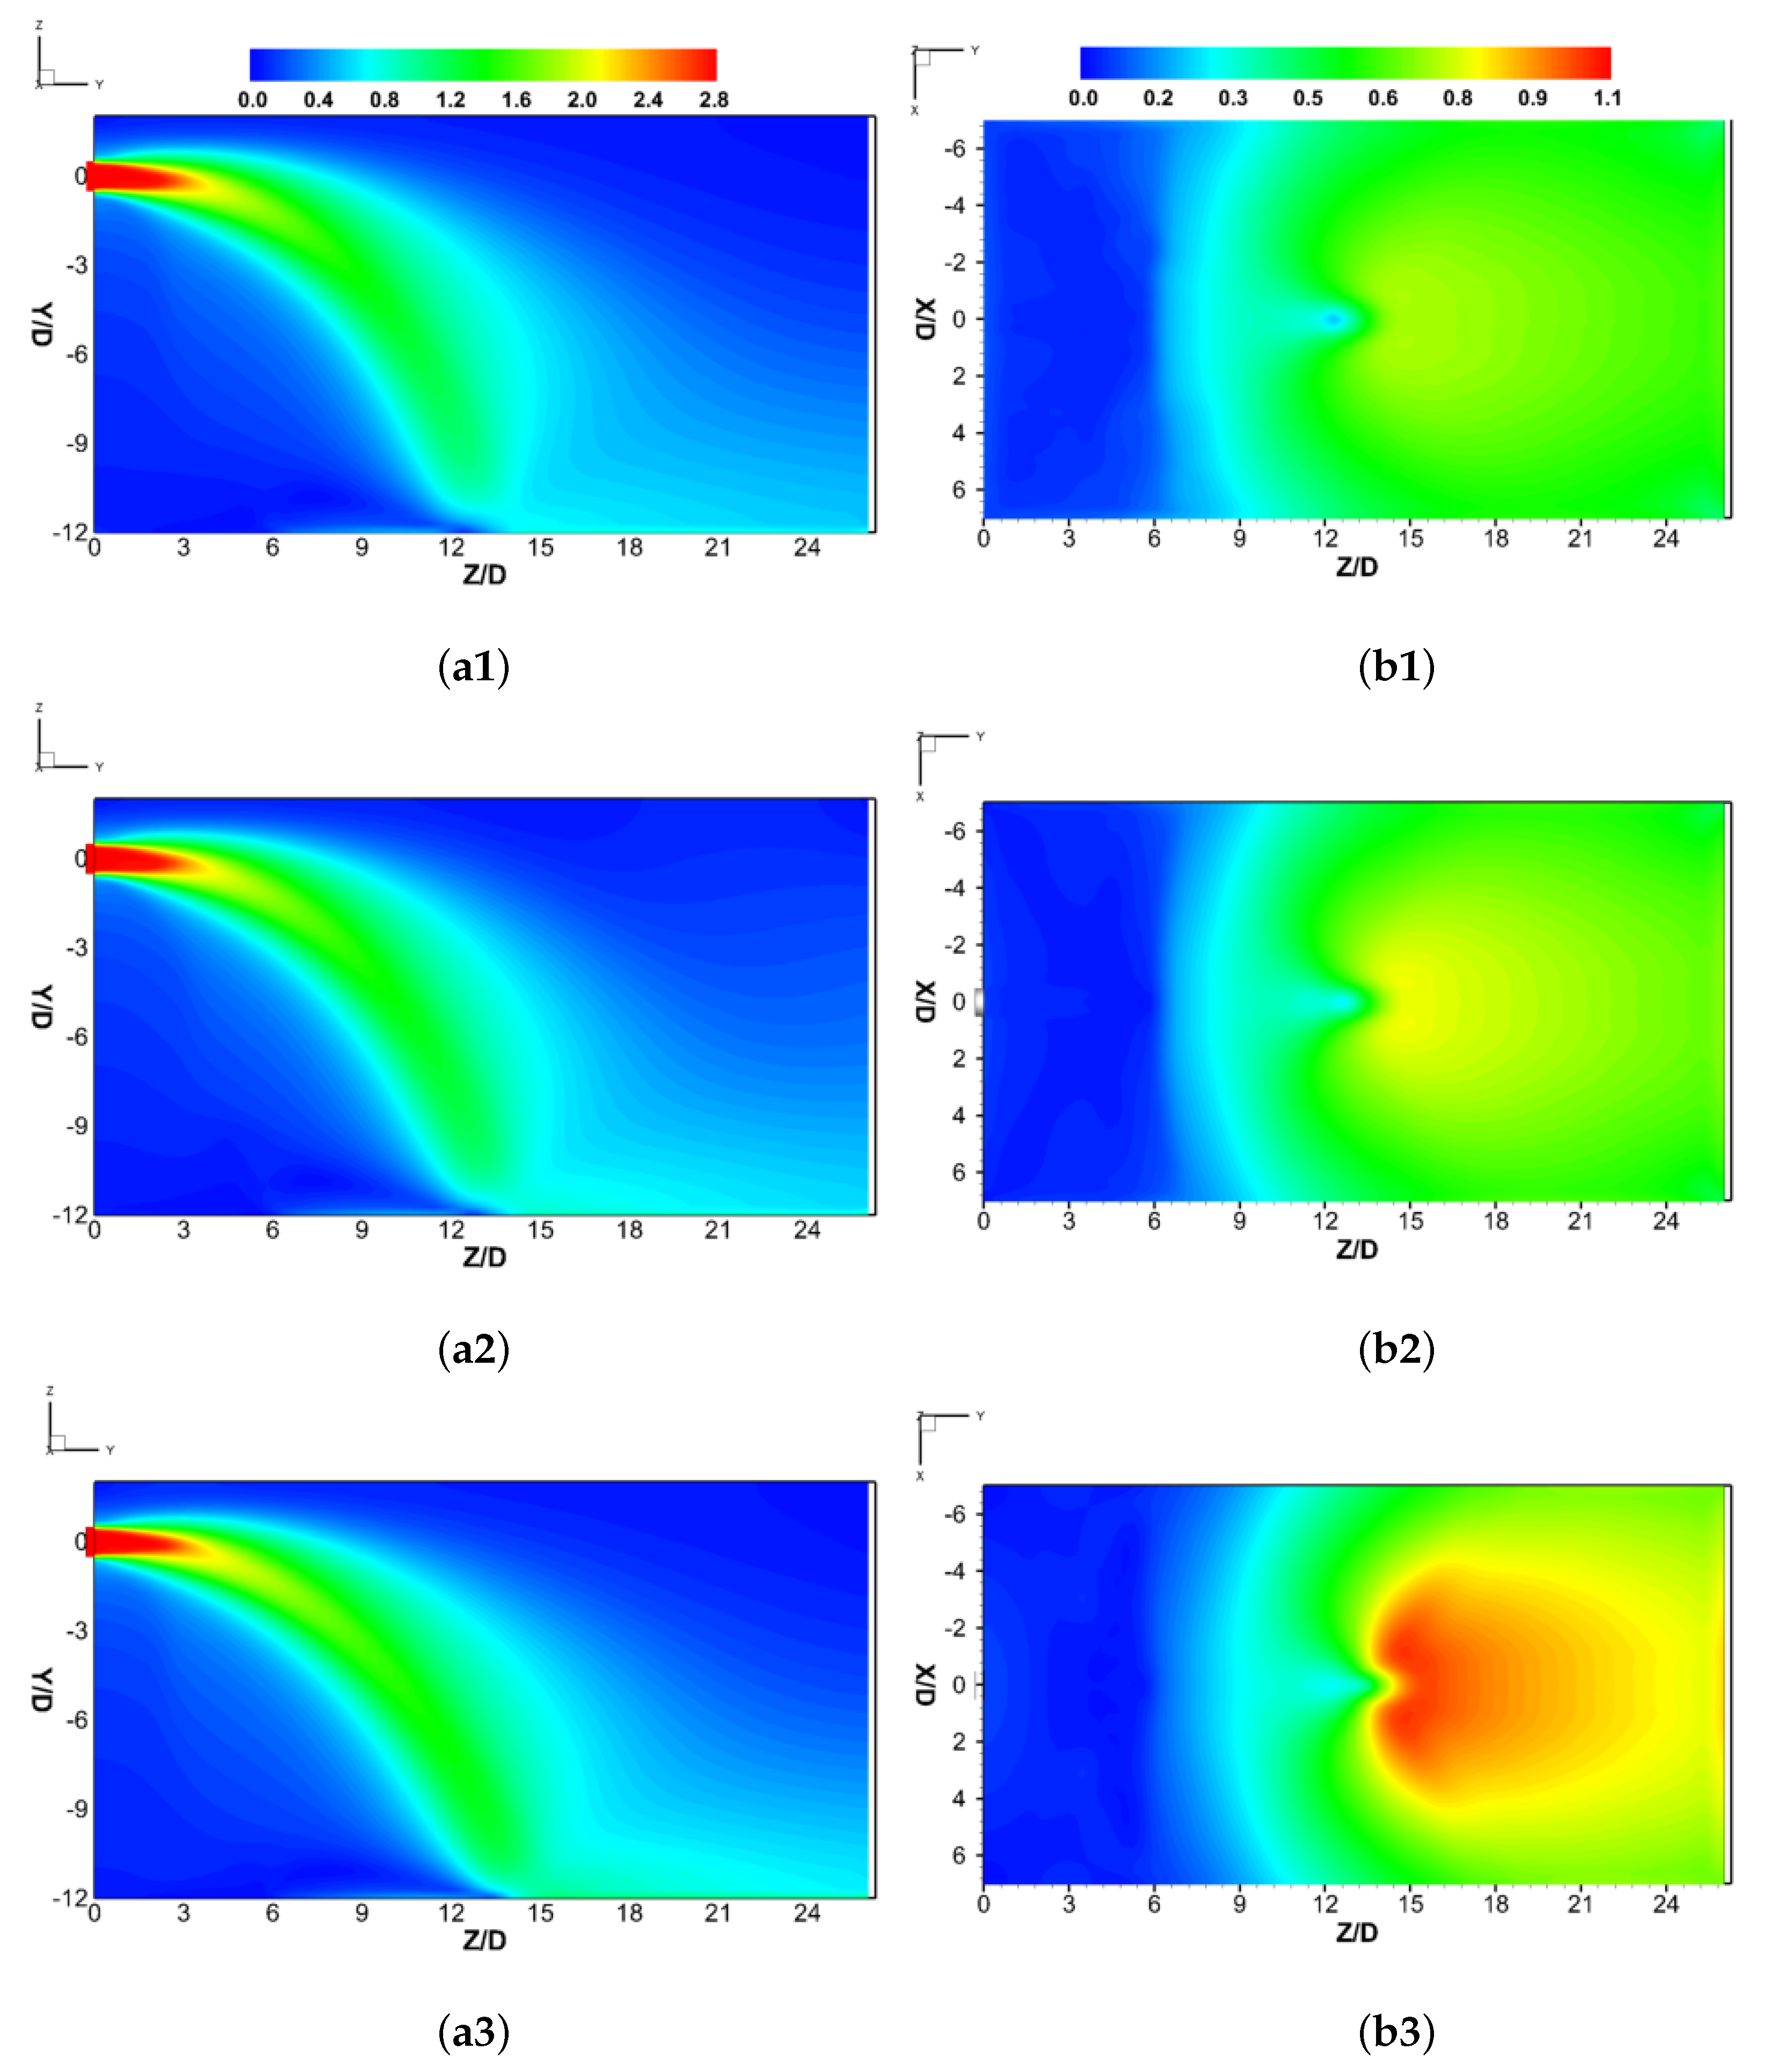
Figure 7 displays the slices of a 3D contour plot of air velocity magnitude in the middle Y-Z plane and close to the ground wall ( Y / D = −11.9) at R e = 13,466. The red color denotes the maximum value of velocity magnitude, whereas the blue color represents the minimum value of zero. The momentum and the gravity-induced instabilities affect the velocity distribution of the free powder jet. As can be seen from Figure 7a, the powder jet is developed near the outlet of the injector for a certain distance before gravitational forces takes over and causes the jet drops down toward the ground. A similar distribution of the velocity pattern can be observed for all cases in the middle of the Y-Z plane. In particular, the higher velocity zone exists behind the discharge position, while the velocity magnitude decreases significantly from 2.8 to 0.8 m/s as the powder jet widely spreads to the surrounding from the outlet of the injector. Moreover, it becomes apparent that the high velocity magnitude zone ( U a > 0.8) enlarges greatly toward the downstream close to the ground wall with the increase of the particle density from 1800 to 3340 kg/m 3 , see Figure 7b. This indicates that the influence of small change of particle density can result in large variations in the velocity field near the ground wall. The larger particle density, the intense inertia of particles, the higher velocity magnitude. On the other hand, the stagnation point can be identified at the particle landing position where the stagnation velocity is close to zero and the static pressure is at its maximum value from the Bernoulli equation.
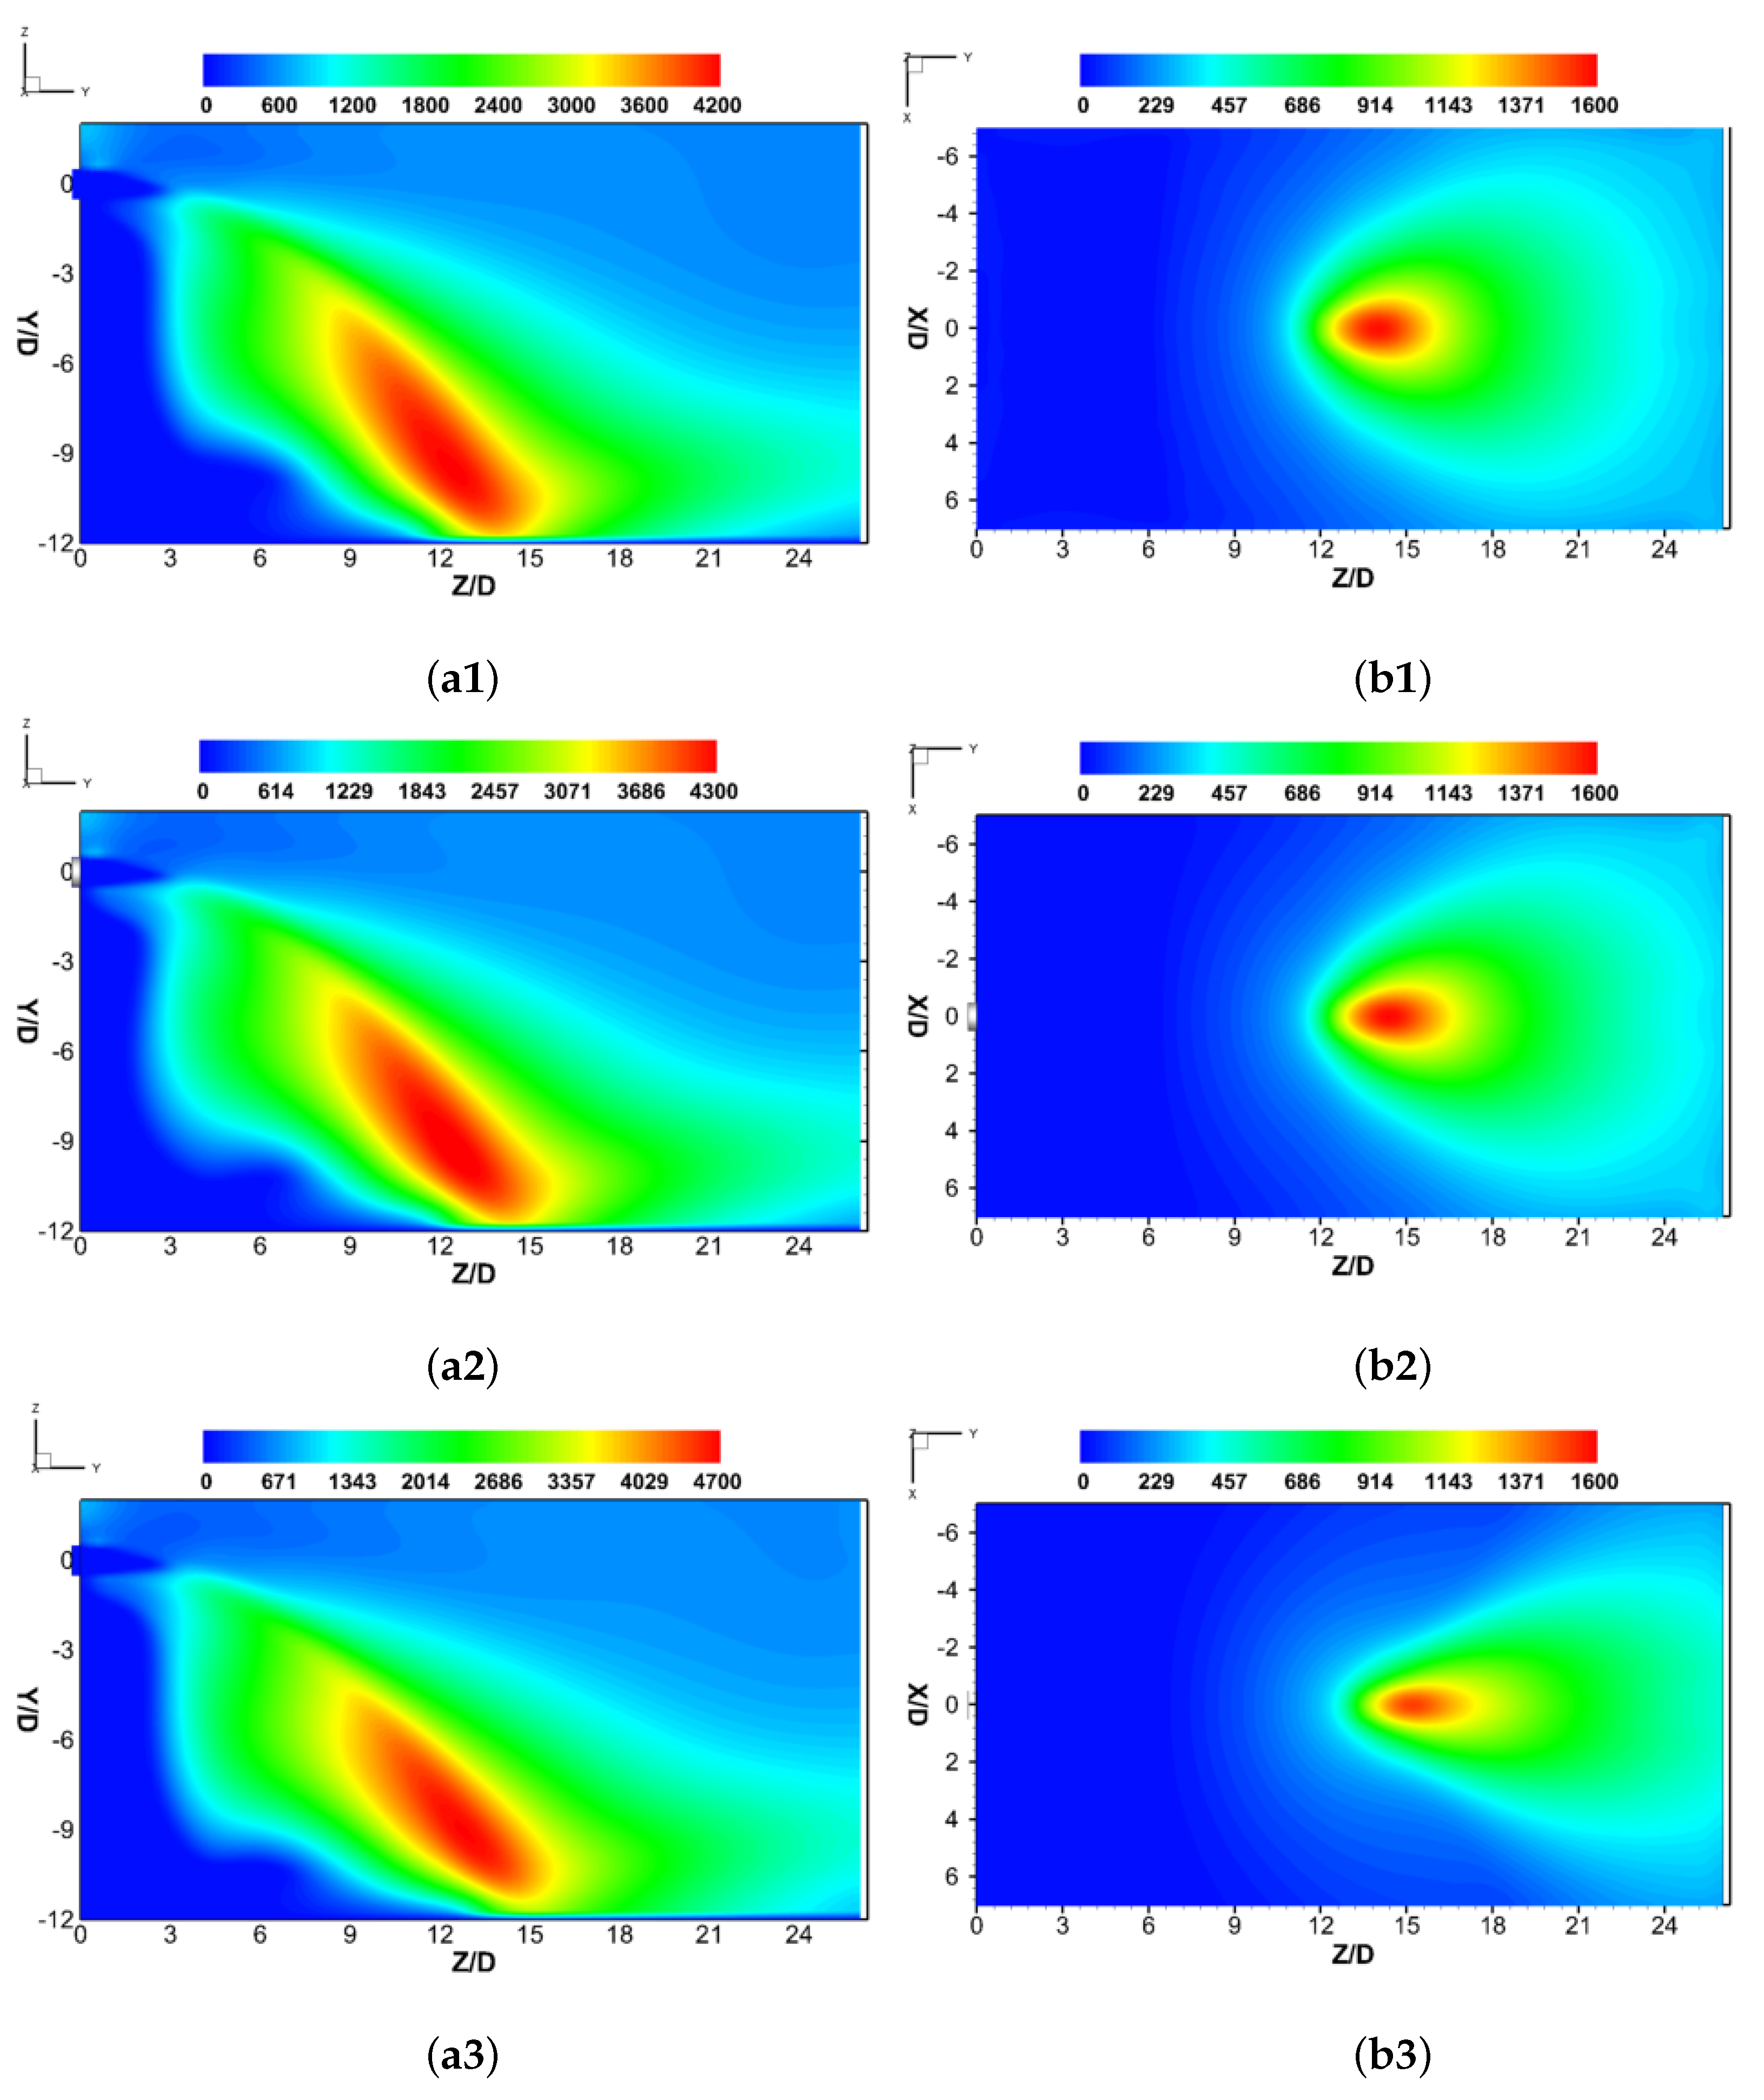
Figure 8 shows the contour plots of the turbulent viscosity ratio μ t μ o in the computational domain with different powder agents. The turbulent viscosity ratio, which is defined as the relation between the turbulent viscosity μ t and molecular viscosity μ o , is utilized to evaluate the magnitude of turbulence within the 3D simulations [15]. As illustrated in Figure 8a, all three cases exhibit a similar distribution of turbulent viscosity ratio in the middle of the Y-Z plane. However, the maximum magnitude of μ t μ o increases from 4200 to 4700 as the particle density increases from 1800 to 3340 kg/m 3 , which indicates that the higher Stokes number can enhance the turbulence intensity in the turbulent regime significantly, and also lead to a strong dispersion behavior of solid particle in the axial direction. On the other hand, Figure 8b depicts the spread of turbulent viscosity ratio near the ground at Y / D = −11.9, which is consistent with the distribution of solid volume fraction on the ground shown in Figure 6b. The turbulence viscosity is clearly seen to have a dominant influence on the structure of the particle concentration distribution. The oval-shaped intense turbulence area ( μ t μ o > 1300), which is mainly concentrated near the particle landing position for all cases, shrinks significantly by 50% from Case-1 to Case-3. Additionally, the magnitude of turbulent viscosity ratio declines greatly along the edge of the powder jet in the region between Z / D = 12 to 21 as the particle density increases from 1800 to 3340 kg/m 3 . This phenomenon is expected since the heavy particles lead to a reduction of turbulence kinetic level and a decrease of the momentum exchange in the radial direction, especially near the jet edge. Thus, more solid particles are concentrated on the central area, thereby forming a V-shaped structure of solid distribution close to the ground wall.
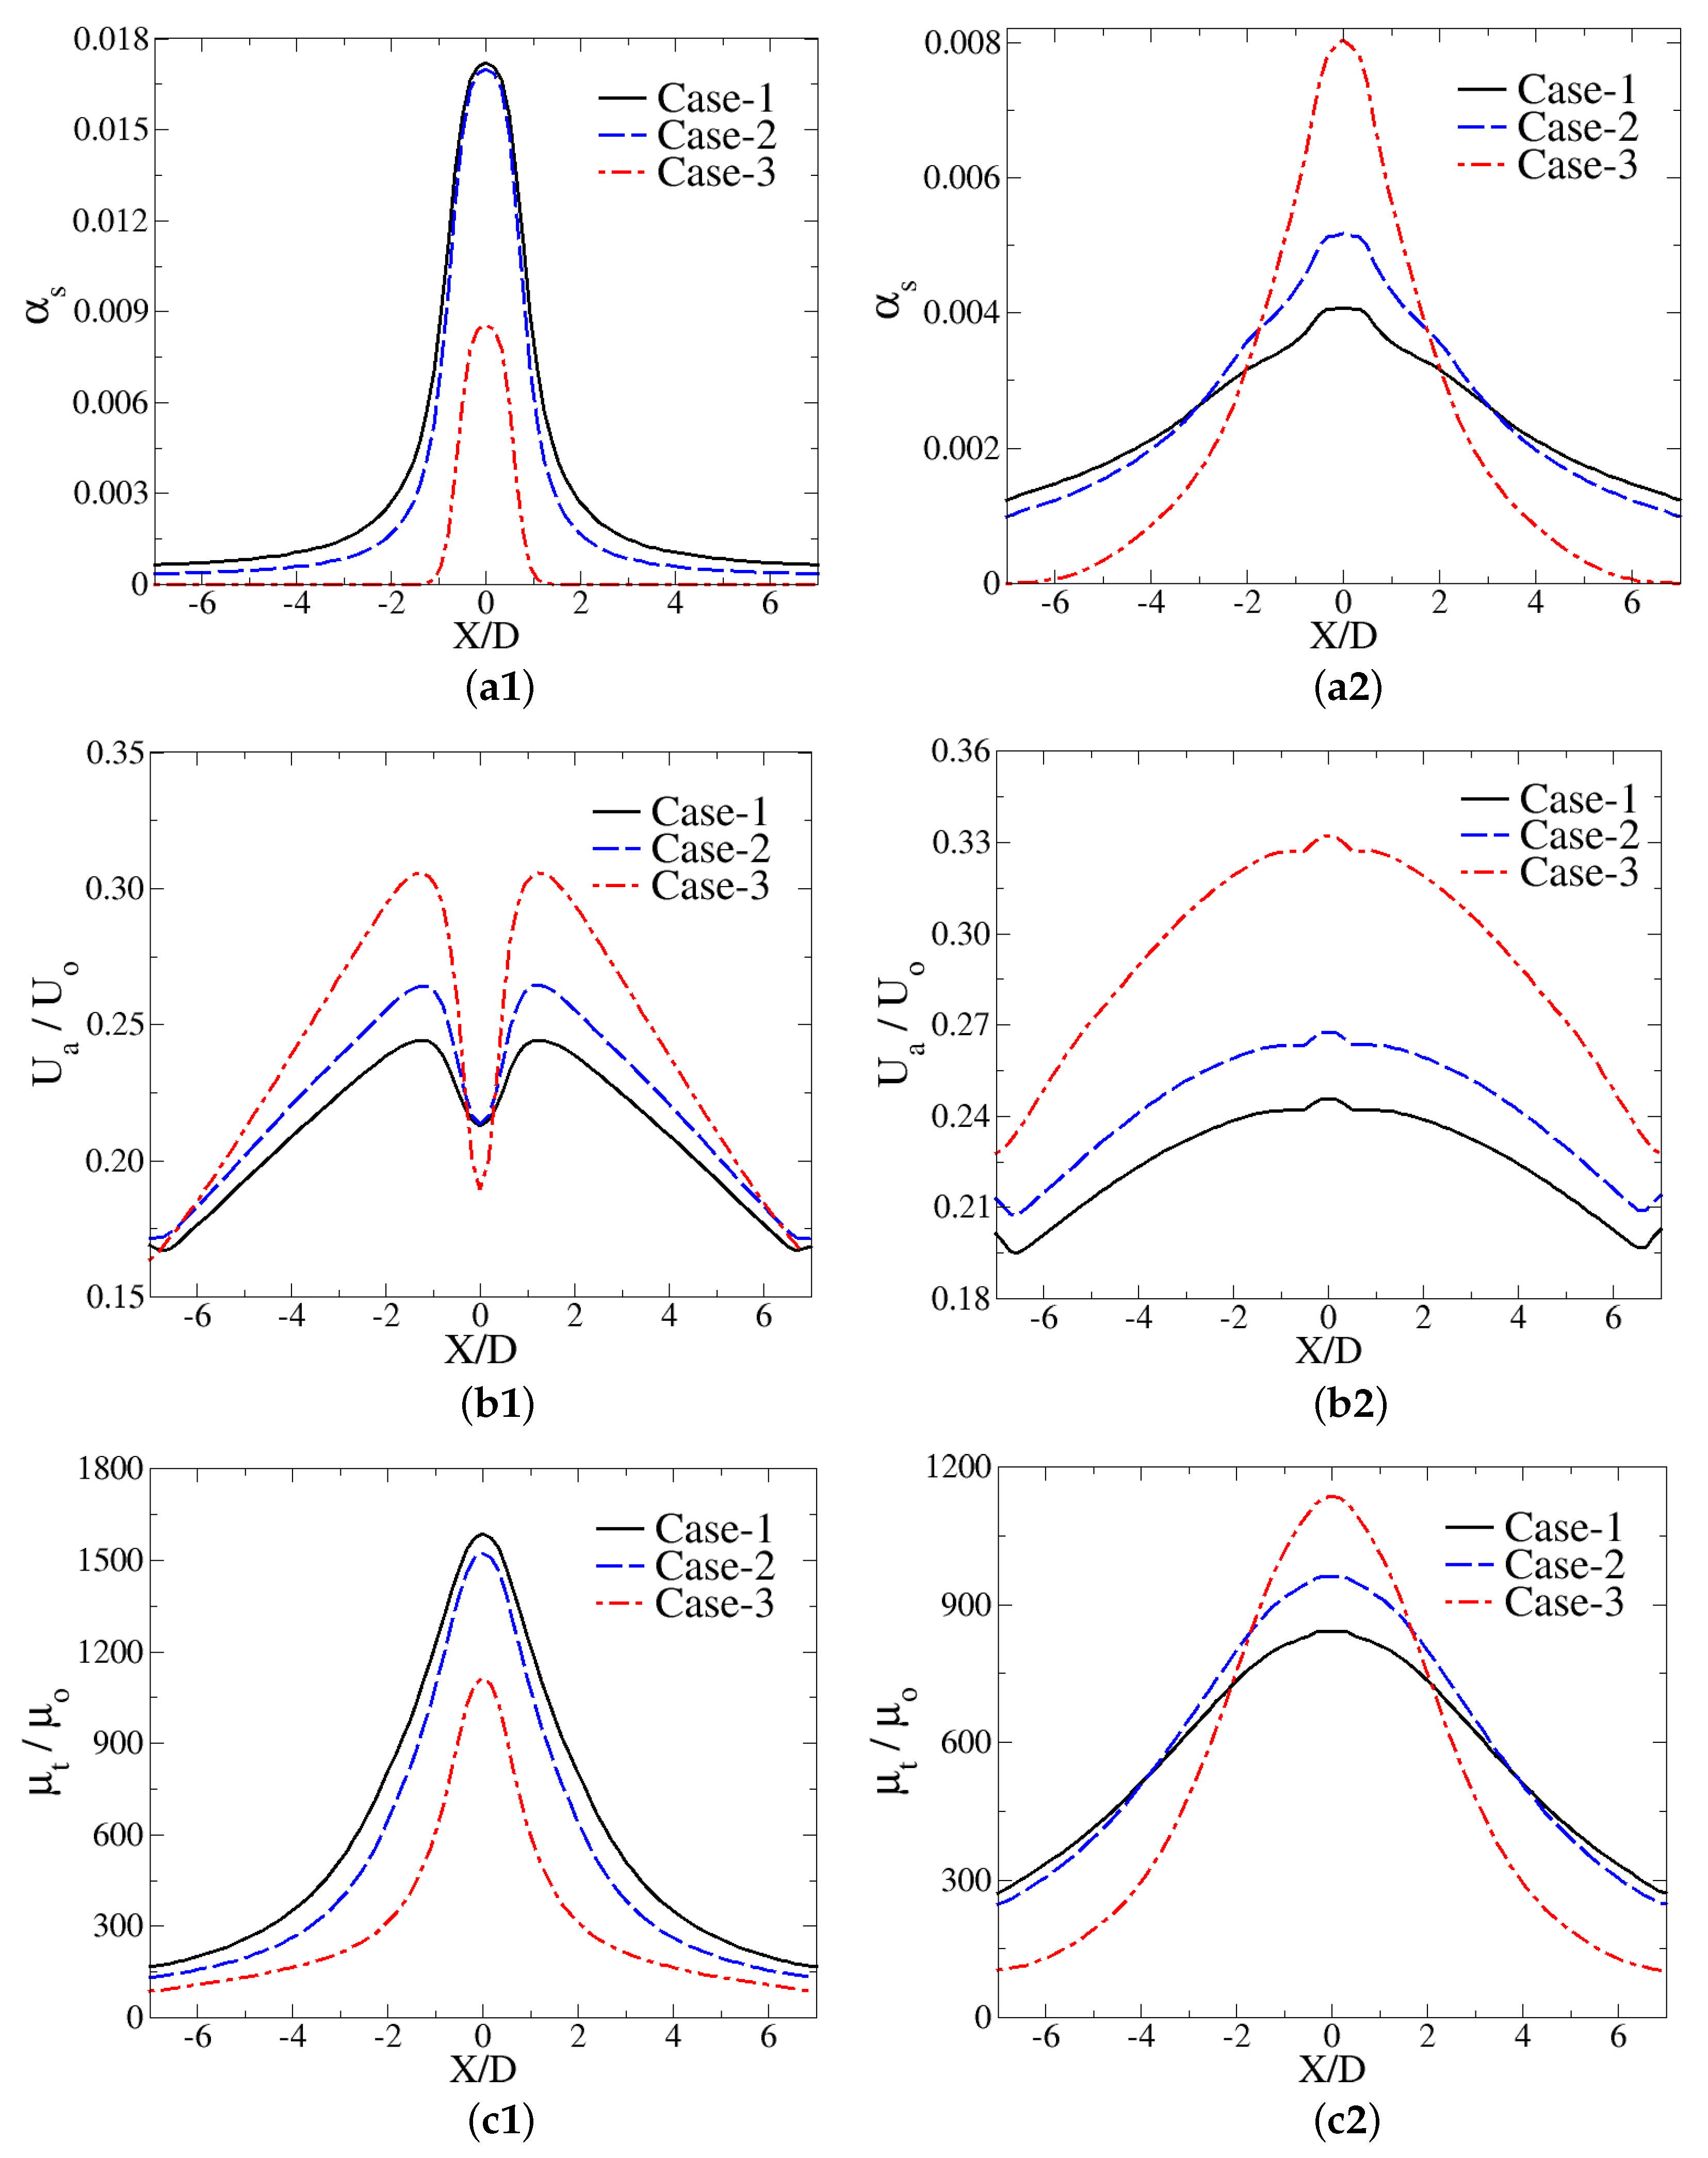
Figure 9a shows the radial distribution of the solid volume fraction for various particle agents. The solid volume fraction is larger in the central region and less in the jet edge at both positions. When compared to the solid volume fraction predicted at Z / D = 14, the spreading increases radially, and consequently more solid particles agglomerate near the edge of the jet at Z / D = 18. The ABC dry powder (Case-1) and BC dry powder (Case-2) give a highest solid concentration at Z / D = 14, while more Portland cement powder (Case-3) is accumulated in the same central region at Z / D = 18, which further confirms that the Portland cement powder has a greater ability to be discharged in a farther location than the ABC dry powder and BC dry powder.
A distinct change in the shape of the normalized air velocity profile can be observed in Figure 9b as the axial position moves from Z / D = 14 to 18. It should be noted that the stagnation point is present in the center region ( X / D = −1 to 1), as shown in Figure 9(b1), where the local velocity is significantly lower. Furthermore, it can be seen from Figure 9(b2) that the velocity fluctuation is more steady with the decrease of Stokes number from 17 (Case-3) to 9 (Case-1) at Z / D = 18. This is though to be primarily due to the fact that the momentum exchange between the jet and the surrounding air is much higher for dense powder flow with a less steep velocity profile.
Figure 9c presents the distribution of turbulent viscosity ratio at various axial locations for different cases. Based on the comparison results displayed in Figure 9(c1), Case-1 shows a higher magnitude of turbulent viscosity ratio across the X / D axis as compared to Case-2 and Case-3. However, as the powder flow disperses to the downstream, the radial dispersion of turbulence viscosity ratio is reduced significantly about 62% at the jet edge, while that increases by 34% at the center region. The decrease of turbulent viscosity ratio causes reduction in mixing, and the spreading of powder jet becomes narrower in the radial direction.
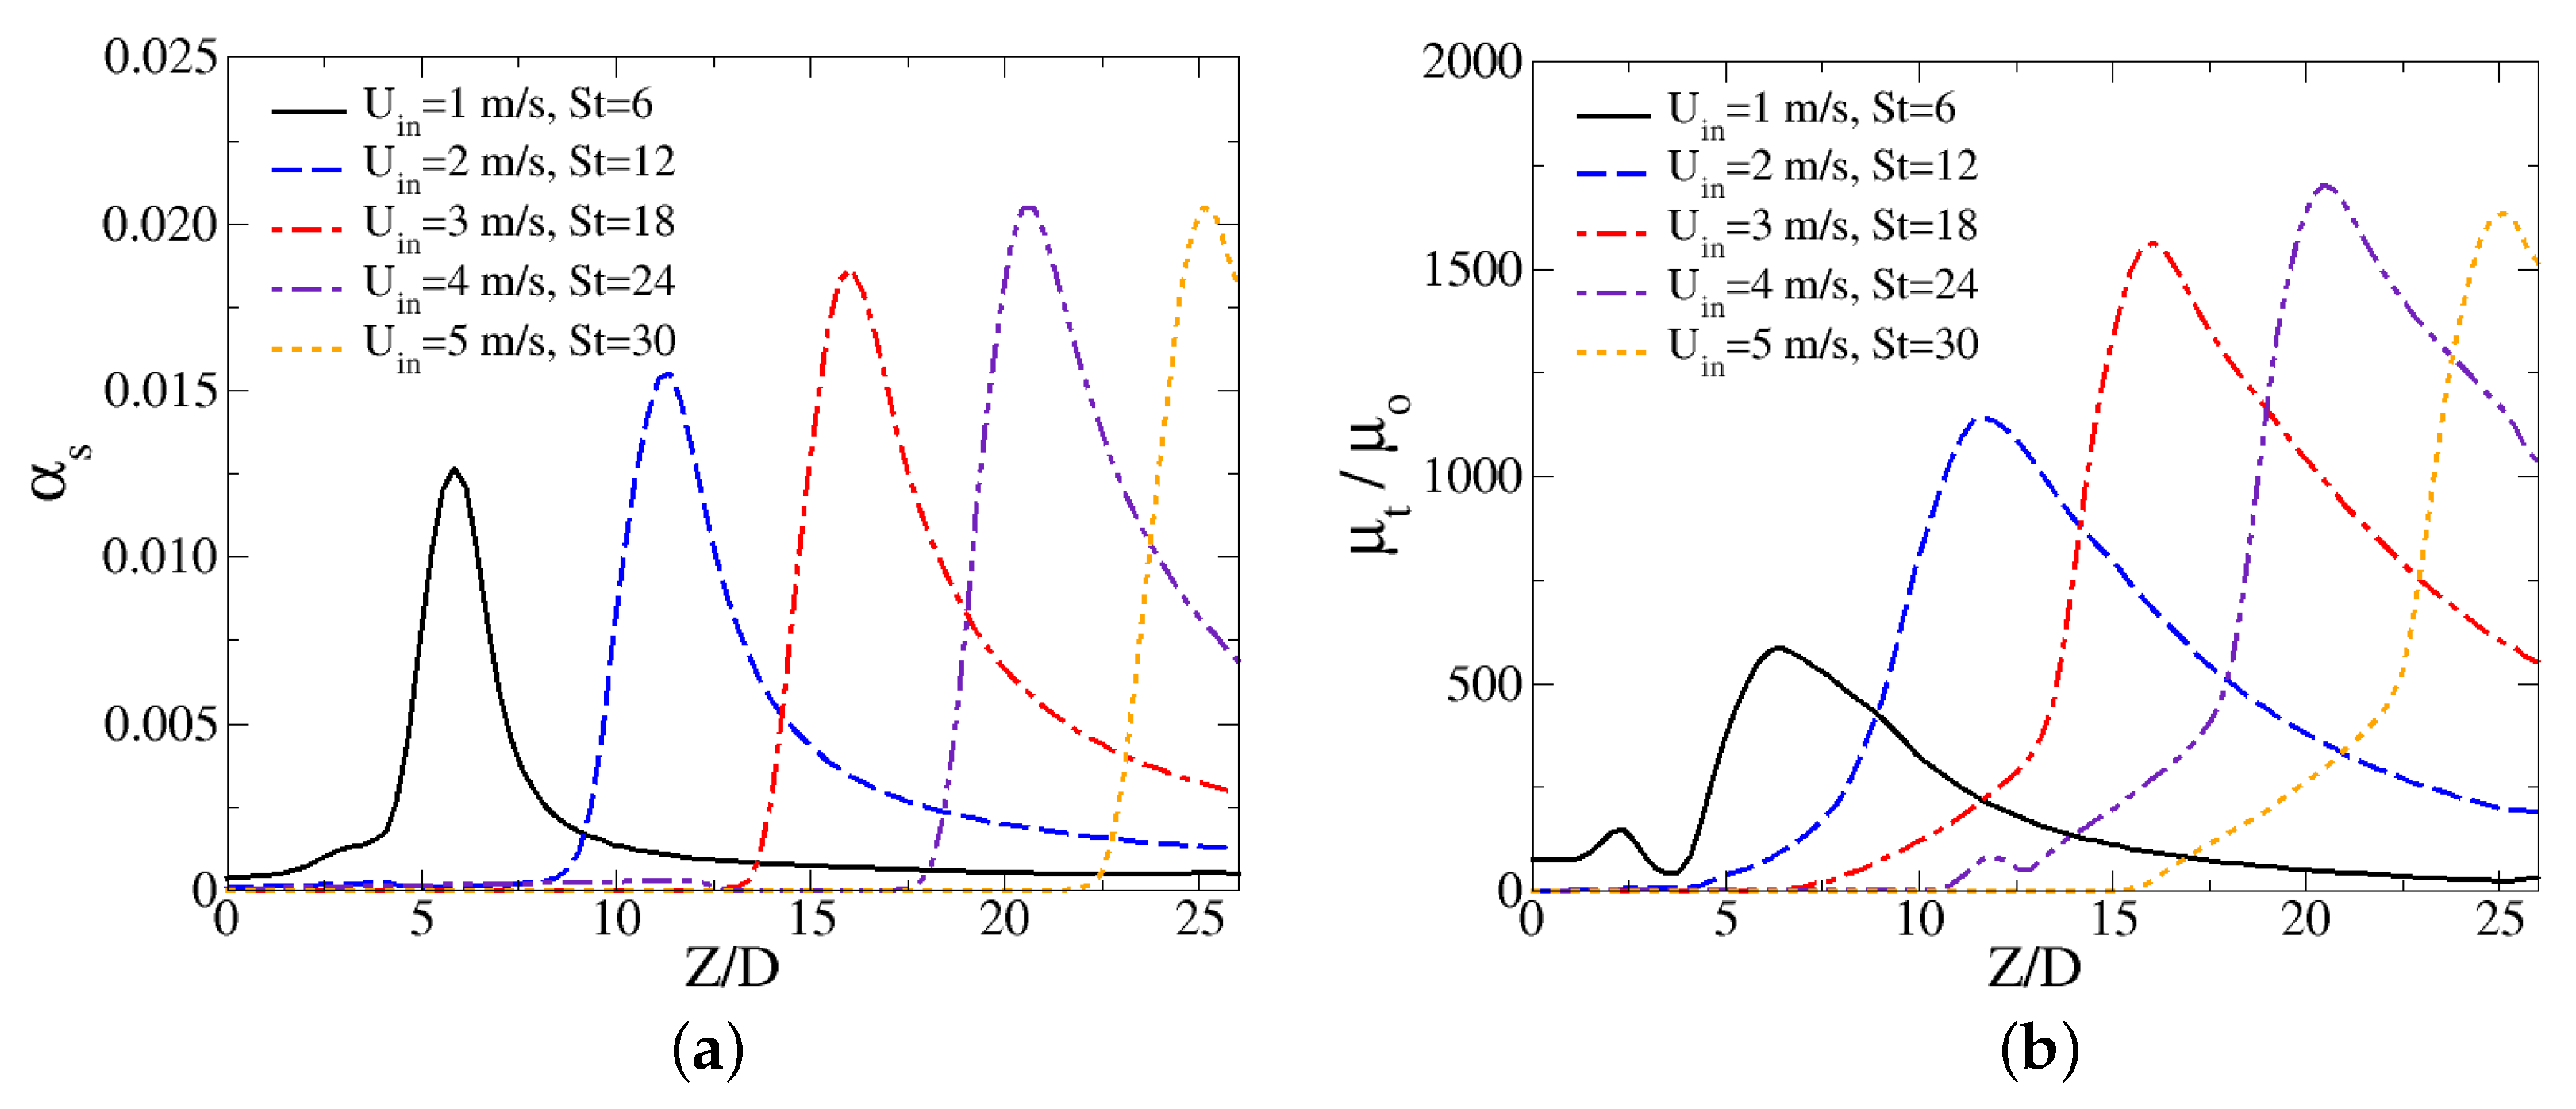
We further evaluated the discharge performance of Portland cement powder under various operating conditions. The axial distribution of solid volume fraction profile at Y / D = 11.9 and X / D = 0 is present in Figure 10a. Five different inflow velocities, U i n =1, 2, 3, 4, 5 m/s, are imparted at the entrance of the injector, corresponding to S t = 6, 12, 18, 24, 30, and R e = 73,647, 36,824, 24,550, 18,412, 14,730, respectively. As can be seen from the profile, a noticeable narrow peak in the solid volume fraction profile is captured for all cases. This peak corresponds to the particle landing position. It is seen that the particle landing position moves from Z / D = 5.8 to Z / D = 25.1 as the inlet velocity increases from 1 to 5 m/s. This is due to an increase in jet momentum, while the gravitational force is not strong enough to cause a lower deviation of the jet. Additionally, we found that the solid volume fraction increases by approximately 61% with the increase from inlet velocity, which suggests that more solid particles are concentrated in the particle landing positions at higher Stokes number. Figure 10b illustrates the axial distribution of turbulent viscosity ratio profile under the same operating conditions. It is clearly seen that the maximum value of μ t μ o increases by about 180% with the increase of inlet flow velocity from 1 to 5 m/s. This phenomenon indicates that the high level of turbulence intensity enhances the solid dispersion concentration on the particle landing position.

6. Concluding Remarks

This work presents the results of experimental and numerical investigation of the discharge performance of the dry chemical powder jet from a horizontal injector with a wide range of Stokes numbers between 6 to 30 and Reynolds numbers between 4792 to 23,960. The 3D-CFD Eulerian–Eulerian multiphase model coupled with Standard k- ω turbulence model available in ANSYS FLUENT 17.0 were employed to reproduce the experiments. The performance of ABC dry powder, BC dry powder, and Portland cement powder were evaluated based on the criterion of powder discharge range and dispersion concentration. The numerical results on the particle landing position have a good agreement with the experiment data, with a deviation within 5%. The main conclusions of this study include the following:
(1)
The particle density significantly affects the hydrodynamic patterns and the discharge performance. With an increase in particle density from 1800 to 3340 kg/m 3 , the particle landing position moves farther by 12% and the spread of powder jet becomes narrower with a transition from U-shaped to V-shaped structure over the ground.
(2)
The stagnation point is formed as the powder jet flow hits the ground. The higher level of inertia leads to the expansion of high air velocity magnitude area ( U a > 0.8) behind the stagnation point, while the intense turbulence area ( μ t μ o > 1300) shrinks by 50% due to the reduction of momentum exchange in the radial direction.
(3)
As the inflow velocity increases from 1 to 5 m/s, the turbulent viscosity ratio rises by 180%, and the solid dispersion concentration increases by 61% on the particle laden position, which indicates that the high level of turbulence intensity enhances the solid dispersion concentration.
(4)
The comparison results demonstrate that the Portland cement powder exhibits better performance in terms of discharge range and dispersion concentration in comparison with ABC dry powder and BC dry powder, which is favorable to suppress the gasoline and diesel fire during the marine transportation process.
Our findings may shed light on a wide range of fire suppression applications with the use of Portland cement powder. Further investigations should focus on the in-depth research on the fire extinguishing mechanism of the Portland cement powder, especially the fire suppression effectiveness and thermal decomposition process, which may provide an understanding of the fundamental physical and chemical mechanism of dry chemical powder that governs the complex marine-based fire exhausting system.

Author Contributions

Writing—review & editing, H.S.; Software, H.S.; Validation, H.S.; Visualization, H.S.; Experiment, Q.X. and G.Z.; Supervision, X.W. and L.X.; Conceptualization, L.X. All authors have read and agreed to published version of the manuscript.

Funding

Financial supports from the National Natural Science Foundation of China (Project No. 52106043, No. 52079057), the MEM Key Laboratory Open Project (2019XFZB10), and the Senior Talent Foundation of Jiangsu University, China (No. 20JDG058) are greatly appreciated.

Acknowledgments

A huge thanks is due to the editor and reviewers for their valuable comments to improve the quality of this paper.

Conflicts of Interest

The authors declare no conflict of interest.

Nomenclature

The following abbreviations are used in this manuscript:
A t c total solid concentration coverage area
A h c highest solid concentration coverage area
A g ground area
C D drag coefficient
Ddiameter of injector
D p diameter of particle
D 50 medium diameter of particle
e s s coefficient of restitution
gacceleration due to gravity
g 0 , s s radial distribution function
K p q fluid–fluid exchange coefficient
K l s fluid–solid exchange coefficient
k-εK-Epsilon turbulence model
k-ωK-Omega turbulence model
Ppressure
R e Reynolds number
S t Stokes number
U a air velocity
U i n upstream flow velocity
Greek Symbols
α volume fraction
γ θ s collisional energy dissipation
λ s bulk viscosity of solid phase
μ viscosity
μ s solid shear viscosity
μ s , c o l solid collisional viscosity
μ s , k i n solid kinetic viscosity
μ s , f r frictional viscosity
ω specific dissipation rate
ε dissipation of turbulence energy rate
ρ density
τ particle relaxation time
τ ¯ ¯ q q th phase stress-strain tensor
Θ q granular temperature
φ s w specularity coefficient
Subscripts
aair phase
ggas phase
pphase p
qphase q
ssolid phase

References

  1. Darbra, R.M.; Casal, J. Historical analysis of accidents in seaports. Saf. Sci. 2004, 42, 85–98. [Google Scholar] [CrossRef]
  2. Li, H.; Du, D.; Guo, X.; Hua, M.; Pan, X. Experimental study on the optimum concentration of ferrocene in composite ultrafine dry powder. Fire Technol. 2020, 56, 913–936. [Google Scholar] [CrossRef]
  3. Haiqiang, L.; Ruowen, Z.; Jiaxin, G.; Siuming, L.; Yuan, H. A good dry powder to suppress high building fires. APCBEE Procedia 2014, 9, 291–295. [Google Scholar] [CrossRef] [Green Version]
  4. Li, H.; Hua, M.; Pan, X.; Li, S.; Guo, X.; Zhang, H.; Jiang, J. The reaction pathway analysis of phosphoric acid with the active radicals: A new insight of the fire-extinguishing mechanism of ABC dry powder. J. Mol. Model. 2019, 25, 1–12. [Google Scholar] [CrossRef]
  5. Zhang, C.; Li, H.; Guo, X.; Li, S.; Zhang, H.; Pan, X.; Hua, M. Experimental and theoretical studies on the effect of Al(OH)3 on the fire-extinguishing performance of superfine ABC dry powder. Powder Technol. 2021, 393, 280–290. [Google Scholar] [CrossRef]
  6. Wang, X.; Zheng, X.; Wang, P. Direct numerical simulation of particle-laden plane turbulent wall jet and the influence of Stokes number. Int. J. Multiph. Flow 2017, 92, 82–92. [Google Scholar] [CrossRef]
  7. Liu, H.K.; Shi, Z.H.; Li, W.F.; Liu, H.F.; Wang, F.C. Asymmetric oscillation of pressurized dense gas-solid jet in a two-dimensional nozzle. Powder Technol. 2021, 392, 601–609. [Google Scholar] [CrossRef]
  8. Pokharel, A.; Akkerman, V.; Celik, I.B.; Axelbaum, R.L.; Islas, A.; Yang, Z. Impact of particle loading and phase coupling on gas–solid flow dynamics: A case study of a two-phase, gas–solid flow in an annular pipe. Phys. Fluids 2021, 33, 073308. [Google Scholar] [CrossRef]
  9. Lau, T.C.; Nathan, G.J. The effect of Stokes number on particle velocity and concentration distributions in a well-characterised, turbulent, co-flowing two-phase jet. J. Fluid Mech. 2016, 809, 72–110. [Google Scholar] [CrossRef] [Green Version]
  10. Kuang, K.; Huang, X.; Liao, G. A comparison between superfine magnesium hydroxide powders and commercial dry powders on fire suppression effectiveness. Process Saf. Environ. Prot. 2008, 86, 182–188. [Google Scholar] [CrossRef]
  11. Yang, D.; Xing, B.; Li, J.; Wang, Y.; Gao, K.; Zhou, F.; Xia, Y.; Wang, C. Experimental study on the injection performance of the gas-solid injector for large coal particles. Powder Technol. 2020, 364, 879–888. [Google Scholar] [CrossRef]
  12. AbdEl-Hamid, A.; Mahmoud, N.; Hamed, M.H.; Hussien, A. Gas-solid flow through the mixing duct and tail section of ejectors: Experimental studies. Powder Technol. 2018, 328, 148–155. [Google Scholar] [CrossRef]
  13. Fang, C.; Xu, J.; Zhao, H.; Li, W.; Liu, H. Influences of the wall thickness on the granular dispersion in a dense gas–solid coaxial jet. Int. J. Multiph. Flow 2016, 81, 20–26. [Google Scholar] [CrossRef]
  14. Shi, H.; Komrakova, A.; Nikrityuk, P. Fluidized beds modeling: Validation of 2D and 3D simulations against experiments. Powder Technol. 2019, 343, 479–494. [Google Scholar] [CrossRef]
  15. Shi, H.; Reza, M.O.; Nikrityuk, P.A. The impact of swirling on the dynamics of a spouted bed. Powder Technol. 2021, 380, 143–151. [Google Scholar] [CrossRef]
  16. Davarpanah, M.; Shi, H.; Nikrityuk, P.; Hashisho, Z. Verification of semi-empirical relations for predicting fluidization in a fluidized bed using CFD. Chem. Eng. Res. Des. 2021, 173, 289–304. [Google Scholar] [CrossRef]
  17. Peng, X.; Wang, J.; Zuo, H.; Xue, Q. Evolution and physical characteristics of a raceway based on a transient Eulerian multiphase flow model. Processes 2020, 8, 1315. [Google Scholar] [CrossRef]
  18. Jebakumar, A.S.; Abraham, J. Comparison of the structure of computed and measured particle-laden jets for a wide range of Stokes numbers. Int. J. Heat Mass Transf. 2016, 97, 779–786. [Google Scholar] [CrossRef]
  19. Tavangar, T.; Tofighian, H.; Tarokh, A. Investigation of the Horizontal Motion of Particle-Laden Jets. Computation 2020, 8, 23. [Google Scholar] [CrossRef] [Green Version]
  20. Patro, P.; Dash, S.K. Computations of particle-laden turbulent jet flows based on Eulerian model. J. Fluids Eng. 2014, 136, 011301. [Google Scholar] [CrossRef]
  21. Zhang, X.; Chin, R.C. A Numerical Study of the Effects of the Velocity Ratio on Coflow Jet Characteristics. J. Fluids Eng. 2020, 142, 081401. [Google Scholar] [CrossRef]
  22. Zhang, W.; Tainaka, K.; Ahn, S.; Watanabe, H.; Kitagawa, T. Experimental and numerical investigation of effects of particle shape and size distribution on particles’ dispersion in a coaxial jet flow. Adv. Powder Technol. 2018, 29, 2322–2330. [Google Scholar] [CrossRef]
  23. Ibrahim, H.; Patruni, J.R. Experimental assessment on LPG fire extinguishing properties of three chemical powders before and after milling action. Fire Mater. 2020, 44, 747–756. [Google Scholar] [CrossRef]
  24. Shi, H.; Li, M.; Nikrityuk, P.; Liu, Q. Experimental and numerical study of cavitation flows in venturi tubes: From CFD to an empirical model. Chem. Eng. Sci. 2019, 207, 672–687. [Google Scholar] [CrossRef]
  25. Shi, H.; Li, M.; Liu, Q.; Nikrityuk, P. Experimental and numerical study of cavitating particulate flows in a venturi tube. Chem. Eng. Sci. 2020, 219, 115598. [Google Scholar] [CrossRef]
  26. Sandler, N.; Reiche, K.; Heinämäki, J.; Yliruusi, J. Effect of moisture on powder flow properties of theophylline. Pharmaceutics 2010, 2, 275–290. [Google Scholar] [CrossRef] [Green Version]
  27. Emery, E.; Oliver, J.; Pugsley, T.; Sharma, J.; Zhou, J. Flowability of moist pharmaceutical powders. Powder Technol. 2009, 189, 409–415. [Google Scholar] [CrossRef]
  28. Bravo-Osuna, I.; Ferrero, C.; Jiménez-Castellanos, M. Influence of moisture content on the mechanical properties of methyl methacrylate–starch copolymers. Eur. J. Pharm. Biopharm. 2007, 66, 63–72. [Google Scholar] [CrossRef]
  29. Syamlal, M.; O’Brien, T. The Derivation of a Drag Coefficient Formula from Velocity-Voidage Correlations; Technical Note; US Department of Energy, Office of Fossil Energy, NETL: Morgantown, WV, USA, 1987.
  30. Syamlal, M.; Rogers, W.; O’Brien, T. MFIX Documentation: Volume 1, Theory Guide; Technical Report, DOE/METC-9411004, NTIS/DE9400087; National Technical Information Service: Springfield, VA, USA, 1993.
  31. Ding, J.; Gidaspow, D. A bubbling fluidization model using kinetic theory of granular flow. AIChE J. 1990, 36, 523–538. [Google Scholar] [CrossRef]
  32. Gidaspow, D.; Bezburuah, R.; Ding, J. Hydrodynamics of Circulating Fluidized Beds: Kinetic Theory Approach; Technical Report; Illinois Institute of Technology: Chicago, IL, USA, 1991. [Google Scholar]
  33. Lun, C.; Savage, S.B.; Jeffrey, D.; Chepurniy, N. Kinetic theories for granular flow: Inelastic particles in Couette flow and slightly inelastic particles in a general flowfield. J. Fluid Mech. 1984, 140, 223–256. [Google Scholar] [CrossRef]
  34. Wilcox, D.C. Turbulence Modeling for CFD; DCW Industries: La Canada, CA, USA, 1998; Volume 2. [Google Scholar]
  35. Shi, H.; Wang, X.; Liu, Q.; Nikrityuk, P. The influence of inflow swirls on phases separation in a Venturi tube. Sep. Purif. Technol. 2021, 281, 119954. [Google Scholar] [CrossRef]
Figure 1. The powder jet fire suppression system: (a) full scale fires and (b) laboratory scale fires.
Jmse 10 00085 g001
Figure 2. Schematics of the horizontal particle-laden flow system.
Jmse 10 00085 g002
Figure 3. Experimental setup: (a) particle-laden flow system, (b) injector, and (c) particle collection area.
Jmse 10 00085 g003
Figure 4. The left view—(a) and front view—(b) of the computational domain and mesh structure of Grid-2 (456,000 cells).
Jmse 10 00085 g004
Figure 5. (a)—radial variation of the dimensional air velocity at Z/D = 3 and Y/D = 0, (b)—experimental and predicted particle landing position under various inlet velocities for Grid-1 (260,092 cells), Grid-2 (793,244 cells), and Grid-3 (2,445,465 cells); (c)—experimental and predicted particle landing position under various inlet velocities for different turbulence models.
Jmse 10 00085 g005
Figure 6. 3D view of the iso-surface contours of solid volume fraction for Case-1 to Case-3 (a1a3) and 2D view of contours of solid volume fraction on the ground wall for Case-1 to Case-3 (b1b3).
Jmse 10 00085 g006
Figure 7. Contour plots of air velocity magnitude in the Y-Z middle plane for Case-1 to Case-3 (a1a3) and near the ground wall surface for Case-1 to Case-3 (b1b3).
Jmse 10 00085 g007
Figure 8. Contour plots of turbulent viscosity ratio in the Y-Z middle plane for Case-1 to Case-3 (a1a3) and near the ground wall surface for Case-1 to Case-3 (b1b3).
Jmse 10 00085 g008
Figure 9. Predicted solid volume fraction profiles at Z / D = 14 —(a1) and Z / D = 18 —(a2); dimensionless air velocity profiles at Z / D = 14 —(b1) and Z / D = 18 —(b2); turbulent viscosity ratio profiles at Z / D = 14 —(c1) and Z / D = 18 —(c2).
Jmse 10 00085 g009
Figure 10. Predicted solid volume fraction (a) and turbulent viscosity ratio (b) profiles along Z / D near the ground.
Jmse 10 00085 g010
Table 1. Parameters of simulation cases performed in this study.
CaseMaterial ρ p U in St Re
(kg/m 3 )(m/s)
1ABC powder18002.81913,466
2BC powder22002.811113,466
3Portland cement powder33402.811713,466
4Portland cement powder3340164792
5Portland cement powder33402129584
6Portland cement powder334031814,376
7Portland cement powder334042419,168
8Portland cement powder334053023,960
Publisher’s Note: MDPI stays neutral with regard to jurisdictional claims in published maps and institutional affiliations.

