Article

Fisheries Reference Point and Stock Status of Croaker Fishery (Sciaenidae) Exploited from the Bay of Bengal, Bangladesh

by
Partho Protim Barman
1,2,
Md. Mostafa Shamsuzzaman
2,
Petra Schneider
3,
Mohammad Mojibul Hoque Mozumder
4 and
Qun Liu
1,*
1
College of Fisheries, Ocean University of China, Qingdao 266003, China
2
Department of Coastal and Marine Fisheries, Sylhet Agricultural University, Sylhet 3100, Bangladesh
3
Department for Water, Environment, Civil Engineering and Safety, University of Applied Sciences Magdeburg-Stendal, Breitscheidstraße 2, D-39114 Magdeburg, Germany
4
Helsinki Institute of Sustainability Science (HELSUS), Fisheries and Environmental Management Group, Faculty of Biological & Environmental Sciences, University of Helsinki, 00014 Helsinki, Finland
*
Author to whom correspondence should be addressed.
J. Mar. Sci. Eng. 2022, 10(1), 63; https://doi.org/10.3390/jmse10010063
Submission received: 4 November 2021 / Revised: 31 December 2021 / Accepted: 1 January 2022 / Published: 5 January 2022
(This article belongs to the Special Issue Coastal Fish Research II)

Abstract

:
This research evaluated fisheries reference points and stock status to assess the sustainability of the croaker fishery (Sciaenidae) from the Bay of Bengal (BoB), Bangladesh. Sixteen years (2001–2016) of catch-effort data were analyzed using two surplus production models (Schaefer and Fox), the Monte Carlo method (CMSY) and the Bayesian state-space Schaefer surplus production model (BSM) method. This research applies a Stock–Production Model Incorporating Covariates (ASPIC) software package to run the Schaefer and Fox model. The maximum sustainable yield (MSY) produced by all models ranged from 33,900 to 35,900 metric tons (mt), which is very close to last year’s catch (33,768 mt in 2016). The estimated B > BMSY and F < FMSY indicated the safe biomass and fishing status. The calculated F/FMSY was 0.89, 0.87, and 0.81, and B/BMSY was 1.05, 1.07, and 1.14 for Fox, Schaefer, and BSM, respectively, indicating the fully exploited status of croaker stock in the BoB, Bangladesh. The representation of the Kobe phase plot suggested that the exploitation of croaker stock started from the yellow (unsustainable) quadrant in 2001 and gradually moved to the green (sustainable) quadrant in 2016 because of the reduction in fishing efforts and safe fishing pressure after 2012. Thus, this research suggests that the current fishing pressure needs to be maintained so that the yearly catch does not exceed the MSY limit of croaker. Additionally, specific management measures should implement to guarantee croaker and other fisheries from the BoB.

1. Introduction

Croakers, locally called Jewfish or Poa mash, are among the largest groups of commercially important fishes exploited from Bangladesh’s Bay of Bengal (BoB) water [1,2,3]. Croakers are under the Perciformes order and belong to the family Sciaenidae [4]. There are 20 species of Corkers under 12 genera that have been reported from the marine water of Bangladesh [5]. Johnius is the most dominant genus of croakers. The most abundant species of croaker are Johnius belangerii (Belanger’s croaker), J. elongates (Spindle croaker), J. dussumieri (Bearded croaker), Otolithes cuvieri (Lesser tiger-tooth croaker), Otolithoides pama (Pama croaker), Pennahia anea (Greyfin croaker), and Protonibea diacanthus (Spotted croaker). These seven species of croakers play a vital role in Bangladesh’s national economy [3,5].
Croakers are bottom-dwelling carnivore fishes distributed in the shallow coastal and marine waters of the BoB. While juvenile croakers are found in coastal water, adults can move toward shallow water of the BoB, where maximum commercial fishing occurs [3,4]. They are harvested by artisanal and industrial fishers in which the fishery is caught by bottom trawl, gillnet, and long lines [5]. This fishery accounts for about 12.8% of the entire demersal fish population in Bangladesh’s exclusive economic zone (EEZ). In comparison, 66.5% of demersal fishes found on the continental shelf are within 20 m of water depth. This fishery contributed 6.3% of the total marine catches from the BoB [6]. In Bangladesh, people consume about 50% of harvested croakers in fresh conditions [1]. Large croakers are used for the value-added product, while the small ones (about 86% of total croaker catches) are sun-dried [7]. Croaker has high demand in local and international markets, particularly in Saudi Arabia, Kuwait, Qatar, the Middle East, and other Arab nations as a fresh and dry condition [1]. Bangladesh exports about 1000 metric tons (mt) of dried and salted croaker to China, Hong Kong, Singapore, South Korea, Japan, and other southeast Asian nations [1,7].
Because of the high demand for croaker and other fisheries, fishing pressure is growing in Bangladesh’s coastal and marine water. Moreover, the unselective operation of set bag net (SBN) and other fishing gear in coastal waters is hampering the stock of both pelagic and demersal fisheries in this region. As a result, the croaker has been overexploited by high fishing pressure for decades. Because of different management and conservation measures, the natural stock of croaker has been progressively improving since 1990 [8]. However, there are minimal studies on the growth pattern, mortality, and length–weight relationships of a few croaker species, but no comprehensive information on the stock condition of croaker in the BoB [1,2,3,5,7,9,10].
This research analyzed a 16-year time series of commercial trawling catch and effort (CE) data of croakers from the BoB. Non-equilibrium surplus production models (SPMs) were applied to assess the sustainable yield of croakers. The SPMs (also called biomass dynamics models) are widely used to assess MSY (maximum sustainable yield). The MSY is the widely used target BRPs (biological reference points) for fisheries management [11]. Additionally, many contemporary techniques exist for estimating MSY and BPRs in data-limited fisheries, such as the Monte Carlo method (CMSY) [12]. The CMSY can better evaluate BRPs than other techniques and is particularly handy for developing nations with limited/absent effort data [12,13].
From Bangladesh’s perspective, commercial fisheries data are limited, poor, and even absent for many species. Thus, Bangladesh’s marine fisheries management primarily focused on establishing a marine protected area, closure of spawning grounds, and mesh size restrictions. Further, Bangladesh has a limited data set of croakers, and there is currently no research into MSY and stock status—this is a significant constraint on realizing the total allowable catch (TAC) and stock status. This research aimed to evaluate the population parameters and stock status of croaker in the BoB. The SPMs and CMSY calculated BRPs will provide valuable management information to ensure the sustainability of croaker and other fishery resources in Bangladesh.

2. Materials and Methods

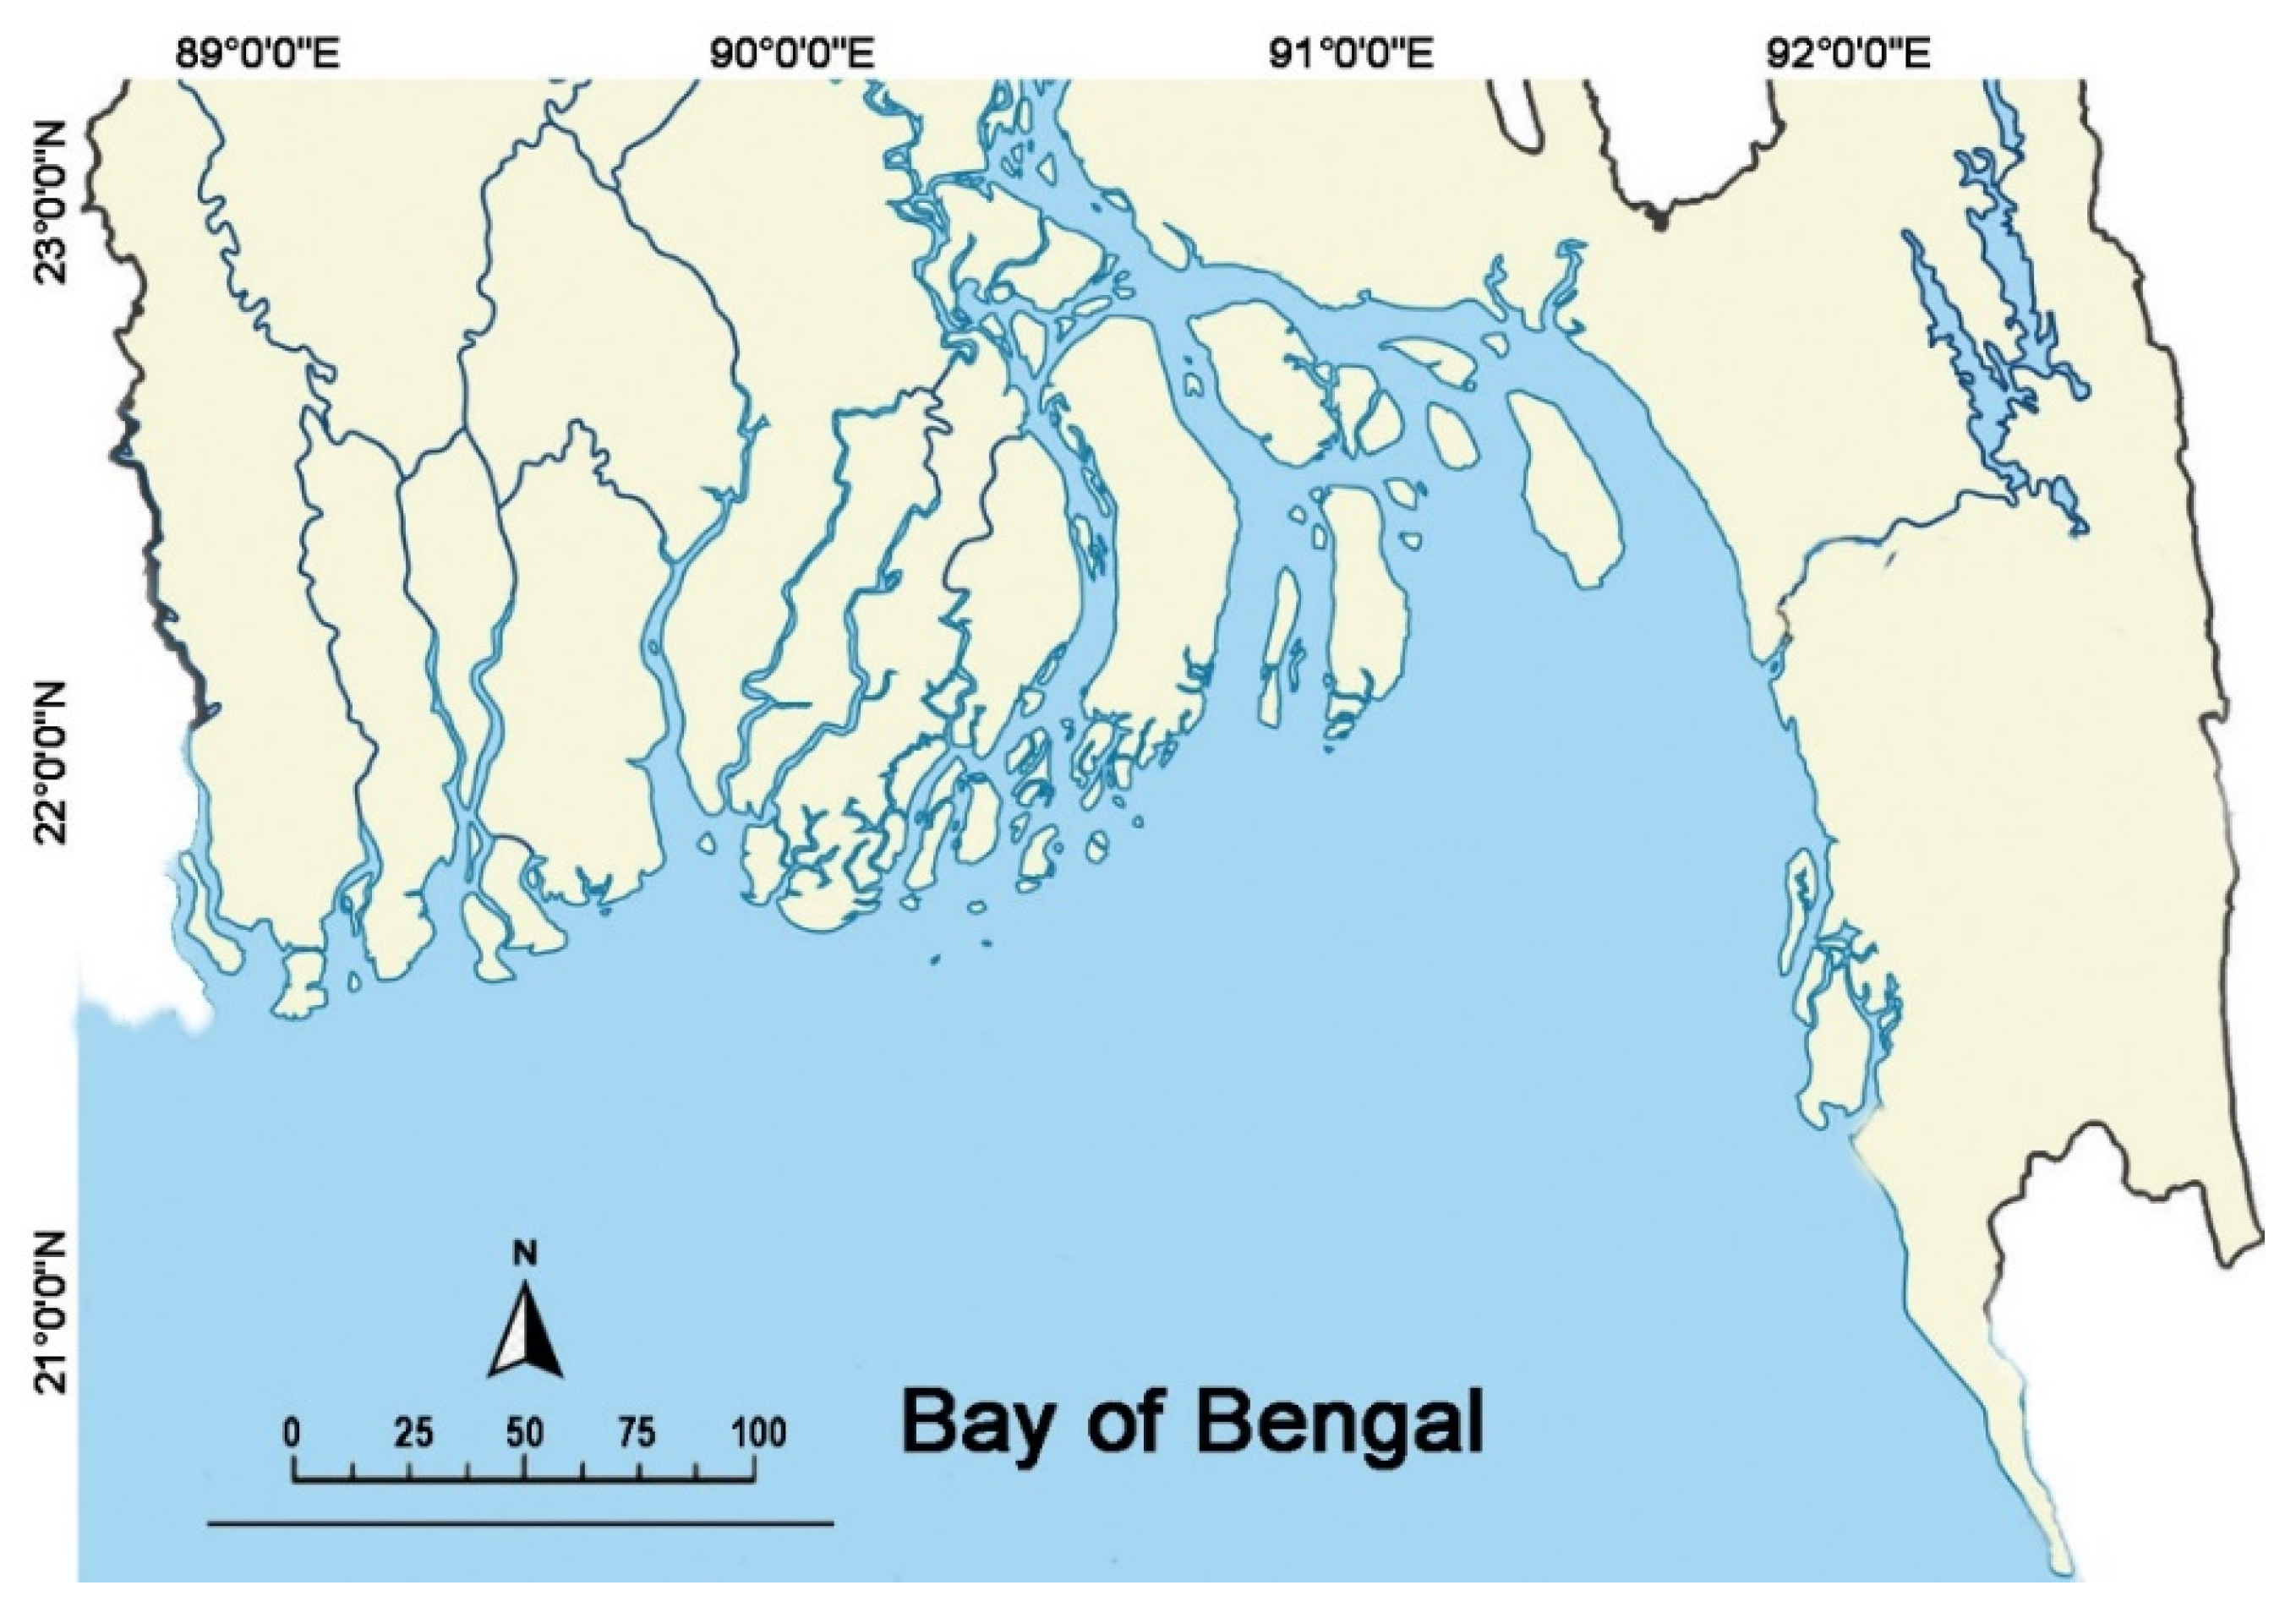
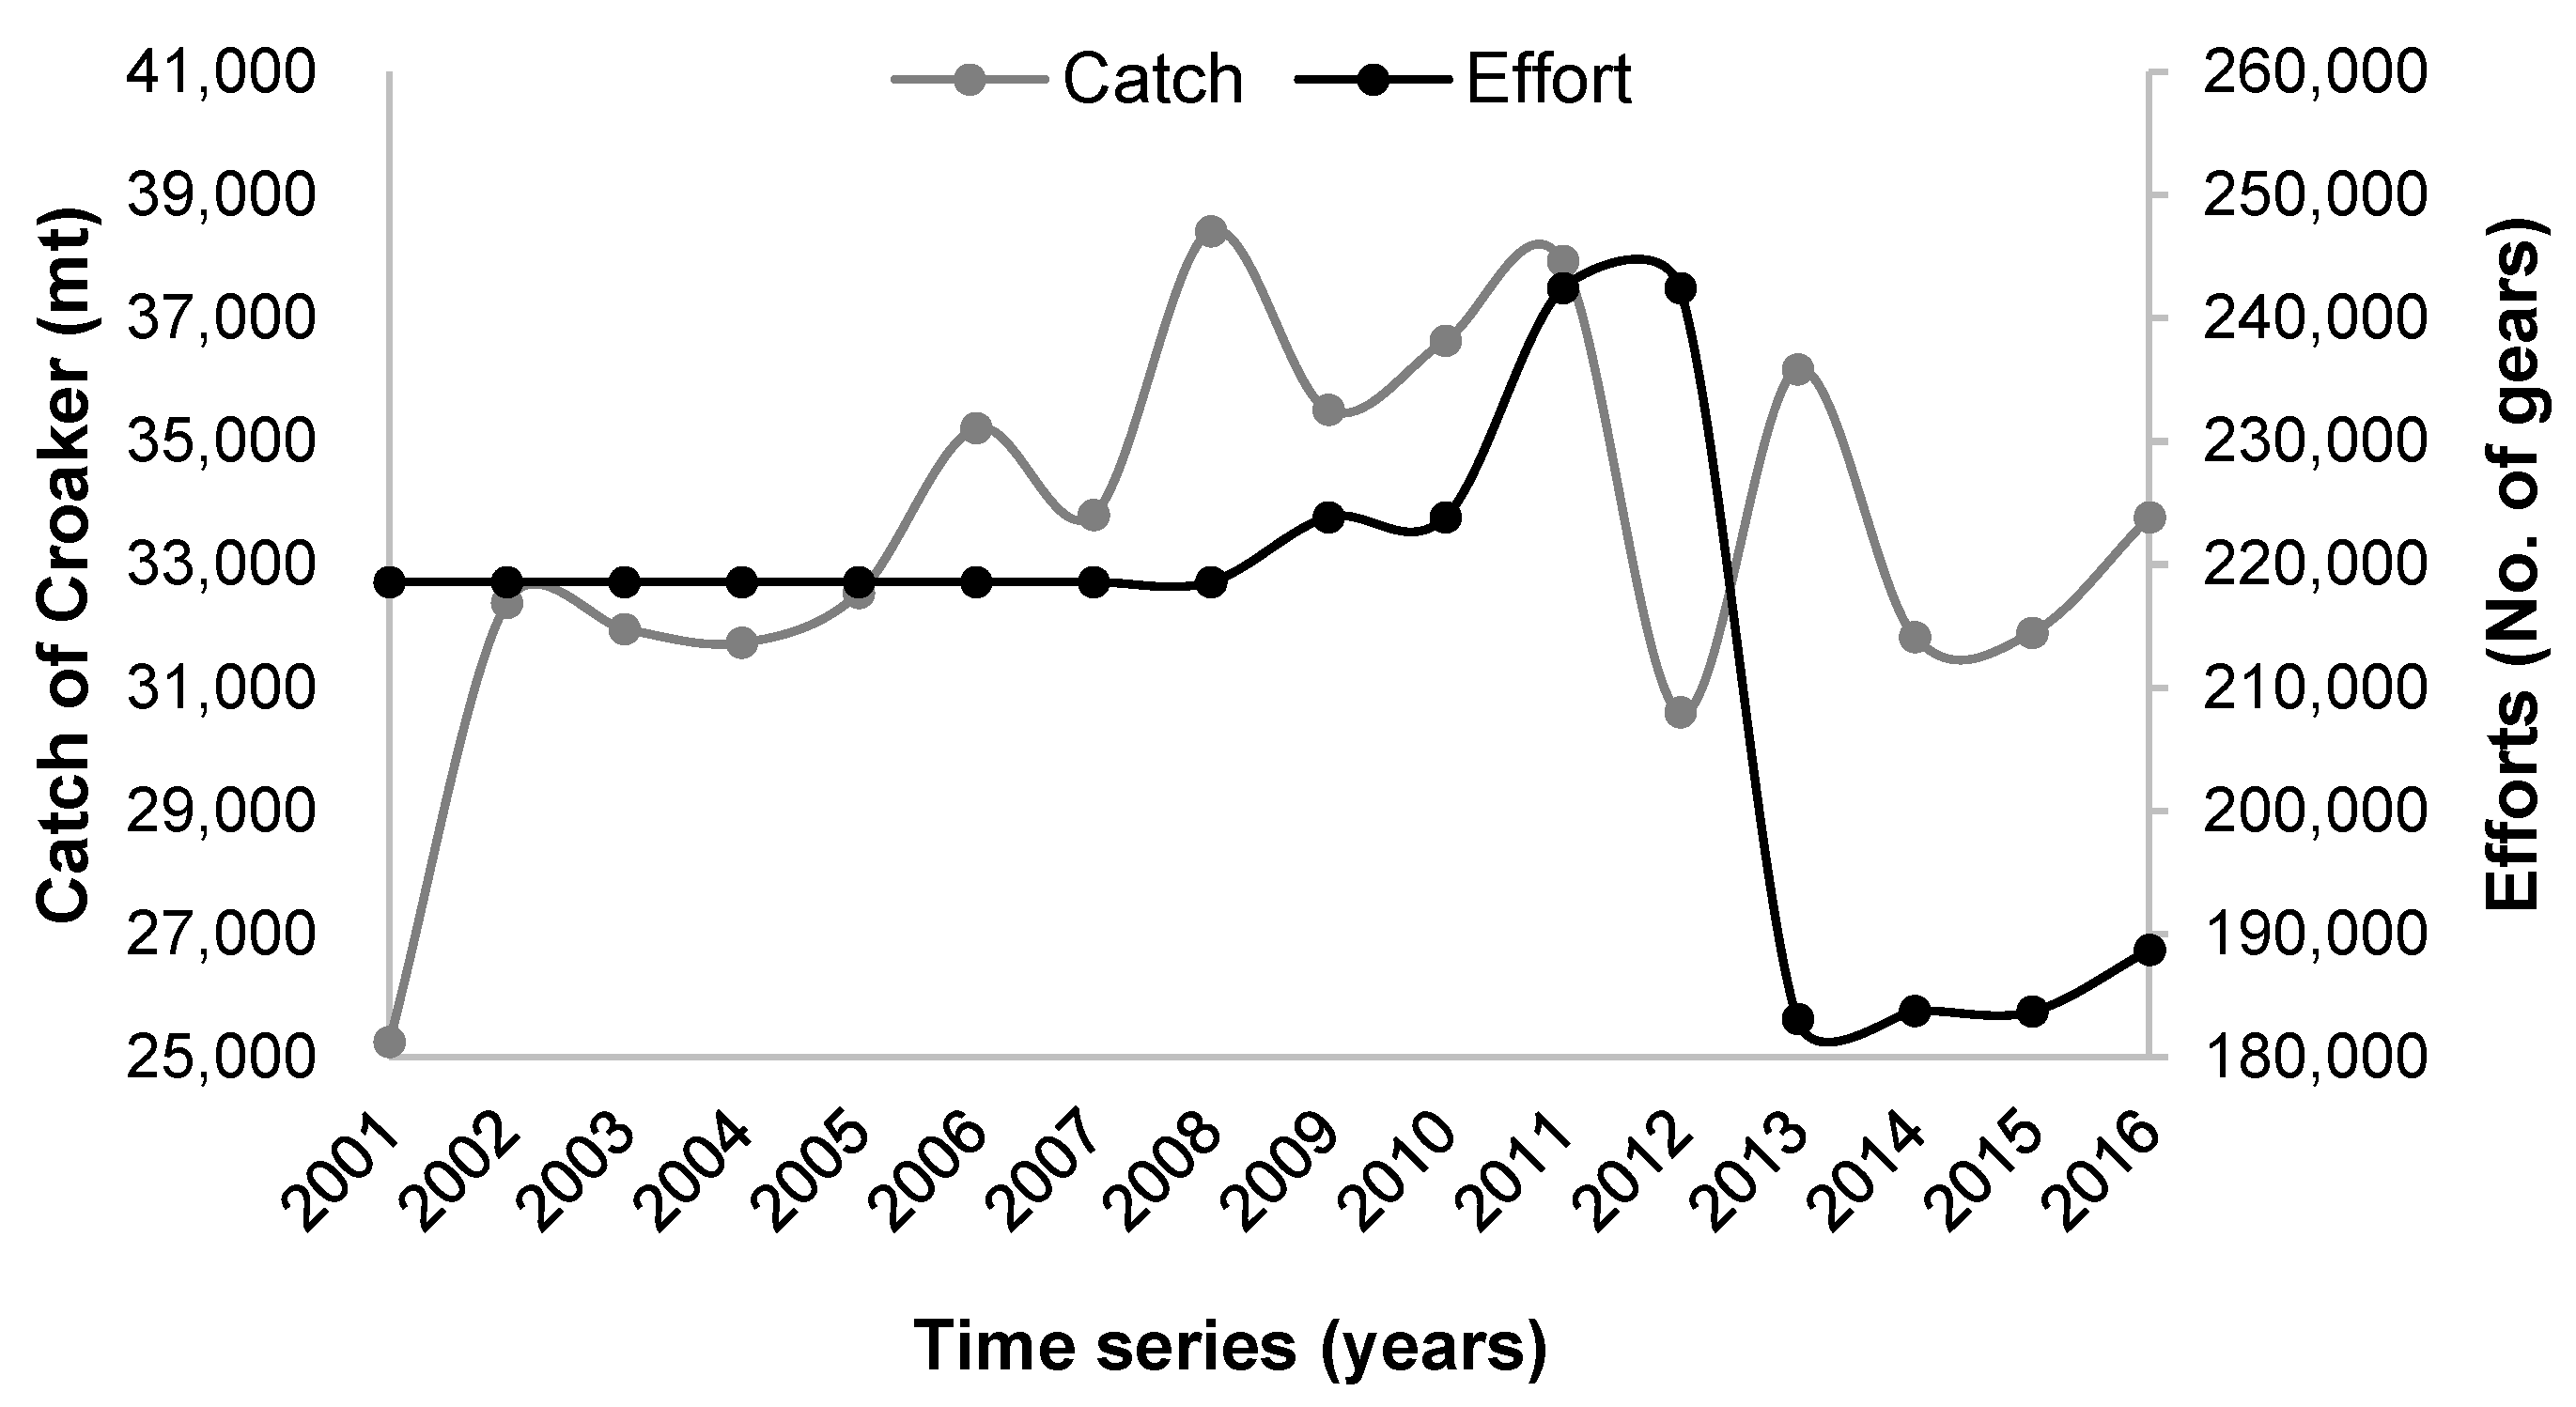
2.1. Catch, Effort, and CPUE Data

Sixteen years (2001–2016) of CE data of croaker comprising annual industrial landing and effort from the BoB waters of Bangladesh (Figure 1) were used in this study. The series of CE data were taken from the Fisheries Resource Survey System (FRSS), compiled by the Department of Fisheries (DoF), Ministry of Fisheries and Livestock (MoFL) in Bangladesh. The DoF authorities provided a standard log sheet to trawler crews to record the fishery catch to obtain navigation permission for the next trip, submitted to the Office of the Marine Fisheries, DoF. The total catch of croaker was calculated in metric tons (mt). The estimated average catch of croaker was 33,477 mt, while the minimum and maximum catches were 25,251 mt in 2001 and 38,414 mt in 2008, respectively (Figure 2). The minimum effort was 183,102 in 2013, while the maximum effort was 242,450 reported in 2011 and 2012 (Figure 2). No changes in the fishing effort were observed from 2001 to 2008. Fishing was conducted using mechanized and non-mechanized commercial boats in which gill net, trammel net, longline, and SBN were the most operated fishing gears. The efforts of the croaker fishery were measured by the total number of gears used for croaker fishing in a year in the marine water of Bangladesh. Thus, the croaker fishery’s catch per unit effort (CPUE) was estimated as mt/gear/year. However, the condition of the BoB’s weather may strongly influence the voyaging time of fishing, whereby usually mechanized boats may take a month to complete a single trip and non-mechanized vessels go on a daily or nightly basis [6,13].

2.2. Surplus Production Models (SPMs)

The ASPIC computer packages were used to run two non-equilibrium SPMs to assess the BRPs [11]. Equation (1) is the logistic population growth model [14], and Equation (2) is the Gompertz growth model [15].
dB/dt = rB(kB)
dB/dt = rB(lnklnB)
Here, B means “biomass,” t means “time (year),” k means “carrying capacity,” and r means “intrinsic growth rate.”
The ASPIC requires an initial proportion (IP) value as an input. The catch data series observed that the first-year catch was 70% of the highest catch; thus, this research calculated that IP was 0.7. The IP value ranged between 0 to 1 and was estimated as the ratio between the first catch and the highest catch from the data series. The IP value zero (0) refers to the time data series started with virgin stock status, while IP one (1) means the heavy exploitation status of fisheries in the first year of the data series. Both SPMs were run in ASPIC with the BOT and FIT files prepared with the IP values. The FIT mode of ASPIC was used to assess BRPs for management, while the BOT mode was used to calculate the BRPs with many bootstrap trials. The ASPIC cannot provide the value of r, so the manual calculation of r was performed using r = 2 × FMSY.

2.3. CMSY and BSM Model

Estimation of BPRs from catch and resilience data of croaker was conducted using a Monte Carlo method-based SPM called CMSY [16]. The CMSY can predict biomass using catch and productivity data, while classic SPMs (e.g., Fox and Schaefer model) require catch and abundance information for productivity estimation [14]. Additionally, we included a Bayesian state-space Schaefer production model (BSM) that uses catch and CPUE data [16]. This research used both CMSY and BSM approaches to assess MSY, B/BMSY, F/FMSY, k (carrying capacity), r (intrinsic growth rate of the fish population), and related BRPs of croakers [17].
B t + 1 = B t + r   ( 1 B t k ) B t C t
The biomass exploited in (t + 1) year was Bt+1, existing biomass was Bt, and catch in t year was Ct. Equation (4) was used when stock sizes were severely depleted, and biomass fell below ¼ k.
B t + 1 = B t + 4 B t k r ( 1 B t k ) B t C t | B t k < 0.25
The FishBase [4] resilience score for croakers was “High,” so the prior range for r was 0.6–1.5 used as input parameter in the CMSY (Table S1). The prior range of k was determined using three assumptions: the unexploited stock size (k) > largest catch in the time series, the maximum sustainable catch (FMSY) is productivity-dependent, and maximum catch represents a more significant fraction of k in significantly depleted stocks than in lightly depleted stocks. By default, and based on the anticipated degree of depletion, probable biomass ranges (Table S2) provide prior estimations of relative biomass at the beginning and end of time series data. The catchability coefficient (q) in the following equation links the abundance index to the stock biomass. The mean CPUE in the time t year was CPUEt, biomass in the time t year was Bt, and q is the catchability coefficient considered for a data-limited fishery.
CPUEt = qBt
where the CMSY and BSM estimated parameters of MSY = rk/4, FMSY = 0.5r, BMSY = 0.5k, and the under biomass condition in which the recruitment of a fishery may compromise as half of BMSY [14,18]. Here we utilized the well-established data-limited Bayesian CMSY technique. The CMSY method has been independently tested by the FAO [16] based on the previous version of Catch-MSY [19]. It is regarded as an overall top performance particularly suited for fisheries in developing countries. Since 2017 [12], this technique has been continually updated and improved and is currently accessible as CMSY+ [12] and downloaded from http://oceanrep.geomar.de/33076/ (accessed on 20 August 2021). Table 1 represents the CMSY input values (biomass, r, k, q ranges).

3. Results

3.1. ASPIC Package-Derived Population Parameters

The ASPIC packages delivered important population information of croaker fishery in the BoB. Table 2 and Table S3 in the supplementary section represented the assessed population parameters from ASPIC. The estimated R2 for the Fox and logistic models were 0.47, and 0.46, respectively, indicating a good fit for both models. Estimated k, B, MSY, F/FMSY, and BMSY values from the Fox model were higher than the logistic model and proved the conservativeness of the Fox model. The inconsistent trend of F/FMSY was calculated, whereas B/BMSY showed a slightly increasing trend over time for both the Fox and logistic models calculated by the ASPIC package (Table 2). The evaluated values of k for the Fox and logistic models were 257,200 mt and 176,500 mt, respectively. A more considerable q value was assessed from the logistic model (1.897 × 10⁻⁶) than the Fox model (1.810 × 10⁻⁶). Population growth rate r was evaluated by the Fox (0.76 year−1) and logistic (0.82 year−1) models. The estimations of FMSY (fishing mortality rate at MSY level) and BMSY (biomass that can produce MSY) from the Fox model were 0.38 and 94,620 mt, respectively. In contrast, the logistic model estimated 0.41 and 88,250 mt values for FMSY and BMSY, respectively. The larger value of B compared with BMSY and the smaller F compared with FMSY were assessed from both models. The assessed MSYs from the Fox and logistic (Schaefer) models were 35,900 mt and 35,880 mt, respectively, and were very close to last year’s catch (33,768 mt in 2016), which indicated the fully exploited condition.

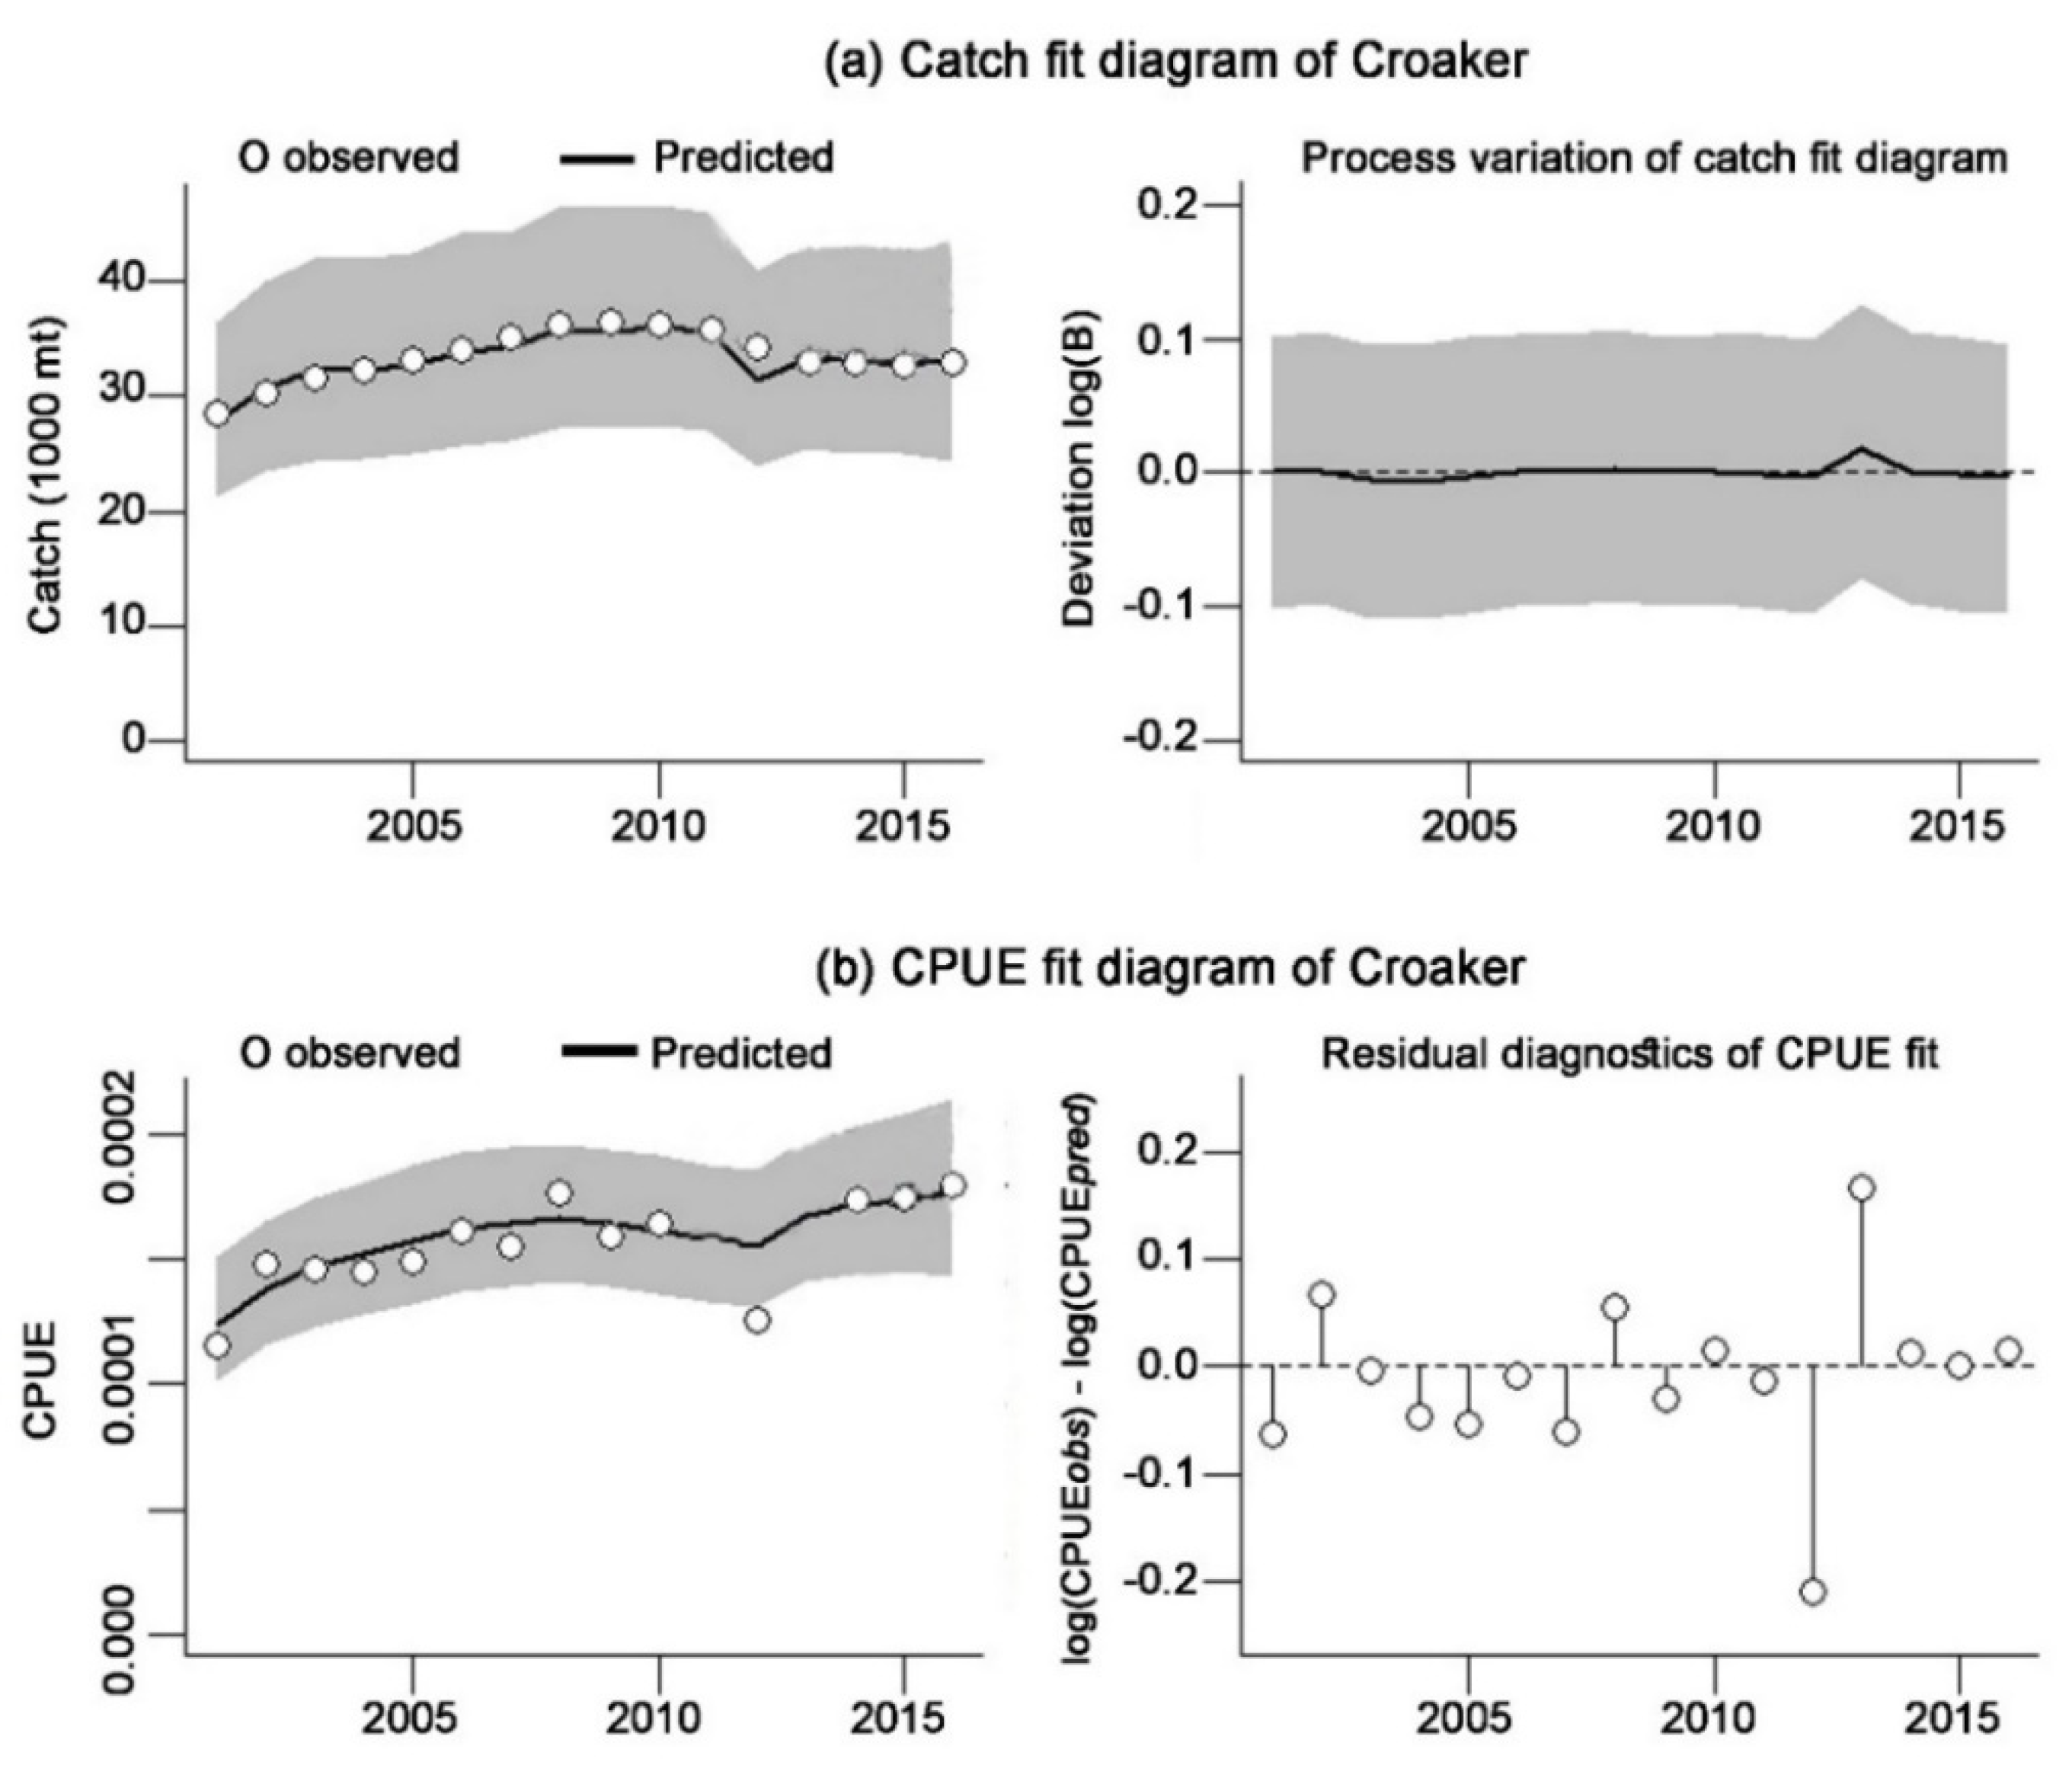
3.2. CMSY- and BSM-Derived Fisheries Reference Points (BRPs)

The CMSY and BSM methods delivered important stock information and BRPs (Table 3). The BSM-derived BRPs are considered the management information for the croaker fishery of the BoB. The BSM produced higher k (127,000 mt) than the CMSY (123,000 mt). The r produced by CMSY and BSM were very close, and values were 0.1, 1.13, and 1.12, respectively. The q estimated from the BSM model was 2.48 × 10⁻⁶. The catch fit diagram (Figure 3a) depicted a gradual increase in both observed and predicted catch, while the CPUE fit diagram (Figure 3b) displayed a similar fluctuation in CPUE. The highest catch (38,414 mt) and CPUE (0.198) were observed in 2008 and 2013, respectively, while the lowest catch (25,251 mt) and CPUE were reported in 2001. There was no remarkable variation between the predicted and observed catch and CPUE in the last year (2016), which is a good sign for the sustainability of this fishery. The CMSY and BSM derived MSY were 33,900 mt per year and 35,900 mt per year. MSY values from both methods were very close to last year’s catch (33,768 mt per year in 2016), indicating a fully exploited condition.
The management information of croaker derived from the BSM method is represented in Table 4 and Figure 4. BSM produced the catch diagram and the stock diagram of croaker illustrated in Figure 4. The catch diagram shows the catches below the MSY line (Figure 4a). The stock diagram (Figure 4b) illustrates that B/BMSY at the beginning of the data year was below the unity (<1) line, depicting overfished biomass. However, gradually, the fish has recovered and resulted in safe biomass (≥1) in the last year (2016). In 2016, the estimated B (72,300 mt) was very close to the BMSY (63,300 mt), suggesting that the biomass is enough to produce the MSY. The exploitation figure (Figure 4c) shows that the exploitation line never crossed the MSY limit. The maximum rate of fishing mortality FMSY was 0.57, F was 0.46, and F/FMSY was 0.81, respectively, suggesting a safe fishing status.

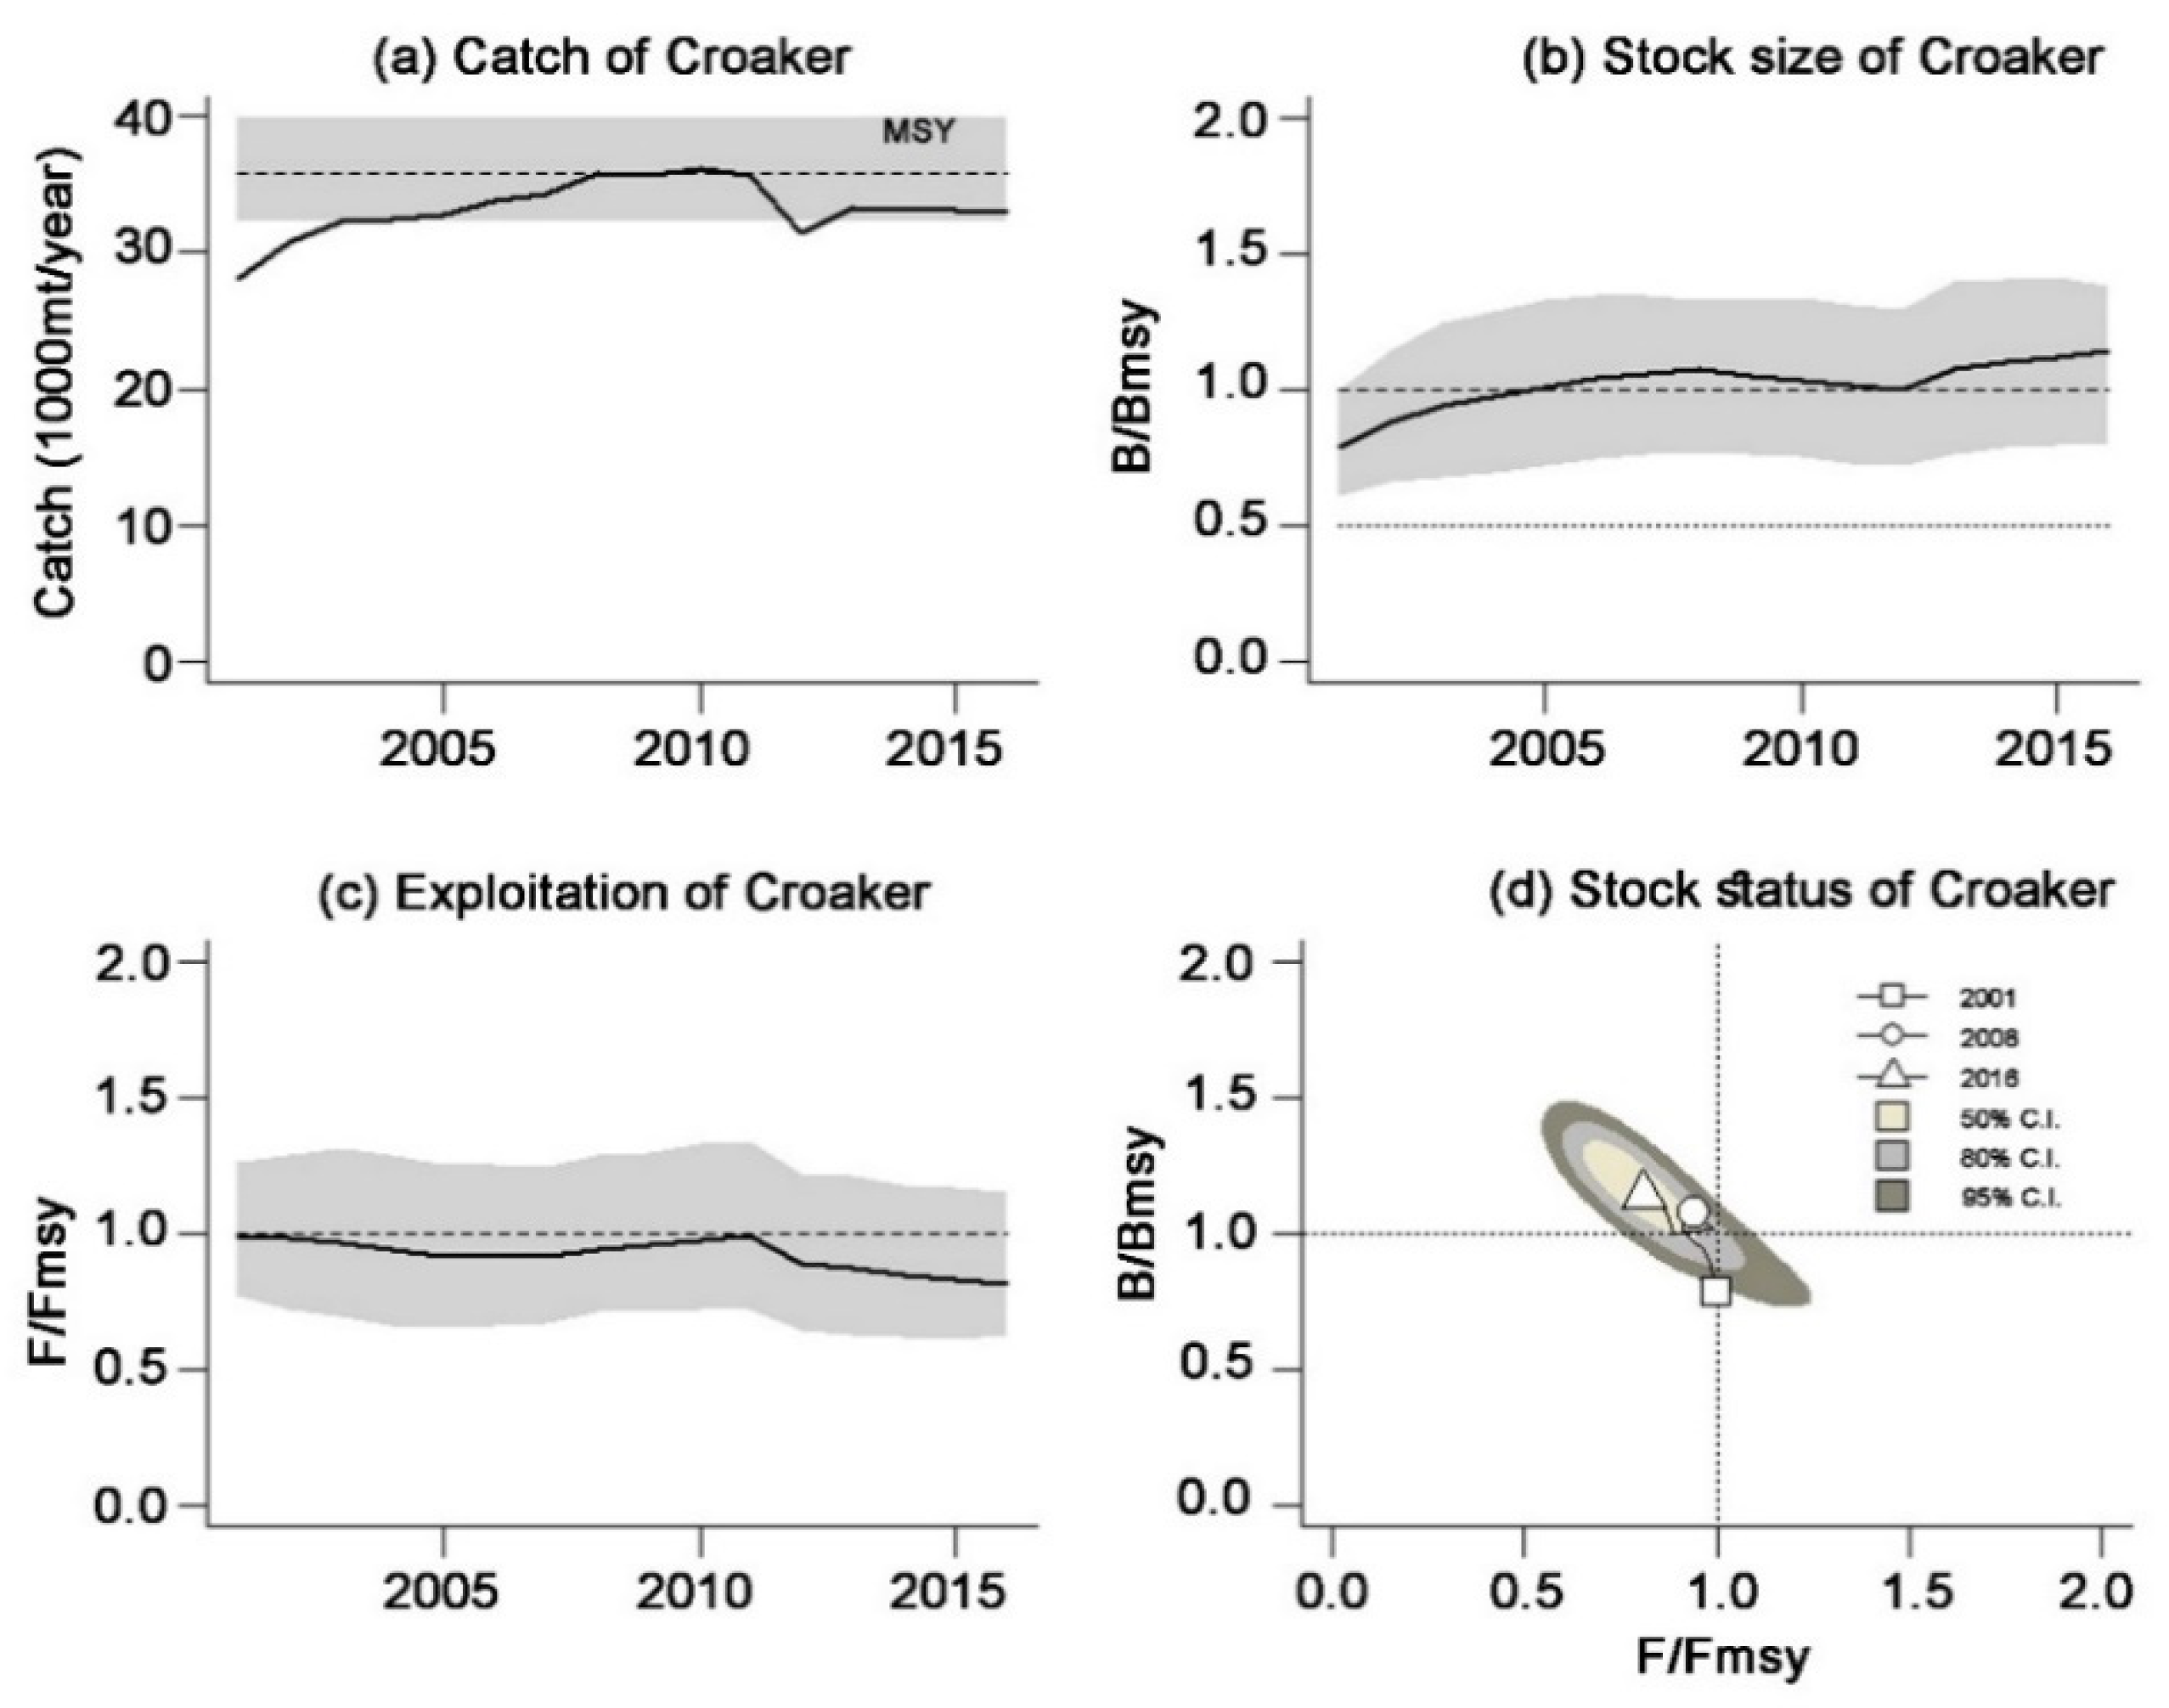
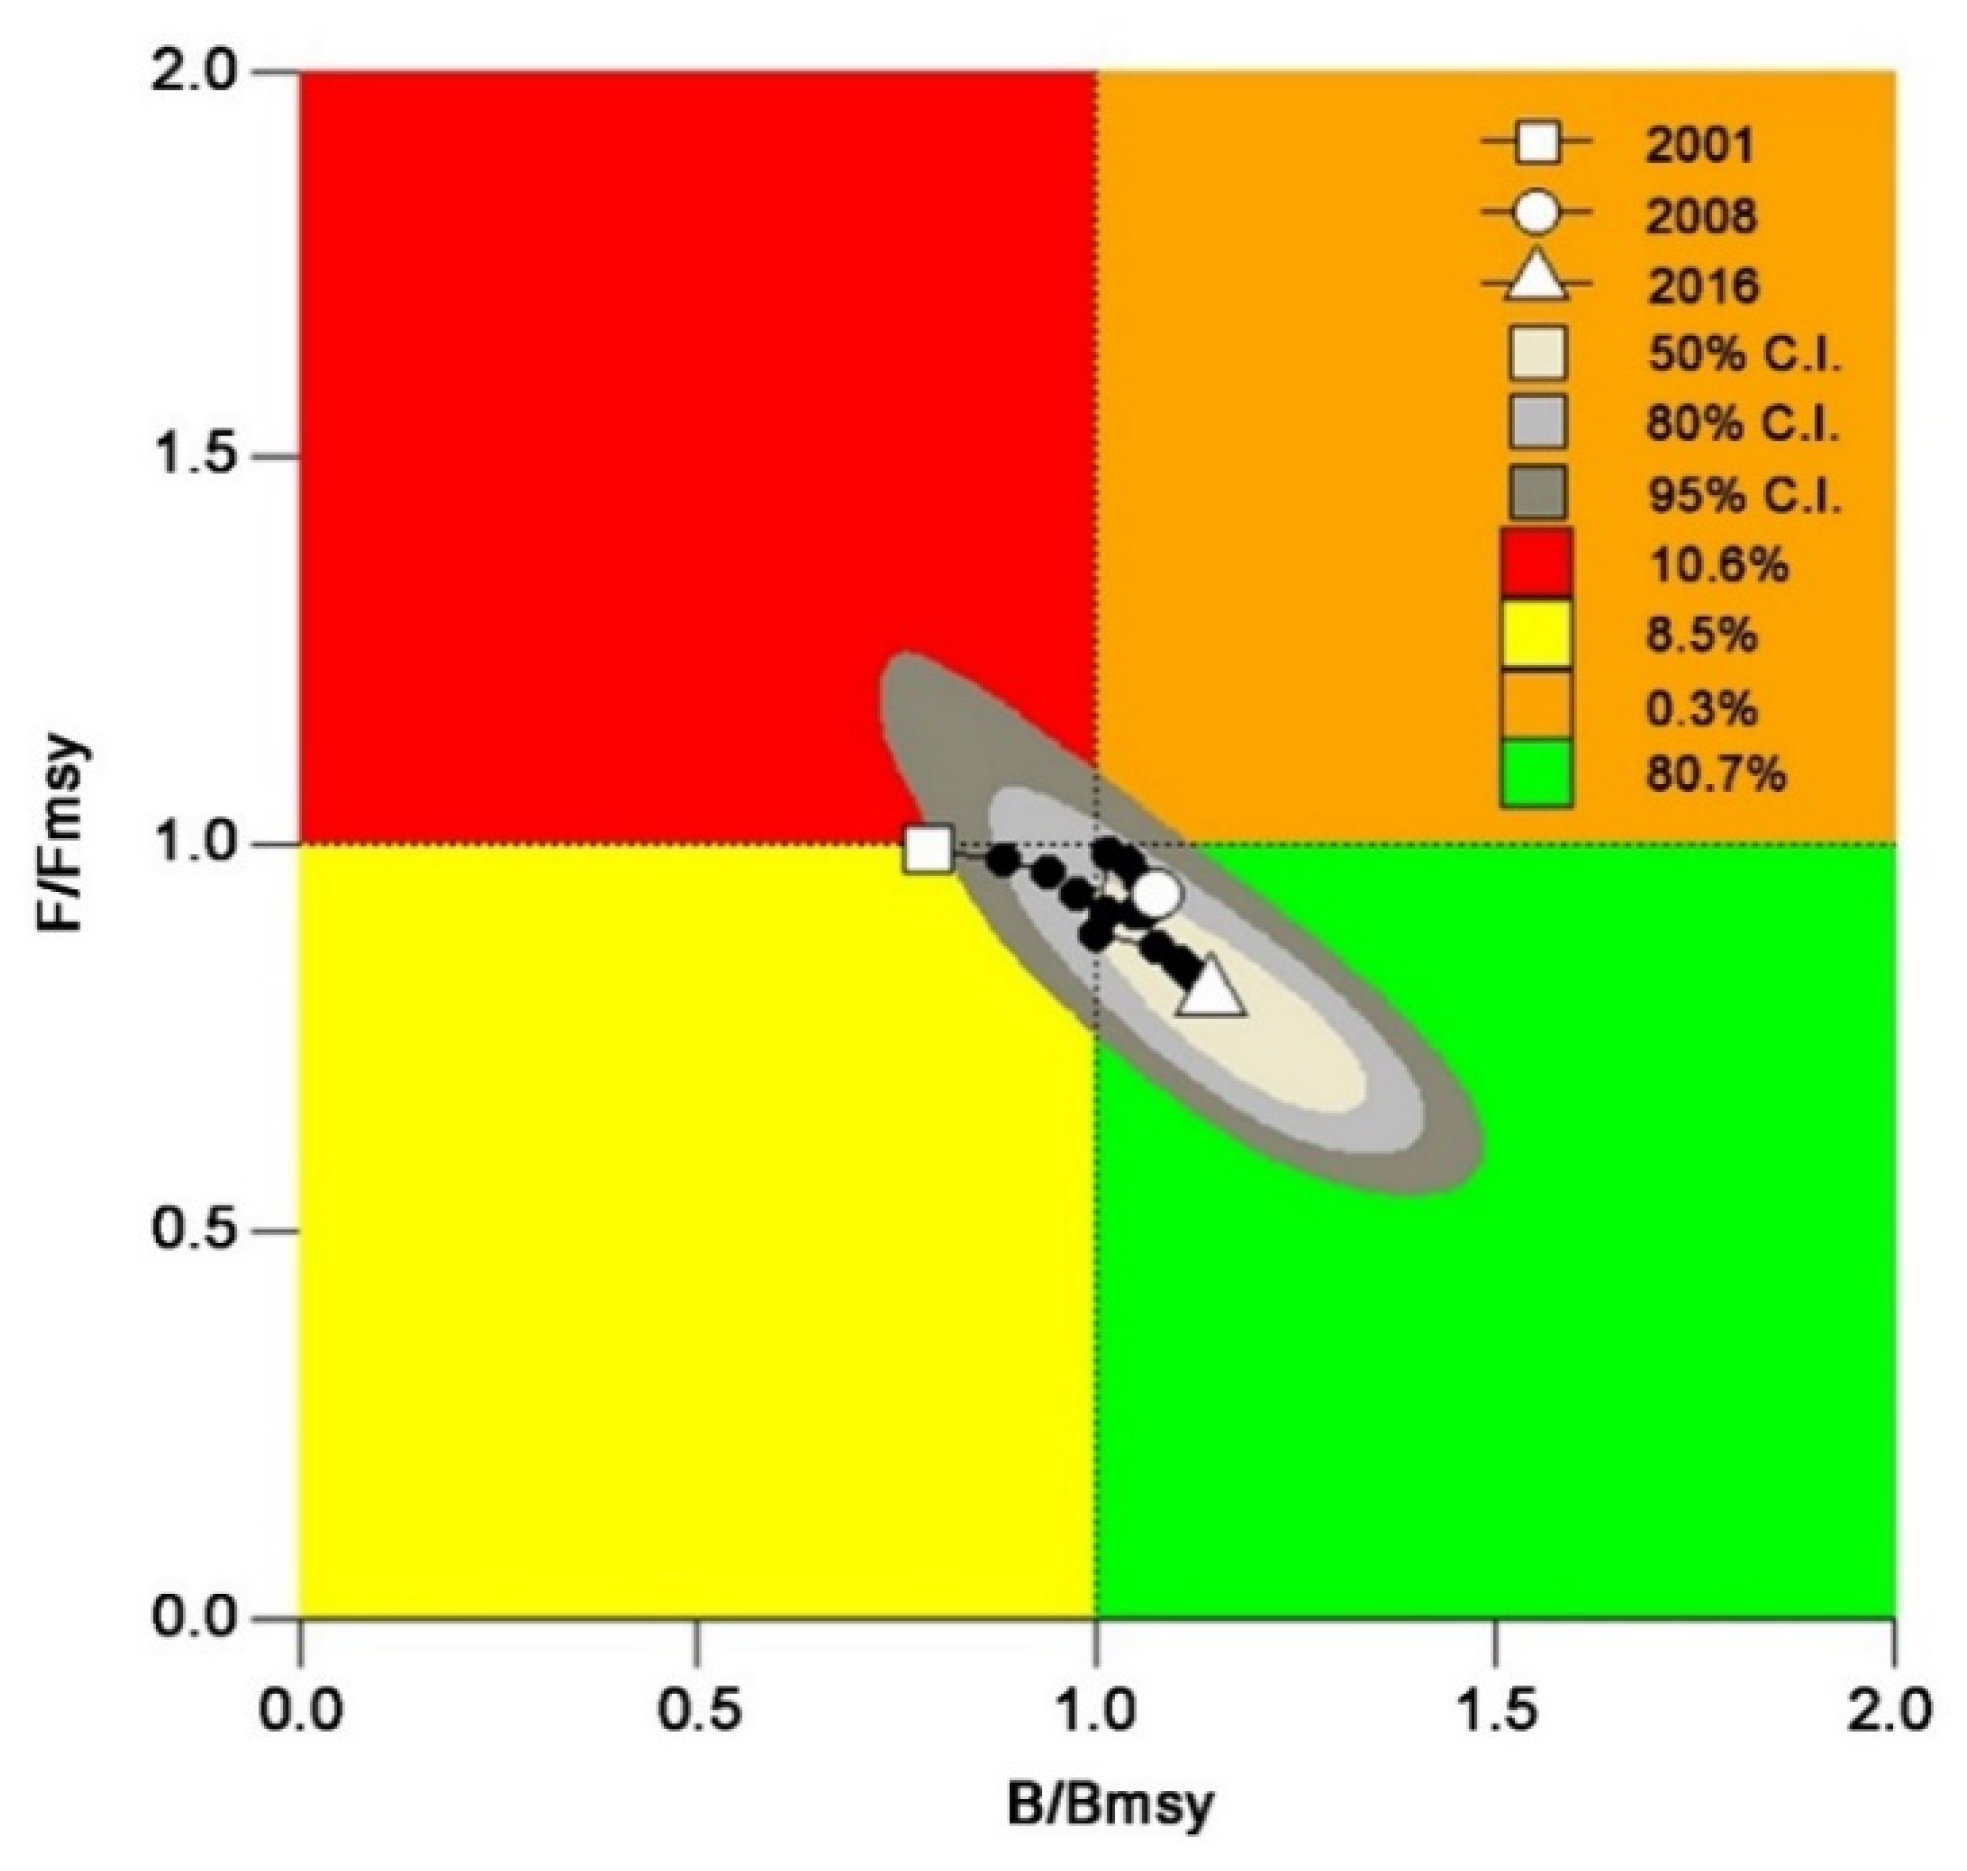
3.3. Stock Status of Croaker Fishery

The ASPIC and, CMSY methods assessed F/FMSY values < 1 and B/BMSY values close to 1, indicating safe fishing conditions and healthy stock in which biomass levels were enough to produce the MSY and, thus, indicating that the biomass levels were enough of a sustainable state of croaker in the BoB. Kobe phase plot was used to depict the current stock status and exploitation rate relative to target reference points (TRPs) such as FMSY and BMSY. The Kobe plot is characterized by four colored quadrants (orange, red, yellow, and green) for F/FMSY on B/BMSY. The orange plot denotes the healthy stock that will be depleted by overfishing. The red color plot indicates the overfished and overfishing status in which the biomass cannot produce the MSY. The yellow color plot indicates very low biomass, but the stock has a chance to recover in a sustainable state if fishing pressure is reduced. The green plot is the management targeted area, signifying healthy stock status and sustainable fishing to produce the MSY. The legend in the plot’s upper right corner indicates the probability of the stock falling into one of the colored areas over the last year, such as an 80.7% probability of the stock subsiding into the green area, a 10.6% probability of the stock falling into the red area, an 8.5% probability of the stock falling into the yellow area, and a 0.3% probability of the stock falling into the orange area. The BSM-derived BRPs indicate that the exploitation of croaker stock started from the yellow plot in 2001 and already moved to the green area because of the reduction in fishing efforts from 2013 and safe fishing pressure (Figure 5). The representation of the Kobe phase plot suggests that the current level of fishing pressure should be strictly maintained to ensure the sustainability of croaker in the marine water of Bangladesh.

4. Discussion

4.1. Suitability of SPMs for Fisheries Management

Sustainable fisheries management depends on the outcome of stock assessment studies [20]. A stock assessment study can provide policymakers and fisheries managers with valuable information to formulate an effective fisheries management policy. However, many stock assessment models require a great deal of data [21], which ultimately limits their implementation to only valuable species, and stocks and other species are less considered [22]. The scientist and expert apply different statistical methods and models to evaluate the stock information and biological reference points [23]. MSY is a frequently used BRPs for fish stocks assessment [22], and B/BMSY is used as a context for determining the status of fisheries [20]. Experts and policymakers representing fisheries recognize the principles of k, q, r, and MSY for attaining sustainability in their respective fisheries [13]. The non-equilibrium SPMs (Fox and Schaefer by ASPIC), CMSY, and BSM methods were used in this study to assess the fisheries reference points of the croaker from the BoB. It is considered that, occasionally, SPMs can produce better BRPs than age-structured models and can be used anywhere [11].
Moreover, the ASPIC package with SPMs can suitably assess BRPs from multispecies data [11]. It is vital to carefully choose an IP value when fitting these models to run the ASPIC package [11]. On the other hand, k and r were the necessary prior information for the CMSY and BSM that can be obtained from resilience data obtained from the FishBase [19]. The MSY estimated by CMSY and BSM shows some inefficiencies when used for very-low-resilience or less-captured fisheries and best fitted for medium to high resilience fisheries [12]. The resilience value for croaker was high, indicating that the CMSY and BSM method is best-suited to assess the BRPs. As a result, the CMSY method may be suggested as a viable alternative for assessing the stock of croaker and other data-limited fisheries in Bangladesh. BRPs estimated from all models offer information for the management of the croaker fishery in the BoB waters of Bangladesh.

4.2. Population Parameters of Croaker

The CMSY and BSM method produced a very close value of k, while the Fox and Schaefer model produced a larger k compared with the CMSY and BSM method. The Fox model estimated the highest k, and the CMSY assessed the lowest k value. The catchability coefficient q is also called gear efficiency for fishing and is considered the ratio between fishing mortality and fishing effort. The q value is vital when catch and effort data are considered key input for fish stock assessment [12,13]. The seasonal and spatial variability may influence the q and fishing effort [12,24]. The q value derived from the BSM (2.48 × 10⁻⁶) was higher than the other models. The intrinsic growth rate (r) is an important indication to understand a fishery [25,26]. The Fox model produced a smaller r value compared with CMSY and BSM. The assessed r from all models ranged from 0.76 year−1 to 1.13 year−1, indicating the high growth rate of croaker capable enough of adding above 76% to 100% biomass to the standing population in a year. When r is 0.1, it is mentioned that population size can increase 10% in a time interval [24]. The r value strongly correlates with fisheries resilience related to natural mortality [4,12]. The fisheries resilience value ranged from 0.015–0.1, categorized as low resilience, 0.2–0.8 is medium resilience, and 0.6–1.5 is called high-resilience fishery [12]. This study identified the croaker as a “high-resilience” fishery. When the minimum time required for population doubling is shorter than 15 months, the population is grouped as a highly resilient fishery [12].

4.3. Maximum Sustainable Yield (MSY) of Croaker

MSY was the target reference point (TRP) and considered the essential BRPs to assume a fishery status [23]. The estimated MSY from all models ranged from 33,900 to 35,900 mt. The MSY value produced by all models was very close to last year’s catch and indicated the fully exploited conditions of croaker in Bangladesh. A stock is considered fully exploited when the observed catch is very close or equal to the MSY value, and no further growth in capture is conceivable [16]. The higher MSY and smaller observed catch value indicated the underexploited condition. In contrast, the higher observed catch and smaller MSY specified the overexploitation status of a fishery stock [24]. Fisheries management aims to ensure the fully exploited or maximally sustainably harvest of fish stock. However, a misconception of fully exploited fish stock leads many non-fishery experts to believe this term is terrible. However, if the fishing intensity is increased at this time, the stock may be driven into overexploitation [27]. As a result, the MSY value is recommended as total allowable catch (TAC) to ensure fisheries’ sustainability [27,28]. Moreover, the annual catch of croaker should not exceed the limit of the estimated MSY (35,900 mt) calculated from the BSM model. The BSM is the postponement of non-equilibrium SPMs empowered by mathematical and computer science and can deliberate prior and posterior fishery population parameters [12]. However, developed countries usually apply TAC limits to manage their fisheries [29], and, similarly, fishery managers in Bangladesh are recommended to manage their fisheries.

4.4. Exploitation and Stock Status of Croaker

The proxies for the B/BMSY and F/FMSY values are measured as the lower limits of predictable stock sizes [13]. The differentiation of B/BMSY value differs by governing or management body; for example, the UN and FAO consider the under-fished state of a fishery when the B/BMSY < 0.8, whereas the USA considers B/BMSY < 0.5 [24]. In this study, the calculated B/BMSY from all methods was close to 1.0, indicating that the stock biomass was equal to the BMSY and the biomass that maximizes long-term catches. Moreover, significantly closer B values than BMSY indicated that the biomass was fully saturated and safe to produce the MSY. The fully exploited biomass is critical for fishery managers because a slight increase in fishing pressure may reduce the B below BMSY, leading to overfishing. The calculated FMSY > F and F/FMSY < 1.0 refers to safe and under the fishing status of croaker. The stock figure (Figure 4b) and exploitation figure (Figure 4c) illustrate the safe biomass and safe exploitation status, but exploitation was close to 1 at the beginning of the data series. It may be assumed that the fishery was in overfished condition, but the high growth rate and reduction in fishing efforts may contribute to the fishery rebuilding a sustainable stock. Several previous studies reported an assessment of the stock of Panna heterolepis, Pennahia anea, Jhonius argentatus, Johnieops vogleri, and Johnius argentatus from the BoB waters, Bangladesh [1,2,3,5]. Additionally, the population dynamics of Otolithoides pama from the Sundarbans area of Bangladesh was studied [9]. All research reported safe fishing and optimal exploitation status of different croaker species from the BoB water, supporting the present research findings. Further, some studies were reviewed for different croaker species from the Indian and Pakistan waters and reported safe exploitation status [10,30,31]. These findings confirm the safe exploitation of the croaker fishery from the Indian Ocean, which supports the findings of our study, where our study area (Bay of Bengal) is a part of the Indian Ocean [20]. Though different studies used different species, data, methods, and areas, all findings affirmed the safe exploitation and safe stock biomass of the croaker fishery. The Kobe plot (Figure 5) depicts the relocation of stock biomass from the yellow to the green zone, confirming the rebuilding state of this fishery; presently, it is in a sustainable state. Because of their high growth performance, the formerly depleted stock of croaker from China and South Korea have been reported as in a sustainable state through stock recovery [27].

5. Conclusions

This research assessed the safe stock status of croaker produced by non-equilibrium ASPIC and equilibrium CMSY methods. Both methods are robust and showed similar performance to assess the data-limited fisheries from the marine water of Bangladesh. The estimated biomass was very close to producing BMSY, and fishing pressure was optimum. While the fishery is a renewable resource, overfishing results in fish biomass reduction and destroys the fishery. Thus, it is critical to conduct regular scientific fish stock assessments to guarantee the sustainability of an exploited fishery. BRPs from all models assessed safe fishing pressure, and biomass was very close to producing BMSY. Further, the calculated MSY level depicted the fully exploited condition of croaker in the BoB waters of Bangladesh. Therefore, the present study strongly recommends maintaining the catch at the MSY level, and current fishing pressure should not increase to ensure the sustainability of croaker. The evaluated BPRs and stock information from this research will help fishery managers and policymakers to manage the croaker and other fisheries’ sustainability in the Bay of Bengal, Bangladesh.

Supplementary Materials

The following supporting information can be downloaded at: https://www.mdpi.com/article/10.3390/jmse10010063/s1, Table S1: the table shows the prior ranges for parameter r used in the CMSY analysis of croaker fishery in BoB; Table S2: the table shows the prior relative biomass ranges (B1/K) for the CMSY analysis of croaker fishery in BoB, Bangladesh; Table S3: representation of population parameters derived from Fox and logistic (Schaefer) models estimated using ASPIC package with the different initial proportion (IP) value (from 0.1 to 0.9) for croaker in the BoB.

Author Contributions

P.P.B.: conceptualization, data collection, methodology, data analysis, draft writing, writing, editing, and reviewing, Q.L.: conceptualization, reviewing, and editing, M.M.S.: data collection, editing, and reviewing, P.S.: editing, reviewing, and funding, M.M.H.M.: visualization, editing, and reviewing. All authors have read and agreed to the published version of the manuscript.

Funding

The research was funded by the Ocean University of China (OUC), Qingdao, China. The OUC fundamental research grant number was 201562030.

Institutional Review Board Statement

Not applicable.

Informed Consent Statement

Not applicable.

Data Availability Statement

Data will be available from the corresponding author by request.

Acknowledgments

The first author wishes to express his gratitude to the Chinese Scholarship Council (CSC) and the SOA (State Oceanic Administration) for their financial support during his doctorate studies and this research. The authors want to express their gratitude to the College of Fisheries, Ocean University, China, and the Department of Coastal and Marine Fisheries, Sylhet Agricultural University, Sylhet, for kind support to complete this research project successfully.

Conflicts of Interest

The authors declare no conflict of interest.

References

  1. Zafar, M.; Mustafa, G.; Amin, S.M.N.; Haque, M.A. Population dynamics of Johnius argentatus (Houttuyn) from the northeastern part of the Bay of Bengal, Bangladesh. Asian Fish. Sci. 2000, 13, 243–249. [Google Scholar]
  2. Sabbir, W.; Hossain, M.Y.; Rahman, M.A.; Hasan, M.R.; Khan, M.N.; Mawa, Z.; Tanjin, S.; Sarmin, M.S.; Rahman, O.; Nima, A.; et al. Growth pattern of the Hooghly croaker Panna heterolepis (Trewavas, 1977) in the Bay of Bengal (Bangladesh) in relation to eco-climatic factors. Egypt. J. Aquat. Biol. Fish. 2020, 24, 847–862. [Google Scholar] [CrossRef]
  3. Sabbir, W.; Rahman, M.A.; Hossain, M.Y.; Hasan, M.R.; Mawa, Z.; Rahman, O.; Tanjin, S.; Sarmin, M.S. Stock assessment of Hooghly Croaker Panna heterolepis in the Bay of Bengal (Southern Bangladesh): Implications for sustainable management. Heliyon 2021, 7, e07711. [Google Scholar] [CrossRef]
  4. Froese, R.; Pauly, D. Fishbase. Available online: https://fishbase.mnhn.fr/search.php (accessed on 20 August 2021).
  5. Fanning, L.P.; Chowdhury, S.R.; Uddin, M.S.; Al-Mamun, M.A. Marine Fisheries Survey Reports and Stock Assessment 2019; Department of Fisheries, Government of Bangladesh: Dhaka, Bangladesh, 2019.
  6. DoF (Department of Fisheries). Yearbook of Fisheries Statistics of Bangladesh, 2019–2020; Department of Fisheries, Ministry of Fisheries and Livestock, Government of Bangladesh: Dhaka, Bangladesh, 2020; Volume 37.
  7. Uddin, K.; Reza, M.; Islam, M.; Kamal, M. Influence of salt on drying performance of silver jewfish (Otolithes argentatus) in a Hohenheim type solar tunnel dryer. J. Bangladesh Agric. Univ. 2014, 12, 227–233. [Google Scholar] [CrossRef] [Green Version]
  8. Lin, L.; Liu, Z.; Jiang, Y.; Huang, W.; Gao, T. Current status of small yellow croaker resources in the southern Yellow Sea and the East China Sea. Chin. J. Oceanol. Limnol. 2011, 29, 547–555. [Google Scholar] [CrossRef]
  9. Mustafa, M.G.; Ahmed, I.; Ilyas, M. Population Dynamics of Five Important Commercial Fish Species in the Sundarbans Ecosystem of Bangladesh. J. Appl. Life Sci. Int. 2019, 22, 1–13. [Google Scholar] [CrossRef]
  10. Jayasankar, P. Population dynamics of big-eye croaker Pennahia macrophthalmus and blotched croaker Nibea maculata (Sciaenidae) in the trawling grounds off Rameswaram Island, east coast of India. Indian J. Mar. Sci. 1995, 24, 153–157. [Google Scholar]
  11. Prager, M.H. User’s Guide for ASPIC Suite, Version 7: A Stock–Production Model Incorporating Covariates and Auxiliary Programs; Prager Consulting: Portland, OR, USA, 2016. [Google Scholar]
  12. Froese, R.; Demirel, N.; Coro, G.; Kleisner, K.M.; Winker, H. Estimating fisheries reference points from catch and resilience. Fish Fish. 2017, 18, 506–526. [Google Scholar] [CrossRef] [Green Version]
  13. Barman, P.P.; Karim, E.; Khatun, M.H.; Rahman, M.F.; Alam, M.S.; Liu, Q. Application of CMSY to Estimate Biological Reference Points of Bombay Duck (Harpadon nehereus) from the Bay of Bengal, Bangladesh. Appl. Ecol. Environ. Res. 2020, 18, 8023–8034. [Google Scholar] [CrossRef]
  14. Schaefer, M.B. Some aspects of the dynamics of populations important to the management of the commercial marine fisheries. Bull. Math. Biol. 1991, 53, 253–279. [Google Scholar] [CrossRef]
  15. Fox, W.W. An Exponential Surplus-Yield Model for Optimizing Exploited Fish Populations. Trans. Am. Fish. Soc. 1970, 99, 80–88. [Google Scholar] [CrossRef]
  16. Rosenberg, A.A.; Fogarty, M.J.; Cooper, A.B.; Dickey-Collas, M.; Fulton, E.A.; Gutiérrez, N.L.; Hyde, K.J.W.; Kleisner, K.M.; Kristiansen, T.; Longo, C.; et al. Developing New Approaches to Global Stock Status Assessment and Fishery Production Potential of the Seas; FAO: Rome, Italy, 2014; Volume 1086. [Google Scholar]
  17. Palomares, M.L.D.; Froese, R.; Derrick, B.; Nöel, S.-L.; Tsui, G.; Woroniak, J.; Pauly, D. A Preliminary Global Assessment of the Status of Exploited Marine Fish and Invertebrate Populations; Sea Around Us Project: Vancouver, BC, Canada, 2018. [Google Scholar]
  18. Haddon, M. Modelling and Quantitative Methods in Fisheries, 2nd ed.; Chapman and Hall/CRC: New York, NY, USA; London, UK, 2011; ISBN 9781119130536. [Google Scholar]
  19. Martell, S.; Froese, R. A simple method for estimating MSY from catch and resilience. Fish Fish. 2013, 14, 504–514. [Google Scholar] [CrossRef]
  20. Barman, P.P.; Liu, Q.; Al-Mamun, M.A.; Schneider, P.; Mozumder, M.M.H. Stock Assessment of Exploited Sardine Populations from Northeastern Bay of Bengal Water, Bangladesh Using the Length-Based Bayesian Biomass (LBB) Method. J. Mar. Sci. Eng. 2021, 9, 1137. [Google Scholar] [CrossRef]
  21. Pauly, D. Major Trends in Small-Scale Marine Fisheries, with Emphasis on Developing Countries, and Some Implication fro Social Sciences. Marit. Stud. 2006, 4, 7–22. [Google Scholar]
  22. Costello, C.; Ovando, D. Status, Institutions, and Prospects for Global Capture Fisheries. Annu. Rev. Environ. Resour. 2019, 44, 177–200. [Google Scholar] [CrossRef]
  23. Ji, Y.; Liu, Q.; Liao, B.; Zhang, Q.; Han, Y. Estimating biological reference points for Largehead hairtail (Trichiurus lepturus) fishery in the Yellow Sea and Bohai Sea. Acta Oceanol. Sin. 2019, 38, 20–26. [Google Scholar] [CrossRef]
  24. Hoggarth, D.; Abeyasekera, S.; Arthur, R.; Beddington, J.R.; Burn, R.W.; Halls, A.S.; Kirkwood, G.P.; McAllister, M.; Medley, P.; Mees, C.C.; et al. Stock Assessment for Fishery Management; FAO Fisheries Technical Paper; FAO: Rome, Italy, 2006; Volume 487, ISBN 9251055033. [Google Scholar]
  25. Anderson, C.N.K.; Hsieh, C.H.; Sandin, S.A.; Hewitt, R.; Hollowed, A.; Beddington, J.; May, R.M.; Sugihara, G. Why fishing magnifies fluctuations in fish abundance. Nature 2008, 452, 835–839. [Google Scholar] [CrossRef] [PubMed]
  26. Cheung, W.W.L.; Lam, V.W.Y.; Sarmiento, J.L.; Kearney, K.; Watson, R.; Zeller, D.; Pauly, D. Large-scale redistribution of maximum fisheries catch potential in the global ocean under climate change. Glob. Chang. Biol. 2010, 16, 24–35. [Google Scholar] [CrossRef]
  27. Bouch, P.; Minto, C.; Reid, D.G. Comparative performance of data-poor CMSY and data-moderate SPiCT stock assessment methods when applied to data-rich, real-world stocks. ICES J. Mar. Sci. 2021, 78, 264–276. [Google Scholar] [CrossRef]
  28. Zhai, L.; Liang, C.; Pauly, D. Assessments of 16 Exploited Fish Stocks in Chinese Waters Using the CMSY and BSM Methods. Front. Mar. Sci. 2020, 7, 1002. [Google Scholar] [CrossRef]
  29. Liang, C.; Xian, W.; Liu, S.; Pauly, D. Assessments of 14 Exploited Fish and Invertebrate Stocks in Chinese Waters Using the LBB Method. Front. Mar. Sci. 2020, 7, 314. [Google Scholar] [CrossRef]
  30. Kalhoro, M.A.; Liu, Q.; Memon, K.H.; Waryani, B.; Soomro, S.H. Maximum sustainable yield of Greater lizardfish Saurida tumbil fishery in Pakistan using the CEDA and ASPIC packages. Acta Oceanol. Sin. 2015, 34, 68–73. [Google Scholar] [CrossRef]
  31. Baset, A.; Liu, Q.; Liao, B.; Waris, A.; Yanan, H.; Qingqing, Z.; Ahmad, I. Population dynamics of bearded croaker Johnius dussumieri (Cuvier, 1830) from Pakistani waters. J. Fish. 2020, 8, 777–783. [Google Scholar]
Figure 1. The map shows the study area (Bay of Bengal waters of Bangladesh).
Jmse 10 00063 g001
Figure 2. Schematic illustration of the time series (2001–2016) of catch and effort data of croaker from the BoB, Bangladesh.
Jmse 10 00063 g002
Figure 3. Schematic plots (a) represent the observed and predicted catch fit diagram, and (b) represent the observed and predicted CPUE fit diagram for the croaker fishery in the BoB derived from the CMSY method with 95% confidence limits (gray shaded).
Jmse 10 00063 g003
Figure 4. Schematic plots represent the result for croaker fishery in the BoB based on BSM analysis: (a) time series of catch and the estimated MSY with 95% confidence interval (CI) in gray area; (b) time series drive of relative biomass (B/BMSY); (c) time series drive of exploitation (F/FMSY); (d) relationship between F/FMSY and B/BMSY with CI of 50% (yellow), 80% (gray), and 95% (black).
Jmse 10 00063 g004
Figure 5. Kobe plot illustrating the concurrent movement of exploitation (F/FMSY) and the relative biomass (B/BMSY) of croaker in the BoB waters of Bangladesh.
Jmse 10 00063 g005
Table 1. Distributions of biomass (B), k, q, r range as prior for the CMSY used in this study.
Input ParametersRanges of the Values
Prior initial relative biomass0.2–0.6
Prior intermediate relative biomass0.2–0.6 in year (2008)
Prior final relative biomass0.2–0.6
Prior range for r0.6–1.5
Prior range for q2.23 × 10−6–7.06 × 10⁻⁶
Prior range for k69,500–208,000
Table 2. Represented ASPIC-derived population parameters (F, B, F/FMSY, and B/BMSY) of croaker in the BoB water from 2001 to 2018 using IP 0.7.
YearModels
Fox ModelLogistic (Schaefer) Model
FBF/FMSYB/BMSYFBF/FMSYB/BMSY
20010.3587.058 × 1040.940.690.3746.750 × 1040.920.71
20020.4237.654 × 1041.110.790.4447.294 × 1041.090.81
20030.4017.970 × 1041.050.820.4227.577 × 1041.040.84
20040.3808.339 × 1041.000.860.4007.927 × 1040.980.88
20050.3748.695 × 1040.990.900.3938.274 × 1040.970.92
20060.3978.880 × 1041.040.940.4168.457 × 1041.020.95
20070.3759.018 × 1040.990.940.3938.594 × 1040.970.96
20080.4288.978 × 1041.120.960.4498.553 × 1041.110.98
20090.4008.876 × 1041.060.940.4208.449 × 1041.030.96
20100.4248.847 × 1041.090.940.4358.419 × 1041.070.96
20110.4368.695 × 1041.150.930.4598.263 × 1041.130.95
20120.3458.870 × 1040.910.910.3638.434 × 1040.890.92
20130.3979.102 × 1041.050.970.4178.664 × 1041.030.99
20140.3429.303 × 1040.900.960.3598.865 × 1040.880.98
20150.3299.706 × 1040.871.000.3449.262 × 1040.851.01
20160.3381.001 × 1040.891.050.3549.545 × 1040.871.07
Table 3. Estimated r, k, and MSY of croaker in the BoB, with 95% confident intervals (CI).
Model Namek (mt)r (year−1)MSY (mt)
CMSY127,000 (87,800–171,000)1.13 (0.779–1.6)35,900 (28,500–42,900)
BSM123,000 (90,200–178,000)1.12 (0.81–1.58)33,900 (32,300–39,800)
Table 4. Management information of croaker in the BoB produced by BSM method.
Population ParametersParameter Values95% Confident Intervals (CI)
MSY33,90032,300–39,800
FMSY0.570.41–0.79
BMSY63,30045,100–88,900
Biomass (B2016)72,30050,900–87,500
B/BMSY1.140.80–1.38
Fishing mortality (F2016)0.460.38–0.65
Exploitation (F/FMSY)0.810.63–1.16
Publisher’s Note: MDPI stays neutral with regard to jurisdictional claims in published maps and institutional affiliations.

