Article

Lithium, Oxygen and Magnesium Isotope Systematics of Volcanic Rocks in the Okinawa Trough: Implications for Plate Subduction Studies

1
Seafloor Hydrothermal Activity Laboratory, CAS Key Laboratory of Marine Geology and Environment, Institute of Oceanology, Chinese Academy of Sciences, Qingdao 266071, China
2
Laboratory for Marine Mineral Resources, Qingdao National Laboratory for Marine Science and Technology, Qingdao 266071, China
3
College of Marine Science, University of Chinese Academy of Sciences, Beijing 100049, China
4
Center for Ocean Mega-Science, Chinese Academy of Sciences, Qingdao 266071, China
*
Author to whom correspondence should be addressed.
J. Mar. Sci. Eng. 2022, 10(1), 40; https://doi.org/10.3390/jmse10010040
Submission received: 14 November 2021 / Revised: 11 December 2021 / Accepted: 14 December 2021 / Published: 31 December 2021

Abstract

:
Determining the influence of subduction input on back-arc basin magmatism is important for understanding material transfer and circulation in subduction zones. Although the mantle source of Okinawa Trough (OT) magmas is widely accepted to be modified by subducted components, the role of slab-derived fluids is poorly defined. Here, major element, trace element, and Li, O and Mg isotopic compositions of volcanic lavas from the middle OT (MOT) and southern OT (SOT) were analyzed. Compared with the MOT volcanic lavas, the T9-1 basaltic andesite from the SOT exhibited positive Pb anomalies, significantly lower Nd/Pb and Ce/Pb ratios, and higher Ba/La ratios, indicating that subducted sedimentary components affected SOT magma compositions. The δ7Li, δ18O, and δ26Mg values of the SOT basaltic andesite (−5.05‰ to 4.98‰, 4.83‰ to 5.80‰ and −0.16‰ to −0.09‰, respectively) differed from those of MOT volcanic lavas. Hence, the effect of the Philippine Sea Plate subduction component, (low δ7Li and δ18O and high δ26Mg) on magmas in the SOT was clearer than that in the MOT. This contrast likely appears because the amounts of fluids and/or melts derived from altered oceanic crust (AOC, lower δ18O) and/or subducted sediment (lower δ7Li, higher δ18O and δ26Mg) injected into magmas in the SOT are larger than those in the MOT and because the injection ratio between subducted AOC and sediment is always >1 in the OT. The distance between the subducting slab and overlying magma may play a significant role in controlling the differences in subduction components injected into magmas between the MOT and SOT.

1. Introduction

The Okinawa Trough is a young back-arc basin in the western Pacific, and its magmas have been affected by the subducted Philippine Sea plate (PSP) [1]. The chemical and stable isotope (Li, O, and Mg) compositions of back-arc volcanic lavas are conventionally used to study the contributions of subducted slabs to magmas [1,2,3,4,5,6,7,8,9,10,11]. However, magmas produced by plate subduction are relatively enriched in large ion lithophile elements and light rare earth elements, but are depleted in high field strength elements; these magmas usually have low Ce/Pb ratios since Pb is preferentially extracted from subducted oceanic crust and/or sediments during plate subduction and dehydration processes [8,9,10,12]. As incompatible elements share similar partition coefficients in magmas, their ratios are rarely modified by the partial melting or crystallization processes. Thus, the incompatible element ratios can be used to trace the compositions of mantle sources. For example, Ba/La ratio is a good indicator of subduction components [13]. Ce/Pb ratios of sediments exhibit a distinctive range, below the values in mantle rocks, and are not significantly affected by fractional crystallization and partial melting processes [14]; thus, these ratios can be used to estimate the contributions of plate subduction components. Th concentrations of marine sediments are higher than the mantle values, and Th is fluid immobile relative to large ion lithophile elements. A high Th/Rb ratio in magma indicates that a sediment melt was added to the magma source [15]. In addition, high Th/La, Th/Nb, and Th/Nd ratios of the volcanic rocks indicate the contribution of sediment melts to the mantle wedge [16,17,18,19]. Ba/La, Cs/La, B/Nb, Pb/Ce, B/La, and Li/Y ratios can also serve as proxies for fluids dehydrated from subducted sediments [20].
Moreover, lithium (Li) is a fluid mobile element, and considerable Li isotope fractionation occurs during oceanic crust alteration and plate subduction [21,22,23,24]. Subducted sediments and altered oceanic crust (AOC) have high Li contents (up to 80 ppm) and a broad range of δ7Li values (−12‰ to +21‰) [4,25,26,27,28]. During the metamorphism and dehydration of subducted slabs, fluids carrying heavy Li isotopes are released from the AOC and metasomatize the overlying mantle, resulting in a high-δ7Li mantle wedge and a low-δ7Li residual plate [29,30,31]. However, Guo, et al. [1] studied Li isotope data from middle Okinawa Trough (MOT) volcanic lavas and found that the MOT magmas were affected by subduction components (with AOC:sediment = 96:4). The δ7Li values of volcanic lavas from the Izu Arc in Japan vary across the arc, decreasing with increasing depth to the subducting plate, indicating that the amount of slab fluids decreases with increasing depth [32,33,34]. Furthermore, Benton, et al. [35] analyzed the Li isotope compositions of volcanic lavas in the Mariana Arc front seamounts and found that they have heterogeneous δ7Li signatures, which reflect a complex history of exchange between the slab fluids and the forearc mantle. These results indicate that there may be uncertainties in using Li isotope data for back-arc volcanic lavas to uncover magma sources and plate subduction and implies that other isotopic tools should be used to clarify magmatic processes in western Pacific plate subduction zones.
However, the oxygen (O) isotopic compositions of the MOT volcanic lavas reveal that the magma source is mantle peridotites modified by subducted slab components [36]. The O isotopic compositions of volcanic glasses obtained from the Manus Basin and the Mariana Trough indicate that the Mariana Trough magma was affected by subduction-modified mantle [37] and that the Manus Basin magma had a δ18O-depleted mantle reservoir, wherein δ18O was increased by recent subduction and a sediment component with low δ18O and high 3He/4He values was derived from the Manus Basin plume [37]. Moreover, the O isotope compositions of volcanic glasses and phenocrysts from the Lau Basin suggest that a subduction cycle involving oxygen-rich mantle materials altered the original δ18O of the magma [38]. All these results indicate that the O isotope data for volcanic lavas may not completely reflect plate subduction processes.
Magnesium (Mg) isotopes are important geochemical tracers of both magmatic sources containing recycled crustal materials [39,40,41] and sources of fluids dehydrated from hydrous minerals in subducting plate [5,40,42,43,44]. However, the Mg isotope compositions of white schist in the western Alps reveal that the dehydration of serpentinites formed in the mantle wedge during plate subduction and exhumation can release Mg-rich fluids to the subduction channel [5]. Furthermore, a study of the Mg isotope compositions of prograde metamorphic rocks from eastern China revealed that Mg isotope fractionation was limited during continental subduction [41]. All these results also indicate that the Mg isotope data for volcanic lavas may not completely determine magma sources and plate subduction processes.
Therefore, we sought to combine the Li isotope composition of volcanic lavas with their O and Mg isotope compositions to understand the magmatic processes involved in forming volcanic lavas and the influence of plate subduction on magmas in the Okinawa Trough (OT). However, previous studies have shown that subducted sediments significantly influence the mantle source of magmas beneath the OT [2,10,19,45,46]. Although slab-derived fluids are also considered to contribute to the OT magmas [47,48,49,50], the evidence for this contribution is insufficient. Furthermore, Li and O isotope studies have been conducted in the OT, but the data remain limited to only three Li isotope analyses in the MOT. O isotope studies have primarily focused on crustal contamination as a source of magma formation [36,51,52,53], and the study of the Mg isotopic compositions of volcanic lavas has not yet been applied to the OT. Here, we investigate the major and trace elements as well as the Sr, Nd, Li, O, and Mg isotopic compositions of volcanic lavas from the MOT and SOT, with the goal of establishing how OT volcanic lavas form and what they represent for understanding the effects of subduction components on back-arc magmas.

2. Geologic Setting

The OT is a young back-arc basin developed in response to the subduction of the PSP (Figure 1) [11,54,55,56] and provides a window into understanding the influences of plate subduction on the back-arc basin evolution, mantle melting, crust-mantle interactions, and seafloor hydrothermal activity [1,11,46,57,58]. According to the prevailing tectonics, the OT can be divided into three parts: northern OT (NOT), MOT, and SOT, bounded by the Tokara Fault and the Kerama Fault, respectively [1,11,50]. The crustal thicknesses of the NOT, MOT, and SOT segments are 15 to 23 km, 12 to 18 km, and 10 to 16 km, respectively [54,59,60,61,62,63,64]. The depths to the Mohorovičić discontinuity (Moho) are 27–30 km and 16–22 km in the NOT and SOT, respectively [59,65,66]. The subduction direction of PSP is nearly perpendicular to the axis of the MOT, with a slab depth of 150–200 km, and becomes progressively more oblique to the south, with a slab depth of ~150 km [11,47,50,67,68]. The subduction rates of PSP increase from 4.9 to 7.3 cm/a from north to south [11,56]. In addition, the convergence rate gradually increases from ~6–7 cm/a in central Ryukyu to ~7–13 cm/a in southern Ryukyu [11,56,69], and the back-arc extension rate increases from 2 cm/a in the NOT to 5 cm/a in the SOT [65,69,70].
The OT has undergone substantial magmatic activity that has generated abundant volcanic lavas. The NOT is dominated by rhyolites and dacites [6,53]. The magma in the NOT could be generated by the differentiation of basaltic melt contaminated by an enriched crustal component [53]. The MOT volcanic lavas exhibit bimodal compositional distribution, forming a basaltic-rhyolitic dominant suite with scarce andesitic lavas [6,72,73]. The Sr-Nd-Pb isotope compositions suggest that the magma source of the MOT volcanic lavas resembles the depleted mantle (DM) but also shows signatures of the enriched mantle II (EMII), indicating that the mantle source for the MOT volcanic lavas is a hybrid of the DM and EMII endmembers [74]. Geochemical modelling shows that the magma source for the MOT volcanic lavas could be generated by hybridizing approximately 0.8–2.0% subducted sediments with 98.0–99.2% mantle rocks [74]. The SOT is dominated by rhyolites, basalts and basaltic andesites [50,72,75,76]. In the SOT, the petrogenesis of rhyolites is due to the ascent of basaltic magma from a deep magma reservoir to a shallow depth where fractional crystallization and crustal assimilation occurred [75]. The decrease in the DUPAL-like anomaly from the rhyolites sampled in the western part of the MOT to the volcanic lavas in the MOT axial zone can be explained by the injection of asthenospheric mantle into the pre-existing mantle with DUPAL-like signature during back-arc extension. The Tl-Pb-Sr-Nd isotopic compositions of volcanic lavas from the NOT to the SOT can be accounted for by the sediment inputs of <1%, 0.1–1% and 0.3–2%, respectively, by weight to the depleted mantle source [46]. The magma sources of the SOT basalts are mainly affected by slab fluids and bulk sediments [47]. The magma sources of the MOT basalts are affected by fluids derived from both sediment and AOC [47]. Based on the above findings, we aim to use the geochemical and Li-O-Mg isotope compositions of OT volcanic lavas to understand the origins of magmas and the effects of plate subduction on magmas in this study.

3. Sampling and Methods

3.1. Sample Collection

The volcanic lavas were collected from the MOT and SOT using a TV grab sampler in 2014 and 2016 during HOBAB (Hello Back Arc Basin) 2 and 4 cruises, respectively. The R2, T5-2, and T2 samples were obtained from the Iheya Ridge (MOT), samples T6-1 and T6-2 were obtained from the western slope of the Iheya Ridge in the MOT, and sample T9-1 was obtained from the Yaeyama Graben (SOT) (Table S1 and Figure 1).
T9-1 basaltic andesite from the SOT is a black vesicular lava sample with a compact, massive structure. It contains few phenocrysts, which predominantly consist of clinopyroxene (~5%), orthopyroxene (~5%), plagioclase (~10%), a small amount of olivine (~1%), and accessory minerals (magnetite and ilmenite). The groundmass of the T9-1 basaltic andesite is mostly composed of plagioclase and clinopyroxene microlites (Figure 2a). The phenocrysts in the T9-1 basaltic andesite are euhedral to subhedral and range from ~0.1 to ~1.0 mm in size.
R2 basalt from the MOT is a black lava with a moderately porphyritic massive structure. It contains olivine (~5%), plagioclase (~5%), and clinopyroxene (~1%) phenocrysts. The phenocrysts in the R2 basalt are euhedral to subhedral, with sizes ranging from ~0.05 to 6 mm. The groundmass of the R2 basalt is dominated by clinopyroxene and plagioclase microlites (Figure 2b). Both the T5-2 trachyandesite and T2 andesite from the MOT are black lavas with compact, massive structures. Thin sections reveal that the T5-2 trachyandesite and T2 andesite are porphyritic and that ~15% of the phenocrysts are plagioclase with minor clinopyroxene and orthopyroxene. The phenocrysts in the T5-2 trachyandesite and T2 andesite samples are euhedral to subhedral, with sizes ranging from ~40 to ~300 μm (Figure 2c,d). The T6-1 pumice from the MOT (Figure 2e) is a light, white, vesicular lava. The phenocrysts (<5%) in the T6-1 pumice are primarily clinopyroxene, orthopyroxene, and plagioclase and range from ~0.2 to 0.5 mm in size. The groundmass in the T6-1 pumice is mainly composed of plagioclase microlites (Figure 2e). The T6-2 pumice from the MOT is a gray-black vesicular lava. The phenocrysts (<5%) in the T6-2 pumice mainly consist of clinopyroxene, plagioclase, and orthopyroxene, with sizes ranging from ~0.2 to 0.4 mm in size. The groundmass in the T6-2 pumice is also mainly composed of plagioclase microlites (Figure 2f).
Details about the sample processing, electron microprobe, major element and trace element, and Sr and Nd isotope analytic methods are given in the Supplementary Texts, and the sampling locations and sample analytic results can be found in Tables S1–S8.

3.2. Li, O, and Mg Isotope Analyses

The whole-rock powders and minerals were fully digested. All reagents (HF, HNO3, and HCl) were doubly distilled, and Milli-Q® water (18.2 MΩ·cm) (Merck Millipore Inc., Billerica, MA, USA) was used. For the isotopic analyses, Li was separated using organic solvent-free two-step liquid chromatography in a clean laboratory at the University of Science and Technology of China (USTC). The procedure used was described by [77]. All separations were monitored using inductively coupled plasma mass spectrometry (ICP-MS) analysis to guarantee both a high Li yield (>99.8% recovery) and a low Na/Li ratio (<0.5). The final Li concentrations of the solutions used for the multi-collector ICP-MS (MC-ICP-MS) analyses were targeted in the range of 50–100 ppb to ensure the precision and accuracy of the results. The total procedural blanks for column chromatography alone and for sample digestion and column chromatography combined were <~0.03 ng of Li. Compared with the ~200–5000 ng of Li used for our analyses, the blank correction was negligible at the uncertainty levels achieved (≤0.2‰, see below).
The lithium isotope compositions were analyzed at the USTC using a Neptune Plus MC-ICP-MS system (Thermo Fisher Scientific Inc., Waltham, MA, USA) operating in wet plasma mode using an X skimmer cone and jet sample cones (Table S9). The samples were introduced through a low-flow PFA nebulizer (~50 μL/min) coupled with a quartz spray chamber. The 7Li and 6Li isotopes were measured simultaneously by two opposing Faraday cups. Each sample analysis was bracketed before and after by analyses of the reference material L-SVEC. For a solution containing 100 ppb of Li and an uptake rate of 50 μL/min, the typical 7Li intensity was ~8 V. The in-run precision of the 7Li/6Li measurements was ≤0.2‰ for one block of 60 ratios. The external precision was based on the long-term analysis of an in-house standard (Li-QCUSTC = +8.8‰ ± 0.2‰ (2 standard deviations (SD), n = 161)). For international rock standards, repeat analyses at the USTC yielded values of +4.4‰ ± 0.3‰ (2SD, n = 8) for BHVO-2, −0.8‰ ± 0.3‰ (2SD, n = 29) for GSP-2, and +5.9‰ ± 0.5‰ (2SD, n = 9) for AGV-1, which were within the uncertainty limits of previously published results [77,78]. The results are reported in the delta notation [δ7Li = ((7Li/6Li)sample/(7Li/6Li)standard −1) × 1000] relative to the L-SVEC Li isotope standard [79].
The whole-rock and mineral oxygen isotope compositions were measured using laser fluorination with a 25 W MIR-10 carbon dioxide (CO2) laser at the CAS Key Laboratory of Crust-Mantle Materials and Environments at the USTC, Hefei. The oxygen isotope analyses and the data acquisition followed the methods described by [80,81]. O2 was extracted from the samples through reaction with bromine pentafluoride (BrF5) in nickel (Ni) bombs, and it was then converted to CO2 through reaction with a hot carbon rod. The δ18O of CO2 was measured using a Delta+ mass spectrometer. Reference minerals GBW04409 quartz (δ18O = 11.11‰ ± 0.1‰) [81] and in-house standard 04BXL07 garnet (δ18OV-SMOW = 3.70‰ ± 0.1‰) [82] were analyzed during each run. We analyzed the O isotope compositions of the whole rocks and the minerals from each sample twice, except for R2-2-Cpx and T2-Opx (Table S9). The data are reported using the usual δ18O notation relative to Vienna standard mean ocean water (V-SMOW). On a given day, the reproducibility of each standard was better than ±0.2‰ (2σ) for δ18O.
The Mg isotopes were measured using a Thermo Scientific Neptune Plus MC-ICP-MS system following the methods of [83] at the CAS Laboratory of Crust-Mantle Materials and Environments at the USTC, Hefei. The whole-rock powders and minerals were fully digested to obtain ~20 μg of Mg for chemical purification. A mixture of concentrated HF-HNO3 was used for digestion. Mg was purified in Savillex columns loaded with 2 mL of Bio-Rad AG®50W-X12 resin (Bio-Rad Laboratories Inc., Hercules, CA, USA). For the Mg isotope analyses, sample-standard bracketing was used, wherein DSM-3 was the bracketing standard. The Mg isotope compositions are reported using the standard δ notation relative to DSM-3. The uncertainties in the δ25Mg and δ26Mg values of the standards and the samples are reported as 2SD based on repeated measurements (Table S9). The data quality was carefully controlled through the repeated analysis of multiple Mg isotope standards (Table S9). The long-term external precision was better than ±0.05‰. Furthermore, each sample was processed three times under the same conditions. During the analyses, the δ26Mg values obtained for BCR-2 (−0.215‰ ± 0.017‰; n = 3) and BHVO-2 (−0.205‰ ± 0.020‰; n = 3) were all identical within the established uncertainty limits (−0.162‰ ± 0.014‰ for BCR-2 and −0.216‰ ± 0.035‰ for BHVO-2) [83].

4. Results

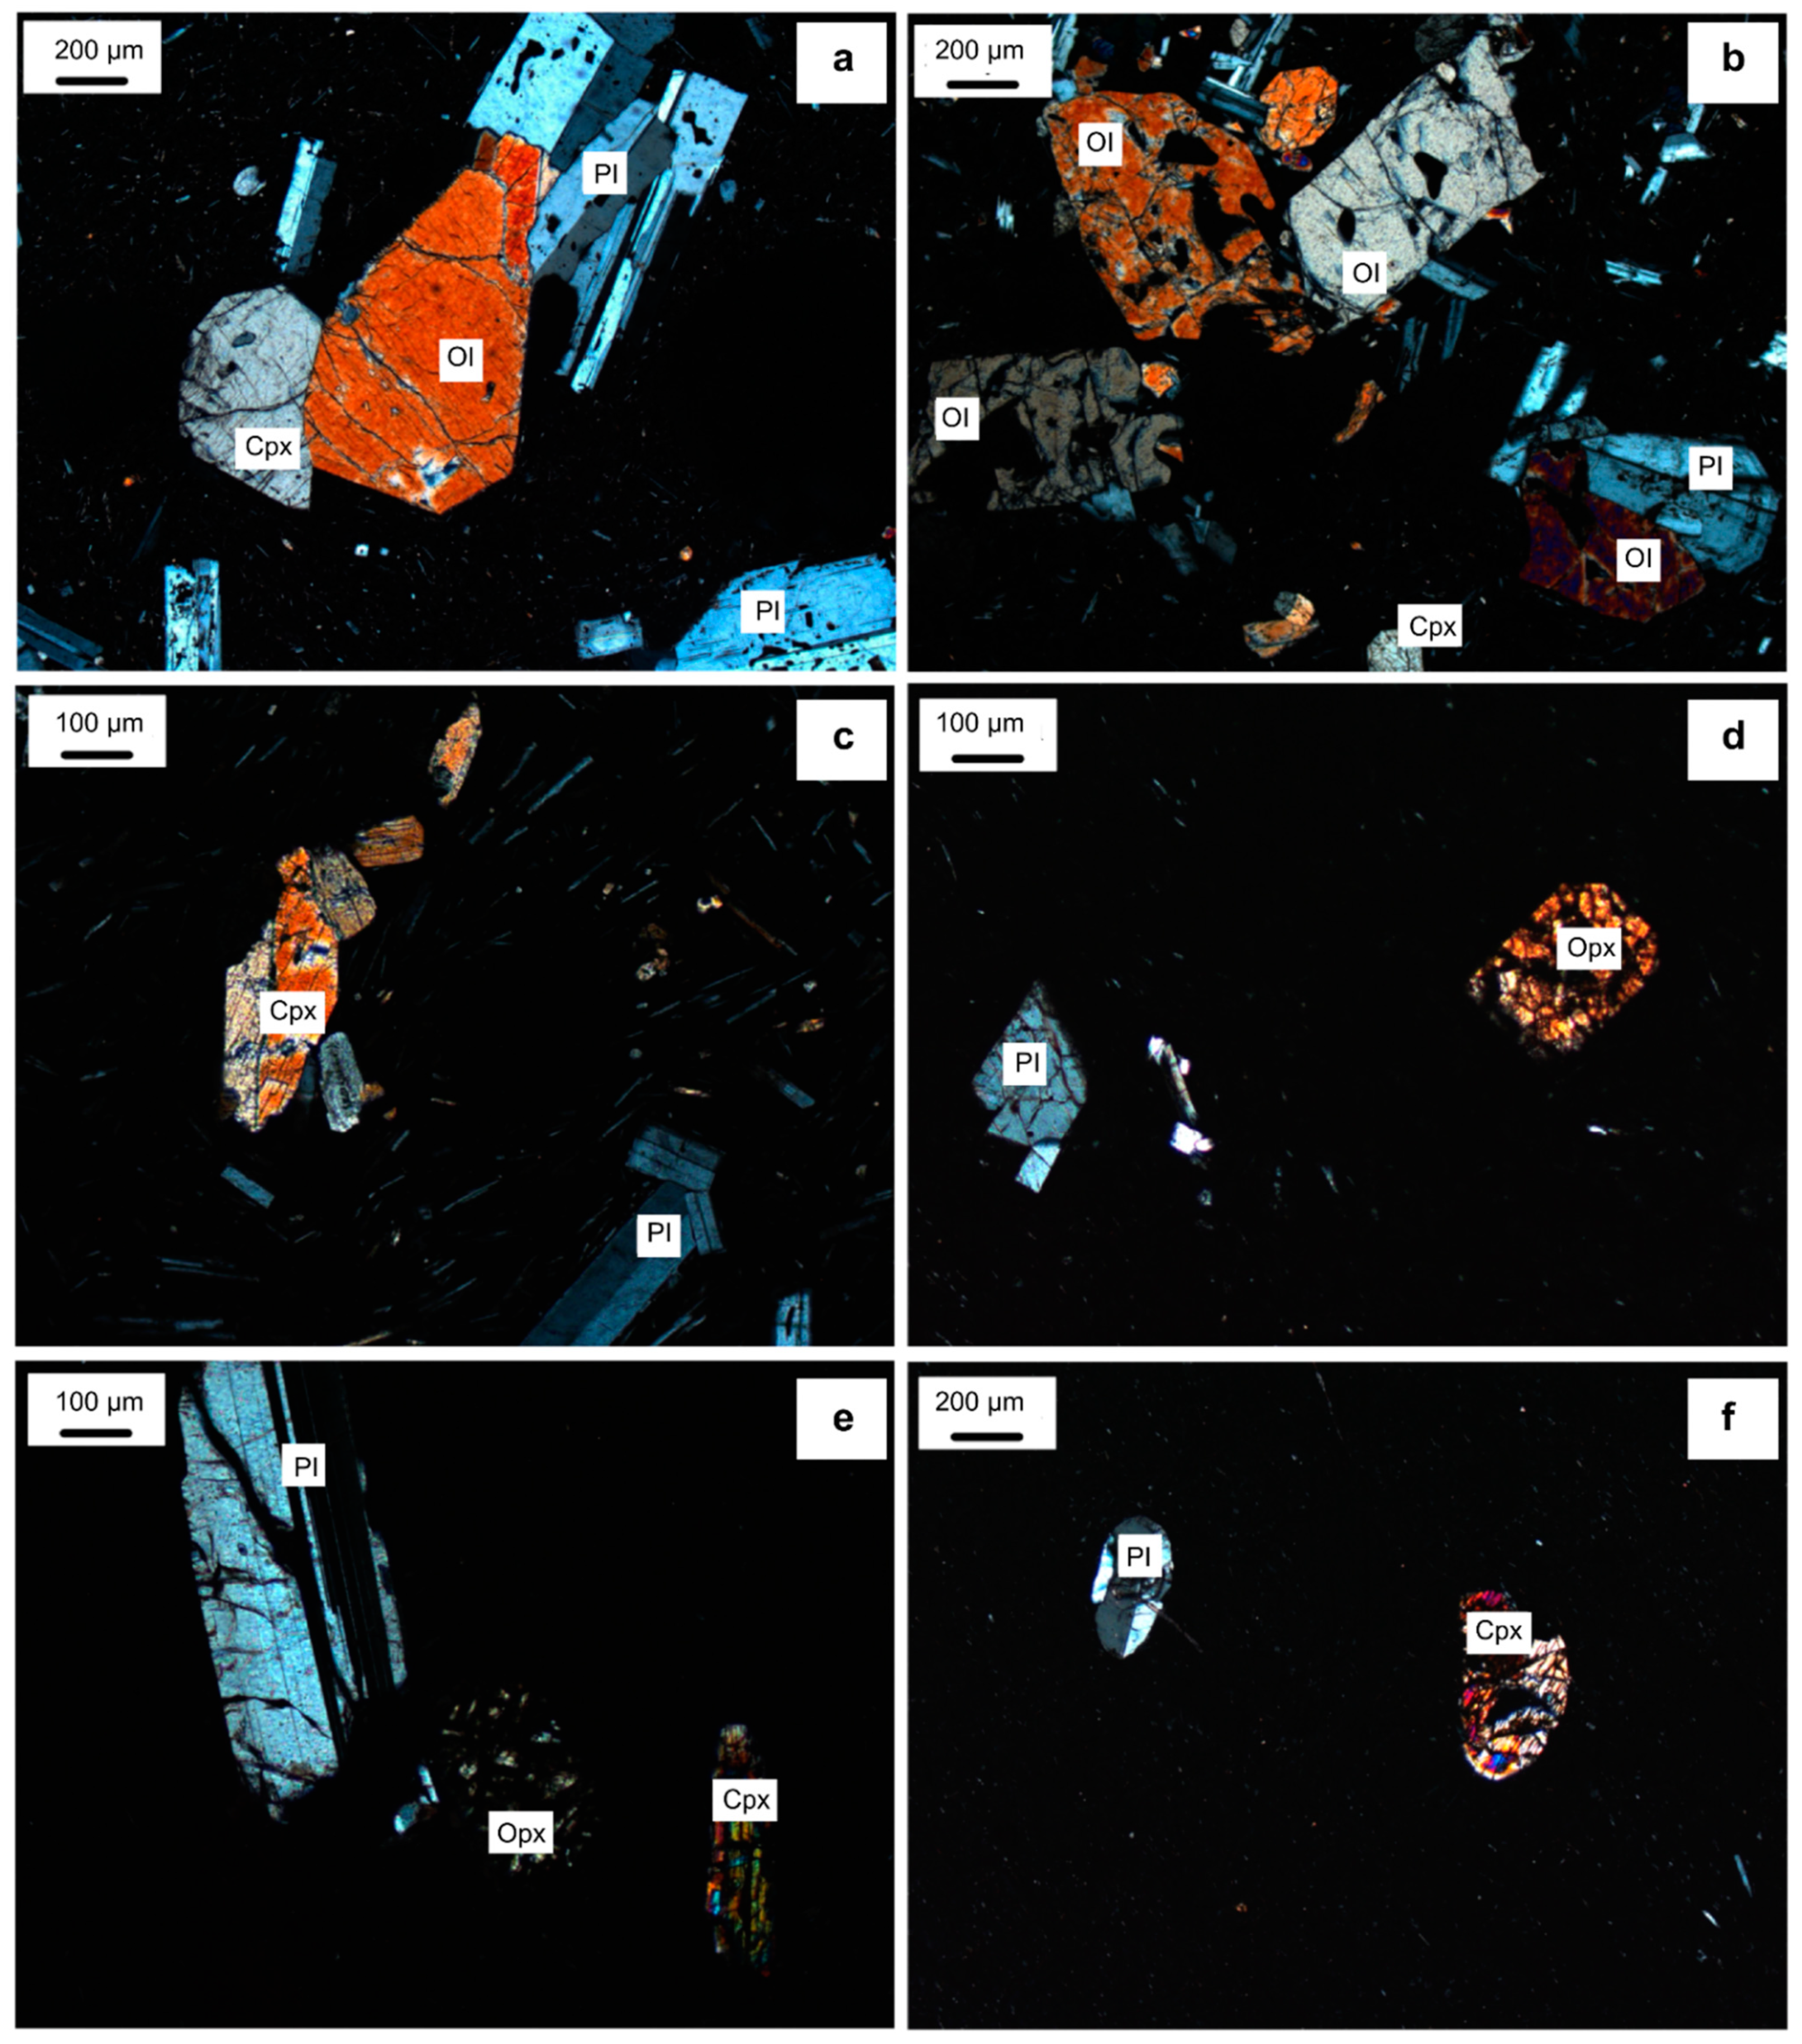
4.1. Clinopyroxene and Orthopyroxene

The clinopyroxene contents in R2 basalt, the orthopyroxene contents in T5-2 trachyandesite, T2 andesite, T6-1 and T6-2 rhyolites from the MOT, and the orthopyroxene content in T9-1 basaltic andesite from the SOT, were analyzed using an electron microprobe. The data are presented in Tables S2–S6. The clinopyroxene and orthopyroxene were unzoned, and their compositions were homogeneous (Figure 2 and Tables S2–S6). There was no notable difference between the Mg#s of clinopyroxene and orthopyroxene [80–84 in R2 (n = 11), 67–76 in T9-1 (n = 18), 59–72 in T2 (n = 14), 34–48 in T6-1 (n = 29), and 47–52 in T6-2 (n = 6)] (Tables S2–S6).
However, assuming that the mineral phases represent equilibrium compositions, the OT clinopyroxene and orthopyroxene composition data (Tables S2–S6) allowed the use of the clinopyroxene and orthopyroxene-liquid geothermobarometer of [84,85] to calculate the crystallization temperatures and pressures of the magma along its ascent path. The standard errors of the temperature and pressure calibrations were 39 °C and 2.1 kbar, respectively [85]. According to the clinopyroxene-liquid geothermobarometer (Table S4) [84], the crystallization temperature, pressure, and magma depth for formation of the clinopyroxene phenocrysts in the R2 basalt from the MOT were estimated to be in the ranges of 1112–1137 °C, 0.14–0.42 GPa, and ~8.0–16.9 km, respectively. From the orthopyroxene-liquid geothermobarometers (Table S3) [85], the crystallization temperature, pressure, and magma depth for formation of the orthopyroxene phenocrysts in the T2 andesite from the MOT were calculated to be in the ranges of 1021–1095 °C, 0.03–0.37 GPa, and 4.3–15.3 km, respectively (Table S3). The crystallization temperature, pressure, and magma depth for formation of the orthopyroxene phenocrysts in the T6-1 and T6-2 rhyolites from the MOT were estimated to be 821–884 °C and 844–858 °C, 0.11–0.59 GPa and 0.01–0.11 GPa, and 7.1–22.2 km and 3.7–7.1 km, respectively (Tables S5 and S6). The crystallization temperature, pressure, and magma source depth for forming the orthopyroxene phenocrysts in the T9-1 basaltic andesite from the SOT were estimated to be 1095–1138 °C, 0.16–0.40 GPa, and 8.4–16.1 km, respectively (Table S2).

4.2. Major Element and Trace Element Compositions of the Volcanic Lavas

The major element concentrations of the volcanic lavas obtained from the MOT and SOT are presented in Table S7. No increase in 87Sr/86Sr ratios was observed with increasing LOI (Figure S1), indicating that the samples were free of seawater alteration. On the total alkalis-silica (TAS) diagram, the volcanic lavas plot in the R2 basalt, T9-1 basaltic andesite, T5-2 trachyandesite, T2 andesite, T6-1 and T6-2 rhyolite fields, indicate they can be classified as subalkaline (SiO2 = 51.62 − 73.85 wt.%; Na2O + K2O = 2.63 − 8.16 wt.%) (Figure 3) [86,87,88]. On the K2O vs. SiO2 diagram, the T9-1 basaltic andesite from the SOT and the R2 basalt from the MOT plot in the low-K arc tholeiitic field, the T5-2 trachyandesite and T2 andesite from the MOT plot in the medium-K calc-alkaline field, and the T6-1 and T6-2 rhyolites from the MOT, are in the high-K calc-alkaline field (Figure 3). On the Harker diagrams (Figure S2), the major element oxides (except for Na2O, TiO2, and P2O5) of the MOT volcanic lavas exhibit first-order trends, indicating that they evolved through the fractional crystallization of magma [89]. In addition, the T9-1 basaltic andesite from the SOT had lower Na2O (2.20 wt.%) and higher Al2O3 (18.55 wt.%) contents than the MOT volcanic lavas (Na2O = 2.77–5.43 wt.%, Al2O3 = 12.23–17.08 wt.%) (Figure S2).
The trace element concentrations of the OT lava samples are presented in Table S8. The primitive mantle-normalized spider diagrams for the MOT and SOT volcanic lavas reveal obvious enrichment in large ion lithophile elements relative to the high field strength elements and rare earth elements (Figure 4). All the samples had negative niobium (Nb), tantalum (Ta), and titanium (Ti) anomalies and distinctly positive Pb anomalies (Figure 4). Moreover, the MOT rhyolites exhibited significant Sr, P, and Ti depletions (Figure 4e,f), suggesting mineral fractionation. The R2 basalt from the MOT and the T9-1 basaltic andesite from the SOT had slight Sr enrichments (Figure 4a). The chondrite-normalized REE diagrams of the MOT and SOT volcanic lavas reveal light REE (LREE) enrichment relative to heavy REEs (HREEs) (Figure 4), and the MOT volcanic lava samples ((La/Yb)N = 2.23–3.68) were more fractionated than the T9-1 basaltic andesite sample ((La/Yb)N = 1.66) from the SOT. The MOT rhyolites exhibited significant negative europium (Eu) anomalies (Eu/Eu*T6-1 = 0.55, and Eu/Eu*T6-2 = 0.36, where Eu/Eu* = 2EuN/(SmN + GdN)), the MOT trachyandesite and andesite exhibited small negative Eu anomalies (Eu/Eu*T5-2 = 0.85, and Eu/Eu*T2 = 0.86), and the MOT basalt and the SOT basaltic andesite exhibited negligible Eu anomalies (Eu/Eu*R2 = 0.99, and Eu/Eu*T9-1 = 1.05). However, fractionation between the LREEs and HREEs was higher in the MOT volcanic lavas ((La/Yb)N = 2.23−3.68) than in the SOT lava ((La/Yb)N = 1.66).

4.3. Li–O–Mg Isotope Compositions of the Volcanic Lavas and Minerals

The Li isotopic compositions of the OT volcanic lavas and minerals are reported in Table S9 and are plotted in Figure 5a,b. The δ7Li values of all samples vary from −5.05‰ to +5.61‰ (Figure 5a). The highly fractionated rhyolites (T6-1 and T6-2) have higher δ7Li values than the mafic and intermediate lavas (Figure S3b), probably as a result of late-stage magma evolution; thus, these data are not included in the following discussion. The T5-2 trachyandesite from the MOT had lower δ7Li values (−0.83‰ to +2.90‰) than the other MOT samples (Figure 5a). The majority of the δ7Li values in the MOT volcanic lavas fell within the range of mid-ocean ridge basalts (MORBs) (+1.50‰ to +6.85‰) (Figure 5a,b) [22,33,91,92,93], indicating that these samples originated from similar magmatic sources. The glass in T9-1 basaltic andesite from the SOT had the highest δ7Li value (+4.98‰) (Table S9), while the δ7Li values of clinopyroxene (+0.49‰), orthopyroxene (+1.04‰), and plagioclase (−5.05‰) in the T9-1 basaltic andesite sample from the SOT were all lower than those of MORBs (Table S9 and Figure 5a). The δ7Li values of the MOT and SOT plagioclase and clinopyroxene phenocrysts were lower than those of olivine, orthopyroxene, and glass (Table S9 and Figure 5a). Furthermore, most of the δ7Li values obtained in this study were lower than those obtained for the MOT volcanic lavas by [1] (δ7Li = +2.6‰ to +6.9‰, n = 3). The δ7Li values of the OT basaltic lavas (δ7LiR2-1 = +3.33‰, and δ7Li9-1 = +3.45‰) were lower than those reported for the Lau Basin basalts (δ7Li = +4.32‰ to +4.82‰) [4].
In addition, the Li isotope fractionations (Δ7Lix−y = δ7Lix−δ7Liy) between coexisting mineral phases (x-y) were also calculated. The Δ7Licpx-ol (Li isotope fractionation between coexisting clinopyroxene and olivine) and Δ7Lipl-ol (Li isotope fractionation between coexisting plagioclase and olivine) values of the R2 basalt from the MOT were −3.76 and −3.77, respectively. The Δ7Licpx-ol, Δ7Liopx-ol, and Δ7Lipl-ol values of the T5-2 trachyandesite from the MOT were −3.24, −0.07, and −0.55, respectively. The Δ7Licpx-ol, Δ7Liopx-ol, and Δ7Lipl-ol values of the T9-1 basaltic andesite from the SOT were −2.35, −1.80, and −7.88, respectively. The Δ7Li values of all samples were negative. This cannot be explained by closed system equilibrium between the different minerals and olivine.
The oxygen isotopic compositions of the OT volcanic lavas and minerals varied from +4.83‰ to +6.69‰ (Table S9 and Figure 5c). The δ18O values showed no significant increase with increasing SiO2 concentrations for whole-rock samples (Figure S3a). The δ18O values (+5.38‰ to +5.79‰) of R2-1 and R2-2 basalts from the MOT fell within the MORB range (Figure 5c,d) (+5.30‰ to +5.80‰) [110,111]. The δ18O values of the T5-2 trachyandesite exhibited a broader range (+5.15‰ to +6.69‰) than those of the other MOT samples (Figure 5c). The majority of the δ18O values (+4.83‰ to +5.80‰) of the T9-1 basaltic andesite and its mineral samples from the SOT were lower than those of the MOT volcanic lava samples (+5.15‰ to +6.69‰) (Table S9 and Figure 5c). Moreover, the δ18O values of all the OT volcanic lava and mineral samples analyzed in this study overlapped with the δ18O range previously reported for volcanic lavas from the Manus Basin (+4.96‰ to +6.68‰) [37,100]. The whole-rock δ18O values of T5-2 (+6.69‰) and T6-2 (+6.08‰) fell within the range of the MOT volcanic lavas (+6.0‰ to +7.6‰) analyzed by [36]. The δ18O values of the T9-1 (+5.29‰), R2-1 (+5.41‰), R2-2 (+5.38‰), T2 (+5.69‰), and T6-1 (+5.84‰) whole-rock samples (Table S9) were lower than those of the volcanic lavas (+6.6‰ to +8.8‰) analyzed by [36,53]. The majority of the δ18O values of the T9-1 basaltic andesite from the SOT and the R2-1 and R2-2 basalts from the MOT were lower than those measured for the volcanic lavas of the North Fiji Basin (δ18O = +5.78‰ to +6.06‰) [38] and the Mariana back-arc basin (δ18O = +5.8‰ to +6.0‰) [7].
In addition, the δ18O values of plagioclase and glass were higher than those of olivine, clinopyroxene, and orthopyroxene in the MOT and SOT volcanic lavas (Table S9), and the δ18O values of olivine, clinopyroxene, and orthopyroxene exhibited smaller variations than those of volcanic glass (Figure 5c). The Δ18Ocpx-ol and Δ18Opl-ol values calculated for the R2 basalt from the MOT were 0.08 and 0.22, respectively. The Δ18Ocpx-ol, Δ18Oopx-ol, and Δ18Opl-ol values calculated for the T5-2 trachyandesite from the MOT were −0.09, 0.41, and 0.75, respectively. The Δ18Ocpx-ol, Δ18Oopx-ol, and Δ18Opl-ol values calculated for the T9-1 basaltic andesite from the SOT were 0.16, 0.67, and 0.66, respectively. These data imply that the crystallization of the magma and minerals preferentially incorporated isotopically heavy O into the orthopyroxene and plagioclase phenocrysts, resulting in the relative enrichment of lighter O isotope in the olivine phenocrysts.
The Mg isotope compositions of the OT volcanic lavas and their minerals varied from −0.31‰ to −0.09‰ (Table S9 and Figure 5e). No correlations existed between Mg isotopes and SiO2 concentrations for whole-rock samples (Figure S3c). The δ26Mg values of the R2 basalt from the MOT ranged from −0.31 to −0.20‰, and all the values fell within the MORB range (−0.26‰ ± 0.07‰) [107] (Figure 5e,f and Table S9). The whole-rock δ26Mg values (−0.25‰ to −0.11‰) of the MOT andesite (T2) and trachyandesite (T5-2) were slightly higher than those of MORBs. All the δ26Mg values (−0.16‰ to −0.09‰) of the T9-1 basaltic andesite from the SOT were higher than those of MORBs (Figure 5e,f). The δ26Mg values of the clinopyroxene, orthopyroxene, and glass in the T9-1 basaltic andesite from the SOT were higher than the δ26Mg values of those from the MOT volcanic lavas (Table S9 and Figure 5e). Furthermore, the Δ26Mgcpx-ol value calculated for the R2 basalt from the MOT was −0.01. The Δ26Mgcpx-ol and Δ26Mgopx-ol values calculated for the T5-2 trachyandesite from the MOT were −0.01 and −0.02, respectively. The Δ26Mgcpx-ol and Δ26Mgopx-ol values calculated for the T9-1 basaltic andesite from the SOT were 0.02 and 0.01, respectively.
However, only the δ7Li (+3.33‰ to +4.09‰), δ18O (+5.41‰ to +5.78‰), and δ26Mg (−0.28‰ to −0.20‰) values of the glass or whole rock from the mafic R2 basalt might be considered indicative of magma source compositions.

5. Discussion

5.1. Genesis and Evolution of Magmas

The crystallization temperatures and pressure ranges (Tables S2–S6) of the corresponding ascending magmas were estimated from the pyroxene compositions of the volcanic lavas (Section 4.1) [84,85,112,113]. The crystallization temperature, pressure, and magma depth for forming the orthopyroxene phenocrysts in T6-2 rhyolites from the MOT were lower and shallower than those for forming the clinopyroxene phenocrysts in the R2 basalt, the orthopyroxene phenocrysts in the T2 andesite from the MOT, and the orthopyroxene phenocrysts in the T9-1 basaltic andesite from the SOT (Tables S2–S6, Figure 6). The average depths of ascending magmas for forming the clinopyroxene phenocrysts in the R2 basalt, orthopyroxene phenocrysts in the T2 andesite, orthopyroxene phenocrysts in T6-1 rhyolites from the MOT, and orthopyroxene phenocrysts in the T9-1 basaltic andesite from the SOT were estimated to be 11.3 km (n = 11), 10.9 km (n = 14), 12.7 km (n = 28), and 12.6 km (n = 13), respectively. These results suggest that the ascending magmas for forming the R2 basalt, T2 andesite, and T6-1 rhyolites in the MOT and the T9-1 basaltic andesite in the SOT originated from near the crust-mantle transition zone (13–14 km) [62].
The LILE, Pb, and Sr enrichments and the Nb, Ta, and Ti depletions in the MOT and SOT lavas (Figure 4) produced trace element distribution patterns similar to those of the continental crust [114]. If considerable crustal contamination or magma mixing occurred, the 87Sr/86Sr and 143Nd/144Nd of the volcanic lavas would then increase and decrease, respectively, with increasing SiO2 [12,89]. However, except for the T6-1 and T6-2 rhyolites, the 87Sr/86Sr and 143Nd/144Nd of the MOT and SOT volcanic lavas remained nearly constant with increasing SiO2 content (Figure 7), which is unlikely to suggest mixing or assimilation between variably evolved OT magmas, indicating that crustal contamination had a minimal effect on the evolution of MOT and SOT magmas. However, the 87Sr/86Sr ratios of MOT volcanic lavas could be strongly affected by the involvement of AOC or sediments, resulting in elevated 87Sr/86Sr ratios in the R2 and T2 volcanic lavas. Furthermore, as observed in the Harker diagrams (Figure S2), the significant negative correlations among SiO2 and Al2O3, CaO, FeOt, and MgO highlight the fractional crystallization of olivine, clinopyroxene, and plagioclase [115]. P2O5 and TiO2 initially increased and then decreased with increasing SiO2 content, suggesting that apatite fractionally crystallized after the SiO2 content reached >60%. Magnetite fractionally crystallized when the SiO2 content was >55% (Figure S2) [115,116].
The sample locations, trace element patterns, and Sr-Nd isotopic compositions of the T5-2 trachyandesite (27°32.86′ N, 126°59.36′ E, 1283 m) and T2 andesite in the MOT (27°32.76′ N, 126°58.52′ E, 1240 m; 87Sr/86Sr = 0.704522, 143Nd/144Nd = 0.512865) [74] were similar to those previously reported for MOT andesite (287-2: 27°29.50′ N, 126°50.00′ E, 1380 m; 87Sr/86Sr = 0.704252, 143Nd/144Nd = 0.512806) [73] (Figure 4c), indicating that samples T5-2, T2, and 287-2 may be derived from a similar magma source [117]. Furthermore, Li, et al. [74] and Shinjo and Kato [73] suggested that the 287-2 and T2 samples were formed by fractional crystallization of basaltic magmas, implying that the T5-2 sample was also produced in this way. Similarly, the sampling location (Table S1), trace element distribution pattern, and Sr-Nd isotope compositions of the R2 basalt from the MOT (27°32.47′ N, 126°58.62′ E, 1309.7 m; 87Sr/86Sr = 0.704188, 143Nd/144Nd = 0.512763) [74] were similar to those of Type 1 basalt (A6: 27°31.33′ N, 126°56.60′ E, 967 m; 87Sr/86Sr = 0.704044, 143Nd/144Nd = 0.512827) (Figure 4b) previously reported by [50], indicating that the R2 sample and Type 1 sample A6 from [50] were both produced by the crystallization of a similar magma source and did not suffer notable crustal contamination or undergo any assimilation and fractional crystallization (AFC) processes [50].
However, the T9-1 basaltic andesite from the SOT had lower trace element and REE concentrations than the R2 basalt from the MOT (Table S8, Figure 4a,b), implying that the T9-1 basaltic andesite and the R2 basalt originated from different magmatic sources and evolved through different processes [50]. Furthermore, the trace element distribution pattern of the T9-1 basaltic andesite from the SOT differed from those of other SOT samples previously reported by [50], suggesting that the source of the SOT magma was heterogeneous and that fractional crystallization of a primitive magma was insufficient to form the different compositions of the SOT magmas [50].
In addition, the T6-1 and T6-2 samples were obtained from the western slope of the trough (Figure 1), and they exhibited the lowest and highest 87Sr/86Sr and 143Nd/144Nd, respectively, among all the OT samples (Figure 7). These pumices all had lower crystallization temperatures and magma depths than the T2 samples obtained from the Iheya Ridge (Figure 6). Zhang, et al. [118] analyzed the geochemistry of the T6-1 and T6-2 pumices and concluded that they did not originate from MOT basaltic rocks through either partial melting or fractional crystallization processes; rather, they were generated from a potassium-rich magma source in the OT. The trace element and REE patterns of the T6-1 and T6-2 rhyolites from the MOT resemble those of Type 2 rhyolites previously reported by [73] (Table S8 and Figure 4e), which can be explained by AFC processes in the MOT basaltic magma [73]. Therefore, the T6-1 and T6-2 rhyolites from the MOT originated from different magma sources and underwent magmatic evolution histories different from those of other MOT samples.

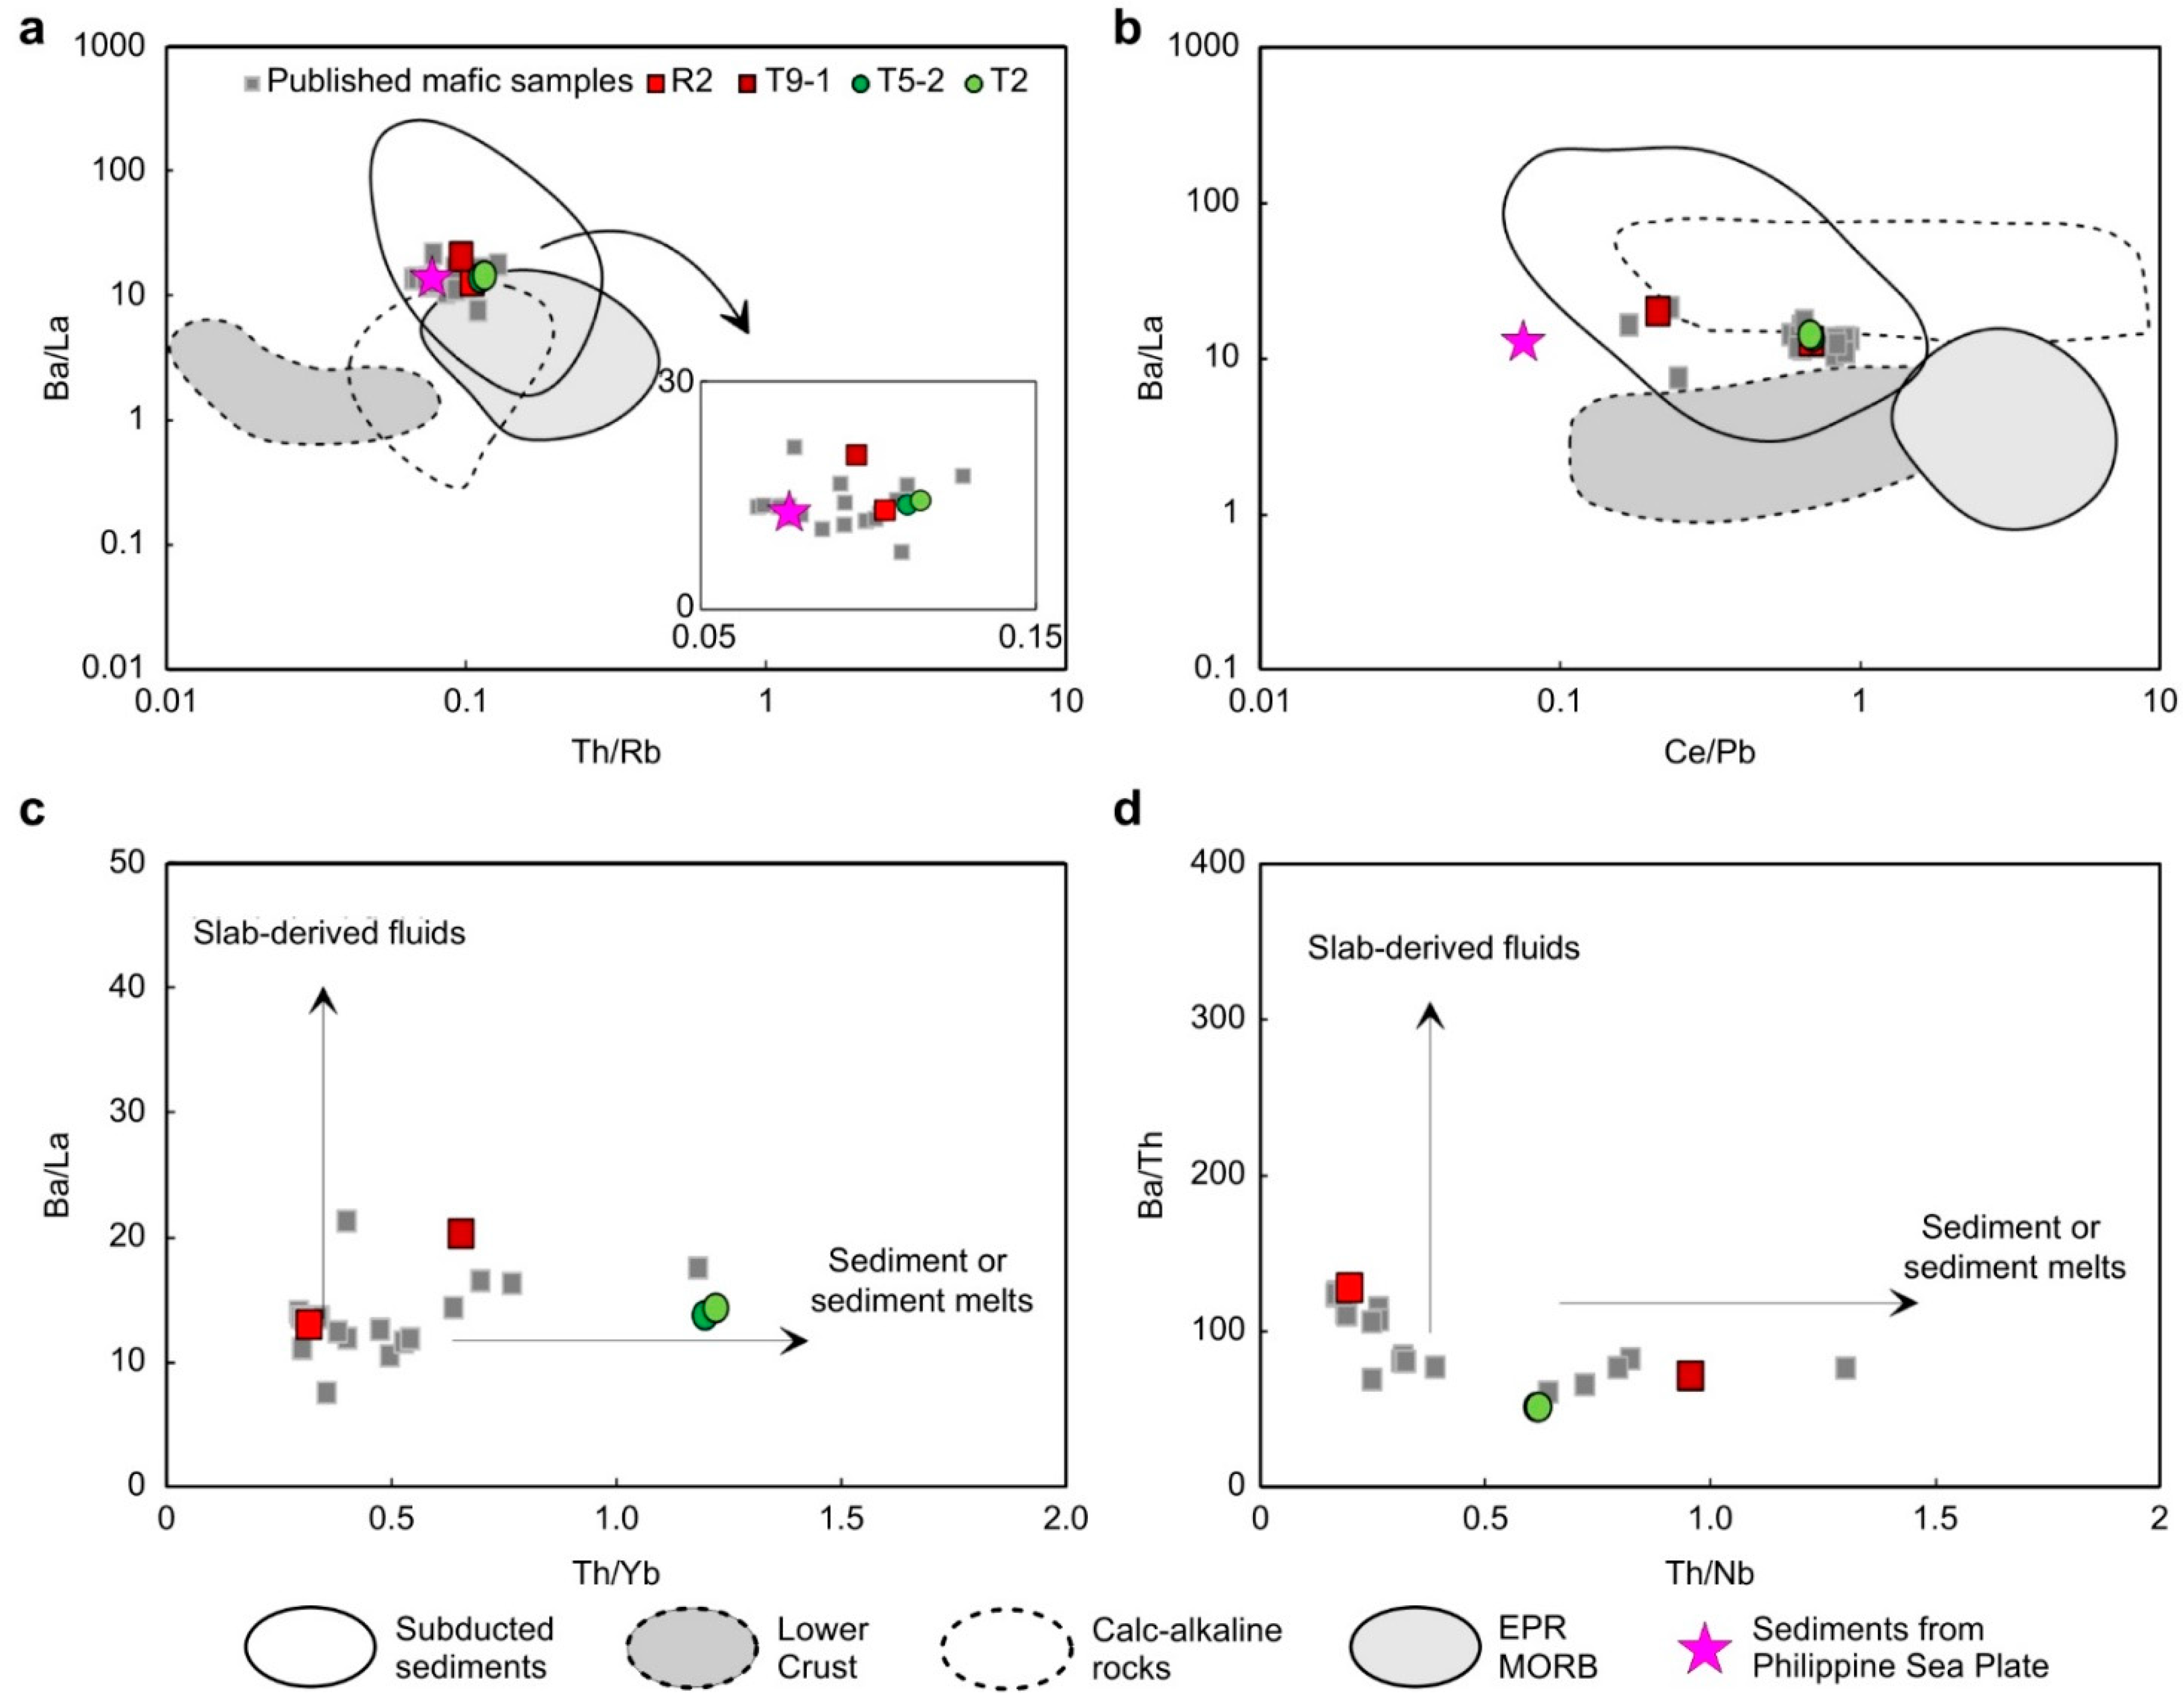
5.2. Influence of Subduction Components Inferred from Trace Elements

The MOT basalts and SOT basaltic andesite were notably enriched in LILEs and Pb and were depleted in HFSEs (Figure 4 and Table S8), indicating that the magma from which these lavas formed had been affected by subduction component input [9]. On the Ba/La vs. Th/Rb and Ce/Pb vs. Ba/La diagrams (Figure 8), all the MOT and SOT whole-rock samples plot are within the subducted sediment zone, indicating that all these volcanic lavas have been affected by subducted sediments. The Ba/La vs. Th/Yb and Ba/Th vs. Th/Nb diagrams (Figure 8) also show that the MOT and SOT trace element ratios trend toward sediment assimilation. All these diagrams suggest that the OT volcanic rocks have been affected by subducted sediment. However, whether slab-derived fluids influenced the mantle beneath the back-arc is still uncertain.
The Pb content of crustal sediments (19.9 ppm) [10] is two orders of magnitude greater than that of the mantle (0.6 ppm) [12,90], and the addition of dehydration fluids from the subducting plate can increase the contents of fluid-active elements [108]. However, the ratios of fluid-inactive elements to active elements, such as the Nd/Pb ratio (1.33) of the T9-1 basaltic andesite from the SOT, were notably lower than those of MOT samples (basalt = 4.65, andesite = 3.80, trachyandesite = 3.79, and rhyolites = 2.15–3.16), and the Nd/Pb ratios of all MOT and SOT samples were lower than that of the primitive mantle (~7.3) [90], suggesting that a Pb-rich component (i.e., subducted sediment) was present in the OT magma source [12].
The Ba/La vs. Th/Yb and Ba/Th vs. Th/Nb diagrams (Figure 8) show that the MOT and SOT samples trend toward sediment assimilation, which suggests that the OT volcanic lavas were affected mainly by subducted sediment-derived melts and that subduction fluids had less influence on the magma. Furthermore, the Ba/La ratio of the SOT basaltic andesite (20.32) was considerably higher than those of MOT basalt (13.05), andesite (13.79), trachyandesite (14.35), and rhyolites (11.76–14.81). The Ce/Pb ratio of the T9-1 basaltic andesite (2.11) from the SOT was significantly lower than those of MOT samples (4.99–7.05). Compared to the Ba/La ratios of MOT volcanic rocks (11.76–14.81), the Ba/La ratios (20.32) of T9-1 basaltic andesite from the SOT were closer to the Ba/La ratios of sediment in the Philippines Sea (25.11) [10] (Figure 8), all of which indicate that the SOT magma from which the T9-1 basaltic andesite formed was affected by subducted sediments [8,12,13,14,74,115].

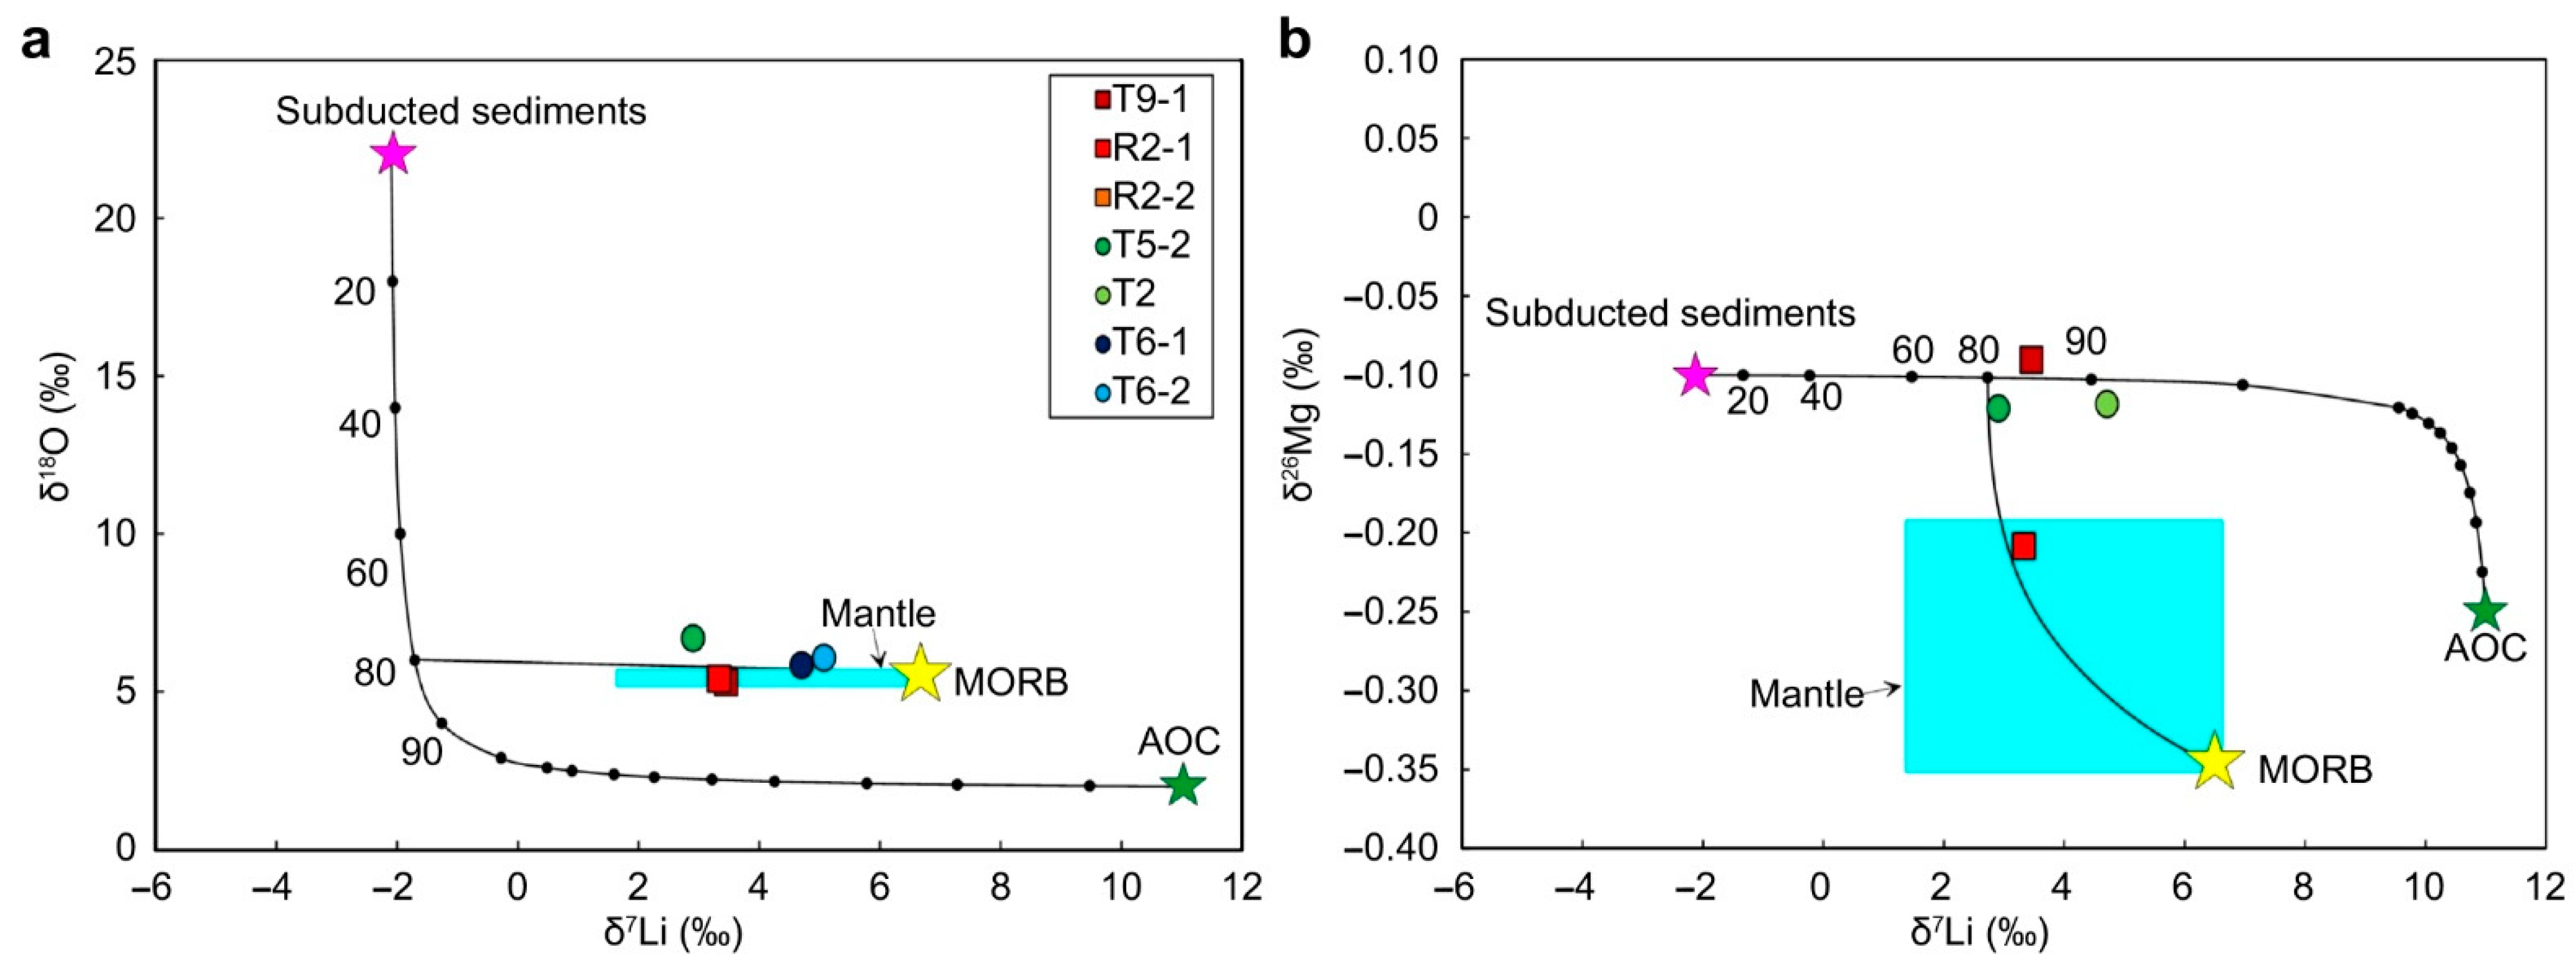
5.3. Subduction Input of Low-δ7Li Components to the OT Magmas

The Li isotope characteristics of back-arc volcanic lavas are known to be potentially influenced by subducted slab-derived components [1,123,124], which include AOC-derived hydrous fluids, subducted sediments, and oceanic crust- and/or sediment-derived silicate melts [125,126]. Although the low δ7Li values are not consistent with subduction fluids or the asthenosphere (i.e., MORBs), they may be related to the melting of a dehydrated slab [4,96,124,127]. Previous research has demonstrated that low δ7Li values can be interpreted as dehydration signatures resulting from the hydrothermal alteration of oceanic crust (−10.90‰ to +20.80‰) [26,94]. During high-temperature plate subduction processes, low-δ7Li components are released and interact with the upper mantle, thereby resulting in low δ7Li values in the range of −6‰ to +10‰ [35]. Other studies have shown that alteration of the upper oceanic crust at high-temperature can also result in low δ7Li values (e.g., −1.7‰) [26,128], and forearc serpentinites exhibit δ7Li values of less than −6‰ [35]. Additionally, eclogites, which represent dehydrated oceanic crust, have low δ7Li values (−11‰ to +0.3‰), and the direct melting of such siliceous eclogites could result in low-δ7Li melts [28]. Some sediments, especially young oceanic sediments that have not been altered by seawater, also exhibit low δ7Li values (−4.31‰ to +23.33‰) [27]. Thus, fluids with relatively low δ7Li values may also be released from subducted sediments [3].
The δ7Li values of glass and whole-rock samples from the T5-2 trachyandesite, T2 andesite, R2 basalt in the MOT and the T9-1 basaltic andesite in the SOT were significantly lower than those of whole-rock data for T6-1 and T6-2 rhyolites in the MOT (Table S9). This contrast implies that the magmas from which the T5-2 trachyandesite, T2 andesite, and R2 basalt in the MOT and the T9-1 basaltic andesite in the SOT formed could have been affected by a low-δ7Li component that may be released from oceanic sediments or subducted AOC.
Furthermore, previous research has shown that Li isotopes are not fractionated in closed systems at temperatures greater than 350 °C [33,129,130]. Thus, Li isotopes are not expected to have fractionated during OT magma evolution [33,131,132]. However, the δ7Li values of clinopyroxene in the T5-2 trachyandesite (−0.83‰) from the MOT and T9-1 basaltic andesite (0.49‰) from the SOT and of plagioclase in the R2-1 basalt (−0.71‰) from the MOT and T9-1 basaltic andesite (−5.05‰) from the SOT were lower than those of olivine, orthopyroxene, glass (Table S9), and MORBs (+1.50‰ to +6.85‰) [22,33,91,92,93] (Figure 5a,b). This difference suggests that the Li isotope compositions of plagioclase and pyroxene may have been modified by a low-δ7Li fluid or melt during magma evolution and that the 6Li content was enriched in clinopyroxene and plagioclase during mineral crystallization and mantle metasomatism. Overall, the negative Li isotope fractionation (Δ7Lix-ol < 0) between silicate minerals and olivine during mineral crystallization may have been due to the low-δ7Li components that are released from oceanic sediments or AOC.

5.4. Subduction of Low-and High-δ18O Components

For volcanic rocks, magma differentiation from mafic to felsic compositions at high temperatures does not result in significant oxygen isotope fractionation (usually less than 0.3–0.4‰) (e.g., from 5.8‰ for basalts to 6.1‰ for rhyolites at ~90% differentiation) [133,134]. The δ18O values of glass (6.31‰) and plagioclase (5.99‰) in the T5-2 trachyandesite, glass (6.21‰) and orthopyroxene (5.86‰) in the T2 andesite, the whole-rock samples of T5-2 (6.69‰) trachyandesite, T6-1 (5.84‰), and T6-2 (6.08‰) rhyolites from the MOT (Table S9) were all higher than those of MORBs (+5.30 to +5.80‰) [110,111] (Figure 5c); this feature also indicates that these volcanic lava samples were produced by high-δ18O magmas [135,136]. The high δ18O values of the evolved magmas may be related to crustal contamination; however, no correlations were observed between the Sr-Nd isotopes and SiO2 concentrations in OT lavas (Figure 7), suggesting that little crustal contamination occurred [11,36,50,73,74]. Alternatively, the high-δ18O signatures could be due to the subduction of δ18O-rich components [110,137]. Marine carbonates (δ18O = 25–32‰), siliceous oozes (δ18O = 35–42‰), and pelagic clays (δ18O = 15–25‰), which are major components of sediments subducting beneath the volcanic arc, all have higher δ18O values than MORBs [2]. Therefore, the addition of subducted sediments to the magma could explain the higher δ18O values of MOT volcanic rock samples.
However, O isotopes can be used to constrain the contribution of slab melts to island arc magmas, thereby indicating the origin of a melt [2]. The δ18O values of the R2-1 (5.41–5.79‰) and R2-2 (5.38–5.78‰) basalts from the MOT fell within the MORB range (5.3–5.8‰), implying that the volcanic lava samples in the MOT originated from mantle-derived magma (Figure 5c) [111,138]. The whole-rock and mineral δ18O values (5.15–6.31‰) of the T5-2 trachyandesite varied significantly (Figure 5c) and may have been affected by different magmatic components [2] during magma ascent. Moreover, the δ18O values of whole-rock samples (5.29‰), olivine (4.83‰) and clinopyroxene (4.99‰) from the T9-1 basaltic andesite in the SOT were lower than those (5.30–5.80‰) [110,111] of MORBs (Figure 5c). This result indicates the presence of a low-δ18O component during magma evolution [37,139,140]. Furthermore, AOC had a large range of δ18O values (+2‰ to +14‰) [141], and the low δ18O values of ocean island basalts (OIBs) and MORBs can be explained by the addition of subducted oceanic crust to the magma source region [142,143,144,145]. Therefore, the low δ18O values of the T9-1 basaltic andesite from the SOT are attributed to siliceous melts or fluids derived from subducted AOC [143,145]. Furthermore, the δ18O value (5.50‰) of orthopyroxene in the T9-1 basaltic andesite from the SOT was lower than that (5.86‰) of orthopyroxene in the T2 andesite from the MOT, which was consistently related to the varying crystallization temperatures (Tables S2 and S3), suggesting that the high-temperature (1095–1138 °C) orthopyroxenes were characterized by 16O enrichment in the SOT, whereas the low-temperature (1020–1095 °C) orthopyroxenes were characterized by 16O depletion in the MOT.
As with the Li isotopes, the δ18O values of plagioclase and glass were higher than those of MOT and SOT olivine, clinopyroxene, and orthopyroxene (Table S9 and Figure 5c), and all the samples exhibited positive O isotopic fractionations between other minerals and olivine (Δ18Ox-ol > 0). This feature suggests that compared to olivine, plagioclase and pyroxene preferentially incorporated 18O rather than 16O during silicate mineral crystallization, which indicates that the O isotope compositions of plagioclase and pyroxene may have been modified by a high-δ18O fluid or melt [137].

5.5. Contribution of High-δ26Mg Slab Fluids

The δ26Mg values of MOT volcanic samples (−0.21‰ to −0.28‰) fell within the range of MORBs (−0.26‰ ± 0.07‰) [107] (Figure 5e). The δ26Mg values of the T2 andesite (−0.20 to −0.12‰) were similar to those of the T5-2 trachyandesite (−0.23‰ to −0.12‰) (Figure 5e), both of which were slightly higher than those of MORBs (Figure 5e). The δ26Mg values (−0.16‰ to −0.09‰) of the T9-1 basaltic andesite in the SOT, which were slightly higher than those in MOT volcanic lavas (Table S9), were also higher than those of MORBs (Figure 5e), all of which indicates that these lavas may have originated from high-δ26Mg magmatic components [5,39,146].
Previous studies have shown that higher Mg isotopes in subduction zones may originate from seawater alteration, chemical weathering, dissolution of continental crust, partial melting of oceanic crust, and/or sediment and slab dehydration [107,108,147,148,149,150,151]. Dissolution of continental crust can be ruled out due to the absence of correlations between the Sr-Nd isotopic compositions and the indices of magma differentiation (e.g., SiO2; Figure 7). Furthermore, volcanic lavas can have isotopically heavier δ26Mg values than MORBs if they are generated by the melting of subducted oceanic crust containing a garnet residual phase because garnet has much lower δ26Mg values [41,42,108,152]. However, because the chemical compositions of our samples were quite different from those of slab products (e.g., adakites) (Figure 4), the possibility of slab melting can also be excluded. Therefore, either subducted sediments or slab dehydration may explain the high δ26Mg values of volcanic lava samples analyzed in this study.
On average, forearc sediments have heavy Mg isotope compositions (−0.10 ± 0.61) that could provide a source for volcanic lavas with heavy Mg isotope compositions [108]. Moreover, the δ26Mg values of the Avacha volcanic lavas from the Kamchatka Peninsula range from −0.25‰ to −0.06‰ (average = −0.18‰ ± 0.10‰ (2SD)) [153], which has been interpreted as the result of the lower mantle being affected by subduction fluids released by the Pacific slab [148]. Similarly, the δ26Mg values of the Avacha volcanic lavas are consistent with those of whole-rock samples from MOT andesite (−0.17‰ to −0.12‰), trachyandesite (−0.16‰ to −0.12‰), and basalt (−0.28‰ to −0.20‰) and SOT basaltic andesite (−0.11‰ to −0.09‰), implying that fluids released from subducted sediment or oceanic crust contributed to the OT magma source.

5.6. Mixing of Subduction Components

The above discussion suggests that the OT magma source was influenced by both subducted sediments and AOC [1,47,50]. A residual slab endmember, represented by eclogite, and an AOC endmember interacting in different proportions with a MORB-producing magma could produce lavas with different δ7Li, δ18O, and δ26Mg values [7,20,33]. According to the δ18O vs. δ7Li and δ26Mg vs. δ7Li diagrams (Figure 9), OT volcanic lavas with different δ7Li, δ18O, and δ26Mg values can be produced by interactions between MORB and different proportions of subducted sediment (i.e., low δ7Li and high δ18O and δ26Mg) and AOC (i.e., high δ7Li and low δ18O), wherein the AOC, oceanic sediments, and mantle wedge (i.e., MORB) are the endmembers contributing to the MOT and SOT magmas. The whole-rock and glass data from the R2 basalt in the MOT and the T9-1 basaltic andesite occur in the SOT plot between subducted sediments and AOC, indicating that the contributions from AOC and sediments were 80% to 92% and 20% to 8%, respectively; therefore, the mixing of different subduction components can produce Li, O, and Mg isotope characteristics in the R2 basalt from the MOT and the T9-1 basaltic andesite from the SOT (Figure 9 and Table S9).

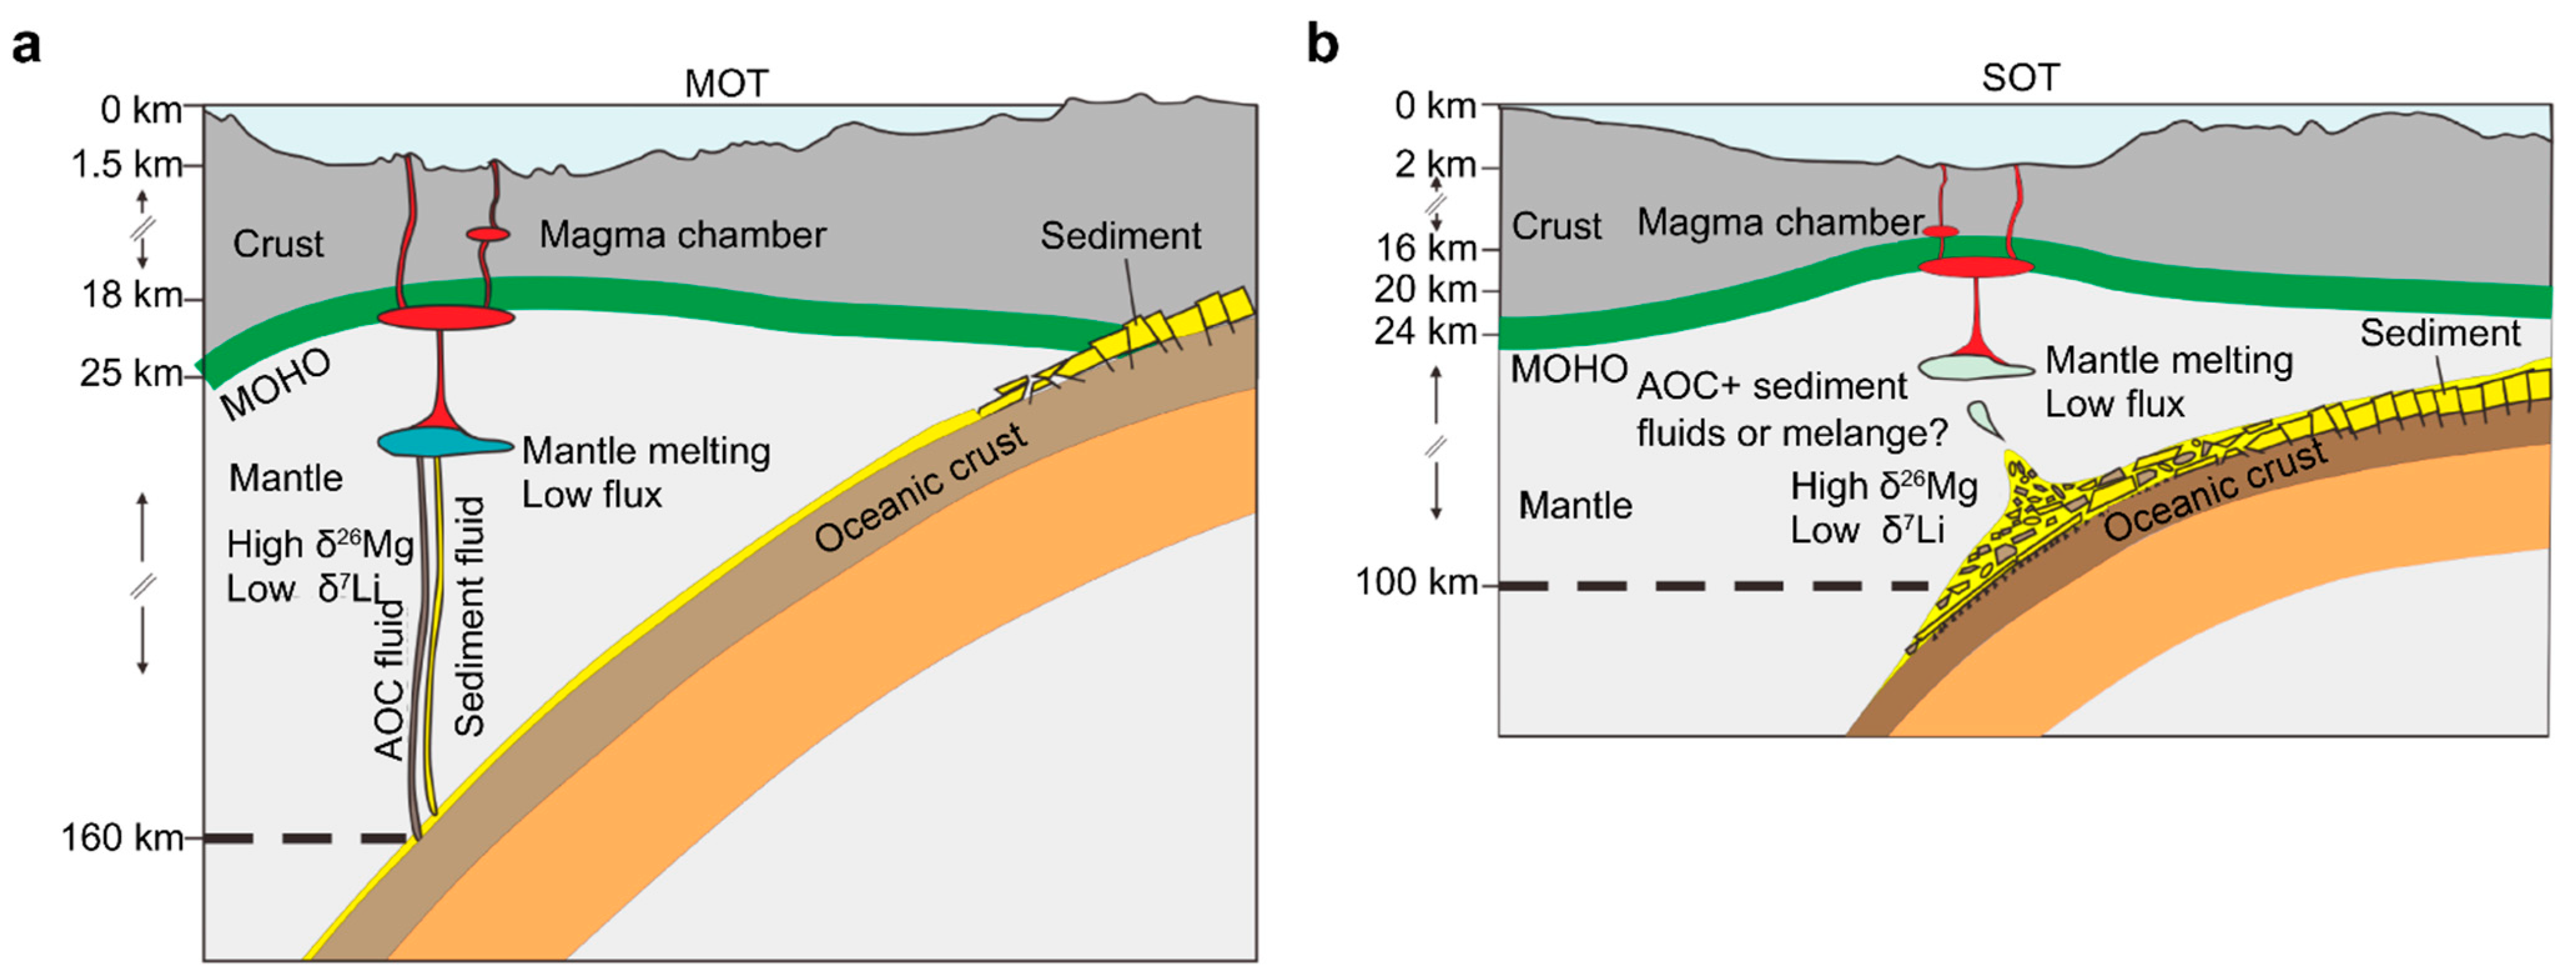
5.7. Implications of Differences in Plate Subduction

As discussed above, the SOT magma from which the T9-1 basaltic andesite formed was influenced by more slab-derived fluids, although the supporting data are limited. However, the thermal structure of a subduction zone is the key to determining the depth at which the subducted slab dehydrates [154,155,156,157], and this thermal structure is mainly determined by the depth of the subducted slab, age of the subducting plate, convergence rate, subduction zone geometry (especially the subduction angle), subduction zone shear heating rate, and nature of the mantle wedge [11,65,123,155,157]. Furthermore, dehydration usually decreases with increasing subduction depth [47,123,158], and most subducted slabs dehydrate considerably at a depth of ~80 km, leaving <1% of the water to be carried deeper by the subducting slab [154]. The subducting plates lose notable volumes of water at relatively shallow depth (modeled here at a depth of 80 km), and the further dehydration of most slabs is only minor (e.g., Kamchatka and Calabria) (Figure S4).
The OT is influenced by the subduction of the PSP, and the difference between the subduction rates of the SOT and the MOT is relatively small [11,50,56,69]. Therefore, the difference between the subduction rates likely had only a limited impact on plate dehydration [47,50,157]. Furthermore, the subduction direction of the PSP is nearly perpendicular to the axis of the MOT and becomes oblique to the SOT [11,50,65]. Although the slab subduction angle beneath the SOT is higher compared to that beneath the MOT, this small difference does not significantly influence slab material transport [11,47,50]. Moreover, the difference between the crustal thicknesses of the MOT and the SOT (i.e., ~16 and ~14 km, respectively) is negligible when compared to the subduction depths of the PSP in the MOT and SOT (~200 and ~150 km, respectively), suggesting that the slight difference between the crustal thicknesses of the MOT and the SOT is not enough to cause different degrees of slab dehydration. However, this difference may reflect the degree of crustal contamination when the magma ascends from a deep magma chamber.
The Ryukyu subduction zone has a fairly rapid subduction rate (~82 mm/a) [159], which is in line with that of cold subduction zone structures [47], suggesting that large degrees of dehydration occurred when the slab reached depths of ~80 to 100 km, at which point sediment fluid/melt entered the mantle wedge [157]. Moreover, the ascending magma from which the T9-1 basaltic andesite in the SOT formed corresponds to a Wadati–Benioff zone depth of ~150 km, and the MOT has Wadati–Benioff zone depths of ~150 to 200 km (Figure 1). However, compared with the PSP subducting slab (depths: ~150 to 200 km) in the MOT, the PSP subducting slab in the SOT exhibits a significantly shallower subduction depth (~150 km), which is consistent with the variation in the subduction angle, i.e., nearly perpendicular beneath the MOT and becoming progressively more oblique beneath the SOT [11,50,65]. This variation indicates that the subducting slab (depth of ~150 km) beneath the SOT was closer to the ascending magma (avg. depth = 12.6 km) that formed the T9-1 basaltic andesite in the SOT than the subducting slab (depth of ~200 km) beneath the MOT. The deep ascending magmas (depth: 8.4–16.1 km and ~8.0–16.9 km) that formed the clinopyroxene and orthopyroxene phenocrysts with high crystallization temperatures (1095–1138 °C and 1111–1137 °C, respectively) in the mafic volcanic lavas (SOT basaltic andesite T9-1 and MOT basalt R2) were closer to the subducted slab than the shallow ascending magma (depth: 3.7–7.1 km) that formed the orthopyroxene phenocrysts with low crystallization temperatures (844–858 °C) in the felsic volcanic lavas (MOT rhyolites T6-2). These data imply that the deeper the ascending magma is, the closer it is to the subducted slab, and the stronger the influence of the subducted components on the ascending magma (Figure 10).

6. Conclusions

(1) The T9-1 basaltic andesite in the SOT had lower trace element contents than the MOT samples and exhibited stronger Nb, Ta, and Ti depletions and a positive Pb anomaly. The Nd/Pb and Ce/Pb ratios of the SOT basaltic andesite were significantly lower than those of the MOT volcanic lavas, while the Ba/La ratio of the SOT basaltic andesite was significantly higher, indicating that the magma from which the T9-1 basaltic andesite from the SOT formed was influenced by subduction components and experienced an injection of sediment components.
(2) The δ7Li values of the whole-rock samples from the T6-1 and T6-2 rhyolites in the MOT were higher than those of whole-rock and glass separates from the T5-2 trachyandesite, T2 andesite, and R2 basalt in the MOT and the T9-1 basaltic andesite in the SOT. These results imply that the magmas that formed the R2 basalt in the MOT and the T9-1 basaltic andesite in the SOT could have been affected by a low-δ7Li component that may have been released from oceanic sediments or subducted AOC. The δ7Li values of plagioclase and clinopyroxene phenocrysts were lower than those of glass and olivine in the MOT and SOT volcanic lavas, suggesting that 6Li was preferentially removed from the magma and incorporated into plagioclase and clinopyroxene, resulting in relative enrichment in heavy Li isotopes in olivine and glass.
(3) The SOT and MOT magmas were influenced by low-δ18O AOC fluids or melts and high-δ18O sediment components, respectively. The δ18O values of plagioclase and glass were higher than those of olivine, clinopyroxene, and orthopyroxene phenocrysts in the MOT and SOT volcanic lavas, indicating that 16O was preferentially removed from the magma and incorporated into olivine, clinopyroxene, and orthopyroxene, resulting in the relative enrichment in heavy 18O isotopes in plagioclase phenocrysts and glass.
(4) The δ26Mg values of clinopyroxene, orthopyroxene, and glass were higher in the T9-1 basaltic andesite from the SOT than those in the MOT volcanic lavas, and the δ18O values of the T9-1 basaltic andesite from the SOT were lower than the δ18O of whole-rock volcanic samples from the MOT. These differences imply that the influence of subduction components with high δ26Mg and low δ18O values was stronger in the SOT than in the MOT, which may have occurred because the amount of subducted sediment and AOC dehydration fluids injected into the magma in the SOT was larger than that in the MOT.
(5) The δ18O and δ26Mg values of pyroxenes in the SOT were lower and higher than those in the MOT, respectively, which is consistent with the variations from the SOT to the MOT in the crystallization temperatures, pressures, and depths of the ascending magmas from which volcanic lavas formed. These results suggest that high-temperature pyroxenes originating from a deep magma (avg. depth = 12.6 km, n = 13), which was located near the crust-mantle transition zone (13–14 km), are characterized by 16O and 26Mg enrichments in the SOT. Low-temperature pyroxenes originating from a shallow magma (avg. depth = 10.9 km, n = 14) are characterized by 16O and 26Mg depletions in the MOT. However, the distance between the subducting slab and the overlying magma may have played a significant part in controlling the differences between the MOT and SOT in the amounts of subduction components injected into the magma. The deeper the magma is, the closer it is to the subducted slab, and the stronger the effects of the subducted inputs on the magma.

Supplementary Materials

The following are available online at https://www.mdpi.com/article/10.3390/jmse10010040/s1, Figures S1–S4, Tables S1–S9, and Text S1. These materials include (1) additional analytical methods, (2) major elements, trace elements, and isotopes data obtained in this study, and (3) additional plots for major elements and isotopes.

Author Contributions

Conceptualization, Z.Z.; methodology, X.L.; investigation, Z.Z., X.L., Y.Z. and H.Q.; resources, Z.Z.; data curation, H.Q.; writing—original draft preparation, Z.Z. and X.L.; writing—review and editing, Y.Z.; supervision, Z.Z.; project administration, Z.Z.; funding acquisition, Z.Z. All authors have read and agreed to the published version of the manuscript.

Funding

This work was supported by the NSFC Major Research Plan on West-Pacific Earth System Multispheric Interactions (project number: 91958213), the National Program on Global Change and Air-Sea Interaction (Grant No. GASI-GEOGE-02), the Taishan Scholar Foundation of Shandong Province (Grant No. ts201511061), and the National Basic Research Program of China (Grant No. 2013CB429700).

Institutional Review Board Statement

Not applicable.

Data Availability Statement

All the data that support the findings in this study are given in the Supporting Information or by contacting the corresponding author.

Acknowledgments

We would like to thank the crews of the R/V KEXUE during the HOBAB 2 and 4 cruises for their help with the sample collection. We thank Professor Yilin Xiao and Professor Fang Huang for performing the lithium, oxygen, and magnesium isotope analyses. We are most grateful for the detailed and constructive comments and suggestions provided by Professor David Selby of the Department of Earth Sciences, University of Durham, which greatly improved an earlier version of the manuscript.

Conflicts of Interest

The authors declare no conflict of interest.

References

  1. Guo, K.; Zhai, S.; Yu, Z.; Wang, S.; Zhang, X.; Wang, X. Geochemical and Sr-Nd-Pb-Li isotopic characteristics of volcanic rocks from the Okinawa Trough: Implications for the influence of subduction components and the contamination of crustal materials. J. Mar. Syst. 2018, 180, 140–151. [Google Scholar] [CrossRef]
  2. Bindeman, I.N.; Eiler, J.M.; Yogodzinski, G.M.; Tatsumi, Y.; Stern, C.R.; Grove, T.L.; Portnyagin, M.; Hoernle, K.; Danyushevsky, L.V. Oxygen isotope evidence for slab melting in modern and ancient subduction zones. Earth Planet. Sci. Lett. 2005, 235, 480–496. [Google Scholar] [CrossRef]
  3. Chan, L.H.; Kastner, M. Lithium isotopic compositions of pore fluids and sediments in the Costa Rica subduction zone: Implications for fluid processes and sediment contribution to the arc volcanoes. Earth Planet. Sci. Lett. 2000, 183, 275–290. [Google Scholar] [CrossRef]
  4. Chan, L.H.; Leeman, W.P.; You, C.F. Lithium isotopic composition of Central American volcanic arc lavas: Implications for modification of subarc mantle by slab-derived fluids: Correction. Chem. Geol. 2002, 182, 293–300. [Google Scholar] [CrossRef]
  5. Chen, Y.X.; Schertl, H.P.; Zheng, Y.F.; Huang, F.; Zhou, K.; Gong, Y.Z. Mg–O isotopes trace the origin of Mg-rich fluids in the deeply subducted continental crust of Western Alps. Earth Planet. Sci. Lett. 2016, 456, 157–167. [Google Scholar] [CrossRef]
  6. Huang, P.; Li, A.; Jiang, H. Geochemical features and their geological implications of volcanic rocks from the northern and middle Okinawa Trough. Acta Petrol. Sin. 2006, 22, 1703–1712. [Google Scholar]
  7. Ito, E.; Stern, R.J. Oxygen- and strontium-isotopic investigations of subduction zone volcanism: The case of the Volcano Arc and the Marianas Island Arc. Earth Planet. Sci. Lett. 1986, 76, 312–320. [Google Scholar] [CrossRef]
  8. Niu, Y.; Wilson, M.; Humphreys, E.R.; O’Hara, M.J. A trace element perspective on the source of ocean island basalts (OIB) and fate of subducted ocean crust (SOC) and mantle lithosphere (SML). Episodes 2012, 35, 310–327. [Google Scholar] [CrossRef] [Green Version]
  9. Pearce, J.A.; Peate, D.W. Tectonic implications of the composition of volcanic ARC magmas. Annu. Rev. Earth Planet. Sci. 1995, 23, 251–285. [Google Scholar] [CrossRef]
  10. Plank, T.; Langmuir, C.H. The chemical composition of subducting sediment and its consequences for the crust and mantle. Chem. Geol. 1998, 145, 325–394. [Google Scholar] [CrossRef]
  11. Shinjo, R. Geochemistry of high Mg andesites and the tectonic evolution of the Okinawa Trough–Ryukyu arc system. Chem. Geol. 1999, 157, 69–88. [Google Scholar] [CrossRef]
  12. Yang, Y.Z.; Wang, Y.; Ye, R.S.; Li, S.Q.; He, J.F.; Siebel, W.; Chen, F. Petrology and geochemistry of Early Cretaceous A-type granitoids and late Mesozoic mafic dikes and their relationship to adakitic intrusions in the lower Yangtze River belt, Southeast China. Int. Geol. Rev. 2017, 59, 62–79. [Google Scholar] [CrossRef]
  13. Taylor, B.; Martinez, F. Back-arc basin basalt systematics. Earth Planet. Sci. Lett. 2003, 210, 481–497. [Google Scholar] [CrossRef]
  14. White, W.M.; Duncan, R.A. Geochemistry and geochronology of the Society Islands: New evidence for deep mantle recycling. In Earth Processes: Reading the Isotopic Code; Basu, A., Hart, S., Eds.; American Geophysical Union: Washington, DC, USA, 1996; pp. 183–206. [Google Scholar]
  15. Duan, X.; Sun, H.; Yang, W.; Su, B.; Xiao, Y.; Hou, Z.; Shi, H. Melt–peridotite interaction in the shallow lithospheric mantle of the North China Craton: Evidence from melt inclusions in the quartz-bearing orthopyroxene-rich websterite from Hannuoba. Int Geol. Rev. 2014, 56, 448–472. [Google Scholar] [CrossRef]
  16. Class, C.; Miller, D.M.; Goldstein, S.L.; Langmuir, C.H. Distinguishing melt and fluid subduction components in Umnak Volcanics, Aleutian Arc. Geochem. Geophys Geosyst 2000, 1, 1004. [Google Scholar] [CrossRef]
  17. Elliott, T.; Plank, T.; Zindler, A.; White, W.; Bourdon, B. Element transport from slab to volcanic front at the Mariana arc. J. Geophys. Res. Solid Earth 1997, 102, 14991–15019. [Google Scholar] [CrossRef]
  18. George, R.; Turner, S.; Hawkesworth, C.; Morris, J.; Nye, C.; Ryan, J.; Zheng, S.H. Melting processes and fluid and sediment transport rates along the Alaska-Aleutian arc from an integrated U-Th-Ra-Be isotope study. J. Geophys. Res. Solid Earth 2003, 108, 2252. [Google Scholar] [CrossRef] [Green Version]
  19. Plank, T. Constraints from thorium/lanthanum on sediment recycling at subduction zones and the evolution of the continents. J. Pet. 2005, 46, 921–944. [Google Scholar] [CrossRef] [Green Version]
  20. Singer, B.S.; Jicha, B.R.; Leeman, W.P.; Rogers, N.W.; Thirlwall, M.F.; Ryan, J.; Nicolaysen, K.E. Along-strike trace element and isotopic variation in Aleutian Island arc basalt: Subduction melts sediments and dehydrates serpentine. J. Geophys. Res. 2007, 112, B06206. [Google Scholar] [CrossRef] [Green Version]
  21. Brenan, J.M.; Ryerson, F.J.; Shaw, H.F. The role of aqueous fluids in the slab-to-mantle transfer of boron, beryllium, and lithium during subduction: Experiments and models. Geochim. Cosmochim. Acta 1998, 62, 3337–3347. [Google Scholar] [CrossRef]
  22. Chan, L.; Edmond, J.; Thompson, G.; Gillis, K. Lithium isotopic composition of submarine basalts: Implications for the lithium cycle in the oceans. Earth Planet. Sci. Lett. 1992, 108, 151–160. [Google Scholar] [CrossRef]
  23. Teng, F.Z.; Rudnick, R.L.; McDonough, W.F.; Gao, S.; Tomascak, P.B.; Liu, Y. Lithium isotopic composition and concentration of the deep continental crust. Chem. Geol. 2008, 255, 47–59. [Google Scholar] [CrossRef]
  24. Wunder, B.; Meixner, A.; Romer, R.L.; Heinrich, W. Temperature-dependent isotopic fractionation of lithium between clinopyroxene and high-pressure hydrous fluids. Contrib Miner. Pet. 2006, 151, 112–120. [Google Scholar] [CrossRef]
  25. Bouman, C.; Elliott, T.; Vroon, P.Z. Lithium inputs to subduction zones. Chem. Geol. 2004, 212, 59–79. [Google Scholar] [CrossRef]
  26. Chan, L.H.; Alt, J.C.; Teagle, D.A.H. Lithium and lithium isotope profiles through the upper oceanic crust: A study of seawater–basalt exchange at ODP Sites 504B and 896A. Earth Planet. Sci. Lett. 2002, 201, 187–201. [Google Scholar] [CrossRef]
  27. Chan, L.H.; Leeman, W.P.; Plank, T. Lithium isotopic composition of marine sediments. Geochem. Geophys Geosyst 2006, 7, Q06005. [Google Scholar] [CrossRef]
  28. Zack, T.; Tomascak, P.B.; Rudnick, R.L.; Dalpé, C.; McDonough, W.F. Extremely light Li in orogenic eclogites: The role of isotope fractionation during dehydration in subducted oceanic crust. Earth Planet. Sci. Lett. 2003, 208, 279–290. [Google Scholar] [CrossRef]
  29. Marschall, H.R.; von Strandmann, P.A.E.P.; Seitz, H.M.; Elliott, T.; Niu, Y. The lithium isotopic composition of orogenic eclogites and deep subducted slabs. Earth Planet. Sci. Lett. 2007, 262, 563–580. [Google Scholar] [CrossRef]
  30. Xiao, Y.; Hoefs, J.; Hou, Z.; Simon, K.; Zhang, Z. Fluid/rock interaction and mass transfer in continental subduction zones: Constraints from trace elements and isotopes (Li, B, O, Sr, Nd, Pb) in UHP rocks from the Chinese Continental Scientific Drilling Program, Sulu, East China. Contrib. Miner. Pet. 2011, 162, 797–819. [Google Scholar] [CrossRef] [Green Version]
  31. Xiao, Y.; Sun, H.; Gu, H.; Huang, J.; Li, W.; Liu, L. Fluid/melt in continental deep subduction zones: Compositions and related geochemical fractionations. Sci. China Earth Sci. 2015, 58, 1457–1476. [Google Scholar] [CrossRef]
  32. Ishikawa, T.; Nakamura, E. Origin of the slab component in arc lavas from across-arc variation of B and Pb isotopes. Nature 1994, 370, 205–208. [Google Scholar] [CrossRef]
  33. Moriguti, T.; Nakamura, E. Across-arc variation of Li isotopes in lavas and implications for crust/mantle recycling at subduction zones. Earth Planet. Sci. Lett. 1998, 163, 167–174. [Google Scholar] [CrossRef]
  34. Nakamura, E.; Campbell, I.H.; Sun, S.S. The influence of subduction processes on the geochemistry of Japanese alkaline basalts. Nature 1985, 316, 55–58. [Google Scholar] [CrossRef]
  35. Benton, L.D.; Ryan, J.G.; Savov, I.P. Lithium abundance and isotope systematics of forearc serpentinites, Conical Seamount, Mariana forearc: Insights into the mechanics of slab-mantle exchange during subduction. Geochem. Geophys. Geosyst. 2004, 5, Q08J12. [Google Scholar] [CrossRef] [Green Version]
  36. Honma, H.; Kusakabe, M.; Kagami, H.; Iizumi, S.; Sakai, H.; Kodama, Y.; Kimura, M. Major and trace element chemistry and D/H, 18O/16O, 87Sr/86Sr and 143Nd/144Nd ratios of rocks from the spreading center of the Okinawa Trough, a marginal back-arc basin. Geochem. J. 1991, 25, 121–136. [Google Scholar] [CrossRef] [Green Version]
  37. Macpherson, C.G.; Hilton, D.R.; Mattey, D.P.; Sinton, J.M. Evidence for an 18O-depleted mantle plume from contrasting 18O/16O ratios of back-arc lavas from the Manus Basin and Mariana Trough. Earth Planet. Sci. Lett. 2000, 176, 171–183. [Google Scholar] [CrossRef]
  38. Macpherson, C.G.; Mattey, D.P. Oxygen isotope variations in Lau Basin lavas. Chem. Geol. 1998, 144, 177–194. [Google Scholar] [CrossRef]
  39. Huang, J.; Ke, S.; Gao, Y.; Xiao, Y.; Li, S. Magnesium isotopic compositions of altered oceanic basalts and gabbros from IODP site 1256 at the East Pacific Rise. Lithos 2015, 231, 53–61. [Google Scholar] [CrossRef]
  40. Li, S.G.; Yang, W.; Ke, S.; Meng, X.; Tian, H.; Xu, L.; He, Y.; Huang, J.; Wang, X.C.; Xia, Q.; et al. Deep carbon cycles constrained by a large-scale mantle Mg isotope anomaly in eastern China. Natl. Sci. Rev. 2017, 4, 111–120. [Google Scholar] [CrossRef] [Green Version]
  41. Wang, S.J.; Teng, F.Z.; Li, S.G.; Hong, J.A. Magnesium isotopic systematics of mafic rocks during continental subduction. Geochim Cosmochim Acta 2014, 143, 34–48. [Google Scholar] [CrossRef]
  42. Wang, S.J.; Teng, F.Z.; Williams, H.M.; Li, S.G. Magnesium isotopic variations in cratonic eclogites: Origins and implications. Earth Planet. Sci. Lett. 2012, 359-360, 219–226. [Google Scholar] [CrossRef] [Green Version]
  43. Xiao, Y.; Teng, F.Z.; Zhang, H.F.; Yang, W. Large magnesium isotope fractionation in peridotite xenoliths from eastern North China craton: Product of melt–rock interaction. Geochim Cosmochim Acta 2013, 115, 241–261. [Google Scholar] [CrossRef]
  44. Yang, W.; Teng, F.Z.; Zhang, H.F.; Li, S.G. Magnesium isotopic systematics of continental basalts from the North China craton: Implications for tracing subducted carbonate in the mantle. Chem. Geol. 2012, 328, 185–194. [Google Scholar] [CrossRef]
  45. Shimoda, G.; Tatsumi, Y.; Nohda, S.; Ishizaka, K.; Jahn, B.M. Setouchi high-Mg andesites revisited: Geochemical evidence for melting of subducting sediments. Earth Planet. Sci. Lett. 1998, 160, 479–492. [Google Scholar] [CrossRef]
  46. Shu, Y.; Nielsen, S.G.; Zeng, Z.; Shinjo, R.; Blusztajn, J.; Wang, X.; Chen, S. Tracing subducted sediment inputs to the Ryukyu arc-Okinawa Trough system: Evidence from thallium isotopes. Geochim Cosmochim Acta 2017, 217, 462–491. [Google Scholar] [CrossRef]
  47. Guo, K.; Zeng, Z.G.; Chen, S.; Zhang, Y.X.; Qi, H.Y.; Ma, Y. The influence of a subduction component on magmatism in the Okinawa Trough: Evidence from thorium and related trace element ratios. J. Asian Earth Sci. 2017, 145, 205–216. [Google Scholar] [CrossRef]
  48. Li, Z.G.; Chu, F.Y.; Dong, Y.H.; Liu, J.Q.; Chen, L. Geochemical constraints on the contribution of Louisville seamount materials to magmagenesis in the Lau back-arc basin, SW Pacific. Int. Geol. Rev. 2015, 57, 978–997. [Google Scholar] [CrossRef]
  49. Pi, J.L.; You, C.F.; Wang, K.L. The influence of Ryukyu subduction on magma genesis in the Northern Taiwan Volcanic Zone and Middle Okinawa Trough—Evidence from boron isotopes. Lithos 2016, 260, 242–252. [Google Scholar] [CrossRef]
  50. Shinjo, R.; Chung, S.L.; Kato, Y.; Kimura, M. Geochemical and Sr-Nd isotopic characteristics of volcanic rocks from the Okinawa Trough and Ryukyu Arc: Implications for the evolution of a young, intracontinental back arc basin. J. Geophys Res. Solid Earth 1999, 104, 10591–10608. [Google Scholar] [CrossRef]
  51. Chang-Hwa, C.; Typhoon, L.; Yuch-Ning, S.; Cheng-Hong, C.; Wen-Yu, H. Magmatism at the onset of back-arc basin spreading in the Okinawa Trough. J. Volcanol. Geotherm. Res. 1995, 69, 313–322. [Google Scholar] [CrossRef]
  52. Zengqian, H.; Zaw, K.; Yanhe, L.; Qiling, Z.; Zhigang, Z.; Urabe, T. Contribution of magmatic fluid to the active hydrothermal system in the JADE Field, Okinawa trough: Evidence from fluid inclusions, oxygen and helium isotopes. Int. Geol. Rev. 2010, 47, 420–437. [Google Scholar] [CrossRef]
  53. Zeng, Z.; Yu, S.; Wang, X.; Fu, Y.; Yin, X.; Zhang, G.; Wang, X.; Chen, S. Geochemical and isotopic characteristics of volcanic rocks from the northern East China Sea shelf margin and the Okinawa Trough. Acta Oceanol. Sin. 2010, 29, 48–61. [Google Scholar] [CrossRef]
  54. Lee, C.S.; Shor, G.G.; Bibee, L.D.; Lu, R.S.; Hilde, T.W.C. Okinawa Trough: Origin of a back-arc basin. Mar. Geol. 1980, 35, 219–241. [Google Scholar] [CrossRef]
  55. Seno, T.; Maruyama, S. Paleogeographic reconstruction and origin of the Philippine Sea. Tectonophysics 1984, 102, 53–84. [Google Scholar] [CrossRef]
  56. Seno, T.; Stein, S.; Gripp, A.E. A model for the motion of the Philippine Sea Plate consistent with NUVEL-1 and geological data. J. Geophys. Res. Solid Earth 1993, 98, 17941–17948. [Google Scholar] [CrossRef]
  57. Hoang, N.; Uto, K. Upper mantle isotopic components beneath the Ryukyu arc system: Evidence for ‘back-arc’ entrapment of Pacific MORB mantle. Earth Planet. Sci. Lett. 2006, 249, 229–240. [Google Scholar] [CrossRef]
  58. Ishizuka, H.; Kawanobe, Y.; Sakai, H. Petrology and geochemistry of volcanic rocks dredged from the Okinawa Trough, an active back-arc basin. Geochem. J. 1990, 24, 75–92. [Google Scholar] [CrossRef]
  59. Han, B.; Zhang, X.H.; Pei, J.X.; Zhang, W.G. Characteristics of crust-mantle in the East China Sea and adjacent regions. Prog. Geophys. 2007, 22, 376–382. [Google Scholar]
  60. Iwasaki, T.; Hirata, N.; Kanazawa, T.; Melles, J.; Suyehiro, K.; Urabe, T.; Möller, L.; Makris, J.; Shimamura, H. Crustal and upper mantle structure in the Ryukyu Island Arc deduced from deep seismic sounding. Geophys. J. Int. 1990, 102, 631–651. [Google Scholar] [CrossRef] [Green Version]
  61. Klingelhoefer, F.; Lee, C.S.; Lin, J.Y.; Sibuet, J.C. Structure of the southernmost Okinawa Trough from reflection and wide-angle seismic data. Tectonophys 2009, 466, 281–288. [Google Scholar] [CrossRef] [Green Version]
  62. Liu, B.; Li, S.Z.; Suo, Y.H.; Li, G.X.; Dai, L.M.; Somerville, I.D.; Guo, L.L.; Zhao, S.J.; Yu, S. The geological nature and geodynamics of the Okinawa Trough, Western Pacific. Geol. J. 2016, 51, 416–428. [Google Scholar] [CrossRef]
  63. Nakahigashi, K.; Shinohara, M.; Suzuki, S.; Hino, R.; Shiobara, H.; Takenaka, H.; Nishino, M.; Sato, T.; Yoneshima, S.; Kanazawa, T. Seismic structure of the crust and uppermost mantle in the incipient stage of back arc rifting—Northernmost Okinawa Trough. Geophys Res. Lett. 2004, 31, L02614. [Google Scholar] [CrossRef]
  64. Sibuet, J.C.; Hsu, S.K.; Shyu, C.T.; Liu, C.S. Structural and kinematic evolutions of the Okinawa Trough backarc basin. In Backarc Basins: Tectonics and Magmatism; Taylor, B., Ed.; Springer: Boston, MA, USA, 1995; pp. 343–379. [Google Scholar]
  65. Arai, R.; Kodaira, S.; Yuka, K.; Takahashi, T.; Miura, S.; Kaneda, Y. Crustal structure of the southern Okinawa Trough: Symmetrical rifting, submarine volcano, and potential mantle accretion in the continental back-arc basin. J. Geophys Res. Solid Earth 2017, 122, 622–641. [Google Scholar] [CrossRef]
  66. Furukawa, M.; Tokuyama, H.; Abe, S.; Nishizawa, A.; Kinoshita, H. Report on DELP 1988 cruises in the Okinawa Trough: Part 2. seismic reflection studies in the southwestern part of the Okinawa Trough. Bull. Earthq Res. Inst. Univ. Tokyo 1991, 66, 17–36. [Google Scholar]
  67. Letouzey, J.; Kimura, M. Okinawa Trough genesis: Structure and evolution of a backarc basin developed in a continent. Mar. Pet. Geol. 1985, 2, 111–130. [Google Scholar] [CrossRef]
  68. Sibuet, J.C.; Deffontaines, B.; Hsu, S.K.; Thareau, N.; Le Formal, J.P.; Liu, C.S. Okinawa trough backarc basin: Early tectonic and magmatic evolution. J. Geophys Res. Solid Earth 1998, 103, 30245–30267. [Google Scholar] [CrossRef] [Green Version]
  69. Argus, D.F.; Gordon, R.G.; DeMets, C. Geologically current motion of 56 plates relative to the no-net-rotation reference frame. Geochem. Geophys Geosyst 2011, 12, Q11001. [Google Scholar] [CrossRef] [Green Version]
  70. Kubo, A.; Fukuyama, E. Stress field along the Ryukyu Arc and the Okinawa Trough inferred from moment tensors of shallow earthquakes. Earth Planet. Sci. Lett. 2003, 210, 305–316. [Google Scholar] [CrossRef]
  71. Pezzopane, S.K.; Wesnousky, S.G. Large earthquakes and crustal deformation near Taiwan. J. Geophys Res. 1989, 94, 7250–7264. [Google Scholar] [CrossRef]
  72. Li, W.; Yang, Z.; Wang, Y.; Zhang, B. The petrochemical features of the volcanic rocks in the Okinawa Trough and their geological significance. Acta Petrol. Sin. 1997, 13, 538–550. [Google Scholar]
  73. Shinjo, R.; Kato, Y. Geochemical constraints on the origin of bimodal magmatism at the Okinawa Trough, an incipient back-arc basin. Lithos 2000, 54, 117–137. [Google Scholar] [CrossRef]
  74. Li, X.; Zeng, Z.; Chen, S.; Ma, Y.; Yang, H.; Zhang, Y.; Chen, Z. Geochemical and Sr-Nd-Pb isotopic compositions of volcanic rocks from the Iheya Ridge, the middle Okinawa Trough: Implications for petrogenesis and a mantle source. Acta Oceanol Sin. 2018, 37, 73–88. [Google Scholar] [CrossRef]
  75. Chen, Z.; Zeng, Z.; Wang, X.; Zhang, Y.; Yin, X.; Chen, S.; Ma, Y.; Li, X.; Qi, H. Mineral chemistry indicates the petrogenesis of rhyolite from the southwestern Okinawa Trough. J. Ocean. Univ. China 2017, 16, 1097–1108. [Google Scholar] [CrossRef]
  76. Ishikawa, M.; Sato, H.; Furukawa, M.; Kimura, M.; Kato, Y.; Tsugaru, R.; Shimamura, K. Report on DELP 1988 cruises in the Okinawa Trough: Part 6. petrology of volcanic rocks. Bull. Earthq. Res. Inst. Univ. Tokyo 1991, 66, 151–177. [Google Scholar]
  77. Gao, Y.; Casey, J.F. Lithium isotope composition of ultramafic geological reference materials JP-1 and DTS-2. Geostand Geoanal Res. 2012, 36, 75–81. [Google Scholar] [CrossRef]
  78. Rudnick, R.L.; Tomascak, P.B.; Njo, H.B.; Gardner, L.R. Extreme lithium isotopic fractionation during continental weathering revealed in saprolites from South Carolina. Chem. Geol. 2004, 212, 45–57. [Google Scholar] [CrossRef]
  79. Flesch, G.D.; Anderson, A.R.; Svec, H.J. A secondary isotopic standard for 6Li/7Li determinations. Int. J. Mass Spectrom. Ion. Phys. 1973, 12, 265–272. [Google Scholar] [CrossRef]
  80. Zheng, Y.F.; Wang, Z.R.; Li, S.G.; Zhao, Z.F. Oxygen isotope equilibrium between eclogite minerals and its constraints on mineral Sm-Nd chronometer. Geochim. Cosmochim. Acta 2002, 66, 625–634. [Google Scholar] [CrossRef]
  81. Zheng, Y.F.; Fu, B.; Li, Y.; Xiao, Y.; Li, S. Oxygen and hydrogen isotope geochemistry of ultrahigh-pressure eclogites from the Dabie Mountains and the Sulu terrane. Earth Planet. Sci. Lett. 1998, 155, 113–129. [Google Scholar] [CrossRef]
  82. Gong, B.; Zheng, Y.F.; Chen, R.X. TC/EA-MS online determination of hydrogen isotope composition and water concentration in eclogitic garnet. Phys. Chem. Min. 2007, 34, 687–698. [Google Scholar] [CrossRef]
  83. An, Y.; Wu, F.; Xiang, Y.; Nan, X.; Yu, X.; Yang, J.; Yu, H.; Xie, L.; Huang, F. High-precision Mg isotope analyses of low-Mg rocks by MC-ICP-MS. Chem. Geol. 2014, 390, 9–21. [Google Scholar] [CrossRef]
  84. Putirka, K.; Condit, C.D. Cross section of a magma conduit system at the margin of the Colorado Plateau. Geology 2003, 31, 701–704. [Google Scholar] [CrossRef]
  85. Putirka, K.D. Thermometers and barometers for volcanic systems. Rev. Mineral. Geochem. 2008, 69, 61–120. [Google Scholar] [CrossRef]
  86. Irvine, T.N.; Baragar, W.R.A. A guide to the chemical classification of the common volcanic rocks. Can. J. Earth Sci. 1971, 8, 523–548. [Google Scholar] [CrossRef]
  87. Le Maitre, R.W. A classification of Igneous Rocks and Glossary of Terms: Recommendations of the International Union of Geological Sci.ences Subcommission on the Systematics of Igneous Rocks; Blackwell: Oxford, UK, 1989. [Google Scholar]
  88. Roberts, M.P.; Clemens, J.D. Origin of high-potassium, talc-alkaline, I-type granitoids. Geology 1993, 21, 825–828. [Google Scholar] [CrossRef]
  89. Hu, Y.; Niu, Y.; Li, J.; Ye, L.; Kong, J.; Chen, S.; Zhang, Y.; Zhang, G. Petrogenesis and tectonic significance of the late Triassic mafic dikes and felsic volcanic rocks in the East Kunlun Orogenic Belt, Northern Tibet Plateau. Lithos 2016, 245, 205–222. [Google Scholar] [CrossRef] [Green Version]
  90. Sun, S.S.; McDonough, W.F. Chemical and isotopic systematics of oceanic basalts: Implications for mantle composition and processes. Geol. Soc. Lond. Spec. Publ. 1989, 42, 313–345. [Google Scholar] [CrossRef]
  91. Elliott, T.; Thomas, A.; Jeffcoate, A.; Niu, Y. Lithium isotope evidence for subduction-enriched mantle in the source of mid-ocean-ridge basalts. Nature 2006, 443, 565–568. [Google Scholar] [CrossRef]
  92. Nishio, Y.; Nakai, S.i.; Ishii, T.; Sano, Y. Isotope systematics of Li, Sr, Nd, and volatiles in Indian Ocean MORBs of the Rodrigues Triple Junction: Constraints on the origin of the DUPAL anomaly. Geochim. Cosmochim. Acta 2007, 71, 745–759. [Google Scholar] [CrossRef]
  93. Tomascak, P.B.; Langmuir, C.H.; le Roux, P.J.; Shirey, S.B. Lithium isotopes in global mid-ocean ridge basalts. Geochim. Cosmochim. Acta 2008, 72, 1626–1637. [Google Scholar] [CrossRef]
  94. Brant, C.; Coogan, L.A.; Gillis, K.M.; Seyfried, W.E.; Pester, N.J.; Spence, J. Lithium and Li-isotopes in young altered upper oceanic crust from the East Pacific Rise. Geochim. Cosmochim. Acta 2012, 96, 272–293. [Google Scholar] [CrossRef]
  95. James, R.H.; Rudnicki, M.D.; Palmer, M.R. The alkali element and boron geochemistry of the Escanaba Trough sediment-hosted hydrothermal system. Earth Planet. Sci. Lett. 1999, 171, 157–169. [Google Scholar] [CrossRef]
  96. Leeman, W.P.; Tonarini, S.; Chan, L.H.; Borg, L.E. Boron and lithium isotopic variations in a hot subduction zone—the southern Washington Cascades. Chem. Geol. 2004, 212, 101–124. [Google Scholar] [CrossRef]
  97. Zhang, L.; Chan, L.H.; Gieskes, J.M. Lithium isotope geochemistry of pore waters from ocean drilling program Sites 918 and 919, Irminger Basin. Geochim. Cosmochim. Acta 1998, 62, 2437–2450. [Google Scholar] [CrossRef]
  98. Teng, F.Z.; McDonough, W.F.; Rudnick, R.L.; Dalpé, C.; Tomascak, P.B.; Chappell, B.W.; Gao, S. Lithium isotopic composition and concentration of the upper continental crust. Geochim. Cosmochim. Acta 2004, 68, 4167–4178. [Google Scholar] [CrossRef]
  99. Cooper, K.M.; Eiler, J.M.; Sims, K.W.W.; Langmuir, C.H. Distribution of recycled crust within the upper mantle: Insights from the oxygen isotope composition of MORB from the Australian-Antarctic Discordance. Geochem. Geophys. Geosyst. 2009, 10, Q12004. [Google Scholar] [CrossRef] [Green Version]
  100. Eiler, J.M.; Schiano, P.; Kitchen, N.; Stolper, E.M. Oxygen-isotope evidence for recycled crust in the sources of mid-ocean-ridge basalts. Nature 2000, 403, 530–534. [Google Scholar] [CrossRef]
  101. Ito, E.; White, W.M.; Göpel, C. The O, Sr, Nd and Pb isotope geochemistry of MORB. Chem. Geol. 1987, 62, 157–176. [Google Scholar] [CrossRef]
  102. Gregory, R.T.; Taylor, H.P. An oxygen isotope profile in a section of Cretaceous oceanic crust, Samail Ophiolite, Oman: Evidence for δ18O buffering of the oceans by deep (>5 km) seawater-hydrothermal circulation at mid-ocean ridges. J. Geophys Res. Solid Earth 1981, 86, 2737–2755. [Google Scholar] [CrossRef] [Green Version]
  103. Staudigel, H.; Davies, G.R.; Hart, S.R.; Marchant, K.M.; Smith, B.M. Large scale isotopic Sr, Nd and O isotopic anatomy of altered oceanic crust: DSDP/ODP sites417/418. Earth Planet. Sci. Lett. 1995, 130, 169–185. [Google Scholar] [CrossRef]
  104. Alt, J.; Shanksiii, W. Stable isotope compositions of serpentinite seamounts in the Mariana forearc: Serpentinization processes, fluid sources and sulfur metasomatism. Earth Planet. Sci. Lett. 2006, 242, 272–285. [Google Scholar] [CrossRef]
  105. Simon, L.; Lécuyer, C. Continental recycling: The oxygen isotope point of view. Geochem. Geophys Geosyst. 2005, 6, Q08004. [Google Scholar] [CrossRef]
  106. Bourdon, B.; Tipper, E.T.; Fitoussi, C.; Stracke, A. Chondritic Mg isotope composition of the Earth. Geochim. Cosmochim. Acta 2010, 74, 5069–5083. [Google Scholar] [CrossRef]
  107. Teng, F.Z.; Li, W.Y.; Ke, S.; Marty, B.; Dauphas, N.; Huang, S.; Wu, F.Y.; Pourmand, A. Magnesium isotopic composition of the Earth and chondrites. Geochim. Cosmochim. Acta 2010, 74, 4150–4166. [Google Scholar] [CrossRef]
  108. Teng, F.Z.; Hu, Y.; Chauvel, C. Magnesium isotope geochemistry in arc volcanism. Proc. Natl. Acad. Sci. USA 2016, 113, 7082–7087. [Google Scholar] [CrossRef] [Green Version]
  109. Li, W.Y.; Teng, F.Z.; Ke, S.; Rudnick, R.L.; Gao, S.; Wu, F.Y.; Chappell, B.W. Heterogeneous magnesium isotopic composition of the upper continental crust. Geochim. Cosmochim. Acta 2010, 74, 6867–6884. [Google Scholar] [CrossRef]
  110. Eiler, J.M. Oxygen isotope variations of basaltic lavas and upper mantle rocks. Rev. Miner. Geochem. 2001, 43, 319–364. [Google Scholar] [CrossRef] [Green Version]
  111. Mattey, D.; Lowry, D.; Macpherson, C. Oxygen isotope composition of mantle peridotite. Earth Planet. Sci. Lett. 1994, 128, 231–241. [Google Scholar] [CrossRef]
  112. Beattie, P. Olivine-melt and orthopyroxene-melt equilibria. Contrib. Miner. Pet. 1993, 115, 103–111. [Google Scholar] [CrossRef]
  113. Davis, B.T.C.; Boyd, F.R. The join Mg2Si2O6-CaMgSi2O6at 30 kilobars pressure and its application to pyroxenes from kimberlites. J. Geophys Res. 1966, 71, 3567–3576. [Google Scholar] [CrossRef]
  114. Rudnick, R.L.; Gao, S. Composition of the continental crust. In Treatise on Geochemistry; Holland, H.D., Turekian, K.K., Eds.; Elsevier: Amsterdam, The Netherlands, 2003; Volume 3, pp. 1–64. [Google Scholar]
  115. Park, S.H.; Lee, S.M.; Kamenov, G.D.; Kwon, S.T.; Lee, K.Y. Tracing the origin of subduction components beneath the South East rift in the Manus Basin, Papua New Guinea. Chem. Geol. 2010, 269, 339–349. [Google Scholar] [CrossRef]
  116. Hong, L.B.; Zhang, Y.H.; Qian, S.P.; Liu, J.Q.; Ren, Z.Y.; Xu, Y.G. Constraints from melt inclusions and their host olivines on the petrogenesis of Oligocene-Early Miocene Xindian basalts, Chifeng area, North China Craton. Contrib. Miner. Pet. 2013, 165, 305–326. [Google Scholar] [CrossRef]
  117. Sun, H.; Xiao, Y.; Gao, Y.; Lai, J.; Hou, Z.; Wang, Y. Fluid and melt inclusions in the Mesozoic Fangcheng basalt from North China Craton: Implications for magma evolution and fluid/melt-peridotite reaction. Contrib. Miner. Pet. 2013, 165, 885–901. [Google Scholar] [CrossRef]
  118. Zhang, Y.; Zeng, Z.; Li, X.; Yin, X.; Wang, X.; Chen, S.; Li, S. High-potassium volcanic rocks from the Okinawa Trough: Implications for a cryptic potassium-rich and DUPAL-like source. Geol. J. 2018, 53, 1755–1766. [Google Scholar] [CrossRef]
  119. Prægel, N.O.; Holm, P.M. Lithospheric contributions to high-MgO basanites from the Cumbre Vieja Volcano, La Palma, Canary Islands and evidence for temporal variation in plume influence. J. Volcanol. Geotherm. Res. 2006, 149, 213–239. [Google Scholar] [CrossRef]
  120. Zhang, H.F.; Sun, M. Geochemistry of Mesozoic basalts and mafic dikes, southeastern North China Craton, and tectonic implications. Int. Geol. Rev. 2002, 44, 370–382. [Google Scholar] [CrossRef]
  121. Zhang, J.J.; Zheng, Y.F.; Zhao, Z.F. Geochemical evidence for interaction between oceanic crust and lithospheric mantle in the origin of Cenozoic continental basalts in east-central China. Lithos 2009, 110, 305–326. [Google Scholar] [CrossRef]
  122. Liu, Y.; Gao, S.; Gao, C.; Zong, K.; Hu, Z.; Ling, W. Garnet-rich granulite xenoliths from the Hannuoba basalts, North China: Petrogenesis and implications for the Mesozoic crust-mantle interaction. J. Earth Sci. 2010, 21, 669–691. [Google Scholar] [CrossRef]
  123. Moriguti, T.; Shibata, T.; Nakamura, E. Lithium, boron and lead isotope and trace element systematics of Quaternary basaltic volcanic rocks in northeastern Japan: Mineralogical controls on slab-derived fluid composition. Chem. Geol. 2004, 212, 81–100. [Google Scholar] [CrossRef]
  124. Tomascak, P.B.; Widom, E.; Benton, L.D.; Goldstein, S.L.; Ryan, J.G. The control of lithium budgets in island arcs. Earth Planet. Sci. Lett. 2002, 196, 227–238. [Google Scholar] [CrossRef] [Green Version]
  125. Grove, T.; Parman, S.; Bowring, S.; Price, R.; Baker, M. The role of an H2O-rich fluid component in the generation of primitive basaltic andesites and andesites from the Mt. Shasta region, N California. Contrib. Mineral. Petrol. 2002, 142, 375–396. [Google Scholar] [CrossRef]
  126. Handley, H.K.; Macpherson, C.G.; Davidson, J.P.; Berlo, K.; Lowry, D. Constraining fluid and sediment contributions to subduction-related magmatism in Indonesia: Ijen volcanic complex. J. Pet. 2007, 48, 1155–1183. [Google Scholar] [CrossRef] [Green Version]
  127. Magna, T.; Wiechert, U.; Grove, T.L.; Halliday, A.N. Lithium isotope fractionation in the southern Cascadia subduction zone. Earth Planet. Sci. Lett. 2006, 250, 428–443. [Google Scholar] [CrossRef]
  128. Decitre, S.; Deloule, E.; Reisberg, L.; James, R.; Agrinier, P.; Mével, C. Behavior of Li and its isotopes during serpentinization of oceanic peridotites. Geochem. Geophys Geosyst 2002, 3, 1–20. [Google Scholar] [CrossRef] [Green Version]
  129. Lui-Heung, C.; Gieskes, J.M.; Chen-Feng, Y.; Edmond, J.M. Lithium isotope geochemistry of sediments and hydrothermal fluids of the Guaymas Basin, Gulf of California. Geochim. Cosmochim. Acta 1994, 58, 4443–4454. [Google Scholar] [CrossRef]
  130. Tomascak, P.B.; Carlson, R.W.; Shirey, S.B. Accurate and precise determination of Li isotopic compositions by multi-collector sector ICP-MS. Chem. Geol. 1999, 158, 145–154. [Google Scholar] [CrossRef]
  131. Chan, L.H.; Frey, F.A. Lithium isotope geochemistry of the Hawaiian plume: Results from the Hawaii Scientific Drilling Project and Koolau Volcano. Geochem. Geophys. Geosyst. 2003, 4, 8707. [Google Scholar] [CrossRef]
  132. Ryan, J.G.; Langmuir, C.H. The systematics of lithium abundances in young volcanic rocks. Geochim. Cosmochim. Acta 1987, 51, 1727–1741. [Google Scholar] [CrossRef]
  133. Bindeman, I.N.; Ponomareva, V.V.; Bailey, J.C.; Valley, J.W. Volcanic arc of Kamchatka: A province with high-δ18O magma sources and large-scale 18O/16O depletion of the upper crust. Geochim. Cosmochim. Acta 2004, 68, 841–865. [Google Scholar] [CrossRef]
  134. Bindeman, I. Oxygen isotopes in mantle and crustal magmas as revealed by single crystal analysis. Rev. Miner. Geochem. 2008, 69, 445–478. [Google Scholar] [CrossRef]
  135. Auer, S.; Bindeman, I.; Wallace, P.; Ponomareva, V.; Portnyagin, M. The origin of hydrous, high-δ18O voluminous volcanism: Diverse oxygen isotope values and high magmatic water contents within the volcanic record of Klyuchevskoy volcano, Kamchatka, Russia. Contrib Miner. Pet. 2009, 157, 209–230. [Google Scholar] [CrossRef]
  136. Dorendorf, F.; Wiechert, U.; Wörner, G. Hydrated sub-arc mantle: A source for the Kluchevskoy volcano, Kamchatka/Russia. Earth Planet. Sci. Lett. 2000, 175, 69–86. [Google Scholar] [CrossRef] [Green Version]
  137. Perkins, G.B.; Sharp, Z.D.; Selverstone, J. Oxygen isotope evidence for subduction and rift-related mantle metasomatism beneath the Colorado Plateau–Rio Grande rift transition. Contrib. Miner. Pet. 2006, 151, 633–650. [Google Scholar] [CrossRef] [Green Version]
  138. Harmon, R.S.; Hoefs, J. Oxygen isotope heterogeneity of the mantle deduced from global 18 O systematics of basalts from different geotectonic settings. Contrib Miner. Pet. 1995, 120, 95–114. [Google Scholar] [CrossRef]
  139. Wang, Z.; Eiler, J. Insights into the origin of low-δ18O basaltic magmas in Hawaii revealed from in situ measurements of oxygen isotope compositions of olivines. Earth Planet. Sci. Lett. 2008, 269, 377–387. [Google Scholar] [CrossRef]
  140. Wei, C.S.; Zheng, Y.F.; Zhao, Z.F.; Valley, J.W. Oxygen and neodymium isotope evidence for recycling of juvenile crust in northeast China. Geology 2002, 30, 375–378. [Google Scholar] [CrossRef] [Green Version]
  141. Muehlenbachs, K. Alteration of the oceanic crust and the 18O history of seawater. In Stable Isotopes in High Temperature Geological Processes; Valley, J.W., Taylor, H.P., O’Neil, J.R., Eds.; De Gruyter: Berlin, Germany, 1986; pp. 425–444. [Google Scholar]
  142. Cooper, K.M.; Eiler, J.M.; Asimow, P.D.; Langmuir, C.H. Oxygen isotope evidence for the origin of enriched mantle beneath the mid-Atlantic ridge. Earth Planet. Sci. Lett. 2004, 220, 297–316. [Google Scholar] [CrossRef]
  143. Demény, A.; Vennemann, T.W.; Hegner, E.; Nagy, G.; Milton, J.A.; Embey-Isztin, A.; Homonnay, Z.; Dobosi, G. Trace element and C–O–Sr–Nd isotope evidence for subduction-related carbonate–silicate melts in mantle xenoliths (Pannonian Basin, Hungary). Lithos 2004, 75, 89–113. [Google Scholar] [CrossRef]
  144. Eiler, J.M.; Farley, K.A.; Valley, J.W.; Hauri, E.; Craig, H.; Hart, S.R.; Stolper, E.M. Oxygen isotope variations in ocean island basalt phenocrysts. Geochim. Cosmochim. Acta 1997, 61, 2281–2293. [Google Scholar] [CrossRef]
  145. Xia, Q.K.; Dallai, L.; Deloule, E. Oxygen and hydrogen isotope heterogeneity of clinopyroxene megacrysts from Nushan Volcano, SE China. Chem. Geol. 2004, 209, 137–151. [Google Scholar] [CrossRef]
  146. Liu, P.P.; Teng, F.Z.; Dick, H.J.B.; Zhou, M.F.; Chung, S.L. Magnesium isotopic composition of the oceanic mantle and oceanic Mg cycling. Geochim. Cosmochim. Acta 2017, 206, 151–165. [Google Scholar] [CrossRef] [Green Version]
  147. Handler, M.R.; Baker, J.A.; Schiller, M.; Bennett, V.C.; Yaxley, G.M. Magnesium stable isotope composition of Earth’s upper mantle. Earth Planet. Sci. Lett. 2009, 282, 306–313. [Google Scholar] [CrossRef]
  148. Ionov, D.A. Petrology of mantle wedge lithosphere: New data on supra-subduction zone peridotite xenoliths from the andesitic Avacha volcano, Kamchatka. J. Pet. 2010, 51, 327–361. [Google Scholar] [CrossRef]
  149. Teng, F.Z.; Wadhwa, M.; Helz, R.T. Investigation of magnesium isotope fractionation during basalt differentiation: Implications for a chondritic composition of the terrestrial mantle. Earth Planet. Sci. Lett. 2007, 261, 84–92. [Google Scholar] [CrossRef]
  150. Yang, W.; Teng, F.Z.; Zhang, H.F. Chondritic magnesium isotopic composition of the terrestrial mantle: A case study of peridotite xenoliths from the North China craton. Earth Planet. Sci. Lett. 2009, 288, 475–482. [Google Scholar] [CrossRef]
  151. Wimpenny, J.; Yin, Q.Z.; Tollstrup, D.; Xie, L.W.; Sun, J. Using Mg isotope ratios to trace Cenozoic weathering changes: A case study from the Chinese Loess Plateau. Chem. Geol. 2014, 376, 31–43. [Google Scholar] [CrossRef]
  152. Li, W.Y.; Teng, F.Z.; Xiao, Y.; Huang, J. High-temperature inter-mineral magnesium isotope fractionation in eclogite from the Dabie orogen, China. Earth Planet. Sci. Lett. 2011, 304, 224–230. [Google Scholar] [CrossRef]
  153. Von Strandmann, P.A.E.P.; Elliott, T.; Marschall, H.R.; Coath, C.; Lai, Y.J.; Jeffcoate, A.B.; Ionov, D.A. Variations of Li and Mg isotope ratios in bulk chondrites and mantle xenoliths. Geochim. Cosmochim. Acta 2011, 75, 5247–5268. [Google Scholar] [CrossRef]
  154. Hacker, B.R. H2O subduction beyond arcs. Geochem. Geophys. Geosyst. 2008, 9, Q03001. [Google Scholar] [CrossRef] [Green Version]
  155. Magni, V.; Faccenna, C.; van Hunen, J.; Funiciello, F. How collision triggers backarc extension: Insight into Mediterranean style of extension from 3-D numerical models. Geology 2014, 42, 511–514. [Google Scholar] [CrossRef] [Green Version]
  156. Peacock, S.M.; Wang, K. Seismic consequences of warm versus cool subduction metamorphism: Examples from southwest and northeast Japan. Science 1999, 286, 937–939. [Google Scholar] [CrossRef] [Green Version]
  157. Van Keken, P.E.; Hacker, B.R.; Syracuse, E.M.; Abers, G.A. Subduction factory: 4. Depth-dependent flux of H2O from subducting slabs worldwide. J. Geophys. Res. 2011, 116, B01401. [Google Scholar] [CrossRef] [Green Version]
  158. Zheng, Y.F.; Chen, R.X.; Xu, Z.; Zhang, S.B. The transport of water in subduction zones. Sci. China Earth Sci. 2016, 59, 651–682. [Google Scholar] [CrossRef]
  159. Ko, Y.T.; Kuo, B.Y.; Wang, K.L.; Lin, S.C.; Hung, S.H. The southwestern edge of the Ryukyu subduction zone: A high Q mantle wedge. Earth Planet. Sci. Lett. 2012, 335–336, 145–153. [Google Scholar] [CrossRef]
Figure 1. Regional geologic map of the Okinawa Trough (OT) showing the sampling locations. MOT, middle Okinawa Trough; SOT, southern Okinawa Trough; and NOT, northern Okinawa Trough. Black solid lines represent the depth contours of the subducting plate (Wadati-Benioff zone) [11,67,71]. Yellow dotted lines mark the Tokara Fault and the Kerama Fault.
Jmse 10 00040 g001
Figure 2. Representative photomicrographs of the MOT and SOT volcanic lava samples. (a) T9-1 is from the SOT and (b) R2, (c) T5-2, (d) T2, (e) T6-1, and (f) T6-2 are from the MOT. Abbreviations: olivine (Ol); magnetite (Mt); clinopyroxene (Cpx); orthopyroxene (Opx); and plagioclase (Pl).
Jmse 10 00040 g002
Figure 3. Classification diagrams for the MOT and SOT volcanic lavas. (a) Plots of Na2O + K2O vs. SiO2. The base diagram is from [87], and the boundary between the alkaline and subalkaline rocks is from [86]. (b) K2O (wt.%) vs. SiO2 (wt.%). Boundaries are from [88]. Data for published mafic samples are from [1,36,50,74]. Data for published felsic samples from [1,73,74]. Data for samples R2, T5-2, T6-1, T2, T6-2, and T9-1 are from this study.
Jmse 10 00040 g003
Figure 4. (a,c,e) Trace element patterns normalized to primitive mantle and (b,d,f) corresponding rare earth element (REE) patterns normalized to chondritic contents for the MOT and SOT volcanic lavas. Primitive mantle and chondrite contents are from [90]. (a,b) show the trace element distributions of the MOT basalt and the SOT basaltic andesite, respectively. (c,d) show the trace element distributions of the MOT andesite and trachyandesite, respectively. (e,f) show the trace element distributions of the MOT rhyolites. Data are from [50,73], and this study.
Jmse 10 00040 g004
Figure 5. The δ7Li distributions of (a) the different whole-rock and mineral separates from the Okinawa Trough (OT) and (b) mid-ocean ridge basalts (MORBs), AOC, sediment, upper continental crust, and seawater. The δ18O distributions of (c) the different whole-rock and mineral separates from the OT and (d) MORBs, AOC, sediment, and upper continental crust. The δ26Mg distributions of (e) the different whole-rock and mineral separates from the OT and (f) MORBs, AOC, sediment, upper continental crust, and seawater. The MORB δ7Li range is from [22,33,91,92,93]. The AOC δ7Li data are from [4,22,25,94]. The sediment δ7Li data are from [3,4,25,27,95,96,97]. Upper continental crust (UCC) δ7Li data are from [98]. The MORB δ18O range is from [99,100,101]. AOC δ18O data are from [102,103]. Sediment δ18O data are from [104]. UCC δ18O data are from [105]. The MORB δ26Mg range is from [106,107]. AOC δ26Mg data are from [39]. Sediment δ26Mg data are from [108]. UCC δ26Mg data are from [109].
Jmse 10 00040 g005
Figure 6. Crystallization temperatures and magma source depths for the MOT and SOT volcanic lavas.
Jmse 10 00040 g006
Figure 7. (a) SiO2 vs. 87Sr/86Sr and (b) SiO2 vs. 143Nd/144Nd plots showing that crustal assimilation slightly influenced the magmatic evolution of the MOT and SOT volcanic lavas. Data for published mafic samples are from [1,36,50,74]. Data for published felsic samples are from [1,73,74]. Data for samples T6-1, T2, and T6-2 are from this study.
Jmse 10 00040 g007
Figure 8. Trace element ratio plots: (a) Th/Rb vs. Ba/La, (b) Ce/Pb vs. Ba/La, (c) Th/Yb vs. Ba/La, and (d) Th/Nb vs. Ba/Th for the MOT and SOT volcanic lavas. Compositions of the EPR MORB data are from PetDB database (www.earthchem.org/petdb accessed on 10 December 2021). Subducted sediment compositions are from [10]. Canary ocean island basalt (OIB) contents are from [119]. Calc-alkaline basalt contents are from [120,121], and the values for the lower crust in the North China Craton are from [122]. Data for published mafic samples are from [1,36,50,74]. Data for published felsic samples from [1,73,74]. Data for samples R2, T5-2, T6-1, T2, and T6-2 in the MOT and T9-1 in the SOT are from this study.
Jmse 10 00040 g008
Figure 9. Plots of (a) δ18O vs. δ7Li and (b) δ26Mg vs. δ7Li for the MOT and SOT samples. Isotopic compositions (δ18O = 2‰, δ7Li = 11‰, and δ26Mg = −0.25‰) of AOC are from [33,39,137], respectively. Isotopic compositions (δ18O = 22‰, δ7Li = −2.1‰, and δ26Mg = −0.1‰) of subducted sediments are from [7,33,108], respectively. Isotope compositions (δ18O = 5.5‰, δ7Li = 6.5‰, and δ26Mg = −0.35‰) of mid-ocean ridge basalts (MORBs) are from [22,107,110], respectively.
Jmse 10 00040 g009
Figure 10. Schematic diagram showing the different contributions of subduction components to the (a) MOT and (b) SOT.
Jmse 10 00040 g010
Publisher’s Note: MDPI stays neutral with regard to jurisdictional claims in published maps and institutional affiliations.

