Article

Monitoring Agricultural Expansion in a Newly Reclaimed Area in the Western Nile Delta of Egypt Using Landsat Imageries

by
Taher M. Radwan
1,2
1
Lancaster Environment Centre, Lancaster University, Lancaster LA1 4YQ, UK
2
Department of Soil and Water Sciences, Faculty of Agriculture (El-Shatby), Alexandria University, Alexandria 21545, Egypt
Agriculture 2019, 9(7), 137; https://doi.org/10.3390/agriculture9070137
Submission received: 31 May 2019 / Revised: 25 June 2019 / Accepted: 26 June 2019 / Published: 1 July 2019

Abstract

:
Detection and monitoring land use/land cover (LULC) changes using historical multi-temporal remote sensing data is greatly important for providing an effective and robust assessment of the human-induced impacts on the environmental conditions. It is extremely recommended for LULC studies related to evaluating the sustainability of changing areas over time. The agricultural sector in Egypt is one of the crucial pillars of the national economy. The amount of traditional agricultural land (Old Lands) in the Nile Delta had a significant decline over the past few decades due to urban encroachment. Consequently, several land reclamation initiatives and policies have been adopted by the Egyptian government to expand agricultural land in desert areas (New Lands) adjacent to both fringes of the Nile delta. Tiba district is one of those newly reclaimed areas located in the western Nile Delta of Egypt with a total area of 125 km2. The primary objective of this article was to identify, monitor and quantify historical LULC changes in Tiba district using historical multi-temporal Landsat imageries for six different dates acquired from 1988 to 2018. The temporal and historical changes that occurred were identified using supervised maximum likelihood classification (MLC) approach. Three major LULC classes were distinguished and mapped: (1) Agricultural land; (2) barren land; and (3) urban land. In 1988, Tiba district was 100% barren land; however, during the 1990s, the governmental reclamation projects have led to significant changes in LULC. The produced LULC maps from performing the MLC demonstrated that Tiba district had experienced significant agricultural land expansion from 0% in 1988 to occupy 84% in 2018, whilst, barren land area has decreased from 100% in 1988 to occupy only 7% in 2018. This reflects the successful governmental initiatives for agricultural expansion in desert areas located in the western Nile Delta of Egypt.

Graphical Abstract

1. Introduction

Egypt has one of the world’s fastest growing and largest populations, with a total population of 100 million people [1]. The country’s total land area is 1 million km2 of which nearly 96% is vast arid deserts, and only 4% of the total land area of Egypt (The Nile Delta region) is inhabited [2,3]. This dramatic population increase, and the limited inhabited land area has caused critical socio-economic and environmental problems, including an increase of unemployment levels, reducing living standards, and loss of productive agricultural land due to urban encroachment [3,4,5]. The unbalanced ratio between human and land resources is the main issue in Egypt. Such a high annual non-stop population growth requires paying considerable attention to preserve the limited natural and land resources, to maximize agricultural productivity and to reclaim more agricultural land in the desert (New Lands) [4,5].
The continuous loss of fertile agricultural land and the potential subsequent food security issues have led to crucial concerns for governments, particularly within developing countries [6,7]. During the past four decades, the Egyptian government adopted policies to cope with the growing demand for food and to ensure self-sufficiency from food production, i.e., agriculture land expansion and maximization of existing crops’ yields. Consequently, several initiatives have been executed to reclaim New Lands in the desert, these governmental efforts led to the conversion of more than 12,000 km2 from barren land to agricultural land (New Lands) [4,5,8].
Agricultural land in Egypt can be divided into two main categories; Old Lands and New Lands [3,9,10]. Old Lands represent highly fertile soils, which are located in the Nile Delta. Due to the River Nile deposits and the highly productive nature of the soil, these areas have been traditionally cultivated with strategic cereal crops, such as rice, wheat and maize, preserving food security for the Egyptian people. During the past four decades, these areas have been encroached by dramatic urban sprawl due to the rapid population growth and economic development [4,5,8]. Therefore, there has been a pressing need for the government to find alternative solutions to maintain the sustainability of the national agricultural sector. Consequently, the adopted policies by the government to reclaim new lands in the desert have led to the second category (New Lands). These are barren areas located in the Western and Eastern deserts outside the green zone of the Nile Delta [3,8]. The New Lands process includes accessibility through constructing roads, houses, installing irrigation and drainage systems and providing reliable sources of water and electricity [11,12].
Due to the rapid global population growth and the increasing demand for food, particularly in developing countries, agricultural expansion has been one of the priority initiatives for decision makers and authorities. In Africa, Basnet and Vodacek [13] tracked land use/land cover (LULC) dynamics in the region of Lake Kivu, which is located on the border between Uganda, Democratic Republic of Congo, Rwanda and Burundi in central Africa. They reported that agricultural land had expanded from 28,730 km2 in 1988 to 34,630 km2 in 2011. Knauer et al. [14] monitored agricultural land expansion in Burkina Faso from 2001 to 2014. They demonstrated that agricultural land had increased from 61,080 km2 in 2001 to 116,907 km2 in 2014. In Asia, Zhao et al. [15] studied the long-term land cover dynamics of Northeast China from 1986 to 2016. They found that croplands expansion was the major land cover change occurred in this region, and it has been increased by 63,000 km2 over the study period. Yang et al. [16] analyzed the forest deforestation patterns and its driving factors between 1988 and 2017 in Myanmar. Thy reported that agricultural land had expanded by about 91,000 km2 at the expense of long-term deforestation processes.
The integration of GIS/RS can provide applicable and powerful techniques to understand, evaluate and analyze the changes in LULC dynamics [17,18,19]. Historical and continual RS data can provide accurate and up-to-date geospatial information—this would help to produce more detailed LULC maps for a better understanding of the surrounding changing landscape [20,21,22]. Furthermore, it could help decision makers and planners identify and develop alternative sustainable plans and solutions for their communities [23,24,25]. LULC change detection by remotely-sensed data involves the analysis of several multi-date satellite images to detect and identify the differences within LULC due to different human and environmental phenomena occurring between the acquisition dates of the analyzed images [26,27,28]. The most common platform for acquiring remotely-sensed data is the moderate-resolution, multi-spectral Land system (Landsat). The Landsat program was initiated by the National Aeronautical and Space Administration (NASA) in 1967, and the launch of the first satellite in the series was in 1972 [29]. It provides historical, consistent and continuous records of imagery. These records of imagery can be processed and analyzed to explore LULC changes over vast areas with a decent amount of spatial detail that is sufficient for identifying, monitoring and evaluating global LULC changes [30].
Several studies have been attempted using different sensors (TM, ETM+, OLI) Landsat imagery to monitor LULC changes in Egypt. Allam et al. [31] monitored the LULC changes in an arid region in Fayoum governorate, Egypt using maximum likelihood classification (MLC) approach from 1984 to 2016. Bakr and Afifi [32] quantified the LULC changes and its potential impacts on rice production using MLC technique in Kafr El-Sheikh governorate, northern of the Nile Delta of Egypt between 1972 and 2016. Xu et al. [33] monitored cropland changes along the River Nile in Egypt from 1984 to 2015 using 961 images. Bratley and Ghoneim [8] used three images to monitor the urban sprawl in the East of the Nile Delta between 1988 and 2017. Megahed et al. [34] used three images to map and model urban encroachment over Greater Cairo between 1984 and 2014. Halmy et al. [35] used three images between 1988 and 2011 to monitor LULC changes in the Northwestern coast of Egypt. Shalaby and Moghanm [36] assessed the implications of urban expansion on the productive cultivated land in the North of the Nile Delta using 12 images for the years 1984, 1992 and 2006. Hegazy and Kaloop [37] investigated LULC change detection from 1985 to 2010 using three images in Dakahlia governorate. Shalaby et al. [38] used three images to monitor the implications of urban sprawl on the fertile cultivated land from 1992 to 2009 in Qalubia governorate. Belal and Moghanm [39] detected LULC changes in Gharbia Governorate, using two images acquired in 1972 and 2005. Abdulaziz et al. [40] used three images from 1984 to 2003 to analyze LULC changes in the Eastern Nile Delta. Shalaby and Tateishi used two images for the years 1987 and 2001 to monitor LULC types in the Northwestern coast of Egypt.
The objective of this paper was to identify, monitor and quantify historical LULC changes in Tiba district, western Nile Delta, Egypt from 1988 to 2018 using multi-temporal Landsat imageries and a supervised MLC approach.

2. Materials and Methods

2.1. Study Area

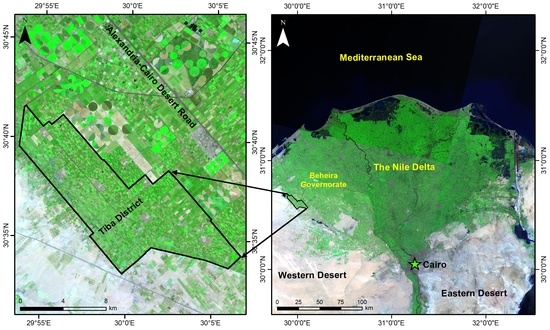
Tiba district is located in both Beheira and Alexandria governorates, western of the Nile Delta, North of Egypt in a newly reclaimed desert region (New Lands). It is bounded by longitude 29°53′ to 30°7′ E, and latitude 30°33′ to 30°41′ N. It is mainly accessible through Alexandria-Cairo desert road and occupies a total area of about 125 km2 (12,527 hectares). This total area is as half the size of Edinburgh (The capital city of Scotland, UK). It covers an area that belongs to six villages, namely, Hussein Abo El-Yosr, Suliman, Adam (the central village), Abd El-Halim Mahmoud, El-Yashaa, and Bilal. Tiba district is characterized by a Mediterranean semi-arid climate. Climatic data were obtained from Tahrir meteorological station (longitude: 30°70′ E, latitude: 30°65′ N, elevation: 16 m) using CLIMWAT 2.0 for CROPWAT 8.0 software [41]. Average climatic records for thirty years demonstrate that the minimum and maximum temperatures occur in January (6 °C) and August (35 °C), respectively. Rainfall mostly takes place during winter months, whilst, the summer months are usually dry with yearly total precipitation around 34 mm [11].
According to the macro-morphological description, field observations, presence or absence of main diagnostic horizons, parent material, soil attributes values derived from laboratory analysis. The soils of Tiba district could be recognized as Entisols order and could be classified as Typic Torripsamments due to the high sandy content found in all fifty-four investigated soil profiles [42]. Tiba district (Figure 1) is cultivated with several crops, the majority are fruit trees (Orchards), such as Citrus, Grape, Apple, Banana, Peach, Pear, and a few areas are cultivated with vegetables and field crops. The main source of irrigation water in Tiba district is branch canal 20, which feeds from the River Nile, and the main pump station is located in the zone of Hussein Abo El-Yosr village. However, a few areas rely on groundwater wells as an irrigation water source. The main irrigation systems used in the study area are mostly the dripping system and partially sprinkler and surface systems.

2.2. Data sets Collection and Description

2.2.1. Landsat Imageries Description

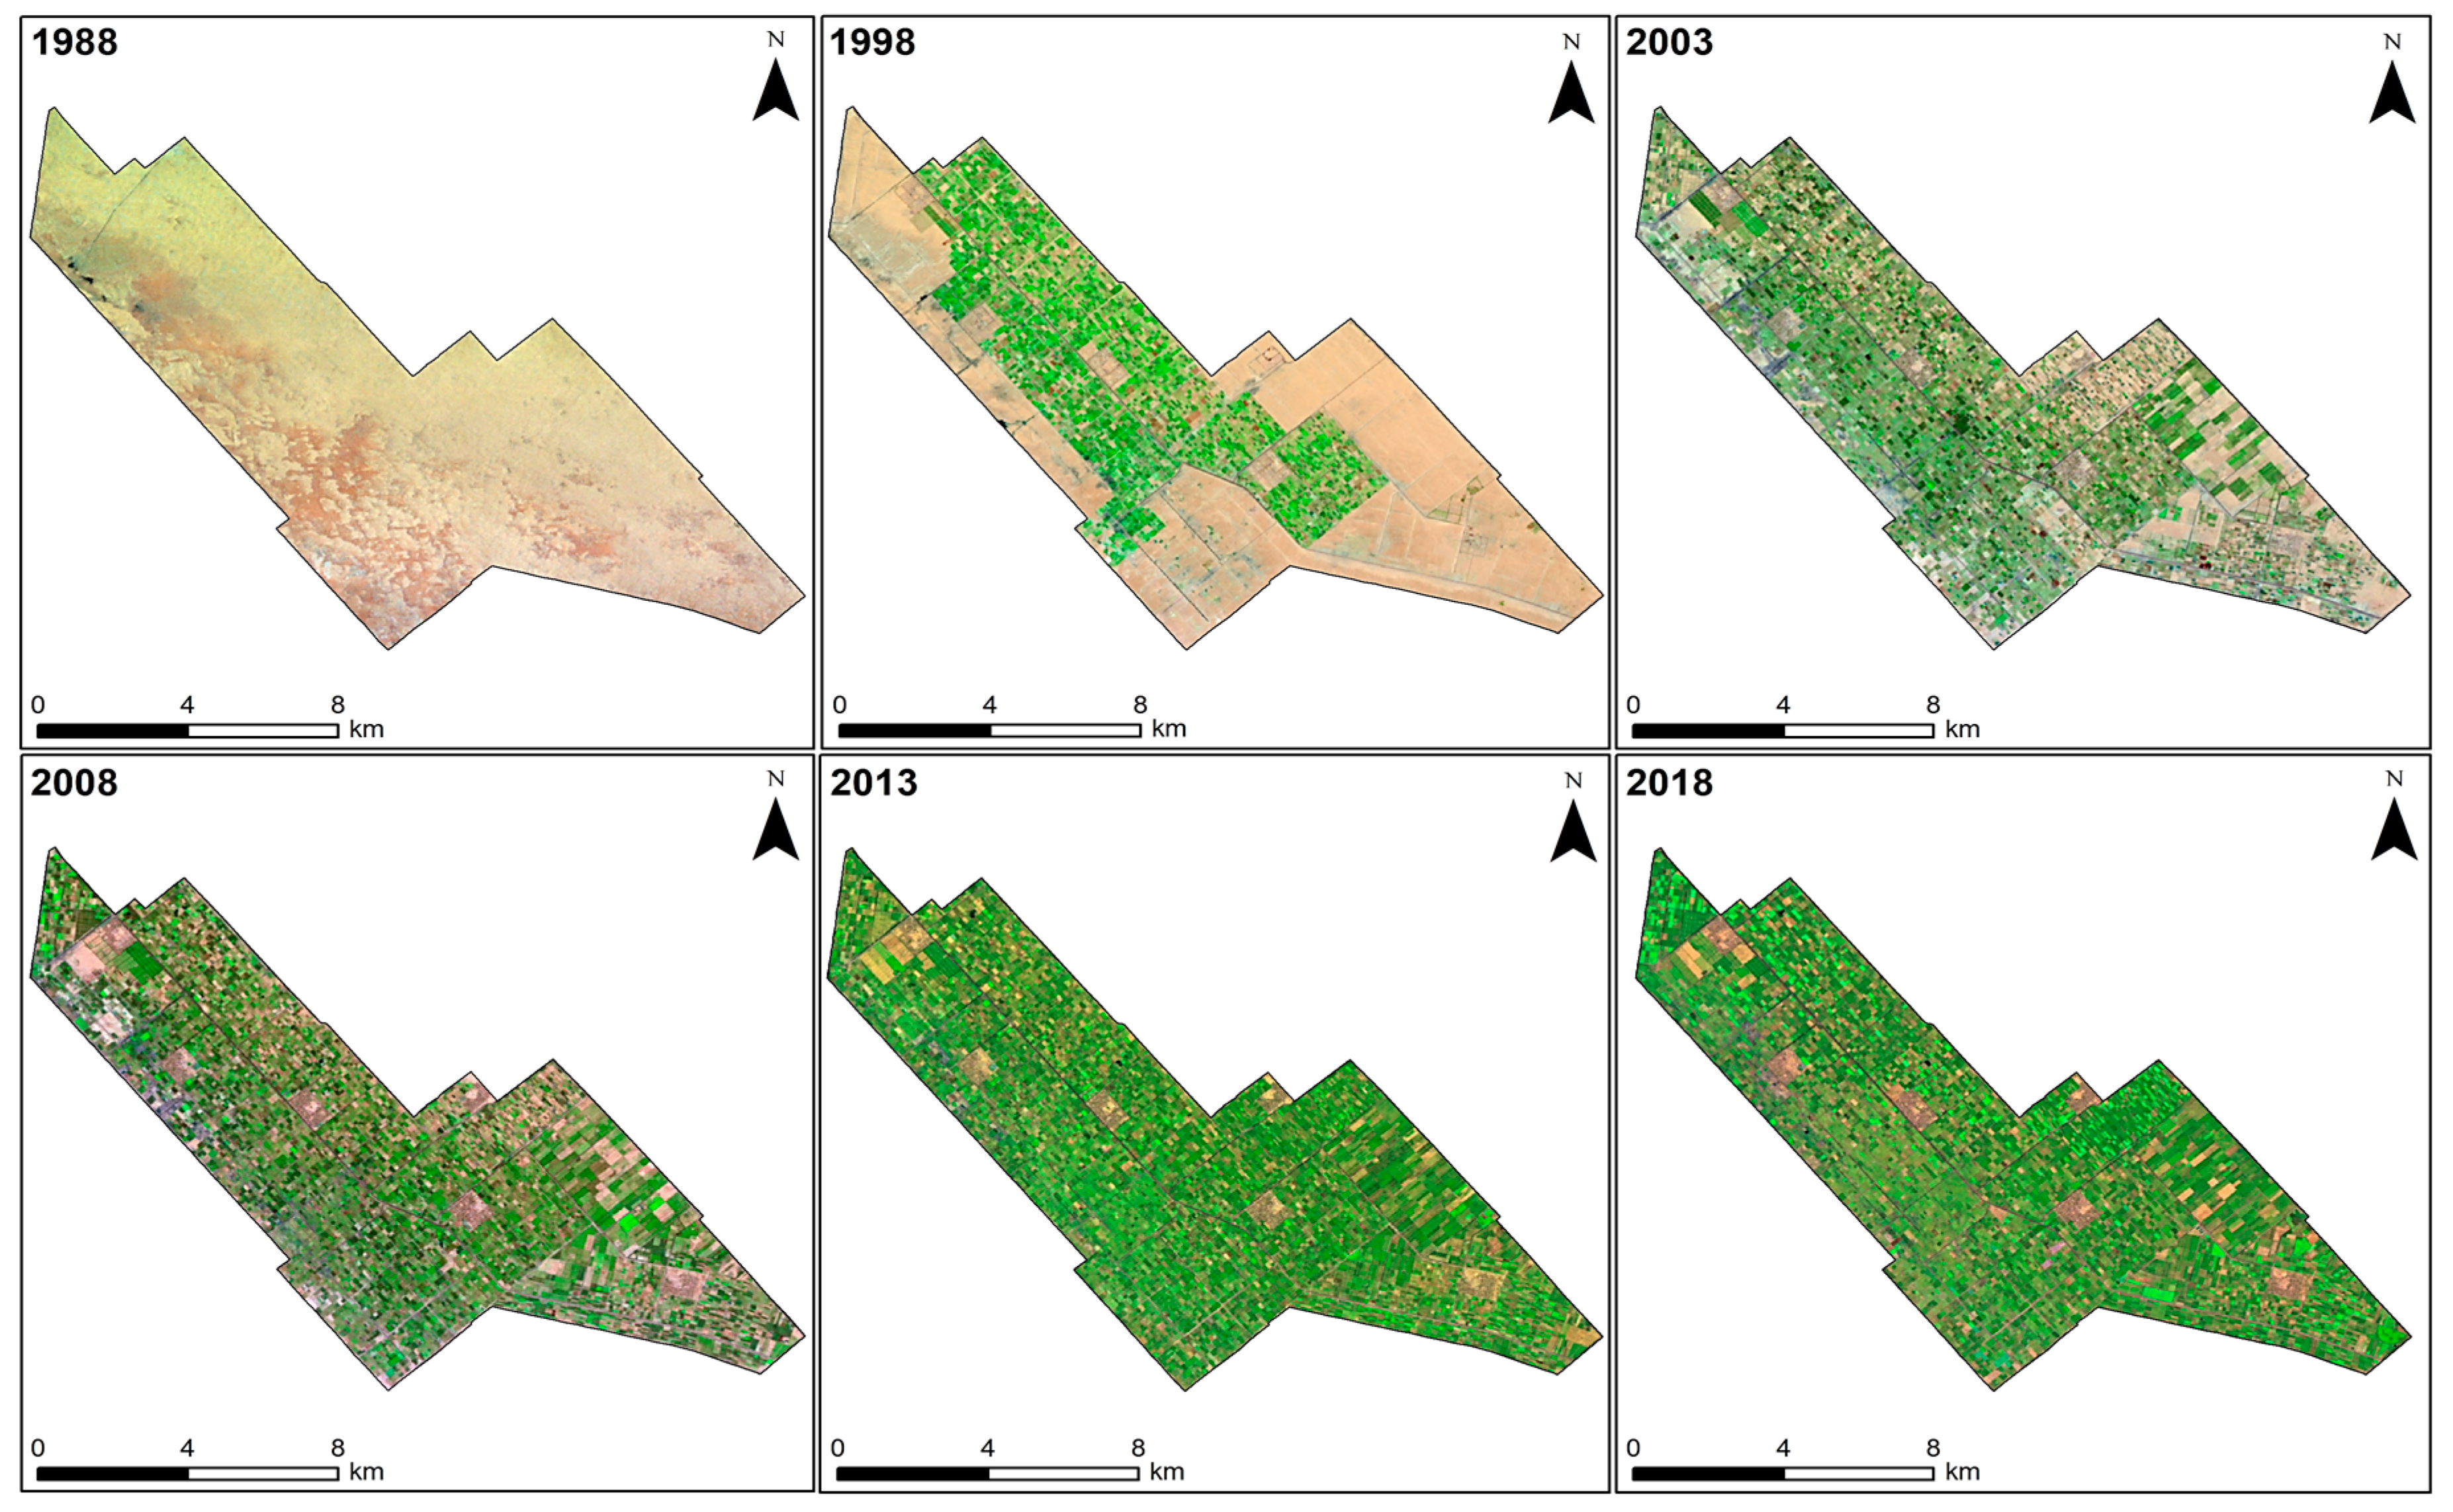
The data sets used in this paper include six Landsat images with 30 m spatial resolution (Table 1). Three Thematic Mapper (TM) sensor images mounted on Landsat-5 acquired in July 1988, 1998 and May 2008. An Enhanced Thematic Mapper Plus (ETM+) sensor image onboard Landsat-7 acquired in May 2003 (Before the SLC failure). Two Operational Land Imager (OLI) sensor image onboard Landsat-8 acquired in July 2013 and May 2018 (Figure 2). They have not been collected in the same month, to ensure that all the used imageries are 100% cloud free. These particular dates were selected to explore the agricultural expansion occurred in the studied area through a five-year interval. Except the first time period had a 10-year interval, since the land reclamation projects were initiated in this area, as well as surrounding areas at the beginning of the 1990s. All images are GeoTIFF Level 1 products and were acquired on satellite track path/row 177/039. They are freely available and obtained from the United States Geological Survey (USGS) website (http://earthexplorer.usgs.gov).

2.2.2. Ancillary and Other Data Description

Other ancillary data were used to support this study, including, two paper topographic maps covering Tiba District with a scale of 1:50,000 were on-screen digitized. Furthermore, fifty-four ground control points (GCPs) were collected from Tiba District using Garmin GPSMAP 64s to identify and provide information about the LULC types exist in the studied area. These ground truth points were also used to confirm the training sets during the supervised classification. In addition, Google Earth Pro was used to validate the LULC classes’ locations visually.
The Shuttle Radar Topographic Mission (SRTM) 30 m digital elevation model (DEM) produced by NASA was acquired and clipped using the study area’s shapefile. All acquired and used data sets in this paper were projected into the World Geodetic System (WGS 84) Universal Transverse Mercator (UTM) zone 36N projection. The Environment for Visualization Images (ENVI) 5.3 image processing software package [43] and ArcGIS Desktop 10.5 [44] were used to carry out the digital image processing and undertake the MLC classification approach performed in this paper.

2.3. Satellite Image Pre-Processing

Pre-processing of remote sensing data prior to change detection studies is a fundamental procedure [45]. All imageries (Figure 2) were geometrically projected to the projection WGS 84 (UTM zone 36). All the acquired images were cloud coverage-free, carefully chosen using the available metadata filtering on the USGS website. Therefore, atmospheric correction is not required. Furthermore, it is not required in such change detection studies as long as the used satellite images are geometrically corrected [46]. All images were subset (Clipped) and masked to the boundary (Shapefile) of Tiba District, then, a layer stacking (Bands compositing) operation was performed for each image, involving all the bands except Band 6 (Thermal band) and Band 8 (Panchromatic band) if existed (i.e., Landsat 7 and 8 images).

2.4. Images Visual Interpretation

Prior to image classification, the identified LULC classes in Tiba District were categorized into three main classes, agricultural land, barren land, and urban land. These three LULC classes were recognized based on the visual interpretation of the used satellite images and verified according to field investigation. Agricultural land mainly represents areas cultivated with fruit trees (Orchards), vegetables or field crops, and these areas are recently reclaimed lands (New Lands). Urban areas include roads, irrigation canals (Concrete materials) and the existing six residential villages in the study area as previously mentioned, which have been constructed at the 1990s decade as part of several new land reclamation projects by the Egyptian government. Barren land refers to uncultivated land or desert areas [3,5,11].

2.5. Supervised Image Classification

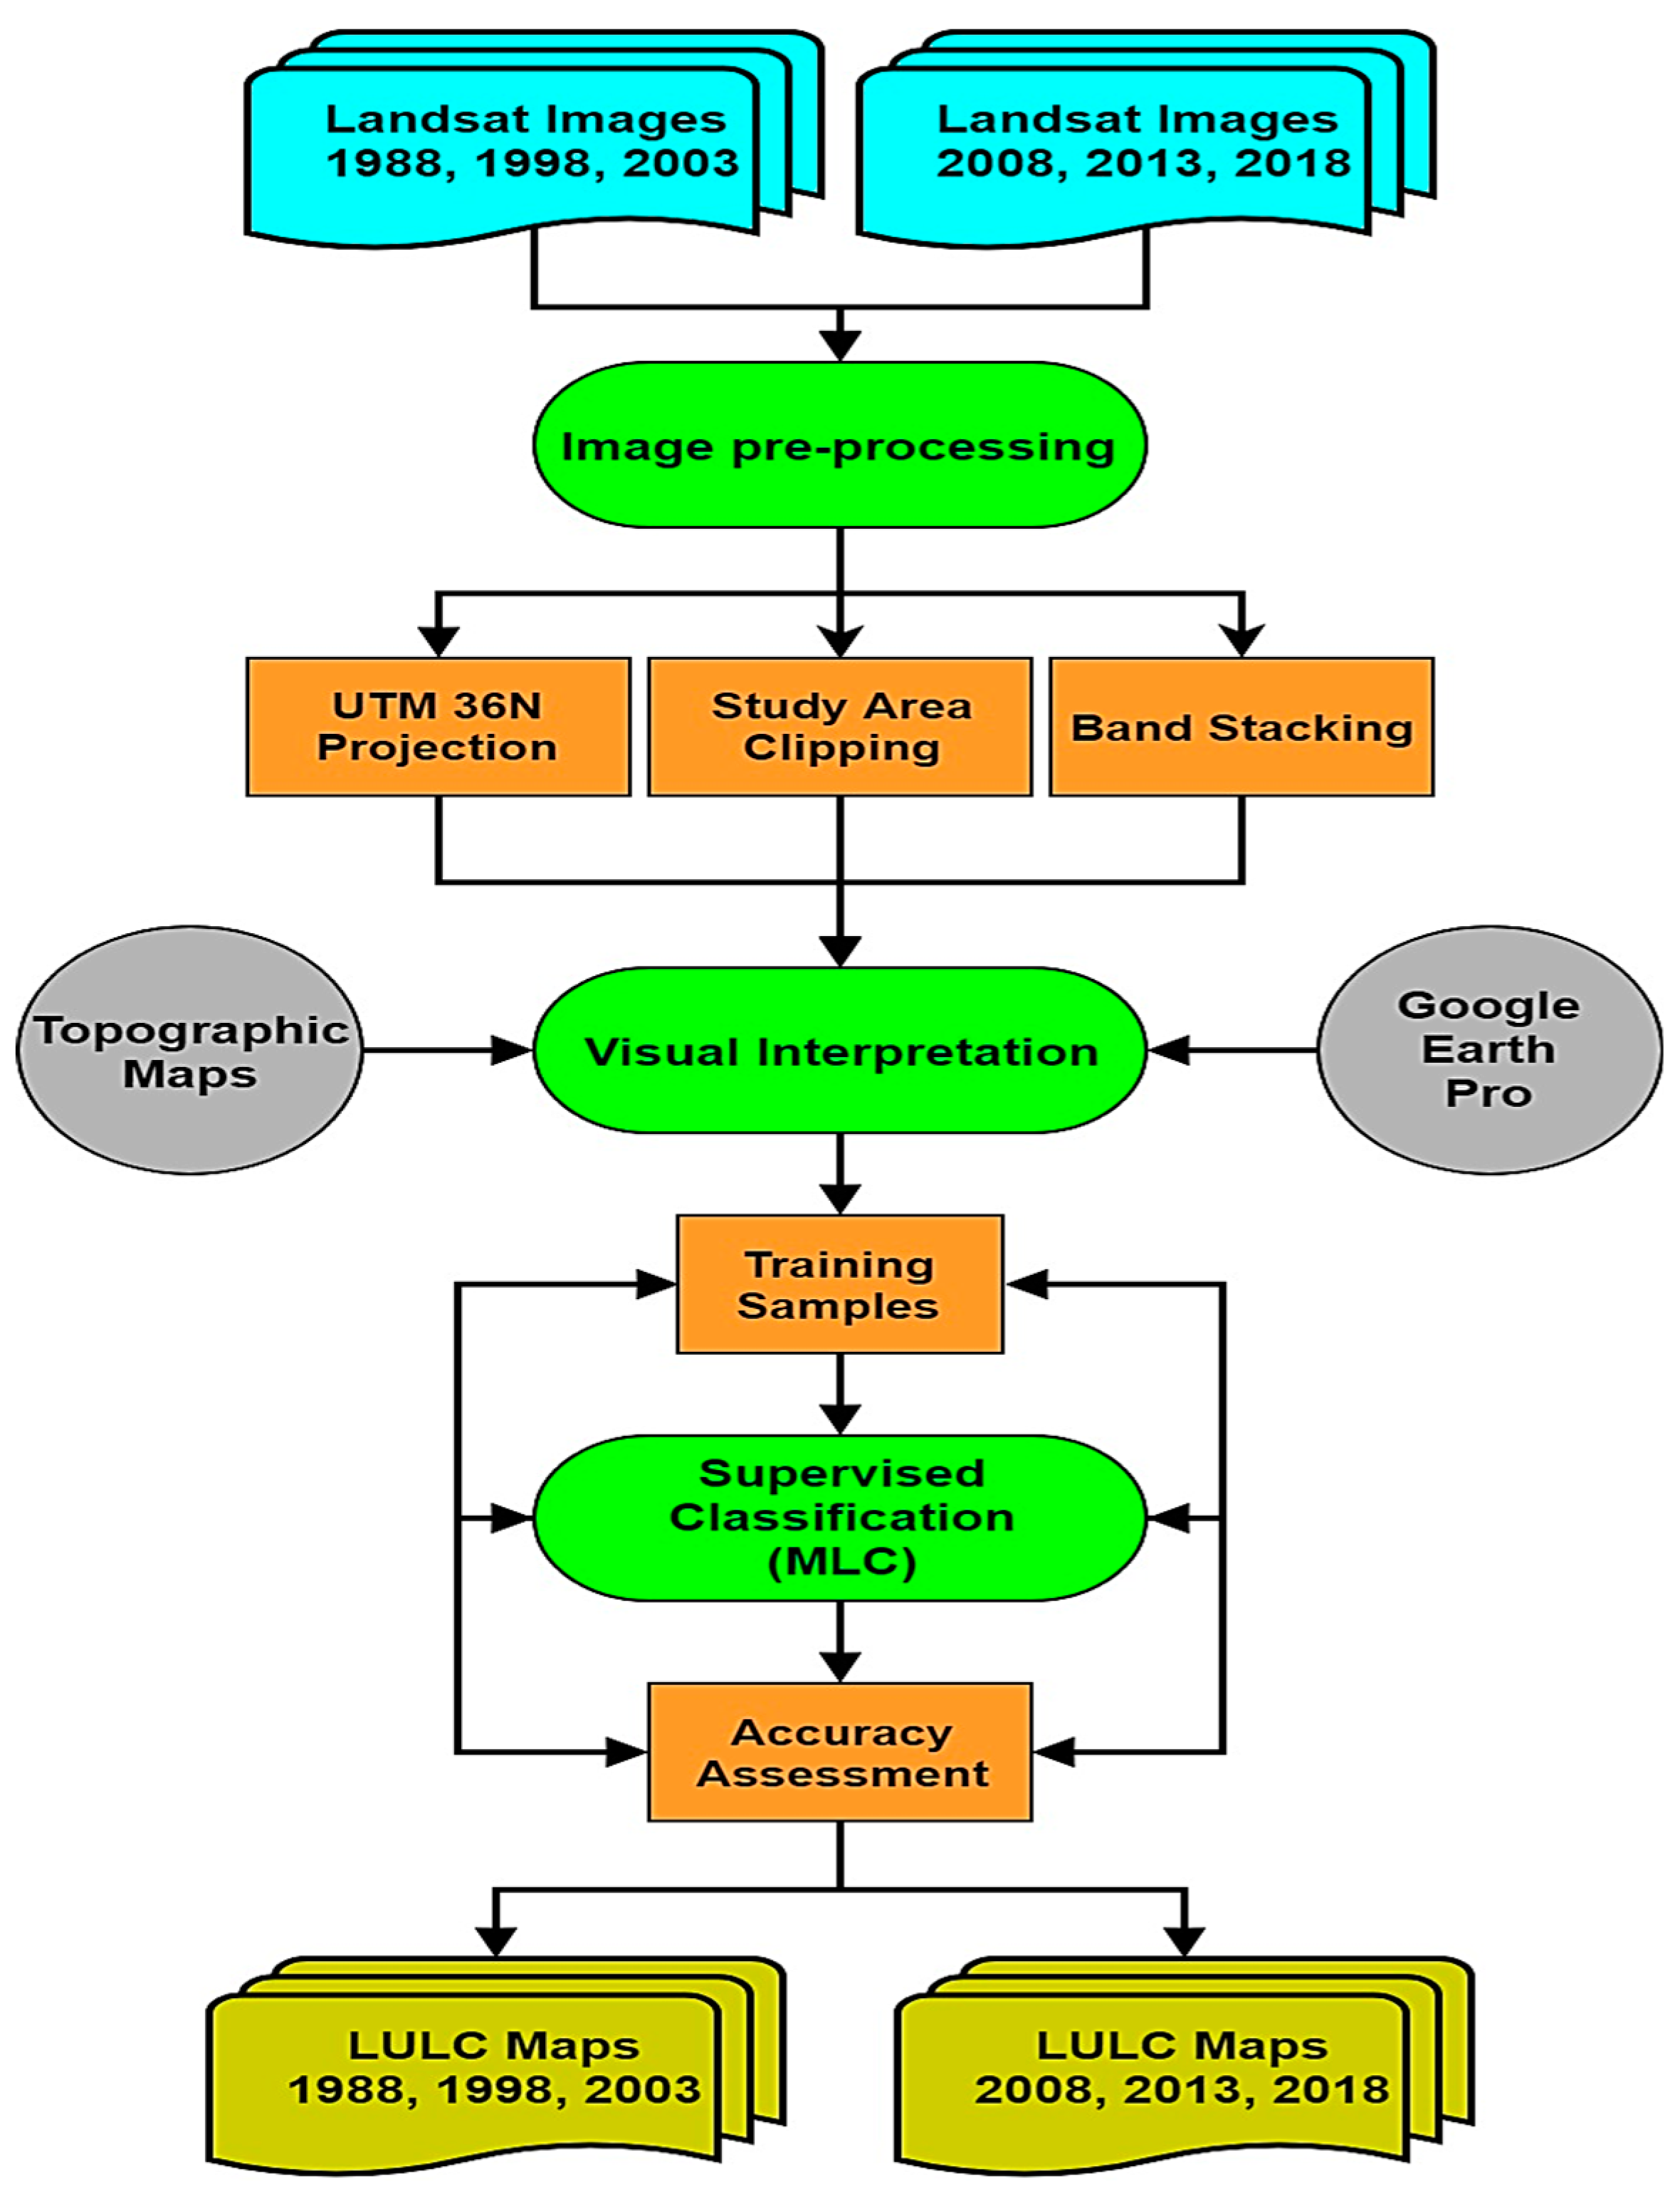
The second step of the classification was to undertake the supervised classification. Based on the field inspection and images’ visual interpretation, three LULC classes were distinguished in Tiba District: Agricultural land, barren land, and urban land. Training sets were drawn for each of the pre-identified LULC classes by drawing polygons per each representative site per LULC class. Using the pixels located within these polygons, various spectral signatures for the corresponding LULC classes were derived and generated [47,48]. The maximum likelihood classification was used to undertake the supervised classification for the analyzed imageries, since it is the most common supervised classification technique being used to classify satellite images. The basis of the maximum likelihood classification technique is the likelihood of each group of pixels with similar spectral signatures to be grouped into one LULC class [49,50]. Therefore, pixels with similar spectral signatures in each class were grouped together forming the three major LULC classes in the study area. The two topographic maps, high-resolution Google Earth Pro images and the investigated GCPs were used to improve the classification approach. Six LULC maps were generated for the used dates; 1988, 1998, 2003, 2008, 2013, and 2018. Figure 3 shows the flowchart of the methodology undertaken in this article.

2.6. Classification Accuracy Assessment

Accuracy assessment is considered a crucial step in classifying remotely-sensed data used in LULC change studies [49,50,51]. An accuracy assessment for the classification was undertaken based on independently selected 100 random pixels from each resulting LULC map. These random pixels were recognized and assigned based on a stratified random technique to represent the three main LULC classes located in the study area. The most common method of undertaking classification accuracy validation for remote sensing applications is to create error matrices [52,53]. Two different accuracies were generated from the values in an error matrix; user’s accuracy and producer’s, as well as calculating Kappa (K^) statistics [51,54].

3. Results

3.1. SRTM DEM and Slope Analysis

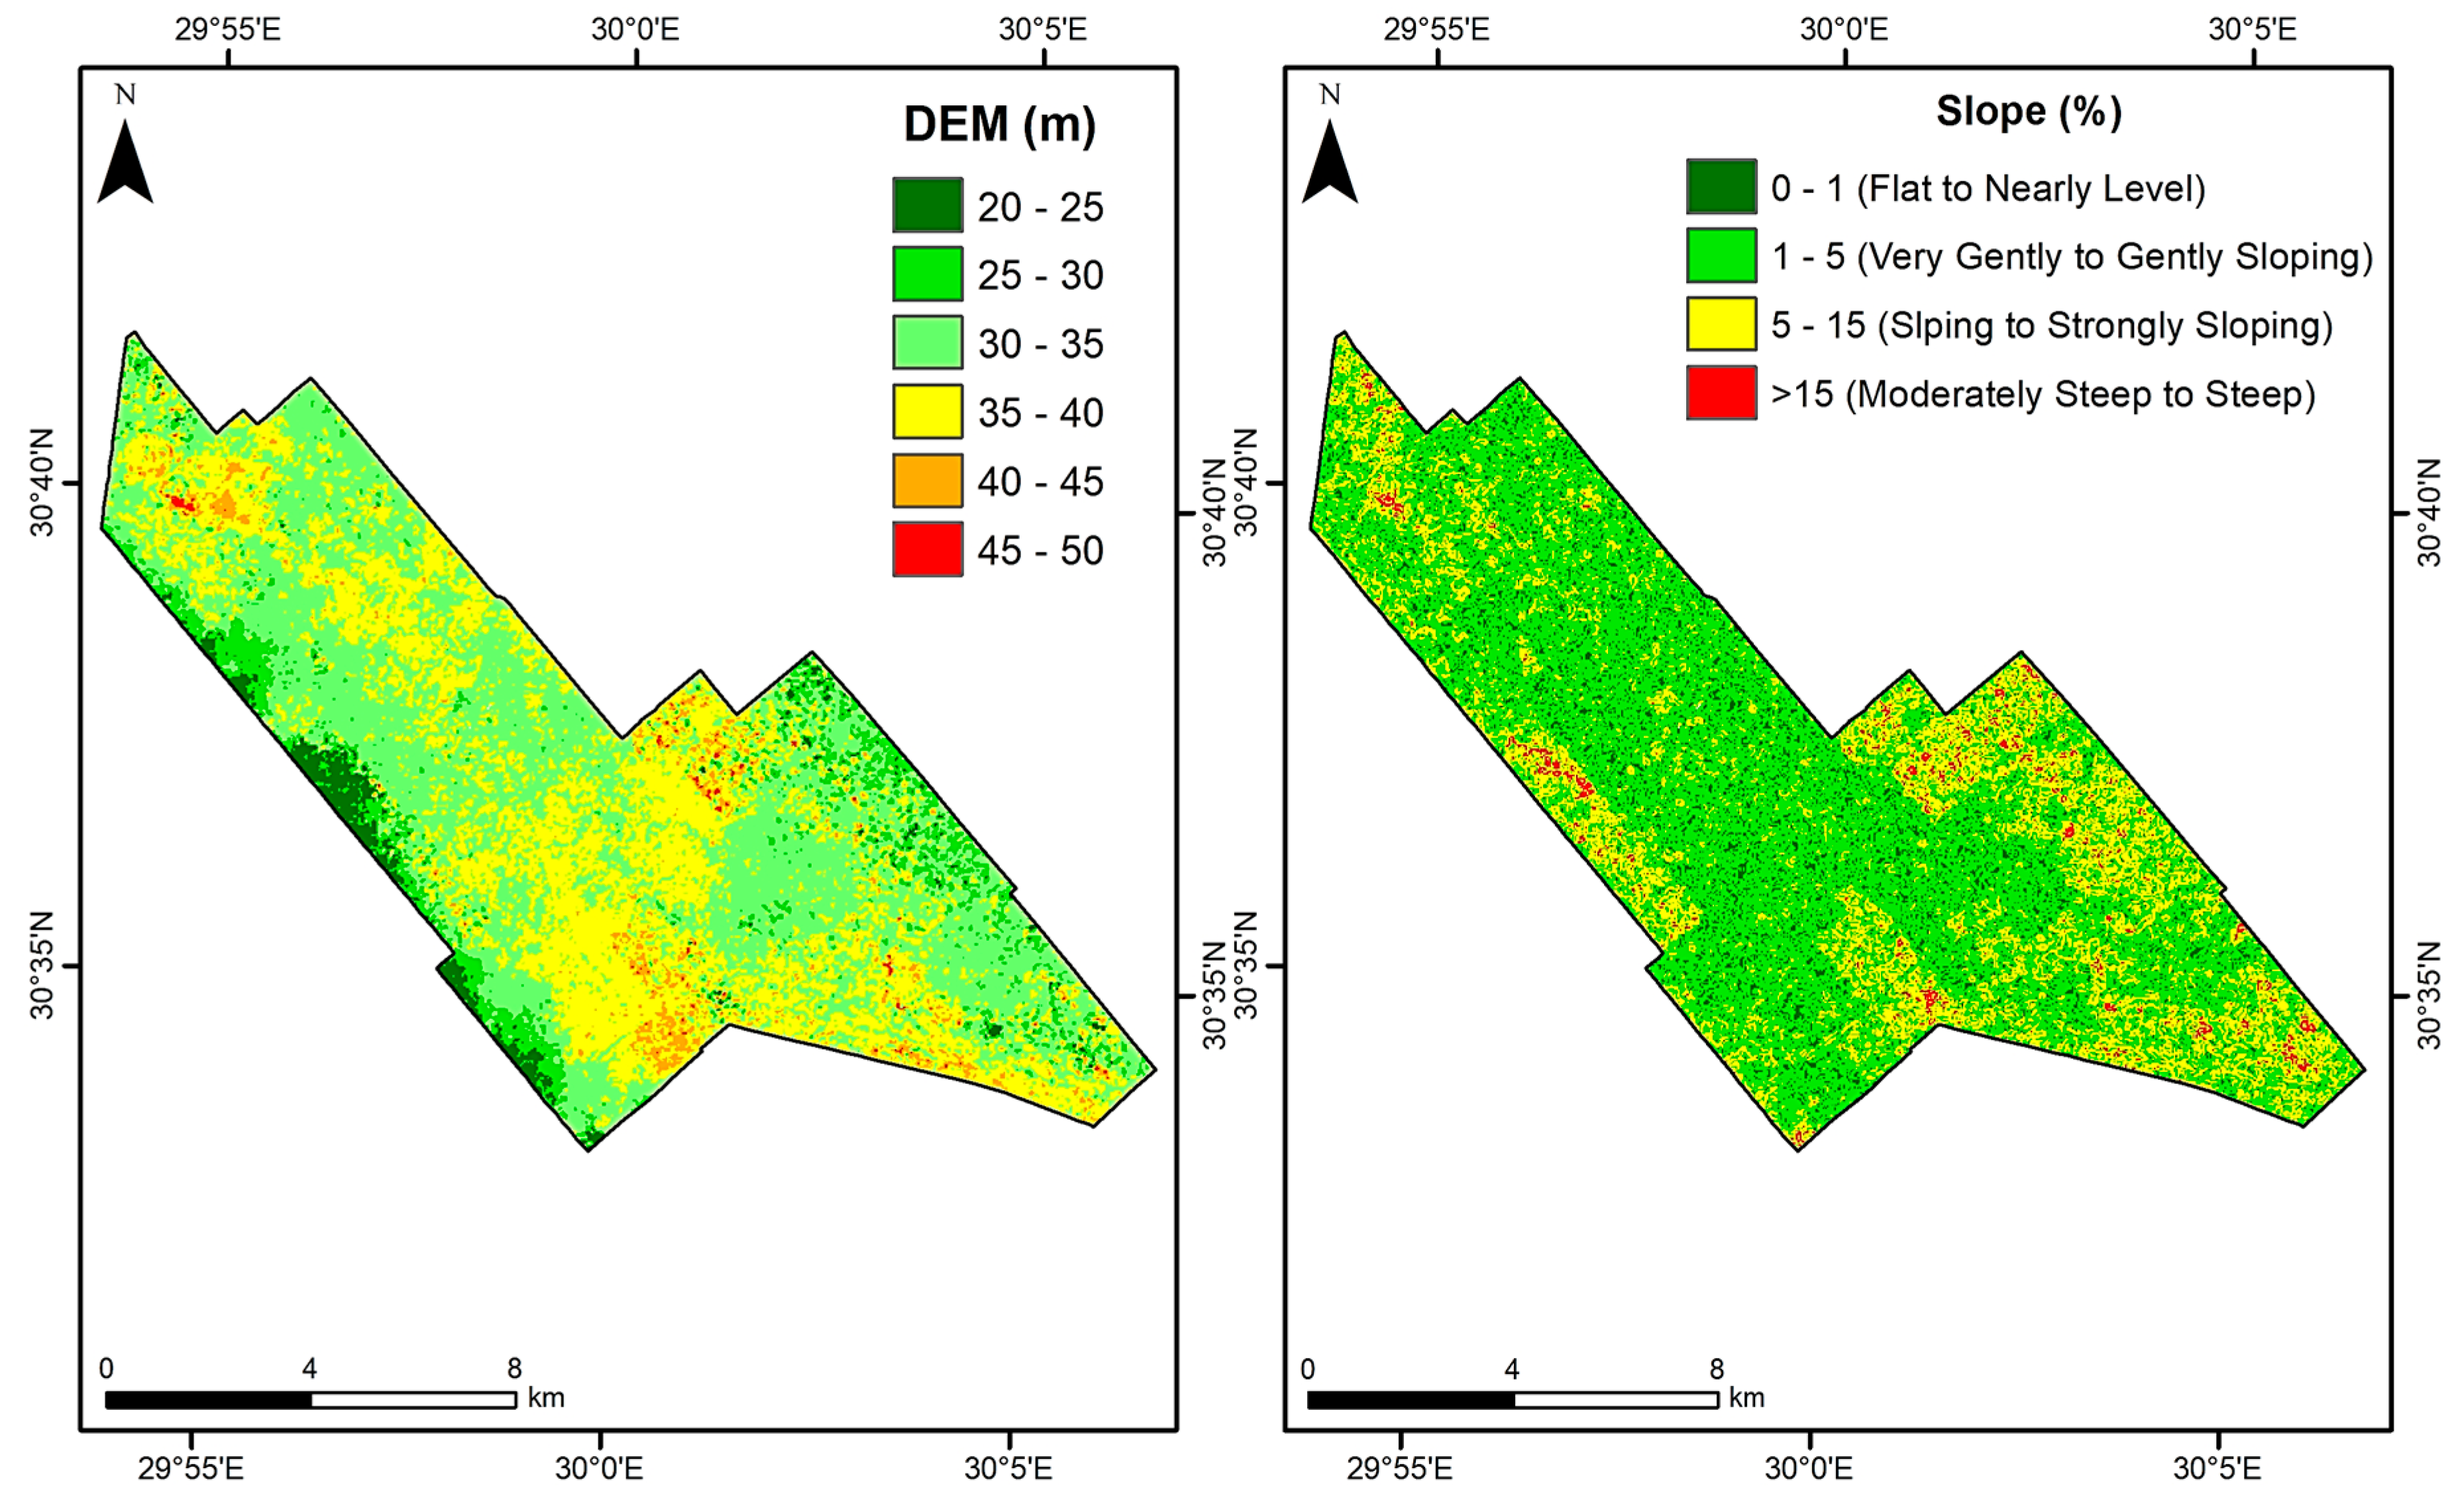
The SRTM DEM analysis results (Figure 4) demonstrate that the study area has an elevation that ranges from 20 to 50 m (above sea level). Based on the DEM, the slope percentage was generated. The slope classes were produced according to the Food and Agriculture Organization of the United Nations (FAO) [55]. The slope map (Figure 4) shows that the dominant slopes percentages in the study area are nearly level (0–1%) and gently sloping (1–5%).

3.2. Temporal LULC Change Analysis

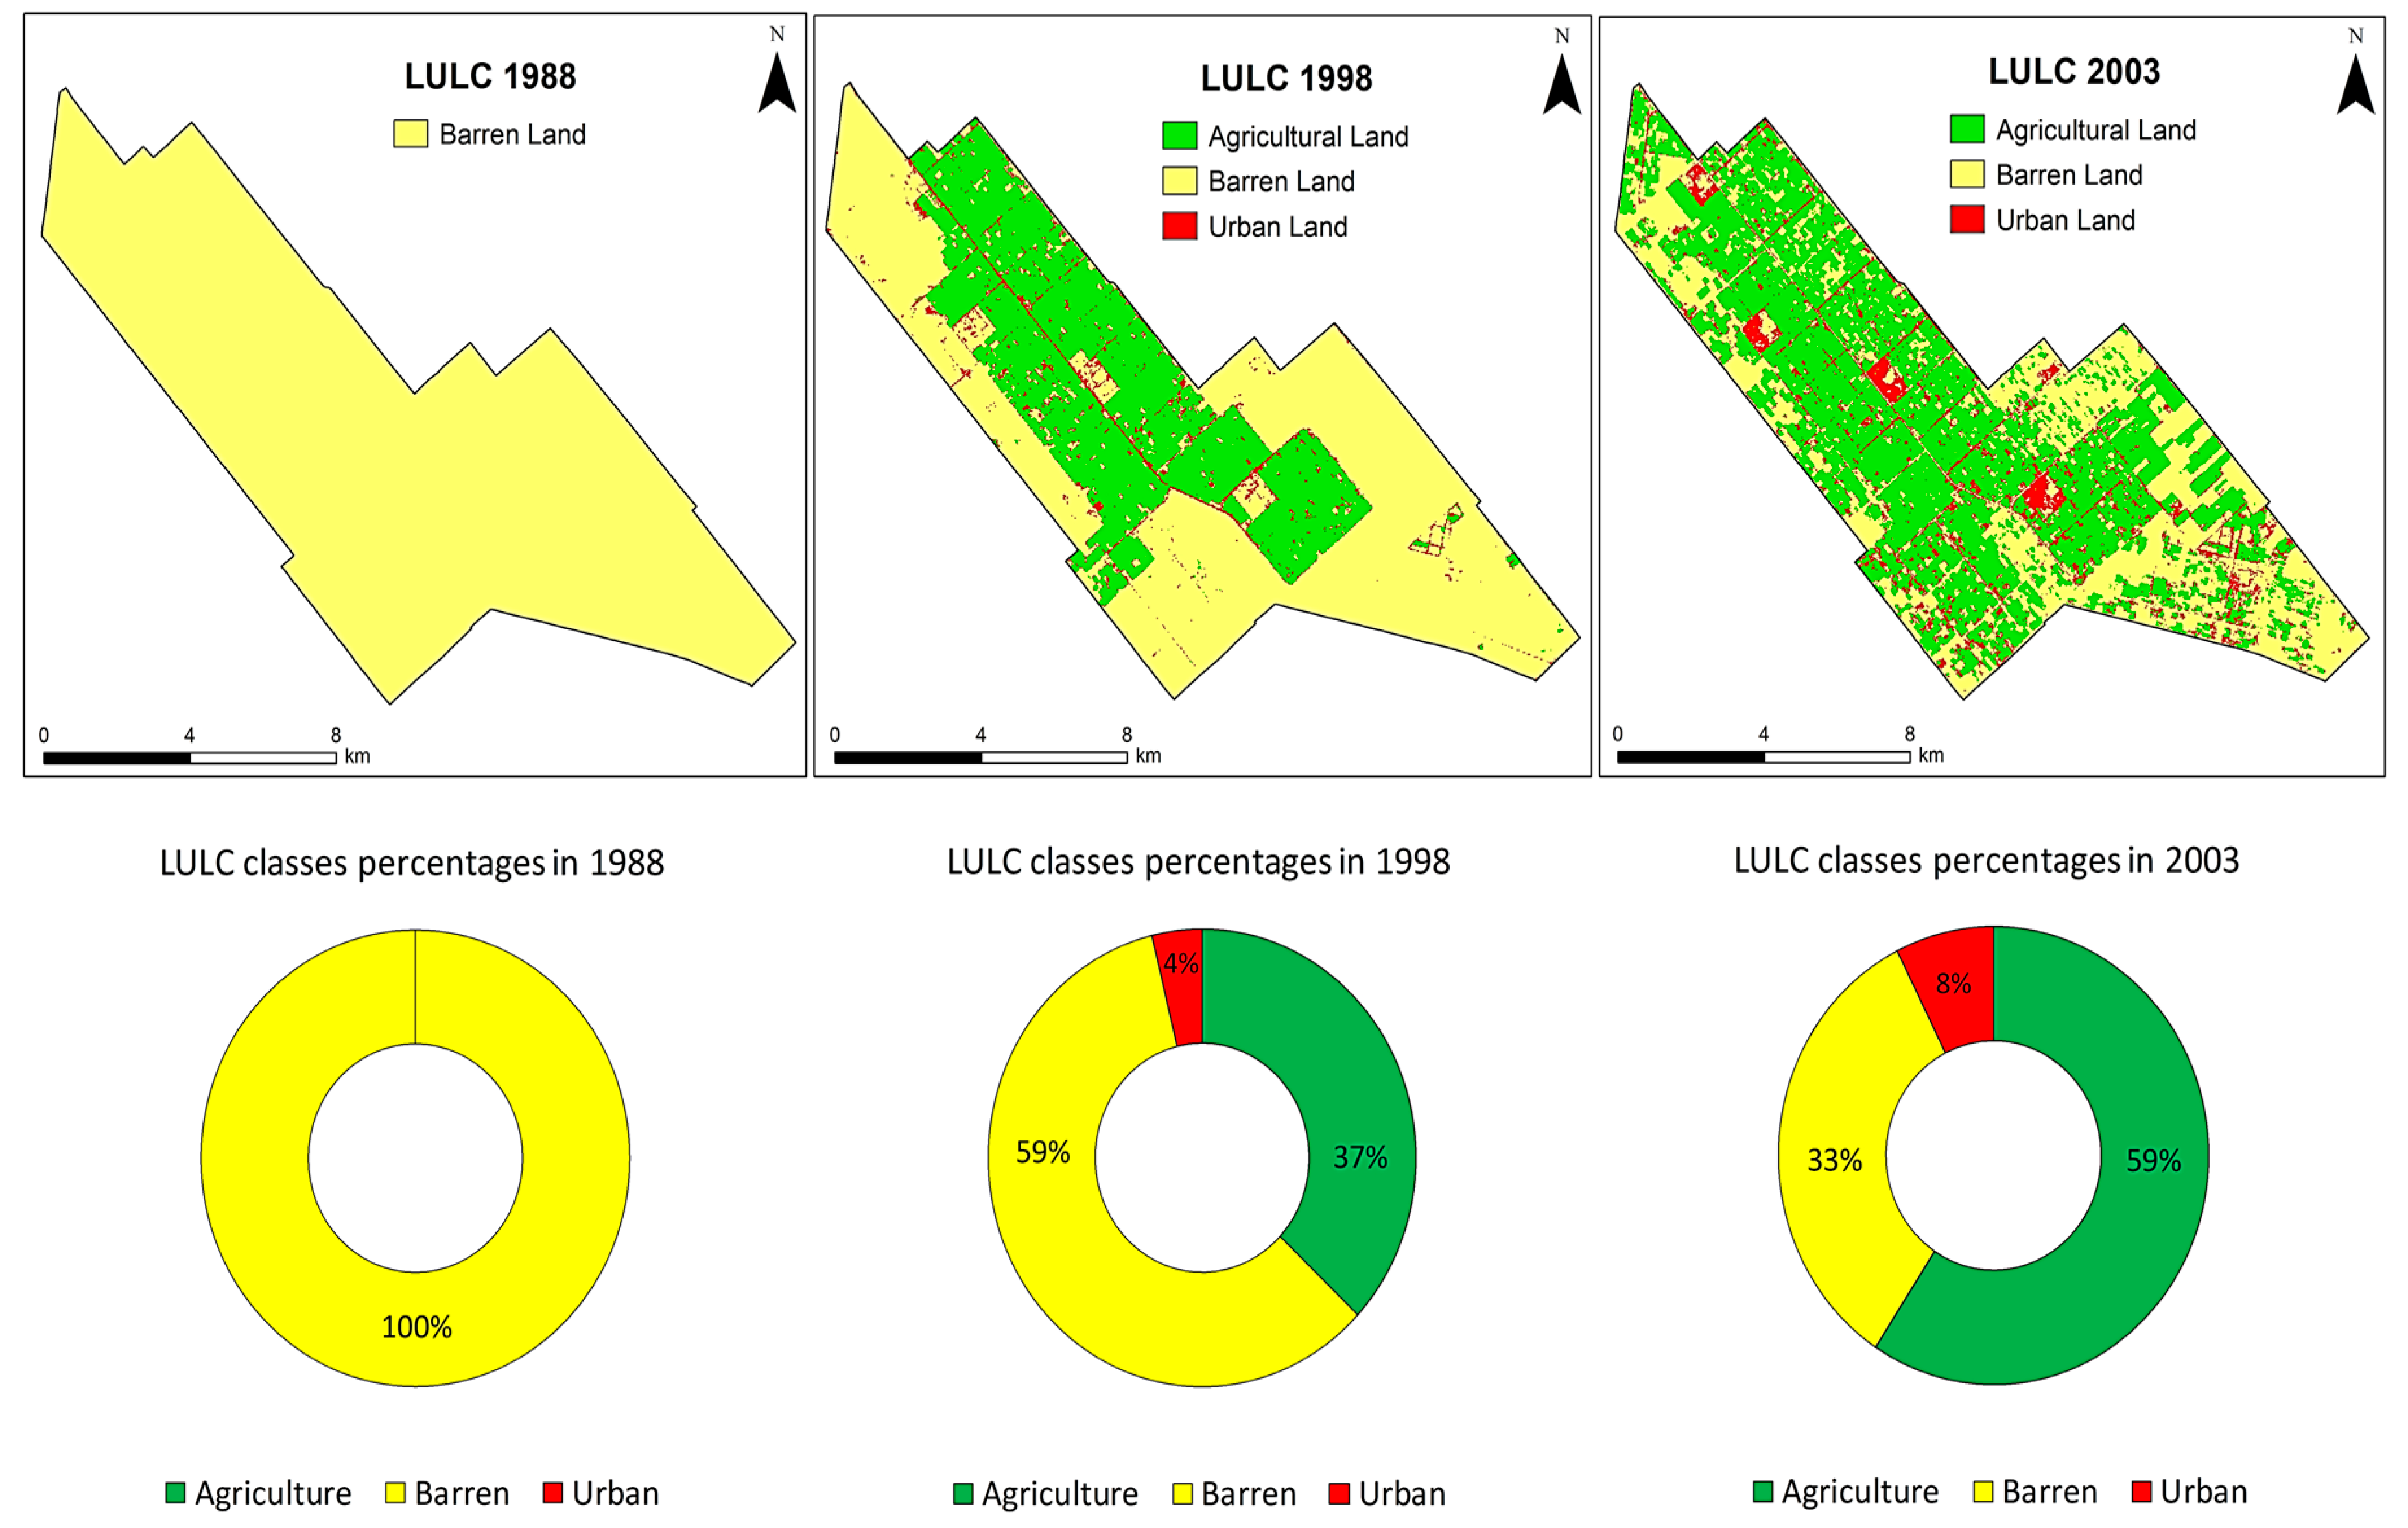
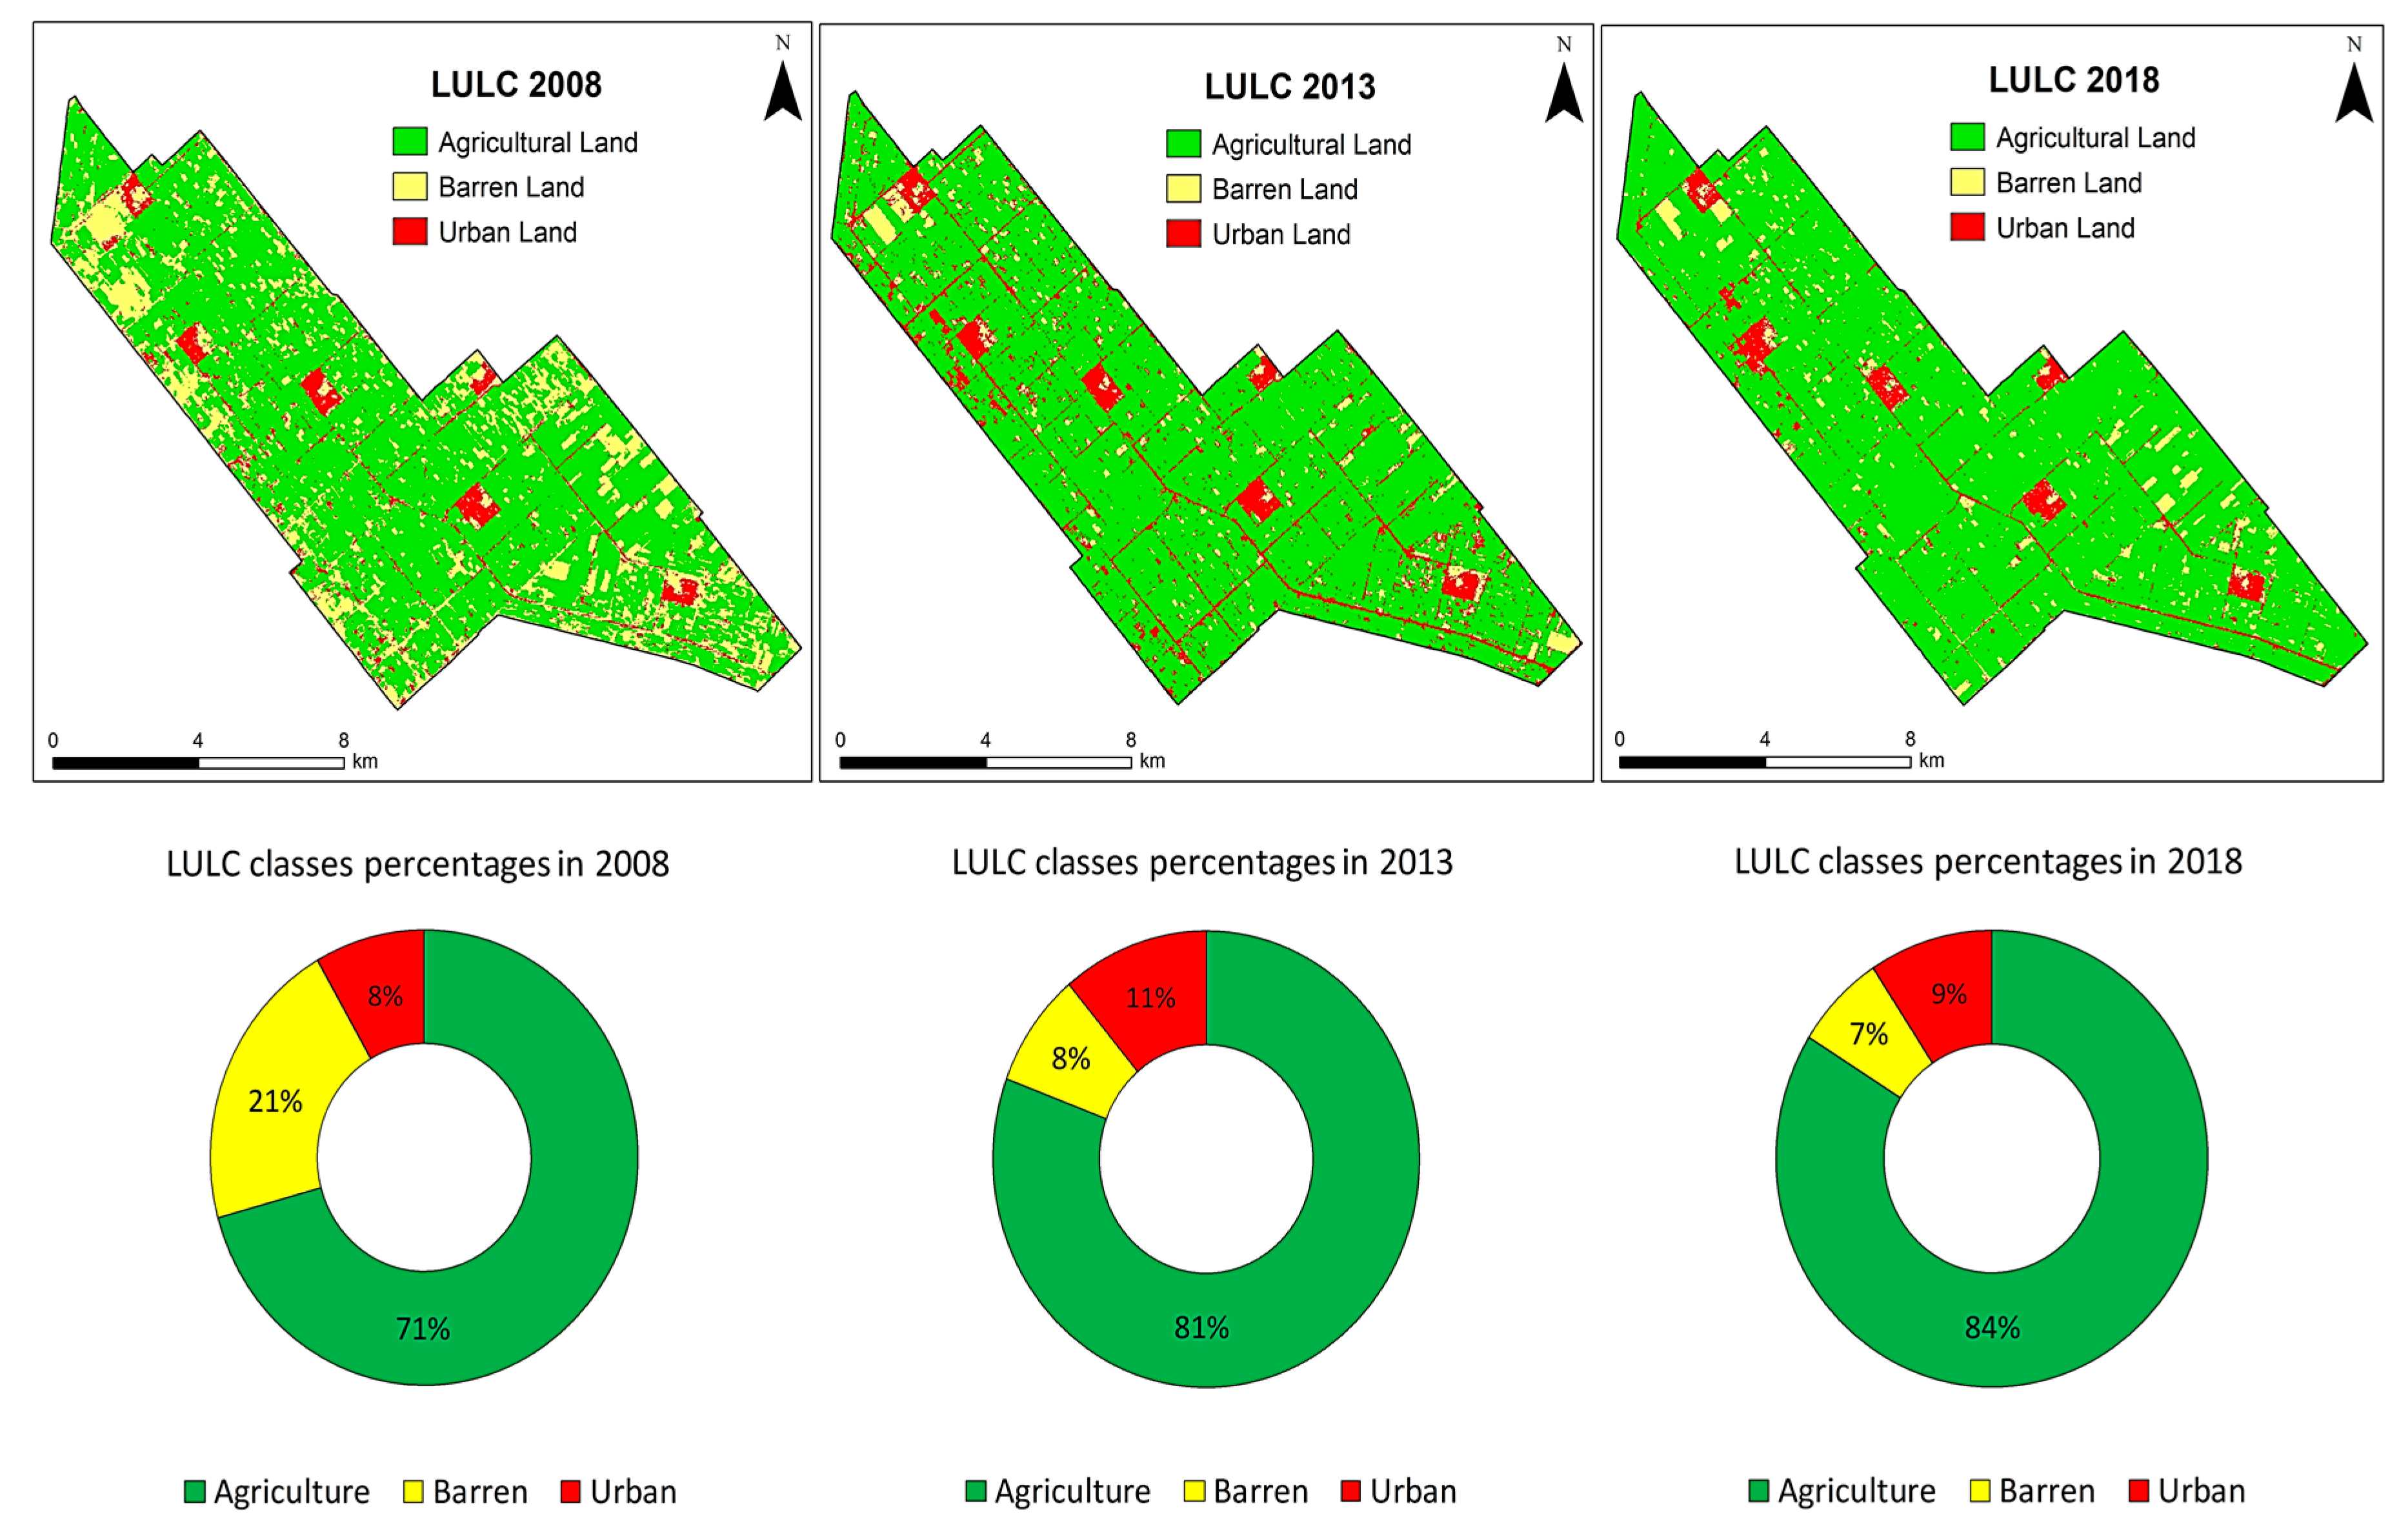
Six LULC maps (corresponding to six time periods) from 1988 to 2018 have been generated from the utilized maximum likelihood supervised classification. For each time period, three major LULC classes were observed in Tiba District: Agricultural land, barren land, and urban land. Figure 5 and Figure 6 show the geospatial distribution and the area percentages for the LULC classes in the study area for the six dates.
The results (Table 2) show that in 1988, the barren land dominated the total area of Tiba district occupying 100% (12,527 ha). After the land reclamation projects have started to develop in the study area, other land cover classes were identified. In 1998, Barren land occupied 59.18% (7413 ha), urban land covered 3.78 (474 ha). Whilst, agricultural land covered 37.04% (4640 ha).
As a consequence of the agricultural expansion occurred in this newly reclaimed area, a substantial increase in agricultural land was observed in 2003. In 2003, agricultural land occupied 59.24% (7421 ha) of the total area of Tiba district, from 1998 to 2003, the amount of agricultural land has significantly increased by 60%. This is considered the highest rate of agricultural land expansion in the Tiba district over the study period. Nevertheless, barren land covered 33.36% (4179 ha). The barren land was found to be dramatically decreased by 70% between 1998 and 2003. The urban land has grown to 7.40% (927 ha). In 2018, similar patterns were observed. The agricultural land had increased to occupy 83.90% (5870 ha) of the total area. Whilst, barren land significantly decreased to cover 6.82% (855 ha). Furthermore, urban land slightly increased to occupy 9.28% (1162 ha). Overall, both the agricultural and urban lands have increased by 126.51% and 145.15%, respectively between 1998 and 2018. However, Barren land has decreased by 88.47%.

3.3. Classification Accuracy Validation

Error matrices, overall accuracies and Kappa statistics (K^) values for the classified images for the six investigated time periods were produced (Table 3). In 1988, the overall classification accuracy was 100%, and the Kappa index was 1. At that time, the study area was a total piece of desert, and only barren land observed. By 1998, three land cover classes were identified, and the overall classification accuracy was 93%, and the Kappa index was 0.88. In 2003, the overall accuracy and the Kappa value decreased to 92% and 0.87, respectively. This could be attributed to the significant changes that occurred among the different LULC classes, which made it slightly harder to distinguish. Similar trends were found in 2013 and 2018, resulting in an overall accuracy of 94% and 93%, respectively. However, the highest overall classification accuracy was obtained from validating the Landsat TM 2008 image, and it was 95% with the highest Kappa value achieved of 0.92. The achieved accuracy was found satisfactory and matched with the USGS proposal for the minimum overall level of accuracy (85%) generated from LULC classification using Landsat imageries [56,57].

4. Discussion

During the past three decades, the governmental desert land (New Lands) reclamation endeavors that have been established and developed, had massively altered the LULC changes over areas like Tiba district located in the western Nile Delta of Egypt. Particularly, there has been a dramatic expansion in agricultural land, as well as substantial urban and residential settlements growth. However, barren land has significantly declined as a consequence. These land reclamation initiatives and the associated agricultural expansion reflect the human impacts and the regional development policies in these areas. Consequently, agricultural production has been increased with great economic benefits. As of now, more than 100 million people live on approximately 4% of the total land area of Egypt (the Nile Delta and its valley). About 60 million people live in the Nile Delta [2]. The main national concern is the unbalanced ratio between human and natural resources. The national population is increasing rapidly, with a rate of 1.5–2%/year [1]. Nevertheless, on the other hand, the fertile, productive agricultural soils in the Nile Delta are being lost dramatically due to unplanned urban expansion consequently. About 96% of the total area of Egypt is a barren desert. Therefore, this has encouraged the national authorities to reclaim New Lands outside the traditional populated Nile Delta cities. These desert reclamation initiatives could help establish and develop new urban communities to meet the large demand for housing the growing population and diminishing the population densities in the Nile Delta (Old Lands), as well as reducing the unemployment rates that arise as a result of the rapid population growth [5,11]. Furthermore, this large-scale agricultural expansion projects could be hugely useful to the Egyptian economy, since the grown fruits and vegetables could be exported to European markets.
One of the main limitations faced in this research is that the urban land class was found to be overestimated in the generated LULC maps. This could be attributed to the fact that the irrigation network system (main, sub-main canals and drainages) in Tiba district and possibly in likewise newly reclaimed areas in the western desert, is built from concrete materials, which are the same materials used for constructing buildings. Furthermore, all sorts of waterways are located so close and adjacent to roads. This issue has been previously reported by Abd El-Kawy et al. [5] in a similar area. As a consequence, it was difficult to fully classify and distinguish between roads and waterways in the study area using medium resolution imagery (Landsat), which led to this slight overestimation in the amount of urban land observed in the six investigated Landsat images.
The results generated from this research are in accordance with a number of recent studies performed within similar areas in Egypt to monitor the conversion from desert land to green land. Afifi and Darwish [58] monitored both the urban sprawl and the expansion of agricultural land in Beheira governorate, Egypt using three Landsat images between 1985 and 2013. Despite the dramatic urban encroachment over agricultural areas, they reported that the agricultural land had increased from 4556 km2 in 1985 to 7756 km2 in 2013. Abd El-Kawy et al. [5] monitored historical LULC changes in a newly reclaimed region located in the western desert of the Nile Delta using four Landsat images from 1984 to 2009. Revealing that the major change occurred was the conversion from bare land to agricultural land. They demonstrated that the agricultural land coverage in 1984 was 10% and because of the several subsequent land reclamation projects, the agricultural land occupied 61% of the total area in 2009. Bakr et al. [11] monitored LULC changes that occurred in the Bustan 3 region, Beheira governorate, Western Nile Delta between 1984 and 2008 using five Landsat images. They found that the agricultural land was covering 0% in 1984, expanding to occupy 79% of the total area.

5. Conclusions

In this paper, multiple Landsat images for the years 1988, 1998, 2003, 2008, 2013 and 2018 were used to monitor the temporal LULC changes that occurred in Tiba district. This district is one of the newly reclaimed areas located in the western desert of Egypt, west of the Nile Delta. During the last three decades, remarkable LULC changes have occurred and observed in the region. Particularly, the significant expansion in agricultural land. The results demonstrate that the study area was completely barren in 1988. However, in 1998, when the land reclamation projects accelerated and developed, 37% of the total area of Tiba district was agriculturally occupied. Furthermore, by 2018, agricultural land has dramatically increased to cover about 84% of the total area. This significant agricultural land expansion reflects the successful Egyptian government’s projects and initiatives in reclaiming more land in desert areas outside both fringes (Eastern and Western) of the Nile Delta. This large-scale agricultural expansion could be extremely beneficial to the national economy, since the produced fruits and vegetables could be exported mainly to lucrative European markets.

Author Contributions

T.M.R. conceived and developed the research framework, undertook the data processing and analysis, wrote and revised the manuscript.

Acknowledgments

The author would like to thank the four anonymous reviewers for their constructive and valuable comments and suggestions that helped improve the quality of this manuscript. He would also like to thank the U.S. Geological Survey department for providing the free Landsat data used in this paper.

Conflicts of Interest

The author declares no conflict of interest.

References

  1. Worldometers. Available online: http://www.worldometers.info/world-population/egypt-population/ (accessed on 13 May 2019).
  2. CAPMAS. The Central Agency for Public Mobilization and Statistics. The Arab Republic of Egypt. 2019. Available online: http://www.capmas.gov.eg/ (accessed on 15 May 2019).
  3. Bakr, N.; Bahnassy, M.H. Egyptian Natural Resources. In The Soils of Egypt; El-Ramady, H., Alshaal, T., Bakr, N., Elbana, T., Mohamed, E., Belal, A.A., Eds.; World Soils Book Series; Springer: Cham, Switzerland, 2019; pp. 33–49. [Google Scholar]
  4. Shalaby, A.; Tateishi, R. Remote sensing and GIS for mapping and monitoring land cover and land-use changes in the Northwestern coastal zone of Egypt. Appl. Geogr. 2007, 27, 28–41. [Google Scholar] [CrossRef]
  5. Abd El-Kawy, O.R.; Rød, J.K.; Ismail, H.A.; Suliman, A.S. Land use and land cover change detection in the western Nile delta of Egypt using remote sensing data. Appl. Geogr. 2011, 31, 483–494. [Google Scholar] [CrossRef]
  6. Radwan, T.M.; Blackburn, G.A.; Whyatt, J.D.; Atkinson, P.M. Dramatic Loss of Agricultural Land Due to Urban Expansion Threatens Food Security in the Nile Delta, Egypt. Remote Sens. 2019, 11, 332. [Google Scholar] [CrossRef]
  7. Liu, F.; Zhang, Z.; Zhao, X.; Wang, X.; Zuo, L.; Wen, Q.; Yi, L.; Xu, J.; Hu, S.; Liu, B. Chinese cropland losses due to urban expansion in the past four decades. Sci. Total Environ. 2019, 650, 847–857. [Google Scholar] [CrossRef] [PubMed]
  8. Bratley, K.; Ghoneim, E. Modeling Urban Encroachment on the Agricultural Land of the Eastern Nile Delta Using Remote Sensing and a GIS-Based Markov Chain Model. Land 2018, 7, 114. [Google Scholar] [CrossRef]
  9. Pax-Lenney, M.; Woodcock, C.E.; Collins, J.B.; Hamdi, H. The status of agricultural lands in Egypt: The use of multitemporal NDVI features derived from Landsat TM. Remote Sens. Environ. 1996, 56, 8–20. [Google Scholar] [CrossRef]
  10. Adriansen, H.K. Land reclamation in Egypt: A study of life in the new lands. Geoforum 2009, 40, 664–674. [Google Scholar] [CrossRef] [Green Version]
  11. Bakr, N.; Weindorf, D.C.; Bahnassy, M.H.; Marei, S.M.; El-Badawi, M.M. Monitoring land cover changes in a newly reclaimed area of Egypt using multi-temporal Landsat data. Appl. Geogr. 2010, 30, 592–605. [Google Scholar] [CrossRef]
  12. Rural Poverty Report 2011. New Realities, New Challenges: New Opportunities for Tomorrow’s Generation; International Fund for Agricultural Development (IFAD): Rome, Italy, 2010; Available online: http://www.fao.org/fileadmin/user_upload/rome2007/docs/IFAD%20Rural%20Poverty%20Report%202011.pdf (accessed on 16 May 2019).
  13. Basnet, B.; Vodacek, A. Tracking land use/land cover dynamics in cloud prone areas using moderate resolution satellite data: A case study in Central Africa. Remote Sens. 2015, 7, 6683–6709. [Google Scholar] [CrossRef]
  14. Knauer, K.; Gessner, U.; Fensholt, R.; Forkuor, G.; Kuenzer, C. Monitoring agricultural expansion in Burkina Faso over 14 years with 30 m resolution time series: The role of population growth and implications for the environment. Remote Sens. 2017, 9, 132. [Google Scholar] [CrossRef]
  15. Zhao, Y.; Feng, D.; Yu, L.; Cheng, Y.; Zhang, M.; Liu, X.; Xu, Y.; Fang, L.; Zhu, Z.; Gong, P. Long-Term Land Cover Dynamics (1986–2016) of Northeast China Derived from a Multi-Temporal Landsat Archive. Remote Sens. 2019, 11, 599. [Google Scholar] [CrossRef]
  16. Yang, R.; Luo, Y.; Yang, K.; Hong, L.; Zhou, X. Analysis of Forest Deforestation and its Driving Factors in Myanmar from 1988 to 2017. Sustainability 2019, 11, 3047. [Google Scholar] [CrossRef]
  17. Dewan, A.M.; Yamaguchi, Y. Land use and land cover change in Greater Dhaka, Bangladesh: Using remote sensing to promote sustainable urbanization. Appl. Geogr. 2009, 29, 390–401. [Google Scholar] [CrossRef]
  18. Rahman, M.T. Detection of land use/land cover changes and urban sprawl in Al-Khobar, Saudi Arabia: An analysis of multi-temporal remote sensing data. Int. J. Geo Inf. 2016, 5, 15. [Google Scholar] [CrossRef]
  19. Lambin, E.F.; Turner, B.L.; Geist, H.J.; Agbola, S.B.; Angelsen, A.; Bruce, J.W.; Coomes, O.T.; Dirzo, R.; Fischer, G.; Folke, C.; et al. The causes of land-use and land-cover change: Moving beyond the myths. Glob. Environ. Chang. 2001, 11, 261–269. [Google Scholar] [CrossRef]
  20. Wu, Y.; Li, S.; Yu, S. Monitoring urban expansion and its effects on land use and land cover changes in Guangzhou city, China. Environ. Monit. Assess. 2016, 188, 1–15. [Google Scholar] [CrossRef] [PubMed]
  21. Guan, D.; Li, H.; Inohae, T.; Su, W.; Nagaie, T.; Hokao, K. Modeling urban land use change by the integration of cellular automaton and Markov model. Ecol. Model. 2011, 222, 3761–3772. [Google Scholar] [CrossRef]
  22. Were, K.O.; Dick, O.B.; Singh, B.R. Remotely sensing the spatial and temporal land cover changes in Eastern Mau forest reserve and Lake Nakuru drainage basin, Kenya. Appl. Geogr. 2013, 41, 75–86. [Google Scholar] [CrossRef]
  23. Wu, Q.; Li, H.Q.; Wang, R.S.; Paulussen, J.; He, Y.; Wang, M.; Wang, B.H.; Wang, Z. Monitoring and predicting land use change in Beijing using remote sensing and GIS. Landsc. Urban Plan. 2006, 78, 322–333. [Google Scholar] [CrossRef]
  24. Rogan, J.; Chen, D.M. Remote sensing technology for mapping and monitoring land-cover and land-use change. Prog. Plan. 2004, 61, 301–325. [Google Scholar] [CrossRef]
  25. Lu, D.; Mausel, P.; Brondizio, E.; Moran, E. Change detection techniques. Int. J. Remote Sens. 2004, 25, 2365–2407. [Google Scholar] [CrossRef]
  26. Pelorosso, R.; Leone, A.; Boccia, L. Land cover and land use change in the Italian central Apennines: A comparison of assessment methods. Appl. Geogr. 2009, 29, 35–48. [Google Scholar] [CrossRef]
  27. Singh, A. Digital change detection techniques using remotely-sensed data. Int. J. Remote Sens. 1989, 10, 989–1003. [Google Scholar] [CrossRef]
  28. Chen, X.; Vierling, L.; Deering, D. A simple and effective radiometric correction method to improve landscape change detection across sensors and across time. Remote Sens. Environ. 2005, 98, 63–79. [Google Scholar] [CrossRef]
  29. Lillesand, T.M.; Kiefer, R.W.; Chipman, J.W. Remote Sensing and Image Interpretation, 7th ed.; John Wiley & Sons: New York, NY, USA, 2015. [Google Scholar]
  30. Wulder, M.A.; White, J.C.; Goward, S.N.; Masek, J.G.; Irons, J.R.; Herold, M.; Cohen, W.B.; Loveland, T.R.; Woodcock, C.E. Landsat continuity: Issues and opportunities for land cover monitoring. Remote Sens. Environ. 2008, 112, 955–969. [Google Scholar] [CrossRef]
  31. Allam, M.; Bakr, N.; Elbably, W. Multi-temporal assessment of land use/land cover change in arid region based on Landsat satellite imagery: Case study in Fayoum Region, Egypt. Remote Sens. Appl. Soc. Environ. 2019, 14, 8–19. [Google Scholar] [CrossRef]
  32. Bakr, N.; Afifi, A.A. Quantifying land use/land cover change and its potential impact on rice production in the Northern Nile Delta, Egypt. Remote Sens. Appl. Soc. Environ. 2019, 13, 348–360. [Google Scholar] [CrossRef]
  33. Xu, Y.; Yu, L.; Zhao, Y.; Feng, D.; Cheng, Y.; Cai, X.; Gong, P. Monitoring cropland changes along the Nile River in Egypt over past three decades (1984–2015) using remote sensing. Int. J. Remote Sens. 2017, 38, 4459–4480. [Google Scholar] [CrossRef]
  34. Megahed, Y.; Cabral, P.; Silva, J.; Caetano, M. Land Cover Mapping Analysis and Urban Growth Modelling Using Remote Sensing Techniques in Greater Cairo Region-Egypt. ISPRS Int. J. Geo-Inf. 2015, 4, 1750–1769. [Google Scholar] [CrossRef]
  35. Halmy, M.W.A.; Gessler, P.E.; Hicke, J.A.; Salem, B.B. Land use/land cover change detection and prediction in the north-western coastal desert of Egypt using Markov-CA. Appl. Geogr. 2015, 63, 101–112. [Google Scholar] [CrossRef]
  36. Shalaby, A.; Moghanm, F.S. Assessment of urban sprawl on agricultural soil of northern Nile Delta of Egypt using RS and GIS. Chin. Geogr. Sci. 2015, 25, 274–282. [Google Scholar] [CrossRef] [Green Version]
  37. Hegazy, I.R.; Kaloop, M.R. Monitoring urban growth and land use change detection with GIS and remote sensing techniques in Daqahlia governorate Egypt. Int. J. Sustain. Built Environ. 2015, 4, 117–124. [Google Scholar] [CrossRef] [Green Version]
  38. Shalaby, A.A.; Ali, R.R.; Gad, A. Urban sprawl impact assessment on the agricultural land in Egypt using remote sensing and GIS: A case study, Qalubiya Governorate. J. Land Use Sci. 2012, 7, 261–273. [Google Scholar] [CrossRef]
  39. Belal, A.A. Detecting urban growth using remote sensing and GIS techniques in Al Gharbiya governorate, Egypt. Egypt. J. Remote Sens. Space Sci. 2011, 14, 73–79. [Google Scholar] [CrossRef] [Green Version]
  40. Abdulaziz, A.M.; Hurtado, J.M.; Al-Douri, R. Application of multitemporal Landsat data to monitor land cover changes in the Eastern Nile Delta region, Egypt. Int. J. Remote Sens. 2009, 30, 2977–2996. [Google Scholar] [CrossRef]
  41. FAO. CLIMWAT for CROPWAT: A Climatic Database for Irrigation Planning and Management; FAO Irrigation and Drainage Paper 49; FAO: Rome, Italy, 1993. [Google Scholar]
  42. Soil Survey Staff. Keys to Soil Taxonomy, 12th ed.; USDA-Natural Resources Conservation Service: Washington, DC, USA, 2014.
  43. Environmental Systems Research Institute. ArcGIS Desktop 10.5; ESRI: Redlands, CA, USA, 2016. [Google Scholar]
  44. Exelis Visual Information Solutions. The Environment for Visualizing Images; ENVI 5.3; Exelis Visual Information Solutions: Boulder, CO, USA, 2015. [Google Scholar]
  45. Coppin, P.; Jonckheere, I.; Nackaerts, K.; Muys, B.; Lambin, E. Digital change detection methods in ecosystem monitoring: A review. Int. J. Remote Sens. 2004, 25, 1565–1596. [Google Scholar] [CrossRef]
  46. Song, C.; Woodcock, C.E.; Seto, K.C.; Pax Lenney, M.; Macomber, S.A. Classification and change detection using Landsat TM data: When and how to correct atmospheric effects? Remote Sens. Environ. 2001, 75, 230–244. [Google Scholar] [CrossRef]
  47. Gao, J.; Liu, Y. Determination of land degradation causes in Tongyu County, Northeast China via land cover change detection. Int. J. Appl. Earth Observ. Geoinf. 2010, 12, 9–16. [Google Scholar] [CrossRef]
  48. Thapa, R.B.; Murayama, Y. Urban mapping, accuracy, and image classification: A comparison of multiple approaches in Tsukuba city, Japan. Appl. Geogr. 2009, 29, 135–144. [Google Scholar] [CrossRef]
  49. Richards, J.A. Remote Sensing Digital Image Analysis: An Introduction, 5th ed.; Springer-Verlag: Heidelberg/Berlin, Germany, 2013. [Google Scholar]
  50. Jensen, J.R. Introductory Digital Image Processing: A Remote Sensing Perspective, 4th ed.; Prentice Hall Press: Upper Saddle River, NJ, USA, 2015. [Google Scholar]
  51. Campbell, J.B.; Wynne, R.H. Introduction to Remote Sensing, 5th ed.; The Guilford Press: New York, NY, USA, 2011. [Google Scholar]
  52. Congalton, R.G. A review of assessing the accuracy of classifications of remotely sensed data. Remote Sens. Environ. 1991, 37, 35–46. [Google Scholar] [CrossRef]
  53. Foody, G.M. Status of land cover classification accuracy assessment. Remote Sens. Environ. 2002, 80, 185–201. [Google Scholar] [CrossRef]
  54. Story, M.; Congalton, R.G. Accuracy assessment: A user’s perspective. Photogramm. Eng. Remote Sens. 1986, 52, 397–399. [Google Scholar]
  55. FAO. Guidelines for Soil Description, 4th ed.; Food and Agriculture Organization of the United Nations: Rome, Italy, 2006. [Google Scholar]
  56. Anderson, J.R.; Hardy, E.E.; Roach, J.T.; Witmer, R.E. A Land Use and Land Cover Classification System for Use with Remote Sensor Data; Geological Survey Professional Paper; US Government Printing Office: Washington, DC, USA, 1976; Volume 964.
  57. Manandhar, R.; Odeh, I.O.A.; Ancev, T. Improving the Accuracy of Land Use and Land Cover Classification of Landsat Data Using Post-Classification Enhancement. Remote Sens. 2009, 1, 330–344. [Google Scholar] [CrossRef] [Green Version]
  58. Afifi, A.A.; Darwish, K.M. Detection and impact of land encroachment in El-Beheira governorate, Egypt. Model. Earth Syst. Environ. 2018, 4, 517–526. [Google Scholar] [CrossRef]
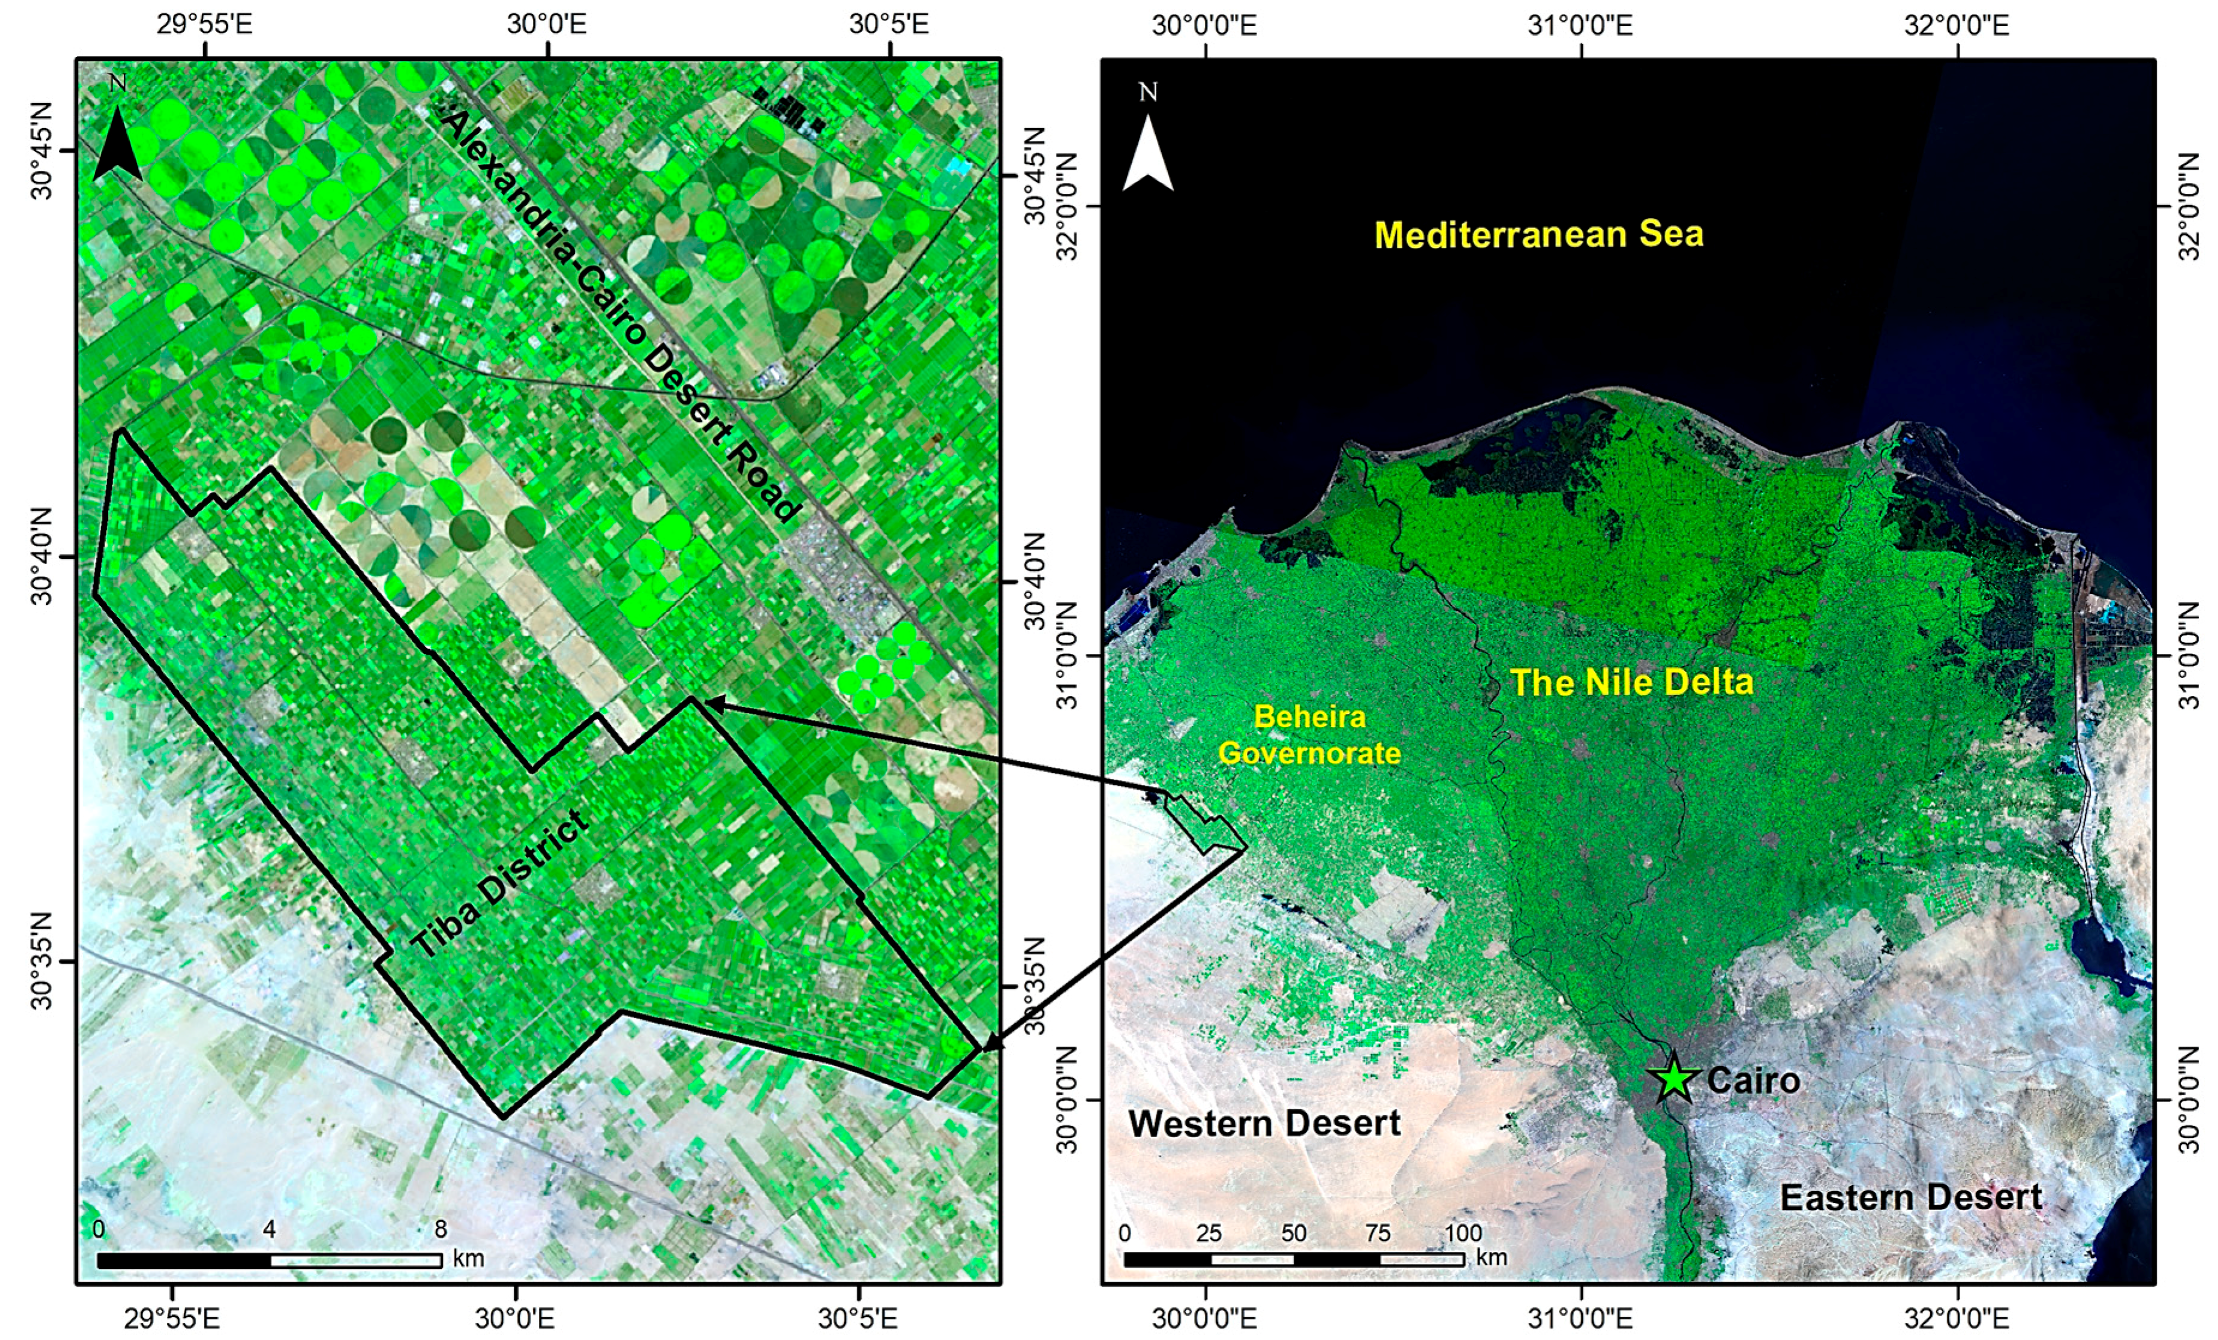
Figure 1. Location of the Tiba district, western Nile Delta of Egypt (study area).
Agriculture 09 00137 g001
Figure 2. Landsat images’ RGB compositions bands based on 7, 4, 2 bands for the TM and ETM+ scenes, and 7-5-2 bands for the 2013 and 2018 OLI scenes.
Agriculture 09 00137 g002
Figure 3. Flowchart of the methodology undertaken in this research.
Agriculture 09 00137 g003
Figure 4. The digital elevation model (DEM) and slope data for Tiba district, Egypt.
Agriculture 09 00137 g004
Figure 5. Geospatial distribution and area percentages for the LULC classes in 1988, 1998, 2003.
Agriculture 09 00137 g005
Figure 6. Geospatial distribution and area percentages for the LULC classes in 2008, 2013, 2018.
Agriculture 09 00137 g006
Table 1. Landsat satellite imageries information.
Satellite/SensorSpatial ResolutionAcquisition Date
Landsat-5 (TM)30 m07/1988
Landsat-5 (TM)30 m07/1998
Landsat-7 (ETM+)30 m05/2003
Landsat-5 (TM)30 m05/2008
Landsat-8 (OLI)30 m07/2013
Landsat-8 (OLI)30 m05/2018
Table 2. Area coverage for each land cover class across Tiba District over the studied period.
LULC Class YearAgricultureBarrenUrban
Hectares(%)Hectares(%)Hectares(%)
19880.000.0012,527100.000.000.00
1998464037.04741359.184743.78
2003742159.24417933.369277.40
2008886070.73262520.9510428.32
201310,11180.7110218.15139511.14
201810,51083.908556.8211629.28
Net change (1998–2018)5870126.51−6558−88.47688145.15
Table 3. Error matrices, overall accuracies and Kappa statistics values for the classified images per each date from 1998 to 2018.
Landsat
Scene
LULC TypeReference DataUser’s AccuracyOverall AccuracyKappa (K^)
AgricultureBarrenUrban
1998 93.00%0.88
Classified dataAgriculture32203494.12%
Barren24915294.23%
Urban02121485.71%
Reference total345313100
Producer’s accuracy94.12%92.45%92.31%
2003 92.00%0.87
Classified dataAgriculture44224893.75%
Barren13123494.12%
Urban10171894.40%
Reference total463321100
Producer’s accuracy95.65%93.93%80.95%
2008 95.00%0.92
Classified dataAgriculture54115696.43%
Barren12212491.60%
Urban10192095.00%
Reference total562321100
Producer’s accuracy96.43%95.65%90.48%
2013 94.00%0.88
Classified dataAgriculture63216695.45%
Barren11011283.30%
Urban10212295.45%
Reference total651223100
Producer’s accuracy96.92%83.30%91.30%
2018 93.00%0.86
Classified dataAgriculture64226894.12%
Barren11101291.60%
Urban20182090.00%
Reference total671320100
Producer’s accuracy95.52%84.62%90.00%
(Note: 1988 is not shown since it was 100% barren land and the overall accuracy was 100%).