Article

Response of the Durum Wheat Cultivar Um Qais (Triticum turgidum subsp. durum) to Salinity

1
Department of Land, Water and Environment, Faculty of Agriculture, University of Jordan, Queen Rania st, 11942 Amman, Jordan
2
Department of Agricultural and Biological Engineering & Institute for Sustainable Food Systems, University of Florida, Gainesville, FL 32611, USA
*
Author to whom correspondence should be addressed.
Agriculture 2019, 9(7), 135; https://doi.org/10.3390/agriculture9070135
Submission received: 15 June 2019 / Revised: 23 June 2019 / Accepted: 24 June 2019 / Published: 30 June 2019

Abstract

:
The threat of land degradation by salinization in Jordan has been increasing over the last decades. Therefore, information about the response of local cultivars to salinity is needed to help farmers choose the most productive cultivars for areas with salt-affected soils. A recently released durum wheat cultivar Um Qais (Triticum turgidum subsp. durum) has shown to be productive under normal conditions but to date there are no known studies on its tolerance to salinity. Two experiments were conducted to investigate the response of Um Qais cultivar to salinity. A field experiment was carried out in the Jordan Valley, which is known for its hot, dry climate during the summer and low rainfall and moderate temperature during the winter. Three water salinity levels (S): S1 (2 dS m−1), S2 (4 dS m−1), and S3 (8 dS m−1) with three irrigation amounts (R) (control = 120% (R1), 100% (R2), and 70% (R3)) were used in the field. A greenhouse experiment was conducted using four levels of saline water (S): S1 (0.65 dS m−1), S2 (4 dS m−1), S3 (8 dS m−1), and S4 (10 dS m−1). In both experiments, the leaf area index (LAI) and canopy height were measured during three growth stages, tillering, flag leaf, and maturity. The number of grains, grain yield, and above-ground biomass were measured after harvesting while soil salinity and pH were measured every three weeks during the growing season. The results showed that the maximum reduction in yield was of the 28% in the field experiment when the average soil salinity was of 6.8 ± 1.1 (standard error) dS m−1 at the middle stages of the season. Significant changes were shown in the treatments of the field experiments for maximum LAI, number of grains, and aboveground biomass, but not for plant height. For the greenhouse treatments, about 60% of the maximum grain yield was obtained when the average soil salinity was 9.94 ± 1.89 dS m−1 at the middle stage. Grain yield was the most sensitive parameter to the increase in soil salinity during the season. According to the findings of both experiments, Um Qais can be cultivated in moderately saline soils.

1. Introduction

Salinity in arable land is one of the major threats to crop production [1] and the risk of salinization increases as more land is needed to feed a growing world population [2]. The total global area of salt-affected soils was estimated to be approximately 830 million hectares (ha) in 2013 [3] and approximately 10 million ha are affected by salt accumulation each year [4]. This rate may be accelerated in the future as a result of climate change, excessive use of groundwater, increasing use of low-quality water in irrigation, and poor drainage [5]. It is estimated that half of the arable lands worldwide will be affected by salinity during the coming 30 years [6]. Many of the countries in the Mediterranean region experience salinity problems that affect their agricultural production, among them Jordan, Syria and Lebanon. About 90% of Jordan climate is arid and semiarid. Over 60% of Jordan’s agricultural products are grown in the Jordan Valley and most of its cultivated area is located to the north of the Dead Sea [7]. Salinity of irrigated soils along the Jordan Valley is dramatically increasing since there are no longer natural floods to wash the irrigated land and leach salts. In addition, high evaporative conditions, lack of adequate drainage systems, and insufficient rainfall also contribute to additional salt accumulation [8].
The process of increasing salt content in the soil is known as soil salinization which results from both primary (natural) occurrence and secondary, human-induced behavior [9]. The primary cause comes from parent soil material, salt deposits, insufficient precipitation and other climate conditions that limit leaching ions from the soil profile. In arid and semi-arid regions, the high rate of water evaporation facilitates salt accumulation, especially in the soil surface [10]. The secondary cause results from human activities, particularly inadequate irrigation practices and using low quality irrigation water [11]. In regions that suffer from water scarcity, treated wastewater is used as an alternative source of irrigation water. The use of low-quality water may lead to the accumulation of salts in the soil, since the leaching fraction is reduced and the salts contained in the irrigation water are not sufficiently leached. Accumulation of salts also can occur as a result of prolonged use of fertilizers.
The northern part of the Jordan Valley uses irrigation water from the Yarmouk River through the King Abdullah Canal, whereas the central and southern parts are supplied by the As-Samra Wastewater Treatment Plant, the major treatment plant in Jordan. The effluent from the plant is diluted by surface runoff water from adjacent catchment areas and temporarily stored in the King Talal Reservoir. Soil salinity in the Jordan Valley varies considerably with time and space. The mean of the electrical conductivity of saturated soil paste extract (ECe) of top-soils increases from 4.5 to 14.1 dS m−1 along the valley from north to south. The highest soil Na content and Sodium Adsorption Ratio (SAR) are found in the central region of the valley [12].
Drip irrigation is the most common irrigation practice in the central region of the valley, and about 96% of the farms in the valley are drip irrigated. Soil salinity is expected to increase because lower amounts of irrigation water are used and there is little leaching effect. The quality of the irrigation water, especially in the centre and in southern parts of the Jordan Valley, shows a relatively high salinity level (1.8–2.7 dS m−1), which can lead to an increase in the areas affected by salinity over time. In addition, the quality of irrigation water is expected to worsen if no actions are taken to solve the problem of irrigation water quality in the King Talal Reservoir.
High concentrations of Na cause soil dispersion which can adversely affect drainage and aeration. Soil salinity can considerably limit yield quantity and quality inhibiting plant growth in two main ways. First, the presence of salts reduces the ability of crops to take up water by decreasing the water potential gradient [13]. The second way is by specific ion toxicity, in which over a period of days to weeks, excessive amounts of salts accumulate in the leaf tissue affecting photosynthesis and stomatal conductance resulting in reduced growth [14]. Ionic stress affects plant growth by increasing Na and Cl ions at cellular levelin response to high concentration of NaCl, and decreased Ca, K, and Mg ions in the soil [15]. Although the presence of Ca in soil attenuates the toxicity of Na, the increase of the Na to Ca ratio in plants inhibits the uptake of Ca [16].
Durum wheat is widely cultivated in Mediterranean countries such as Lebanon, Syria and Jordan, where many areas have salt problems [17]. Elings and Nachit [18] found significant genetic diversity within and between landraces of durum wheat grown in different villages and regions of West Asia and North Africa. Jaradat [19] reported a high phenotypic divergence in durum wheat landraces in Jordan in term of salt tolerance and response to sodium toxicity. Triticum turgidum subsp. durum showed a high tolerance to Na accumulation compared to other genotypes [20]. In 1981, the International Center for Agricultural Research in the Dry Areas (ICARDA) combined the widely cultivated Jordanian landrace ‘Haurani’ with the successful line ‘Jori69’ to improve T. turgidum subsp. durum. The new cultivar was called Omrabi 6 in Jordan. All released cultivars remain widely used by smallholder farmers in the arid regions [21]. Omrabi 6 cultivar was superior to Haurani for its biological yield, seed yield, harvest index, number of spikes per plant and number of kernels per spike. It also proved to be a more efficient cultivar because of its high productivity under improved growing conditions according to a study conducted in the southern region in Jordan in 2005 [22]. Omrabi 6 was certified as an improved durum wheat cultivar under the name Um Qais (Triticum turgidum subsp. durum) by the Ministry of Agriculture in Jordan [22].
So far only a few studies have been conducted in Jordan about the tolerance of localdurum wheat cultivars to salinity [23,24,25] and none included the recently released cultivar Um Qais durum wheat. Therefore, the objective of this study was to evaluate the rate of development and growth of Um Qais under saline conditions when irrigated with different amounts of water and salinity levels. The study was conducted in the central region of the Jordan Valley, where most of the soil is moderately saline and the irrigation water is relatively saline [26]. The field experiment was designed to be similar to the common management practices in the Jordan Valley’s agricultural areas. The field experiment was supported by a greenhouse study to assess the response of Um Qais when irrigated with different water salinity levels in a well-controlled environment.

2. Materials and Methods

The Um Qais durum wheat cultivar was released in 2005 and is known for its high productivity when it is cultivated under normal non-saline conditions when compared to other local cultivars. Therefore, it is widely used by farmers in Jordan [22]. In order to understand the response of Um Qais to salinity, two experiments were conducted, one under field conditions and one in a greenhouse.

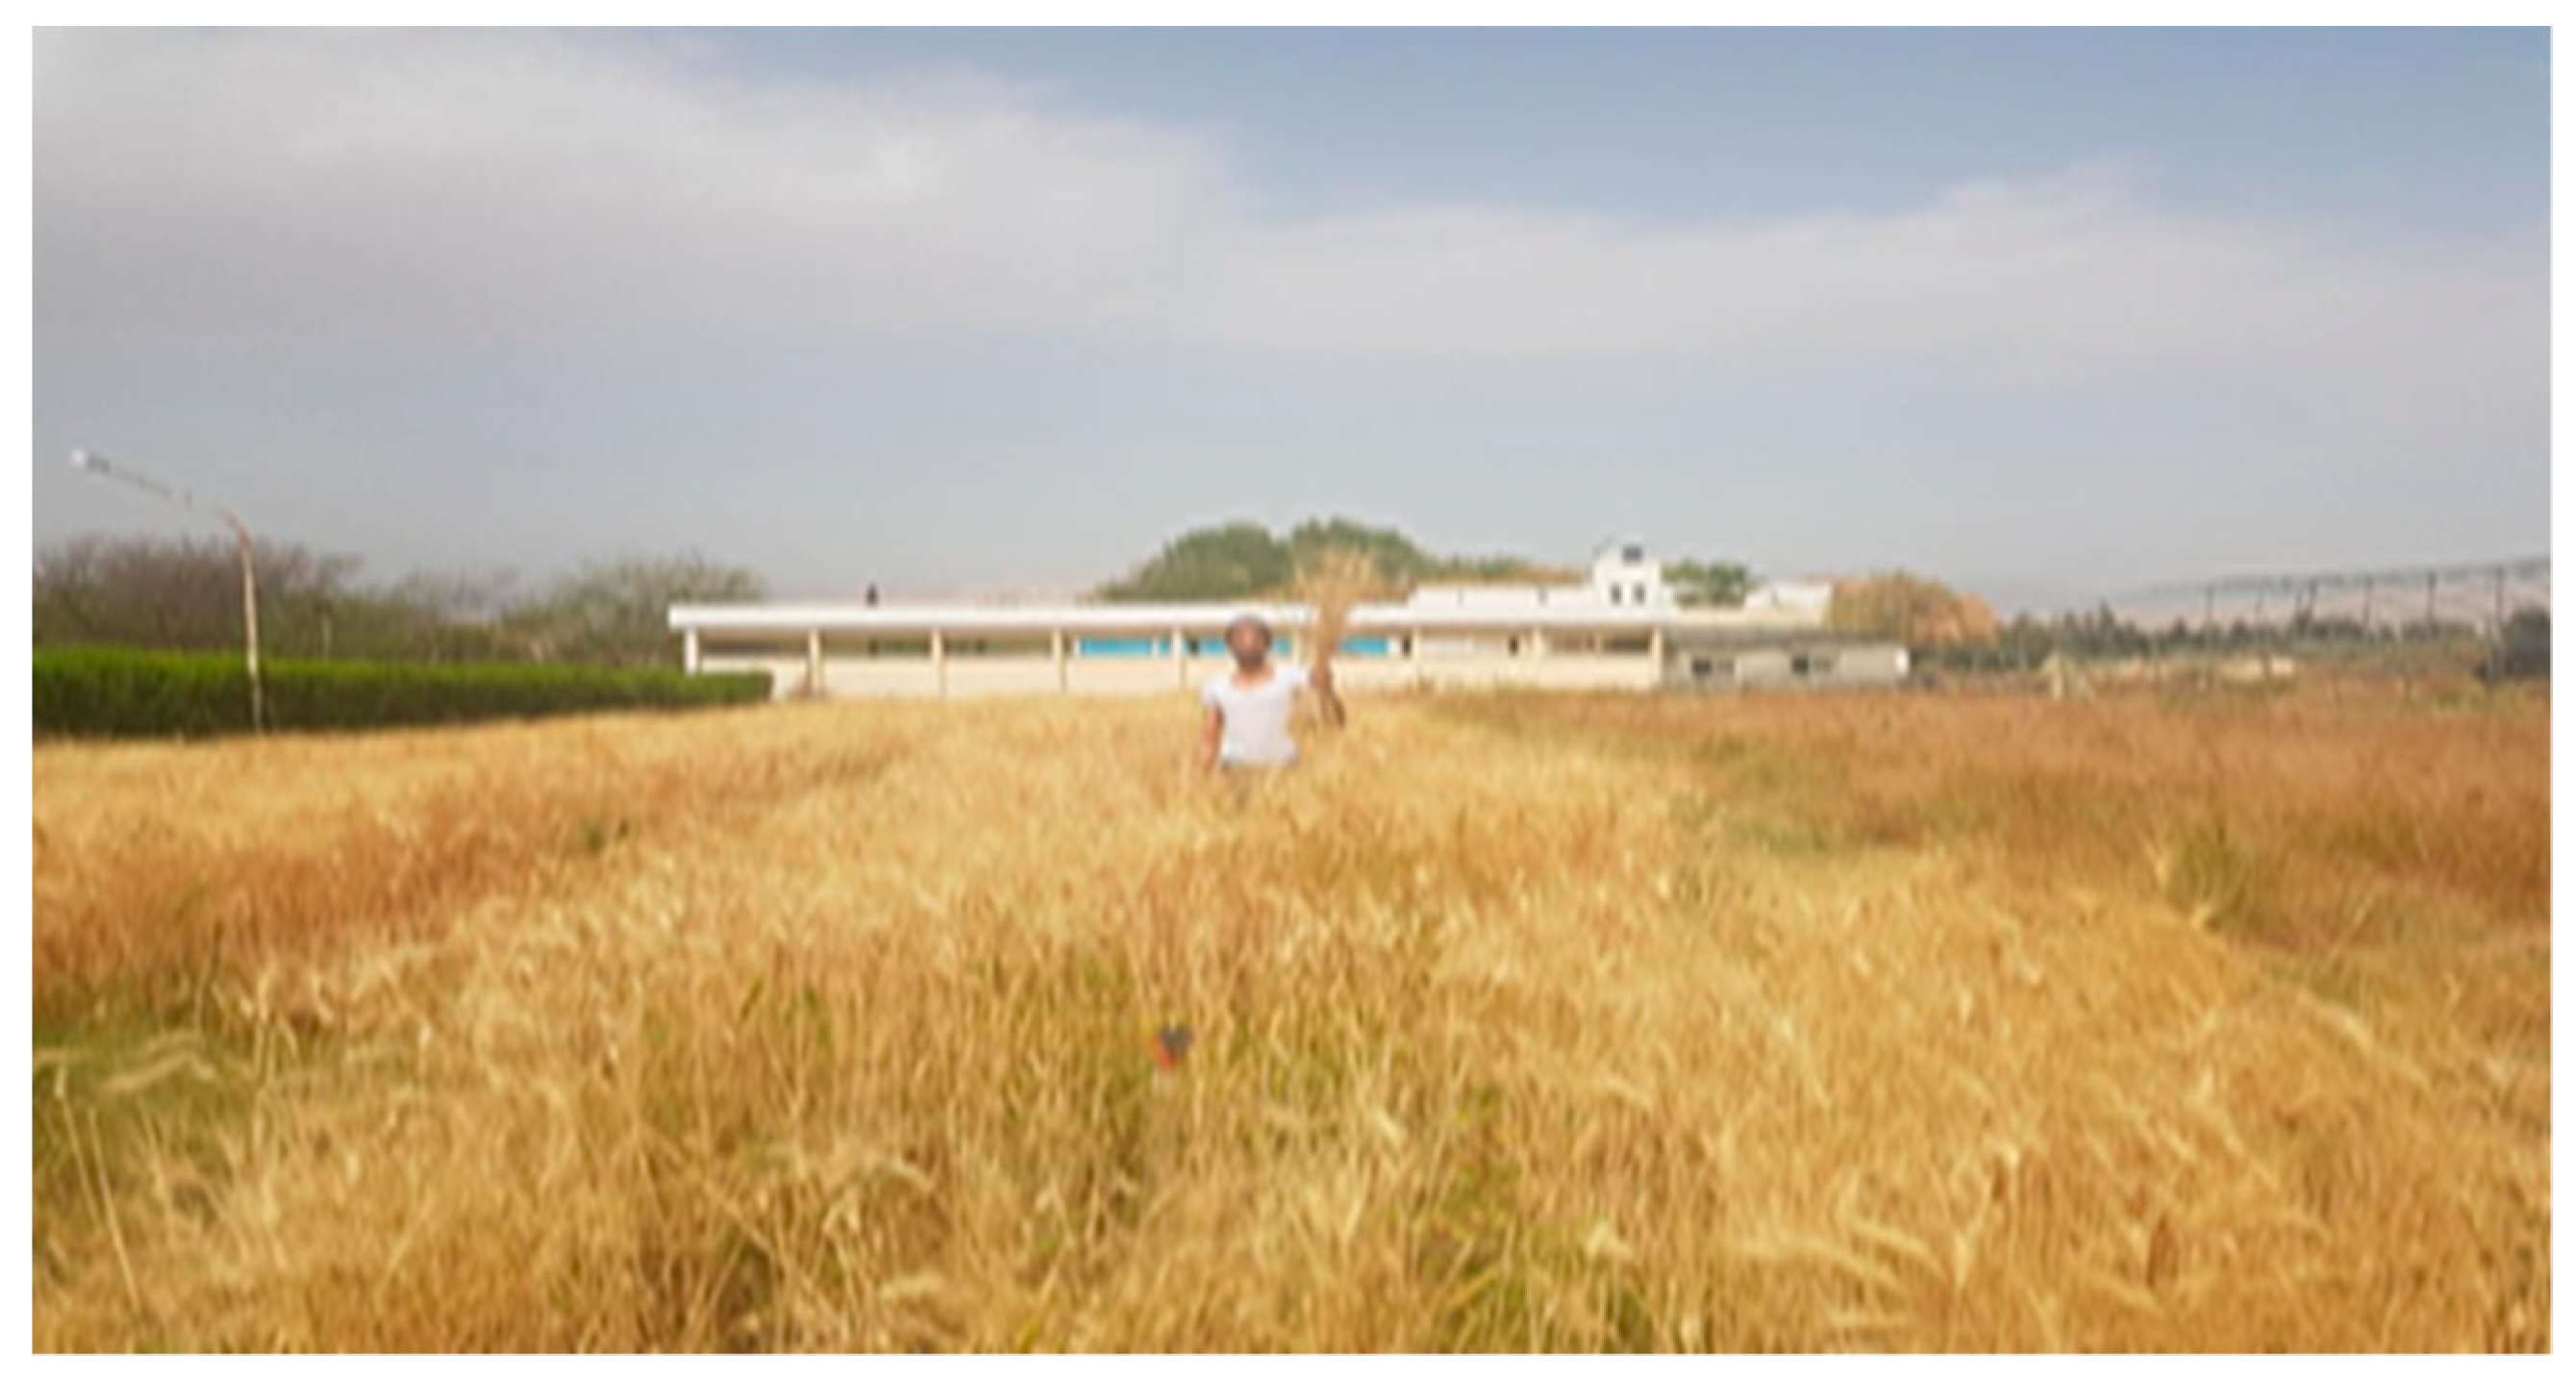
2.1. Field Experiment

The field experiment was conducted at the Agricultural Research Station in the central Jordan Valley (Damea) (32.08 N, 35.58 E) where soil salinity showed a pronounced increase from 2007 to 2013 ranging between 51% and 63% [22]. The soil type is Entisol with a fine loamy sand texture. The soil depth in the study area is about 1.5 m and the land has no drainage system. The experimental design was split plot randomized complete block design and the experimental area was 456.5 m², which was divided into four blocks. Each block contained three main plots to which the three irrigation levels (R) were assigned: R1 (120%), R2 (100%), and R3 (70%). Each main plot was split into three subplots to which three water salinity levels (S) were assigned: S1 (2 dS m−1), S2 (4 dS m−1) and S3 (8 dS m−1) for a total of nine treatments (S1R1, S1R2, S1R3, S2R1, S2R2, S2R3, S3R1, S3R2 and S3R3) and 36 plots measuring 3 × 3 m. The design was based on the hypothesis that different levels of irrigation amounts would affect the amount of salt accumulation in the root zone, especially in arid and semi-arid regions where the amount of rainfall is low. The salt accumulation was expected to be in the most stressed treatments of high salinity and low irrigation amounts, thus the reduction in yield and growth was expected to be significant in the most stressed treatments. The Um Qais durum wheat cultivar was planted on 29 December 2017 with a planting density of 200 plant per m2 and seven rows in each plot of 3 m and 40 cm plot length and row spacing, respectively. Urea fertilizer was mixed with irrigation water that was applied on 29 December 2017, 15 February 2018, and 15 March 2018 with 200, 100, and 100 kg ha−1, respectively. A total of 250 mL m−3 of 2,4-D (weed killer) was added once on 3 March 2018. A drip irrigation system was used in the field, which was adequately watered during the first irrigation application. Salinity and irrigation treatments were initiated at the second irrigation within initial stages. Soil water content was determined weekly using the gravimetric method at the beginning and by Time Domain Reflectometry (TDR) PICO-BT IMKO type (IMKO Micromodultechnik GmbH, Ettlingen, Germany). The TDR soil moisture measurements were taken at soil depths of 10 and 30 cm on 1, 8, 15, 22 and 26 March 2018 and on 2 April 2018 (Figure 1).
Salinity levels were determined according to the salinity threshold described by Maas and Hoffman [27] and the levels of water salinity that are internationally used for durum wheat salt experiments [28,29]. The irrigation amounts were determined according to a study conducted by Prathapar and Qureshi [30], which showed that generally during one growing season plants start to be affected by water stress when they are irrigated with 80% readily available water (RAW). The control in the field was the treatment S1R1 with the lowest irrigation water salinity (2 dS m−1) and the highest irrigation water amount (120% RAW). The control was expected to prevent any possible accumulation of salt in the soil during the season, thereby allowing the cultivar to grow without any salinity stress. All other management practices except salinity and irrigation levels were the same for all treatments in the field.
The RAW is defined as the soil moisture held between field capacity (FC) and a nominated refill point for unrestricted growth, at which water can be easily absorbed by plants from the soil. Irrigation water was applied when the measured soil moisture reached the management allowable depletion (MAD), which is defined as the maximum amount of Plant Available Water (PAW) allowed to be removed from the soil before irrigation refill occurs. The MAD for this experiment was assumed to be 0.5 based on Allen’s [31] recommendation for durum wheat. RAW was calculated by first calculating the critical soil moisture which is defined as the threshold level of soil water content in mm above which the irrigation water should be applied:
The   Critical   soil   moisture = MAD   ( FC PWP ) z ,
where (FC) is field capacity, (PWP) is permanent wilting point, and z is rooting depth in mm. RAW is calculated as the difference between (FC) and the critical soil moisture as follows:
RAW = FC MAD ( FC PWP ) z .
Some soil chemical and physical properties of each block were measured first on 20 December 2017 at depths of 10 and 30 cm to determine the initial conditions prior to planting. Soil texture, field capacity, permanent wilting point and bulk density were measured using the pipette [32], ceramic plate [33] and core method [34]. A pH and EC meters of type BP3001 were used to measure soil salinity and pH every three weeks taking four soil samples at four depths (10, 30, 50, and 70 cm) of the 18 plots at the two central blocks. The saturated soil extract method was used to measure the soil electrical conductivity (ECe) [35]. Other ions in the soil were measured for the first 30 cm depth at the initial conditions before planting, except Na, Ca, and Mg were measured twice before planting and after harvesting at 30 cm depth K and Na concentrations were analyzed using a flame photometer (Jenway Research PFP7/C, Cole-parmer Inc., Eaton Socon, England). The cation exchange capacity was determined using the sodium acetate method [36]. Other ions, including Cl, Ca, Mg and HCO3, were measured using titration according to the methods illustrated by Bower [37]. Phosphorus was determined using the Olsen method [38], and total Nitrogen was determined with the Kjeldahl method [39]. Sodium Adsorption Ratio (SAR) was calculated from the measured Na, Ca and Mg in the soil water extract as follows:
SAR =   Na + Ca + 2 + Mg + 2 2 .
The electrical conductivity was 4 dS m−1, pH was 8, and Na and Cl were 41.98 and 0.33 ppm, respectively. The bulk density was 1.58 g cm−3, and the soil texture was loamy sand. Soil chemical and physical properties are shown in Table 1.
The total amount of the applied irrigation water for the whole field experiment was 90.18 m3 and was distributed as 37.8 (350 mm), 30.78 (250 mm) and 21.6 (200 mm) m3 for R1, R2, and R3 respectively. NaCl was added to each tank at the rate of 1.6 kgm−3 for the S2 experiments and 3.5 kgm−3 for the S3 treatments. The irrigation water of the control (2 dS m−1) plot was the same as the water that is used by farmers in the Jordan Valley, without any change to its salinity. The field experiment was harvested on 2 April 2018.

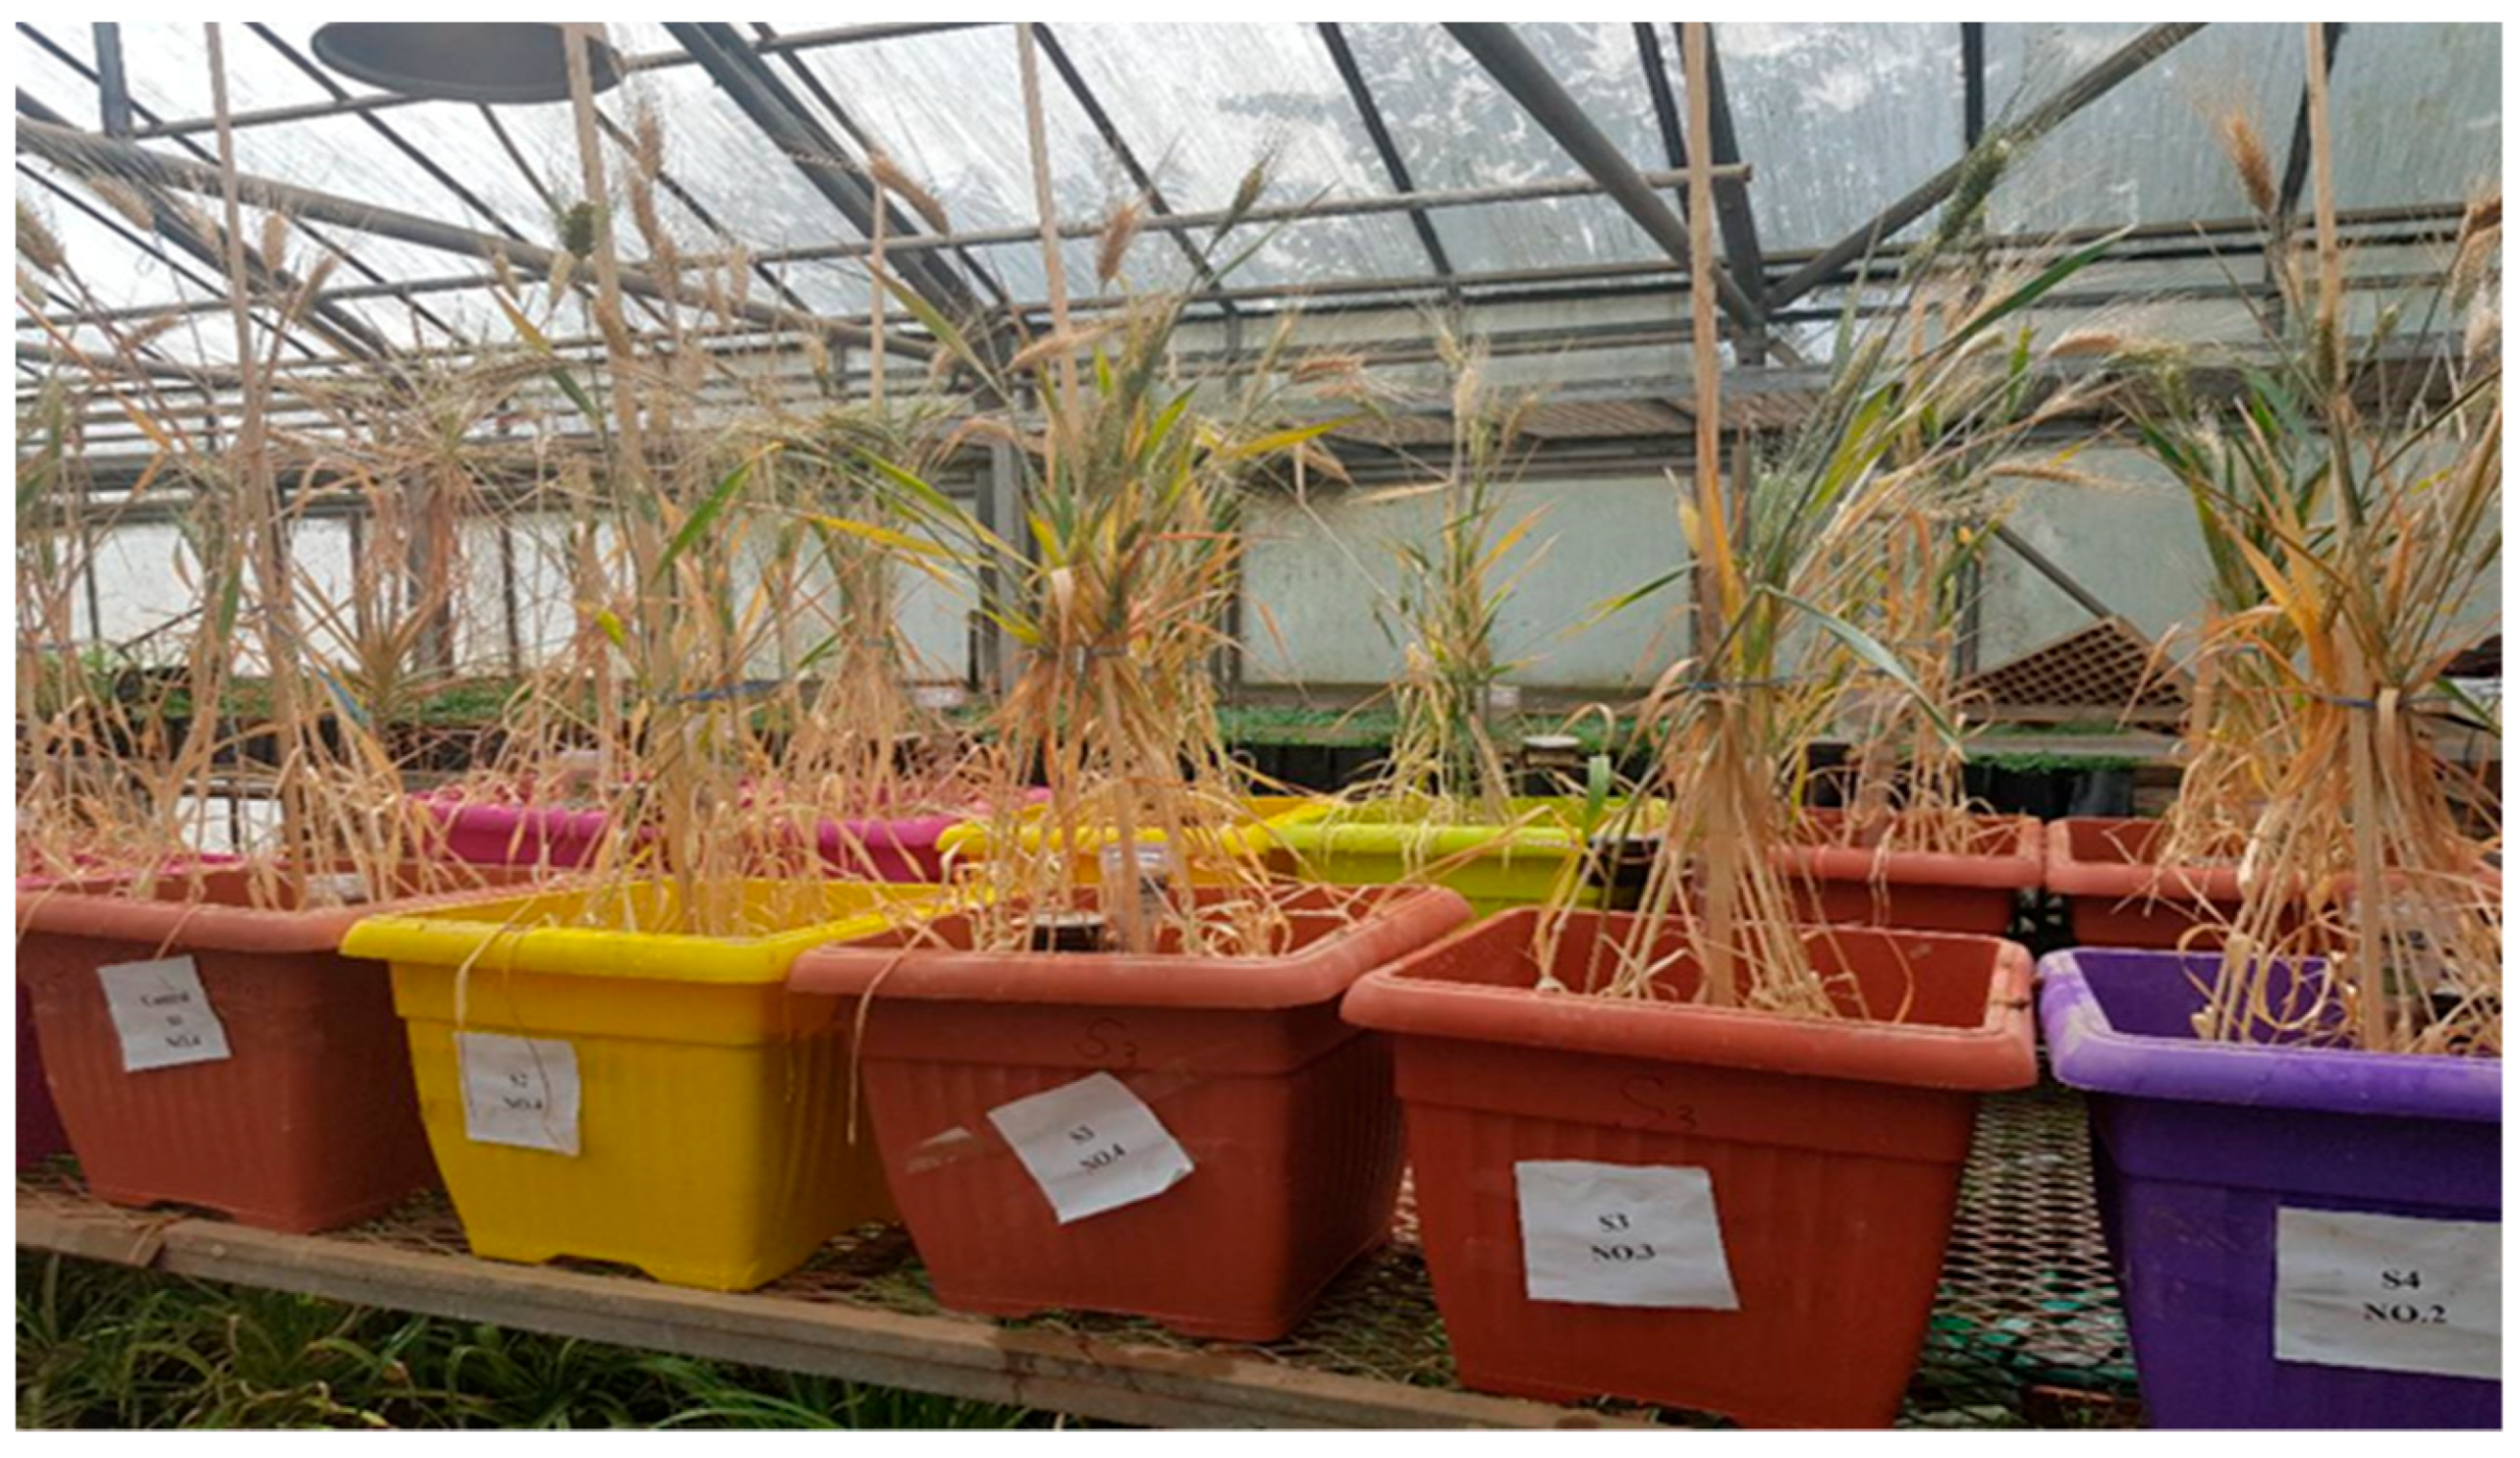
2.2. Greenhouse Experiment

The second experiment was conducted in a greenhouse at the University of Jordan. The same durum wheat cultivar and soil type were used. Sixteen identical pots (80 l) with rectangular dimensions of 40 × 40 cm and 50 cm deep were planted on 30 December 2017 and were harvested on 10 Aprril 2018. A randomized complete block design (RBD) with four replicates for each treatment was used in the experiment. The four salinity levels of the experiment were 0.68, 4, 8, and 10 dS m−1 for S1 (the control), S2, S3, and S4, respectively. The design based on the hypothesis that pots in greenhouse could accumulate salts and significantly suppress the yield and growth parameters without deficit irrigation. A higher level of saline irrigation water was used in greenhouse where a further reduction in growth and development was expected. Soil samples for ECe and pH were taken every three weeks during the growing season at depths of 10 and 30 cm.
In each pot, six seeds were planted in two rows. Soil water content was monitored on the same dates as in the field experiment by gravimetric soil moisture and tensiometers that were installed in the 16 pots at a depth of 20 cm from the soil surface (Figure 2). The treatments were irrigated by saline water after emergence and irrigation was conducted using the same procedure as in the field experiment. Pots were irrigated at 100% RAW, and each time the soil water content reached the critical level, irrigation water was applied to replenish soil water content to FC.
A micro weather station was installed inside the greenhouse, consisting of a pyranometer (PYR) for daily solar radiation, a thermistor for hourly air temperature and a humidity sensor. Canopy height and LAI were measured during tillering, flag leaf, and maturity development stages. The measurements were taken for all plants in each pot.
The total applied irrigation water in the greenhouse experiment was 0.973 m3 for each pot. NaCl was added for the three treatments S2, S3 and S4 in the amounts of 1.75, 3.5 and 4.5 g l−1, respectively. The water used in the control was tap water and no NaCl was added to irrigation water for the control treatment. The salinity of the tap water was approximately 0.68 dS m−1. The electrical conductivity of irrigation water (ECiw) was measured frequently before and after irrigation. The mass of NaCl that was needed to reach the salinity levels in irrigation water was estimated for both experiments using the procedure described by Rani and Sharma [40] where NaCl was used as solute in g l−1. A relationship was found that amount of sodium chloride required in terms of gram per liter is half of the desired EC in dS m−1 with some adjustments to get the final ECiw.
Table 2 shows the chemical properties of the irrigation water that was used in the control treatment for the two experiments. For the field experiment, the electrical conductivity of irrigation water (ECiw) was 2 ± 0.31 dS m−1, the pH and sodium adsorption ratio (SAR) were 7.8 ± 0.04 and 5.22 ± 0.04, respectively, and the concentration of Na was an average of 240 ± 0.91 ppm. For the greenhouse experiment, the pH and SAR were 7.53 ± 0.14 and 5.230 ± 0.05, respectively. The Na concentration in the control was 170 ± 0.57 ppm.

2.3. Experimental Measurements

Canopy height, LAI, aboveground biomass, grain number per unit area, grain yield and duration of growth stages were measured for the filed and greenhouse experiments. The duration of the three development stages, tillering, flag leaf and maturity were recorded using days after planting (DAP), which is defined as the days needed to reach the growth stage from the planting date. Leaf area index (LAI) was measured using a ceptometer (AccuPAR model LP-80, Decagon Devices, Inc., Pullman, WA, USA), and a graduated rod was used to measure canopy height at tillering, flag leaf, and maturity. The number of grains per unit area, grain yield and aboveground biomass were measured at harvest using all plants in 1 m2 for each plot in the field. In the greenhouse, all plants in each pot were measured after harvesting.

2.4. Statistical Analysis
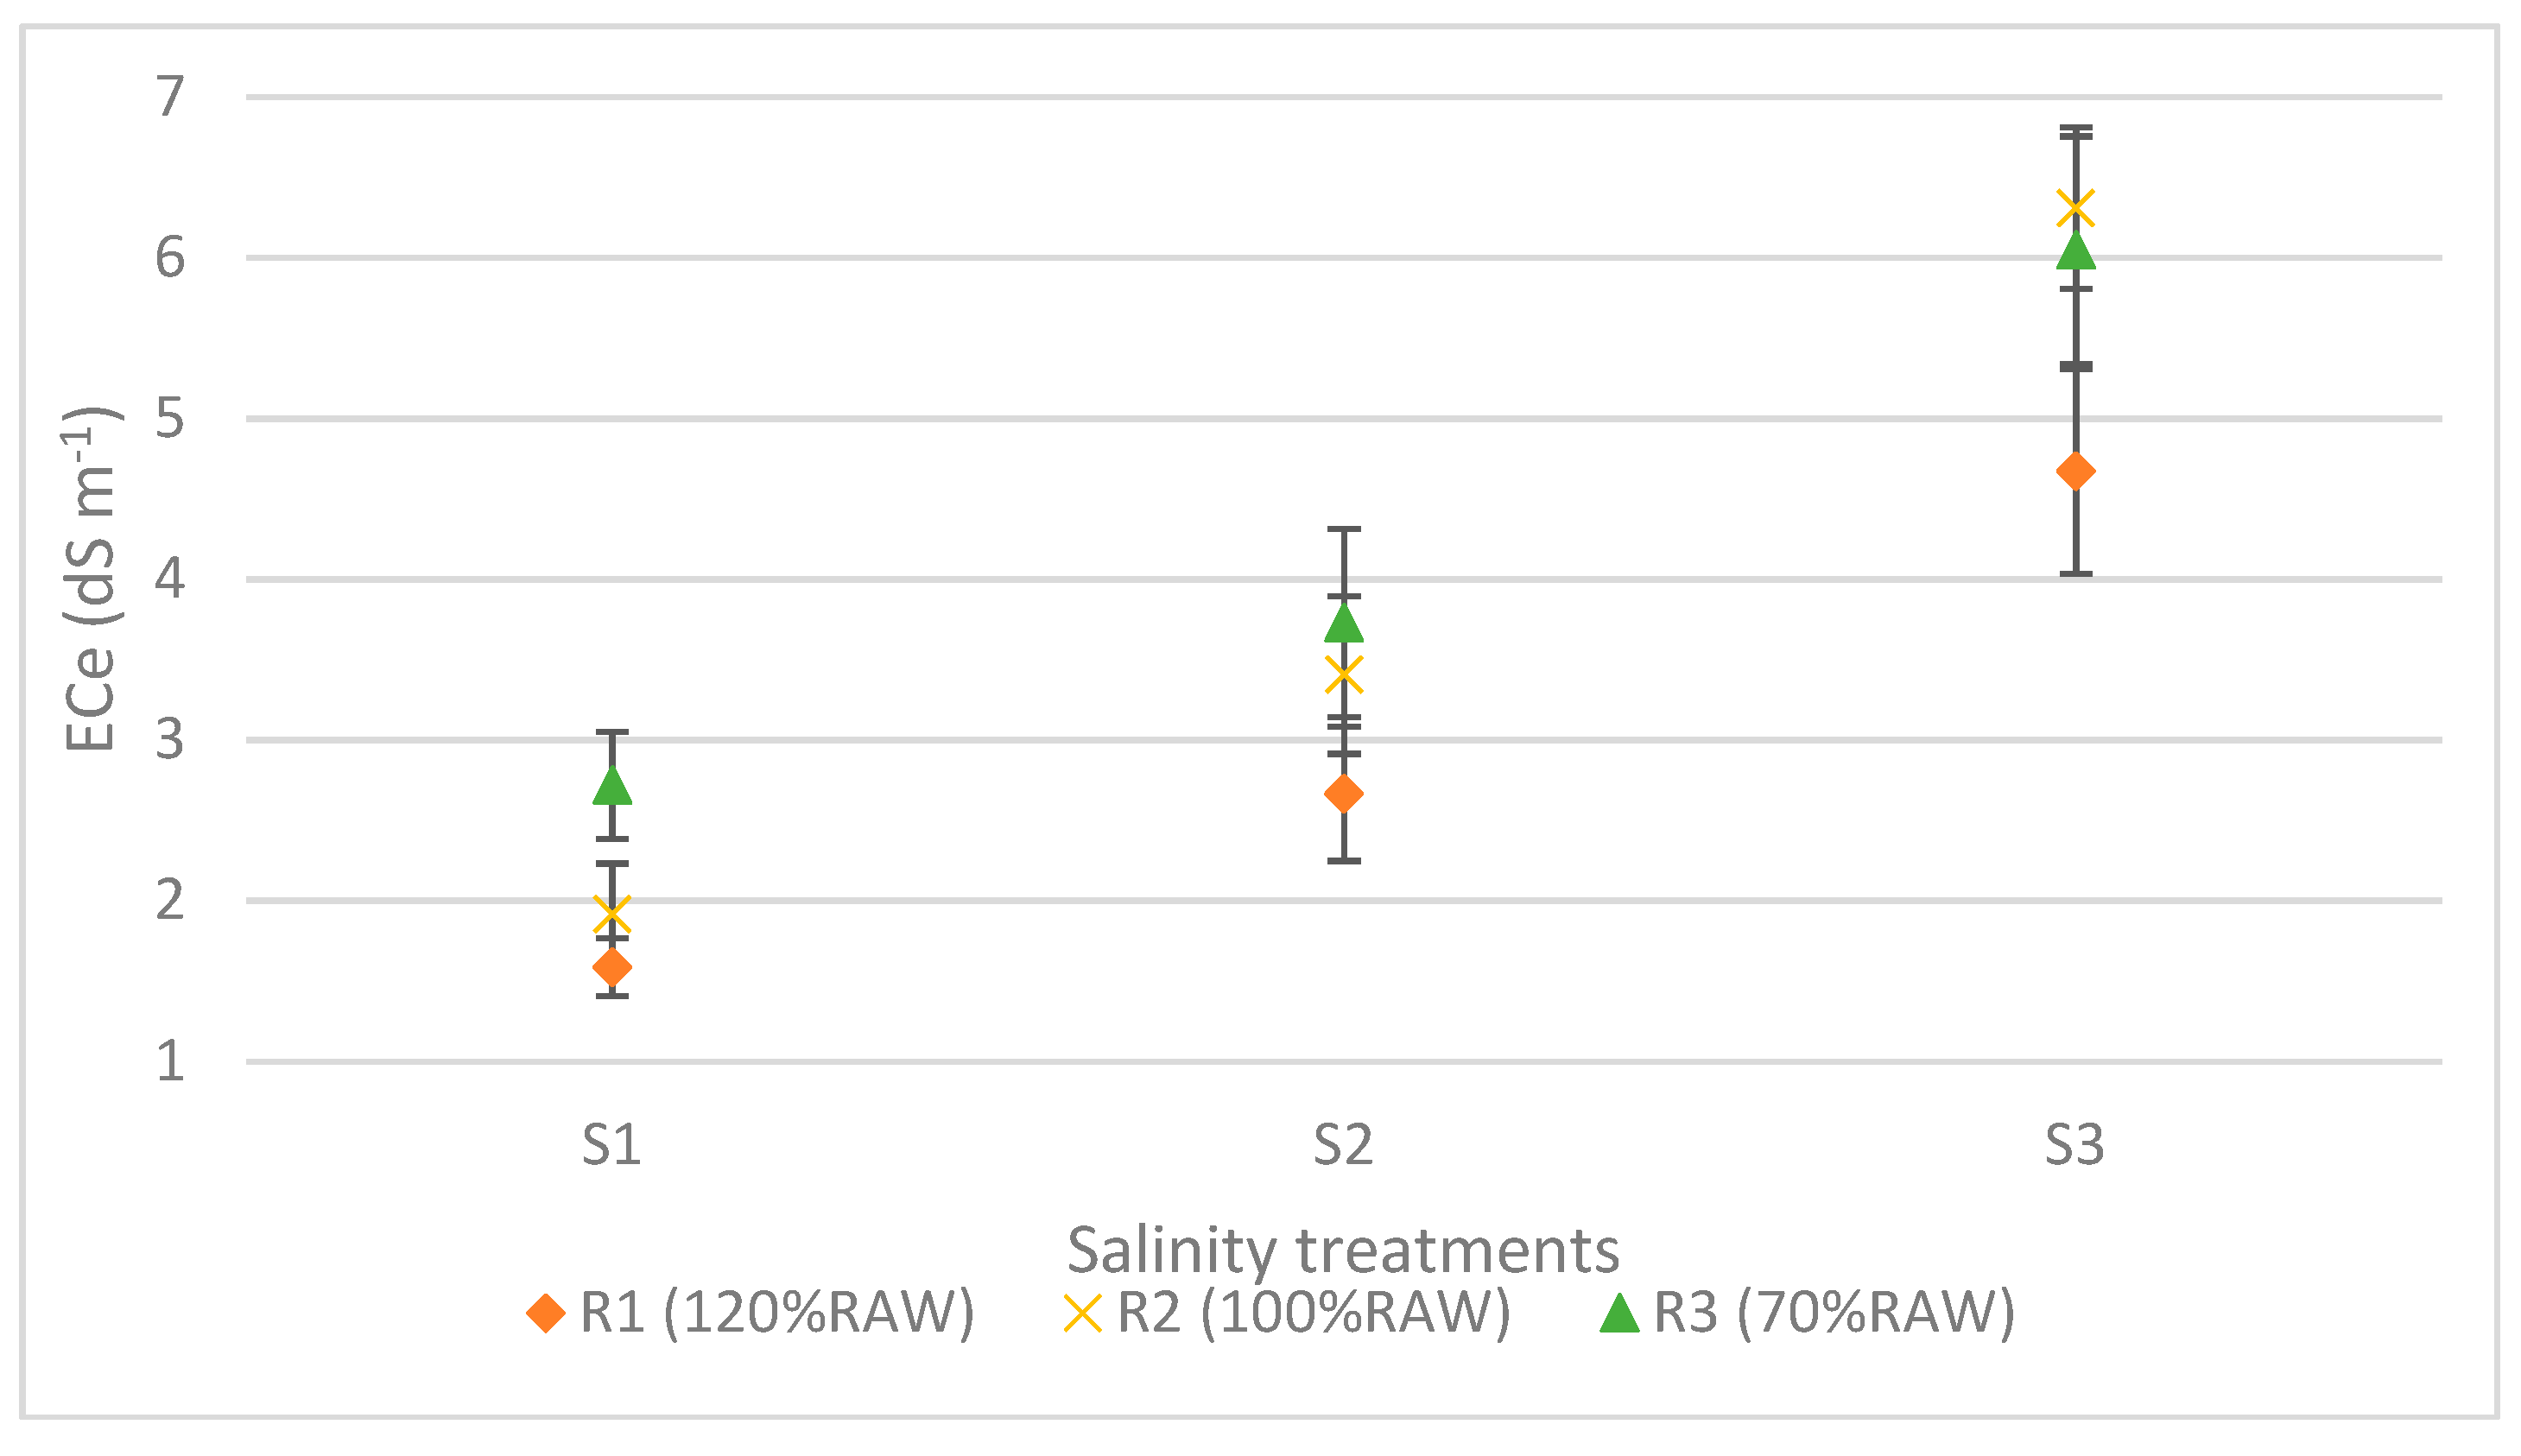
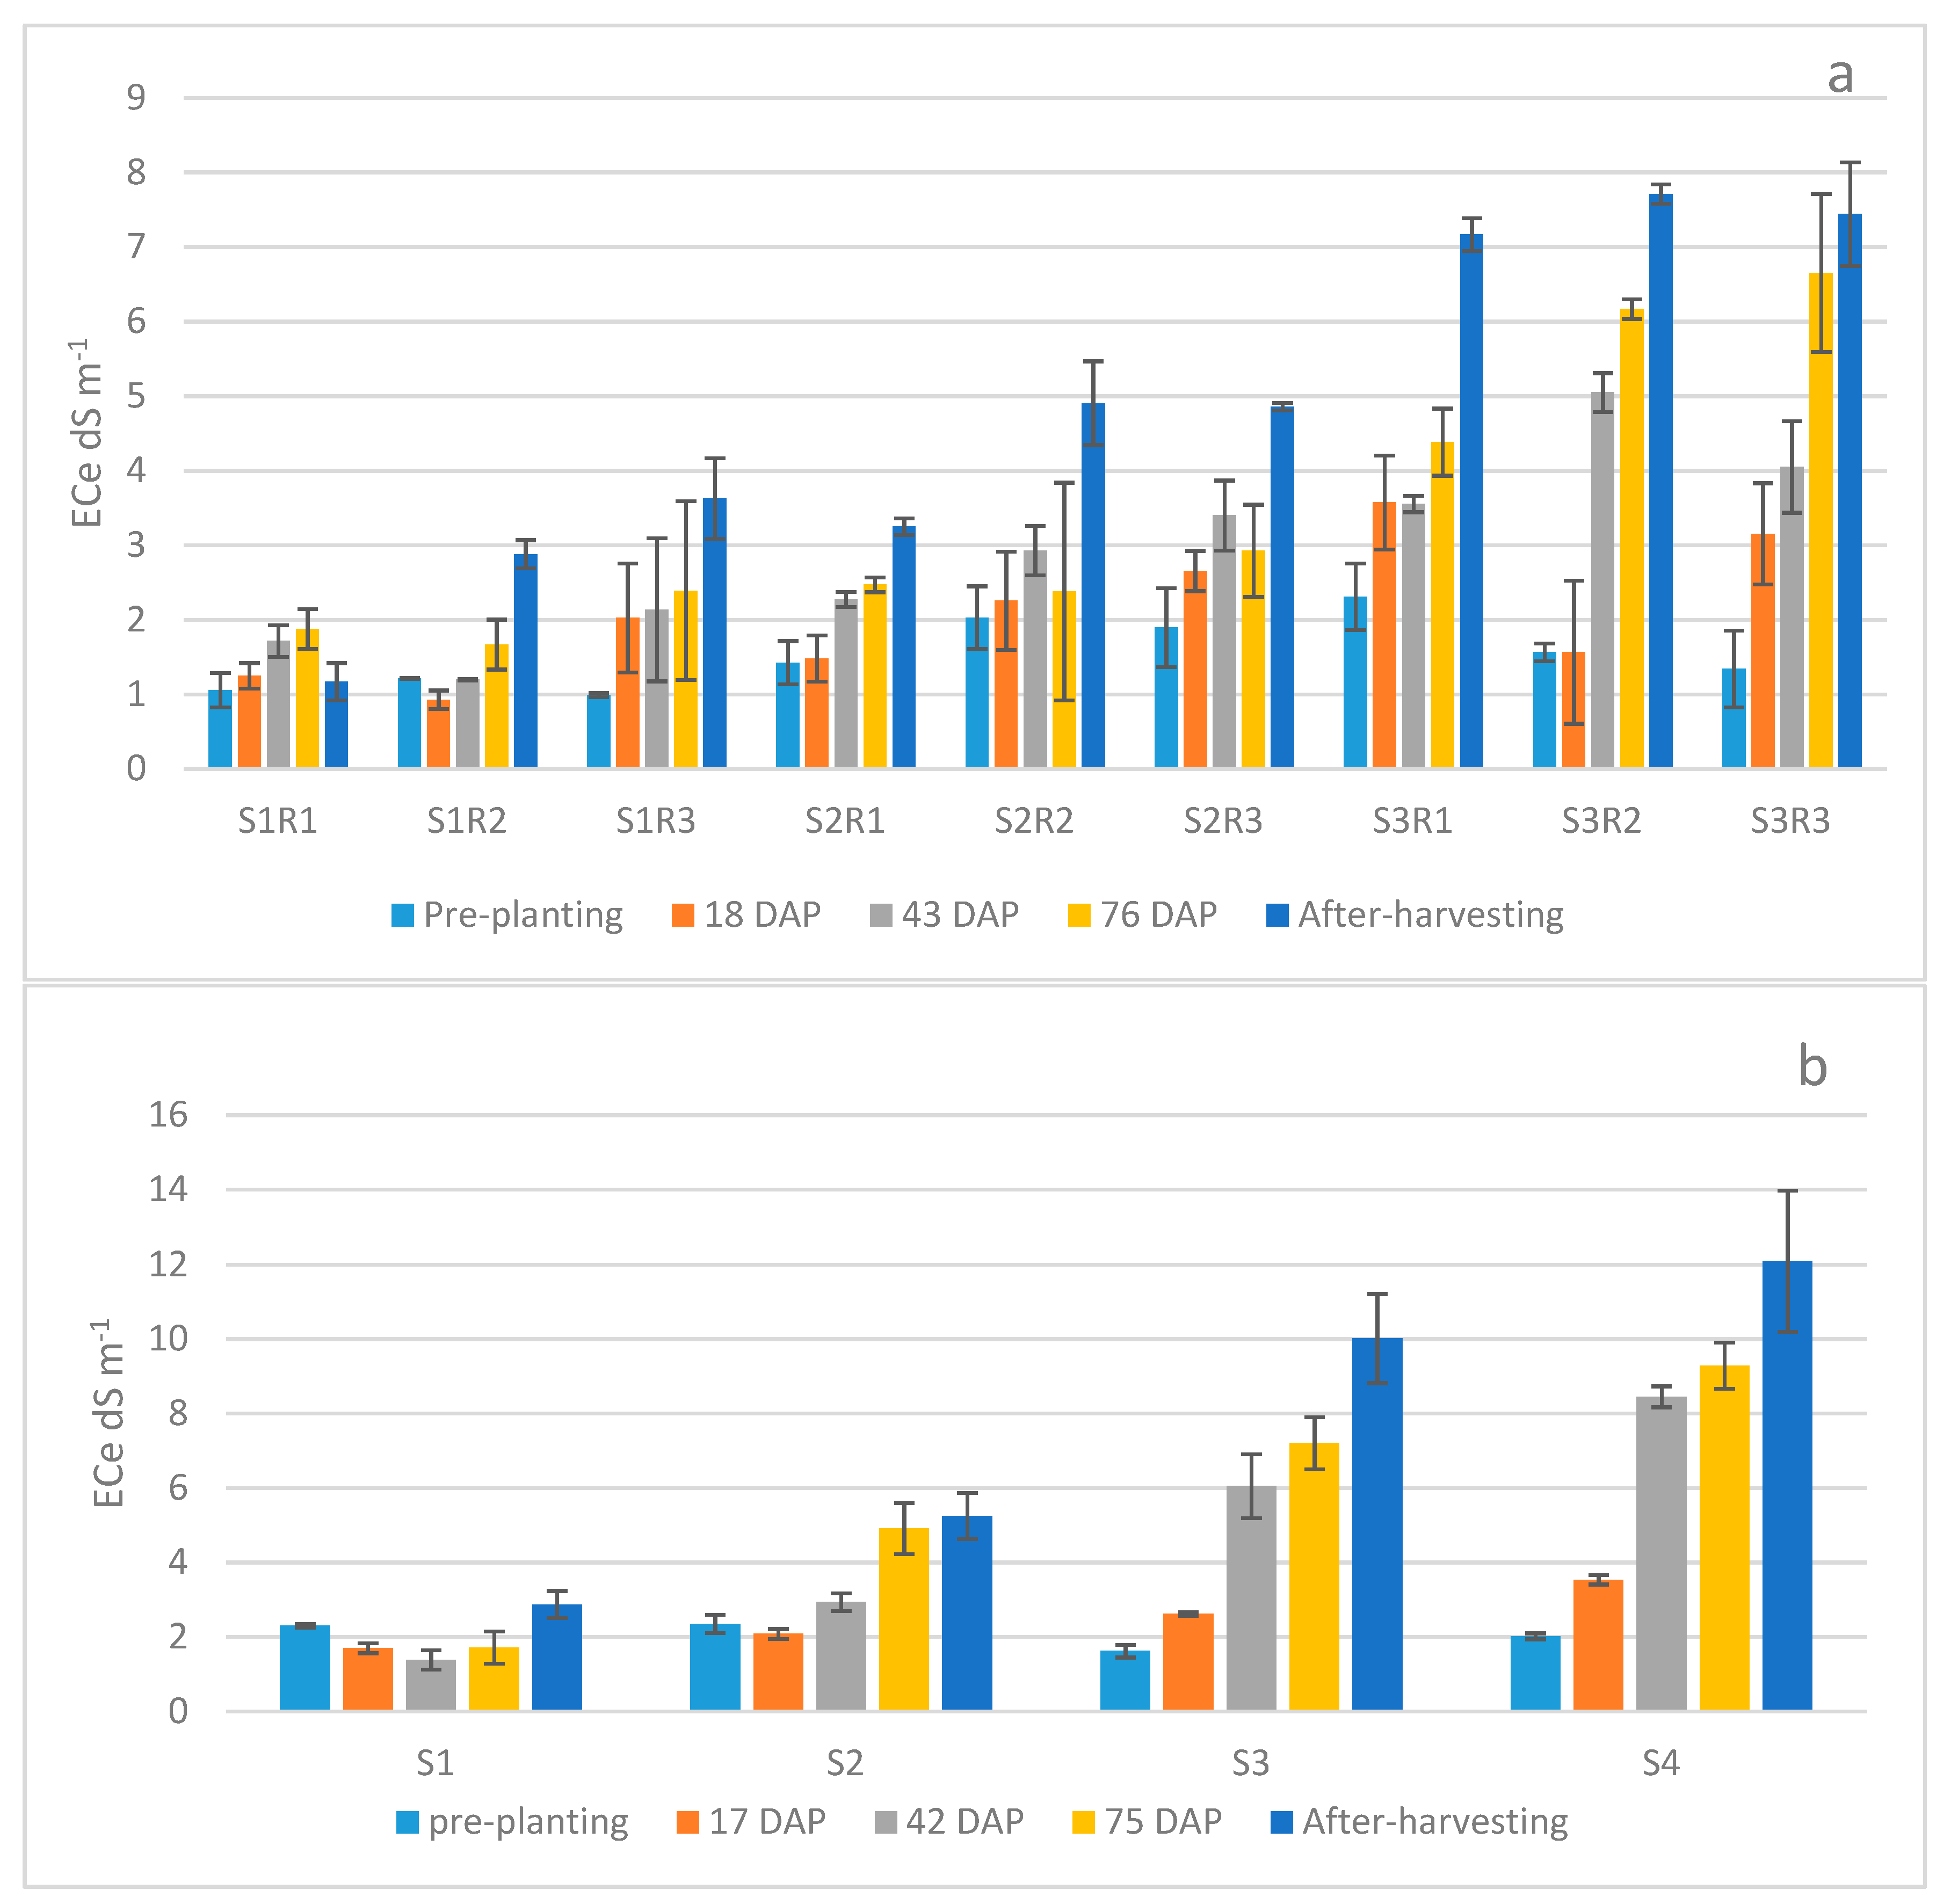
ANOVA and t-test were applied using the general linear model (GLM) procedure of the Statistical Analysis System (NCSS Statistical Software, version 12, Kaysville, UT, USA). Differences were considered significant at α = 0.05.

3. Results

The relationship between salinity levels and irrigation amounts in the field experiment is illustrated in Figure 3. The average soil salinity at the end of the season increased slightly for the S1 treatment (control) from an average of 1.59 ± 0.18 dS m−1 for R1 (120% RAW) to an average of 2.72 ± 0.33 dS m−1 (S1) for R3 (70% RAW), while soil salinity for the S2 treatment increased gradually from 2.67 ± 0.42, 3.41 ± 0.49 to 3.73 ± 0.59 dS m−1 for (120% RAW), (100% RAW), and (70% RAW) for R1, R2, and R3, respectively. The increase was most noticeable for the S3 treatment, where the average changed in the range of 4.67 ± 0.64, 6.31 ± 05, and 6.05 ± 0.71 dS m−1 for R1, R2 and R3, respectively. The highest soil salinity levels for treatments S1, S2 and S3 were observed for R3 (70% RAW).
Soil salinity increased gradually during the growing season for both experiments; the average ECe with the standard error for each treatment is shown in Figure 2. For the field experiment, the highest significant changes in soil salinity between from pre-planting to after-harvesting were for the S3R2 and S3R3 treatments (Figure 4a). An average soil salinity difference between ECe in during the growing season for S3R2 and S3R3 were 6.64 ± 0.25 and 6.1 ± 1.21 dS m−1, respectively. The other treatments did not show any significant increase in soil salinity during the growing season.
For the greenhouse experiment, the average soil salinity for S1 at the early stage pre-planting was 2.31 ± 0.05 dS m−1 reaching 2.87 ± 0.08 dS m−1 after-harvesting (Figure 4b). For S2 the early average salinity level was 2.30 ± 0.13 dS m−1 and 5.25 ± 0.28 dS m−1 after-harvesting. Both S3 and S4 had significant average soil salinity differences during the whole season that were approximately 8.45 ± 1.05 and 10.07 ± 2.25 dS m−1, respectively.
The durations of tillering, flag leaf and maturity development stages in the field experiment were the same for all field treatments (Table 3a). The LAI for the field experiment was significantly different for only the treatments S2R3, S3R1, S3R2 and S3R3 at the flag leaf development stage. During the entire growing season, plant height in the field did not show any significant difference compared to the control treatment using the t-test (t > 0.05).
In the greenhouse, there were no differences between the control and other treatments in the duration of tillering and flag leaf stages, but the maturity for the S4 treatment was two days earlier than the other treatments (Table 3b). The duration of the different development stages was longer in the greenhouse than in the field experiment by 7, 17 and 4 days for tillering, flag leaf and maturity, respectively. The t-test showed a significant difference in plant height in the greenhouse for the S2, S3, and S4 treatments compared to the control (S1).
For the field experiment, the mean number of grains for the different treatments was not significantly different from the control treatment using the t-test (t > 0.05) (Table 4a). The grain yield was most sensitive to soil salinity for both experiments. Three treatments in the field S2R3, S3R2 and S3R3 had significant differences in yield. The aboveground biomass was significantly lower than the control only in the most stressed field treatment (S3R3).
For treatments S2, S3 and S4, grain yield was significantly different from the control (Table 4b).
A two-way ANOVA was calculated for the field experiment considering the different salinity levels (S1, S2, and S3) and irrigation amounts (R1, R2, and R3). The significant effect of the two factors on soil salinity is illustrated by the Fisher test (F) and probability (P). The irrigation water salinity (S) showed a significant impact on soil salinity, while irrigation levels were insignificant, and the interaction between the two factors in the field experiment was weak (Table 5a). Grain yield showed the most significant difference in response to salinity treatments for the field experiment (the lowest p-value). F critical (F crit) is called also F statistics that is used to determine the significant results when it is lower than F value (F). All parameters in the field had significant variations except plant height (Table 5a). For the greenhouse experiment, only grain yield and plant height had significant differences compared to the control, while the number of grains and aboveground biomass were not significantly different (Table 5b).

4. Discussion

The accumulation of sodium chloride in the soil in both the field and greenhouse experiments can be attributed to several causes. It was likely caused by multiple possibilities, primarily the low quality of irrigation water and the lack of sufficient irrigation water to reduce salt leaching, thereby resulting in further salt accumulation. The rate of soil salinization during the growing season was faster in all treatments in the greenhouse than in the field experiment (Figure 2), mainly due to the frequent irrigation of pots in the greenhouse compared to the field experiment. As a result, there was an unusually higher water uptake for the greenhouse pots than the irrigated fields when expressed in mm per unit area [41]. The accumulation of salts in the field was slow even for the most stressed treatment (S3R3), which can be explained by the short growing season in the field due to the hot climate in the Jordan Valley. The short growing season and respective limited amount of irrigation coupled with the loamy sand soil texture likely reduced the accumulation of saline in the soil as compared to accumulations reported in clay soil [41].
A comparison of the two experiments found no significant changes in the duration of the three development stages (Table 3). According to Grieve [42], moderate soil salinity does not have a noticeable effect on the timing of development stages for durum wheat, and that even high soil salinity level did not affect the duration of the vegetative phase, but does shorten the reproductive phase of durum wheat. The duration of the growing season in the greenhouse was higher than in the field (Table 3). Due to the unique conditions in the Jordan Valley 240 m below sea level, the average minimum field temperature was nearly 4 ºC higher than in the greenhouse. This higher temperature might be the reason for the short growing season in the field, as described by Barlow [43].
Results of the ANOVA for the parameters of both experiments (Table 5) show statistically significant differences for all the growth and development measurements for the field experiment except for plant height. On the other hand, grain yield and plant height were the only parameters that were significantly affected by the salinity increase in the greenhouse experiment (Table 5).
Although the soil at the beginning of the season was non-saline at germination and initial vegetative development, a reduction in the yield and yield components with the increase in soil salinity was observed. These finding suggests that the middle and late stages could be affected by soil salinity even when early stages were non-saline. Both experiments indicated that the most susceptible parameter to soil salinity was grain yield, similar to the finding of Singh and Chatrath [44], Steppuhn et al. [45], Saqib et al. [46] and Dikgwatlhe et al. [47]. The reduction in plant height with increasing soil salinity was significant for all salinity treatments in the greenhouse, where an accumulation of salts occurred during the earlier stages. This indicates that plant height is more sensitive to soil salinity when it is exposed to salinity at earlier stages, in accordance with the findings of Dikgwatlhe et al. [46].
Based on the grain yield data measured in the greenhouse experiment, the durum wheat cultivar Um Qais can be classified as a moderately salt tolerant cultivar. This is based on its relative yield when using saline irrigation water, according to the salt tolerance ranking criteria that were established by El-Hendawy [28] for durum wheat. Triticum turgidum subsp. Durum was considered relatively tolerant to Na and Cl ions compared to other durum wheat genotypes [29], in spite of the wide variation among the durum cultivars in tolerance to salinity [29]. The level of salt tolerance in durum wheat is highly related to the ability of the genotype to conserve high K to Na ratio in the shoot [48]. There was a relatively high reduction in yield of 40% for the S4 treatment in the greenhouse compared to the control, and the decline in yield for the S4 treatment compared to S3 was greater than 15%. Although it is very difficult to determine at which time during the growing season the effect of ion toxicity occurs, a study was conducted by Dura [25] to investigate the salt tolerance of three durum wheat cultivars in Jordan. One of these cultivars was Omrabi5 which is very similar to Um Qais. The response to NaCl toxicity was also investigated at different concentrations. Dura indicated that when the Na concentration in tissues reached 100 mM, it may inhibit the function of the most enzymes. Dura also implied that the effect of Na toxicity was observed at 100 mM (≈ 9 dS m−1) NaCl irrigation water. Accordingly, S4 treatment in the greenhouse experiment with 10 dS m−1 irrigation water salinity was expected to be affected by sodium ion toxicity.

5. Conclusions

In both the field and greenhouse experiments, Um Qais proved to be a moderately resistant crop to soil salinity. Grain yield was the most affected parameter to soil salinity during the middle and late stages of plant development. The maximum reduction of yield for Um Qais cultivar was 40% in the greenhouse when it was irrigated with 10 dS m−1 NaCl. The findings of this study are a good indication of the ability of Um Qais durum wheat to be productive in moderately saline soils and its use is recommended for cultivation in the Jordan Valley. However, more studies are needed to compare this cultivar with other local cultivars and to test their productivity in other areas with saline soils in Jordan and similar regions across the globe.

Author Contributions

L.H. is the main researcher who developed the project proposal, experimental design, data collection, analysis, and main write up; A.S. is the main supervisor of L.H. and who conceptualized the experiment, methodology, review, and editing; G.H. is the co-supervisor who contributed to the conceptualization, review and editing; V.S. also contributed to conceptualization, methodology, review and editing.

Funding

This research received funding from the University of Jordan with no external funding.

Conflicts of Interest

The authors declare no conflict of interest.

References

  1. Flowers, T. Plants and Salinity. J. Exp. Bot. Pref. 2006, 57, IV. [Google Scholar] [CrossRef]
  2. Läuchli, A.; Grattan, S. Plant Growth and Development Under Salinity Stress. In Advances in Molecular Breeding Toward Drought and Salt Tolerant Crops; Jenks, M.A., Hasegawa, P.M., Jain, S.M., Eds.; Springer: Dordrecht, The Netherlands, 2007; pp. 1–32. [Google Scholar] [CrossRef]
  3. Hajiboland, R. Role of Arbuscular Mycorrhiza in Amelioration of Salinity. In Salt Stress in Plants; Ahmad, P., Azooz, M.M., Prasad, M.N.V., Eds.; Springer: New York, NY, USA, 2013; pp. 301–354. [Google Scholar] [CrossRef]
  4. Pimentel, D.; Berger, B.; Filiberto, D.; Newton, M.; Wolfe, B.; Karabinakis, E.; Clark, S.; Poon, E.; Abbett, E.; Nandaopal, S. Water Resources, Agriculture and the Environment. BioScience 2004, 54, 909–918. [Google Scholar] [CrossRef]
  5. Machado, R.; Serralheiro, R. Soil Salinity: Effect on Vegetable Crop Growth. Management Practices to Prevent and Mitigate Soil Salinization. Horticulturae 2017, 3, 30. [Google Scholar] [CrossRef]
  6. Jamil, A.; Riaz, S.; Ashraf, M.; Foolad, R. Gene expression profiling of plants under salt stress. Crit. Rev. Plant Sci. 2011, 30, 435–458. [Google Scholar] [CrossRef]
  7. AbuAisha, E. Permanent Use of Water in Irrigation in Jordan’s Valley. In The Second International Conference of Water; The Jordanian Engineers Syndicate and The Ministry of Water and Irrigating: Amman, Jordan, 2001. [Google Scholar]
  8. Miyamoto, S.; Chacon, A.; Hossain, M.; Martinez, I. Soil salinity of urban turf areas irrigated with saline water. Landsc. Urban Plan 2005, 71, 233–241. [Google Scholar] [CrossRef]
  9. Ammari, T.G.; Tahhan, R.; Abubaker, S.; Al-Zu’Bi, Y.; Tahboub, A.; Ta’Any, R.; Abu-Romman, S.; Al-Manaseer, N.; Stietiya, M.H. Soil Salinity Changes in the Jordan Valley Potentially Threaten Sustainable Irrigated Agriculture. Pedosphere 2013, 23, 376–384. [Google Scholar] [CrossRef]
  10. Ekmekci, B.; Elkoca, O.; Tekkaya, E.; Erden, A. Residual stress state and hardness depth in electric discharge machining: De-ionized water as dielectric liquid. Mach. Sci. Technol. 2005, 9, 39–61. [Google Scholar] [CrossRef]
  11. Webber, H.A.; Madramootoo, C.A.; Bourgault, M.; Horst, M.G.; Stulina, G.; Smith, D.L. Adapting the CROPGRO Model for Saline Soils: The Case for a Common Bean Crop. Irrig. Sci. 2010, 28, 317–329. [Google Scholar] [CrossRef]
  12. Al-Zu’bi, Y.; Al-Kharabsheh, A. Multicriteria analysis for water productivity in the Jordan Valley. Water Int. 2003, 28, 501–511. [Google Scholar] [CrossRef]
  13. Munns, R. Comparative Physiology of Salt and Water Stress. Plant Cell Environ. 2002, 25, 239–250. [Google Scholar] [CrossRef]
  14. Greenway, H.; Munns, R. Mechanisms of Salt Tolerance in Nonhalophytes. Annu. Rev. Plant Physiol. 1980, 31, 149–190. [Google Scholar] [CrossRef]
  15. Tavakkoli, E.; Rengasamy, P.; Mcdonald, G.K. The response of barely to salinity stress differs between hydroponics and soil systems. Funct. Plant Biol. 2010, 37, 621–633. [Google Scholar] [CrossRef]
  16. Borrelli, M.G.; Fragasso, M.; Nigro, F.; Platani, C.; Papa, R.; Beleggia, R.; Trono, D. Analysis of metabolic and mineral changes in response to salt stress in durum wheat (Triticum turgidum ssp. durum) genotypes, which differ in salinity tolerance. Plant Physiol. Biochem. 2018, 133, 57–70. [Google Scholar] [CrossRef] [PubMed]
  17. Porceddu, E.; Damania, B.; Qualset, O. Genetics and breeding of durum wheat. In Proceedings of the International Symposium on Genetics and Breeding of Durum Wheat, Rome, Italy, 27–30 May 2013. [Google Scholar]
  18. Elings, A.; Nachit, M. Durum wheat landraces from Syria. I. Agro-ecological and morphological characterization. Euphytica 1991, 53, 211–224. [Google Scholar] [CrossRef]
  19. Jaradat, A. Phenotypic divergence for morphological and yield-related traits among landrace genotypes of durum wheat from Jordan. Euphytica 1991, 52, 155–164. [Google Scholar] [CrossRef]
  20. Munns, R.; Passioura, J.B.; Guo, J.; Chazen, O.; Cramer, G.R. water relations and leaf expansoin: Importance of time scale. J. Exp. Bot. 2000, 51, 1495–1504. [Google Scholar] [CrossRef] [PubMed]
  21. Kabbaj, H.; Sall, A.; Al-Abdallat, A.; Geleta, M.; Amri, A.; Matlouf, A.; Belkadi, B.; Ortiz, R.; Bassi, F. Genetic Diversity within a Global Panel of Durum Wheat (Triticum durum) Landraces and Modern Germplasm Reveals the History of Alleles Exchange. Plant Sci. 2017, 8, 1495–1504. [Google Scholar] [CrossRef]
  22. Al-Rjoub, F.A.; Al-Samarrai, M.A. Growth and Yield Responses of Three Durum Wheat Cultivars Subjected to Four Levels of Available Soil Moisture. Agric. Sci. 2006, 33, 153–164. [Google Scholar]
  23. Thalji, T.; Shalaldeh, G. Screening Wheat and Barely Genotypes for Salinity Resistance. J. Agron. 2007, 6, 647–650. [Google Scholar]
  24. Katerji, N.; Mastrorilli, M.; van Hoon, J.W.; Lahmer, F.Z.; Hamdy, A.; Oweis, T. Durum wheat and barley productivity in saline-drought environments. Eur. J. Agron. 2009, 31, 1–9. [Google Scholar] [CrossRef]
  25. Dura, S.; Duwayri, M.; Nachit, M. Detection of molecular markers associated with yield and yield components in durum wheat (Triticum turgidum L. var. durum Desf.). Afr. J. Agric. Res. 2013, 8, 2118–2128. [Google Scholar]
  26. Food and Agriculture Organization of the United Nations (FAO). The State of Food and Agriculture; FAO: Rome, Italy, 1993. [Google Scholar]
  27. Maas, E.V.; Hoffman, G.J. Crop Salt Tolerance-Current Assessment. J. Irrig. Drain. Div. 1977, 103, 115–134. [Google Scholar]
  28. El-Hendawy, S.E.; Hu, Y.; Yakout, G.M.; Awad, A.M.; Hafiz, S.E.; Schmidhalter, U. Evaluating Salt Tolerance of Wheat Genotypes Using Multiple Parameters. Eur. J. Agron. 2005, 22, 243–253. [Google Scholar] [CrossRef]
  29. Munns, R.; Hare, R.A.; James, R.A.; Rebetzke, G.J. Genitic variation for improving the salt tolerance of durum wheat. Aust. J. Res. 2000, 51, 69–74. [Google Scholar] [CrossRef]
  30. Prathapar, S.A.; Qureshi, A.S. Modelling the Effects of Deficit Irrigation on Soil Salinity, Depth to Water Table and Transpiration in Semi-arid Zones with Monsoonal Rains. Int. J. Water Resour. Dev. 1999, 15, 141–159. [Google Scholar] [CrossRef]
  31. Allen, R.G.; Pereira, L.S.; Raes, D.; Smith, M. Crop Evapotranspiration, Guidelines for Computing Crop Water Requirements; FAO Irrigation and Drainage Paper 56; FAO: Rome, Italy, 1998. [Google Scholar]
  32. Day, P.R. Particle Fractionation and Particle-Size Analysis. In Methods of Soil Analysis. Part 1. Physical and Mineralogical Properties, Including Statistics of Measurement and Sampling; Black, C.A., Ed.; Agron. Monogr. 9.1; ASA, SSSA: Madison, WI, USA, 1965; pp. 545–567. [Google Scholar] [CrossRef]
  33. Gardner, W.H. Water Content. In Methods of Soil Analysis. Part 1. Physical and Mineralogical Properties, Including Statistics of Measurement and Sampling; Black, C.A., Ed.; Agron. Monogr 1965. 9.1; ASA, SSSA: Madison, WI, USA, 1965; pp. 82–127. [Google Scholar] [CrossRef]
  34. Blake, G.R. Bulk Density1. In Methods of Soil Analysis. Part 1. Physical and Mineralogical Properties, Including Statistics of Measurement and Sampling; Black, C.A., Ed.; Agron. Monogr 1965. 9.1; ASA, SSSA: Madison, WI, USA, 1965; pp. 374–390. [Google Scholar] [CrossRef]
  35. Rhoades, J.D.; Chanduvi, F.; Lesch, S. Soil Salinity Assessment: Methods of Interpretation of Electrical Conductivity Measurements; FAO: Rome, Italy, 1999. [Google Scholar]
  36. Chapman, H.D. Cation-Exchange Capacity 1. In Methods of Soil Analysis. Part 2. Chemical and Microbiological Properties, 2nd ed.; Norman, A.G., Ed.; Agron. Monogr 1965. 9.2; ASA, SSSA: Madison, WI, USA, 1965; pp. 891–901. [Google Scholar] [CrossRef]
  37. Bower, C.A.; Wilcox, L.V. Soluble Salts 1. In Methods of Soil Analysis. Part 2. Chemical and Microbiological Properties; Norman, A.G., Ed.; Agron. Monogr.1965. 9.2; ASA, SSSA: Madison, WI, USA, 1965; pp. 933–951. [Google Scholar] [CrossRef]
  38. Olsen, S.R.; Dean, L.A. Phosphorus 1. In Methods of Soil Analysis. Part 2. Chemical and Microbiological Properties, 2nd ed.; Norman, A.G., Ed.; Agron. Monogr 1965. 9.2; ASA, SSSA: Madison, WI, USA, 1965; pp. 1035–1049. [Google Scholar] [CrossRef]
  39. Bremner, J.M. Total Nitrogen 1. In Methods of Soil Analysis. Part 2. Chemical and Microbiological Properties, 2nd ed.; Norman, A.G., Ed.; Agron. Monogr 1965. 9.2; ASA, SSSA: Madison, WI, USA, 1965; pp. 1149–1178. [Google Scholar] [CrossRef]
  40. Rani, B.; Sharma, V.K. Standarisation of methodology for obtaining the desired salt stress environment for salinity effect observation in rice seedlings. Int. J. Environ. Sci. 2015, 6, 232. [Google Scholar] [CrossRef]
  41. Ben Ahmed, C.; Magdich, S.; Ben Rouina, B.; Boukhris, M.; Ben Abdullah, F. Saline Water Irrigation Effects on Soil Salinity Distribution and Some Physiological Responses of Field Grown Chemlali Olive. J. Environ. Manag. 2012, 113, 538–544. [Google Scholar] [CrossRef]
  42. Grieve, C.M.; Grattan, S.R.; Maas, E.V. Plant salt tolerance. Agric. Salin. Assess. Manag. 2012, 2, 405–459. [Google Scholar]
  43. Barlow, K.M.; Christy, B.P.; O’Leary, G.J.; Riffkin, P.A.; Nuttall, J.G. Simulating the impact of extreme heat and frost events on wheat crop production: A review. Field Crops Res. 2015, 171, 109–119. [Google Scholar] [CrossRef]
  44. Singh, K.N.; Chatrath, R. Salinity tolerance. In Application of Physiology in Wheat Breeding; Reynolds, M.P., Monasterio, J.I.O., McNab, A., Eds.; CIMMYT: Mexico City, Mexico, 2001; pp. 101–110. [Google Scholar]
  45. Steppuhn, K.; Volkmar, K.M.; Miller, P.R. Comparing canola foeld pea, dry bean, and durum crops grown in saline media. Crop Sci. 2001, 41, 1827–1833. [Google Scholar] [CrossRef]
  46. Saqib, M.; Akhtar, J.; Qureshi, R.H. Pot study on wheat growth in saline and waterlogged compacted soil I. Grain yield and yield components. Soil Till. Res. 2004, 77, 169–177. [Google Scholar] [CrossRef]
  47. Dikgwatlhe, S.B.; Ceronio, G.M.; van Rensburg, L.D. Wheat (Triticum aestivum, L.) Growth and Yield Response to Saline Irrigation Water under Controlled Conditions. S. Afr. J. Plant Soil 2008, 25, 172–177. [Google Scholar] [CrossRef]
  48. Colmer, T.D.; Flowers, T.J.; Munns, R. Use of wild relatives to improve salt tolerance in wheat. J. Exp. Bot. 2006, 57, 1059–1078. [Google Scholar] [CrossRef] [PubMed] [Green Version]
Figure 1. Harvesting at field experiment in April 2018.
Agriculture 09 00135 g001
Figure 2. Harvesting at greenhouse experiment in April 2018.
Agriculture 09 00135 g002
Figure 3. Mean soil salinity (ECe) at the end of the growing season in the field experiment for the three irrigation water salinity levels (S1, S2, and S3) with the three irrigation levels (R1, R2, and R3) which was determined by RAW (Readily Available Water).
Agriculture 09 00135 g003
Figure 4. The mean ECe for the nine treatments of the field experiment (a), and the mean ECe for the four treatments in the greenhouse during the growing season (b). The time of ECe measurements are shown in days after planting (DAP). (Error bars represent standard errors from the mean.)
Agriculture 09 00135 g004
Table 1. Soil chemical and physical properties in the Jordan Valley experiment at the field initial conditions before planting. CEC is the cation exchange capacity of the soil and SAR is the sodium adsorption ratio. The values are reported with their standard errors.
a. Soil Chemical Properties
Cl (ppm)0.33 ± 0.05
Na (ppm)41.98 ± 6.52
K (ppm)54.55 ± 0.04
Ca (ppm)120 ± 0.65
P (ppm)42 ± 4.10
Mg (ppm)105.60 ± 1.24
HCO3 (ppm)231.86 ± 10.01
Organic C (%)0.23 ± 0.01
N (%)0.50 ± 0.05
CEC (cmolkg−1)18.60 ± 0.48
SAR0.83 ± 0.02
ECe (dS m−1)4.00 ± 0.23
pH8.00 ± 0.09
b. Soil Physical Properties
Clay (%)16 ± 0.48
Sand (%)73 ± 0.65
Upper limit (cm3 cm−3)0.19 ± 0.01
Lower limit (cm3 cm−3)0.09 ± 0.01
Saturated water content (cm3 cm−3)0.38 ± 0.02
Bulk density (g cm−3)1.58 ± 0.11
Table 2. Chemical properties of the irrigation water used for the control treatments in field and greenhouse experiments.
Ca (ppm)Mg (ppm)Cl (ppm)Na (ppm)SARpHECiw (dS m−1)
Field exp.92 ± 2.1040.8 ± 0.470.35 ± 0.01240 ± 0.915.22 ± 0.057.8 ± 0.042 ± 0.31
Greenhouse exp.28 ± 0.4631.2 ± 2.080.054 ± 0.01170 ± 0.575.230 ± 0.057.53 ± 0.140.68 ± 0.05
SAR is Sodium Adsorption Ratio. ECiw is the electrical conductivity for irrigation water.
Table 3. Days after planting (DAP), leaf area index (LAI, m2 m−2) and plant height (P.HEIGHT, cm) for the tillering, flag leaf and maturity growing stages for the field experiment (a), and for the greenhouse experiment (b). The star symbol * shows significant values t < 0.05 using t-test assuming equal variances.
TilleringFlag LeafMaturity
DAPLAIP.HEIGHTDAPLAIP. HEIGHTDAPLAIP. HEIGHT
a. Field Experiment
S1R1 control190.40 ± 0.1131 ± 0.75535.03 ± 0.4184 ± 0.75942.89 ± 0.58103 ± 2.53
S1R2190.32 ± 0.0731 ± 0.48535.18 ± 0.3486 ± 0.29942.53 ± 0.25104 ± 1.32
S1R3190.38 ± 0.0931 ± 0.63534.50 ± 0.1985 ± 0.29942.41 ± 0.46106± 1.81
S2R1190.47 ± 0.0832 ± 0.48535.06 ± 0.1884 ± 0.29942.85 ± 0.18104 ± 1.81
S2R2190.44 ± 0.0332 ± 0.63534.36 ± 0.0985 ± 1.04942.25 ± 0.36103 ± 2.63
S2R3190.20 ± 0.0132 ± 0.48534.09 ± 0.10 *85 ± 0.63942.11 ± 0.04103 ± 0.45
S3R1190.27 ± 0.0230 ± 0.25533.96 ± 0.16 *83 ± 0.29942.41 ± 0.38103 ± 1.43
S3R2190.31 ± 0.0930 ± 0.29533.81 ± 0.20 *81 ± 0.41942.23 ± 0.03101 ± 1.19
S3R3190.21 ± 0.0331 ± 0.48533.73 ± 0.18 *81 ± 0.41941.84 ± 0.26098 ± 1.09
b. Greenhouse
S1 control26NA41 ± 0.4870NA97 ± 0.3598NA106 ± 2.39
S226NA39 ± 0.48 *70NA84 ± 0.28 *98NA98 ± 1.94 *
S326NA35 ± 0.25 *70NA79 ± 0.42 *98NA90 ± 2.46 *
S426NA35 ± 0.25 *70NA73 ± 0.50 *96NA85 ± 0.75 *
Table 4. Yield and yield components for the field (a) and the greenhouse experiments (b). The star symbol * shows significant values t < 0.05 using t-test assuming equal variances.
TreatmentsGrains Number m−2Grain Yield kg ha−1Above-Ground Biomass kg ha−1
a. Field Experiment
S1R16131 ± 1503311 ± 819353 ± 241
S1R26124 ± 2483307 ± 1349436 ± 471
S1R36048 ± 2473265 ± 1339391 ± 407
S2R16130 ± 1813310 ± 979930 ± 293
S2R25773 ± 2103117 ± 119665 ± 353
S2R35390 ± 1362911 ± 73 *9024 ± 227
S3R15825 ± 923145 ± 509752 ± 155
S3R25508 ± 1052754 ± 52 *8813 ± 169
S3R34963 ± 802430 ± 11 *8021 ± 38 *
b. Greenhouse Experiment
S12742 ± 2281448 ± 1034576 ± 355
S22288 ± 1921148 ± 94 *4110 ± 352
S32568 ± 1411100 ± 52 *4129 ± 207
S42242 ± 73 *878 ± 67 *3365 ± 109 *
Table 5. ANOVA statistical analysis for the field (a) and for the greenhouse (b) experiments. Results marked with star symbol * are significant (p < 0.05). DF: Degree of Freedom, CV: Coefficient of Variance, SE: Standard Error, F crit: F critical.
TreatmentsDFMeanCV (%)SEFp-ValueF crit
a. Field Experiment
Irrigation water salinity (S)2NANANA19.82709 *9.8 × 10−8 *3.109311
Irrigation water amount (R)2NANANA2.2884540.1079453.109311
Interaction 4NANANA0.1270750.9722312.484441
Number of grains (m−2)355766982.35.581253 *0.000322 *2.305313
Grain yield (kg ha−1)3530611155.811.13967 *8.34 × 10−7 *2.305313
Aboveground biomass (kg ha−1)3592658125.93.981641 *0.003164 *2.305313
Plant height (cm)35102.740.601.5529360.1858892.305313
LAI354.40150.106.164087 *0.000151 *2.305313
b. Greenhouse Experiment
Number of grains (m−2)1524600.002.31.9584190.1741433.490295
Grain yield (kg ha−1)1511432264.18.175895 *0.003123 *3.490295
Aboveground biomass kg ha−115404517167.13.2871140.0582613.490295
Plant height (cm)1594.3102.316.5935 *0.000853 *4.066181

