Article

The Effect of Herbage Conservation Method on Protein Value and Nitrogen Utilization in Dairy Cows

1
Institute of Animal Science, University of Bonn, Endenicher Allee 15, 53115 Bonn, Germany
2
Agroscope, Animal Biology Research Group, Tioleyre 4, 1725 Posieux, Switzerland
3
Agroscope, Ruminant Research Unit, Tioleyre 4, 1725 Posieux, Switzerland
*
Author to whom correspondence should be addressed.
Agriculture 2019, 9(6), 118; https://doi.org/10.3390/agriculture9060118
Submission received: 3 May 2019 / Revised: 31 May 2019 / Accepted: 2 June 2019 / Published: 6 June 2019
(This article belongs to the Special Issue Quality and Production of Forage)

Abstract

:
Ruminant production systems frequently rely on grassland utilization and conservation of herbage as hay or silage. Conservation affects the crude protein (CP) composition and protein value, which is particularly recognized during ensiling. The aim of the current study was to describe the effect of the conservation method on forage protein value and N utilization in dairy cows. Herbage from the same sward was cut and conserved as silage (SI), barn-dried hay (BH), or field-dried hay (FH). Laboratory evaluation indicated differences in CP fractions and ruminal degradability of CP. Conserved forages were fed to six lactating Holstein cows in a replicated 3 × 3 Latin square design, and N balance was assessed. Partitioning of N into milk, feces, and urine was affected only moderately. Lower concentrations of serum, milk, and also urinary urea indicated lower N turnover for FH compared to SI and BH, likely due to lower N intake for FH. However, the use efficiency of feed N for milk N did not differ between the types of forage. Further, high CP concentrations and the unbalanced concentrations of CP and energy in the forages led to excess excretion of N in all treatments and presumably superimposed effects of the conservation method on N utilization.

1. Introduction

Worldwide, agriculture substantially relies on grassland utilization. Feeding high amounts of forage to ruminants is beneficial with regard to maintaining rumen function and reduced competition with resources for human nutrition [1]. Moreover, utilization of forage produced on farm can be advantageous over imported concentrate in terms of both cost and nutrient cycles.
In many countries, conservation of herbage plays a key role, either to supply forage for winter feeding or as year-round feed in stall-feeding systems. Ensiling is often favored to conserve herbage in humid and temperate regions due to a reduced period between cutting and harvesting [2]. However, traditional conservation as hay has gained renewed interest in grassland-dominated regions specialized in the production of dairy products with different quality labels, such as protected-designation-of-origin (PDO) hard cheese types (e.g., Gruyère cheese [3]). These labels often offer higher milk payment but prohibit the feeding of silage, e.g., because of concerns regarding lowered cheese processing quality caused by clostridia contamination [4]. Haymaking in the field requires constant weather conditions for several days, which causes some uncertainty for the production of high-quality forage. A way to reduce the time in the field is conservation as barn-dried hay where the fresh herbage is put on a ventilation just after wilting in the field for some days [5].
However, conservation of forages—and particularly, ensiling—can have significant effects on crude protein (CP) composition of the forage and N utilization by the animal [6,7]. This is mainly due to the fact that much of the original true protein (TP) is degraded to non-protein N (NPN) during ensiling. Crude protein degradation in dried forages is generally less pronounced than in silages [8]. True protein concentration as an indicator of protein degradation during conservation is routinely included in silage quality evaluation by many laboratories. However, a more detailed fractionation of feed CP according to the Cornell Net Carbohydrate and Protein System (CNCPS [9,10]) could provide a better understanding of the effect of the conservation method on herbage quality. The distribution of CP fractions per se can reveal potential conservation-induced changes in herbage CP. The underlying concept of different ruminal solubilities further allows the CP fractions to be used in regression equations to estimate ruminally undegraded feed CP (RUP) values for a variety of feedstuffs, including forages [8,11].
There is a long history of research on forage conservation including N utilization in silage feeding [12]. However, there is a lack of targeted research on the conservation of herbage from temperate regions focusing on the relationship between conservation method and N balance in animals, as well as detailed descriptions of CP composition and protein value of the feed.
Therefore, the aim of this study was to determine the effect of three different conservation methods (i.e., ensiling, barn-drying, field-drying) of herbage on N balance and utilization in lactating dairy cows. We hypothesized that N utilization would be improved by feeding hay compared to silage due to its lower concentration of NPN. The differently conserved herbages were further characterized regarding CP composition and protein value, including CP fractionation and estimation of ruminal CP degradation and intestinal protein digestibility.

2. Materials and Methods

2.1. Preparation of Conserved Herbage

Herbage was cultivated at the experimental site Agroscope, Posieux, Switzerland (latitude: 46°46′ N, longitude: 07°06′ E; altitude: 650 m; 2016 average temperature: 9.2 °C; 2016 average precipitation: 1225 mm) in a sward mainly composed of Lolium perenne L., Trifolium repens L., and Trifolium pretense L. A 34 d regrowth was harvested as the fourth cut on 30 August 2016. One-third of the herbage was baled (0.8 × 0.7 × 1.3 m) without additives at a dry matter (DM) concentration of 56% after 24 h of wilting (silage, SI). A further third of the herbage, after 26 h on the field and at an average DM concentration of 68%, was put on ventilation (Hetroc dehumidifiers, Jona-Kempraten, Switzerland). In short, herbage was introduced into a hay box (basal area 6.2 × 9.9 m; volume 305 m³) with a wooden grate. Ambient air was moderately heated (typically 5 to 8 °C above ambient temperature) with a heat pump and conducted through the material from below. The herbage was ventilated until a DM concentration of 88% was reached (barn-dried hay, BH). After 72 h of drying on the field, the rest was harvested at 86% DM and put on ventilation for one day (field-dried hay, FH). After drying, FH and BH were baled into square bales (0.8 × 0.7 × 2.2 m). During the harvesting period (30 August to 2 September 2016), the average values 2 m above ground for temperature, wind velocity, and sunshine duration were 19.9 °C, 1.5 m/s, and 535 min/d, respectively.

2.2. N Balance Trial

2.2.1. Trial Design and Animal Housing

Six multiparous Holstein cows were randomly assigned to three treatments (SI, BH, FH) in a replicated 3 × 3 Latin square arrangement. At the beginning of the trial, the cows were 270 ± 7 d in milk, had a body weight of 698 ± 65 kg and a milk yield of 23.5 ± 3.9 kg/d. Three consecutive 21 d experimental periods were conducted, each consisting of a 14 d adaptation and a 7 d data collection period. Cows were kept in a tie-stall barn with rubber mat flooring for the adaptation periods and transferred to metabolic cages during the data collection periods. Metabolic cages were equipped with rubber mat flooring and slatted floor in the anterior and posterior part of the cage, respectively.
SI, BH, or FH were fed to two cows each ad libitum during the adaptation periods. Feed residues were recorded daily, and feed intake was calculated. During the data collection periods, 0.95 of ad libitum feed intake was offered as a constant amount. Two cows receiving the same feed within one experimental period were randomly assigned, i.e., pairs were not kept together for the following experimental period. The cows received 300 g/d of a mineral mix containing 253, 92, 248, 147 g of ash, CP, neutral detergent fiber (NDF), and acid detergent fiber (ADF) per kg of DM, respectively, in two meals per day during the complete trial. The cows were milked twice a day at 7:00 and 16:00. All procedures were conducted in accordance with the Swiss guidelines for animal welfare and were approved (No. 2016_25_FR) by the Animal Care Committee of the Canton Fribourg, Fribourg, Switzerland.

2.2.2. Data Recording and Sample Collection

Body weight was determined during the adaptation periods after each milking when the cows left the milking parlor using a walk-through weight recording system with locking gates (Ga5010, Insentec B.V., PV Marknesse, The Netherlands). During the collection periods, each type of herbage was sampled daily to form two pooled samples per period for laboratory analyses (for SI, three pooled samples were formed in period 2 due to varying DM concentration). The samples were stored in plastic bags at −20 °C for SI and at room temperature for BH and FH. Feed residues were recorded daily. Milk yield was recorded at each milking, and milk samples were taken from each cow and handled for later analysis of gross constituents, urea, and N concentrations as described by Grosse Brinkhaus et al. [13]. Total feces were collected in a tub beneath the metabolic cage, and total urine was collected via urinals attached around the vulva via Velcro straps glued to the shaved skin. One part of the urine was acidified directly with 2.5 M sulfuric acid for later analysis of urinary N. Each morning, the total weights of feces and urine were measured. Feces were homogenized, and an aliquot of approximately 100 g was collected daily. For urine, 0.2% of the total daily amount was collected daily from the acidified collection vessels. In addition, aliquots of non-acidified urine were collected. Daily samples of both feces and urine were separately pooled per cow over each collection period and stored at −20 °C until further analysis. On d 1 and 7 of each collection period, at 7:00 before feeding, ruminal fluid was sampled via a stomach tube. At the same time points, blood was sampled from the jugular vein. Samples were prepared for later analysis of volatile fatty acids (VFA) and ammonia in ruminal fluid and urea in blood, as described by Grosse Brinkhaus et al. [13].

2.3. Laboratory Analyses

2.3.1. Silage Fermentation Quality Analysis

Silage pH was determined by inserting an electrode (No. 6.0202.110, Metrohm Schweiz AG, Zofingen, Switzerland) connected to an ion meter (pH/ionmeter 692, Metrohm Schweiz AG, Zofingen, Switzerland) into the filtered fluid extracted from 40 g samples shaken for 30 min with 400 mL of deionized water. The ammonia concentration of each extract was determined with an ammonia electrode (No. 6.0506.010, Metrohm Schweiz AG, Zofingen, Switzerland). Solutions of ~10 g silage, 90 mL deionized water, 2.5 mL Carrez I (18 g K4Fe(CN)6 × 3H2O in 500 mL deionized water), 2.5 mL Carrez II (36 g ZnSO4 × 7H2O in 500 mL deionized water), and 5 mL internal standard solution were shaken (250 rpm) and extracted for 3 h. The concentrations of lactic, acetic, and butyric acid of the extracts were analyzed by high-performance liquid chromatography (HPLC; Summit, Thermo Fisher Scientific, Reinach, Switzerland) equipped with a nucleogel ION 300 OA 300 × 7.8 mm column (Macherey-Nagel, Düren, Germany) and a Shodex RI-101 refractive index detector (Shodex, Munich, Germany).

2.3.2. General Analyses

For chemical analysis, silage and feces samples were lyophilized (Christ, Osterode, Germany); all other feed samples were dried at 60 °C for 24 h. All samples were ground to pass a 1 mm screen (Brabender mill, Brabender, Duisburg, Germany). The DM and ash concentrations of feeds and feces were determined gravimetrically by oven-drying at 105 °C for 3 h and ashing at 550 °C until constant weight was attained (prepAsh, Precisa Instruments AG, Dietikon, Switzerland). Crude lipids concentrations were determined as petrol ether extract after an acidic hydrolysis in boiling HCl for 1 h (Method 5.1.1, VDLUFA [14]). NDF (Method 6.5.1 [14]; assayed with heat-stable amylase and without sodium sulfite, expressed without residual ash), ADF (Method 6.5.2 [14]; expressed without residual ash), and acid detergent lignin (Method 6.5.3 [14]) were analyzed using a Fibretherm analyzer (Gerhardt, Königswinter, Germany). The total N concentrations of feeds, feces, urine (acidified), and milk were analyzed using the Kjeldahl method (ISO 5983-1:2005) and—for the feed—multiplied by 6.25 to calculate the CP concentration. Water-soluble carbohydrates were determined as described by Hall et al. [15]. Milk samples were analyzed for fat, protein, and lactose concentrations using Fourier-transform infrared spectrometry (Milkoscan FT 6000, Foss, Hillerød, Denmark). Milk urea concentration was determined using the UreaFil test kit (MEA 549 EC Milk Urease, Eurochem, Moscow, Russia). Urinary (non-acidified) and serum urea concentrations were determined by enzymatic treatment with urease (EC 3.5.1.5) and glutamate dehydrogenase (EC 1.4.1.2) using a commercial test kit (No 147116, Greiner-Diagnostic, Langenthal, Switzerland). The ruminal VFA profile was analyzed by HPLC as described in Section 2.3.1. Ruminal ammonia was determined colorimetrically with a commercial test kit (Urea liquicolor, Human, Wiesbaden, Germany).

2.3.3. Ruminal Microbiota Quantitative PCR Analysis

DNA extraction was performed using QIAamp Fast DNA Stool Mini Kit (Qiagen, Hombrechtikon, Switzerland) following the manufacturer’s instructions with slight modifications. Briefly, 2 mL of ruminal fluid were centrifuged at 6500× g for 30 min at 4 °C. The pellet was then resuspended in 2 mL of Inhibitex (provided with the mentioned kit) and heated at 90 °C for 5 min. The tubes were allowed to return to room temperature before 15 s vortexing and further centrifuged at 16,000× g for 1 min at room temperature. Afterwards, 200 µL of the supernatant were used for DNA extraction following the kit’s procedure. DNA quantity was determined by spectrophotometry using a NanoDrop 1000 (Witec AG, Luzern, Switzerland). The quality of the extracted DNA was assessed by capillary electrophoresis using a Fragment Analyzer (Agilent technologies, Basel, Switzerland). The primers used in this study were previously described [13,16,17]. The primers were purchased in desalted quality (Microsynth, Balgach, Switzerland). Four micrograms of genomic DNA were used for amplification in the same conditions as previously described [13]. A reference sample was generated using a mixture of DNA derived from five different random ruminal fluids. The percentage of each considered strain in relation to total bacterial 16S ribosomal DNA (determined by amplification using GenBac primers) was calculated for the reference sample using the described formula [13]. For all the other samples, an induction fold was calculated relative to the abundance in the reference sample using a ∆∆Ct method with efficiency correction [18] and the EcoStudy software (Labgene, Châtel-Saint-Denis, Switzerland). The induction fold was then multiplied by the percentage calculated for the reference sample.

2.3.4. Feed Crude Protein Fractionation

Crude protein was categorized into five subfractions (i.e., A, B1, B2, B3, and C) based on the CNCPS [9]. For this purpose, TP, buffer-insoluble CP, neutral detergent-insoluble CP, and acid detergent-insoluble CP were specified according to standardizations of Licitra et al. [10] using Kjeldahl digestion to determine N (Method 4.1.1; VDLUFA [14]). All analyses were carried out in triplicate. In short, fraction A, which was NPN multiplied by 6.25, was calculated as CP minus TP precipitated with tungstic acid. Fraction B1 was TP soluble in borate-phosphate buffer. Fraction B2 was buffer-insoluble CP minus neutral detergent-insoluble CP. Fraction B3 was neutral detergent-insoluble CP minus acid detergent-insoluble CP. Fraction C corresponded to acid detergent-insoluble CP.

2.3.5. Enzymatic In Vitro Estimation of RUP and RUP Intestinal Digestibility

Streptomyces griseus protease was used to simulate ruminal protein degradation and estimate RUP [19,20] following the forage-specific description of Edmunds et al. [8]. The samples were incubated for 1 h at 39 °C in borate-phosphate buffer before adding the protease solution (0.58 U/mL; Type XIV, ≥3.5 units/mg solid, P5147, Sigma-Aldrich, St. Louis, MO, USA) in an amount corresponding to 24 U/g TP determined using trichloroacetic acid as a precipitating agent [10]. After 24 h of incubation, the contents were filtered through a FibreBag (30 µm pore size, Gerhardt, Königswinter, Germany). In contrast to the procedure of Edmunds et al. [8], no vacuum was used for filtration, and rinsing of the FibreBags was replaced by washing in a beaker with fresh deionized water for 10 times [21]. FibreBags were freeze-dried, and the residues analyzed for N concentration using the Dumas combustion method (Method 4.1.2; VDLUFA [14]; rapid N cube, Elementar Analysensysteme, Hanau, Germany). Each sample was incubated in duplicate in two different runs, and RUPENZ (g/kg CP) was calculated as the amount of CP in the residue divided by incubated amount of CP, multiplied by 1000.
The residues from protease incubation were further used to estimate intestinal digestibility of RUP (IPD) [21,22]. The procedure was modified to account for the higher volume of residues from forage compared to concentrate by reducing the sample weight used for incubation and proportionately adjusting the enzyme dosage. In short, the residues were weighed into 50 mL centrifugation tubes in an amount including 7.5 mg N. After addition of 10 mL of a 0.1 N HCl solution (pH 1.9) containing 0.5 g/L of pepsin (P7012, Sigma-Aldrich, St. Louis, MO, USA), the tubes were incubated for 1 h in a shaking water bath at 38 °C. Subsequently, the solution was neutralized with 0.5 mL of 1 N NaOH, and 13.5 mL of phosphate buffer (pH 7.8; containing 1.5 g/L of pancreatin, P7545, Sigma-Aldrich, St. Louis, MO, USA) was added to each tube. After incubation for 24 h and vortexing every 8 h, 3 mL of trichloroacetic acid (1000 g/L) was pipetted into each tube to stop or minimize the enzymatic action and precipitate the undigested protein. The tubes were put on ice, and the contents were filtrated through filter paper (MN 640w, Macherey-Nagel, Düren, Germany). The residue on the filter paper was analyzed for insoluble N using the Kjeldahl procedure (Method 4.1.1, VDLUFA [14]). Pepsin–pancreatin incubation was carried out in triplicate. For calculation of IPD, N soluble in trichloroacetic acid was divided by N incubated in pepsin–pancreatin.

2.3.6. In Vitro Estimation of Utilizable Crude Protein at the Duodenum

A modified Hohenheim gas test was carried out to estimate utilizable CP at the duodenum (uCP). Based on the instructions of Menke and Steingass [23], modifications outlined by Steingaß and Südekum [24] and described in detail by Edmunds et al. [25] were applied. In short, 200–250 mg of feed was incubated in glass syringes with a ruminal fluid–buffer solution for 8 and 48 h. Ruminal fluid was obtained from two cannulated Holstein steers prior to morning feeding. The steers received a diet of grass hay (107 g CP and 5.40 MJ net energy for lactation (NEL) per kg DM) and concentrate feed (216 g CP and 7.6 MJ NEL per kg DM) in a ratio of 60:40 corresponding to their maintenance energy requirements. Each sample was incubated in duplicate for each time point within one run. Three runs were carried out, using ruminal fluid from different days. Additionally, two blanks containing only ruminal fluid–buffer solution were incubated for each time point within each run. After incubation, syringes where put on ice in order to stop the fermentation, and the quantity (mg) of ammonia-N was measured in the samples (ammonia-Nsample) and blanks (ammonia-Nblank) using automated distillation (Vapodest 50 s carousel, Gerhardt, Königswinter, Germany). For both 8 and 48 h, uCP (g/kg DM) was calculated as follows:
uCP = ((Nsample − (ammonia-Nsample − ammonia-Nblank))/weightsample) × 6.25 × 1000,
where Nsample is total N added by sample (mg), weightsample is the amount of sample incubated expressed as mg DM, and other variables are as described above. Linear regression of uCP values at 8 and 48 h to the natural logarithm (ln) of time allowed for the calculation of effective uCP for an assumed ruminal passage rate (Kp) of 0.05/h through calculating the function value of ln (20).

2.4. Calculations and Statistical Analysis

The concentrations of NEL and absorbable protein in the small intestine (APD) in the conserved herbages were estimated according to Swiss nutrient recommendations for ruminants (Agroscope [26]). First, organic matter (OM) digestibility (%) was calculated on the basis of regression equations for balanced mixed swards including mainly ryegrass [26]:
OM digestibility of silage = 16.9 + 0.0864 CP + 0.3815 ADF − 0.000125 CP2 − 0.000755 ADF2,
OM digestibility of hay = 27.3 + 0.0924 CP + 0.2846 ADF − 0.000162 CP2 − 0.000581 ADF2,
where CP and ADF are in g/kg of OM. In the results section, the calculated OM digestibility was expressed as a coefficient.
To further estimate NEL concentrations (MJ/kg DM), metabolizable energy (ME)—estimated from the calculated OM digestibility—and gross energy (GE)—estimated from OM and CP concentrations—were used [26]:
NEL = (0.463 + 0.24 ME/GE) × ME × 0.9752,
The APD (g/kg DM), when ruminally fermentable energy (APDE) or N (APDN) limits microbial protein synthesis in the rumen, was calculated as follows [26]:
APDE = 0.093 × FOM + CP × (1.11 × (1 − deCP/100)) × dAAF/100,
APDN = CP × (deCP/100 − 0.10) × 0.64 + CP × (1.11 × (1 − deCP/100)) × dAAF/100,
where CP is given in g/kg DM, FOM is fermentable OM (g/kg DM), deCP is degradability of CP (%), and dAAF is digestibility of amino acids (AA) in the feed (%). The values of FOM, deCP, and dAAF were calculated according to Agroscope [26].
Assuming a Kp of 0.05/h, RUP was estimated from chemical CP fractionation (RUPCHE; g/kg CP) on the basis of the equation of Kirchhof [11]:
RUPCHE = 321.9023 + (0.1676 × PADF) + (−0.0022 × (CP × (A + B1))) + (0.0001 × (CP × C2)),
where PADF (g/kg DM) refers to ADF estimated from the residue after boiling in acid detergent solution according to Licitra et al. [10], CP is in g/kg DM, and CP fractions are in g/kg CP.
The potential prececal CP digestibility (fraction of CP) was calculated from CP concentration (g/kg DM), RUPENZ (g/kg CP), and IPD (fraction of RUP) estimated in vitro as follows:
Potential prececal CP digestibility = (CP × (1000 − RUPENZ)/1000 + (CP × RUPENZ/1000 × IPD))/CP,
The apparent total tract digestibility of OM was calculated from the daily amounts of OM in feed and feces and then used to calculate the intake of digestible OM. Nitrogen balance was calculated as N intake minus N excretion via milk, urine, and feces and expressed as g/d. Balances of uCP and APDE were calculated as dry matter intake (DMI) × feed concentration of uCP or APDE, respectively, minus the requirements estimated from the German feed evaluation system (GfE [27]) and from Agroscope [26] for uCP and APDE, respectively. Energy-corrected milk yield (ECM) was calculated on a 4.0% fat, 3.2% protein, and 4.8% lactose basis [26].
Statistical analysis was done using the SAS 9.4 software (SAS Institute Inc., Cary, NC, USA). Data on feed intake and digestibility, N intake and excretion, milk yield and composition, ruminal VFA and ammonia concentrations, serum urea concentrations and ruminal microbiota were analyzed with PROC MIXED of SAS with conservation method and experimental period as fixed effects and cow as random effect. The results are expressed as least-squares means, and the differences were tested with Tukey’s test. Significance was defined at p < 0.05, and tendencies were declared for p = 0.05 to p < 0.10.

3. Results

3.1. Characteristics of Conserved Herbage

Silage displayed a pH of 5.5, and the concentrations of lactic, acetic, and butyric acid were 27, 5 and 1 g/kg DM, respectively. The results on the chemical composition of the forages are given in Table 1. The chemical composition was similar between types of forage, with NDF revealing the highest variation. The concentrations of CP and NEL (Table 1) as well as the calculated OM digestibility (Table 1) were slightly higher in SI compared to both types of hay. Silage also displayed the highest APDN but the lowest APDE concentrations (Table 1). The concentrations of APDN were higher than those of APDE for all types of forage (Table 1).
Crude protein fractions B1 and C were similar for all types of forages, whereas the other fractions showed some variation (Table 2). Specifically, CP fraction A was almost 200 g/kg CP higher in SI compared to BH and FH. Crude protein fraction B3 was lowest in SI, highest in FH, and intermediate in BH. The estimated concentrations of uCP were on average 157 g/kg DM (Table 2). The estimation from both CP fractions and the enzymatic in vitro method resulted in a similar pattern of RUP values, with the lowest values for SI, the highest values for FH, and BH being intermediate (Table 2). The estimated IPD was below 0.50 for SI, BH, and FH (Table 2).

3.2. Feed Intake and Digestibility

Dry matter intake during the collection periods tended to be lower (p = 0.05) for SI compared to BH, while the intake of FH did not differ from the other treatments (Table 3). The apparent total tract digestibility of OM was lower for FH compared to SI (p = 0.01; Table 3). The apparent digestibility of NDF was not affected by the conservation method, but the apparent digestibility of ADF was or tended to be higher for SI compared to FH (p = 0.02) and BH (p = 0.09). The intake of digestible OM tended to be higher for BH compared to SI (p = 0.08) and FH (p = 0.09).

3.3. N Intake, Digestibility, and Excretion in Milk, Urine, and Feces

Urine volume was not statistically different between treatments and was, on average, 46.3 L/d (Table 4). Table 4 shows the results for N intake, digestibility, and excretion. The daily N intake of cows fed SI was not different compared to the intake of cows fed BH or FH, but cows fed BH had higher (p = 0.02) N intake than cows fed FH. Feeding FH compared to SI (p = 0.001) or BH (p = 0.01) resulted in lower apparent total tract digestibility of N. The excretion of N in milk tended to be higher for cows fed BH compared to those fed FH (p = 0.08) and SI (p = 0.07). Fecal N excretion was 177 g/d on average and similar for all forage types. Urinary N excretion (g/d) tended to be higher (p = 0.06) when cows were fed SI compared to FH but was not different for BH compared to the other conservation methods. Urinary N excretion expressed as proportion of N intake did not differ between treatments. The N balance was negative (−27.2 g/d, on average) for all cows and not affected by the conservation method. Fecal N expressed as a proportion of N intake was higher for cows fed FH compared to cows fed SI (p = 0.001) and BH (p = 0.01). The proportion of milk N of total N intake (N use efficiency, NUE) did not differ between treatments and was, on average, 21%. The urine of cows fed SI (p = 0.01) and BH (p = 0.04) had higher concentrations of urea compared to the urine of cows fed FH. Also, the amount (g/d) of urinary N excretion in the form of urea (UUN) was higher for cows fed SI (p = 0.01) and tended to be higher (p = 0.05) for cows fed BH compared to FH. The daily excretion of urinary non-urea N (UNUN) was not affected by the conservation method and, on average, comprised 0.19 of total urinary N excretion.

3.4. Milk Yield and Composition

The results for milk yield and composition are shown in Table 5. The type of forage had no significant effect on milk fat and protein percentages. There was a tendency for milk yield (p = 0.09) and ECM (p = 0.09) to be higher for BH compared to FH. Milk protein yield tended to be higher when the cows were fed BH compared to SI (p = 0.07) and FH (p = 0.08). Milk urea concentration was higher for cows fed SI (p < 0.001) or BH (p = 0.003) compared to cows fed FH.

3.5. Ruminal Fluid Ammonia and Volatile Fatty Acids and Serum Urea

Ammonia concentration was higher (p = 0.04) in the ruminal fluid of cows fed BH compared to cows fed FH, whereas it was not different for SI compared to BH and FH (Table 6). The total concentration of VFA in the ruminal fluid as well as the proportions of individual VFA did not differ between treatments (Table 6). Serum urea concentration was higher (p = 0.001) in cows fed BH and SI compared to those fed FH (Table 6).

3.6. Ruminal Microbiota Quantification

Feeding differently conserved herbages did not affect the relative abundances of Lactobacillus spp. and Fibrobacter succinogenes but influenced those of the other examined bacterial species (Table 7). When cows were fed SI compared to FH, Prevotella spp. displayed higher (p = 0.02) relative abundances, while the levels of Butyrivibrio fibrisolvens were lower (p = 0.01). B. fibrisolvens relative abundance also tended (p = 0.07) to be lower in the ruminal fluid of cows fed BH compared to FH. The abundances of the Ruminococcus species albus (p = 0.03) and flavefaciens (p = 0.04) were lower when feeding BH compared to FH. For R. albus, a lower relative abundance was also observed in the ruminal fluid of cows fed BH compared to SI (p = 0.01).

4. Discussion

The feed characteristics of the differently conserved herbages reflected typical effects of the conservation method, such as lower and higher concentrations of DM and CP fraction A, respectively, in silages compared to hay. A trend towards lower CP and higher fiber concentrations from SI over BH to FH could be related to longer wilting time, increased mechanical processing, and an associated loss of leaf material. Generally, the production of barn-dried hay can result in considerably lower DM losses from cutting to feeding compared to field-dried hay and, in some cases, also to silage [28]. The duration until inhibition of respiration either by anaerobic conditions in silage or by low moisture in hay has a large impact on forage quality [28,29]. Consequently, NEL concentrations were the highest for SI and the lowest for FH, which underwent the longest time until stable DM conditions were reached.
The silage had a relatively high DM concentration and, therefore, the fermentation process was limited, as reflected in the low concentration of lactic acid. However, silage fermentation quality was “very good” when assessed with the scheme of the German Agricultural Society (DLG [30]) based on the concentrations of acetic acid and butyric acid and the pH value. Fermentation quality is linked to DM concentration in grass silages, which is why higher DM concentrations can increase feed intake [31]. A considerably higher feed intake for hay compared to silage has been reported [32,33]. However, the effect is dependent on a variety of characteristics often related to silage quality [34], not clearly demonstrated by literature data [2] and, in the current study, was visible only for BH but not for FH. The intake by sheep was higher for barn-dried hay compared to field-dried hay, possibly due to higher OM digestibility [35]. In the current study, apparent total tract OM digestibility was not significantly different between FH and BH, but it was higher for SI compared to FH. This could be related to lower concentration (NDF) and higher digestibility (ADF) of fiber in SI. Higher CP (or N) digestibility and, specifically, degradation in the rumen [36] may also have contributed to higher OM digestibility in SI, but quantitative aspects of ruminal OM or CP degradation were not investigated here. However, ruminal VFA concentrations were analyzed. Friggens et al. [37] discussed considerable differences in the molar proportions of VFA in the ruminal fluid when feeding silage versus hay. In other studies, moderate effects on single VFA were observed [38,39]. In contrast, neither total concentrations nor molar proportions of VFA were affected by the conservation method in the current study. The lack of effect may be due to the silage being relatively dry and restrictedly fermented and thus yielding lower propionate proportions of VFA compared to extensively fermented silages [39]. The proportions of acetate and propionate were higher and lower, respectively, than reported by other authors when comparing hay and silage feeding [38,39], presumably due to an at least moderate supplementation of concentrate in the latter studies.
In addition to VFA, the relative abundances of ruminal bacteria were evaluated via quantitative PCR. Prevotella spp. represented the majority of bacteria, consistent with earlier observations [40]. The higher abundance in the ruminal fluid from cows fed SI compared to FH could be related to better accessibility of feed protein, as Prevotella are known for proteolytic and peptidolytic activity [41]. B. fibrisolvens also displays proteolytic activity [41] and was elevated through feeding FH compared to SI, but its overall relative abundances were low. Carbohydrate-degrading bacteria F. succinognenes, R. albus, and R. flavefaciens showed together a high relative abundance, presumably reflecting the forage-only diet. The conservation method affected R. albus and R. flavefaciens relative abundances, but the effect was not consistent.
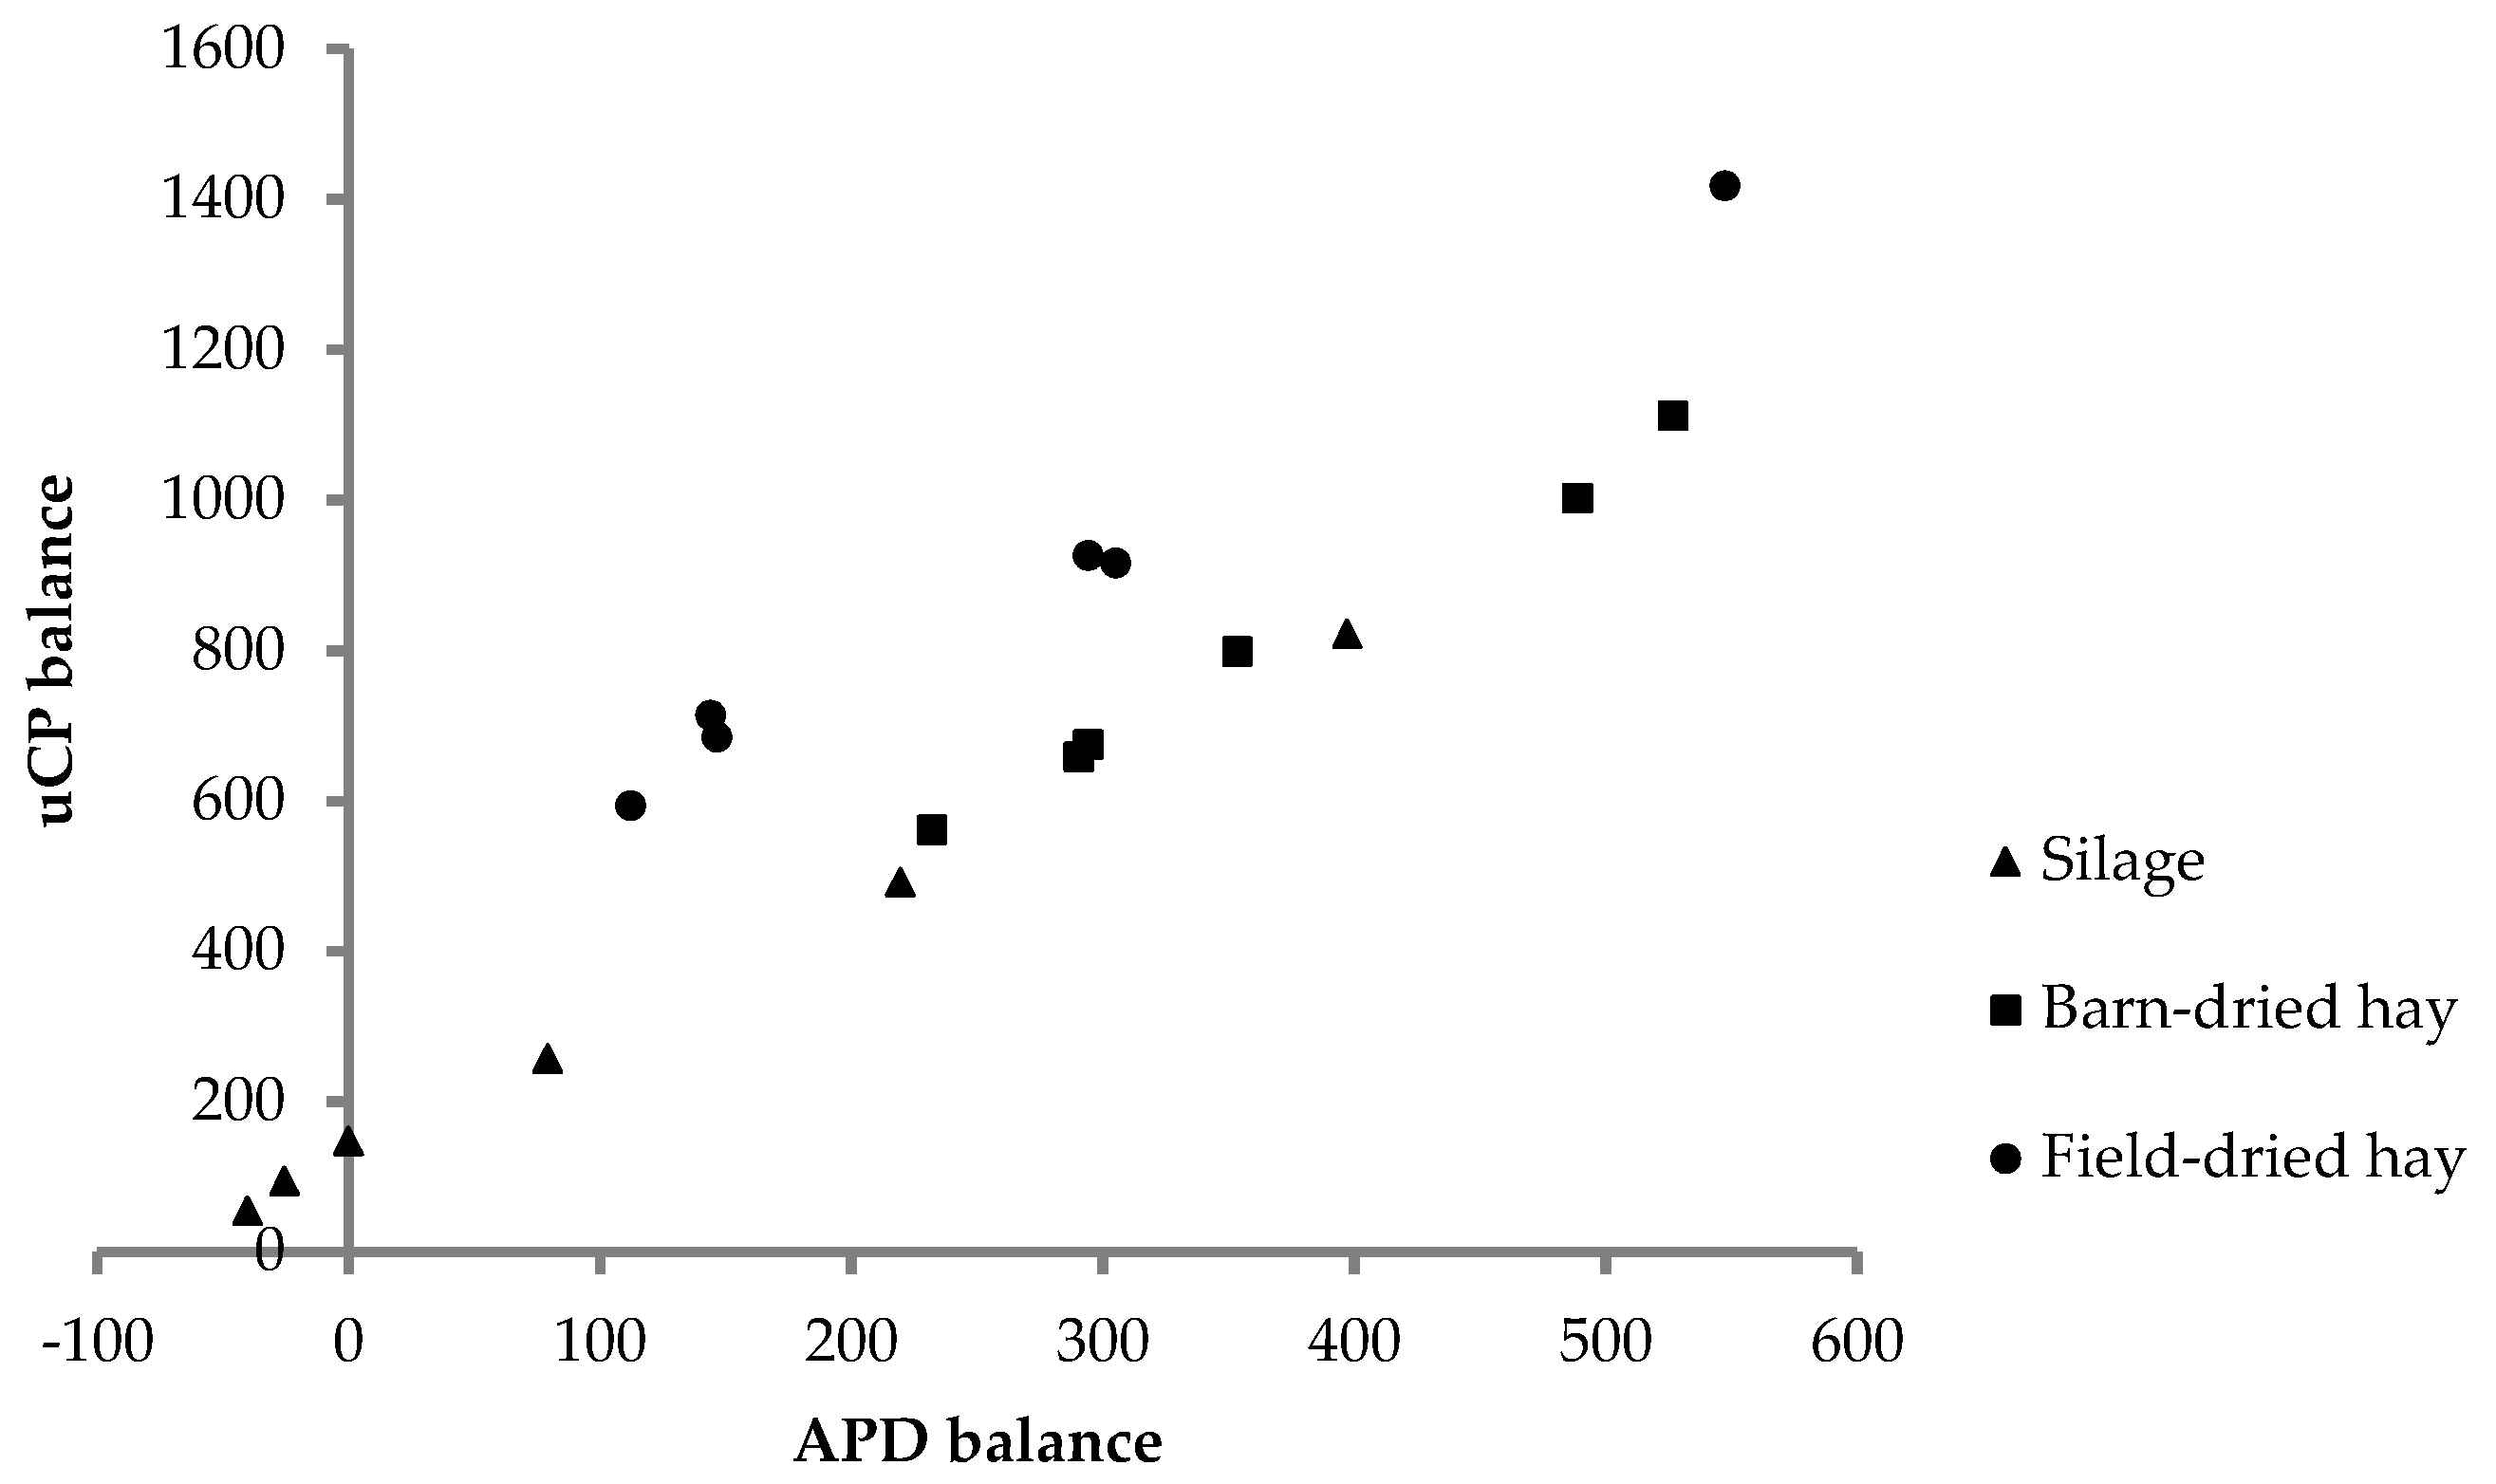
The focus of our study was on N balance and utilization. Dry matter intake of feed from all conservation methods was high, given the cows were in late lactation. Combined with the high dietary CP concentrations, this led to high intake of N. Further, intake of uCP calculated from the concentration of uCP estimated in vitro and feed intake exceeded uCP requirements [27] (Figure 1). Similarly, APD intake was in excess with respect to the requirements [26], except for two cows in two periods (Figure 1).
As a consequence of excess dietary N intake, urinary N excretion amounted to around 0.5 of N intake. Urine as the main route of surplus N excretion has been observed for various diet compositions (e.g., [42,43,44]). Regulatory N excretion via urine is in the form of urea [45], which could also be observed in the current experiment, where feeding FH resulted in both the lowest N intake and the lowest UUN excretion. In contrast, UNUN excretion was similar for all treatments and as such not affected by different N intakes. The observed UNUN excretion was also very close to the value of 51.9 g/d estimated by Spek et al. [46]. Moreover, UNUN was around 3 g/kg DMI and thus consistent with the values reported in a literature review by Pfeffer et al. [45], who concluded that UNUN excretion mostly is <4 g/kg DMI.
Similar to UNUN, fecal N excretion did not differ between treatments and was approximately 10 g/kg DMI. This value is in line with collated literature data and can be viewed as obligatory and not related to the regulation of N in the body pool [45]. However, fecal N excretion expressed as proportion of N intake decreases with higher N intake [47]. Thus, a higher percentage of fecal N excretion related to N intake for FH was most likely an artifact of slight differences in feed intake and CP concentration of the herbages, resulting in lower daily N intake for FH. In contrast to fecal N excretion, the proportion of UNUN in urinary N was not significantly affected by the treatment, which is not consistent with the concept of UNUN seen as obligatory excretion. The fact that less N had to be disposed of when FH was fed was visible not only in UUN excretion but also in lower urea concentrations in serum and milk of cows fed FH.
Even though differences in N intake certainly explain a significant share of the observed effects on urea concentrations, feed protein characteristics may also play a role. Field-dried hay displayed the lowest apparent total tract digestibility of N. This is in line with the lower potential of prececal CP digestibility indicated by the enzymatic in vitro method. Moreover, RUP values estimated from CP fractionation and in vitro incubation in S. griseus protease solution indicated lower ruminal CP degradability for FH, which was also reflected in lower ruminal ammonia concentration for FH compared to BH. However, SI displayed higher concentrations of CP, which in addition contained a higher proportion of NPN. This should theoretically have led to higher ruminal ammonia concentrations for SI compared to FH, which was not the case. A possible explanation could be the fact that the ruminal fluid was collected before the morning feeding. At this time point, ammonia rapidly released from dietary NPN can already be absorbed. Moreover, significant amounts of soluble N fractions from silage, including non-ammonia NPN, may escape from the rumen [48]. In contrast, protein degradation in BH and FH will have proceeded more steadily.
Crude protein fractionation revealed the highest proportion of fraction B3 in FH. In a study by Edmunds et al. [8], 60% of the variation in RUP in silages and dried forages could be assigned to differences in CP fraction B3. In sheep, Verbič et al. [36] found a lower ruminal CP degradability of hay compared to differently prepared silages from the same parent material. However, it cannot be determined if the observed results indicating lower N turnover and clearance for FH were due to lower N intake, lower ruminal CP degradability, or a combined effect. While the effect of increased dietary RUP concentration is debated, reducing N supply is a commonly recommended measure to reduce N excretion and increase NUE [47], also in grass-based diets [49,50].
Feeding SI and BH resulted in similar N intake. The observed pattern of CP fractions and in vitro and chemical RUP estimation indicated that BH delivered higher amounts of RUP to the animals, which could have led to the observed tendencies for higher milk N excretion and milk protein yield in cows fed BH compared to SI. However, there was also a tendency towards a higher intake of feed and particularly digestible OM for BH compared to SI. On the other hand, neither partitioning of N excretion nor urea concentrations in milk and serum differed between feeding BH and SI, contradictory to our hypothesis that N utilization would be improved by feeding hay compared to silage. True protein in SI still contributed >500 g/kg CP. Much lower TP concentrations can be reached as a result of protein breakdown even in well-fermented silages [51]. The silage produced in this experiment was relatively dry due to constant dry weather conditions during the wilting period on the field. Possibly, stronger effects of ensiling compared to drying of herbage could have been expected if silage with lower DM concentrations had been produced. In particular, concentrations of TP, RUP, and uCP may be lower in silages with lower DM concentrations [52]. Furthermore, DM concentrations in grass-clover silages are positively correlated to the duodenal flow of microbial CP [53]. However, even if RUP supply was actually different between SI and BH, excess supply of feed CP by both treatments may have prevented possible positive effects of an increased dietary RUP concentration on NUE [54].
The enzymatic estimation revealed similar but low IPD values for herbage from all three conservation methods. This indicates that a large proportion of RUP consisted of fiber-bound N and, hence, was not accessible for enzymatic digestion in the small intestine. However, IPD was lower than the values for grass products reported in the literature [55,56], but it has to be noted that methods differed. Edmunds et al. [57] demonstrated that the AA pattern of forage protein is altered during ruminal incubation but does not widely differ between RUP from differently conserved forages. For the current study, this would imply that only total supply and not quality in terms of intestinal digestibility and AA pattern of RUP differed between forages.
Overall, NUE was low, as N excreted in milk was only 20–22% of N intake. These values correspond well to the efficiency of N utilization observed for the lower quartile in collated data of Calsamiglia et al. [58]. Interestingly, the CP concentration in forage that Calsamiglia et al. [58] estimated for this quartile was almost equal to the CP concentration of the conserved forages in the current experiment. For diets mainly based on grass silage, NUE estimated from collated feeding trial data was 27.7% [59]. However, the reported minimum and maximum NUE values were as low as 16.0 and as high as 40.2%, respectively [59]. Reports of NUE in dairy cows receiving only conserved forage are scarce. Shingfield et al. [39] observed slightly higher NUE for hay compared to differently treated silages prepared from the same mixed swards (timothy and meadow fescue). However, concentrate supplementation was part of the experiment, and the level of NUE was around 30%. A similar mean value was demonstrated for cows fed grass-clover silage supplemented with concentrate [60]. Low NUE of around 20–25% were also reported for cows grazing ryegrass pasture with only moderate concentrate supplementation [61].
The utilization of N seems particularly low, given the fact that adequate or surplus supply of APD and uCP was accompanied by a negative N balance. Moreover, N intake of cows largely exceeded the requirements to maintain a stable N balance calculated by Pfeffer et al. [45]. A negative N balance indicates a mobilization of body protein. This can occur during non-sufficient dietary supply of N, when AA from the skeletal muscle protein are used for milk protein synthesis [62]. However, in the current experiment, a shortage of dietary N supply was precisely not likely, and thus AA from degraded body protein would not have been essential for milk protein synthesis. Instead, it is more likely that AA from skeletal muscle protein were used for energy supply [62], and the amino group of AA was disposed of as urea and excreted via urine. In fact, except for one cow, all cows lost body weight over the course of the complete trial (body weight change from −49.9 to +1.9 kg, average −23.6 kg). Milk yields were moderate, but high milk protein and fat concentrations elevated ECM. The requirements of NEL [27] were not met by the actual intake for five of the six cows, and the mean estimated NEL balance was −9.2 MJ/d. Hence, the assumptions of Pfeffer et al. [45] regarding N supply to maintain a stable N balance were not met in this study. Negative energy balance is of major significance during early lactation, when substantial amounts of body protein can be mobilized along with body fat despite sufficient dietary CP supply [63]. However, the proportion of mobilized body protein in total mobilized tissue decreases fast after parturition, and protein balance can become positive after four weeks of lactation [64]. In contrast, the cows in the current experiment were in late lactation, where energy supply under most feeding regimes is not limited.
Balancing dietary energy and protein supply to maximize N utilization is primarily discussed concerning ruminal metabolism [65]. Energy supply matching N supply may lead to the efficient use of N for microbial growth and help in capturing rapidly released ammonia, e.g., in silages. However, the current results should also be seen in the light of adequate postabsorptive energy supply, which may improve AA uptake in the mammary gland independently from protein supply [66]. In this regard, Tamminga [67] discussed postabsorptive N losses due to an imbalance between energy and AA availability at the tissue level. This also has a practical implication for herbage-dominated feeding systems without supplementary concentrate. These systems can result in a “high metabolic load in high-yielding dairy cows during early lactation” [68]. Although the cows in the current study were not in early lactation, and milk yields were moderate, the loss of body weight and a negative NEL balance point to the fact that high metabolic loads may have occurred nonetheless.
When feeding only forage, balancing the supply of energy and CP is a challenge. Harvest and conservation of herbage are weather-dependent and thus offer limited opportunities to modify both energy and CP concentrations to the desired level. From a study with grass silages, Dewhurst et al. [69] clearly concluded that in order to maximize the utilization of grass silage N, crops with higher energy and lower CP concentrations are needed. The results from the current experiments underline this conclusion and further indicate that it can be extended to herbage conserved as hay. Similar suggestions have been made with regard to pasture systems, where high N concentrations in ryegrass and clover result in high N losses [49]. Energy may become first limiting, and N be used less efficiently when cows are fed pasture without supplementation [70].

5. Conclusions

Although the cows in this study were in late lactation, feeding only forage derived from herbage resulted in negative N and energy balances regardless of the method of conservation. Contradictory to our hypothesis, the utilization of feed N for milk N was not different between cows fed SI, BH, and FH. From chemical and in vitro estimations, it could be concluded that the conservation method had considerable effects on CP composition and protein value of the forages. These differences were not or only moderately reflected in the animals’ responses, which can be explained by the fact that N supply exceeded the requirements for all three treatments. Lower urea concentrations in serum, milk, and urine when FH was fed were likely due to the lower N intake observed for FH. The effects of the different conservation methods will be presumably more pronounced when (i) silage exhibits lower DM concentration, (ii) the supply of total CP, APD, and uCP is not in excess, and (iii) the energy supply is not limited. This has implications for future research on comparing forage conservation methods, e.g., silage DM concentration and energy supply have to be considered in new study designs. In addition, these aspects should be addressed in practical feeding situations where dairy cows are fed solely on herbage.

Author Contributions

Conceptualization, F.D.-M., K.-H.S., and U.W.; methodology, C.B., P.S., F.D.-M., K.-H.S., and U.W.; validation, C.B., P.S., F.D.-M., K.-H.S., and U.W.; formal analysis, C.B., P.S., F.D.-M., and U.W.; investigation, C.B., P.S., and U.W.; data curation, C.B., P.S., and U.W.; writing—original draft preparation, C.B.; writing—review and editing, C.B., P.S., F.D.-M., K.-H.S., and U.W.; visualization, C.B.; supervision, F.D.-M. and K.-H.S.; project administration, F.D.-M. and U.W.; funding acquisition, F.D.-M. and U.W.

Funding

This research was funded by Arbeitsgemeinschaft zur Förderung des Futterbaues AGFF, Zürich, Switzerland.

Acknowledgments

The authors thank the animal husbandry and laboratory staff at Agroscope Posieux and Institute of Animal Science, Bonn, and J.-L. Oberson for his advice in conducting the N balance trial. D. Latzke and A. Saßenbach are gratefully acknowledged for carrying out the modified Hohenheim gas test and the enzymatic in vitro method, respectively.

Conflicts of Interest

The authors declare no conflict of interest. The funders had no role in the design of the study; in the collection, analyses, or interpretation of data; in the writing of the manuscript, or in the decision to publish the results.

Abbreviations

Acrude protein fraction according to the Cornell Net Carbohydrate and Protein System
AAamino acid(s)
ADFacid detergent fiber
APDabsorbable protein in the small intestine
APDEabsorbable protein in the small intestine when ruminally fermentable energy limits microbial protein synthesis in the rumen
APDNabsorbable protein in the small intestine when N limits microbial protein synthesis in the rumen
B1crude protein fraction according to the Cornell Net Carbohydrate and Protein System
B2crude protein fraction according to the Cornell Net Carbohydrate and Protein System
B3crude protein fraction according to the Cornell Net Carbohydrate and Protein System
BHbarn-dried hay
Ccrude protein fraction according to the Cornell Net Carbohydrate and Protein System
CNCPSCornell Net Carbohydrate and Protein System
CPcrude protein
DMdry matter
dAAFdigestibility of amino acids in the feed
deCPdegradability of crude protein
DMIdry matter intake
ECMenergy-corrected milk yield
FHfield-dried hay
FOMfermentable organic matter
GEgross energy
HPLChigh-performance liquid chromatography
IPDintestinal digestibility of ruminally undegraded feed crude protein
Kpruminal passage rate
MEmetabolizable energy
NDFneutral detergent fiber
NELnet energy for lactation
NPNnon-protein N
NUEN use efficiency, i.e., proportion of milk N of total N intake
OMorganic matter
PADFacid detergent fiber estimated from the residue after boiling in acid detergent solution according to Licitra et al. [10]
PDOprotected designation of origin
RUPruminally undegraded feed crude protein
RUPCHEruminally undegraded feed crude protein estimated from chemical crude protein fractionation
RUPENZruminally undegraded feed crude protein estimated from in vitro protease incubation
SEMstandard error of the mean
SIsilage
TPtrue protein
uCPutilizable crude protein at the duodenum
UNUNurinary non-urea N
UUNurinary urea N
VFAvolatile fatty acids

References

  1. Wilkinson, J.M.; Lee, M.R.F. Review: Use of human-edible animal feeds by ruminant livestock. Animal 2018, 12, 1735–1743. [Google Scholar] [CrossRef] [PubMed]
  2. Südekum, K.-H.; Krizsan, S.J.; Gerlach, K. Forage quality evaluation—Current trends and future prospects. In The Multiple Roles of Grassland in the European Bioeconomy, Proceedings of the 26th General Meeting of the European Grassland Federation, Trondheim, Norway, 4–8 September 2016; Höglind, M., Bakken, A.K., Hovstad, K.A., Kallioniemi, E., Riley, H., Steinshamn, H., Østrem, L., Eds.; Wageningen Academic Publishers: Wageningen, The Netherlands, 2016; pp. 151–158. [Google Scholar]
  3. Anonymous. Specifications of Gruyère AOP. 2016. Available online: https://gruyere.com/content/ressources/cahier-des-charges-definitif-du-6-juillet-2001-anglais-aop-2014-v2016.pdf (accessed on 11 April 2019).
  4. Bertoni, G.; Calamari, L.; Maianti, M.G. Producing specific milks for speciality cheeses. Proc. Nutr. Soc. 2001, 60, 231–246. [Google Scholar] [CrossRef] [PubMed] [Green Version]
  5. Wyss, U.; Arrigo, Y.; Meisser, M.; Nydegger, F.; Boéchat, S.; Boessinger, M. Les facteurs de réussite de foin séché en grange à partir de l’expérience suisse. Fourrages 2011, 205, 3–10. [Google Scholar]
  6. McDonald, P.; Edwards, R.A. The influence of conservation methods on digestion and utilization of forages by ruminants. Proc. Nutr. Soc. 1976, 35, 201–211. [Google Scholar] [CrossRef] [PubMed] [Green Version]
  7. Givens, D.I.; Rulquin, H. Utilisation by ruminants of nitrogen compounds in silage-based diets. Anim. Feed Sci. Technol. 2004, 114, 1–18. [Google Scholar] [CrossRef]
  8. Edmunds, B.; Südekum, K.-H.; Spiekers, H.; Schwarz, F.J. Estimating ruminal crude protein degradation of forages using in situ and in vitro techniques. Anim. Feed Sci. Technol. 2012, 175, 95–105. [Google Scholar] [CrossRef]
  9. Sniffen, C.J.; O’Connor, J.D.; Van Soest, P.J.; Fox, D.G.; Russell, J.B. A net carbohydrate and protein system for evaluating cattle diets: II. Carbohydrate and protein availability. J. Anim. Sci. 1992, 70, 3562–3577. [Google Scholar] [CrossRef] [PubMed]
  10. Licitra, G.; Hernandez, T.M.; Van Soest, P.J. Standardization of procedures for nitrogen fractionation of ruminant feeds. Anim. Feed Sci. Technol. 1996, 57, 347–358. [Google Scholar] [CrossRef]
  11. Kirchhof, S. Kinetik des ruminalen in situ-Nährstoffabbaus von Grünlandaufwüchsen des Alpenraumes unterschiedlicher Vegetationsstadien sowie von Maissilagen und Heu—ein Beitrag zur Weiterentwicklung der Rationsgestaltung für Milchkühe. Ph.D. Thesis, Christian-Albrechts-Universität, Kiel, Germany, 2007. [Google Scholar]
  12. Wilkins, R.J.; Wilkinson, J.M. Major contributions in 45 years of International Silage Conferences. In Proceedings of the XVII International Silage Conference, Piracicaba, Brazil, 1–3 July 2015; Daniel, J.L.P., Morais, G., Junges, D., Nussio, L.G., Eds.; ESALQ: Piracicaba, Brazil, 2015; pp. 26–50. [Google Scholar]
  13. Grosse Brinkhaus, A.; Bee, G.; Silacci, P.; Kreuzer, M.; Dohme-Meier, F. Effect of exchanging Onobrychis viciifolia and Lotus corniculatus for Medicago sativa on ruminal fermentation and nitrogen turnover in dairy cows. J. Dairy Sci. 2016, 99, 4384–4397. [Google Scholar] [CrossRef] [PubMed]
  14. Verband Deutscher Landwirtschaftlicher Untersuchungs-und Forschungsanstalten. Handbuch der Landwirtschaftlichen Versuchs- und Untersuchungsmethodik (VDLUFA-Methodenbuch), Bd. III. Die Chemische Untersuchung von Futtermitteln; VDLUFA-Verlag: Darmstadt, Germany, 2012. [Google Scholar]
  15. Hall, M.B.; Hoover, W.H.; Jennings, J.P.; Miller Webster, T.K. A method for partitioning neutral detergent-soluble carbohydrates. J. Sci. Food Agric. 1999, 79, 2079–2086. [Google Scholar] [CrossRef]
  16. Metzler-Zebeli, B.U.; Hooda, S.; Pieper, R.; Zijlstra, R.T.; van Kessel, A.G.; Mosenthin, R.; Gänzle, M.G. Nonstarch polysaccharides modulate bacterial microbiota, pathways for butyrate production, and abundance of pathogenic Escherichia coli in the pig gastrointestinal tract. Appl. Environ. Microbiol. 2010, 76, 3692–3701. [Google Scholar] [CrossRef] [PubMed]
  17. Muyzer, G.; de Waal, E.C.; Uitterlinden, A.G. Profiling of complex microbial populations by denaturing gradient gel electrophoresis analysis of polymerase chain reaction-amplified genes coding for 16S rRNA. Appl. Environ. Microbiol. 1993, 59, 695–700. [Google Scholar] [PubMed]
  18. Pfaffl, M.W. A new mathematical model for relative quantification in real-time RT-PCR. Nucleic Acids Res. 2001, 29, e45. [Google Scholar] [CrossRef] [PubMed]
  19. Licitra, G.; Lauria, F.; Carpino, S.; Schadt, I.; Sniffen, C.J.; Van Soest, P.J. Improvement of the Streptomyces griseus method for degradable protein in ruminant feed. Anim. Feed Sci. Technol. 1998, 72, 1–10. [Google Scholar] [CrossRef]
  20. Licitra, G.; Van Soest, P.J.; Schadt, I.; Carpino, S.; Sniffen, C.J. Influence of the concentration of the protease from Streptomyces griseus relative to ruminal protein degradability. Anim. Feed Sci. Technol. 1999, 77, 99–113. [Google Scholar] [CrossRef]
  21. Böttger, C.; Südekum, K.-H. European distillers dried grains with solubles (DDGS): Chemical composition and in vitro evaluation of feeding value for ruminants. Anim. Feed Sci. Technol. 2017, 224, 66–77. [Google Scholar] [CrossRef]
  22. Irshaid, R. Estimating Intestinal Digestibility of Feedstuffs for Ruminants Using Three-Step In Situ-In Vitro and In Vitro Procedures. Ph.D. Thesis, Christian-Albrechts-Universität, Kiel, Germany, 2007. [Google Scholar]
  23. Menke, K.H.; Steingass, H. Estimation of the energetic feed value obtained from chemical analysis and in vitro gas production using rumen fluid. Anim. Res. Dev. 1988, 28, 7–55. [Google Scholar]
  24. Steingaß, H.; Südekum, K.-H. Proteinbewertung beim Wiederkäuer—Grundlagen, analytische Entwicklungen und Perspektiven. Übers. Tierernährg. 2013, 41, 51–73. [Google Scholar]
  25. Edmunds, B.; Südekum, K.-H.; Spiekers, H.; Schuster, M.; Schwarz, F.J. Estimating utilisable crude protein at the duodenum, a precursor to metabolisable protein for ruminants, from forages using a modified gas test. Anim. Feed Sci. Technol. 2012, 175, 106–113. [Google Scholar] [CrossRef]
  26. Agroscope. Fütterungsempfehlungen für Wiederkäuer (Grünes Buch). 2016. Available online: https://www.agroscope.admin.ch/agroscope/de/home/services/dienste/futtermittel/fuetterungsempfehlungen-wiederkaeuer.html (accessed on 11 April 2019).
  27. Gesellschaft für Ernährungsphysiologie. Empfehlungen zur Energie-und Nährstoffversorgung der Milchkühe und Aufzuchtrinder; DLG-Verlag: Frankfurt am Main, Germany, 2001. [Google Scholar]
  28. Carter, W.R.B. A review of nutrient losses and efficiency of conserving herbage as silage, barn-dried hay and field-cured hay. Grass Forage Sci. 1960, 15, 220–230. [Google Scholar] [CrossRef]
  29. McGechan, M.B. A review of losses arising during conservation of grass forage: Part 1, field losses. J. Agric. Eng. Res. 1989, 44, 1–21. [Google Scholar] [CrossRef]
  30. Deutsche Landwirtschafts-Gesellschaft. Grobfutterbewertung-Teil B—DLG-Schlüssel zur Beurteilung der Gärqualität von Grünfuttersilagen auf Basis der chemischen Untersuchung. DLG-Information 2/2006. 2006. Available online: https://www.dlg.org/fileadmin/downloads/fachinfos/futtermittel/grobfutterbewertung_B.pdf (accessed on 11 April 2019).
  31. Gerlach, K.; Roß, F.; Weiß, K.; Büscher, W.; Südekum, K.-H. Aerobic exposure of grass silages and its impact on dry matter intake and preference by goats. Small Rumin. Res. 2014, 117, 131–141. [Google Scholar] [CrossRef] [Green Version]
  32. Campling, R.C. The intake of hay and silage by cows. Grass Forage Sci. 1966, 21, 41–48. [Google Scholar] [CrossRef]
  33. Thiago, L.R.L.; Gill, M.; Dhanoa, M.S. Studies of method of conserving grass herbage and frequency of feeding in cattle: 1. Voluntary feed intake, digestion and rate of passage. Br. J. Nutr. 1992, 67, 305–318. [Google Scholar] [CrossRef] [PubMed]
  34. Huhtanen, P.; Rinne, M.; Nousiainen, J. Evaluation of the factors affecting silage intake of dairy cows: A revision of the relative silage dry-matter intake index. Animal 2007, 1, 758–770. [Google Scholar] [CrossRef] [PubMed]
  35. Demarquilly, C.; Jarrige, R. The effect of method of forage conservation on digestibility and voluntary intake. In Proceedings of the XI International Grassland Congress, Surfers Paradise, Australia, 13–23 April 1970; Norman, M.J.T., Ed.; University of Queensland Press: St. Lucia, Australia, 1970; pp. 733–737. [Google Scholar]
  36. Verbič, J.; Ørskov, E.R.; Žgajnar, J.; Chen, X.B.; Žnidaršič-Pongrac, V. The effect of method of forage preservation on the protein degradability and microbial protein synthesis in the rumen. Anim. Feed Sci. Technol. 1999, 82, 195–212. [Google Scholar] [CrossRef]
  37. Friggens, N.C.; Oldham, J.D.; Dewhurst, R.J.; Horgan, G. Proportions of volatile fatty acids in relation to the chemical composition of feeds based on grass silage. J. Dairy Sci. 1998, 81, 1331–1344. [Google Scholar] [CrossRef]
  38. Jaakkola, S.; Huhtanen, P. The effects of forage preservation method and proportion of concentrate on nitrogen digestion and rumen fermentation in cattle. Grass Forage Sci. 1993, 48, 146–154. [Google Scholar] [CrossRef]
  39. Shingfield, K.J.; Jaakkola, S.; Huhtanen, P. Effect of forage conservation method, concentrate level and propylene glycol on diet digestibility, rumen fermentation, blood metabolite concentrations and nutrient utilisation of dairy cows. Anim. Feed Sci. Technol. 2002, 97, 1–21. [Google Scholar] [CrossRef]
  40. Stevenson, D.M.; Weimer, P.J. Dominance of Prevotella and low abundance of classical ruminal bacterial species in the bovine rumen revealed by relative quantification real-time PCR. Appl. Microbiol. Biotechnol. 2007, 75, 165–174. [Google Scholar] [CrossRef]
  41. Hartinger, T.; Gresner, N.; Südekum, K.-H. Does intra-ruminal nitrogen recycling waste valuable resources? A review of major players and their manipulation. J. Anim. Sci. Biotechnol. 2018, 9, 33. [Google Scholar] [CrossRef] [PubMed] [Green Version]
  42. Castillo, A.R.; Kebreab, E.; Beever, D.E.; Barbi, J.H.; Sutton, J.D.; Kirby, H.C.; France, J. The effect of protein supplementation on nitrogen utilization in lactating dairy cows fed grass silage diets. J. Anim. Sci. 2001, 79, 247–253. [Google Scholar] [CrossRef] [PubMed]
  43. Mulligan, F.J.; Dillon, P.; Callan, J.J.; Rath, M.; O’Mara, F.P. Supplementary concentrate type affects nitrogen excretion of grazing dairy cows. J. Dairy Sci. 2004, 87, 3451–3460. [Google Scholar] [CrossRef]
  44. Olmos Colmenero, J.J.; Broderick, G.A. Effect of dietary crude protein concentration on milk production and nitrogen utilization in lactating dairy cows. J. Dairy Sci. 2006, 89, 1704–1712. [Google Scholar] [CrossRef]
  45. Pfeffer, E.; Schuba, J.; Südekum, K.-H. Nitrogen supply in cattle coupled with appropriate supply of utilisable crude protein at the duodenum, a precursor to metabolisable protein. Arch. Anim. Nutr. 2016, 70, 293–306. [Google Scholar] [CrossRef]
  46. Spek, J.W.; Dijkstra, J.; van Duinkerken, G.; Bannink, A. A review of factors influencing milk urea concentration and its relationship with urinary urea excretion in lactating dairy cattle. J. Agric. Sci. 2013, 151, 407–423. [Google Scholar] [CrossRef]
  47. Castillo, A.R.; Kebreab, E.; Beever, D.E.; France, J. A review of efficiency of nitrogen utilisation in lactating dairy cows and its relationship with environmental pollution. J. Anim. Feed Sci. 2000, 9, 1–32. [Google Scholar] [CrossRef]
  48. Volden, H.; Mydland, L.T.; Olaisen, V. Apparent ruminal degradation and rumen escape of soluble nitrogen fractions in grass and grass silage administered intraruminally to lactating dairy cows. J. Anim. Sci. 2002, 80, 2704–2716. [Google Scholar] [CrossRef]
  49. Totty, V.K.; Greenwood, S.L.; Bryant, R.H.; Edwards, G.R. Nitrogen partitioning and milk production of dairy cows grazing simple and diverse pastures. J. Dairy Sci. 2013, 96, 141–149. [Google Scholar] [CrossRef] [Green Version]
  50. Huhtanen, P.; Hristov, A.N. A meta-analysis of the effects of dietary protein concentration and degradability on milk protein yield and milk N efficiency in dairy cows. J. Dairy Sci. 2009, 92, 3222–3232. [Google Scholar] [CrossRef]
  51. Scherer, R.; Gerlach, K.; Taubert, J.; Adolph, S.; Weiß, K.; Südekum, K.-H. Effect of forage species and ensiling conditions on silage composition and quality and the feed choice behaviour of goats. Grass Forage Sci. 2019. In press. [Google Scholar] [CrossRef]
  52. Edmunds, B.; Spiekers, H.; Südekum, K.-H.; Nussbaum, H.; Schwarz, F.J.; Bennett, R. Effect of extent and rate of wilting on nitrogen components of grass silage. Grass Forage Sci. 2014, 69, 140–152. [Google Scholar] [CrossRef]
  53. Johansen, M.; Hellwing, A.L.F.; Lund, P.; Weisbjerg, M.R. Metabolisable protein supply to lactating dairy cows increased with increasing dry matter concentration in grass-clover silage. Anim. Feed Sci. Technol. 2017, 227, 95–106. [Google Scholar] [CrossRef]
  54. Hoekstra, N.J.; Schulte, R.P.O.; Struik, P.C.; Lantinga, E.A. Pathways to improving the N efficiency of grazing bovines. Eur. J. Agron. 2007, 26, 363–374. [Google Scholar] [CrossRef]
  55. Frydrych, Z. Intestinal digestibility of rumen undegraded protein of various feeds as estimated by the mobile bag technique. Anim. Feed Sci. Technol. 1992, 37, 161–172. [Google Scholar] [CrossRef]
  56. Cone, J.W.; van Gelder, A.H.; Mathijssen-Kamman, A.A.; Hindle, V.A. Post-ruminal digestibility of crude protein from grass and grass silages in cows. Anim. Feed Sci. Technol. 2006, 128, 42–52. [Google Scholar] [CrossRef]
  57. Edmunds, B.; Südekum, K.-H.; Bennett, R.; Schröder, A.; Spiekers, H.; Schwarz, F.J. The amino acid composition of rumen-undegradable protein: A comparison between forages. J. Dairy Sci. 2013, 96, 4568–4577. [Google Scholar] [CrossRef]
  58. Calsamiglia, S.; Ferret, A.; Reynolds, C.K.; Kristensen, N.B.; van Vuuren, A.M. Strategies for optimizing nitrogen use by ruminants. Animal 2010, 4, 1184–1196. [Google Scholar] [CrossRef]
  59. Huhtanen, P.; Nousiainen, J.I.; Rinne, M.; Kytölä, K.; Khalili, H. Utilization and partition of dietary nitrogen in dairy cows fed grass silage-based diets. J. Dairy Sci. 2008, 91, 3589–3599. [Google Scholar] [CrossRef]
  60. Nadeau, E.; Englund, J.-E.; Gustafsson, A.H. Nitrogen efficiency of dairy cows as affected by diet and milk yield. Livest. Sci. 2007, 111, 45–56. [Google Scholar] [CrossRef]
  61. Tas, B.M.; Taweel, H.Z.; Smit, H.J.; Elgersma, A.; Dijkstra, J.; Tamminga, S. Effects of perennial ryegrass cultivars on milk yield and nitrogen utilization in grazing dairy cows. J. Dairy Sci. 2006, 89, 3494–3500. [Google Scholar] [CrossRef]
  62. Swick, R.W.; Benevenga, N.J. Labile protein reserves and protein turnover. J. Dairy Sci. 1977, 60, 505–515. [Google Scholar] [CrossRef]
  63. Komaragiri, M.V.S.; Erdman, R.A. Factors affecting body tissue mobilization in early lactation dairy cows. 1. Effect of dietary protein on mobilization of body fat and protein. J. Dairy Sci. 1997, 80, 929–937. [Google Scholar] [CrossRef]
  64. Tamminga, S.; Luteijn, P.A.; Meijer, R.G.M. Changes in composition and energy content of liveweight loss in dairy cows with time after parturition. Livest. Prod. Sci. 1997, 52, 31–38. [Google Scholar] [CrossRef]
  65. Sinclair, L.A.; Garnsworthy, P.C.; Newbold, J.R.; Buttery, P.J. Effect of synchronizing the rate of dietary energy and nitrogen release on rumen fermentation and microbial protein synthesis in sheep. J. Agric. Sci. 1993, 120, 251–263. [Google Scholar] [CrossRef]
  66. Rius, A.G.; McGilliard, M.L.; Umberger, C.A.; Hanigan, M.D. Interactions of energy and predicted metabolizable protein in determining nitrogen efficiency in the lactating dairy cow. J. Dairy Sci. 2010, 93, 2034–2043. [Google Scholar] [CrossRef] [PubMed]
  67. Tamminga, S. A review on environmental impacts of nutritional strategies in ruminants. J. Anim. Sci. 1996, 74, 3112–3124. [Google Scholar] [CrossRef]
  68. Zbinden, R.S.; Falk, M.; Münger, A.; Dohme-Meier, F.; van Dorland, H.A.; Bruckmaier, R.M.; Gross, J.J. Metabolic load in dairy cows kept in herbage-based feeding systems and suitability of potential markers for compromised well-being. J. Anim. Physiol. Anim. Nutr. 2017, 101, 767–778. [Google Scholar] [CrossRef]
  69. Dewhurst, R.J.; Mitton, A.M.; Offer, N.W.; Thomas, C. Effects of the composition of grass silages on milk production and nitrogen utilization by dairy cows. Anim. Sci. 1996, 62, 25–34. [Google Scholar] [CrossRef]
  70. Kolver, E.S.; Muller, L.D. Performance and nutrient intake of high producing Holstein cows consuming pasture or a total mixed ration. J. Dairy Sci. 1998, 81, 1403–1411. [Google Scholar] [CrossRef]
Figure 1. Balances (estimated intake minus requirements; g/d) of utilizable crude protein at the duodenum (uCP) [27] and absorbable protein at the duodenum (APD; calculated from APD when ruminally fermentable energy limits microbial protein synthesis in the rumen, i.e., APDE [26]). Each data point represents one cow in one experimental period.
Agriculture 09 00118 g001
Table 1. Dry matter (DM) concentration and chemical composition as well as calculated values [26] of organic matter digestibility, concentrations of net energy for lactation, and absorbable protein at the duodenum of silage (SI; n = 7), barn-dried hay (BH; n = 6), and field-dried hay (FH; n = 6). Values are reported as means ± standard deviation of pooled samples of the same type of forage.
SIBHFH
DM (g/kg)554 ± 82.8877 ± 9.6868 ± 10.2
Ash (g/kg DM)119 ± 7.7114 ± 2.0109 ± 2.0
Crude protein (g/kg DM)207 ± 6.6187 ± 3.8176 ± 3.4
Crude lipids (g/kg DM)45.7 ± 5.4042.5 ± 3.0835.0 ± 2.10
Neutral detergent fiber 1,2 (g/kg DM)406 ± 13.4438 ± 6.4482 ± 22.0
Acid detergent fiber 2 (g/kg DM)260 ± 11.6268 ± 6.4283 ± 4.1
Acid detergent lignin (g/kg DM)21.8 ± 2.8621.5 ± 2.4322.8 ± 3.06
Water-soluble carbohydrates (g/kg DM)67.5 ± 19.6880.5 ± 3.9472.1 ± 2.14
Organic matter digestibility0.743 ± 0.00840.703 ± 0.00280.687 ± 0.0067
Net energy for lactation (MJ/kg DM)5.96 ± 0.0985.53 ± 0.0525.38 ± 0.075
APDE (g/kg DM)89.2 ± 4.3997.0 ± 0.9394.2 ± 1.03
APDN (g/kg DM)130 ± 3.9120 ± 2.3112 ± 2.1
APDE/APDN, absorbable protein at the duodenum when ruminally fermentable energy (APDE) or N (APDN) limits microbial protein synthesis in the rumen. 1 Assayed with heat-stable amylase. 2 Expressed without residual ash.
Table 2. Crude protein (CP) fractions and chemically and in vitro estimated characteristics of the protein value of SI (n = 7), BH (n = 6), and FH (n = 6). Values are reported as means ± standard deviation of pooled samples of the same type of forage.
SIBHFH
Crude protein fractions (g/kg CP)
A448 ± 53.4260 ± 28.7256 ± 13.2
B132.1 ± 14.1054.8 ± 32.8629.4 ± 14.23
B2333 ± 35.2421 ± 16.2370 ± 16.0
B3124 ± 33.3200 ± 19.6278 ± 13.5
C63.4 ± 6.8264.3 ± 12.8066.7 ± 10.31
Protein value characteristics
uCP (g/kg DM)144 ± 15.7160 ± 13.0169 ± 17.2
RUPCHE (g/kg CP)238 ± 37.9322 ± 32.6344 ± 24.5
RUPENZ (g/kg CP)316 ± 32.8363 ± 27.7393 ± 27.7
IPD0.47 ± 0.0620.49 ± 0.0770.43 ± 0.091
Potential prececal digestibility of CP 10.83 ± 0.0180.81 ± 0.0180.78 ± 0.031
A, B1, B2, B3, C, CP fractions estimated according to Licitra et al. [10]; uCP, utilizable CP at the duodenum estimated from in vitro incubation [25]; RUP, ruminally undegraded feed CP estimated from chemical CP fractionation (RUPCHE; [11]) or in vitro protease incubation (RUPENZ; [8]); IPD, intestinal digestibility of RUP estimated from pepsin–pancreatin incubation [22]. 1 Calculated from CP concentration, RUPENZ, and IPD.
Table 3. DM intake, apparent total tract digestibility of organic matter (OM), neutral detergent fiber (NDF), acid detergent fiber (ADF), and intake of apparently digestible OM in cows fed SI, BH, or FH.
SIBHFHSEMp-Value
Feed intake 1,2 (kg DM/d)17.319.217.90.710.05
Apparent OM digestibility 20.743 a0.730 ab0.712 b0.00670.01
Apparent NDF digestibility 20.7500.7400.7370.00780.26
Apparent ADF digestibility 20.771 a0.748 ab0.738 b0.00910.02
Intake of digestible OM (kg/d) 2,311.312.411.30.450.06
Values with different superscripts within a row differ (p < 0.05). SEM, Standard error of the mean. 1 Feed intake during the collection periods, i.e., feed offering was adjusted to 0.95 of ad libitum feed intake during the adaptation periods. 2 Calculations of feed intake and digestibility include the contribution from mineral feed. 3 Calculated from feed intake, proportion of OM in DM, and apparent OM digestibility.
Table 4. N intake and apparent total tract digestibility and excretion of N in milk, urine, and feces, as well as urine volume for cows fed SI, BH, or FH.
SIBHFHSEMp-Value
N intake (g/d)560 ab581 a509 b21.90.03
Apparent N digestibility 10.701 a0.685 a0.647 b0.00820.001
Urine (L/d)48.147.543.31.970.21
N excretion (g/d)
Milk N1121231136.00.05
Urinary N30729525115.90.06
Fecal N1681831808.60.34
Total N58760054319.80.13
N balance−27.4−19.4−34.819.40.85
N excretion (% of N intake) 2
Fecal N29.9 a31.5 a35.3 b0.830.001
Urinary N55.051.849.23.730.55
Milk N20.221.222.20.870.11
Fractionation of urinary N
Urinary urea (mmol/L)188 a181 a163 b6.40.01
Urinary urea N (g/d)253 a241 ab198 b11.70.01
Urinary urea N/Urinary N0.8230.8210.7910.0210.51
Urinary non-urea N (g/d)54.353.753.17.360.99
Urinary non-ureaN/Urinary N0.1770.1800.2090.02060.51
Values with different superscripts within a row differ (p < 0.05). SEM, Standard error of the mean. 1 Calculation of digestibility includes the contribution from mineral feed. 2 Negative N balance results in total excretion amounting to >100%.
Table 5. Milk yield and composition for cows fed SI, BH, or FH.
SIBHFHSEMp-Value
Milk yield (kg/d)19.320.619.01.380.09
ECM (kg/d)22.123.521.81.800.09
Milk components (%)
Fat4.984.884.930.1470.35
Protein3.733.833.820.0990.18
Lactose4.704.714.680.0730.74
Milk urea (mg/kg)370a351 a306 b14.9<0.001
Milk component yield (kg/d)
Fat0.9681.0120.9470.09110.11
Protein0.7170.7850.7200.03800.05
Lactose0.9110.9770.8990.07860.12
Values with different superscripts within a row differ (p < 0.05). ECM, energy-corrected milk yield [26]. SEM, Standard error of the mean.
Table 6. Concentrations of ruminal ammonia and volatile fatty acids (VFA) as well as serum urea in cows fed SI, BH, or FH.
SIBHFHSEMp-Value
Ruminal ammonia (mmol/L)7.38 ab8.15 a6.98 b0.4230.04
Total VFA (mmol/L)82.587.086.14.820.67
VFA molar proportion (%)
Acetate70.870.471.10.230.19
Propionate14.714.814.90.160.66
n-Butyrate10.710.810.40.180.19
Isobutyrate1.261.301.190.0520.33
n-Valerate1.101.111.040.0340.25
Isovalerate1.351.531.360.0660.14
Acetate:propionate ratio4.824.774.760.0560.77
Serum urea (mmol/L)7.23 a7.22 a6.45 b0.202<0.001
Values with different superscripts within a row differ (p < 0.05). SEM, Standard error of the mean.
Table 7. Relative abundance (% of total 16S DNA) of ruminal bacteria species in the ruminal fluid of cows fed SI, BH, or FH.
SIBHFHSEMp-Value
Lactobacillus spp.0.1150.1020.1150.00480.12
Prevotella spp.48.5 a45.4 ab41.3 b1.540.03
Butyrivibrio fibrisolvens0.0333 a0.0378 ab0.0476 b0.002810.01
Fibrobacter succinogenes6.005.986.670.4700.51
Ruminococcus albus5.81 a4.02 b5.46 a0.5510.01
Ruminococcus flavefaciens13.9 ab12.4 a16.6 b1.290.0478
Values with different superscripts within a row differ (p < 0.05). SEM, Standard error of the mean.

