Article

Factors Influencing the Frequency of Consumers’ Purchases of Locally-Produced Rice in Indonesia: A Poisson Regression Analysis

Department of Food, Agriculture and Bioresources, School of Environment, Resources and Development, Asian Institute of Technology (AIT), Pathun Thani 12120, Thailand
*
Author to whom correspondence should be addressed.
Agriculture 2019, 9(6), 117; https://doi.org/10.3390/agriculture9060117
Submission received: 20 May 2019 / Revised: 29 May 2019 / Accepted: 30 May 2019 / Published: 4 June 2019

Abstract

:
This study assessed the factors influencing the frequency of purchases of locally-produced rice using data collected from a sample of 400 consumers in Jakarta Province in Indonesia. The empirical results of a Poisson regression model revealed that socio-economic characteristics of the consumers (i.e., gender, age, occupation, education, and income), characteristics of the product (i.e., label and color), and the product’s price and promotion significantly influenced consumers’ frequency of purchasing locally-produced rice. The implication is that increasing the quality of locally-produced rice, applying an appropriate marketing strategy such as offering a relatively lower-priced product compared to the price of imported rice, and product promotion are necessary for increasing the frequency of consumers’ purchases of locally-produced rice.

1. Introduction

The agricultural sector plays a strategic role in Indonesia’s economy. Stakeholders in the agricultural sector have innovative and creative ideas for developing new products. However, a lack of market demand for locally-produced products has weakened this innovation. Consumers are often concerned about the quality and safety of locally-produced food [1]. The lack of consumer interest in purchasing local products is mainly due to their low quality, a low level of differentiation, market segmentation, and the development of specific client niches [2]. As a result, local products sold domestically are often of less quality compared to imported products.
Governments and businesses should work together to encourage societies to use local products. An integrated step is needed to persuade the community and related parties to prioritize local products. In Indonesia, the government has sought to regulate the use of local products such as through the Presidential Instruction No. 9 in 2009 [3]. Moreover, Decree No. Kep-08/M.Ekon/02/2009 by Indonesia’s Coordinating Minister for Economic Affairs strengthened government policies to support the use of local products. The government action named “ACI (I Love Indonesian Products)” had a goal to improve the understanding, manufacture, and use of locally-produced products. In the long term, this action was expected to create jobs and increase domestic production.
Consumers’ tendency to buy foreign products is something that local domestic industries must monitor in the context of the changing business environment, and they must adjust their marketing strategies accordingly [4]. The financial success of a company often relies on its marketing capability. Marketing is about identifying human and social needs. It is an art and science of identifying and accessing target markets, devising a set of strategies using the marketing mix elements, and keeping and growing consumers through establishing, conveying, and promoting consumers’ value [5,6].
Consumer responses to a product need manufacturers’ attention if they want to survive in the industry [7]. In a real-world shopping condition (including a food–service situation), the environment can directly affect consumers’ emotions and their purchasing behaviors [8].
Indonesia’s agricultural sector produces commodities that are distinct in terms of their quantity and quality. The agricultural commodities produced in Indonesia are variable in terms of appearance, water contents, duration of maturity and storage, size of the products, yields, and outputs. However, these differences challenge the competitiveness of the agricultural sector through the selection of products that can compete in the domestic and international markets. Locally-produced agricultural commodities have unique flavor and characteristics for which consumers are willing to pay a premium. Consumers buy local products due to their freshness and high quality. Moreover, culture and taste are an obvious reason for consumer preference for local products such as fruits and rice. Thus, consumers’ food purchasing decisions are based on several cultural, psychological, and lifestyle factors, as well as food trends [9]. The preference to buy local food could be linked to attitudes, behaviors, and personality characteristics of the consumer [10]. Rice is a staple food for most Indonesians and an important component of national food security. Rice production increased at an annual average of 2.34% during 2010–2016 due to productivity improvements resulting from government programs such as direct seed and fertilizer support [11]. Given the importance of rice for Indonesia, the rice produced should meet the needs of consumers in terms of quality, quantity, and safety. Increased consumers’ incomes lead to increased demand for quality. On the other hand, economic and demographic changes such as education, urbanization rates, and female labor force participation rates, along with current transportation and communications advances, influence consumer preferences. Consumers put more emphasis on the balance of quality, nutrition, and aesthetics, while the increased participation of female labor force, especially in urban areas, encourages consumers to choose food that is packed in such a way that they can easily be handled when shopping, easy to cook, and easy to prepare. The current rice marketing competition is very keen among rice marketing actors, including local rice producers, traders, and distributors of imported rice. To increase rice production, some superior rice varieties have been disseminated. The diversity of these varieties leads to the diversity of the nature and quality of the rice produced and sold in the market, and these enable the consumers to have diversity of choice of rice in the market [12]. Thus, this study is based on the theory of consumer behavior [13,14,15,16].
In society, there is a strong connection between food and culture, with food often being an integral part of culture [17]. Culture can influence consumer behavior, and the literature views food consumption as a complex interplay of cultural, economic, and social forces [18,19]. Moreover, there are many factors that influence consumer behavior and their frequency of purchases of certain foods, such as community and family structures, as well as other socio-economic factors [20]. The factors influencing consumers’ considerations and their frequency of purchases of locally-produced products such as rice in Indonesia are not well understood. This is more important, as consumer preference for products is dynamic in the context of the government’s drive to implement programs to increase the production of the locally produced agricultural commodities, including rice, for consumption by the population.
This is the gap in the existing literature that this study sought to fill. Therefore, this study analyzes the factors influencing consumers’ frequencies of purchases of locally-produced rice in Jakarta Province, Indonesia. The rest of the manuscript is structured as follows: Section 2 presents the literature review, Section 3 presents the materials and methods; Section 4 presents the results and discussions, and Section 5 provides the conclusions.

2. Literature Review

2.1. Overview of the Locally Produced Rice in Indonesia

Rice is a staple food for most Indonesians and an important component of national food security. Table 1 shows that rice production increased at an annual average of 2.34% during 2010–2016 due to productivity improvements resulting from government programs such as direct seed and fertilizer support [11,21]. Geographically, rice production is spread in various regions in Indonesia. The rice production centers are Java (53%) and Sumatra (23%). The rest of the regions are Sulawesi (11%), Kalimantan (7%), Nusa Tenggara (5%), and eastern regions of Indonesia (Maluku and Papua) [21]. Several local rice varieties are being produced in Indonesia, including “pandan wangi,” “setra ramos,” and “rojolele.” Rice consumption in Indonesia is increasing due to changing consumer behavior [21], and the increasing consumption resulted in a trade deficit during 2010–2016 (Table 2). Rice production costs in Indonesia are high due to the lack of new varieties and inadequate agricultural infrastructure, and this makes the price of locally produced rice relatively expensive compared to imported rice [22]. Generally, in Indonesia, the import of certain types of foods, including rice, was needed to maintain the availability of food and to stabilize food prices at affordable levels [23].

2.2. Attributes of a Product

A product can be defined as anything that is produced to be used, purchased, or consumed by manufacturers or producers as the fulfillment of consumer needs or desires. The combination of several attributes such as quality, features, brand name, package, label, and service of the goods that a company establishes and proposes to the target market to satisfy consumer needs can be defined as a product [24,25].
Product quality is one of the attributes that have the capacity to satisfy consumers’ desires [24]. The product has good quality because it is able to execute its function and meet consumer needs. In general, products are classified into four levels of quality: Poor, average, good, and excellent quality [26].
Product features can be defined as the way to differentiate one product from other products, characteristics of product design that can enable it to perform a specific task, and the most effective way to compete with other producers [24,27].
The product design is another way to attract consumers’ attention and obtain more value for the product than other products. It indicates how a product is organized, produced, and appreciated by consumers [24,26,27].
The brand of a product can be defined as a product’s name, term, sign, symbol, or combination of those that recognize the producer’s innovation. It includes the brand name, trademarks, and virtually all other means of product recognition. The product’s brand name has implications for the producer to deliver a specific set of quality, features, and services to the consumer. An excellent brand conveys additional guarantees of assurance and can be used for promotional campaigns [24,28].
Packaging includes the covering of the product and can be used for promoting and increasing the value of the product [28]. It has two key functions: The technical function and the communication function. The technical function is that the package enables the product to be shipped, stored, and handled in a safe and reliable manner (transport capability, storage capability, and protection capability). The packaging allows the product to be easily used. Sometimes a package is reusable after the product is depleted/used. The communication function is that the package communicates a company’s image through its design, label, colour, brand, and display.
Labels are part of a product that conveys information about the product from the seller. A label can identify the product or service and describe various things about the product or service such as the producer’s name, location of the production, the content of the product or service, and the instructions for using the product or service [24].

2.3. Locally-Produced Products and Consumer Preference

The increasing preference for local food among consumers, social movements, the media, and academia is due to the solid conviction that it is more sustainable, safe, and healthy [29]. The definition of local product is rooted in geographic proximity [30]. There are two criteria usually used for geographical demarcation [31].
The first uses the distance between the location of production and the consumption (Peringer, 2008). The second criterion is related to political–administrative boundaries such as countries, states, or provinces [32]. These political–administrative boundaries may have a stronger impact than geographical boundaries on preferences for local products. Research revealed that Canadian consumers’ preference for home–province beef versus beef labeled “local” depends on the geographic distance [33].
Consumer preference for a product or service can be defined as likes or dislikes for the product or service. This preference arises from the consumer’s perception of the product and is measured by the usefulness of various quality of the products or services, as well as the ability of the product or service to satisfy the consumer’s need [34,35,36]. A person can always create or rank the conditions of products or services from the most favored to the least favored. In a real shopping condition (including a food–service situation), the environment can directly affect a consumer’s emotion and their purchase behavior [37]. Consumer preference is also influenced by beliefs, attitudes, psychological characteristics, social characteristics, and personal characteristics, as well as the marketing mix elements including the product, price, place, and promotion [24,38,39].

3. Material and Method

3.1. Study Area

This study was undertaken in Jakarta Province in Indonesia. The province has a population of 10,277,628 and includes a considerable number of consumers of Indonesia’s locally-produced agricultural commodities. Jakarta is the provincial and national capital city and is located at latitude 6°12′ South and longitude 106°48′ East. The province has an area of approximately 662.33 km² (oceans: 6977.5 km²) [11]. Administratively, Jakarta Province is divided into five municipalities (i.e., North, South, East, West, and Central Jakarta Province) and one district administration (i.e., Kepulauan Seribu) (Figure 1).
The city of Jakarta is a lowland area with an average altitude of +7 m above sea level. The total area of Jakarta, according to Governor Decree No. 171 of 2007, is 662.33 km2, with a sea area of 6977.5 km2. The population of Jakarta in 2017, based on projections of the 2010 Population Census population, was 10,374,235 inhabitants, with population growth rate of 0.94% per year, and the population density in 2017 was approximately 16 people/km2. Jakarta Barat has the highest population density of approximately 20 people/km2.

3.2. Population, Sample Size Determination, Sampling Technique, and Data

The total size of the study sample was determined using the following equation [41]:
n = N ( 1 + N   e 2 ) ,
where n denotes the sample size (respondents), N denotes the total population, and e denotes the margin of error, 0.05 (95% confidence level). This is a well-known approach to perform the power test for the sample used in the study. The power of the test is the chance to reject the null hypothesis, given that the null hypothesis is false (i.e., given that the alternative hypothesis is true). It is the process of determining the sample size for a study. Given the intended power, we can derive the required sample size, and, given the intended sample size, we can derive the resulting power. The equation determined that the appropriate sample size was ~400 respondents. The sub-sample sizes of consumers from each municipality are presented in Table 3.
A multistage sampling technique was used to select the consumers for data collection. First, a purposive sampling technique was employed to select five municipalities in Jakarta Province due to a high level of consumption of locally produced rice in the province. Second, proportional simple random sampling was employed to select the consumers in the five municipalities based on the population of each municipality (Table 3). The questionnaire for data collection was initially developed and pretested to remove all ambiguities before finalizing for the actual data collection. By this process, we ensured that quality data were obtained for the analysis.

3.3. Method of Analysis

This study used the Poisson regression model to assess the factors influencing the frequency of consumers’ purchases of locally-produced rice. The Poisson regression model was selected because it is a suitable model for the estimation of count data [43,44,45,46,47]. The Poisson regression is an application of the Poisson distribution to a non-linear regression model [46,47]. This distribution relates independent variables (xi) to a scalar dependent variable y. The Poisson regression model is specified as follows:
f ( y / x i ) = e μ i   μ y y ! ,
Equation (3) can be specified as:
μ = exp ( β 0 +   β 1 x 1 i +   β 2 x 2 i + +   β k x k i ) ,
The Poisson regression model using the maximum likelihood estimation (MLE) was performed using EViews 8.

3.4. Justification of the Variables Used for the Poisson Regression

The variables that are hypothesized to influence the frequency of consumers’ purchases of locally-produced rice were identified from the literature, a preliminary survey, and a focus group discussion of consumers in the province (Table 4). The positive and negative signs depict the hypothesized influence of each of the variables on the frequency of purchases of locally produced rice. The justifications of the variables are presented as follows:
Socio-economic characteristics of the respondents such as age, gender, education, income, and occupation were hypothesized to positively or negatively influence consumer preferences and their frequency of purchasing locally-produced rice. Several previous studies have stated the effects of socio-economic factors on purchases of locally-produced products. The factors, such as respondents’ age, place of residence, and income, influenced their preference for local foods based on their knowledge, attitude, and perception [48]. Previous study revealed that age, education level, and the number of children in a family had significant positive influences on purchases of local foods in Canada, although attitudinally-based variables have far greater influence [49,50]. Demographic characteristics such as family size and dimension of fruit preferences, including country of origin, perceived quality, and environmental concerns, were important factors that influenced consumers’ purchasing behavior towards locally grown or imported fruits [51]. According to the survey, the majority of the sample’s female shoppers (54.7%) buy locally-produced rice as compared to males (45.3%). Moreover, approximately 53% of the females in the sample purchased locally-produced rice once a month, followed by 15.9% and 13.4% that purchased locally-produced rice twice a week and once a week, respectively. In addition, 11.6% and 1.3% of these females purchased locally-produced rice twice a month and every day in a week, respectively. Only 5.3% of the females in the sample never purchased locally-produced rice.
Approximately 58% of the respondents had annual income lower than Rp. 50 million (US $1 ≈ Rp. 13,200), and 14.7% of them purchased locally-produced rice twice per week. Moreover, 35% of the respondents had an annual income of Rp. 51 million–100 million, and 15.2% of these respondents purchased locally-produced rice twice per week. In addition, 7.5% of the respondents had an annual income of above Rp. 101 million, and 29.2% of these respondents purchased locally-produced rice twice per week. This survey confirms the results of previous studies that found income to be influential for the consumption of local rice/food in Japan, Thailand, and Canada.
It is important to note that as age increases to a threshold, the consumer could be persuaded to purchase local rice due to customs and societal traditions. Therefore, we have included the square of their age to capture the nonlinear nature of the behavior of the consumers.
The taste, color, and shape (characteristics of quality) of rice were hypothesized to positively influence the frequency of purchases of locally produced rice [10,49,52]. These studies have revealed that delicious taste and appropriate appearance were the two primary attributes of high quality locally-produced rice. Moreover, the attractive appearance of local food is a factor known to influence consumers’ purchases [53,54]. The combination of pleasant aroma and taste has been found to induce greater satiation, short-term satiety, and consumers’ purchases of locally-produced food [55].
Packaging and labelling related to food safety are hypothesized to positively influence consumer preferences and their frequency of purchasing locally-produced rice. Food safety has been found to have a positive and significant influence on respondents’ choice to purchase locally-produced rice [56]. Previous studies have shown that packaging is an important feature of the product to attract consumer attention [57,58]. Packaging can also inform consumers’ evaluations of the quality and value of the product and thereby influences their choice of food items. Moreover, brand and labelling as non-sensory features have been found to influence consumer evaluations of product freshness [59,60]. The popularity of brands seems to influence consumers’ perceptions of food products and may therefore facilitate healthy eating via social influence [61]. The majority of respondents (43%) mentioned that they read the production and expiration dates on the label before purchasing the locally-produced rice. About 22% and 19% of these respondents read the content and the producer’s name, respectively. This result is consistent with the previous study that labelling is seen as an indicator of food quality and safety, and it positively influences purchases of locally-produced rice. In addition, labelling as a non-sensory attribute influences consumers’ evaluation of the freshness of the product.
The price, place (i.e., consumers’ distance to the markets), and promotion (i.e., economic aspects) of a product are hypothesized to positively influence consumer preferences and their frequency of purchasing locally-produced rice. Several studies about food products indicated economic variables as significant factors in decisions about food consumption [62]. Price has been found to have an important impact on food purchases or consumption [63,64,65,66,67]. Research revealed that peoples’ buying decisions can be influenced by easy access to markets [66]. Consumers believe that if they purchase a product near their residence, they will save more time and money [56]. Moreover, if there are long distances between the market and consumers’ residences, they may not be able to access the market for their daily needs.
Other past studies have found that types of product or service promotion, including discounts and messages that appeal to consumers, can increase their preference [68,69,70,71]. Table 4 presents the descriptions, measurements, and expected signs of the variables used for the Poisson regression.

3.5. Socio-Economic Characteristics of the Respondents

The socio-economic characteristics of the respondents are presented in Table 5. Of the 400 respondents, 189 were males and 209 were females (the gender of two respondents could not be counted, as they did not respond to the question on gender). This is because the decision-makers regarding household consumption are mostly women, especially for decisions relating to basic food needs such as rice. Regarding the age of the respondents, 38.80% were between 21 and 30 years old, and 34.76% were between 31 and 40 years old. Approximately 42% of the respondents held a bachelor’s degree.
Most (~70%) of the respondents were married. Regarding the respondents’ occupation, 40% of the respondents worked in private companies, and approximately 42% worked as government officers. Approximately 48% of the respondents earned income in the range of Rp. 3,000,001–5,000,000 (US $227.27–378.78), approximately 30% earned more than Rp. 5,000,000 (US $378.78), and approximately 23% earned lower than 3,000,001 (US $227.27), showing a broad distribution of income ranges of the respondents. This reflects the income distribution in Jakarta Province [11]. The exchange rate was US $1 ≈ Rp. 14,000 at the time of data collection in December 2017.

4. Results and Discussion

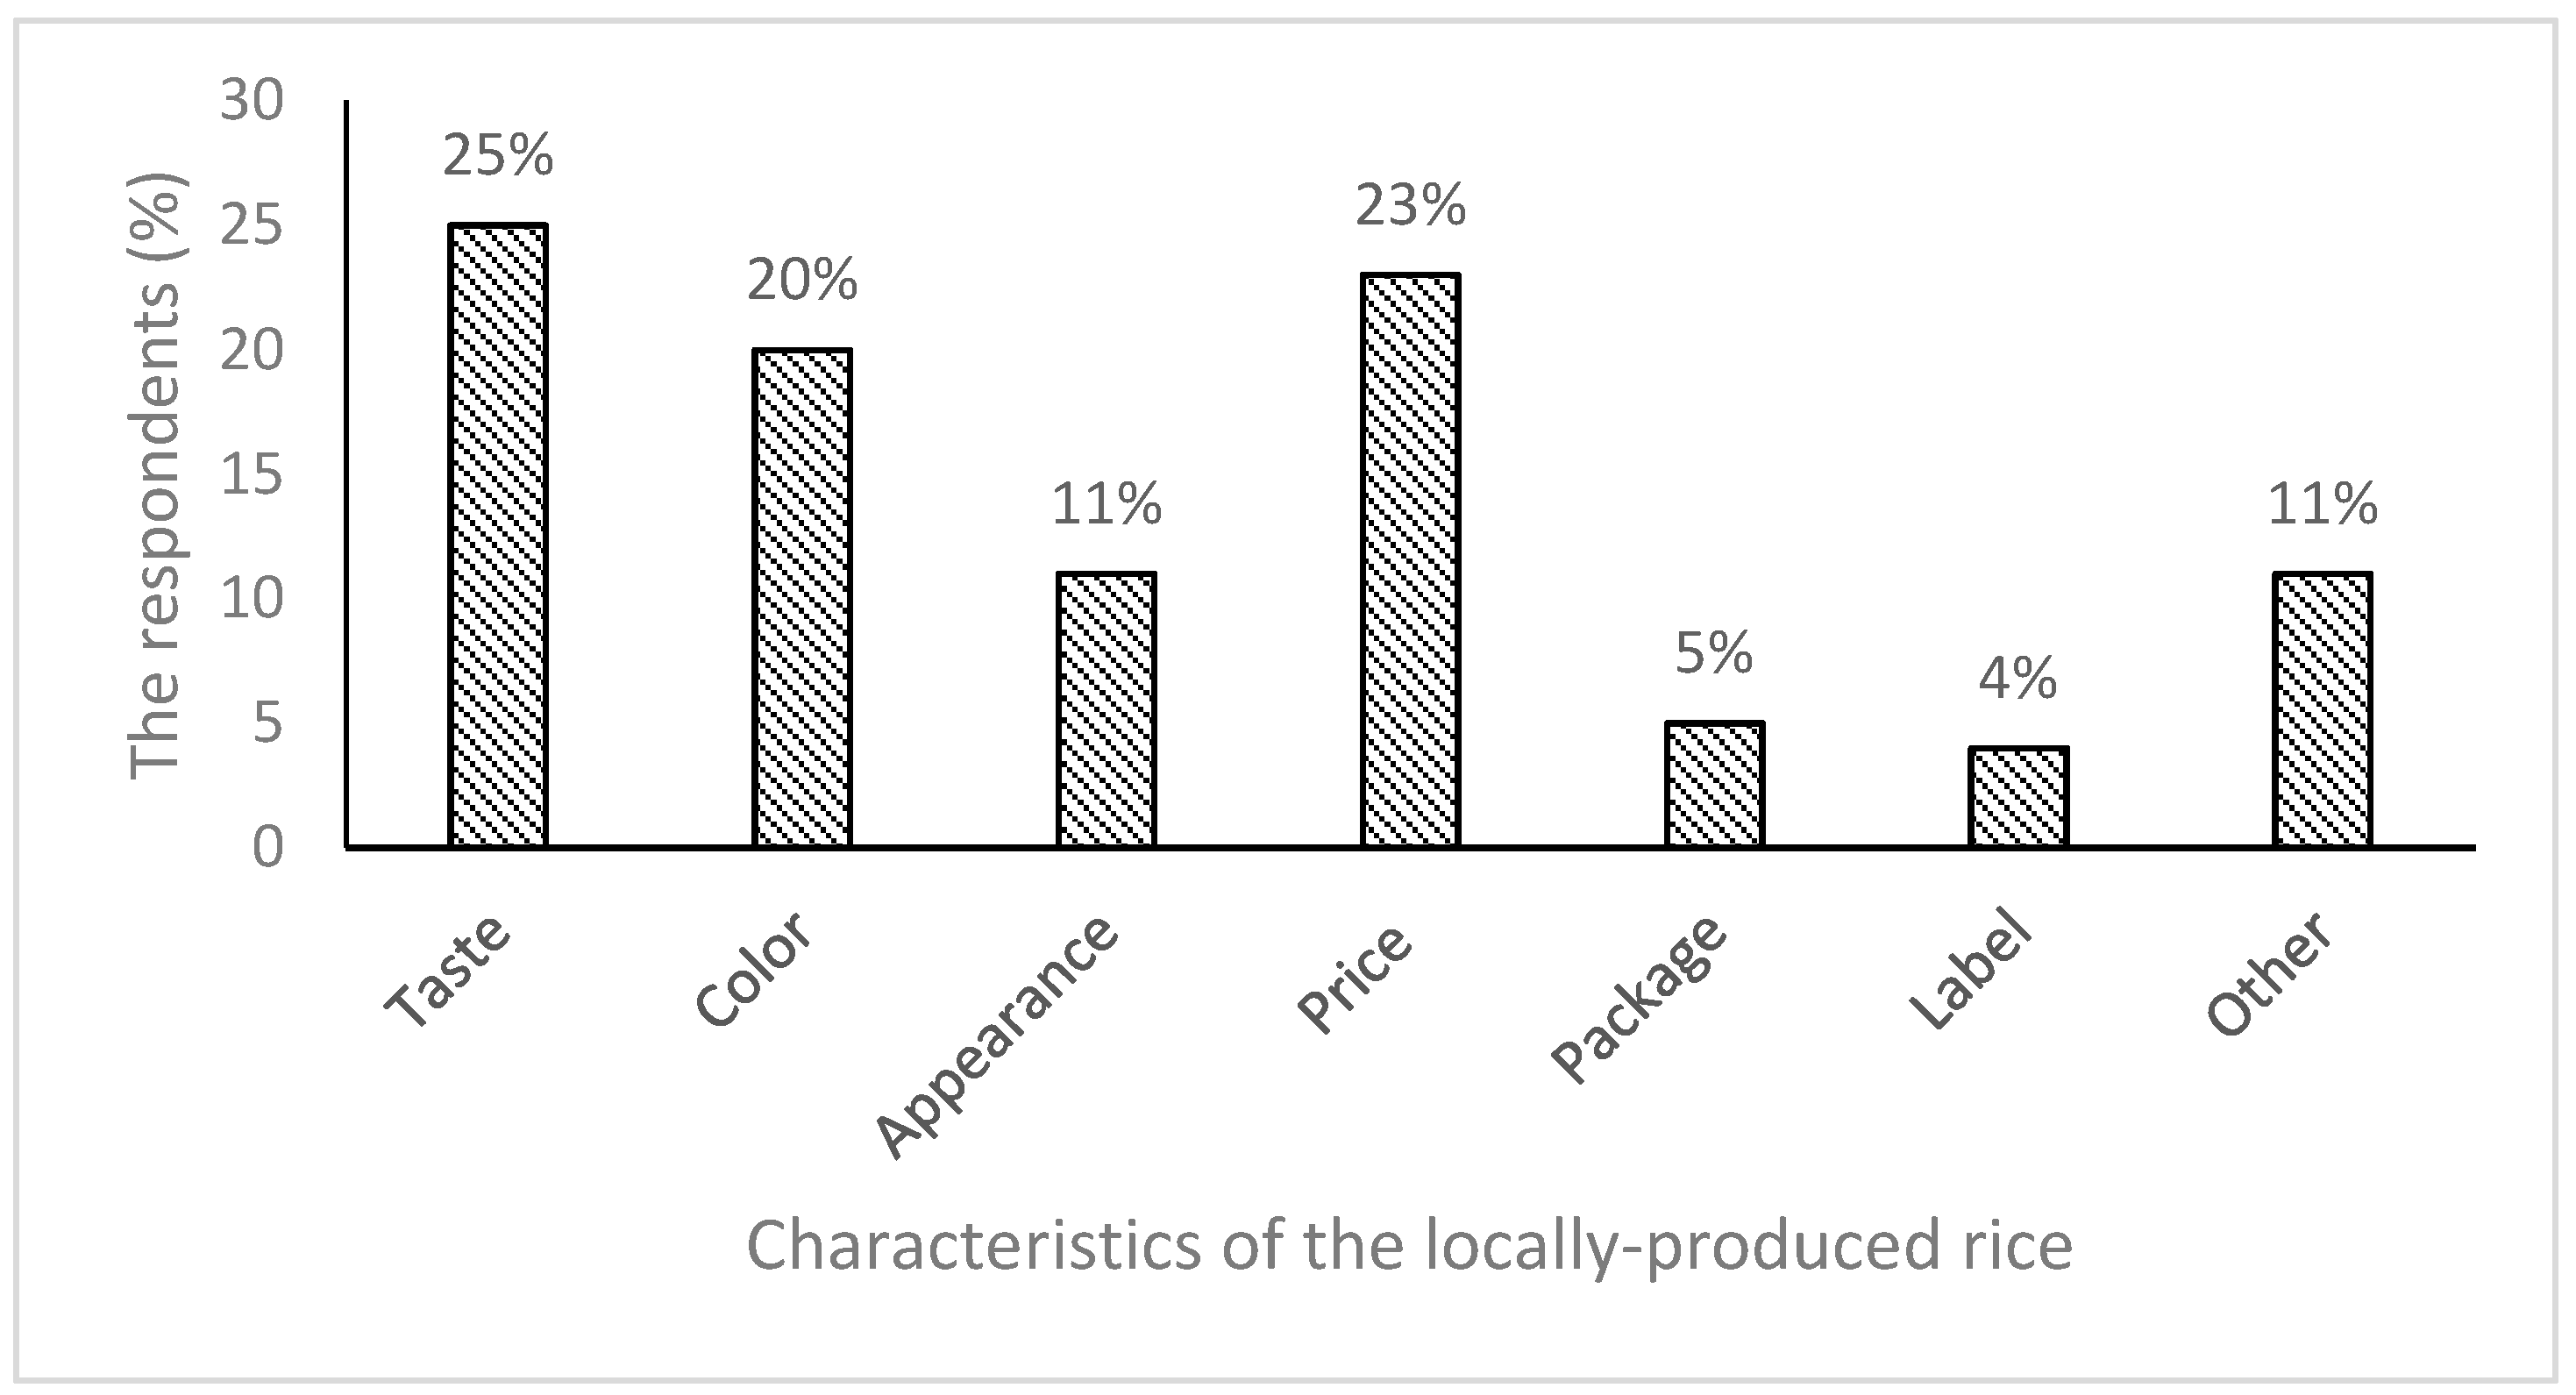
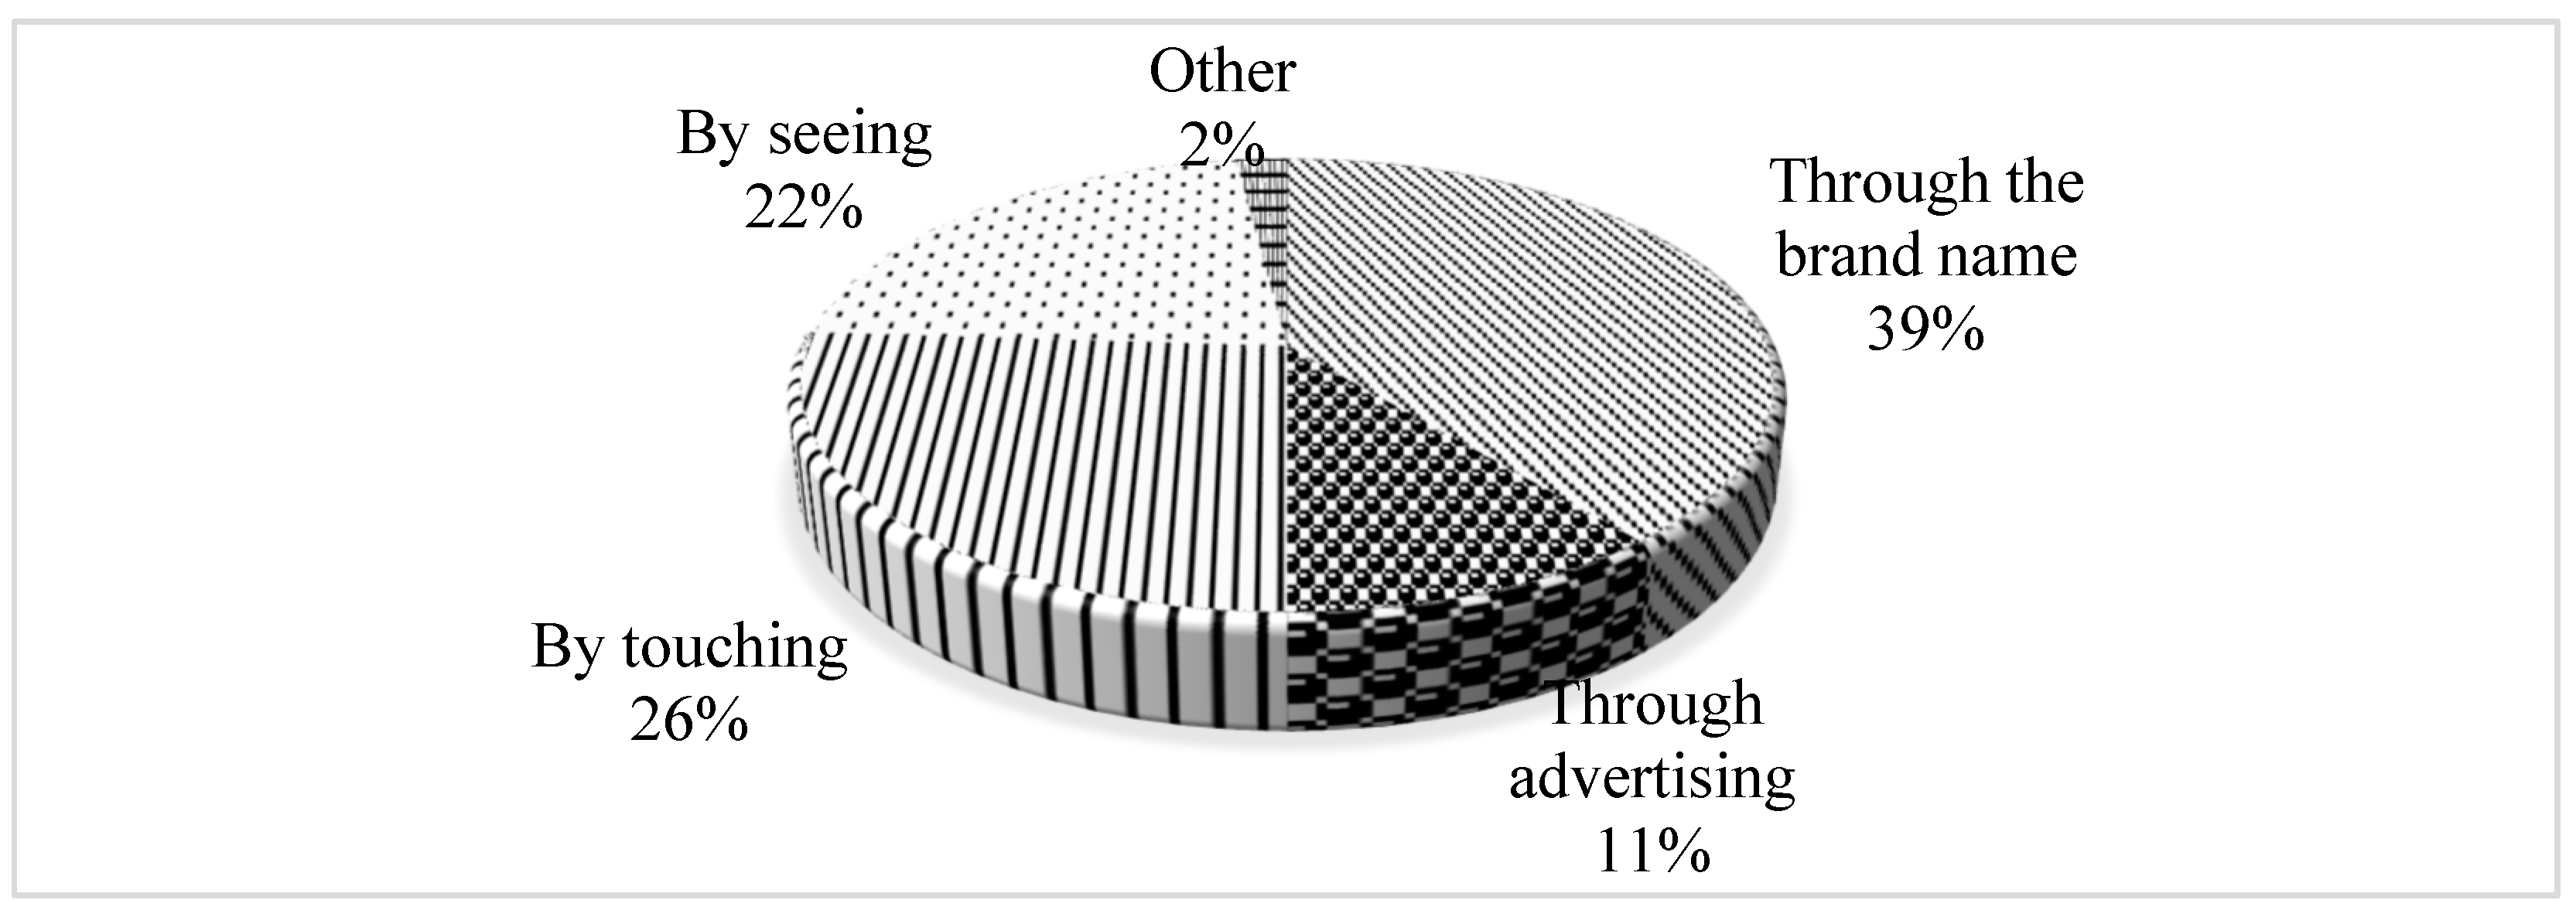
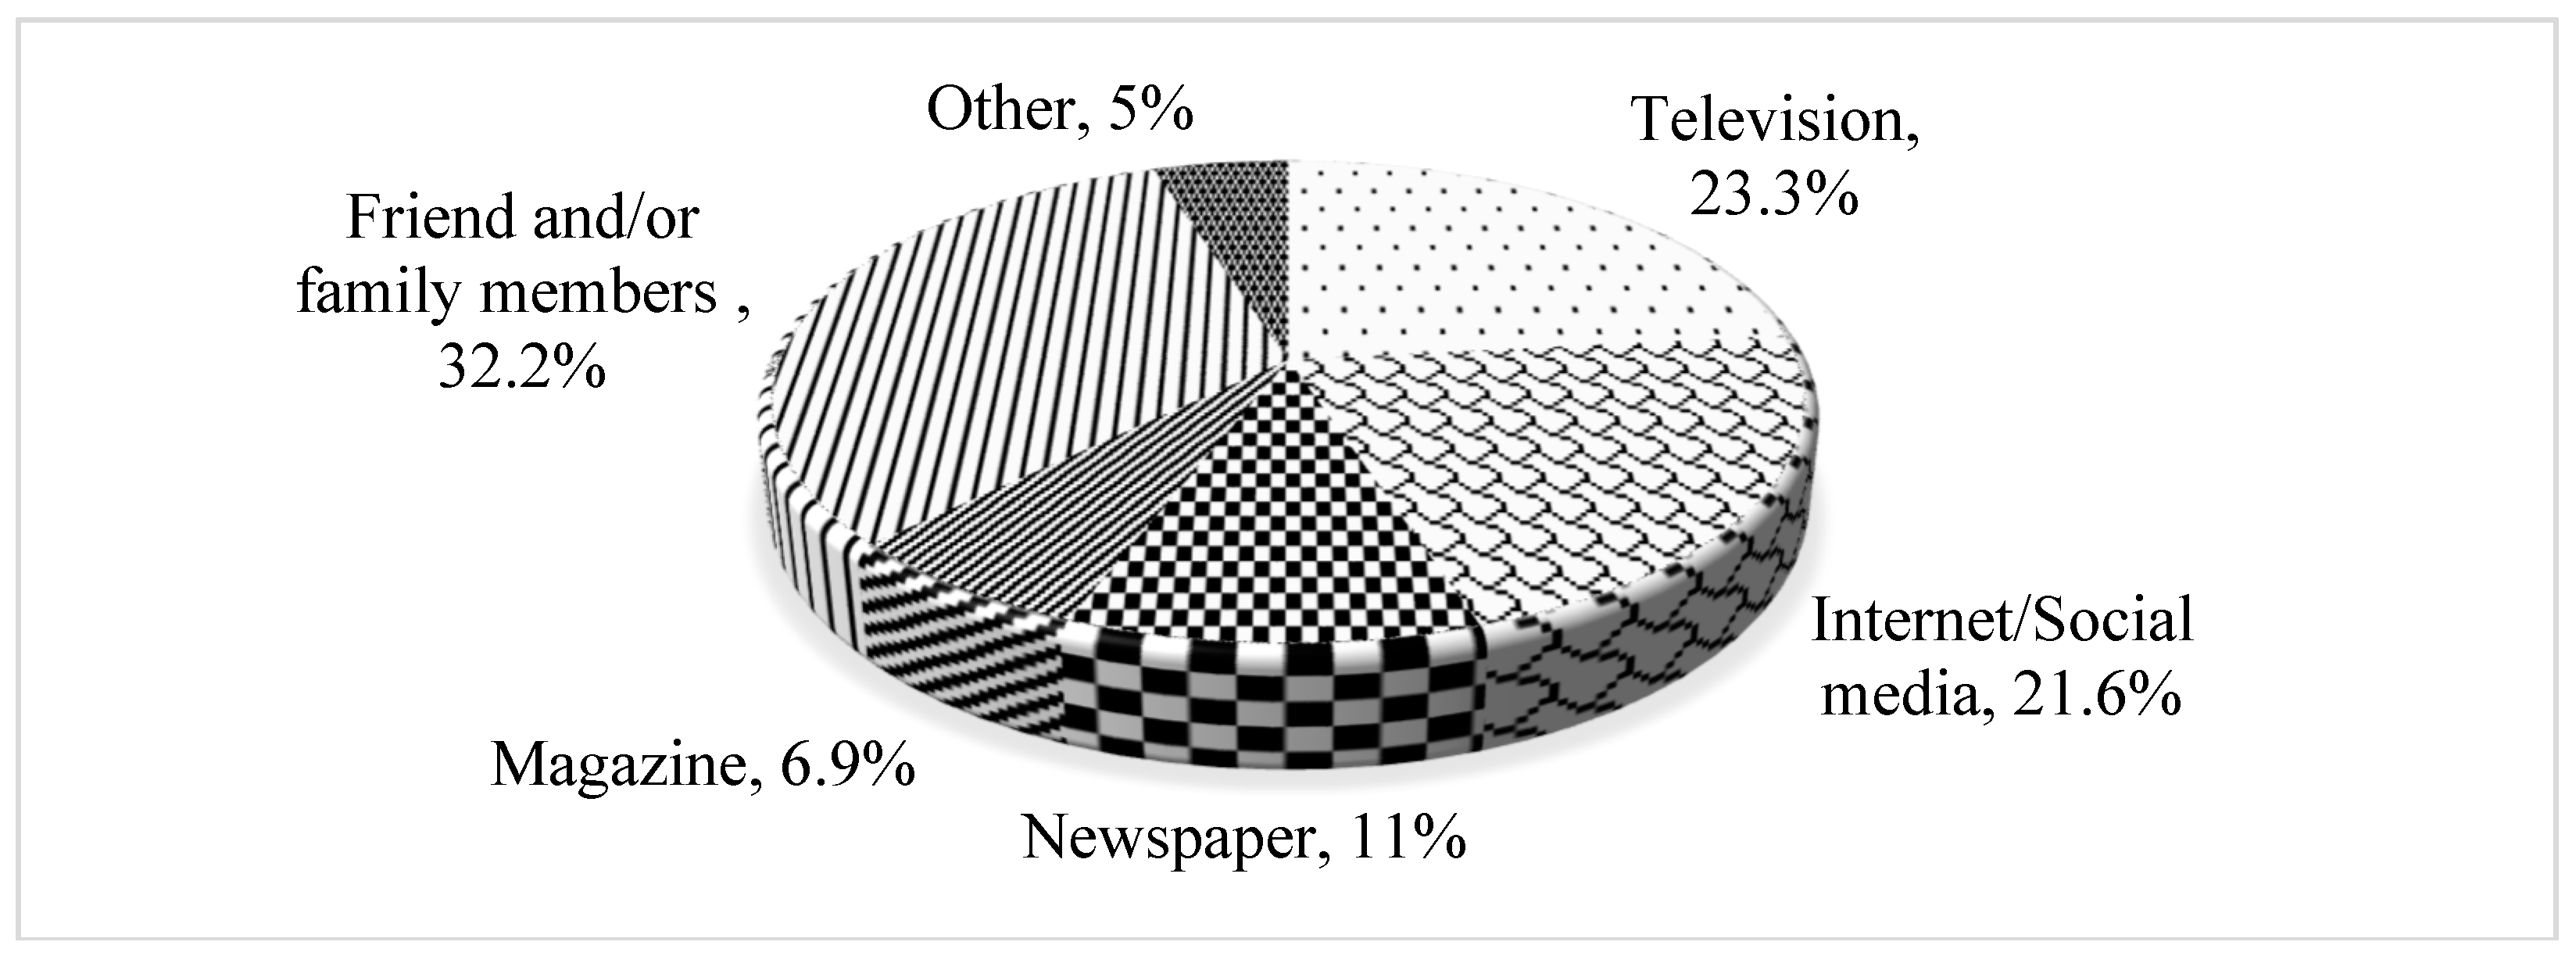
4.1. Characteristics and Varieties of Locally-Produced Rice in Jakarta Province, Indonesia

Characteristics of the locally-produced rice that consumers purchase are shown in Figure 2. The survey results revealed that 25% of the respondents chose taste as the most important attribute that influenced their purchase of locally-produced rice, followed by price (23%), color (20%), appearance (11%), packaging (5%), labelling (4%), and other characteristics such as the nutritional values and the variety (11%).
Most of the respondents (57.5%) mentioned that it is easy to recognize the locally-produced rice, and 51.5% believed they could distinguish the locally-produced from imported rice. There are several ways the respondents can recognize the locally-produced rice, namely by the brand name (38.5%), by touching (26%), by visually observations (22.33%), and through advertising (11.2%), (Figure 3).
Plain rice is the most common type of locally-produced rice purchased by consumers in Jakarta Province because it has a good taste, it is considered soft, and it is considered a bit sticky [72]. Though plain rice is not as healthy as brown rice, most of the surveyed consumers preferred it. Approximately 79% of the respondents preferred plain rice, followed by 14.5% who preferred brown rice, and 6.8% of the respondents who preferred other types of rice such as sticky rice. The respondents preferred locally-produced rice to the imported rice. Approximately 41% of the respondents preferred locally-produced because it is easy to find on the market, 35.8% preferred it because of the taste, and 23.2% had other reasons such as its reasonable price and promotion.
There were several varieties of locally-produced rice in the market in Jakarta Province. Many (34%) of the respondents knew of the locally-produced rice known as pandan wangi, 23.7% knew of the rojolele variety, 19.6% knew of the beras merah (brown rice) variety, and 10.5% knew of the ciherang variety; 4.7% knew Inpari 12 (pera), 2.9% knew mekongga as a locally produced rice, and 4.7% knew other varieties such as Inpari 13 as the locally produced rice (Figure 4).
The respondents were aware of the locally-produced rice through several means, including friends and/or family members (32.2%), television (23.3%), internet or social media (21.6%), newspapers (11%), and magazines (6.9%), (Figure 5).

4.2. Factors Influencing the Frequency of Consumers’ Purchases of Locally-Produced Rice

Table 6 presents the results of the Poisson regression model. Eight of the fourteen independent variables used had a significant influence on the frequency of consumers’ purchases of locally-produced rice. The R-squared of 0.075 indicates that approximately 8% of the variations in the frequency of purchases of locally produced rice is influenced by the independent variables. Though the R-squared value is considerably small, this is typical of cross-sectional data. Nevertheless, the average log likelihood statistic of −4.48 (p < 0.01) suggests that the model fits the data and that the independent variables jointly influence the frequency of consumers’ purchases of the locally-produced rice.
Consumers’ gender, square of the age, occupation, income, as well as the label and price of the locally-produced rice had a positive significant influence on the frequency of their purchases of locally-produced rice. On the other hand, consumers’ age, education, and the color of the locally-produced rice had a negative significant influence on the frequency of consumers’ purchases of locally-produced rice.
The presentations of the descriptive statistics were based on the total sample size of 400. However, the analysis of the frequency of purchases (Poisson regression) was based on the sample size of 320 due to some missing information identified during the cleaning of the data. Nevertheless, following [41], the margin of error of the sample based on this sample size is 5.6%. This implies that we are 94.4% confident in the results based on this sample and that the results can be generalized to the population of the consumers of locally-produced rice in Jakarta Province in Indonesia.
Gender had positive significant influence on the frequency of consumers’ purchases of locally-produced rice (p < 0.1). This means that the males purchased the locally-produced rice more frequently than the females. In general, Indonesian women do the shopping and prepare food for the family [28]. This result suggests that even though the women are more involved in shopping for the family, they have less preference for locally produced as compared to the males.
Similarly, consumers’ annual income had a positive significant influence on the frequency of purchases of locally-produced rice (p < 0.05). Income is directly related to purchasing power. The personal income of consumers influences their buying ability because it determines the level of purchases of products and services [53].
The labelling of the locally-produced rice had a positive significant influence on the frequency of consumers’ purchases of locally-produced rice (p < 0.1). The rice labels carried a great deal of information. For the locally produced rice, the label was necessary to provide information about the quality of the rice such as the name of the variety, the production date, and the expiration date [56,59,60].
The price variable had a positive significant influence on the frequency of consumers’ purchases of locally-produced rice (p < 0.05). Consumers spend to maximize satisfaction or utility, and rice is a staple food and basic need for most of the Indonesian population. The reasonable price of locally-produced rice was one of the factors that influenced its purchase. It is worthy to note that the reasonable price depends on the consumer’s purchasing power, which, in turn, depends on the income level. This result is consistent with previous studies that found that economic factors such as price influence purchases of products [63,64,65,66,67].
Consumer’s education had a negative significant influence on the frequency of their purchases of locally-produced rice (p < 0.1). Consumers whose educational levels were lower than a bachelor’s degree were less likely to buy locally-produced rice. Approximately 52% of the respondents with an education level lower than a bachelor’s degree purchased locally-produced rice once a month, compared with 55% of the respondents that had an education level higher than a bachelor’s degree. Previous studies revealed that respondents with education levels lower than high school or a bachelor’s degree are less likely to purchase local food, as they may have adequate information on alternative products that may appear to be of superior quality compared to the local food products [10,49].
The color variable had a negative significant influence on the frequency of consumers’ purchases of locally-produced rice (p < 0.01). Approximately 51% of the respondents purchased locally-produced rice once a month because the color was attractive. Approximately 58% of the respondents did not pay attention to the color of the locally-produced rice. This finding contrasts with previous studies that found color to be one of the main features indicating the high quality of local rice [10,49,52].
Age had a negative significant influence on the frequency of consumers’ purchases of locally-produced rice (p < 0.01). This implies that increases in consumers’ age decreases the frequency of purchases of locally-produced rice. Approximately 48% of the respondents who were 20–30 years of age purchased locally-produced rice once a month. Moreover, 53.7% and 56.6% of the respondents who were 31–40 and 41–50 years of age, respectively, purchased locally-produced rice once a month. Next, 60% of the respondents were more than 51 years, and they also purchased locally-produced rice once a month. This result is consistent with the previous studies that age had a significant effect on consumers’ preferences for local food [10,49,50]. Nevertheless, as age increases up to a point, the effect becomes significantly positive (p < 0.01), although negligible, on consumers’ preference for locally-produced rice. This may be because the aged could be persuaded to purchase local rice due to customs and societal traditions.
The promotion variable had a positive significant influence on consumers’ frequency of purchases of locally-produced rice (p < 0.1). This result suggests that effective promotion of locally-produced rice increased consumers’ frequency of purchase. Approximately 51% of the respondents purchased the locally-produced rice once a month due to promotion. In addition, 16.7% of the respondents purchased the locally-produced rice twice a week due to promotion. This result is in line with previous studies that found that a combination of discounts and other forms of promotion including online programs can influence the consumers’ motivation to purchase a product, thereby increasing producers’ profits [51,70].
Finally, we expected the interaction effect of income and occupation to influence the frequency of purchases. However, this variable was not significant.

5. Conclusions

Locally-produced products are important for improving the economic condition of local inhabitants, as these inhabitants produce for consumption and market the surplus for income to sustain their livelihoods. This study described the characteristics of locally-produced rice in Jakarta Province in Indonesia and analysed the factors influencing the frequency of consumers’ purchases of this rice. The study is relevant for producers because the results can assist in the preparation of marketing strategies. Moreover, producers can develop promotional strategies, especially appropriate advertisements based on the needs and desires of consumers.
Several varieties of locally-produced rice are known by consumers in Jakarta Province. Pandan wangi is the most common variety, followed by rojolele, beras merah (brown rice), inpari 12 (pera), ciherang, and mekongga. The characteristics of the locally-produced rice such as its smell, texture, shape or form, color, and accessibility were the main factors that determined the consumers’ preference for them.
The results of the Poisson regression revealed that gender, the square of the age of the respondent, occupation, annual income, promotion, label, and price had a positive significant influence on the frequency of consumers’ purchases of locally-produced rice. However, age, education, and color had a negative significant influence on the frequency of consumers’ purchases of locally-produced rice.
The results imply that the consumers considered price to be the most important factor influencing the frequency of purchases of locally-produced rice. Other factors such as label, color, and promotion also influenced the consumers’ frequency of purchases of the locally-produced rice. Thus, increasing the quality of locally-produced rice, improving the labeling, and offering affordable price compared to the price of imported rice would increase the frequency of consumer purchases of locally-produced rice. The study provides the following recommendations. First, it is imperative that the government provide training and capacity-building support related to production practices to enable the farmers to produce quality rice. Second, the government should provide input subsidies for the farmers to enable them to reduce the price of the locally-produced rice in the market and thereby help to persuade more consumers to purchase it.
The promotion of locally-produced agricultural products is not only critical for the development of the agricultural sectors in developing and emerging economies like Indonesia that depend heavily on agriculture but is also imperative to improve the livelihood of the farming households.
This study is not without limitations. It is based only on data from Jakarta Province, which may not be representative of the entire population of Indonesia. Therefore, extending this study to other regions of the country to provide a broader perspective of consumers’ preferences for locally-produced rice would be an excellent opportunity for future research. Indonesia is a developing country that has several cities and provinces with different socio-economic characteristics of their consumers. Extending the study to these other cities would improve our understanding of consumer preferences that would provide directions for the formulation and implementation of appropriate and effective marketing strategies for locally-produced rice. Moreover, other variables such as product safety that would reflect health and environmental issues should also be considered in any future studies.
In addition, the datum collected on varieties was a general one about the consumers’ awareness of those varieties. We did not collect data on the consumers’ preference for individual locally produced varieties. This is another excellent suggestion for future research. Further, the sign of the coefficient of the color variable did not meet our a priori expectation, and this would be re-examined in our future research. The agricultural commodities produced in Indonesia are variable in the terms of appearance, water contents, duration of maturity and storage, and the size of the products, yields, and outputs. The exact differences in all these attributes compared to imported rice would require laboratory analysis, which is beyond the scope of this study. This is also an excellent opportunity for future research. Similarly, an investigation into consumers’ desirable colour and shape of the rice is another opportunity for future research. In addition, consumer preference based on water content in the rice would require laboratory analysis, and this presents another opportunity for future research. The differences in taste and how taste influences consumer preference is another excellent opportunity for future research. Finally, examining the differences in duration of maturity and storage, size of products, yields, and outputs is another opportunity for future research.

Author Contributions

A.W., J.K.M.K., E.G., A.D., and L.T.N. designed the research. A.W. collected the data. J.K.M.K. and A.W. analyzed the data. A.W., J.K.M.K., and E.G. drafted the manuscript. J.K.M.K., A.W., A.D., L.T.N., and E.G. worked on the flow, clarity, organizational structure, discussions, conclusions, and reviewed and revised the manuscript. J.K.M.K. served as the corresponding author.

Acknowledgments

The authors gratefully thank the Indonesian Agency for Agricultural Research and Development, and the Indonesian Ministry of Agriculture for providing financial support for this study. We also acknowledge our sincere gratitude to the consumers in the five Jakarta provinces for their patience, time and the information provided during the field survey.

Conflicts of Interest

The authors declare that there is no conflict of interest regarding the publication of this article.

References

  1. Camhuri, N.; Batt, P.J. Consumer perception of food quality in Malaysia. Br. Food J. 2015, 117, 1168–1187. [Google Scholar] [CrossRef]
  2. Lundy, M.; Gottret, V.M.; Cifuentes, W.; Ostertag, F.C.; Best, R.; Peters, D.; Ferris, S. Increasing the Competitiveness of Market Chains for Smallholder Producers; CIAT: Cali, Colombia, 2004. [Google Scholar]
  3. Listrik Indonesia. Upaya Panjang Cinta Produk Lokal (In Bahasa); Listrik Indonesia: Jakarta, Indonesia, 2013; Available online: http://listrikindonesia.com/upaya_panjang_ cinta_produk_lokal_514.htm (accessed on 17 October 2013).
  4. Setiawan, E. Analisis sikap konsumen terhadap produk fashion lokal dan impor. J. Econ. 2014, 10, 38–47. (In Bahasa) [Google Scholar]
  5. Kotler, P.T.; Keller, L.K. Marketing Management, 15th ed.; Pearson Education: New York, NY, USA, 2016. [Google Scholar]
  6. Kotler, P.T.; Amstrong, G. Principles of Marketing, 14th ed.; Pearson Education: New York, NY, USA, 2012. [Google Scholar]
  7. Budiman, J.A. Analisis Preferensi Konsumen Terhadap Keputusan Pembelian Madu di Kota Blitar. Ph.D. Thesis, Brawijaya University, Malang, Indonesia, 2014. [Google Scholar]
  8. Campbell, J.M. Muy local: Differentiating hispamic and caucasian shoppers of locally produced foods in US grocery. J. Retail. Consum. Serv. 2013, 20, 325–333. [Google Scholar] [CrossRef]
  9. Asp, E. Factors affecting food decisions made by individual consumers. Food Policy 1999, 24, 287–294. [Google Scholar] [CrossRef]
  10. Mirosa, M.; Lawson, R. Revealing the lifestyles of local food consumers. Br. Food J. 2012, 114, 816–825. [Google Scholar] [CrossRef]
  11. Statistical Bureau. Statistical Yearbook of Indonesia; Government of Indonesia: Jakarta, Indonesia, 2017.
  12. Ambarinanti, M. Analisis Faktor-Faktor Yang Dapat Mempengaruhi Produksi dan Ekspor Beras Indonesia; Institut Pertanian Bogor: Bogor, Indonesia, 2007. (In Bahasa) [Google Scholar]
  13. Fishbein, M.; Ajzen, I. Belief, Attitude, Intention, and Behavior: An Introduction to Theory and Research; Addison-Wesley: Boston, MA, USA, 1975. [Google Scholar]
  14. Ajzen, I.; Fishbein, M. Understanding Attitudes and Predicting Social Behavior; Prentice-Hall Inc.: Englewood Cliffs, NJ, USA; Reading, MA, USA, 1980. [Google Scholar]
  15. Ajzen, I. From intentions to actions: A theory of planned behavior. In Action Control: From Cognition to Behavior; Kuhl, J., Beckmann, J., Eds.; Springer: Berlin/Heidelberg, Germany; New York, NY, USA, 1985; pp. 11–39. [Google Scholar]
  16. Ajzen, I. The theory of planned behavior. Organ. Behav. Hum. Decis. Process. 1991, 50, 179–211. [Google Scholar] [CrossRef]
  17. Bhugra, D.; Bhui, K.; Mallett, R.; Desai, M.; Jayshree, S.; Leff, J. Cultural identity and its measurement: A questionnaire for Asians. Int. Rev. Psychiatry 2009, 11, 244–250. [Google Scholar]
  18. Franchi, M. Food choice: Beyond the chemical content. Int. J. Food Sci. Nutr. 2012, 63, 17–28. [Google Scholar] [CrossRef]
  19. Lang, M.; Stanton, J.; Qu, Y. Consumers’ evolving definition and expectations for local food. Br. Food J. 2014, 116, 1808–1820. [Google Scholar] [CrossRef]
  20. Anic, I.D.; Rajh, S.P.; Rajh, E. Antecedents of food-related consumer decision-making styles. Br. Food J. 2014, 116, 431–450. [Google Scholar] [CrossRef]
  21. National Development Planning Agency—Bappenas Report; Government of Indonesia: Jakarta, Indonesia, 2014. Available online: http://www.bappenas.go.id/ (accessed on 24 April 2018).
  22. Komalasari, T.D. Impor Beras Masih Tinggi (in Bahasa); Pikiran Rakyat: Bandung, Indonesia, 2017; Available online: http://www.pikiran-rakyat.com/ekonomi/2017/07/10/impor-beras-masih-tinggi-404884 (accessed on 23 August 2017).
  23. Indonesia’s National Government Internal Auditor—BPKP; Government of Indonesia: Jakarta, Indonesia, 2015. Available online: https://www.kemenkeu.go.id/en/publications/news/the-ministry-of-pdtt-created-a-collaborative-monitoring-system/ (accessed on 30 May 2018).
  24. Kotler, P.; Amstrong, G. Principles of Marketing, 13th ed.; Pearson Education: New York, NY, USA, 2009. [Google Scholar]
  25. Akpoyomare, O.B.; Adeosun, L.P.K.; Rahim, A.G. The influence of product attributes on consumer preference decision in the Nigerian food and beverage industry: A study of Lagos Metropolis. Am. J. Bus. Manag. 2012, 1, 196–201. [Google Scholar]
  26. Kotler, P.; Armstrong, G. Principles of Marketing, 12nd ed.; Pearson Education: New York, NY, USA, 2008. [Google Scholar]
  27. Pride, W.M.; Ferrel, O.C. Marketing, 17th ed.; Cengage Learning: South-Western, AZ, USA, 2014. [Google Scholar]
  28. Perreault, W.D.; Cannon, J.P.; McCarthy, E.J. Essentials of Marketing, 12th ed.; Mac-Graw Hill Inc.: New York, NY, USA, 2010. [Google Scholar]
  29. Adams, D.C.; Salois, M.J. Local versus organic: A turn in consumer preferences and willingness-to-pay. Renew. Agric. Food Syst. 2010, 25, 331–341. [Google Scholar] [CrossRef] [Green Version]
  30. Thompson, E., Jr.; Harper, A.M.; Kraus, S. Think Globally-Eat locally: San Fransisco Foodshed Assessment. 2008. Available online: http://www.farmland.org/programs/states/ca/Features%20Stories/San-Fransisco-Foodshed-Report.asp (accessed on 5 September 2017).
  31. Fernández-Ferrína, P.; Calvo-Turrientesb, A.; Bandec, B.; Miren Artaraz-Miñóna, M.; Galán-Laderod, M.M. The valuation and purchase of food products that combine local, regional and traditional features: The influence of consumer ethnocentrism. Food Qual. Prefer. 2108, 64, 138–147. [Google Scholar] [CrossRef]
  32. Darby, K.; Batte, M.; Ernst, S.C.; Roe, B. Willingness to pay for locally produced foods: A customer intercept study of direct market and grocery store shoppers. In Proceedings of the Annual meeting of the American Agricultural Economics Association, Long Beach, CA, USA, 23–26 July 2006. [Google Scholar]
  33. Lim, K.H.; Hu, W. How Local Is Local? A Reflection on Canadian Local Food Labeling Policy from Consumer Preference. Can. J. Agric. Econ. 2017, 64, 71–88. [Google Scholar] [CrossRef]
  34. Munandar, J.M.; Udin, F.; Amelia, M. Analisis faktor yang mempengaruhi preferensi konsumen produk air minum dalam kemasan di Bogor. J. Teknol. Ind. Pertan. IPB 2012, 13, 97–107. (In Bahasa) [Google Scholar]
  35. Guleria, D.; Parmar, Y.S. A study of consumer preference for smartphone: A case of Solan town of Himachal Pradesh. Int. J. Mang. Res. Rev. 2015, 5, 193–200. [Google Scholar]
  36. Marwan, A. Marketing, 2nd ed.; BPFE Universitas Gadjah Mada: Yogyakarta, Indonesia, 1990. (In Bahasa) [Google Scholar]
  37. Campbell, J.; DiPietro, R.B.; Remar, D. Local foods in a University setting; price/quality inference and customer’s willingness to pay. Int. J. Hosp. Manag. 2014, 42, 39–49. [Google Scholar] [CrossRef]
  38. Tjiptono, F. Strategi Pemasaran, 3rd ed.; Andi: Yogyakarta, Indonesia, 2008. (In Bahasa) [Google Scholar]
  39. Tunggal, A.W. Tanya-Jawab: Perilaku Konsumen dan Pemasaran Strategi; Harvarindo: Jakarta, Indonesia, 2005. (In Bahasa) [Google Scholar]
  40. Indonesian Geospatial Information Agency. Atlas Administrasi DKI Jakarta; BIG: Bogor, Indonesia. Available online: http://www.big.go.id/atlas-administrasi/ (accessed on 10 March 2019).
  41. Yamane, T. Statistics, An Introductory Analysis, 2nd ed.; Harper and Row: New York, NY, USA, 1967. [Google Scholar]
  42. Indonesian Statistical Bureau. Indonesian Statistic 2015; BPS: Jakarta, Indonesia, 2016.
  43. Greene, W.H. FIML Estimation of Sample Selection Models for Count Data; Working Papers 97-02; Department of Economics, Leonard N Stern School of Business, New York University: New York, NY, USA, 1997. [Google Scholar]
  44. Greene, W.H. Econometric Analysis, 4th ed.; Prentice Hall: New Jersey, NJ, USA, 2000. [Google Scholar]
  45. Ferrara, O.; Ward, R.W. Evidence of Changes in Preferences among Beef Cuts Varieties: An Application of Poisson Regressions. Presented at the American Agricultural Economics Association Annual Meetings, Portland, OR, USA, 29 July–1 August 2007; 2007. [Google Scholar]
  46. Mensah-Bonsu, A.; Sarpong, D.B.; Al-Hassan, R.; Asuming-Brempong, S.; Egyir, I.S.; Kuwornu, J.K.M.; Osei-Asare, Y.B. Technology Adoption and Land and Water Management Practices among Maize Farmers in Ghana. In Proceedings of the International Conference of Agricultural Production, “Increasing Agricultural Productivity and Enhancing Food Security in Africa: New Challenges and Opportunities”, Addis Ababa, Ethiopia, 1–3 November 2011. [Google Scholar]
  47. Mensah-Bonsu, A.; Sarpong, D.B.; Al-Hassan, R.; Asuming-Brempong, S.; Egyir, I.S.; Kuwornu, J.K.M.; Osei-Asare, Y.B. Intensity of and factors affecting land and water management practices among smallholder maize farmers in Ghana. Afr. J. Agric. Resour. Econ. 2017, 12, 142–157. [Google Scholar]
  48. Latiff, Z.A.A.; Ayob, M.A. Preference of consumer toward imported rice and local rice in Kelantan. Int. J. Community Dev. Manag. Stud. 2017, 1, 73–83. [Google Scholar]
  49. Cranfield, J.; Henson, S.; Blandon, J. The effect of attitudinal and socio-demographic factors on the likelihood of buying locally-produced food. Agribusiness 2012, 28, 205–221. [Google Scholar] [CrossRef]
  50. Bianchi, C. Exploring urban consumers’ attitudes and intentions to purchase local food in Chile. J. Food. Prod. Market. 2017, 23, 553–569. [Google Scholar] [CrossRef]
  51. Terano, R.; Mohamad, Z.; Rezai, G.; Hanum, Z. Preference for locally grown or imported fruit among the millennial generation in Johor, Malaysia. J. Food. Prod. Mark. 2016, 22, 891–904. [Google Scholar] [CrossRef]
  52. Zepeda, L.; Nie, C. What are the odds of being an organic or local food shopper? Multivariate analysis of US food shopper lifestyle segments. Agric. Hum. Values 2012, 29, 467–480. [Google Scholar] [CrossRef]
  53. Megicks, P.; Memery, J.; Angell, R.J. Understanding local food shopping: Unpacking the ethical dimension. J. Mark. Mang. 2012, 28, 264–289. [Google Scholar] [CrossRef]
  54. Nederkoorn, C.; Houben, K.; Havrmans, C. Taste the texture: The relation between subjective tactile sensitivity, mouthfeel and picky eating in young adults. Appetite 2019, 136, 58–61. [Google Scholar] [CrossRef] [PubMed]
  55. Yin, W.; Hewson, L.; Linforth, R.; Taylor, M.; Fisk, I.D. Effects of aroma and taste, independently or in combination, on appetite sensation and subsequent food intake. Appetite 2017, 114, 265–274. [Google Scholar] [CrossRef] [PubMed]
  56. Rahnama, H. Consumer motivations toward buying local rice: The case of Northern Iranian consumers. Appetite 2017, 114, 350–359. [Google Scholar] [CrossRef]
  57. Silayoi, P.; Speece, M. The importance of packaging attributes: A conjoint analysis approach. Eur. J. Mark. 2007, 41, 1495–1517. [Google Scholar] [CrossRef]
  58. Karimi, P.; Mahdieh, O.; Rahmani, M. The study of relationship between packaging elements and purchase behavior: Consumers of food, cosmetics, and health products. Interdiscip. J. Contemp. Res. Bus. 2013, 5, 281–295. [Google Scholar]
  59. Carlucci, D.; Nocella, G.; De Devitiis, B.; Viscecchia, R.; Bimbo, F.; Nardone, G. Consumer purchasing behavior towards fish and seafood products. Patterns and insights from a sample of international studies. Appetite 2015, 84, 212–227. [Google Scholar] [CrossRef] [PubMed]
  60. Zhang, T.; Lusk, K.; Mirosa, M.; Oey, I. Understanding young immigrant Chinese consumers’ freshness perceptions of orange juices: A study based on concept evaluation. Food Qual. Prefer. 2016, 48, 156–165. [Google Scholar] [CrossRef]
  61. Koening, L.M.; Giese, H.; Stok, F.M.; Renner, B. The social image of food: Associations between popularity and eating behaviour. Appetite 2017, 114, 248–258. [Google Scholar] [CrossRef] [PubMed]
  62. Powell, L.M.; Han, E.; Chaloupka, F.J. Economic contextual factors, food consumption, and obesity among U.S. Adolescents. J. Nutr. 2010, 140, 1175–1180. [Google Scholar] [CrossRef] [PubMed]
  63. Arsil, P.; Li, E.; Bruwer, J. Perspectives on consumer perceptions of local foods: A view from Indonesia. J. Int. Food Agribus. Mark. 2014, 26, 107–124. [Google Scholar] [CrossRef]
  64. Garg, T.; Barrett, C.B.; Gomez, M.I.; Lentz, E.C.; Violette, W.J. Market prices and food aid local and regional procurement and distribution: A multi-country analysis. World Dev. 2013, 49, 19–29. [Google Scholar] [CrossRef]
  65. Kang, S.; Rajagopal, L. Perceptions of benefits and challenges of purchasing local foods among hotel industry decision makers. J. Foodserv. Bus. Res. 2014, 17, 301–322. [Google Scholar] [CrossRef]
  66. Knight, A.J. Evaluating local food programs: The case of select Nova Scotia. Eval. Program Plan. 2013, 36, 29–39. [Google Scholar] [CrossRef]
  67. Rahnama, H.; Rajabpour, S. Factors for consumer choice of dairy products in Iran. Appetite 2017, 111, 46–55. [Google Scholar] [CrossRef]
  68. Cucchiara, C.; Kwon, S.; Ha, S. Message framing and consumer responses to organic seafood labeling. Br. Food J. 2015, 17, 1547–1563. [Google Scholar] [CrossRef]
  69. Vecchio, R.; Lombardi, A.; Cembalo, L.; Caracciolo, F.; Cicia, G.; Masucci, F.; Di Francia, A. Consumers’ willingness to pay and drivers of motivation to consume omega-3 enriched mozzarella cheese. Br. Food J. 2016, 118, 2404–2419. [Google Scholar] [CrossRef]
  70. Gomez, M.; Rao, V.R. Market power and trade promotions in US supermarkets. Br. Food J. 2009, 111, 866–877. [Google Scholar] [CrossRef]
  71. Tang, Y.C.; Wang, Y.M.; Huang, J.Y. Optimal promotional strategy for intra-category cross-selling: An application to culinary products in Taiwan. Br. Food J. 2014, 116, 80–90. [Google Scholar] [CrossRef]
  72. Indrasari, S.D.; Purwaningsih, P.; Apriyati, E.; Ardhiyanti, S.D. Preferensi konsumen pada beras berlabel jaminan varietas untuk Hipa 8, Ciherang dan Inpari 13. J. Penelit. Pertan. Tanam. Pangan 2016, 35, 173–180. (In Bahasa) [Google Scholar] [CrossRef]
Figure 1. Map of Indonesia showing the location of Jakarta Province and its municipalities and district administration. Source: Indonesian Geospatial Information Agency [40].
Agriculture 09 00117 g001
Figure 2. Characteristics of the locally-produced rice. Source: Field survey, 2017.
Agriculture 09 00117 g002
Figure 3. Means of recognizing the locally-produced rice. Source: Field survey, 2017.
Agriculture 09 00117 g003
Figure 4. The locally-produced rice varieties in Jakarta Province, Indonesia. Source: Field survey, 2017.
Agriculture 09 00117 g004
Figure 5. The source of information about the locally-produced rice. Source: Field survey, 2017.
Agriculture 09 00117 g005
Table 1. Rice production and consumption in 2010–2016.
YearProduction (’000 Ton)Consumption (’000 Ton)
201040,23940,238.79
201141,05641,055
201241,10941,110
201341,99942,000
201441,85842,678
201544,96345,222
201646,14146,141
Rate (%/year)2.342.32
Source: Indonesian Statistical Bureau, 2017 [11].
Table 2. Volume of rice export and import in 2010–2016.
YearExport (Ton)Import (Ton)
2010-683,000
201110002,745,000
201210001,787,000
20133000471,000
20142000841,000
20151000860,000
20161000381,000
Source: Indonesian Statistical Bureau, 2017 [11].
Table 3. The sub-sample size per municipality of Jakarta Province.
MunicipalityPopulation of the MunicipalitySub-Sample Size per Municipality
North Jakarta1,764,61469
South Jakarta2,206,73286
West Jakarta2,496,00297
East Jakarta2,868,910112
Central Jakarta917,75436
Total10,254,012400
Source: Indonesian Statistical Bureau [42].
Table 4. Descriptions of variables used for the Poisson regression, as well as their measurements and expected signs.
VariableDescription and MeasurementExpected Sign
Dependent variable:
Frequency of purchases per week
(Number) *
Independent variables:
AgeActual age (years)+/−
Age squaredNumber+
GenderConsumer’s gender, Dummy: 1 = male; 0 = female+/−
EducationConsumer’s education level, Dummy: 1 = formal; 0 = non-formal+/−
IncomeConsumer’s income (USD)+/−
OccupationConsumer’s type of occupation, Dummy: 1 = government; 0 = otherwise+/−
TasteThe taste of the product, Dummy: 1 = tasty; 0 = not tasty+
ColorThe color of the product, Dummy:1 = attractive; 0 = otherwise+
ShapeThe shape/form/appearance of the product, Dummy: 1 = good; 0 = otherwise+
PackagingAppropriate packaging, Dummy: 1 = appropriate; 0 = otherwise+
LabelThe label of the product, Dummy: 1 = informative; 0 = otherwise+
The brand namePreference for brand name, Dummy: 1 = preferred; 0 = otherwise+
PricePrice per kg in USD 1 = reasonable; 0 = otherwise+
PlaceThe place where the consumer will buy the product, Dummy: 1 = traditional; 0 = otherwise+
PromotionThe promotion of the product, Dummy: 1 = have promotion; 0 = otherwise+
Income*OccupationNumber+/−
* The frequency of consumers’ purchases of locally-produced rice was the number of times that consumers purchased locally-produced rice in a week. The respondents provided several responses to the frequency of purchases as follows: Once a week, twice a week, once per month, twice per month, and three times per month. The numbers were normalized to a per week basis and used for the Poisson regression.
Table 5. Characteristics of the respondents.
CategoriesGenderTotal%
MaleFemale
Age
Under 20 years 2351.26
21–30 years 698515438.80
31–40 years 647413834.76
41–50 years 29305914.86
51–60 years 2117389.57
Above 60 years 3-30.76
Educational Background
Non-formal1-10.25
Lower than bachelor’s degree988618446.35
Bachelor’s degree709416441.31
Higher than bachelor’s degree19294812.09
Marital status
Single526411629.30
Married13514528070.21
Occupation
Government officer718215339.23
Private company officer758015540
State enterprises officer84123.08
Business owner1012225.64
Other17314812.31
Income per month (Rp.)
Below 500,00046102.58
500,001–1,000,00085133.36
1,000,001–2,000,000134174.40
2,000,001–3,000,00022264812.40
3,000,001–4,000,000615912031
4,000,001–5,000,00023406316.28
Above 5,000,000556111629.97
Source: Field survey, 2017.
Table 6. Results of the Poisson regression of consumers’ frequency of purchases of locally-produced rice (n = 320)
VariablesCoefficientStd. errorp-Value
Constant4.4560.2590.000
Gender0.076 *0.0390.051
Age−0.113 ***0.0140.000
Square of the Age0.001 ***0.0000.000
Education−0.014 *0.0080.070
Occupation0.0510.0760.499
Income0.222 **0.0900.013
Taste−0.0480.0650.458
Color−0.220 ***0.0540.000
Appearance0.0200.0440.648
Package−0.0440.0480.368
Label0.095 *0.0500.061
The brand name−0.0010.0520.979
Price1964.810 **775.6560.011
Place0.0380.0470.423
Promotion0.074 *0.0450.099
Income*Occupation1.40 × 10−51.38 × 10−50.312
Regression Diagnostics
R-squared0.074727Mean dependent var8.965625
Adjusted R-squared0.025867S.D. dependent var8.885306
Avg. log likelihood−4.481019Prob(LR statistic)0.000000
***, **, * denote significance at 1%, 5% and 10% levels, respectively.

