1. Introduction
With the rapid development of large-scale dairy farming, the amount of manure generated by dairy farms has continued to increase, and manure slurry produced by dairy farms has become an important potential source of agricultural non-point-source pollution [
1]. Manure slurry is rich in nutrient resources such as nitrogen and phosphorus. If rapid detection and accurate evaluation can be achieved, this would not only help improve the efficiency of manure resource utilization, but also provide an important basis for farmland nutrient management, fertilization decision-making, and non-point-source pollution control [
2,
3,
4]. Among these nutrients, total nitrogen (TN), as one of the key indicators reflecting the fertilizer value and environmental risk of manure slurry, is of great significance for manure slurry resource utilization and agricultural ecological environment protection [
5]. Traditional methods for nutrient determination in manure slurry mainly rely on chemical analysis. Although these methods generally provide high analytical accuracy, they usually involve cumbersome sample pretreatment, long detection cycles, high reagent consumption, and difficulty in meeting the demand for rapid on-site detection [
6]. Near-infrared spectroscopy (NIRS), with the advantages of rapidity, non-destructiveness, and environmental friendliness, has been widely applied in recent years in agricultural product quality evaluation, feed composition analysis, and nutrient detection of livestock manure [
7,
8,
9,
10]. For dairy farm manure slurry, which has complex composition and highly variable physical states, NIRS provides a promising technical basis for rapid nutrient detection. However, manure slurry systems exhibit pronounced heterogeneity and dynamic fluctuations. Their spectral responses are influenced not only by the concentrations of target nutrients, but also by multiple factors such as particle distribution, moisture status, organic matter composition, and differences in sample origin [
11,
12,
13]. In particular, under cross-farm, cross-season, and different treatment-stage conditions, the physicochemical properties and background composition of manure slurry may change substantially, resulting in distribution shifts in the mapping relationship between spectral features and target constituents, thereby affecting the generalization ability and robustness of predictive models. Therefore, identifying suitable models for near-infrared spectral analysis is of great importance.
In quantitative near-infrared analysis, partial least squares regression (PLSR) has long been one of the most widely used classical modeling methods because it can effectively handle high-dimensional and highly collinear spectral data [
14]. For spectral modeling tasks under small- and medium-sample conditions, PLSR often exhibits strong stability and competitiveness [
15]. Meanwhile, machine learning and deep learning methods such as support vector machines, random forests, multilayer perceptrons, and convolutional neural networks have gradually been applied in spectral analysis and have demonstrated good nonlinear modeling capabilities under certain conditions [
16,
17]. In addition, deep learning methods have attracted increasing attention in the field of near-infrared spectral analysis in recent years [
18,
19,
20]. Compared with traditional machine learning methods, deep learning models can automatically extract hierarchical features from spectra through multilayer nonlinear transformations, showing certain advantages in handling complex sample systems and potential nonlinear relationships [
21]. In particular, architectures such as one-dimensional convolutional neural networks can mine combined response features among adjacent wavelengths while preserving the local correlations of spectral sequences, thereby providing new modeling strategies for quantitative near-infrared analysis [
22,
23].
In addition to the spectra themselves, dairy farm manure slurry samples are usually accompanied by certain sample-contextual information, such as farm source, geographical location, sampling season, and treatment stage. To some extent, this information can reflect the sample formation environment, differences in feeding and management practices, spatial distribution characteristics, and seasonal variation patterns, and therefore has potential value for explaining fluctuations in manure slurry composition and corresponding spectral differences [
24,
25,
26]. Compared with pure spectral modeling, introducing sample-contextual information as auxiliary inputs may help compensate for the limited representational capacity of spectra alone and enhance the adaptability and predictive robustness of models for heterogeneous samples [
27,
28]. In a recent study, Li et al. systematically investigated the influence of seasonal fluctuations on NIRS modeling of dairy farm manure slurry and preliminarily confirmed the feasibility of constructing a global prediction model to cope with cross-season monitoring [
29]. However, that study also revealed a deeper scientific challenge: within a purely spectral feature space, it is difficult for the model to completely disentangle the non-characteristic baseline drift caused by complex spatiotemporal backgrounds. For heterogeneous data collected under large-scale and multi-farm conditions, spectral features alone are often insufficient to independently support a highly robust prediction framework, resulting in phenomena such as “similar background but different spectra” or “different background but similar spectra”. This means that if the model relies solely on spectral physical signals while ignoring the contextual information associated with sample generation, its prediction accuracy will inevitably suffer severe deviations when facing samples from unseen farms or under extreme climatic conditions. Moreover, the introduction of contextual information does not necessarily lead to optimal performance simply through direct addition, because different features may provide complementary information, but may also introduce redundancy or even interference. Therefore, systematic investigation is needed at both the feature-combination level and the fusion-mechanism level [
30,
31,
32].
To address the above issues, this study focused on manure slurry samples collected from dairy farms in Tianjin, China, with the specific objective of total nitrogen (TN) prediction, and constructed a multi-branch gated deep learning model integrating near-infrared spectra and multi-source sample-contextual features. First, CARS-selected characteristic near-infrared wavelengths were used as the primary input to establish baseline models under pure spectral conditions, and classical machine learning methods were compared with deep learning methods to clarify the baseline role of PLSR in the current task. Subsequently, sample-contextual information including farm name, longitude, latitude, and season was introduced as auxiliary features, and separate numerical-feature and categorical-feature branches were constructed. On this basis, a joint framework integrating multi-scale convolution, squeeze-and-excitation (SE) attention, and gated fusion, namely MultiScaleSE-GatedCNN, was proposed to achieve collaborative modeling of spectral and sample-contextual information. Finally, through multi-model comparison and feature-combination ablation experiments, the effects of multi-source sample-contextual features on TN prediction performance were systematically analyzed, and the optimal feature combination and the relative contributions of different information sources were identified. Compared with the study of Li et al. [
29], the present work differs in both research objective and modeling strategy. That study mainly focused on the influence of seasonal variation on NIRS-based prediction of TN and TP in dairy farm manure slurry, and established single-season models as well as a global model of four seasons (GMFS) using PLS regression. Their results demonstrated the importance of season in slurry NIRS modeling, but the modeling framework remained essentially based on spectral information and season-oriented scenario analysis. In contrast, the present study extends the problem from seasonal-effect analysis to multi-source contextual fusion under cross-farm heterogeneous conditions. In addition to near-infrared spectra, contextual variables such as farm name, longitude, latitude, and season were incorporated as auxiliary inputs, and a MultiScaleSE-GatedCNN framework was developed to achieve branch-specific representation learning and adaptive fusion of heterogeneous information sources. Therefore, the improvement explored in this study is not limited to an architectural replacement, but lies in a broader modeling framework that explicitly integrates spectral and sample-contextual information to enhance TN prediction robustness under complex backgrounds.
2. Materials and Methods
2.1. Study Area and Sample Collection
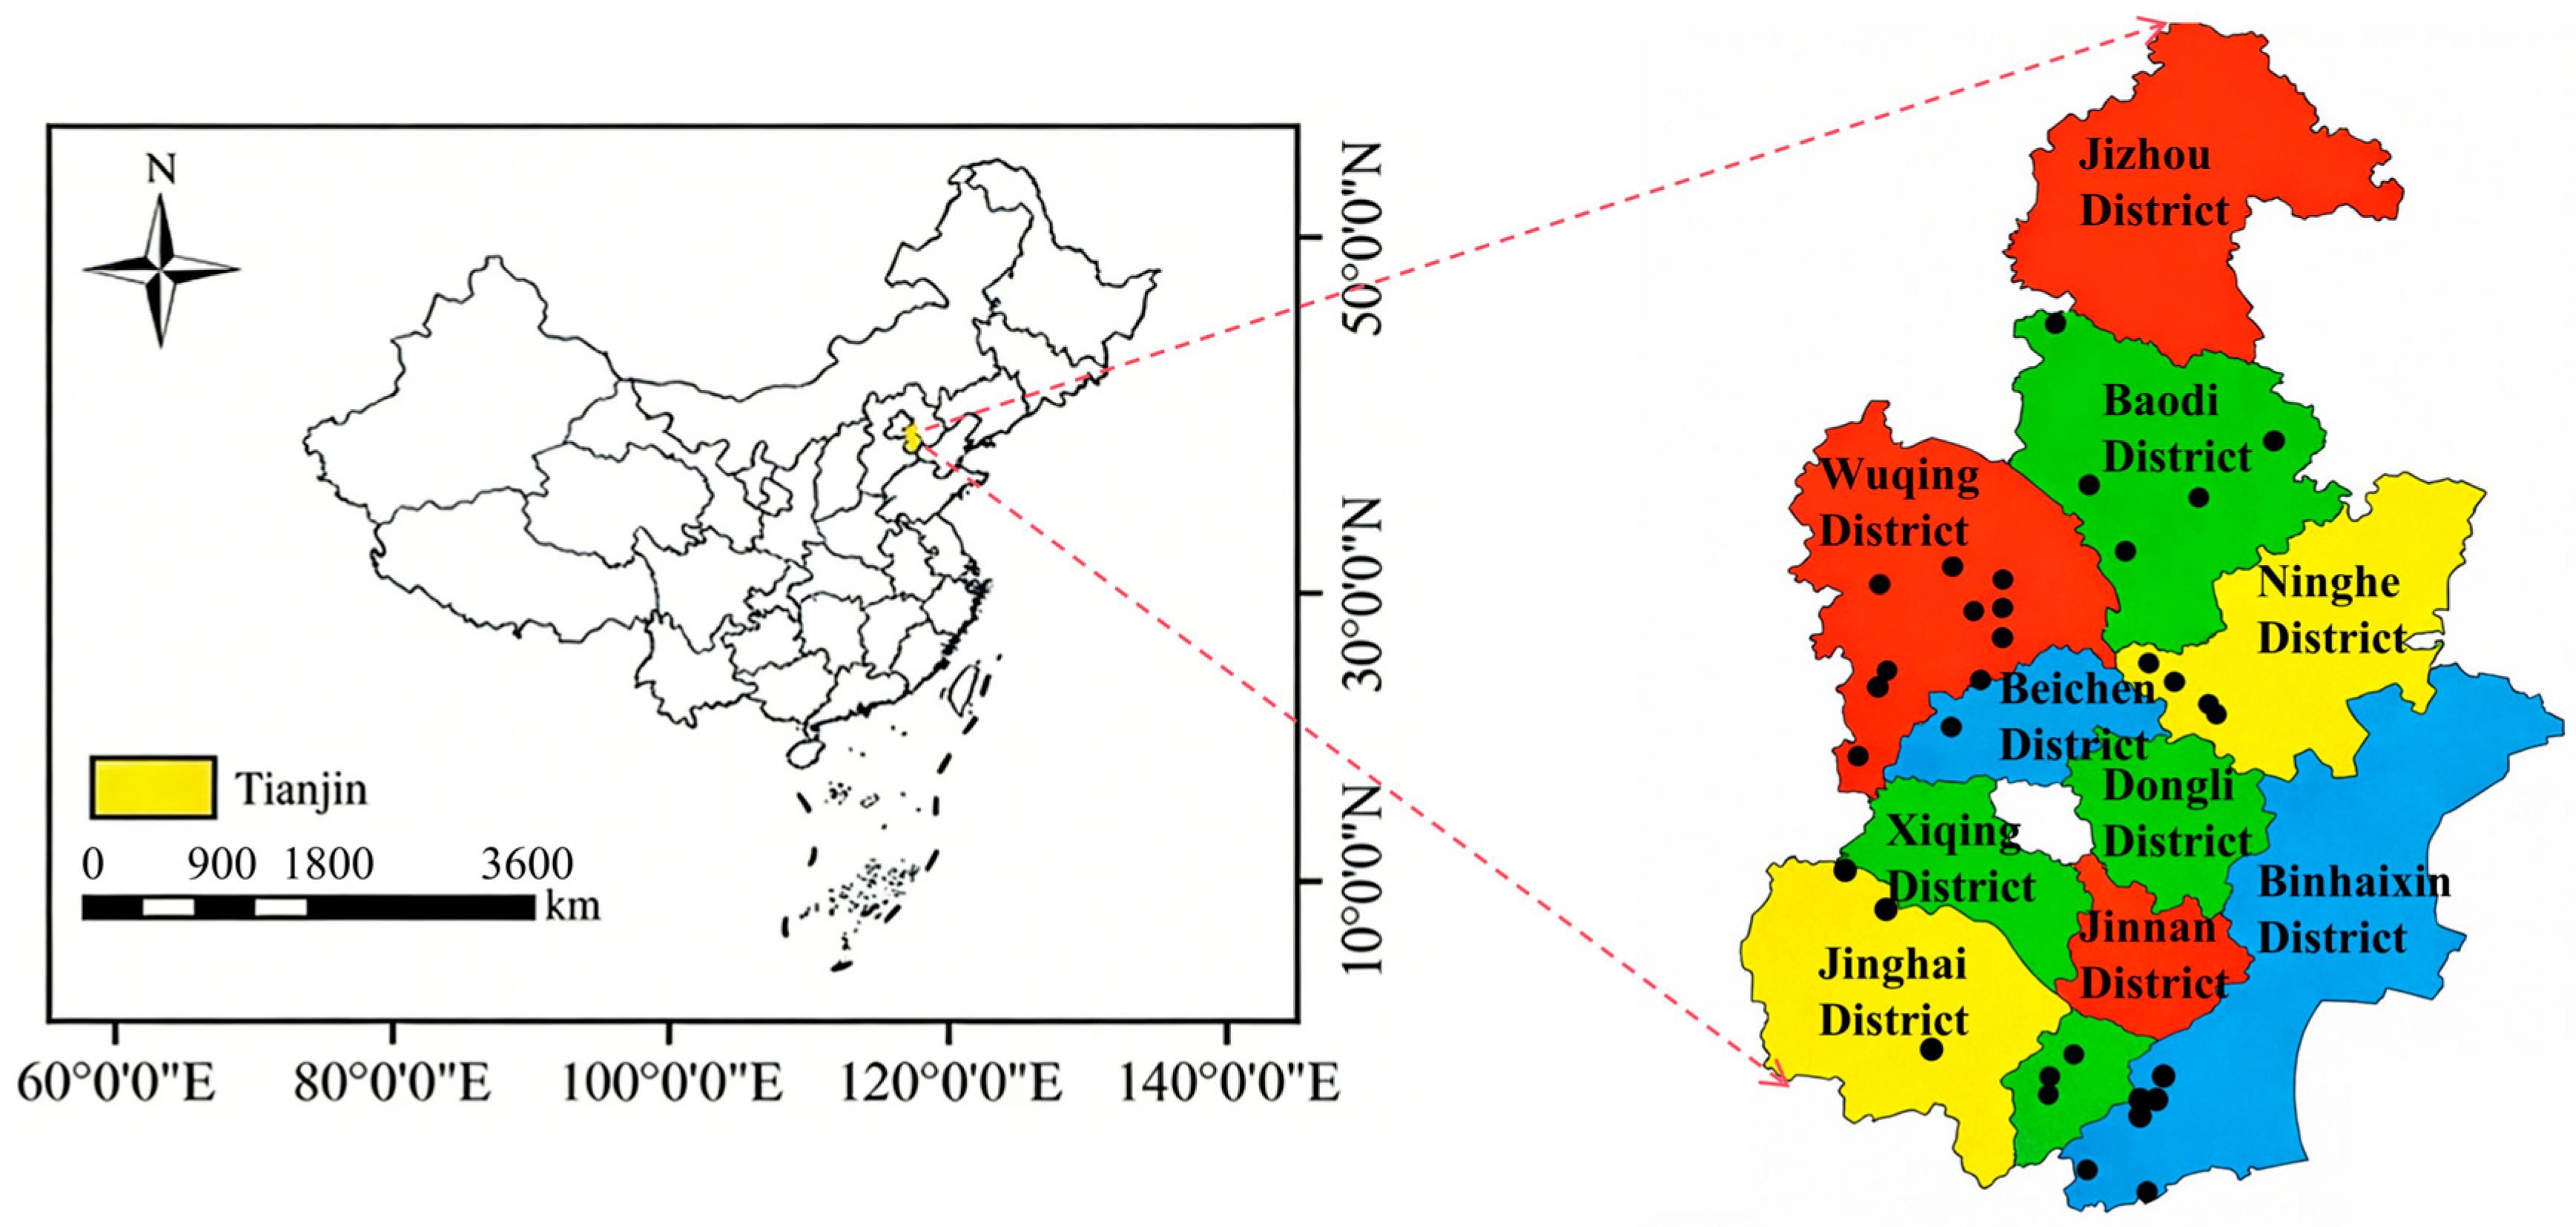
The samples used in this study were collected from 36 representative large-scale dairy farms in Tianjin, China, as shown in
Figure 1. Tianjin is located in the North China Plain and is a densely concentrated area of intensive livestock farming. Its manure slurry management patterns and nutrient distribution characteristics are highly representative at the regional scale. To ensure that the developed model could adequately cover the nutrient complexity and spatiotemporal variability encountered in real production scenarios, sampling was conducted across multiple years (2018, 2019, and 2022) and strictly covered all four seasons: spring, summer, autumn, and winter.
A total of 768 manure slurry samples were initially collected. After the two-stage outlier detection and removal procedure described in
Section 2.4, 747 samples were retained for subsequent modeling analysis. These samples were collected from frontline production sites and covered 24 typical manure slurry treatment stages, including oxidation ponds, sewage collection pools, secondary sedimentation tanks, epidemic prevention ditches, and biogas slurry tanks. To enable deep integration of multi-source information, each sample was synchronously associated with detailed sample-contextual features during spectral acquisition and physicochemical measurement, including the geographical coordinates of the sampling point, farm name, treatment stage, and sampling season. This multidimensional data structure not only recorded the chemical composition of manure slurry nutrients, but also characterized the specific spatiotemporal context in which each sample was generated, thereby laying the foundation for subsequent investigation of the role of sample-contextual features in prediction modeling.
2.2. Spectral Acquisition
To obtain near-infrared spectral information from manure slurry samples, a Fourier-transform near-infrared spectrometer (PerkinElmer, Shelton, CT, USA) equipped with an indium gallium arsenide (InGaAs) detector and an integrating sphere accessory was used for spectral acquisition. Scanning was performed at room temperature over the spectral range of 4000–12,000 cm−1, with a resolution of 8 cm−1 and a scanning interval of 2 cm−1. To improve spectral stability and signal-to-noise ratio, each sample was scanned 64 times, and the average spectrum was used as the final spectral data for that sample. The parameters and accessory configuration are consistent with your related slurry NIRS studies.
For sample preparation, slurry samples were collected and mixed according to our previous sampling protocol. Briefly, subsamples were collected below the liquid surface, thoroughly mixed, transferred into sampling bottles, and transported to the laboratory in an insulated container. Before spectral acquisition, each sample bottle was thoroughly shaken to reduce particle sedimentation and local non-uniformity. The homogenized slurry was then transferred into a sample cup to approximately two-thirds of its volume, placed on the rotating platform of the integrating sphere, and scanned using the built-in reference background. Spectral acquisition was initiated immediately after sample loading. All samples were scanned under identical testing conditions to ensure comparability of spectral data among samples.
2.3. Physicochemical Determination
To establish a quantitative near-infrared prediction model for total nitrogen (TN), reference TN values were measured for all manure slurry samples. Immediately after collection, the samples were stored in a portable incubator at 4 °C and transported back to the laboratory to minimize changes in sample properties during transportation and short-term storage. The TN content was determined according to the relevant standard methods and analyzed using an automatic Kjeldahl analyzer (Kjeltec 8400, FOSS, Hillerød, Denmark). Parallel samples were included during the experiment to ensure the accuracy and repeatability of the measurements. The obtained physicochemical TN values were used as the reference values for near-infrared spectral modeling, model training, and performance evaluation. In addition, to ensure a one-to-one correspondence between spectral data and physicochemical data, each sample was matched with its measured TN value after spectral acquisition and further linked with sample-contextual information such as farm source, geographical location, and season, ultimately forming a complete dataset for subsequent modeling analysis.
2.4. Outlier Detection and Removal
Before model construction, a two-stage outlier removal strategy was applied to improve the reliability of the dataset. In the first stage, samples with obviously abnormal spectral morphology and baseline patterns were identified through visual inspection and removed. These spectra showed clear deviations from the overall spectral trend and were considered unsuitable for subsequent modeling. In total, 11 samples were excluded at this stage.
In the second stage, a residual-based screening procedure was performed using the deep learning framework developed in this study. Specifically, a five-fold out-of-fold (OOF) prediction strategy was adopted for the remaining samples. In each fold, the model was trained on four subsets and used to predict the held-out subset, so that OOF predictions were obtained for the entire dataset. The absolute residuals between the predicted and reference TN values were then calculated, and the 10 samples with the largest absolute residuals were identified as residual outliers. These samples were synchronously removed from both the spectral file and the auxiliary-feature file. After the above two-stage procedure, 747 samples were retained for subsequent modeling and analysis.
2.5. Spectral Preprocessing and Feature Variable Selection
During spectral acquisition, a large amount of noise may be introduced from the environment, stray light, and the internal components of the instrument. Large quantities of irrelevant and redundant information, as well as noisy and unreliable data, make knowledge discovery during the training stage more difficult. Therefore, data preprocessing is a crucial step in machine learning. This step plays a key role in addressing problems such as noise, redundancy, and missing data values [
33]. The specific preprocessing strategies included the use of multiplicative scatter correction (MSC) to eliminate optical path differences and scattering interference caused by uneven particle distribution in samples [
34]; application of first derivative (FD) processing to remove slowly varying baseline background and highlight overlapping characteristic peaks [
35]; and use of the Savitzky–Golay (SG) smoothing algorithm to suppress high-frequency random noise while preserving spectral characteristics without distortion [
36]. In this study, the above three preprocessing methods, as well as the combination of SG and FD (SG_1st)
, were used as candidate preprocessing schemes. SG_1st denotes first-derivative preprocessing implemented using a Savitzky–Golay filter. The polynomial order was set to 2, and the window length was adaptively selected as the largest valid odd number from 15, 11, 9, 7, and 5 that was smaller than the number of retained spectral variables. By comparing the statistical performance of the calibration set and the test set under different preprocessing strategies, the preprocessing result with the highest prediction accuracy was finally selected for the subsequent feature selection step. By comparing the statistical performance of the calibration set and the test set under different preprocessing strategies, the preprocessing result with the highest prediction accuracy was finally selected for the subsequent feature selection step.
For spectral feature variable selection, considering the high dimensionality, strong collinearity, and dispersed effective information of the near-infrared spectra of manure slurry, this study employed the competitive adaptive reweighted sampling (CARS) algorithm. This algorithm first simulates the “survival of the fittest” mechanism in biological evolution and uses Monte Carlo sampling together with an exponentially decreasing function to forcibly remove wavelengths with relatively small absolute regression coefficients, thereby achieving an initial coarse screening of spectral dimensions [
37].
2.6. Sample-Contextual Information Processing and Quantification Strategy
Many machine learning algorithms require numerical input data; therefore, categorical features must be converted into numerical representations before being introduced into the algorithm [
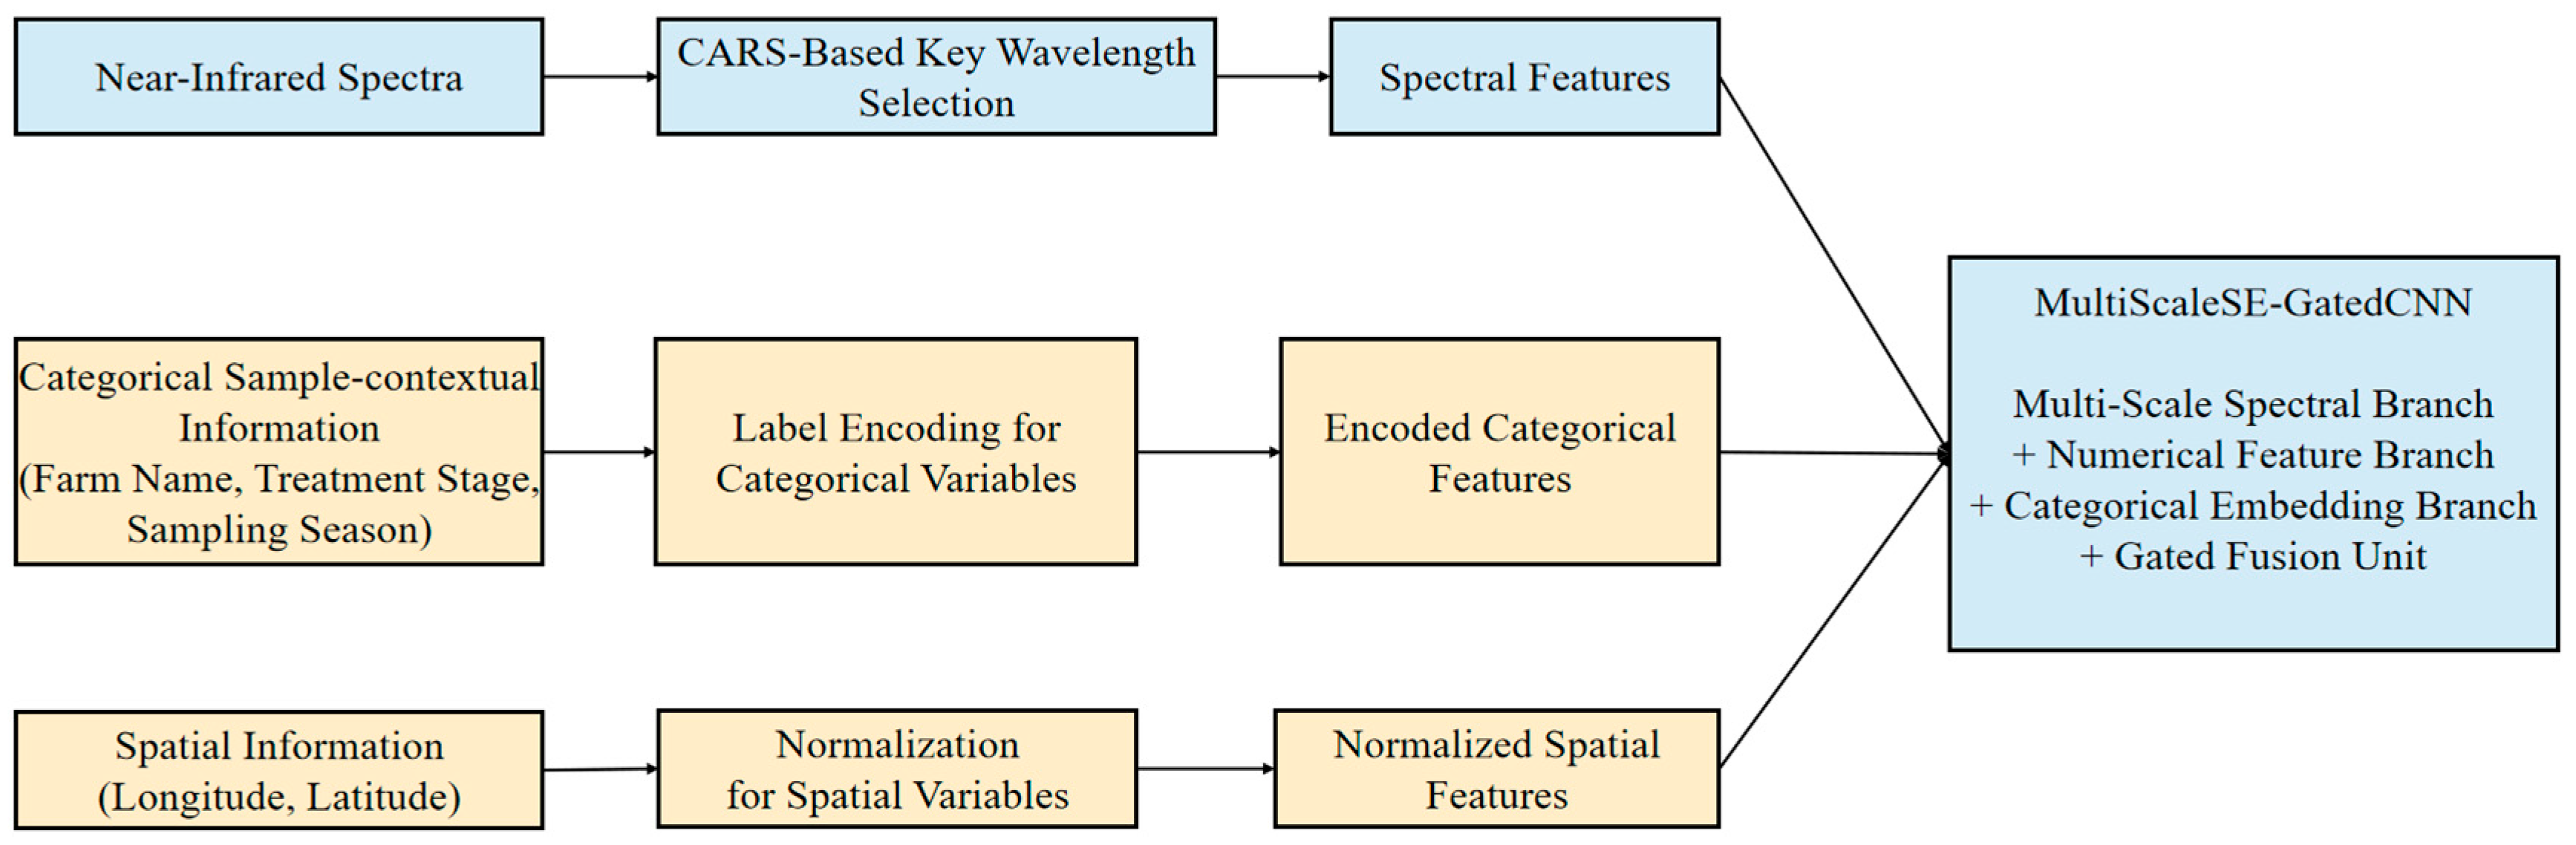
38]. For the non-spectral features introduced in this study, a refined quantification strategy was adopted, as illustrated in
Figure 2. Farm name, treatment stage, and sampling season were treated as discrete categorical variables and converted into numerical features using label encoding. This processing strategy was intended to characterize the evolutionary background of the physicochemical properties of manure slurry under different management modes, biochemical transformation stages, and temperature fluctuations. For longitude and latitude coordinates, normalization was applied to ensure that spatial features and spectral features were kept on a comparable numerical scale in subsequent calculations. Through this explicit representation of multi-source information, the model was able to obtain support from sample-contextual information in addition to the “physical spectral signal”.
2.7. Model Construction
To systematically evaluate the effects of near-infrared spectra and multi-source sample-contextual features on total nitrogen (TN) prediction in dairy farm manure slurry, this study constructed traditional machine learning models and a deep learning model under a unified data partition scheme. All models were trained and evaluated using the same split to ensure a fair comparison among different modeling strategies. Specifically, the dataset retained after outlier removal was randomly divided into a training set and a test set at a ratio of 8:2 using a fixed random seed, and a validation set was further split from the training set for model selection and training monitoring. It should be noted that the purpose of this study was to develop a robust prediction framework for complex heterogeneous samples collected across multiple farms, seasons, and treatment stages, rather than to establish a strict leave-one-farm-out extrapolation model for completely unseen farms. Therefore, the present split setting is intended to evaluate model robustness under heterogeneous sample conditions within the studied population. At the same time, because “farm name” was introduced as a contextual feature, this setting does not constitute a rigorous farm-wise generalization assessment, and this issue is further discussed as a limitation of the present study.
2.7.1. Machine Learning Model Construction
For the traditional machine learning models, partial least squares regression (PLSR), support vector regression (SVR) [
39], random forest (RF) [
40], k-nearest neighbors regression (KNN) [
41], and multilayer perceptron (MLP) [
42] were selected as comparative models. Among them, PLSR, as a classical method in quantitative near-infrared analysis, was used to construct a strong baseline under pure spectral conditions, whereas the remaining models were used to compare the predictive ability of different nonlinear modeling methods under both pure spectral and multi-source feature conditions. To improve the rationality of comparison, moderate hyperparameter search was performed for each machine learning model, and relatively optimal parameter combinations were determined based on the validation results on the training set. Specifically, the number of latent variables was mainly optimized for PLSR; the penalty parameter C, kernel parameter gamma, and error tolerance parameter epsilon were mainly optimized for SVR; the number of trees, tree depth, minimum number of samples in leaf nodes, and maximum number of features were mainly optimized for RF; the number of neighbors and weighting scheme were mainly optimized for KNN; and the hidden-layer structure, regularization coefficient alpha, and learning rate were mainly optimized for MLP. Ultimately, all traditional machine learning models participated in the subsequent result comparison using their respective optimal parameter settings.
2.7.2. MultiScaleSE-GatedCNN Model Construction
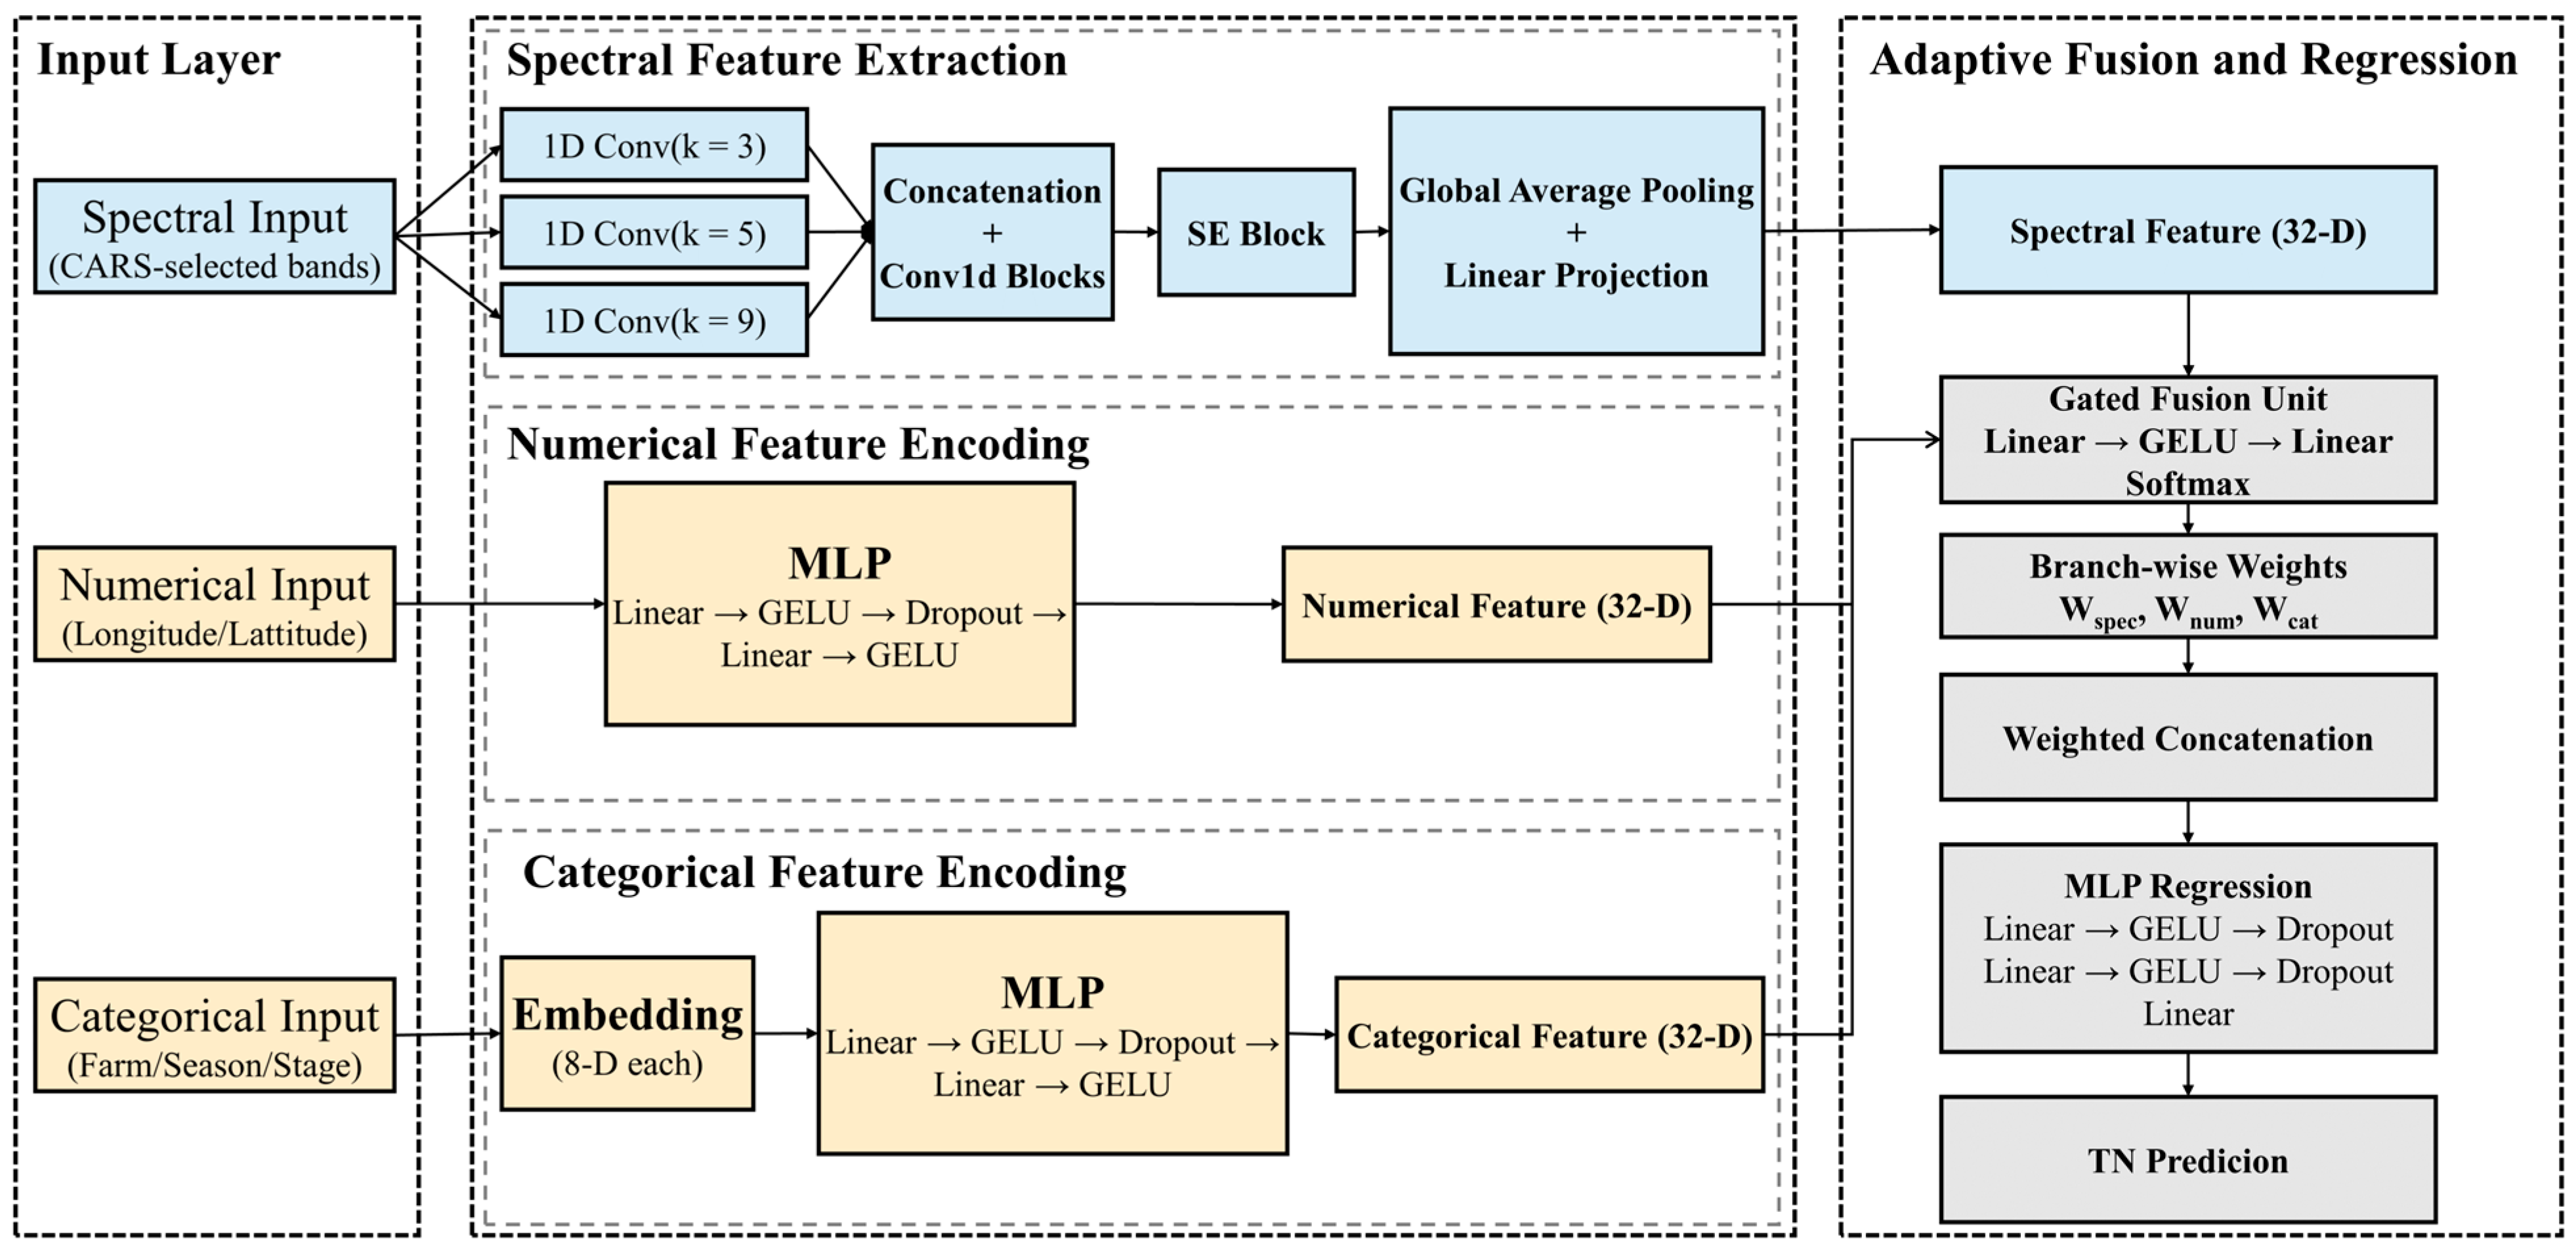
For the deep learning model, a MultiScaleSE-GatedCNN model was proposed for TN prediction, and its structural configuration and architecture are shown in
Table 1 and
Figure 3, respectively. This model takes spectral variables as the primary input and performs collaborative modeling together with numerical sample-contextual features and categorical sample-contextual features. The model consists of a spectral branch, a numerical feature branch, a categorical feature branch, a gated fusion unit, and a regression head. The spectral branch uses multi-scale one-dimensional convolutions to extract local spectral-shape features under different receptive fields and combines them with an SE module to enhance important channel responses. The numerical branch extracts latent representations of continuous variables through a multilayer perceptron. The categorical branch learns compact representations of discrete variables through an embedding layer and a fully connected network. The gated fusion unit dynamically allocates the contribution weights of different information sources through an adaptive weighting mechanism, and the final TN prediction is produced through the regression head. Such as
Table 2, for model training, the AdamW optimizer was used together with a cosine annealing learning-rate scheduler. The maximum number of epochs was set to 160, the batch size was 16, the initial learning rate was 0.0008, the weight decay coefficient was 0.0005, and the dropout ratio was 0.18. To improve robustness to outliers, the Huber loss was adopted with δ = 1.0. In addition, gradient clipping with a threshold of 1.0 was applied to suppress unstable gradient fluctuations during training. Model performance on the validation set was evaluated every 5 epochs, and early stopping was triggered when no improvement was observed for 15 consecutive evaluation rounds. The optimal parameter setting determined on the training–validation split was then fixed for final model training and test-set evaluation. To improve the interpretability of the proposed model, the outputs of the gated fusion unit after the Softmax operation were further analyzed during inference.
2.7.3. SimpleConcatMLP Baseline Construction
To evaluate whether the gated fusion mechanism provides practical benefits beyond a straightforward fusion strategy, an additional deep learning baseline, denoted as SimpleConcatMLP, was introduced. In this baseline, the CARS-selected spectral variables and the encoded sample-contextual features were directly concatenated into a single input vector and then fed into a standard multilayer perceptron for regression. Unlike MultiScaleSE-GatedCNN, this model did not include branch-specific feature extraction or gated weighting, and therefore represented a direct-concatenation fusion strategy.
For fair comparison, the same training, validation, and test split as described in
Section 2.7 was used. The same spectral preprocessing procedure, contextual feature encoding strategy, and evaluation metrics were also retained. Under the optimal feature combination of spectra + farm name + longitude + season, the final hyperparameters of SimpleConcatMLP were set as follows: epochs = 160, batch size = 16, learning rate = 0.0008, weight decay = 0.0005, and dropout = 0.18.
2.8. Model Evaluation
To objectively evaluate the predictive performance of different models for total nitrogen (TN) in dairy farm manure slurry, the coefficient of determination (R2), root mean square error (RMSE), and residual prediction deviation (RPD) were adopted as the main evaluation indicators. These metrics were used to comprehensively assess the models in terms of goodness of fit, prediction error, and practical applicability.
The coefficient of determination (R
2) reflects the proportion of variance in the reference values that can be explained by the model, and a larger value indicates better predictive ability [
43]. The root mean square error (RMSE) represents the average deviation between the predicted values and the reference values, and a smaller value indicates higher prediction accuracy [
44]. The residual prediction deviation (RPD) is defined as the ratio of the standard deviation of the reference values to the prediction error and is commonly used to evaluate the practical usefulness of a model. In general, an RPD value greater than 2.0 indicates that the model has good predictive ability, while an RPD value greater than 3.0 suggests excellent predictive performance and practical application potential. To further distinguish model performance during calibration and external prediction, R
c2 and RMSEC were used to evaluate the fitting performance of the calibration set, whereas R
p2, RMSEP, and RPD were used to evaluate the predictive performance of the test set. Among them, R
c2 and R
p2 represent the coefficients of determination for the calibration set and test set, respectively; RMSEC and RMSEP represent the root mean square errors of calibration and prediction, respectively. In this study, model performance was comprehensively compared based on these indicators to identify the optimal modeling method and feature combination for TN prediction in dairy farm manure slurry.
The corresponding calculation formulas are shown as follows:
where
is the reference value of sample
,
is the predicted value of sample
,
is the mean of all reference values,
is the number of samples, and
is the standard deviation of the reference values in the prediction set. Data processing and model development were conducted in Python (v3.10.18). Deep learning was implemented using PyTorch (v2.5.1) and torchaudio (v2.5.1), machine learning analysis was performed using scikit-learn (v1.7.2), and figures were prepared using Origin 2021.
3. Results
3.1. Statistical Analysis of the Physicochemical Characteristics of Manure Slurry
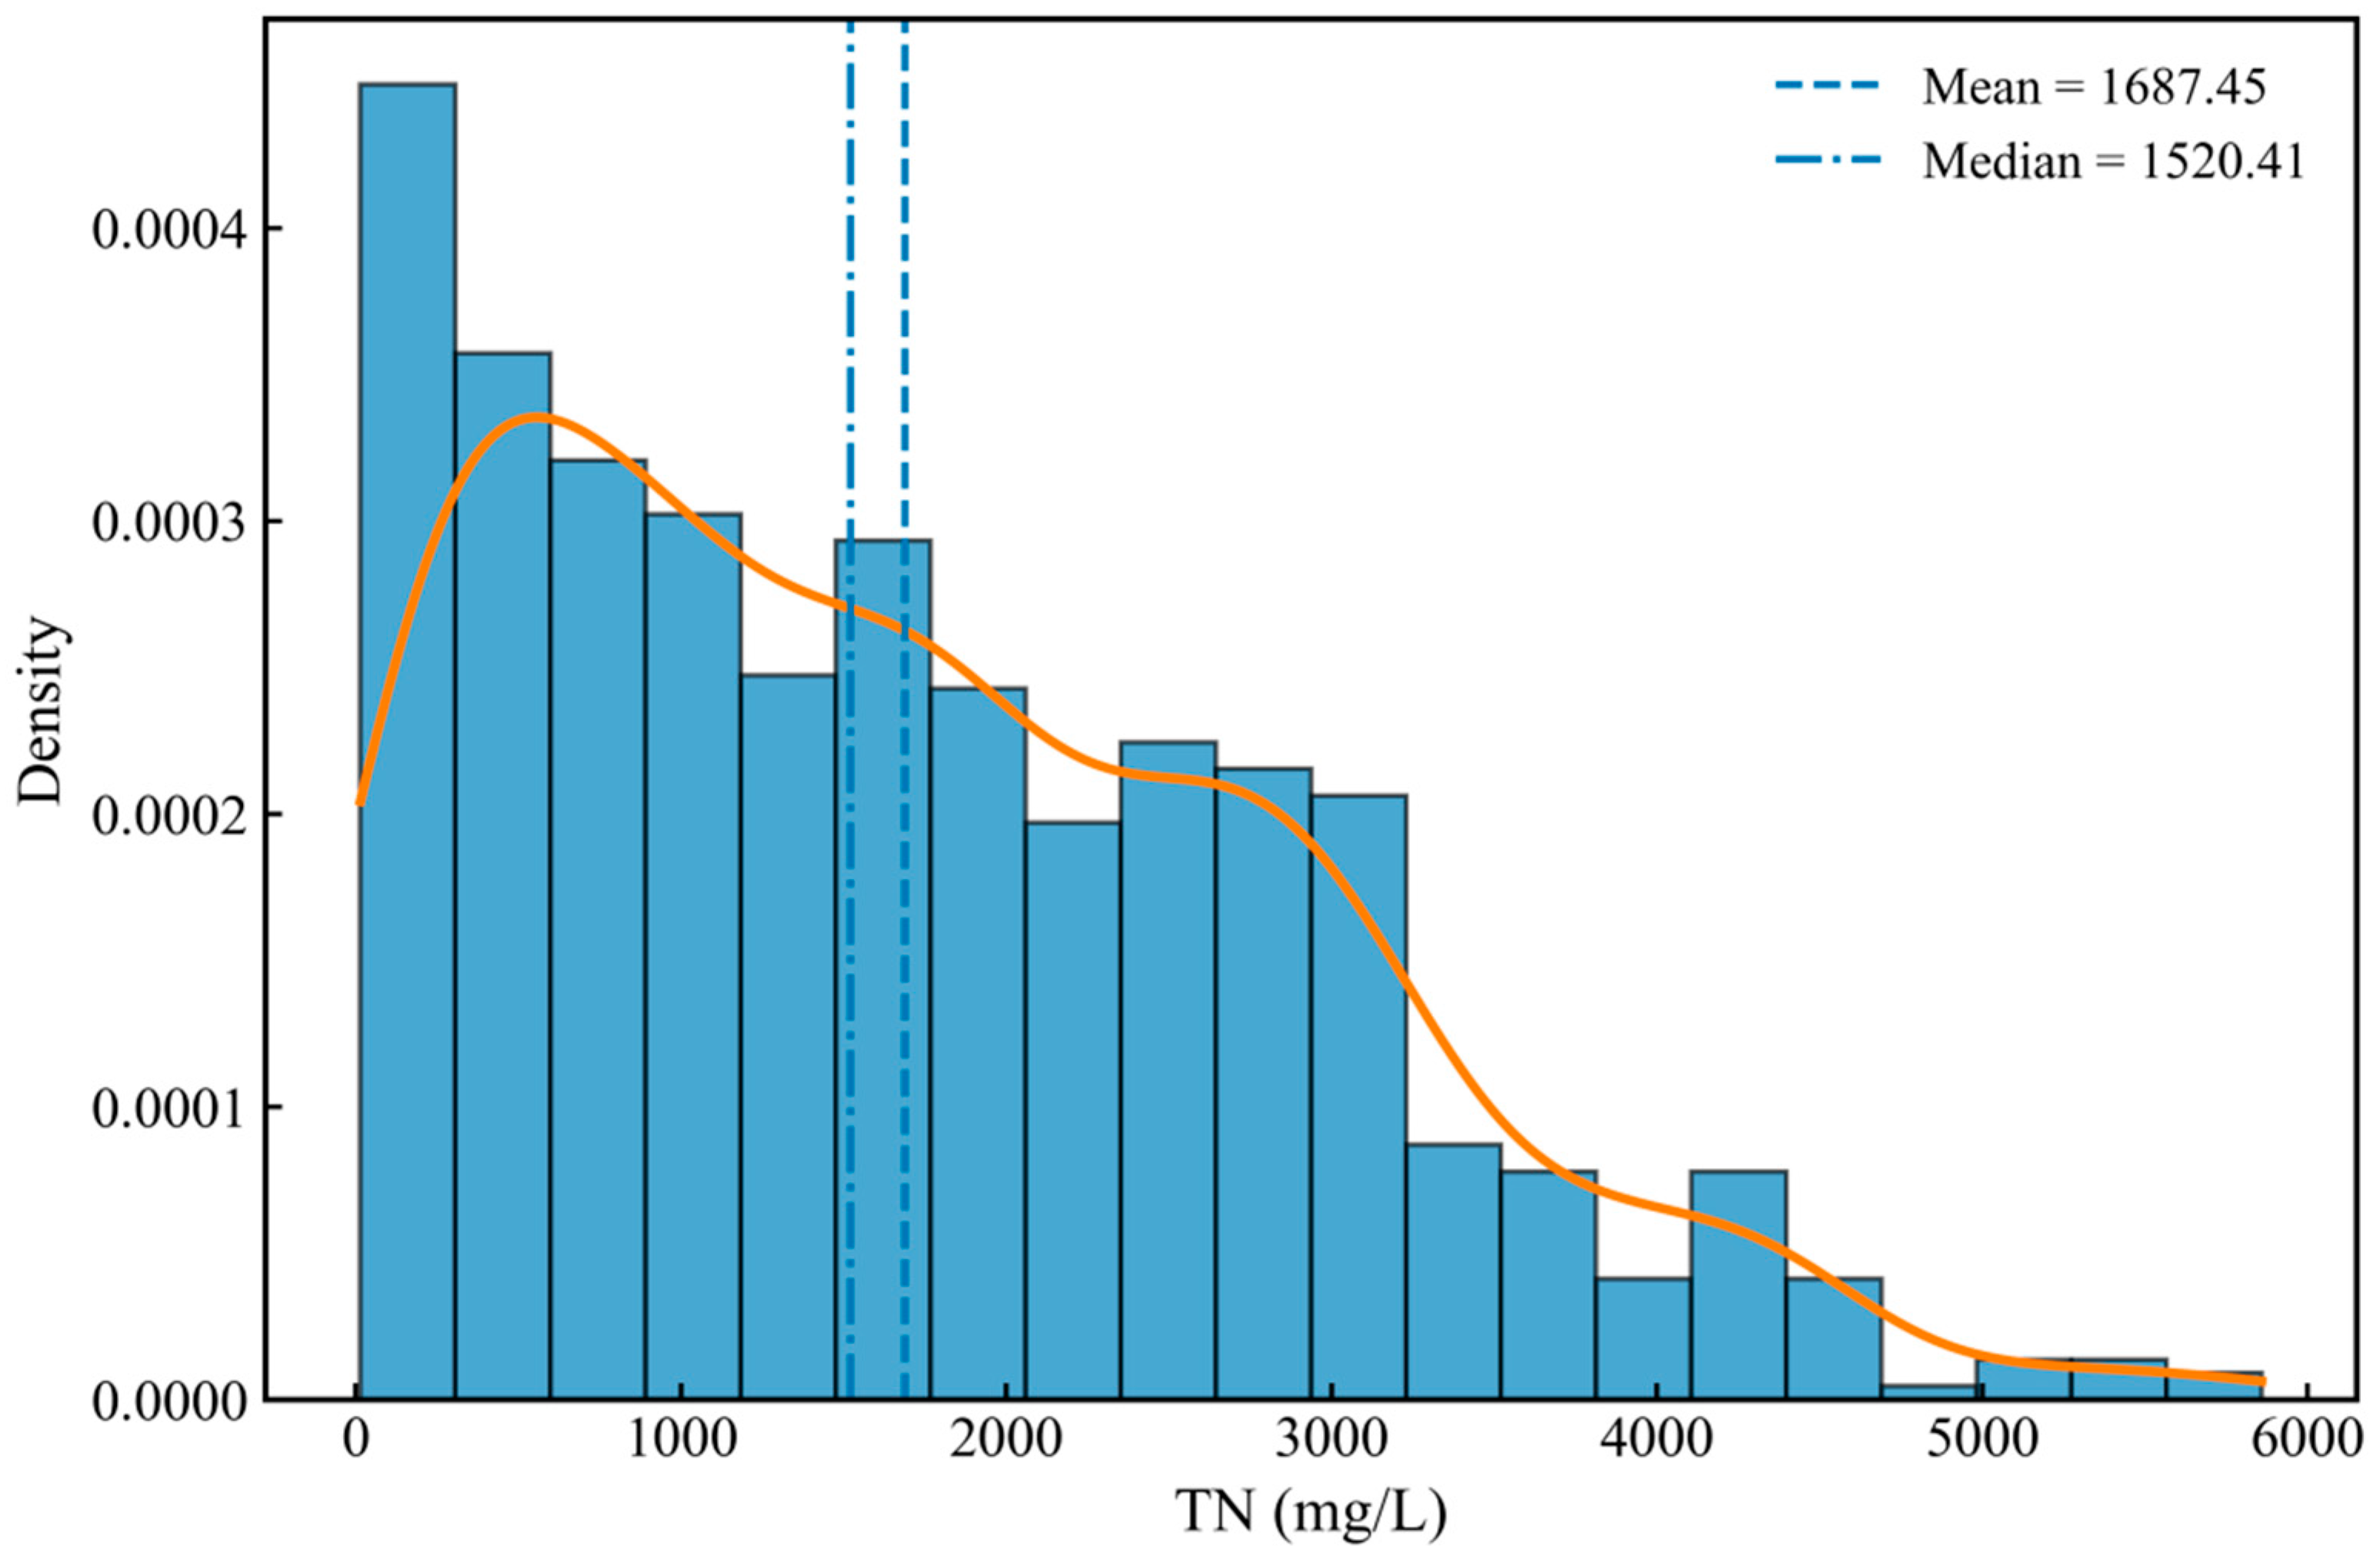
To clarify the overall distribution characteristics of total nitrogen (TN) in the studied samples and to provide a data basis for subsequent modeling analysis, the physicochemical determination results of TN in manure slurry samples were statistically analyzed, and the results are shown in
Table 3 and
Figure 4. As shown in
Table 3, the TN content of the samples in this study varied over a wide range, indicating obvious nutrient differences among samples. The broad value range and the high coefficient of variation suggest strong dispersion and heterogeneity of the samples, which are closely related to farm source, spatial location, seasonal variation, and the complex composition of manure slurry. Overall, the TN content exhibited substantial variation, providing a rich data basis for the subsequent development of a robust quantitative prediction model.
Figure 4 further shows that the frequency distribution of TN did not fully follow a symmetric distribution, but instead exhibited a certain right-skewed characteristic. Most samples were concentrated in the relatively low-to-medium concentration range, whereas the number of high-concentration samples was relatively small, resulting in a long-tail distribution in the high-value region. This indicates that a few manure slurry samples with relatively high TN contents were present in the dataset, causing the overall distribution to extend toward higher values. The fact that the mean was higher than the median also further suggests that the TN data as a whole followed a positively skewed distribution pattern. This distribution characteristic indicates obvious non-uniformity and complexity in the nutrient composition of manure slurry samples. On the one hand, the broad value range is beneficial for improving the model’s learning ability across different concentration intervals; on the other hand, the skewed distribution and the long tail of high-value samples also increase the difficulty of model fitting, especially for the prediction of high-concentration samples.
In summary, the TN content of the studied samples exhibited a large variation range and obvious non-uniform distribution characteristics, indicating that the dataset constructed in this study can effectively reflect the complexity of manure slurry samples under actual farm production conditions and provide a basis for comparing the effectiveness of different models and multi-source feature-fusion strategies.
3.2. Analysis of Raw Spectral Curves
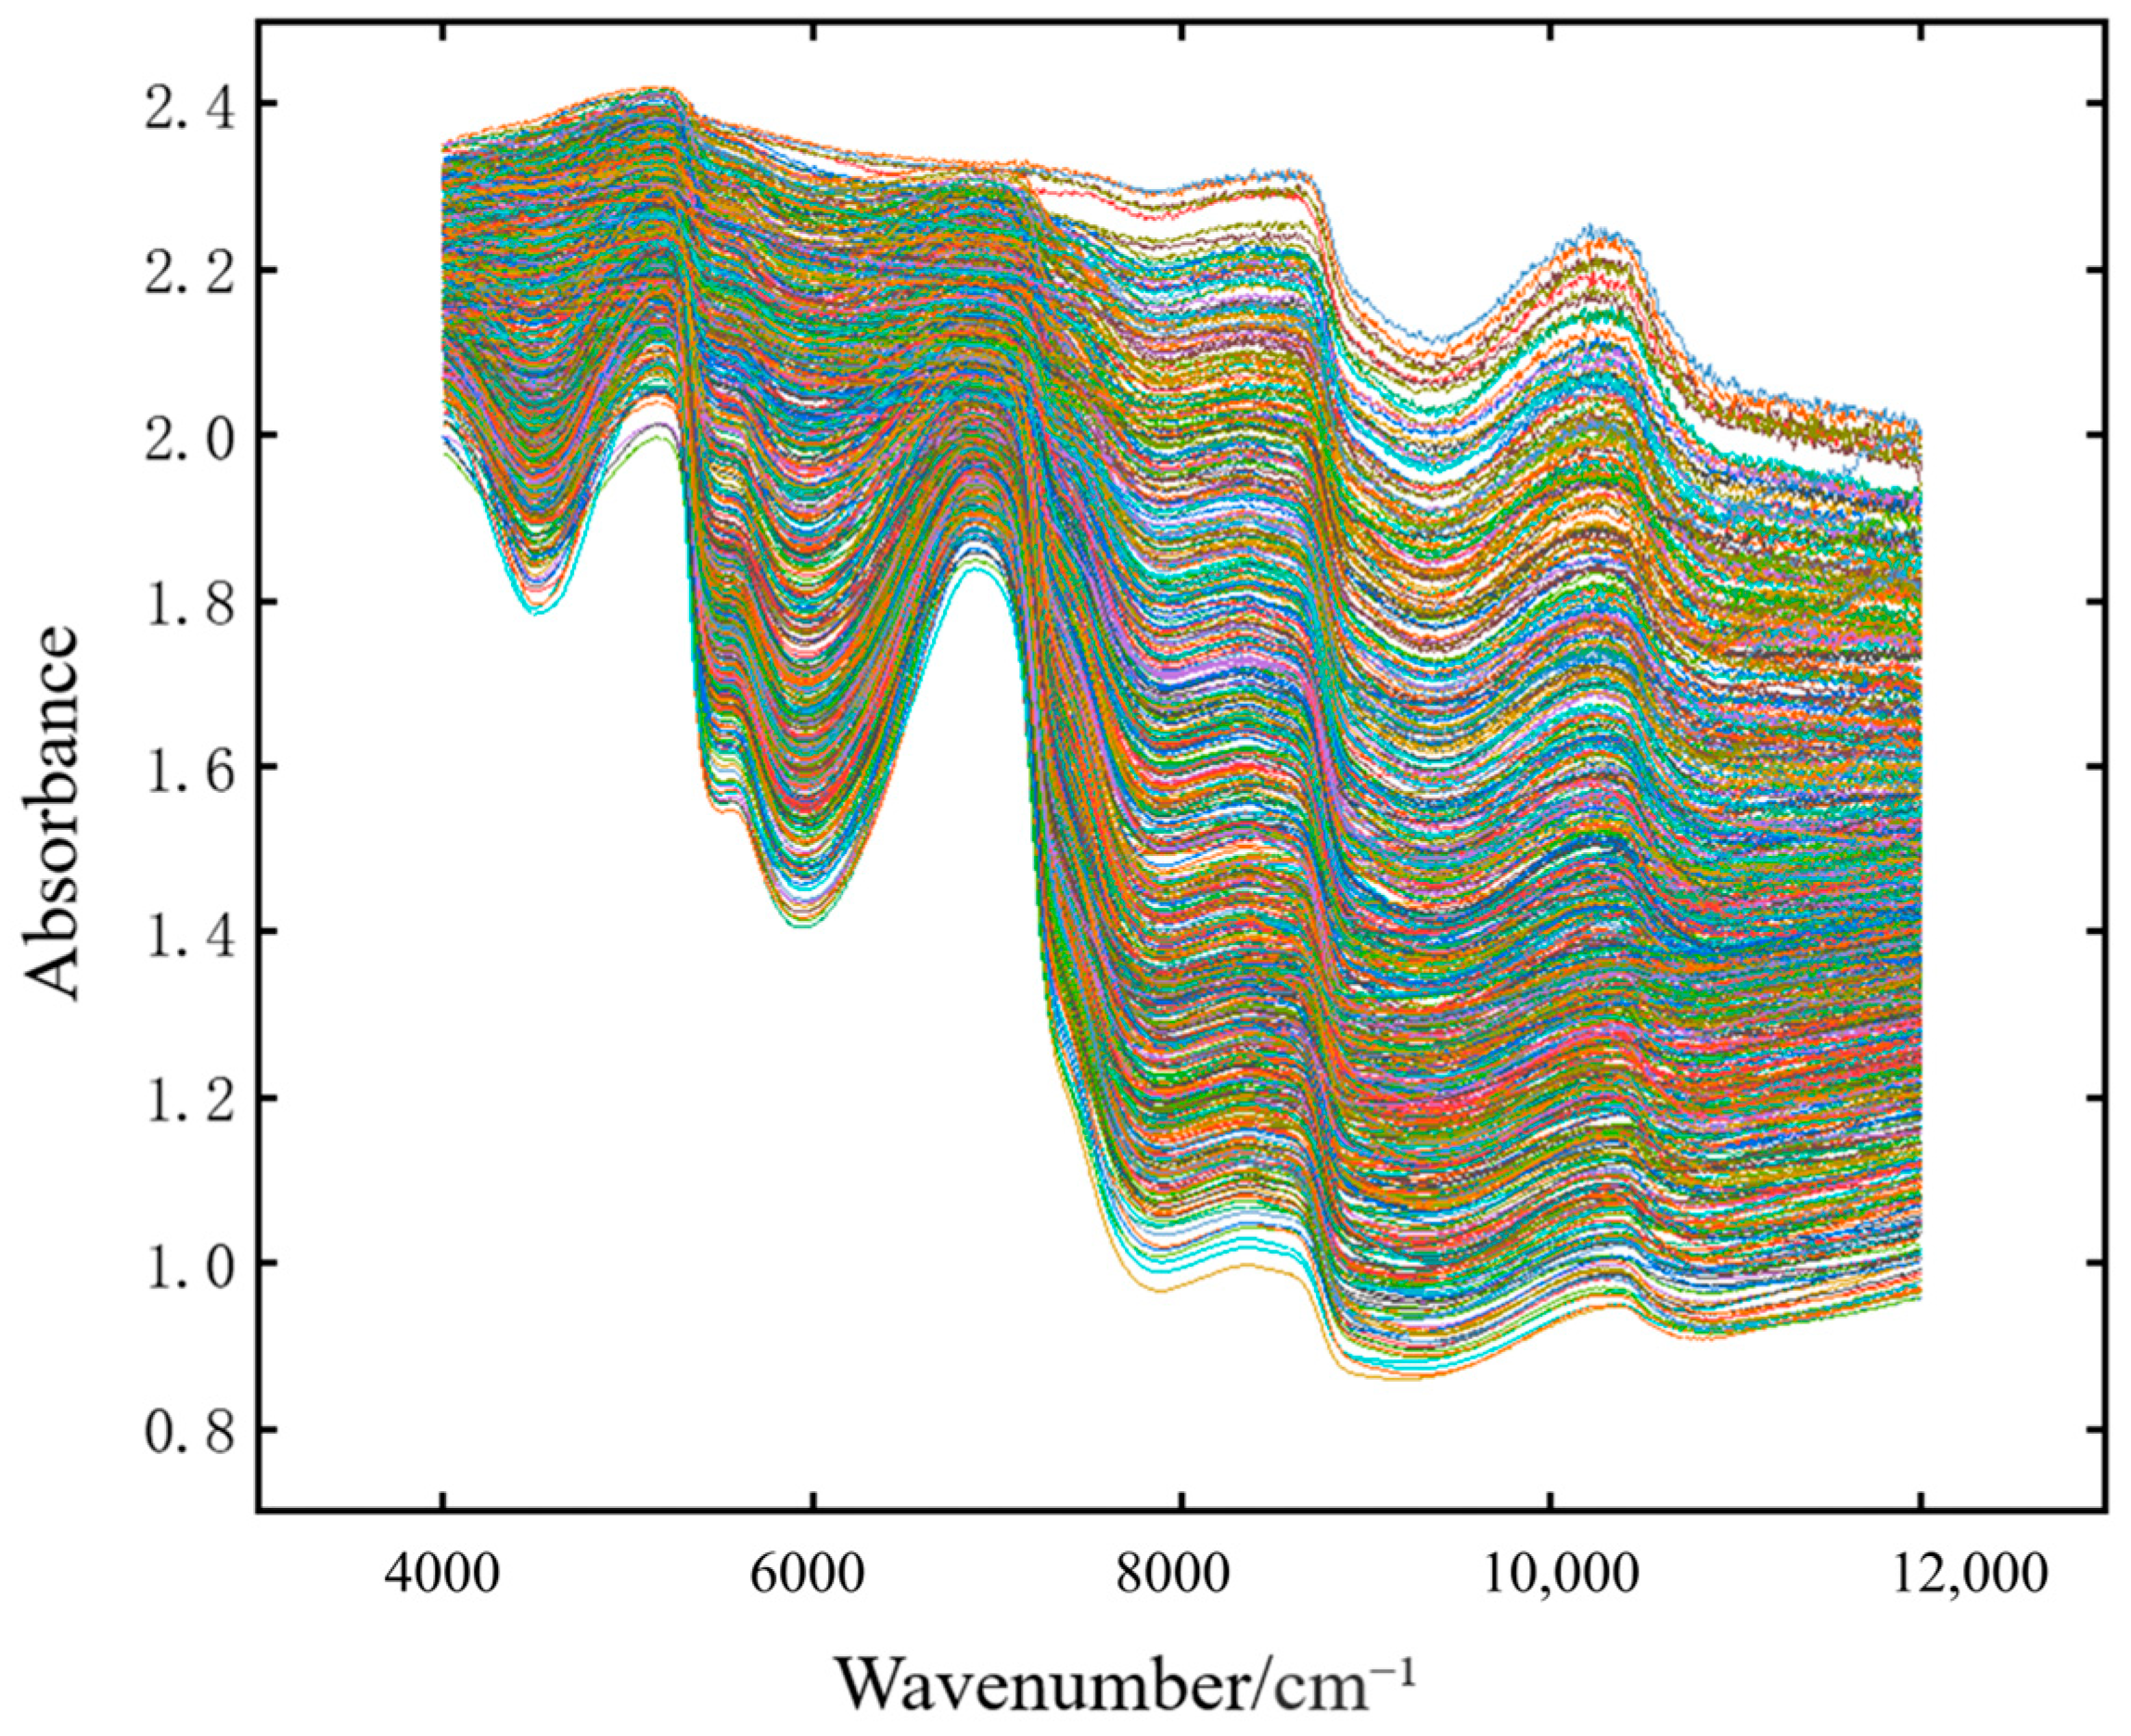
As shown in
Figure 5, the raw absorbance spectra of manure slurry samples over the range of 4000–12,000 cm
−1 exhibited obvious molecular vibration characteristics. The spectrum showed the strongest absorption peak near 5150 cm
−1, which is highly consistent with the combination vibration of the O–H bond in the high-moisture matrix of manure slurry [
45]. The absorption peak in the range of 6400–7000 cm
−1 was mainly caused by the first overtone stretching vibration of water-related O–H groups around 1440 nm (6944 cm
−1) [
46]. In addition, relatively consistent peaks were also observed near 8400 cm
−1 and 10,400 cm
−1. Among them, the peak near 8400 cm
−1 was associated with the second overtone vibration of the C–H bond [
47], whereas the absorption peak near 10,400 cm
−1 resulted from the combination absorption of the symmetric and asymmetric stretching vibrations of O–H bonds [
48]. After feature selection, 258 spectral variables were retained and used as the spectral input of subsequent models. The full list of retained variables is provided in
Table S1.
3.3. Comparison of Traditional Machine Learning Models Under Single-Source Spectral Conditions
To compare the predictive ability of different modeling methods for total nitrogen (TN) in dairy farm manure slurry under single-source spectral conditions, PLSR, RF, SVR, KNN, and MLP models were constructed based on CARS-selected characteristic wavelengths and compared under the same data partition. The results are shown in
Table 4. It should be noted that, to ensure fair comparison among models, the spectral preprocessing method used in single-source spectral modeling was selected based on the performance of the training and validation sets, and feature wavelength selection was uniformly performed using the CARS method.
As shown in
Table 4, under single-source spectral conditions, PLSR achieved the best overall performance on the test set, with an R
2 of 0.850, an RMSEP of 526.323 mg/L, and an RPD of 2.584, indicating that PLSR had strong predictive ability on the current CARS-selected spectral data. By contrast, RF ranked second overall, with a training-set R
2 of 0.968 and an RMSEC of 216.710 mg/L, while its test-set R
2 was 0.817, its RMSEP was 533.551 mg/L, and its RPD was 2.337.
KNN achieved an almost perfect fit on the training set (R2 = 0.999, RMSEC = 38.549 mg/L), but its test-set R2 was only 0.782, with an RMSEP of 582.387 mg/L. SVR and MLP performed relatively weakly overall. Specifically, the test-set R2 of SVR was 0.656, with an RMSEP of 731.166 mg/L and an RPD of 1.706, whereas the test-set R2 of MLP was 0.615, with an RMSEP of 774.053 mg/L and an RPD of 1.611, both lower than those of PLSR and RF. Overall, under single-source spectral input conditions, the predictive performance of different traditional machine learning models varied considerably, with PLSR showing the best performance and RF ranking second.
3.4. Comparative Analysis of Traditional Machine Learning Models Under Different Sample-Contextual Feature Combinations
Based on the model comparison under single-source spectral conditions, contextual features were further introduced on top of spectral input, and the multi-source modeling results of different traditional machine learning models were compared. The results are shown in
Table 5. Overall, after incorporating their respective optimal contextual feature combinations, all traditional machine learning models showed varying degrees of improvement compared with the single-source spectral condition.
For PLSR, the optimal contextual feature combination was “spectra + farm name + season”, with a test-set R2 of 0.851, an RMSEP of 526.229 mg/L, and an RPD of 2.585. Compared with the single-source spectral condition, the predictive performance of PLSR improved only slightly. RF performed best under the multi-source condition, and its optimal contextual feature combination was “spectra + longitude + season”, with the test-set R2 reaching 0.854, the RMSEP decreasing to 475.851 mg/L, and the RPD increasing to 2.621. The optimal contextual feature combination for KNN was “spectra + latitude + season”, with a test-set R2 of 0.825, an RMSEP of 522.389 mg/L, and an RPD of 2.387, which also represented an improvement over the single-source spectral condition.
SVR and MLP also showed some degree of improvement after the incorporation of contextual features, but their overall performance remained relatively weak. Among them, the optimal contextual feature combination for SVR was “spectra + season”, with the test-set R2 improving to 0.682, the RMSEP decreasing to 703.520 mg/L, and the RPD reaching 1.773. For MLP, the optimal contextual feature combination was “spectra + farm name + season”, with a test-set R2 of 0.790, an RMSEP of 571.234 mg/L, and an RPD of 2.183. Overall, the comparative results of traditional machine learning models under multi-source feature conditions indicate that auxiliary contextual information can improve TN prediction performance as a whole, although the optimal contextual feature combination differed across models.
3.5. Ablation Analysis of Feature Combinations for MultiScaleSE-GatedCNN
To further clarify the influence of different contextual feature combinations on the predictive performance and information utilization of the proposed MultiScaleSE-GatedCNN model, ablation experiments were conducted under different contextual feature combinations on top of near-infrared spectral input. The results are shown in
Table 6. In addition to the predictive metrics,
Table 6 also reports the normalized gate weights of the active branches, including the spectral branch, numerical branch, and categorical branch, so as to provide further insight into how the gated fusion unit allocated attention to different information sources under each input configuration.
As shown in
Table 6, among all candidate contextual feature combinations, the model corresponding to “spectra + farm name + longitude + season” achieved the best overall performance, with an R
c2 of 0.904, an RMSEC of 381.722 mg/L, an R
p2 of 0.905, an RMSEP of 367.389 mg/L, and an RPD of 3.242, representing the best comprehensive performance among all combinations. A closely comparable combination was “spectra + farm name + latitude + season”, with an R
p2 of 0.901, an RMSEP of 374.007 mg/L, and an RPD of 3.185. By contrast, the combination with more contextual features, namely “spectra + farm name + longitude + latitude + season”, yielded an R
p2 of 0.875, an RMSEP of 421.576 mg/L, and an RPD of 2.825, failing to further improve model performance. For the combinations with fewer variables, the results of “spectra + longitude + season” and “spectra + latitude + season” were relatively close, with R
p2 values of 0.806 and 0.805, respectively. When only “spectra + season” was used, the R
p2 dropped to 0.798, the RMSEP increased to 535.986 mg/L, and the RPD decreased to 2.222.
The normalized gate weights further reveal how the model utilized different information sources. For the optimal combination of “spectra + farm name + longitude + season”, the spectral branch retained the largest gate weight, indicating that near-infrared spectra remained the primary source of TN-related information. Meanwhile, the numerical and categorical branches also received non-negligible weights, suggesting that longitude and categorical contextual information provided complementary cues beyond the spectral signal alone. Across different feature combinations, the gate-weight distribution changed accordingly, demonstrating that the gated fusion unit did not assign fixed importance to each branch, but adaptively adjusted branch contributions according to the available contextual inputs.
It is also noteworthy that adding latitude did not further improve the model performance. A plausible explanation is that all samples in this study were collected from farms within Tianjin, where the north–south spatial span represented by latitude was relatively limited compared with the heterogeneity introduced by farm identity, management conditions, and seasonal variation. Under this dataset structure, latitude provided less additional discriminative information and was partly redundant with farm name and season. Therefore, after longitude, farm name, and season had already been incorporated, adding latitude increased input complexity but contributed limited new information, which likely weakened the generalization benefit of the model.
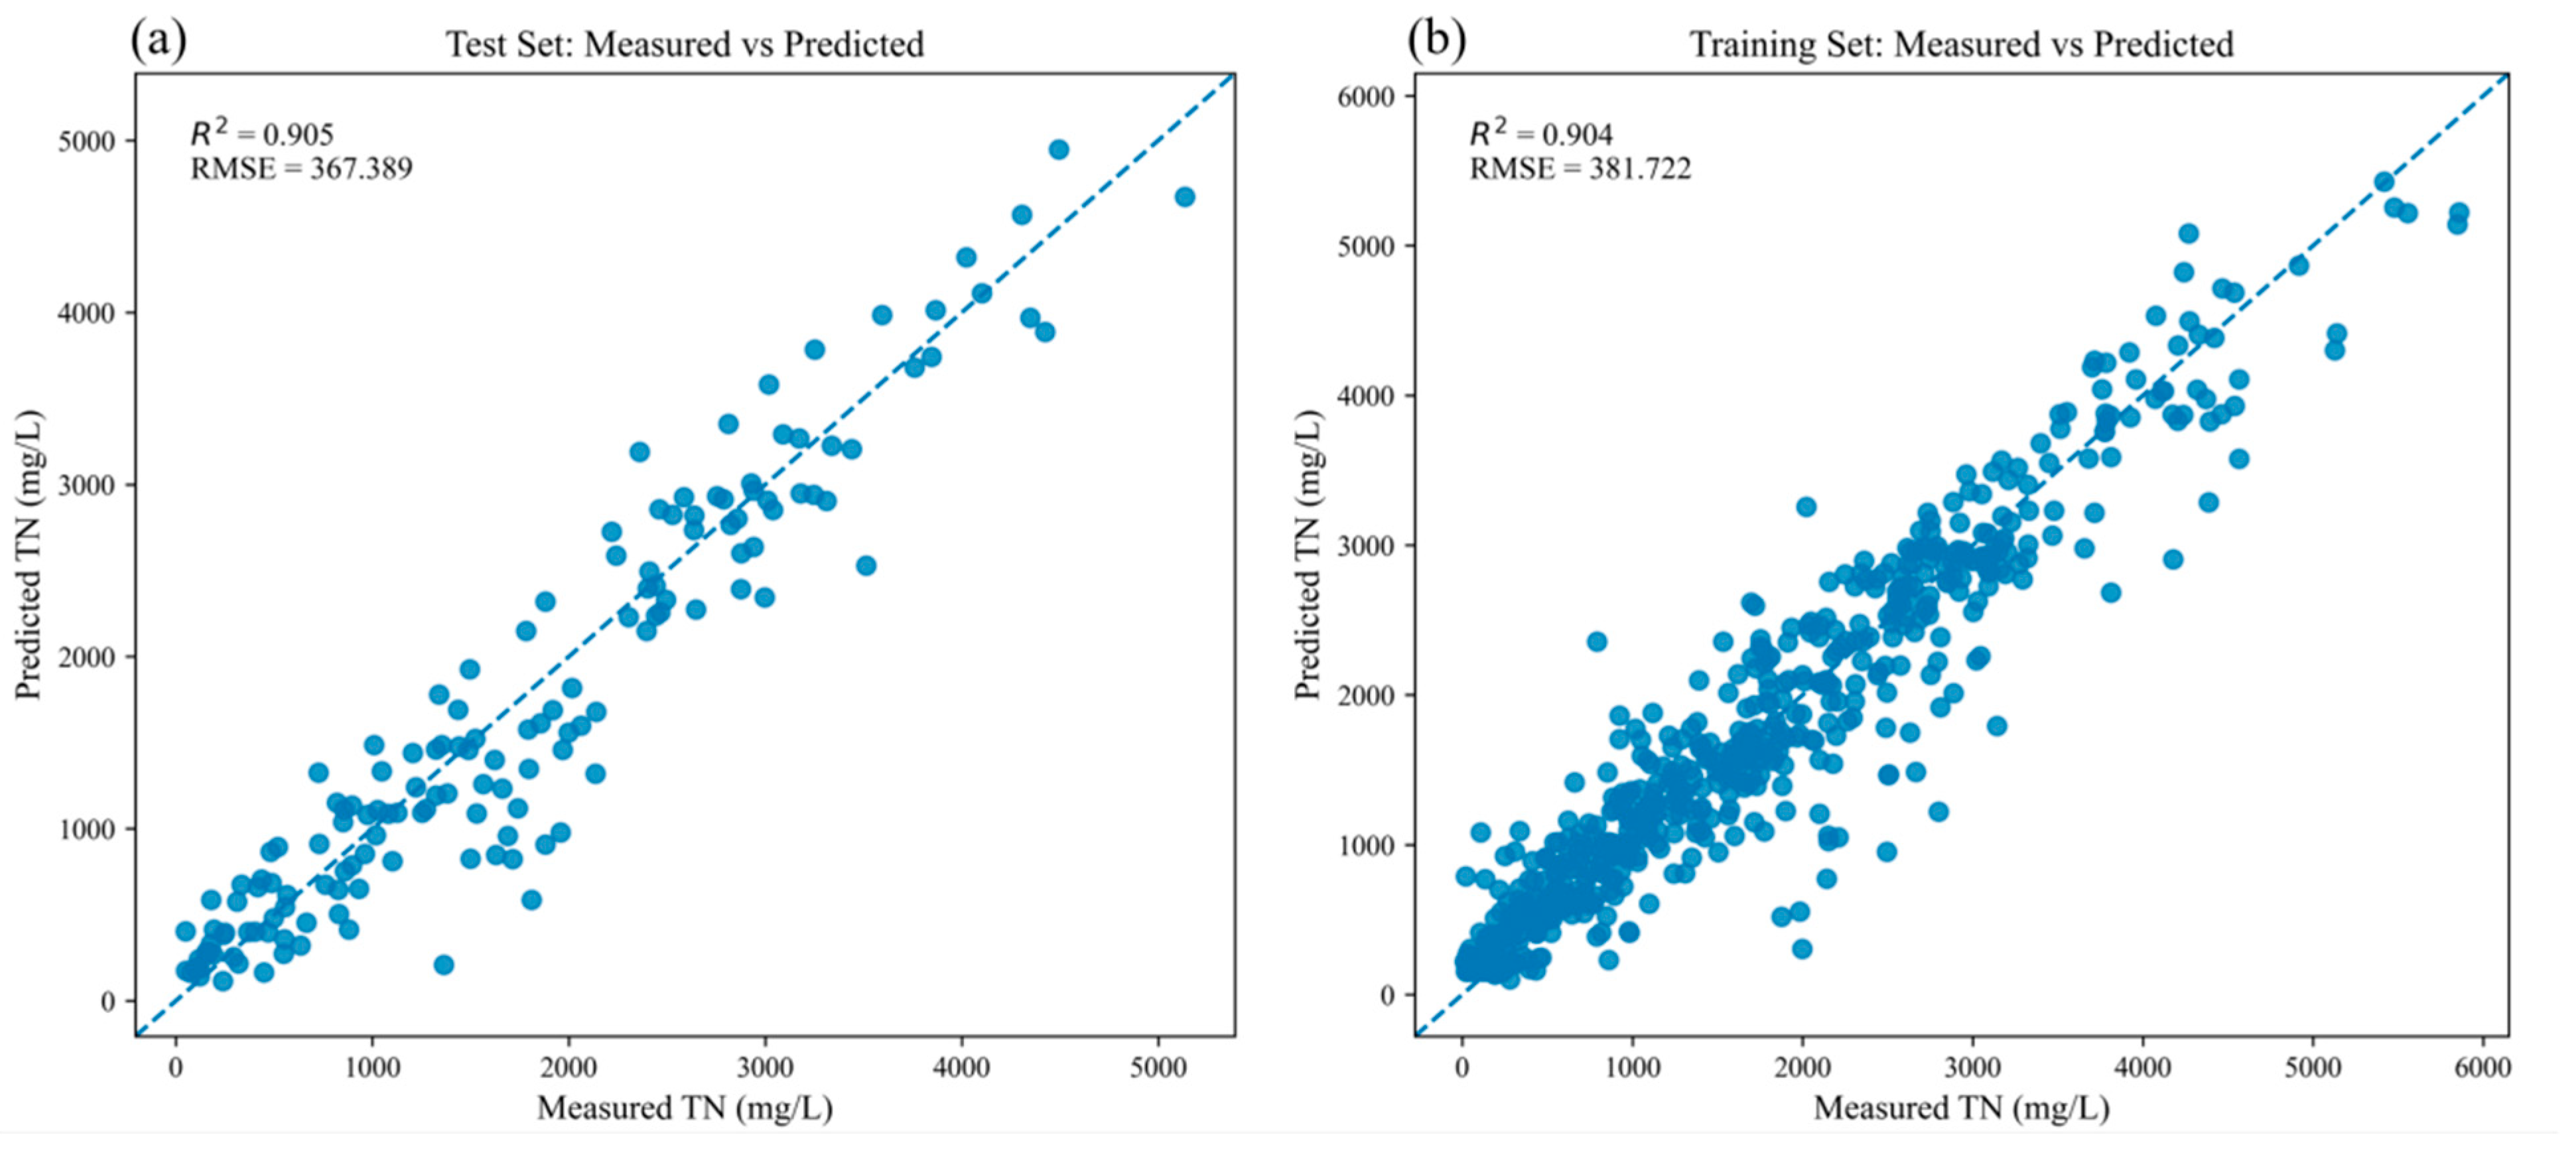
In addition, to further validate the predictive performance of the model under the optimal feature combination, the prediction scatter plots for the training and test sets (
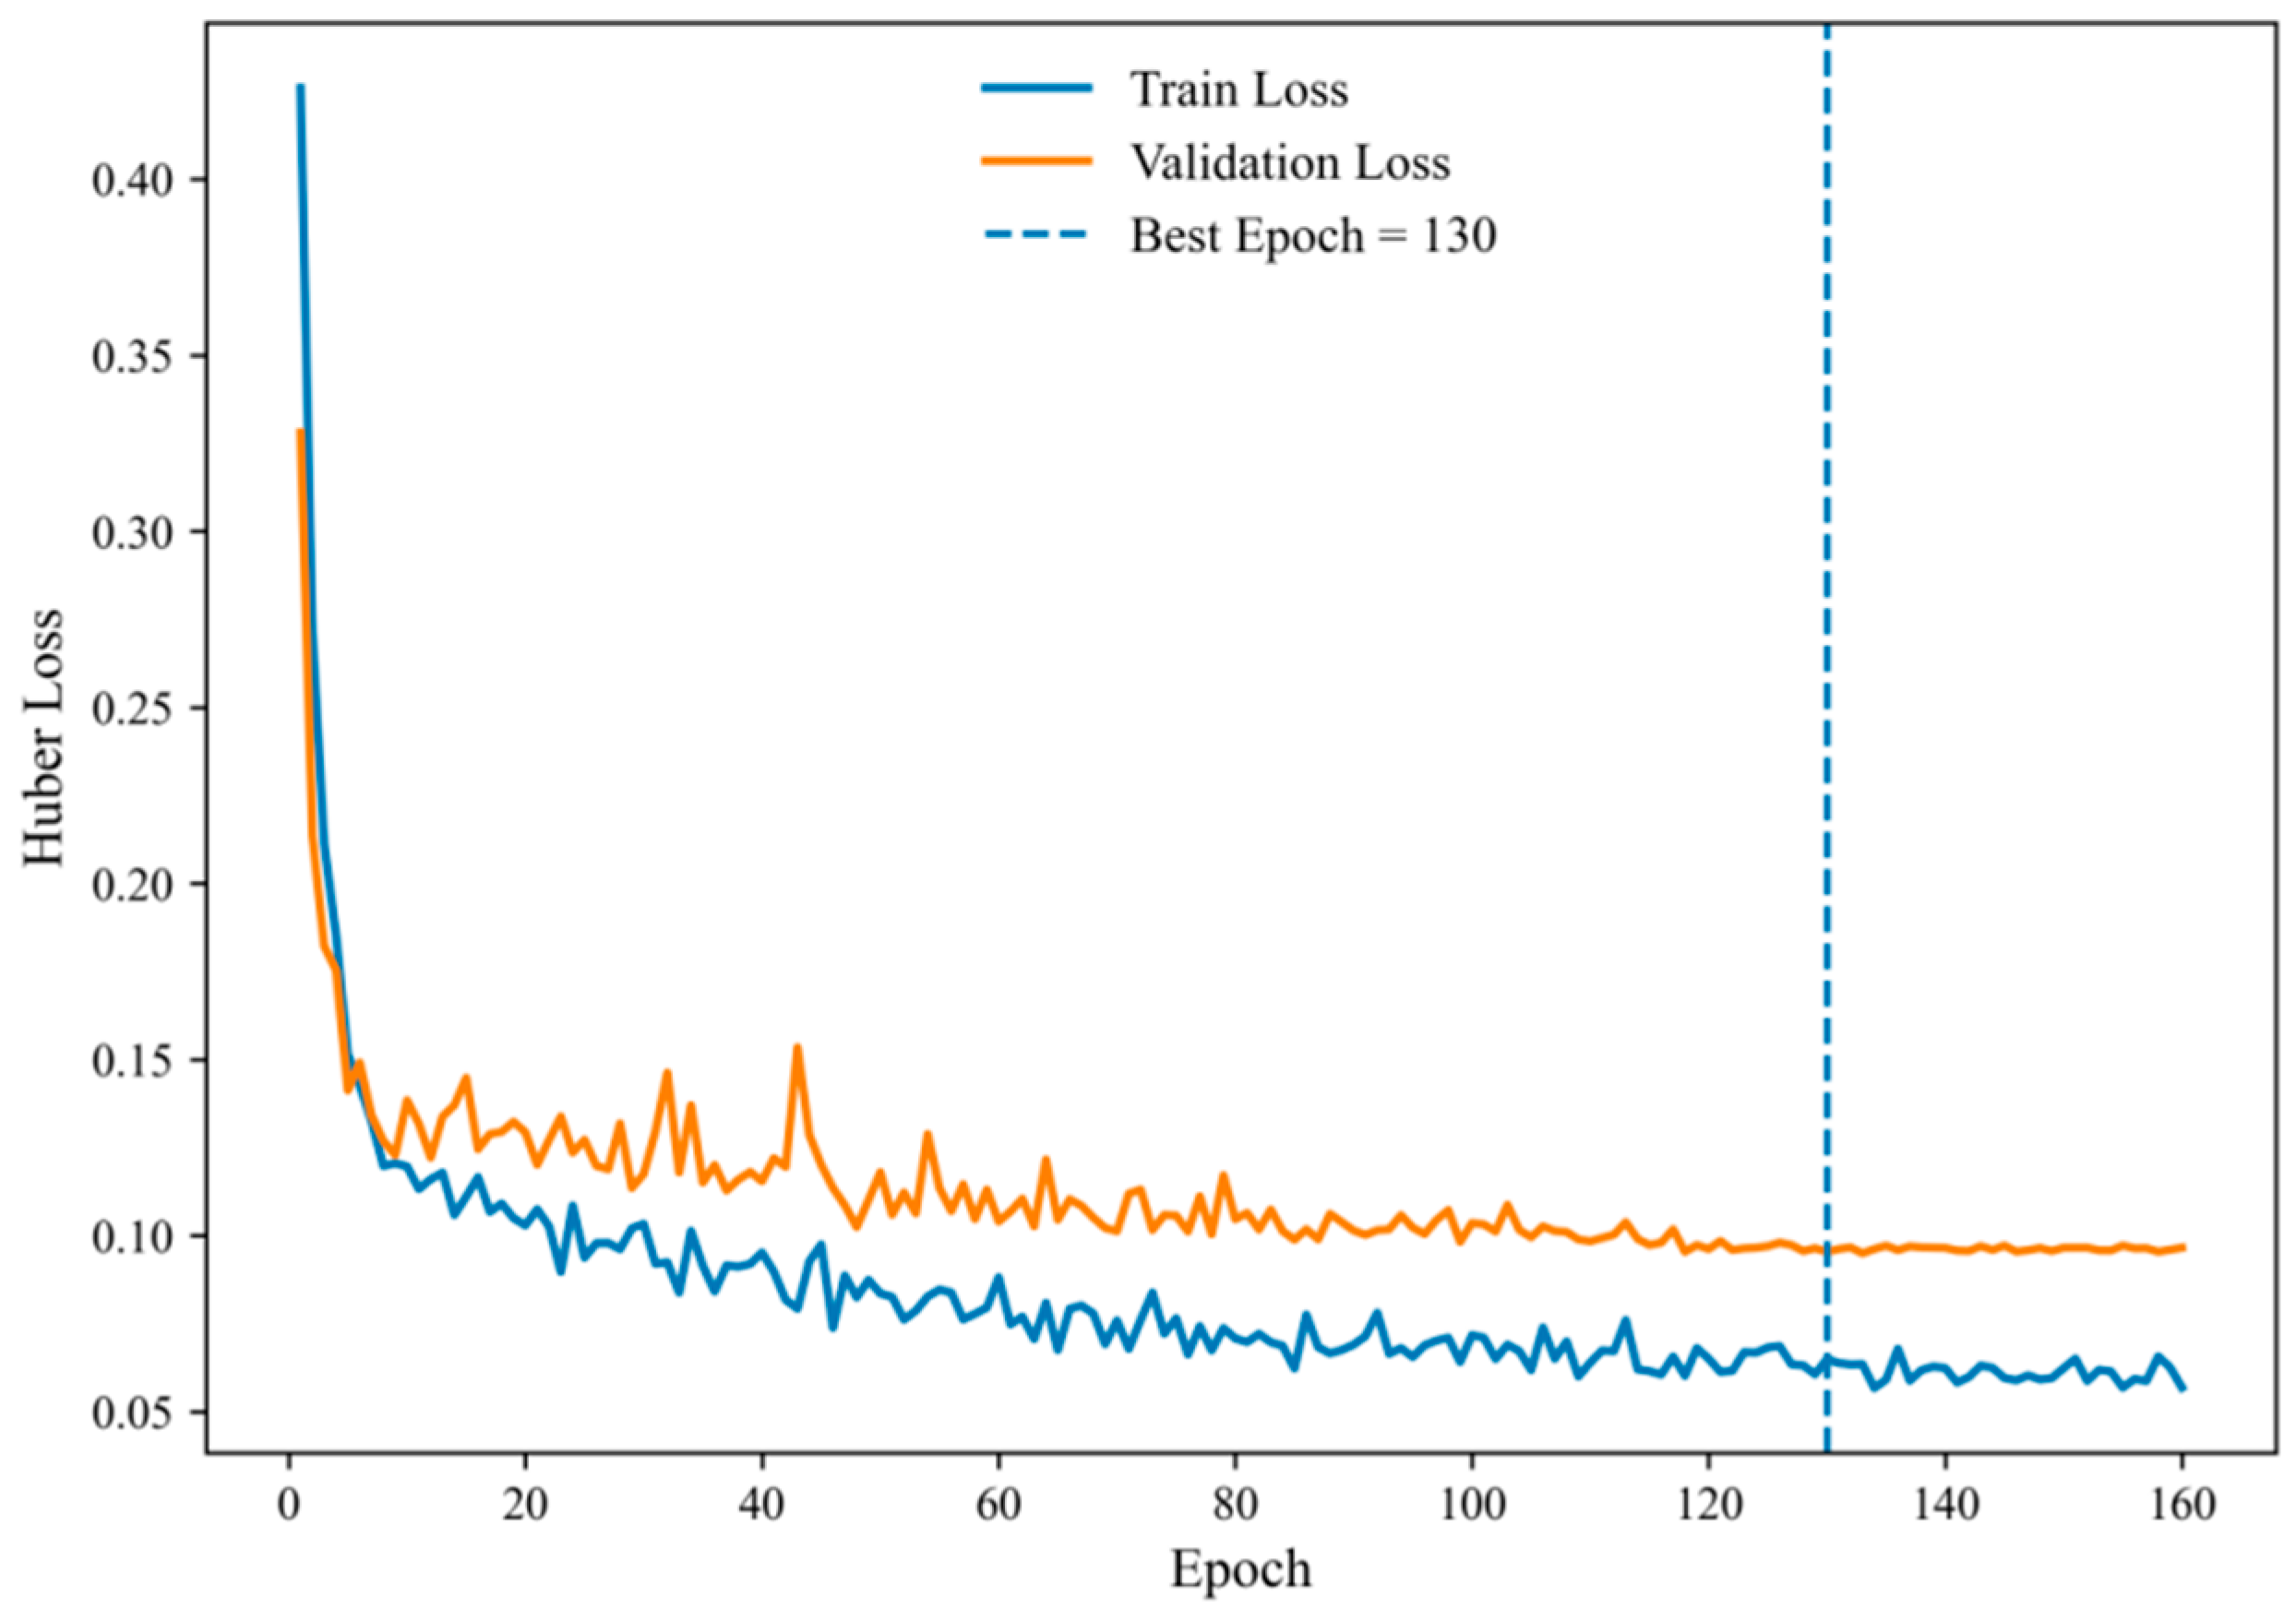
Figure 6) and the training-loss curves (
Figure 7) were plotted. As shown in
Figure 6, the sample points of both the training and test sets were generally distributed around the line y = x, indicating good agreement between predicted and measured values.
Figure 7 shows that both the training loss and validation loss decreased rapidly during the early stage of training and then gradually stabilized, with the best epoch appearing around epoch 130, indicating that the training process of the model was generally stable. Overall, “spectra + farm name + longitude + season” was identified as the optimal input combination for MultiScaleSE-GatedCNN.
3.6. Comparison with the SimpleConcatMLP Baseline
To further verify whether the proposed gated fusion mechanism provides advantages beyond simple feature fusion, an additional baseline experiment based on direct feature concatenation was conducted. Specifically, a SimpleConcatMLP model was established by directly concatenating the spectral variables and encoded sample-contextual features, followed by regression using a standard multilayer perceptron. The comparison was carried out under the same optimal feature combination, namely spectra + farm name + longitude + season, so as to isolate the effect of the fusion mechanism itself.
The results showed that SimpleConcatMLP already achieved competitive predictive performance, with a training-set R2 of 0.956, a training RMSEP of 258.453 mg/L, a training RPD of 4.763, a test-set R2 of 0.893, a test RMSEP of 389.404 mg/L, and a test RPD of 3.059. This indicates that direct concatenation of spectral and contextual information can effectively improve TN prediction performance.
However, under the same feature combination, the proposed MultiScaleSE-GatedCNN still achieved better overall prediction performance, with a test-set R2 of 0.905, an RMSEP of 367.389 mg/L, and an RPD of 3.242. Compared with SimpleConcatMLP, the proposed model improved the test-set R2 by 0.012, reduced the RMSEP by 22.015 mg/L, and increased the RPD by 0.183. These results indicate that the performance gain in this study does not come only from introducing contextual information itself, but also from the more effective organization and utilization of heterogeneous inputs through branch-specific encoding and gated fusion.
3.7. Comprehensive Comparison of Different Modeling Strategies
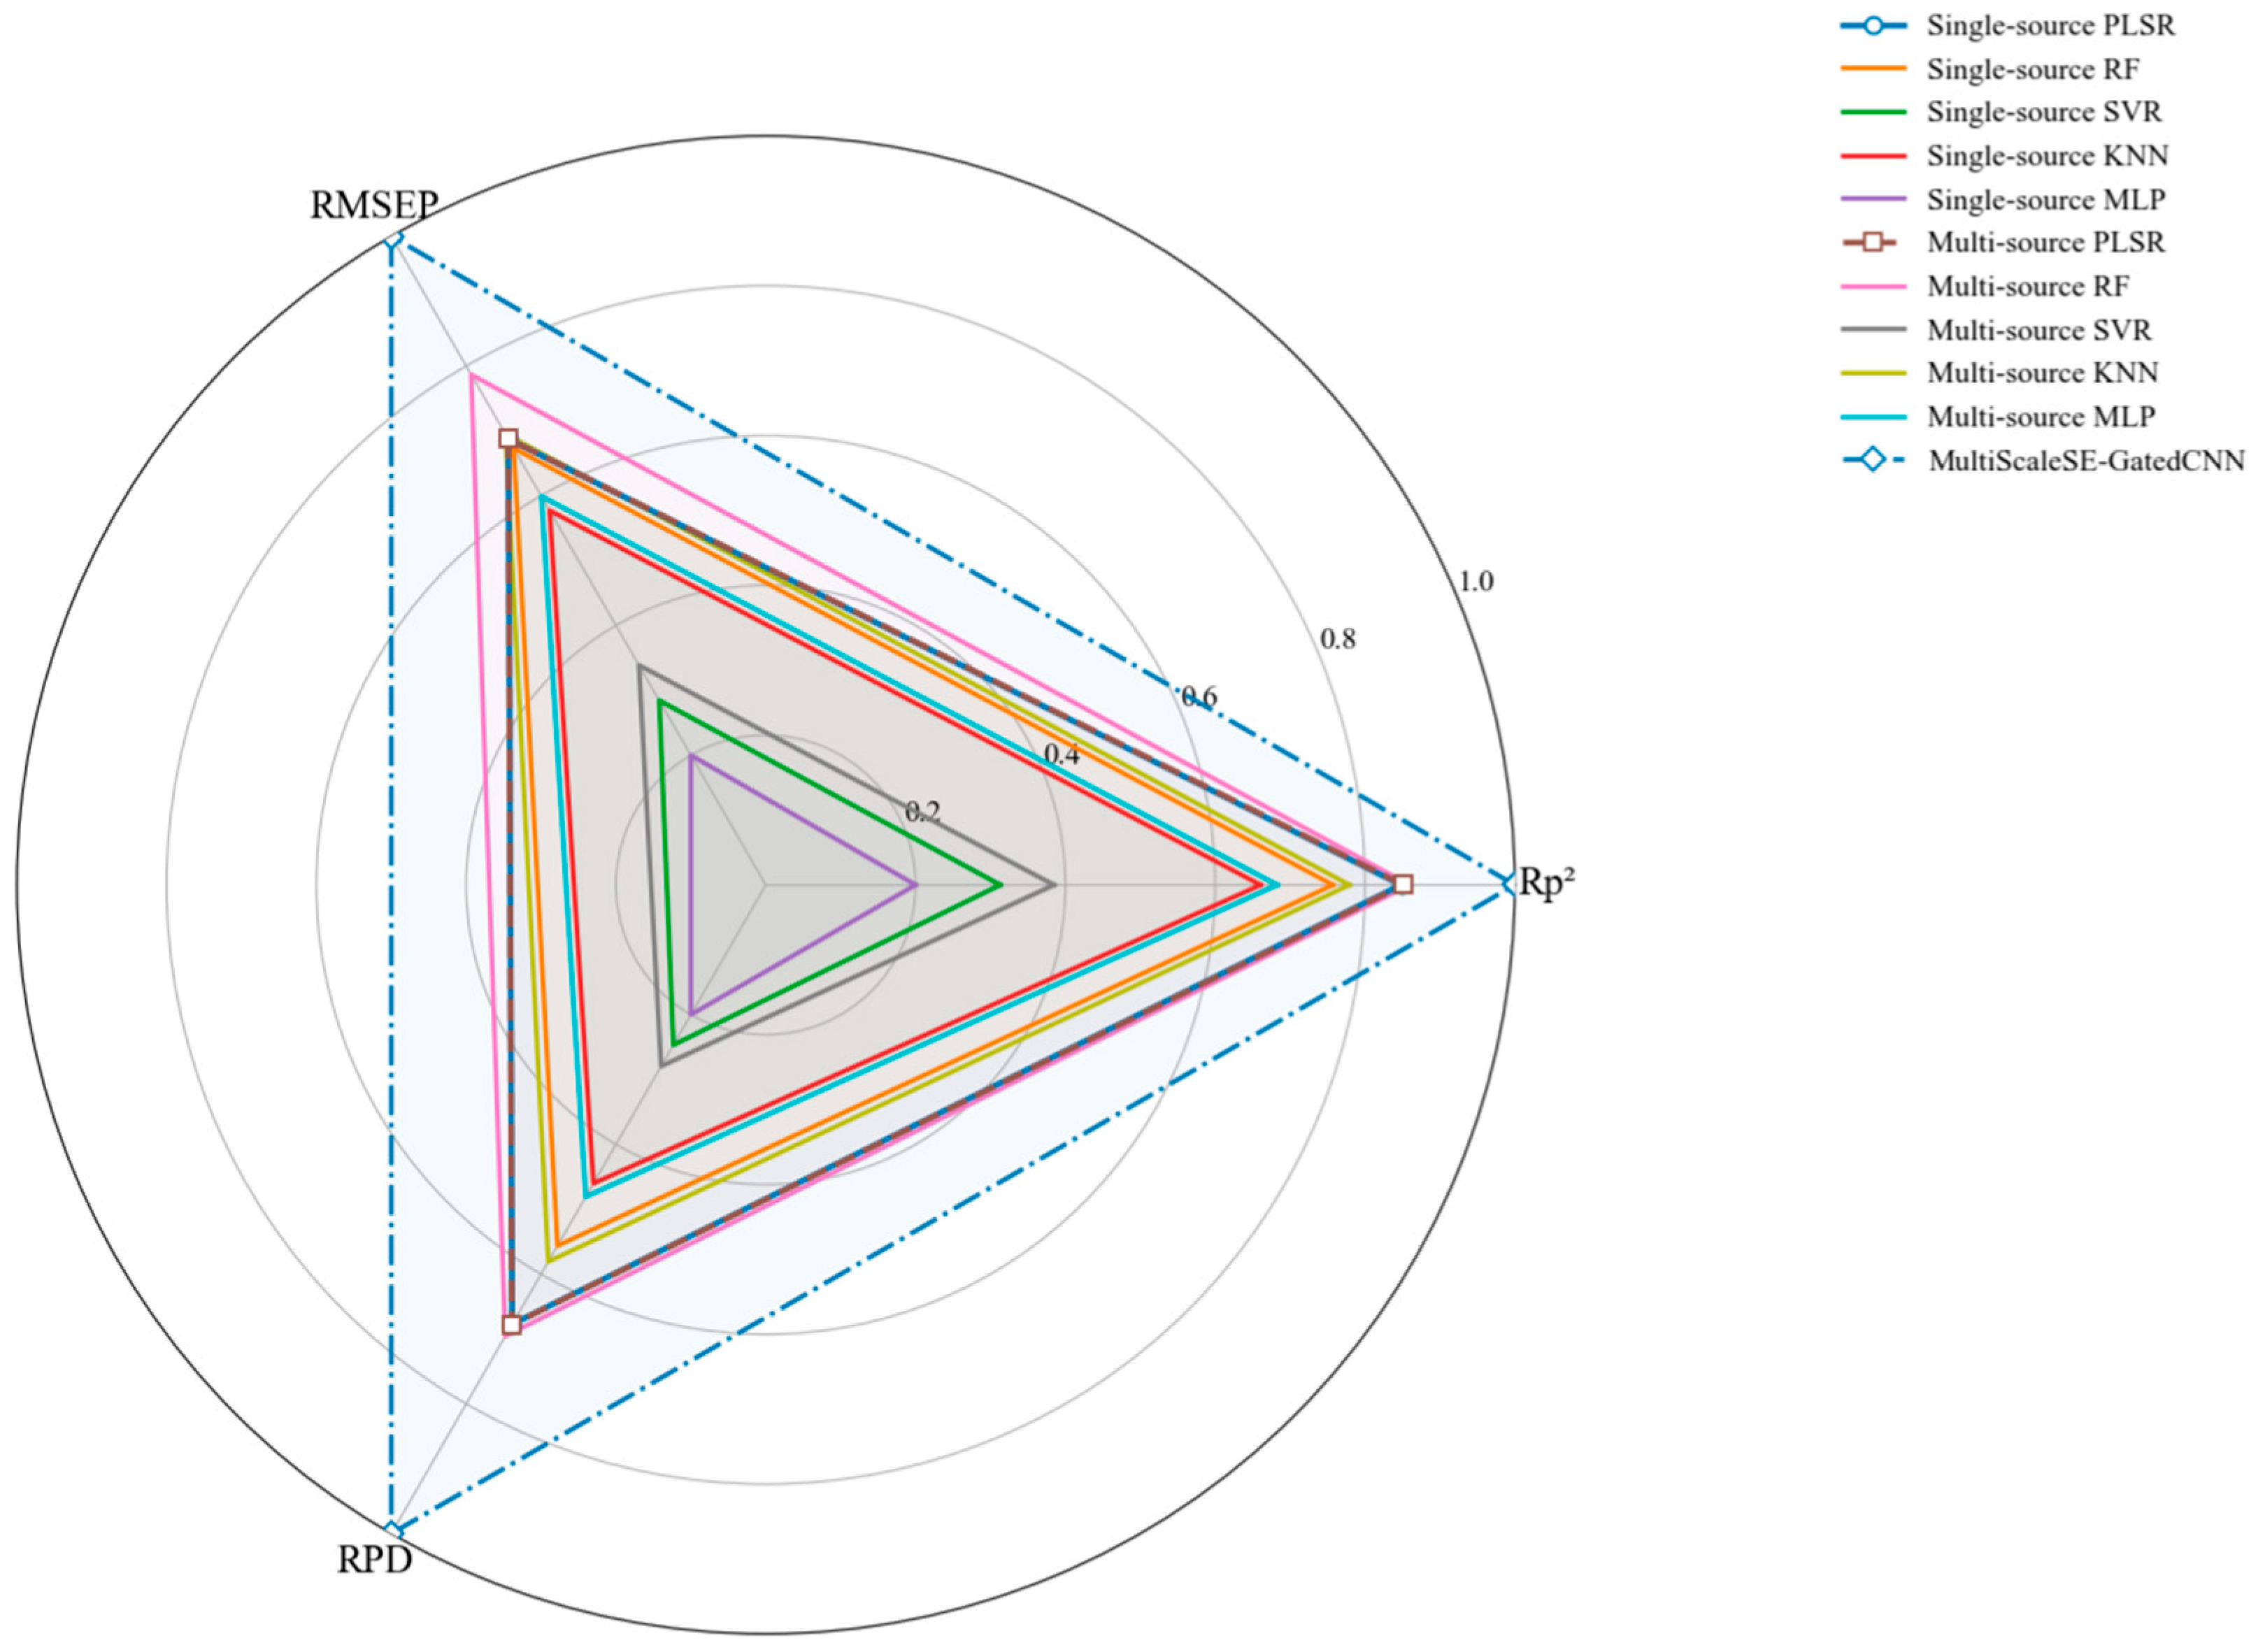
To further provide an intuitive comparison of the comprehensive performance of single-source models, multi-source fusion models, and the proposed MultiScaleSE-GatedCNN model in TN prediction, a radar chart of different modeling strategies was plotted, as shown in
Figure 8. The results show that multi-source fusion models as a whole outperformed single-source models, while MultiScaleSE-GatedCNN achieved the best performance in terms of R
p2, RMSEP, and RPD.
Overall, from single-source spectral models to traditional multi-source fusion models and then to MultiScaleSE-GatedCNN, different modeling strategies showed a progressive improvement trend in TN prediction performance. Among them, MultiScaleSE-GatedCNN achieved the highest comprehensive predictive performance under the optimal feature combination.
4. Discussion
4.1. Sample Heterogeneity and the Limitations of Single-Source Spectral Modeling
In this study, the TN content of manure slurry samples showed a wide fluctuation range and an obvious right-skewed distribution, indicating strong heterogeneity among samples. Meanwhile, although the raw spectral curves had similar overall contours, obvious parallel shifts and baseline drift were still observed. This suggests that the spectral responses of dairy farm manure slurry samples were influenced not only by the concentration of the target nutrient, but also by particle distribution, moisture status, suspended solids concentration, and differences in sample source.
From the perspective of physical optical characteristics, the absorbance over the full spectral range exhibited obvious parallel shifts and baseline drift, reflecting enhanced scattering effects caused by differences in particle size, suspended solids concentration, and viscosity of manure slurry across different treatment stages. Such signal shifts caused by physical properties often lead to nonlinear bias of the chemical nutrient signals along the spectral axis. Because the signals of chemical composition and physical background noise are highly coupled, the fluctuations in spectral features are not completely dominated by nitrogen contents, but are jointly driven by spatiotemporal background and treatment-stage variation [
49].
Under such conditions, single-source spectral models were still able to achieve a certain level of predictive ability. In particular, PLSR showed strong comprehensive performance under single-source spectral conditions, indicating that near-infrared spectra still retained effective information related to TN variation. For high-dimensional and highly collinear spectral data, PLSR is able to extract latent variables closely related to the target variable, which explains why it maintained a strong baseline position in the current task.
It should be emphasized that the predictive usefulness of spectral information in this study does not rely only on direct N–H absorption. Manure slurry is a high-moisture, organic-rich heterogeneous matrix, and variations in TN are closely associated with changes in moisture status, organic matter composition, ammonium-related forms, and other physicochemical properties of the matrix. Therefore, even though the dominant absorption regions identified in the raw spectra were mainly associated with O–H and C–H vibrations, these bands still carried TN-related indirect information through covariance with the overall sample composition. This helps explain why the pure spectral model already provided reasonable performance, while the addition of contextual information further improved robustness under heterogeneous conditions.
However, the overall results indicate that relying single-source spectral information alone was insufficient to fully characterize the complex differences among samples collected under cross-farm, cross-season, and different treatment-background conditions. Especially when sample background differences are large, the mapping relationship between spectral features and target components is easily disturbed by physical background and spatiotemporal variation, thereby limiting the generalization ability and robustness of the model. Therefore, although single-source spectral modeling can serve as an important foundation for TN prediction, its adaptability under complex real-world scenarios remains limited.
4.2. Auxiliary Role of Contextual Information in TN Prediction
The overall performance of traditional machine learning models improved to varying degrees after the introduction of contextual features, indicating that auxiliary contextual information has practical value for TN prediction. Although variables such as farm name, longitude, latitude, and season do not directly reflect nutrient content itself, they can characterize the background environment in which the samples were formed from different perspectives. Farm name reflects differences in management practices, feed composition, and manure source across farms; longitude and latitude represent spatial differences; and season corresponds to stage-specific variation in environmental temperature, feeding conditions, and the physicochemical state of manure slurry.
From the results, season was retained in the optimal combinations of PLSR, RF, SVR, KNN, and MLP, indicating that it plays a relatively stable auxiliary role in TN prediction. This suggests that seasonal variation affects not only the compositional fluctuation of manure slurry itself, but also its spectral response characteristics. By contrast, the retention of farm name, longitude, and latitude was not consistent across models, reflecting that different models differ in their ability to utilize categorical contextual information and spatial contextual information.
Therefore, the introduction of contextual information is not a simple addition to spectral information, but rather compensates, to a certain extent, for the insufficient representational ability of single-source spectral modeling, enabling the model to achieve more robust prediction results under more complex heterogeneous sample conditions [
29,
33,
50]. This also indicates that, in systems such as dairy farm manure slurry that are strongly affected by spatiotemporal background, multi-source information fusion has clear practical significance.
4.3. Advantages of MultiScaleSE-GatedCNN in Multi-Source Fusion
Compared with traditional machine learning models, MultiScaleSE-GatedCNN achieved the best comprehensive results under the optimal feature combination, indicating that simply introducing contextual features is not sufficient and that effective fusion of different information sources is equally critical. Structurally, the model simultaneously considers spectral features, numerical contextual features, and categorical contextual features, learns representations of different types of information through a multi-branch architecture, and then realizes collaborative utilization of different information sources through a gated fusion unit.
Among them, the multi-scale one-dimensional convolution is capable of extracting local spectral-shape features under different receptive fields, while the SE module helps enhance the responses of important channels [
51]. The numerical branch and the categorical branch respectively encode continuous variables and discrete variables in a targeted manner. This structural design enables the model to retain local response patterns in near-infrared spectra relatively well while simultaneously absorbing auxiliary information related to sample source, spatial position, and seasonal variation from the contextual variables.
More importantly, the gated fusion unit does not simply concatenate multi-source features directly, but dynamically adjusts the contribution of different information sources through an adaptive weight allocation mechanism. This fusion strategy enables the model to utilize information from different sources more flexibly when dealing with complex heterogeneous samples, thereby improving prediction accuracy and generalization ability [
52]. From the final results, MultiScaleSE-GatedCNN outperformed both traditional single-source models and traditional multi-source models under the optimal feature combination, further indicating that a reasonable fusion mechanism is the key to improving TN prediction performance under complex scenarios.
The comparison with the SimpleConcatMLP baseline further supports this interpretation. Although direct concatenation of spectral and contextual features already yielded competitive predictive performance, the proposed MultiScaleSE-GatedCNN still achieved better results under the same optimal feature combination. This suggests that the benefit of the proposed method lies not merely in adding more inputs, but in organizing heterogeneous information in a more structured manner. By separating spectral, numerical, and categorical information into dedicated branches and then adaptively weighting them through the gated fusion unit, the proposed model can make more effective use of complementary information and achieve improved prediction accuracy.
The present study can also be compared with the work of Li et al. [
29], who investigated the effect of seasonal variation on NIRS modeling of dairy farm manure slurry. Their study demonstrated that season was an important source of variation and showed that the GMFS could improve applicability across seasons, although at the expense of some prediction precision. In the present work, season was likewise retained as an important contextual factor, but it was not treated as the only auxiliary clue. Instead, it was jointly modeled with farm identity and spatial information within a multi-branch gated fusion framework. In this sense, the advancement of the present study is not merely that a deep learning architecture was used instead of PLS, but that the modeling unit was extended from spectral data alone to a coordinated representation of spectral and sample-contextual information. Under the optimal feature combination of spectra + farm name + longitude + season, the proposed MultiScaleSE-GatedCNN achieved a test-set R
p2 of 0.905, an RMSEP of 367.389 mg/L, and an RPD of 3.242, whereas the previous study [
29] reported R
p2 = 0.85, RMSEP = 443.39 mg/L, and RPD = 2.38 for the TN global model of four seasons. Although these results are not from a strictly identical experimental setting, they suggest that integrating multi-source contextual information together with adaptive fusion can provide a more robust solution for TN prediction under heterogeneous farm conditions.
4.4. Differences in Feature Combinations, Practical Significance, and Research Limitations
The ablation results of MultiScaleSE-GatedCNN indicate that multi-source feature fusion does not follow the simple rule of “the more features, the better.” Although adding contextual variables can expand the input information range, it does not necessarily lead to better prediction performance. On the contrary, if newly added variables are redundant with existing information or contain insufficient effective information, they may interfere with model training and thereby weaken generalization ability [
53].
The gate-weight analysis further supports the above observation. The spectral branch consistently retained a substantial proportion of the normalized gate weight across different feature combinations, indicating that spectral information remained the dominant basis for TN prediction. At the same time, the numerical and categorical branches contributed complementary information with magnitudes that varied across input combinations, confirming that the gated fusion unit adaptively balanced the reliance on spectral and contextual information rather than applying a fixed fusion pattern.
It should also be noted that the proposed model did not indiscriminately rely on the full raw spectrum. Instead, CARS was first applied to retain 258 informative spectral variables, meaning that the spectral input was already reduced to characteristic wavelengths associated with chemically meaningful absorption regions. In this sense, the present framework can be regarded as a feature-screened spectral modeling strategy rather than a direct full-spectrum input strategy. Combined with the raw spectral analysis in
Section 3.2, these retained variables were mainly associated with the major absorption regions of manure slurry spectra, including bands near 5150 cm
−1, 6400–7000 cm
−1, 8400 cm
−1, and 10,400 cm
−1, which are related to O–H- and C–H-associated absorptions in the high-moisture and organic-rich manure slurry matrix. This indicates that the model relied on chemically meaningful spectral regions after variable screening rather than using the entire raw spectrum indiscriminately. A more fine-grained post hoc wavelength attribution analysis, such as SHAP-based interpretation, will be further explored in future work. And the combination of selected raw spectral variables with engineered spectral descriptors, such as the intensities of characteristic bands and integrated spectral regions, will be further investigated to determine whether these hybrid representations can provide additional predictive benefits. Moreover, easily obtainable physicochemical parameters such as pH may serve as useful auxiliary inputs for the MultiScaleSE-GatedCNN model and deserve further evaluation.
In this study, “spectra + farm name + longitude + season” achieved the best overall performance, whereas adding latitude did not further improve model performance. This indicates that the key to multi-source feature fusion lies in selecting variables that can form effective complementarity with spectral information rather than simply increasing input dimensionality. In addition, although treatment-stage features were included among the initial contextual variables, they showed relatively weak performance in preliminary experiments and were not included in the final key combinations. In addition, treatment-stage features were evaluated in preliminary screening experiments, but they did not provide stable performance gains. As shown in
Supplementary Table S2, when treatment-stage information was added to three representative feature combinations, the predictive performance consistently deteriorated. Specifically, for the combination of spectra + farm name + longitude + latitude + season, the test-set R
p2 decreased from 0.875 to 0.872, while the RMSEP increased from 421.576 to 426.690 mg/L. For spectra + farm name + longitude + season, the test-set R
p2 decreased from 0.902 to 0.892, and the RMSEP increased from 373.148 to 391.733 mg/L. For spectra + farm name + latitude + season, the test-set R
p2 decreased from 0.901 to 0.885, and the RMSEP increased from 374.007 to 403.794 mg/L. Meanwhile, the corresponding RPD values also decreased in all three cases. These results indicate that treatment-stage information provided limited or unstable contribution under the current dataset and model setting, and therefore it was not retained in the final key feature combinations reported in this study.
From an application perspective, the modeling strategy integrating near-infrared spectra with contextual information can effectively improve the accuracy and robustness of TN prediction in dairy farm manure slurry and has certain application potential for rapid nutrient detection, resource utilization, and precision management of manure. To provide a practical reference for on-site deployment, the inference efficiency of the optimal MultiScaleSE-GatedCNN model was additionally evaluated under the feature combination of spectra + farm name + longitude + season. The average single-sample inference time was approximately 0.847 ms/sample on a 12th Gen Intel(R) Core(TM) i5-12400F CPU and 1.189 ms/sample on an NVIDIA GeForce RTX 4060 GPU. When processed in batches, the average inference time was further reduced to 0.122 ms/sample on CPU and 0.028 ms/sample on GPU. These values refer only to model inference after the spectral and contextual inputs were prepared, and do not include spectral acquisition time. Although the end-to-end latency in practical deployment will also depend on spectral acquisition and preprocessing, these results suggest that the proposed model is computationally feasible for near-real-time prediction tasks. However, this study still has several limitations. For example, the research samples were mainly collected from farms in Tianjin, the types of contextual variables were still relatively limited, and the cross-regional applicability of the model as well as its online application capability under more complex field conditions remain to be further verified. Future studies may evaluate the generalization ability and practical applicability of the model under larger sample sizes, broader regional coverage, and richer contextual variables.
In addition, it should be noted that farm name was incorporated as a contextual feature to characterize sample-background heterogeneity. Under this setting, the present study primarily evaluates model robustness within a regional multi-farm population represented by the Tianjin dataset, rather than universal extrapolation to entirely unseen farms. Because the data were split using a fixed random train–test strategy rather than a farm-wise split, samples from the same farm may contribute contextual patterns to both model development and evaluation. Therefore, the current results should be interpreted as evidence that integrating spectra with sample-contextual information can improve prediction robustness under complex heterogeneous conditions within the studied regional population, but not as proof of unrestricted cross-farm or cross-regional generalization. For practical use, the proposed framework is expected to be more suitable for regional deployment in populations with similar farm backgrounds, management conditions, and environmental contexts. Future work should further assess this framework using farm-wise validation, leave-one-farm-out strategies, and external datasets from other regions to more rigorously verify its extrapolation ability. Another limitation should also be noted for practical deployment. In this study, the samples were stored at low temperature and analyzed within a relatively short period after collection, so the constructed model mainly reflects the spectral–composition relationship under short-term storage conditions. However, in real farm scenarios, manure slurry may undergo compositional and spectral changes during prolonged storage, standing, or repeated handling, which may affect the long-term stability of the model. Therefore, whether the proposed model can maintain its predictive accuracy over time under extended storage conditions was not explicitly evaluated in the present study. This issue should be further investigated in future work by combining time-dependent storage experiments with model updating or recalibration strategies.
To further position the present work relative to previous studies, a concise comparison of representative NIRS-based studies related to TN prediction is provided in
Table 7. The present study differs from previous work not only in predictive performance, but also in explicitly integrating sample-contextual information into TN modeling under cross-farm heterogeneous conditions.
5. Conclusions
In this study, a multi-branch gated fusion deep learning model, MultiScaleSE-GatedCNN, was constructed for total nitrogen (TN) prediction in dairy farm manure slurry by integrating near-infrared spectra and sample-contextual information. Using 747 manure slurry samples collected from 36 large-scale dairy farms in Tianjin, China, this study systematically evaluated the predictive performance of traditional machine learning models and deep learning models under single-source spectral conditions and multi-source feature fusion conditions, and further analyzed the effects of different sample-contextual feature combinations on model performance through ablation experiments. The results showed that under single-source spectral input conditions, PLSR still exhibited strong predictive ability and served as an important baseline model for the current task. After the introduction of sample-contextual information, the predictive performance of traditional machine learning models generally improved to different extents, indicating that sample-contextual information can provide useful supplementary information for TN prediction in manure slurry. Among these traditional machine learning models, RF achieved the best overall performance under the multi-source condition. For the proposed MultiScaleSE-GatedCNN model, the ablation results showed that different sample-contextual feature combinations had markedly different effects on prediction performance. The combination of “spectra + farm name + longitude + season” was identified as the optimal input combination. Based on this combination, MultiScaleSE-GatedCNN achieved the best prediction performance, with a test-set Rp2 of 0.905, an RMSEP of 367.389 mg/L, and an RPD of 3.242, outperforming both the traditional machine learning models under single-source conditions and those under multi-source conditions. These results indicate that the proposed model can more effectively exploit the complementary relationship between near-infrared spectra and sample-contextual information, thereby improving the prediction accuracy and robustness of TN in manure slurry under complex scenarios.
Overall, this study demonstrates that integrating near-infrared spectra with sample-contextual information is an effective strategy for improving TN prediction in dairy farm manure slurry. The proposed MultiScaleSE-GatedCNN model provides a new methodological framework for rapid nutrient detection in heterogeneous manure slurry systems and offers technical support for nutrient assessment, precision fertilization, and intelligent management of livestock manure.




 ,
,