1. Introduction
Mechanized corn harvesting has been widely applied in most corn-producing areas in China, becoming a key link in improving agricultural production efficiency. One of the core factors affecting the quality of harvesting operations is whether the cutting table can be accurately aligned with the crop rows: accurate alignment can effectively reduce ear loss and reduce cutting table blockage, thereby significantly improving harvest quality and efficiency [
1,
2]. However, the intelligence level of corn harvesters in China still needs to be improved, and the operation during harvesting mainly relies on the driver’s experience and visual judgment. This not only increases the labor intensity and fatigue of drivers but also makes it difficult to maintain stable accuracy in manual operations, resulting in significant fluctuations in harvest quality and difficulty in effectively controlling loss rates. It is particularly urgent to develop an intelligent system that can assist or even replace manual operation in order to reduce dependence on manual operation, minimize harvest losses, and improve the standardization level of operations [
3,
4].
Mechanical guidance systems typically feature movable feeler levers or guide plates at the front end of the equipment, which adjust the direction of travel in real time through direct physical contact feedback with crop stems. Mechanical guidance achieves deviation correction through physical contact between feeler levers or guide plates and crop stalks [
5,
6,
7,
8]. However, it relies heavily on the continuity and uprightness of plants, exhibiting sluggish dynamic response and limited reliability under conditions of missing seedlings, lodging, or high-speed operation. It can be seen that the mechanical solution is intuitive in structure and low in cost, and has been applied in some field work machinery. However, its correction behavior relies heavily on the continuity and uprightness of the plants, which can easily lead to persistent guidance deviations in cases of missing seedlings, lodging, or irregular plant morphology. Additionally, dynamic response is sluggish during high-speed operations, limiting overall reliability. Therefore, it is more suitable for low-speed, structured operating environments.
Visual guidance involves capturing crop canopy images and utilizing computer vision algorithms to recognize inter-row structures, subsequently generating navigation paths. Vision-based guidance identifies crop row structures through image recognition [
9,
10]. Nevertheless, it is highly susceptible to interference from the dynamic field environment, cannot directly sense crop roots, suffers from significant precision degradation at high speeds, and exhibits insufficient generalization capability. Overall, pure visual row-alignment schemes are greatly affected by dynamic field environments, unable to directly perceive crop roots, and their speed and accuracy decrease with increasing operation speed. They rely heavily on scene and installation parameters, have limited generalization ability, and lack reliability in actual complex farmland. Therefore, they require integration with other sensing or compensation technologies for practical application.
Multi-sensor fusion guidance integrates information from various sensors such as GNSS, IMU, LiDAR, and visual cameras, enhancing the system’s perception ability, navigation accuracy, and overall robustness in complex environments through data fusion. Multi-sensor fusion schemes enhance robustness by integrating information from GNSS, IMU, LiDAR, and vision [
11,
12]. However, they still face challenges such as difficulty in sensor temporal synchronization, dynamic response delay, and high cost, which restrict their large-scale application. It can be seen that multi-sensor fusion-based automatic row-following methods for agricultural machinery can achieve high row-following accuracy in practical operations, demonstrating significant reliability over single-sensor methods. However, such systems still generally suffer from inherent problems in multi-source heterogeneous information fusion, such as difficulty in time synchronization between sensors, response delays under dynamic working conditions, insufficient adaptability to complex field environments, and high costs. These deficiencies collectively constitute key bottlenecks restricting their large-scale reliable application and are difficult problems that urgently need to be addressed in the field of smart agricultural equipment.
The above analysis indicates that all three existing technical approaches have significant limitations: mechanical guidance relies on crop continuity and uprightness, making it difficult to handle complex conditions such as missing seedlings or lodging; vision-based guidance is highly susceptible to dynamic field environments, with accuracy degrading significantly during high-speed operations; and although multi-sensor fusion solutions can improve robustness, they commonly face bottlenecks such as difficulty in sensor temporal synchronization, dynamic response latency, and high system cost. The key lies in achieving complementary and enhanced sensing capabilities along with reliable continuous guidance without significantly increasing cost or complexity. To this end, this paper proposes a vision–gateway collaborative enhancement strategy for row following: stereo vision is used to provide high-frequency relative navigation information, while an intelligent gateway deeply integrates vehicle CAN bus data with BDS/GNSS global positioning data, establishing a complementary verification mechanism between vision-based relative navigation and global trajectory. Compared with mechanical solutions, this method requires no physical contact with crops and offers stronger adaptability to complex field conditions. Compared with vision-only solutions, this method effectively mitigates environmental interference and performance degradation at high speeds through multi-source fusion. Compared with existing multi-sensor fusion systems, this method achieves millisecond-level response and low-cost deployment through an edge gateway architecture, avoiding the information synchronization latency and high sensor costs associated with centralized processing. When vision fails due to environmental interference, the fusion system can maintain reliable guidance based on historical trajectories and multi-source information. Through architectural innovation and algorithmic fusion, this method significantly enhances system robustness, providing a deployable technical pathway for reliable automatic row following in complex field environments.
To achieve the aforementioned collaborative enhanced row-assistance system, this paper innovates in three aspects: visual perception, state estimation, and multi-source fusion. The main contributions are as follows:
- (1)
A “vision-driven—gateway-enhanced” dual-mode navigation system based on a multi-source data gateway has been developed for corn combine harvesters. This system can achieve multi-source information fusion and has been successfully deployed on the RK3568 embedded platform.
- (2)
A novel deep learning segmentation model named R2DC-Mask R-CNN was proposed (which integrates Random-Batch enhancement, Res2Net multi-scale backbone, deformable convolution, and channel attention). This model, through multi-dimensional network structure optimization, can effectively address challenges such as the slender nature of corn row targets, complex backgrounds, and variable morphologies, significantly improving detection accuracy and segmentation continuity.
- (3)
A MCC-KF median robust estimation algorithm that integrates the maximum correlation entropy criterion (MCC) and Kalman filter (KF) is proposed, aiming to suppress the interference from abnormal observations in the field and improve the continuity and stability of the median estimation in complex environments.
2. Materials and Methods
2.1. System Description
2.1.1. System Composition
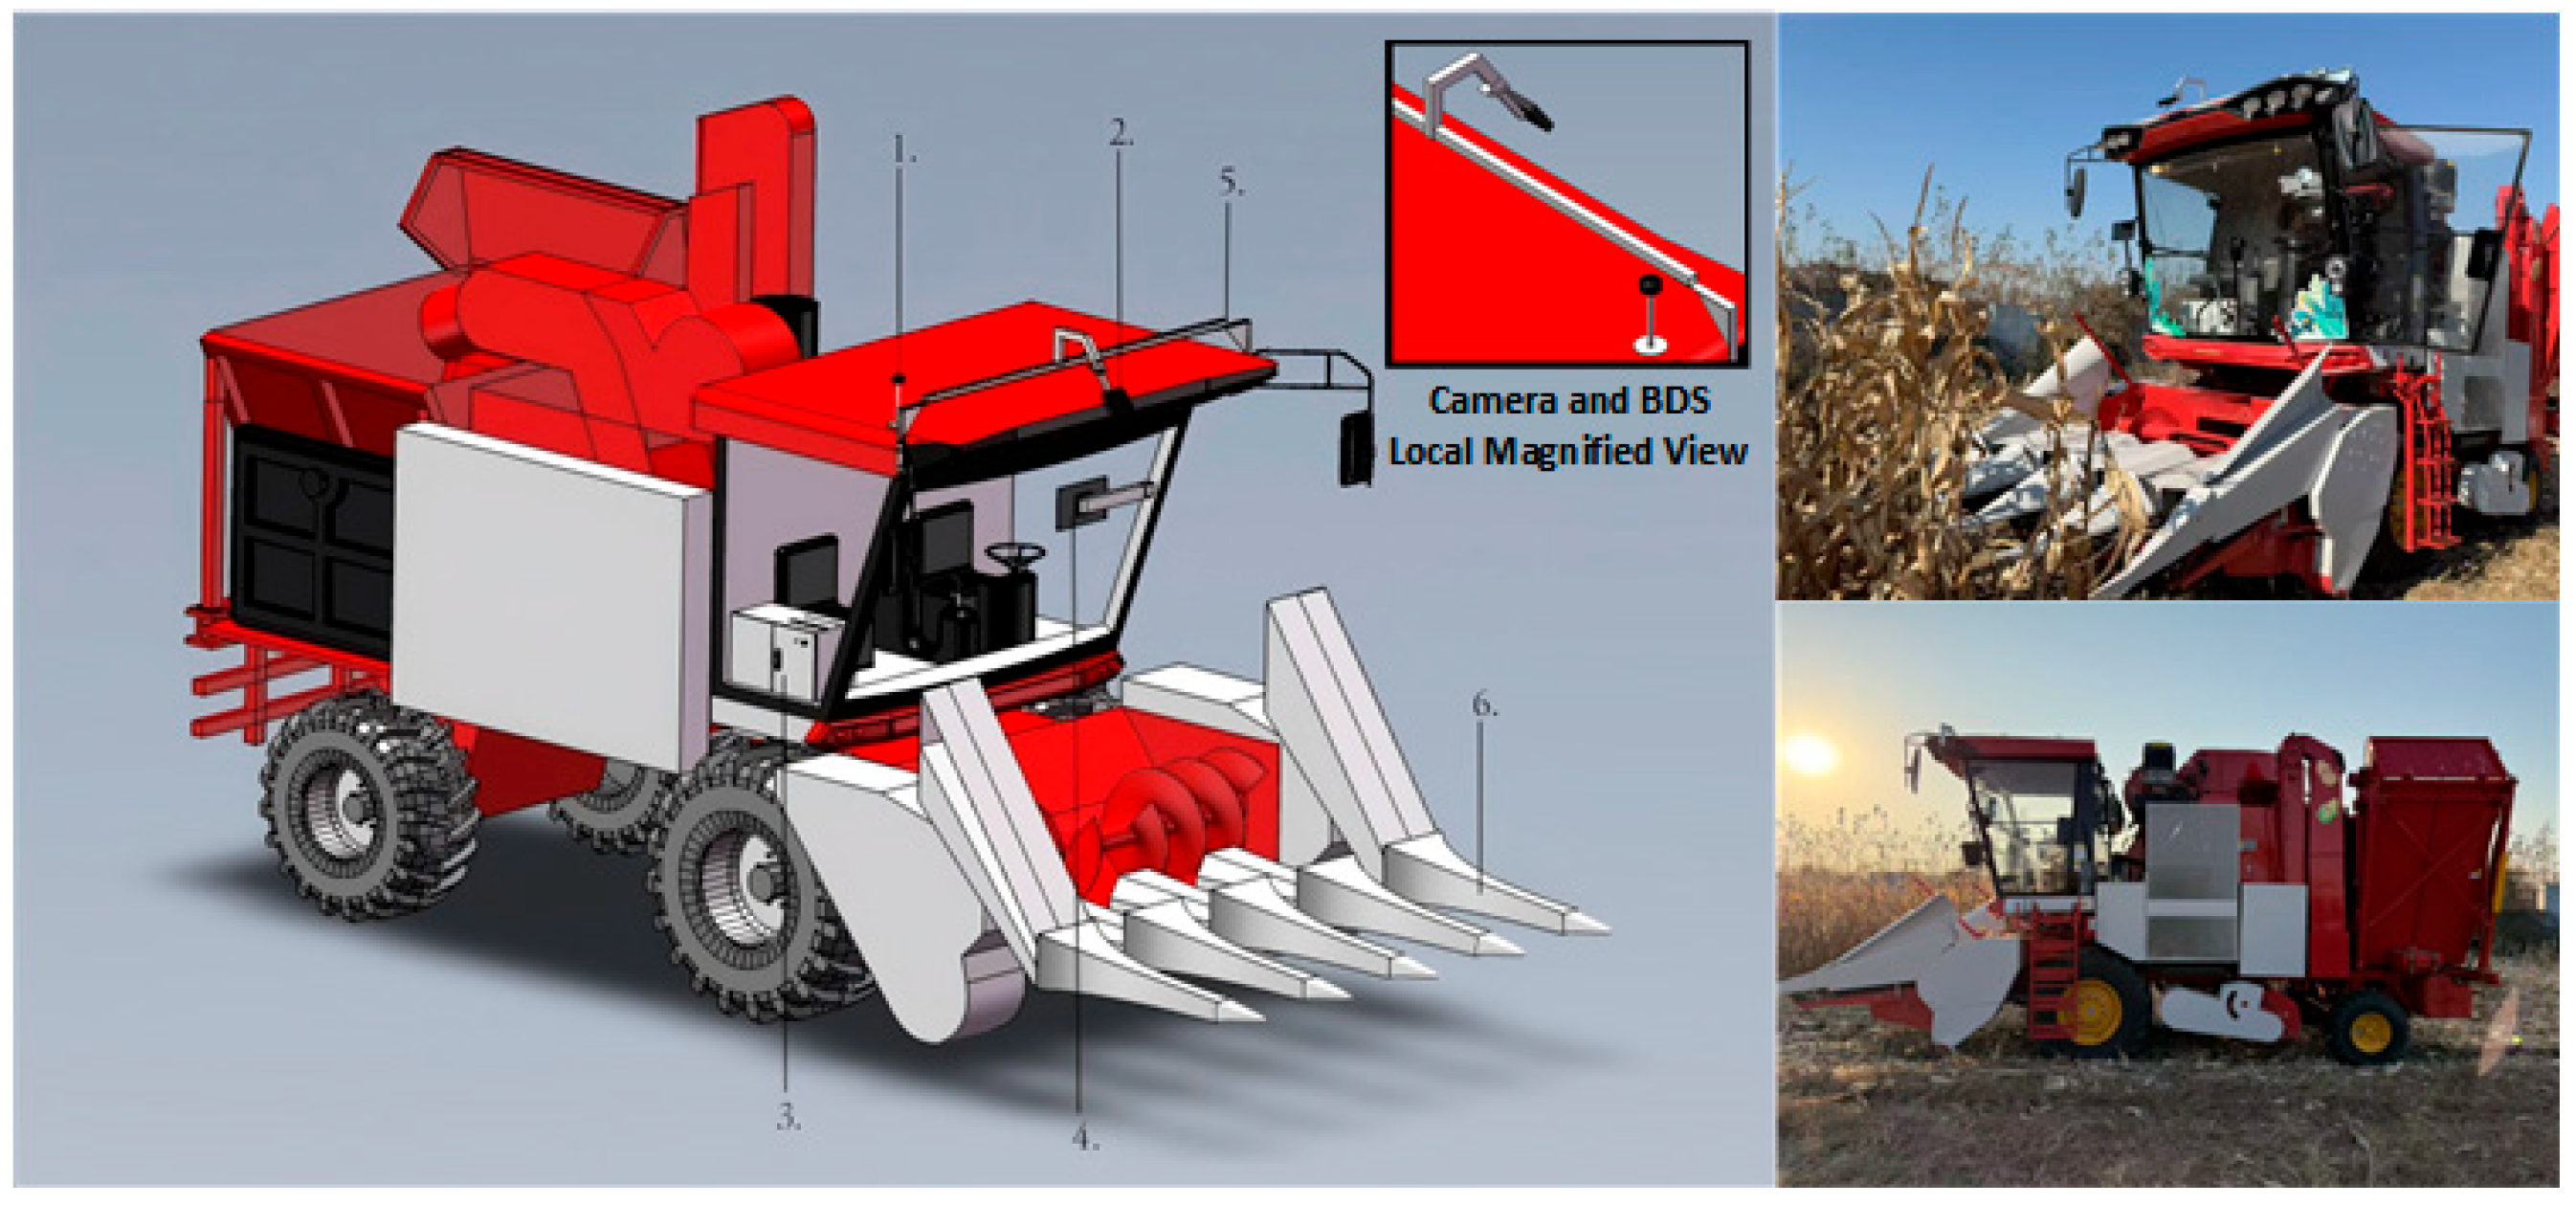
To achieve precise row-by-row operation of the corn harvester between crop rows, taking the Wuchai Leiwuo Gu Shen CD4P (4YZ-4EP/4YZ-4EP1) self-propelled corn harvester as the research object, a driving-assistance system based on machine vision was constructed, as shown in
Figure 1. This test system mainly consists of a visual perception system, an on-board computing system, an auxiliary guidance system, a human–computer interaction system, and an integrated power supply system. The visual perception system uses a stereo camera (ZED 2i, Stereolabs Company, San Francisco, CA, USA), with an image resolution of 960 × 640 pixels, a frame rate of 60 fps, and a field of view of 110°. The camera is installed in the center of the cab, with an installation angle of 15° downward. The on-board computing system is based on a single industrial computer, equipped with an Intel Core i5-9400F processor and an NVIDIA GeForce GTX 1050 Ti (4 GB GDDR5) independent graphics card (NVIDIA Corporation, Santa Clara, CA, USA), responsible for running the visual recognition algorithm in real time. The auxiliary guidance system uses software algorithms to calculate the lateral offset in real time and generates dynamic guidance information on the interactive interface. The human–computer interaction system uses a 13.3-inch high-brightness display (resolution 2560 × 1440), placed on the right side of the cab, ensuring that the driver can clearly read in strong light. All equipment power supply is managed by a custom integrated power box, which is connected to the on-board 24 V DC power supply, and internally integrates multiple isolated DC-DC conversion and protection circuits to ensure the stable operation of the system in vibration and dusty environments.
2.1.2. Principle of Lane Assist System
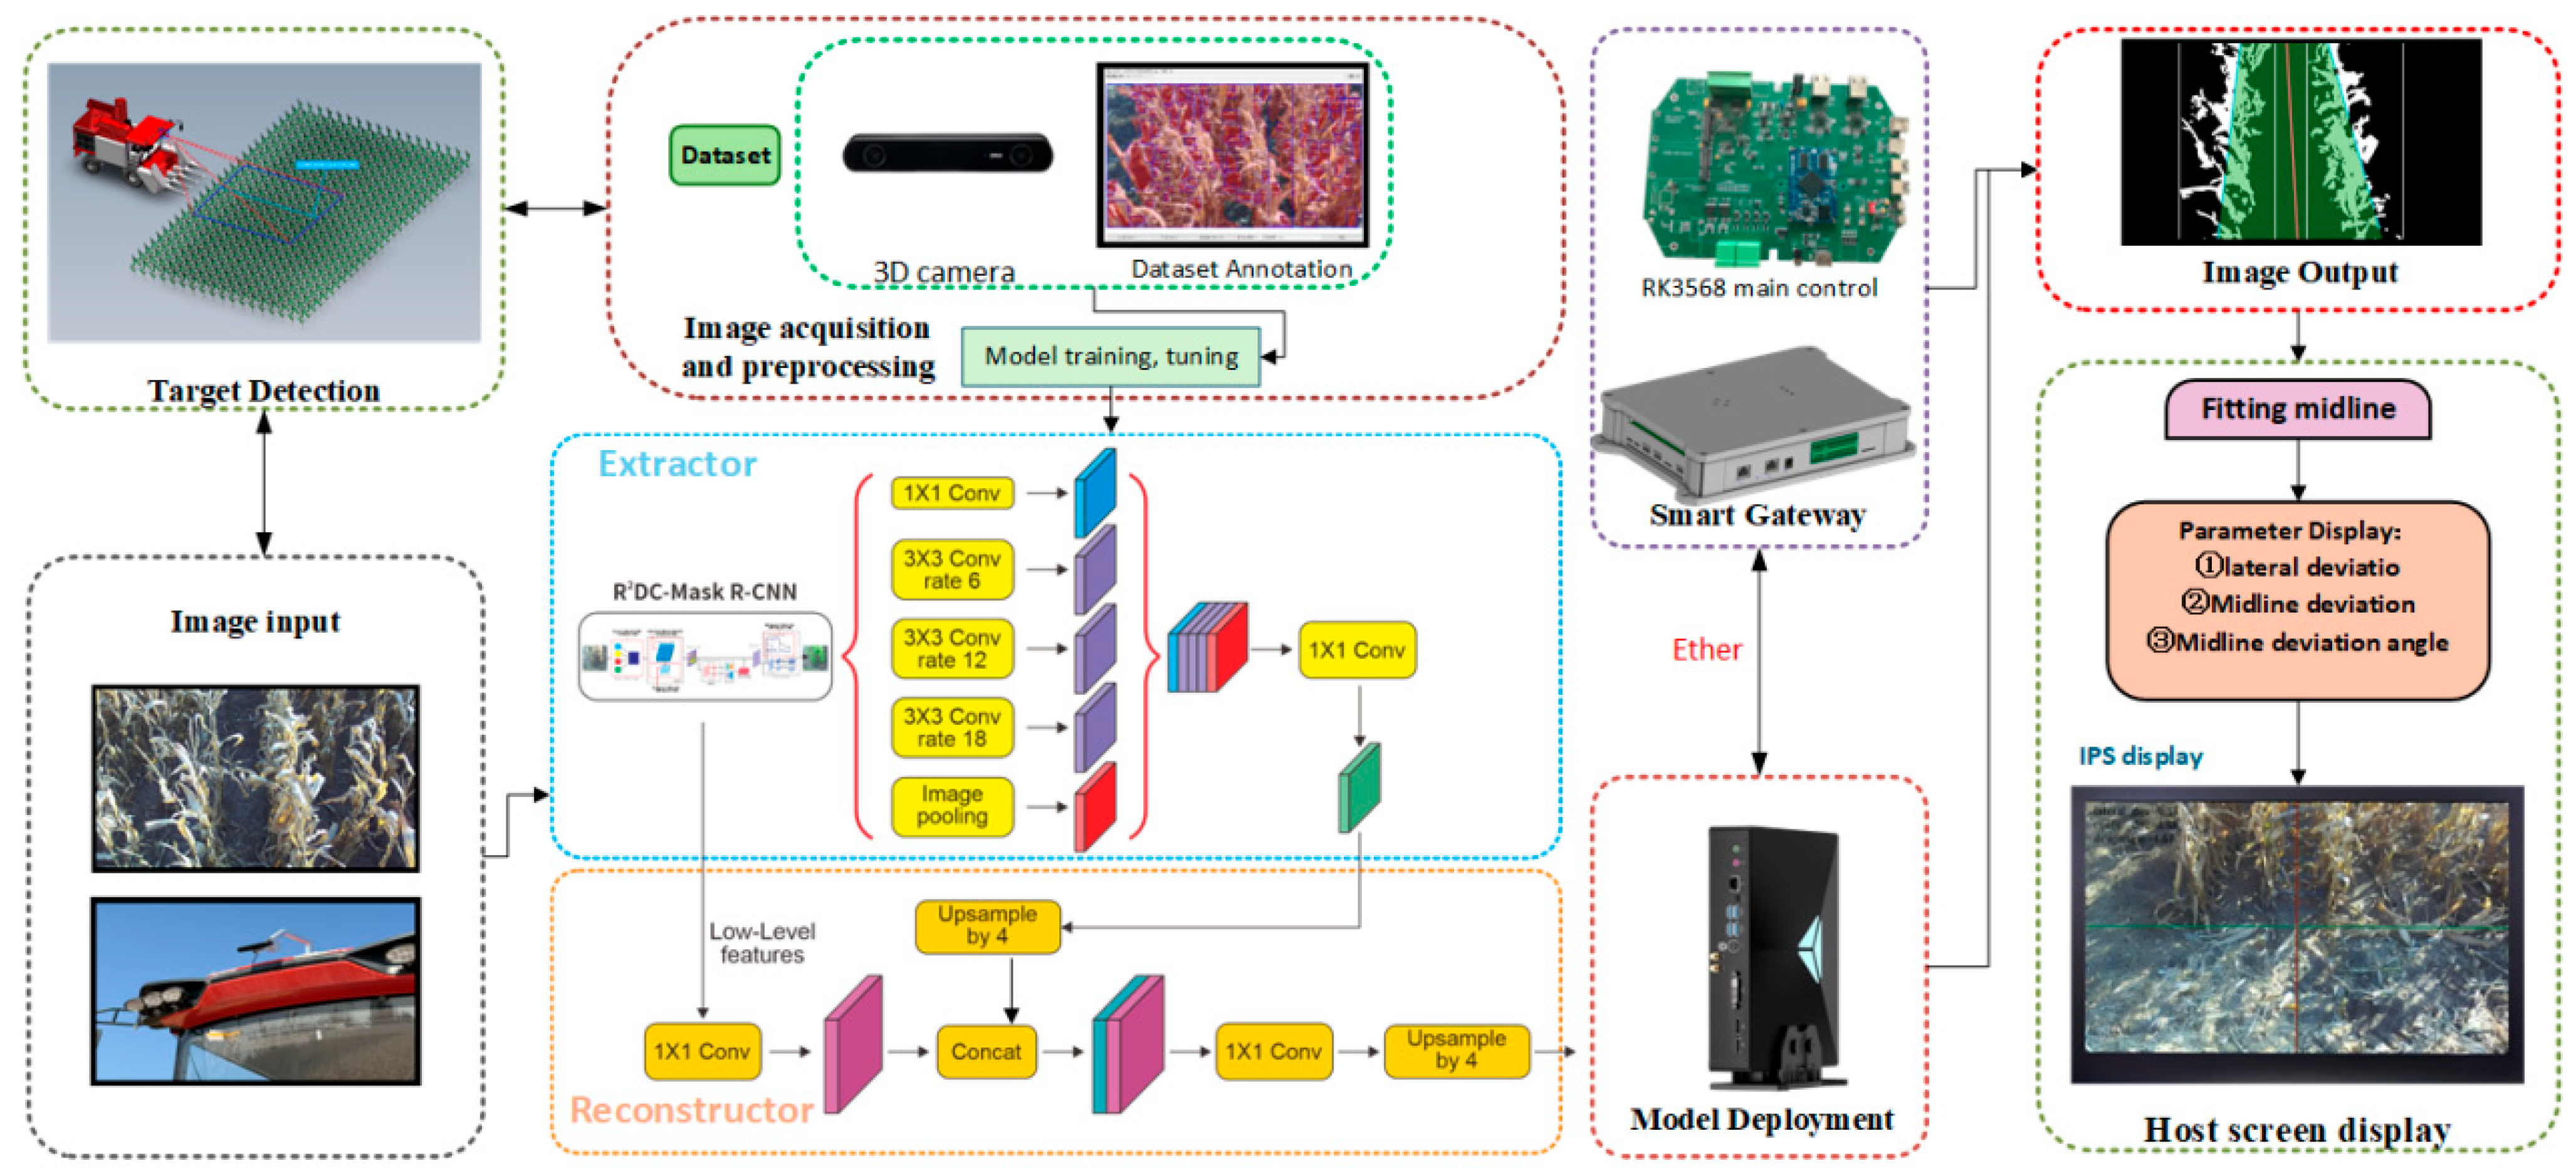
The working principle of the row-assistance system for corn harvesters based on machine vision is shown in
Figure 2. The stereo vision camera captures real-time images of the corn rows in front and transmits them to the on-board industrial control computer. The industrial control computer runs a deep learning algorithm to segment the crop row area, fits the left and right boundary lines using the Hough transform and calculates the navigation centerline [
13,
14,
15]. At the same time, it calculates the lateral deviation of the harvester from the centerline. The industrial control computer sends the processing results through the Ethernet interface to the intelligent gateway. The gateway integrates vehicle CAN bus information (speed, steering angle) and BDS/GNSS positioning data to dynamically verify and evaluate the confidence of the visual navigation centerline; the dual-mode collaborative mechanism is realized through confidence assessment and dynamic weight allocation. A visual confidence metric Cv is defined, which is comprehensively calculated based on the segmentation confidence score output by the R
2DC-Mask R-CNN, the detection consistency across consecutive frames (temporal coherence), and the deviation from the historical trajectory. When Cv ≥ 0.75 and the visual/GNSS trajectory deviation is less than 10 cm, the system operates in “vision-dominant mode” (with weights wv = 0.9, wg = 0.1), directly outputting the visual navigation line. When Cv < 0.75 or detection fails for three consecutive frames, the system switches to “gateway-enhanced mode,” in which wv is reduced to 0.2. In this mode, the gateway fuses GNSS absolute position, CAN bus heading, and vehicle speed information using the MCC-KF algorithm and estimates short-term dead reckoning through a kinematic model to generate a compensatory navigation line. The two modes achieve smooth transitions via fuzzy logic, avoiding output jumps caused by hard switching and ensuring guidance continuity under scenarios such as occlusion and sudden illumination changes. when the confidence is high, the visual navigation line is used as the main output; when the confidence is low, the fusion compensation mechanism is automatically activated, combining historical trajectories and absolute positioning to generate a compensation navigation line, ensuring continuous and reliable output. The final fused navigation line is rendered graphically and output to the driver cab’s interactive display, providing intuitive guidance for the driver, forming a human–machine collaborative closed loop of “visual perception—industrial control processing—gateway fusion—interactive guidance—driver control”.
2.2. Development Environment and Technical Process
The visual acquisition equipment uses the ZED 2i stereo vision camera (from Stereolabs, San Francisco, CA, USA). The camera is mounted on the top of the driver’s cabin, with the optical center of the lens approximately 2.9 m above the ground. The image resolution of the collected data is 960 × 640 pixels, and the video frame rate is set at 15 frames per second. The algorithm development is carried out using the Python 3.9 programming language. The core recognition model is built based on the PyTorch 1.12 deep learning framework and combined with the Open CV 4.5 library to implement image preprocessing and postprocessing logic. The compilation and testing environment is Windows 10 under Visual Studio Code 1.70. The image-processing hardware is the on-board industrial computer, with a processor of Intel Core i5-9400F and a graphics card of NVIDIA GeForce GTX 1050 Ti, and 16 GB of memory.
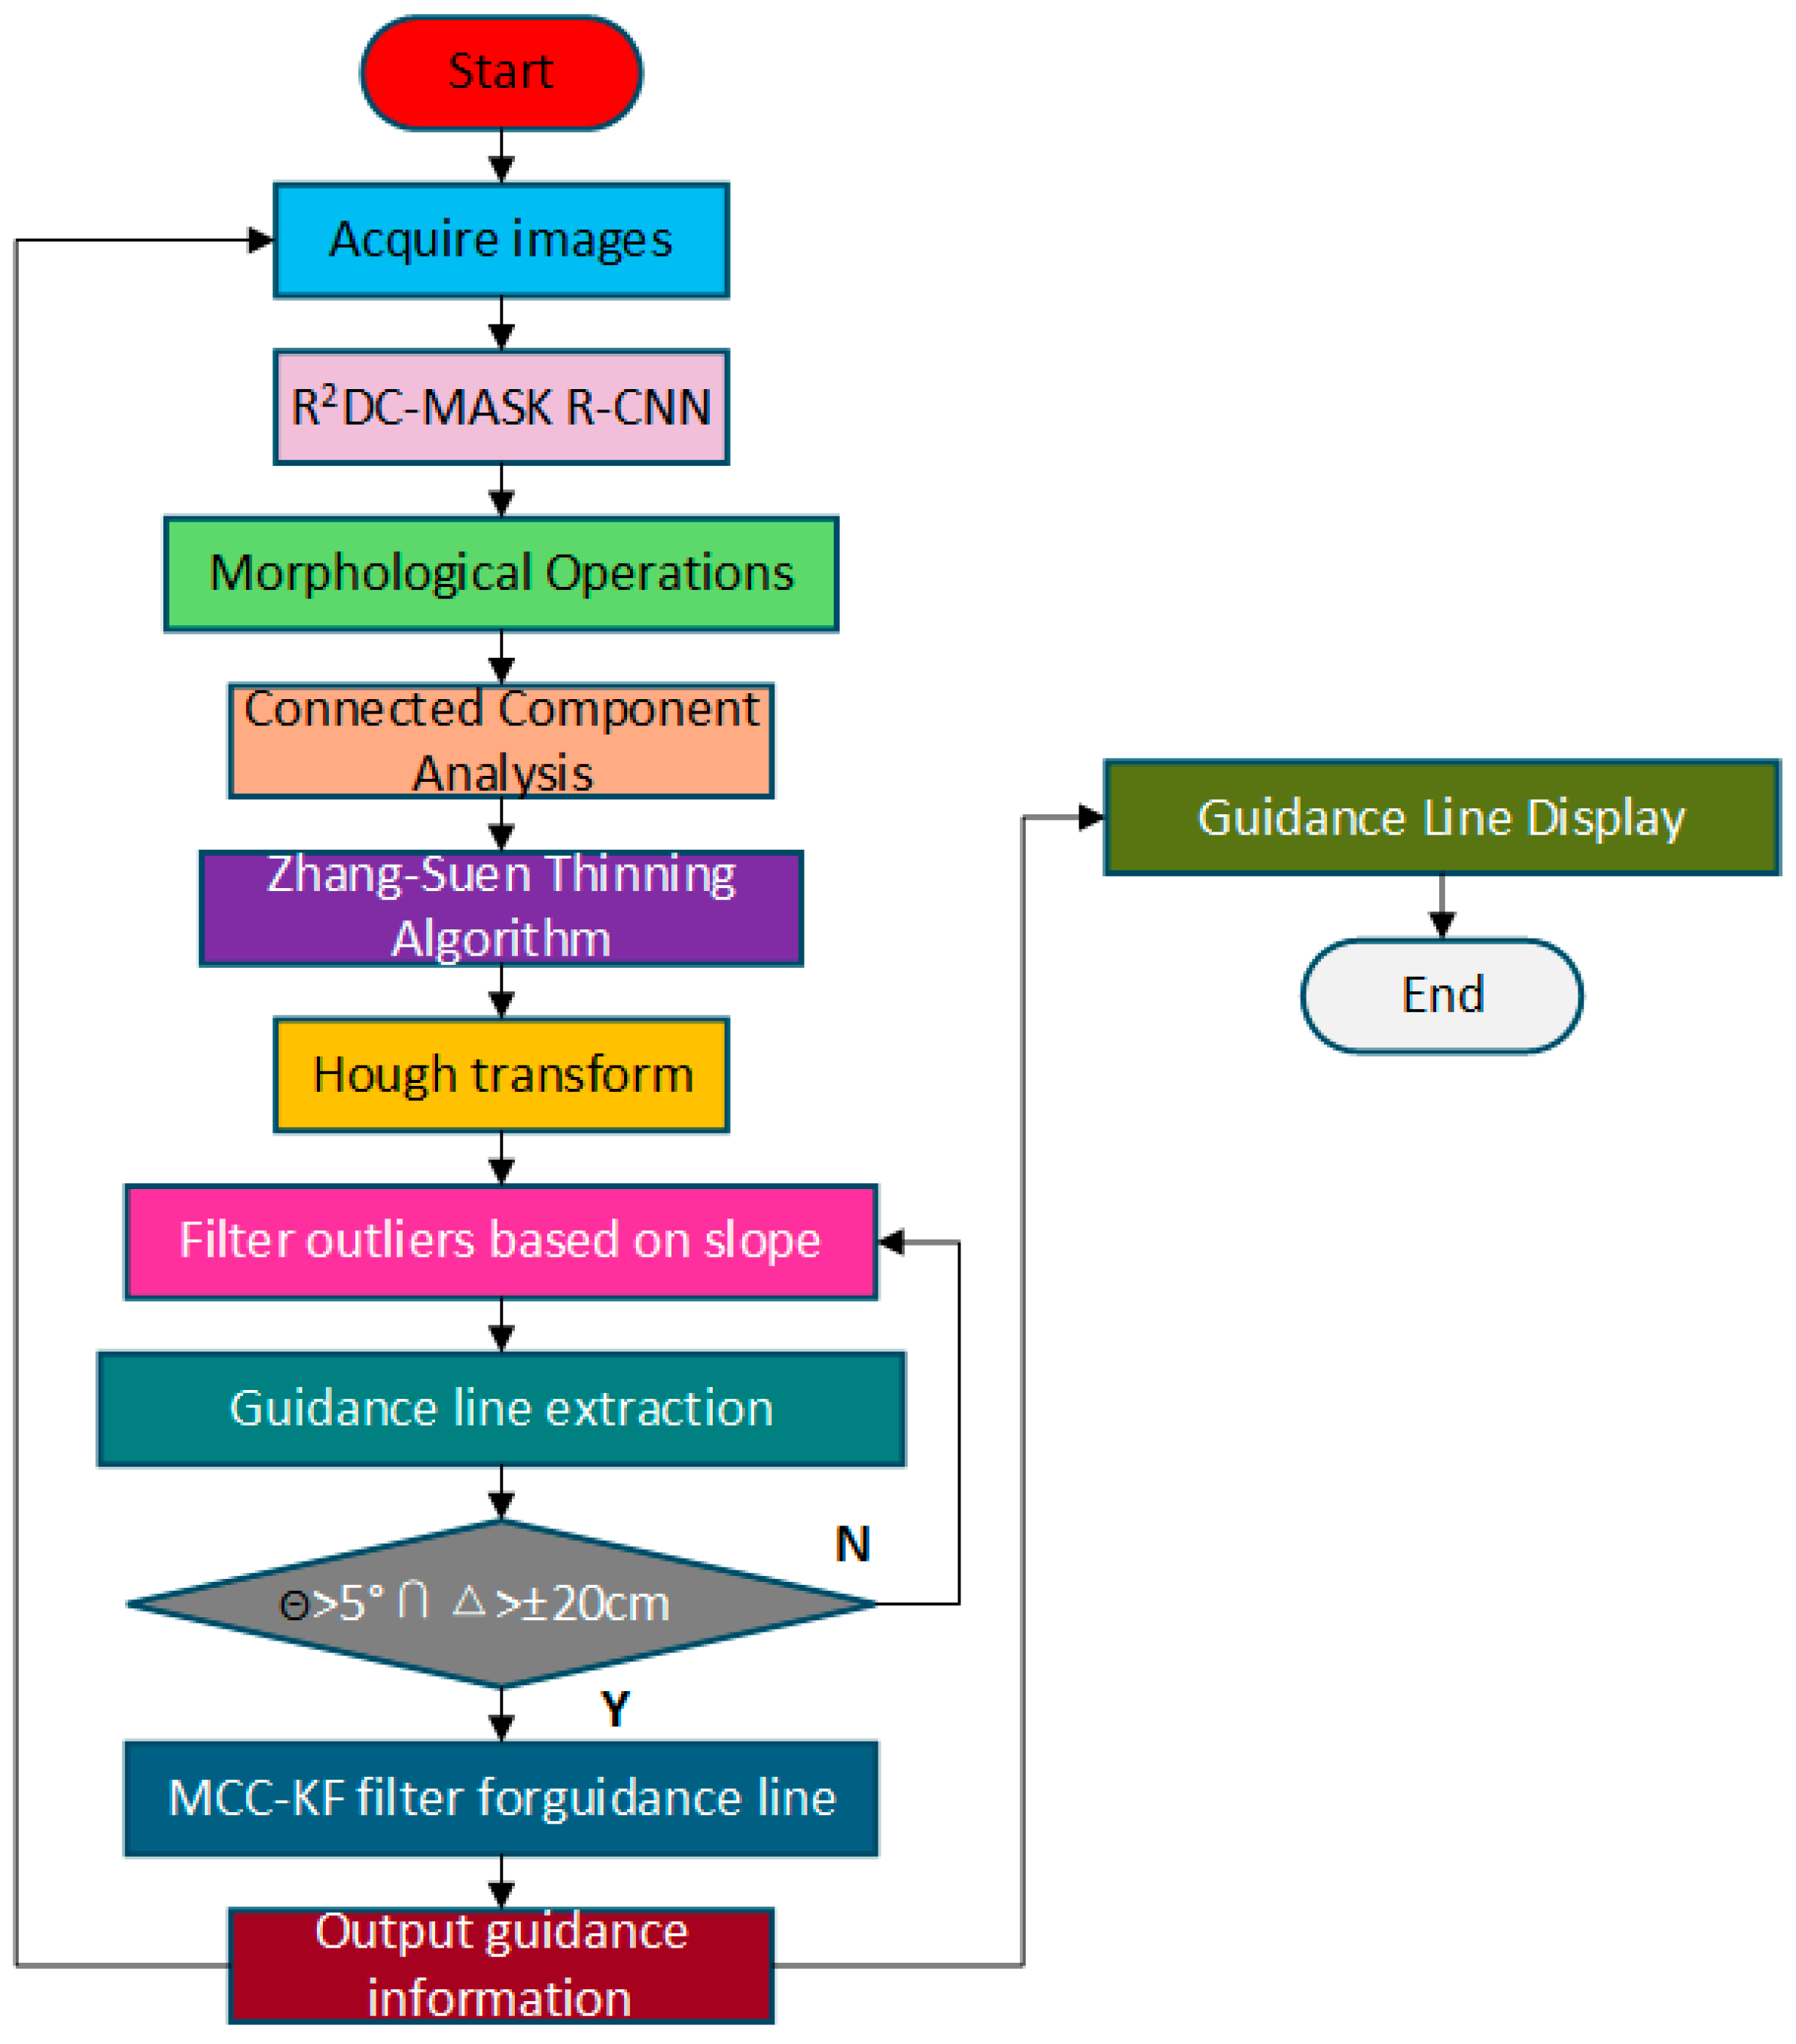
The navigation centerline extraction process is shown in
Figure 3. Firstly, the corn row images captured by the camera are input into the R
2DC-Mask R-CNN instance segmentation network to obtain a binary segmentation map of the corn row area. Subsequently, through morphological opening operations (corrosion followed by dilation), small noises are removed and holes are filled to obtain a continuous and complete row area. Based on connected domain analysis, the main row areas are selected, and the Zhang-Suen refinement algorithm is used to extract skeleton lines with a single-pixel width. The skeleton lines are subjected to probability Hough transformation, and the left and right row boundary straight line equations are fitted, thereby calculating the midline as the navigation centerline [
16,
17,
18]. The system calculates in real time the lateral pixel offset of the centerline and converts it into actual physical deviation through camera calibration. The parameters of the fitted centerline for each frame are input as observations into the MCC-KF algorithm for time series filtering. This algorithm can dynamically adjust the observation weights based on new information, effectively suppressing the interference of abnormal observations, and outputs a stable and smooth navigation centerline. Finally, the navigation line, lateral deviation, and steering guidance information are superimposed and displayed on the vehicle’s interactive interface to assist the driver in completing the row operation [
19].
2.3. Experimental Environment and Training Parameters
To ensure the fairness and reproducibility of the assessment, all models were tested under the same experimental conditions. The software and hardware configuration of the experimental platform, including the on-board industrial control computer and training workstation, is shown in
Table 1. Experimental environment parameters: Training and inference use the same software environment, and training is accelerated on a higher-performance GPU (RTX 4080), while actual operation is performed on the on-board industrial control computer GTX 1050 Ti.
To ensure the stable convergence of each comparison model, based on extensive experimental experience from the previous stage, this paper selects the training hyperparameters shown in
Table 2. Training parameters: these include batch size, initial learning rate, optimizer, and number of iterations. Among them, the Random-Batch augmentation strategy employs multi-scale random cropping and splicing to generate diverse training samples online, which is used to expand the dataset and enhance the generalization ability of the model.
The evaluation metrics used in this study are defined in
Table 3.
2.4. R2DC-Mask R-CNN Model
Mask R-CNN, as a classic instance segmentation framework [
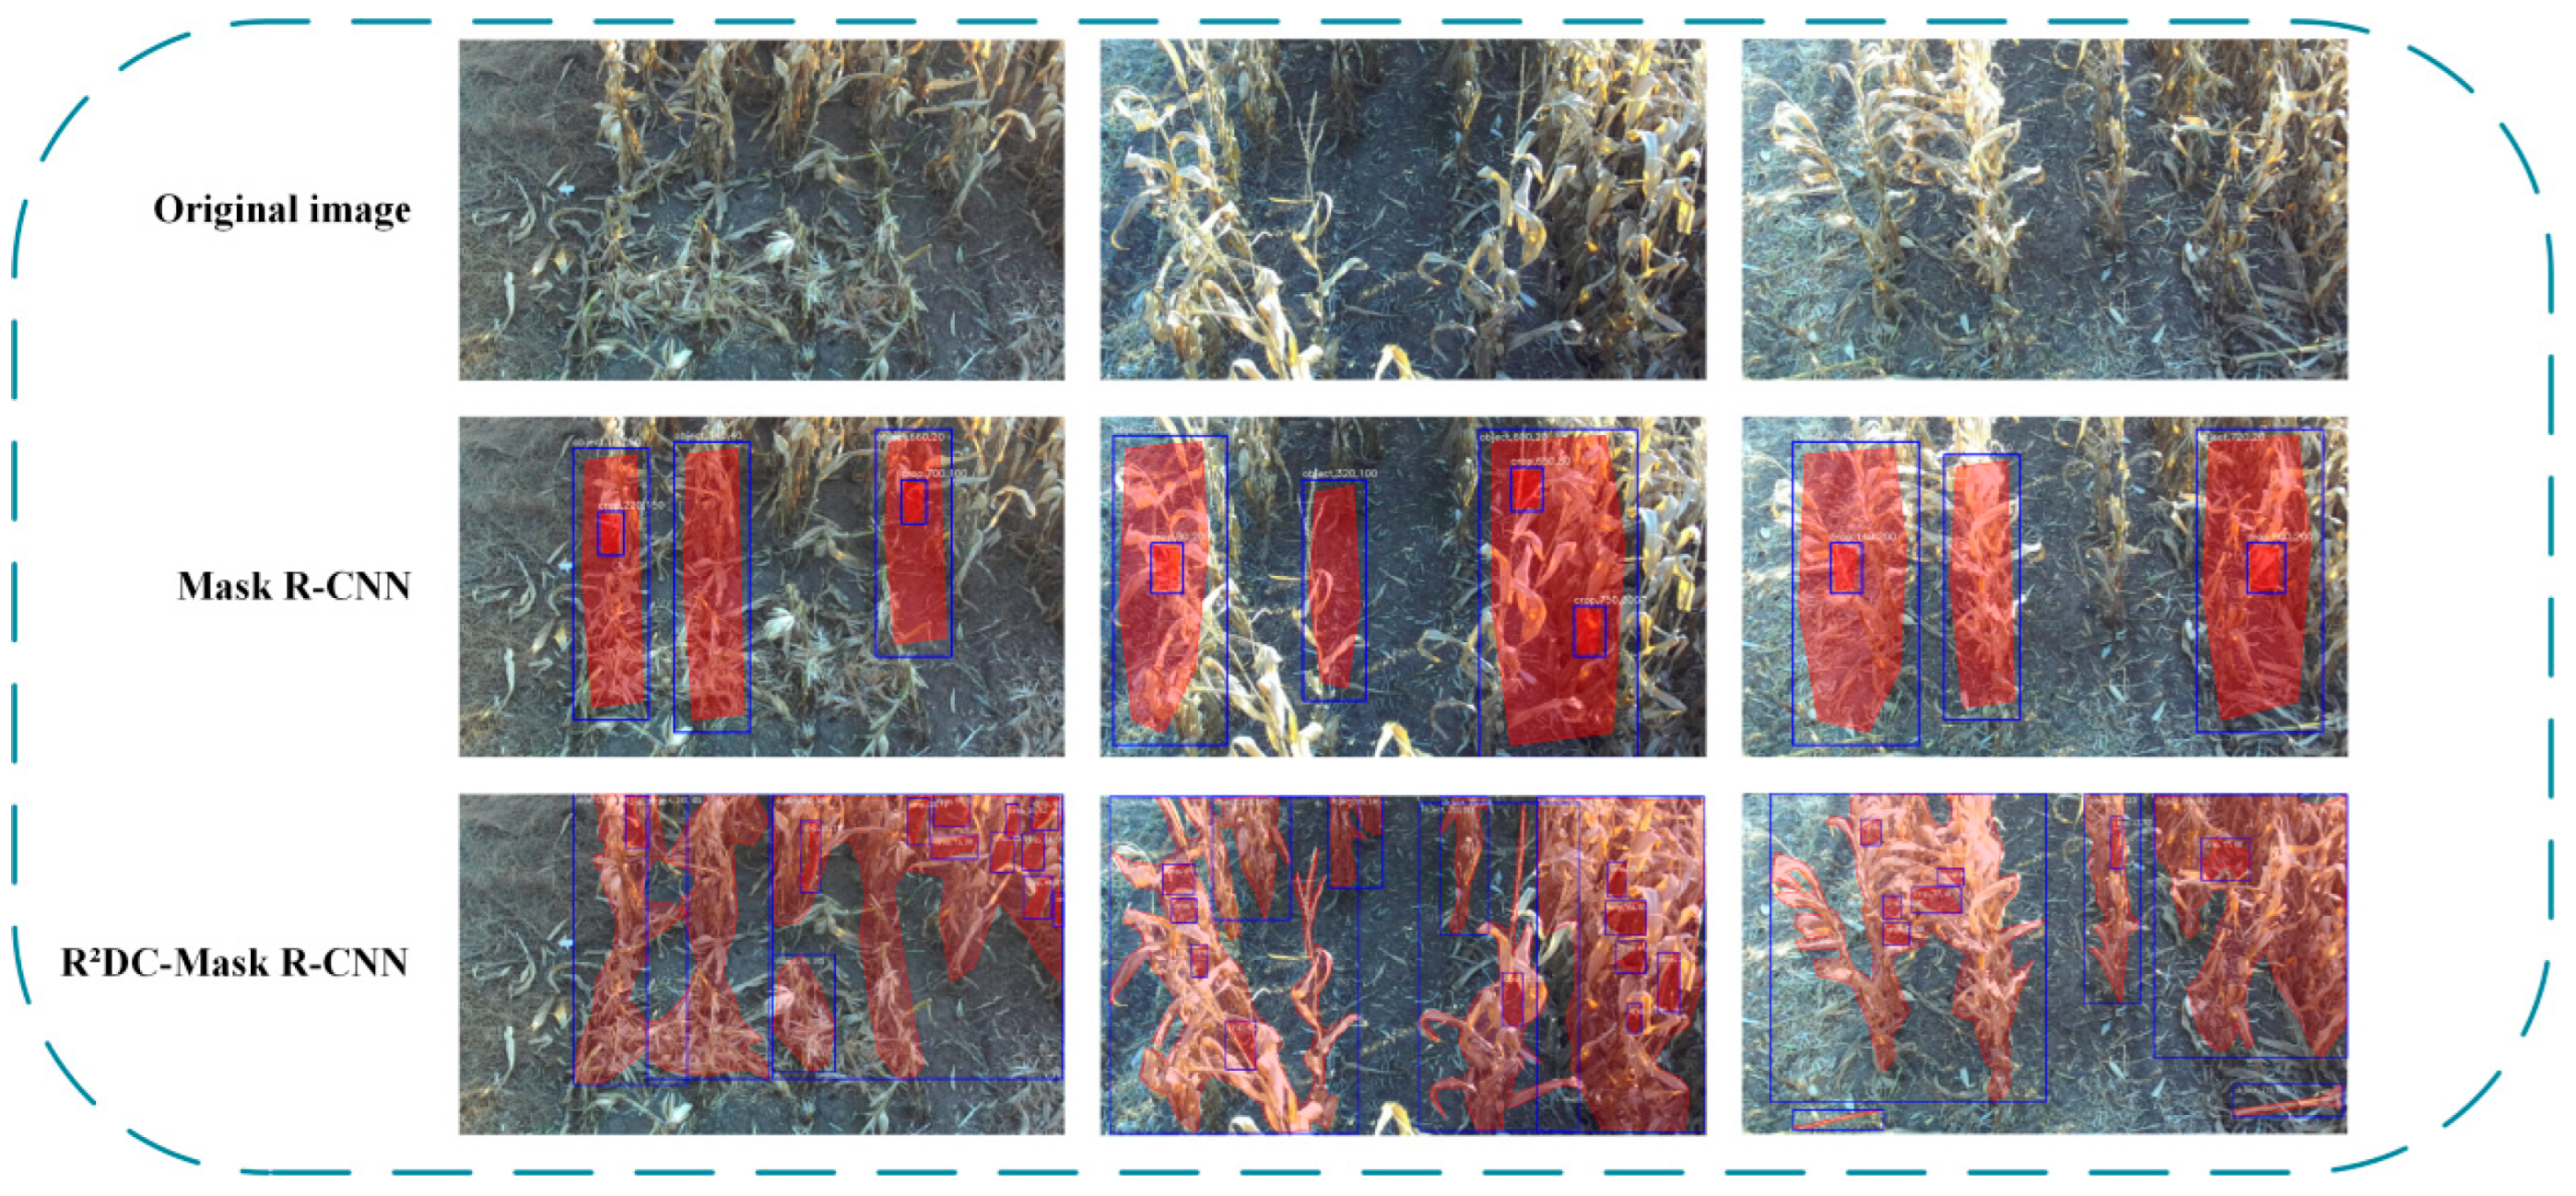
20], improves the multi-scale feature extraction capability by adopting the ResNet + FPN backbone network on the basis of Faster R-CNN. It solves the pixel deviation problem through ROI Align bilinear interpolation and sets independent Mask branches for each category to avoid inter-class competition. The overall performance is significantly superior to previous models. However, when directly applied to the row scenario of corn harvesters, it still faces three major challenges: the corn rows are slender, resulting in easy loss of spatial-structure information during feature extraction; the plant morphology is variable, making the traditional convolution with fixed geometric structure insufficiently adaptable; the field background is complex, causing a large amount of noise interference that is difficult to effectively suppress. To address these issues, this paper proposes an enhanced instance segmentation model R
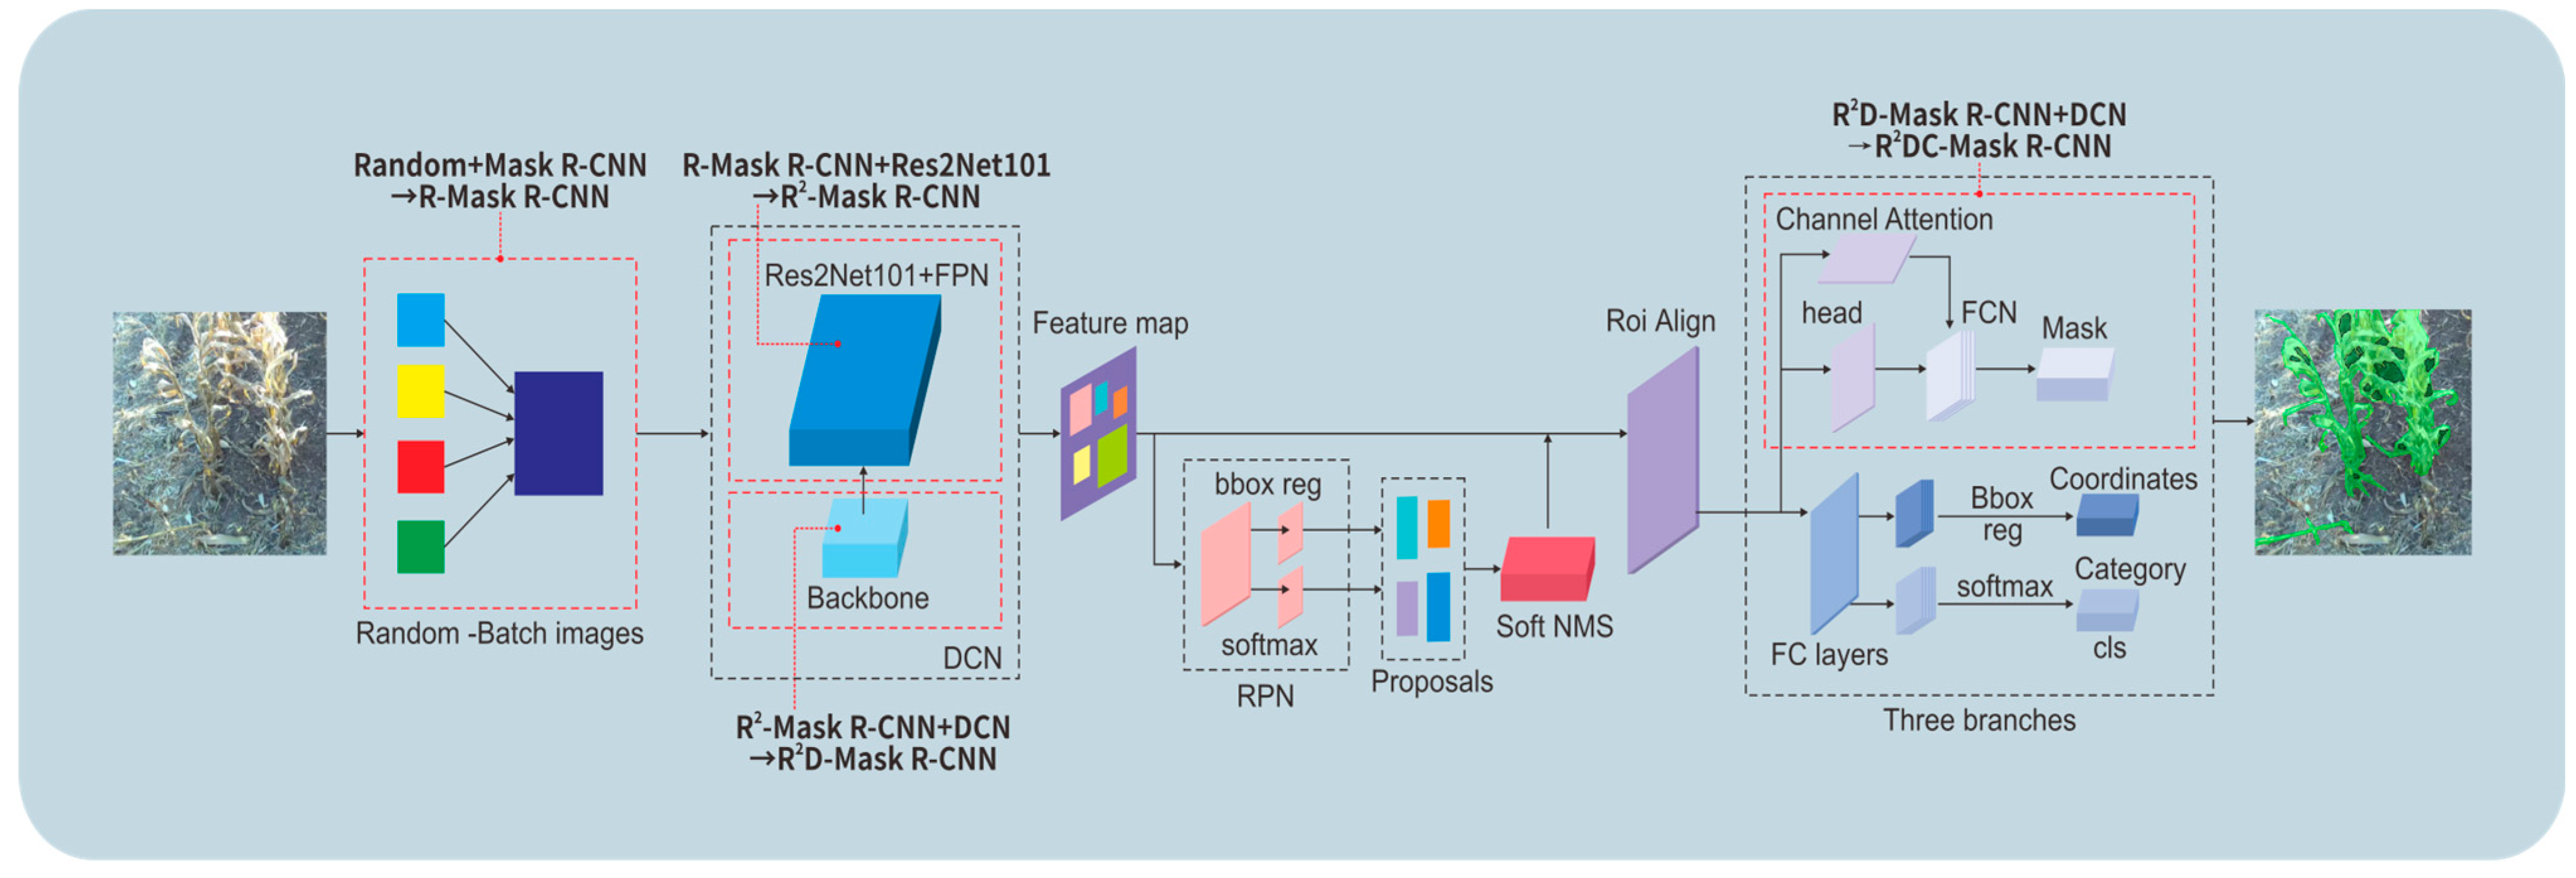
2DC-Mask R-CNN; the overall framework flowchart is shown in
Figure 4. The model takes raw corn row images as input. First, a multi-scale random cropping and stitching augmentation strategy, termed Random-Batch Images, is applied to generate R-Mask R-CNN. Subsequently, Res2Net101 is adopted as the backbone network to extract multi-scale features, and deformable convolution is introduced to replace standard convolution, forming R
2DC-Mask R-CNN. The extracted features are then fused through a feature pyramid network (FPN), followed by candidate box generation via a region proposal network (RPN) and Soft NMS. After ROI Align, a channel attention mechanism is incorporated into the Mask branch for feature reweighting, ultimately producing the instance segmentation results of corn rows. In the figure, arrows indicate data flow, and dashed boxes represent model variants at each stage.
2.4.1. Improvement in the Input Dataset
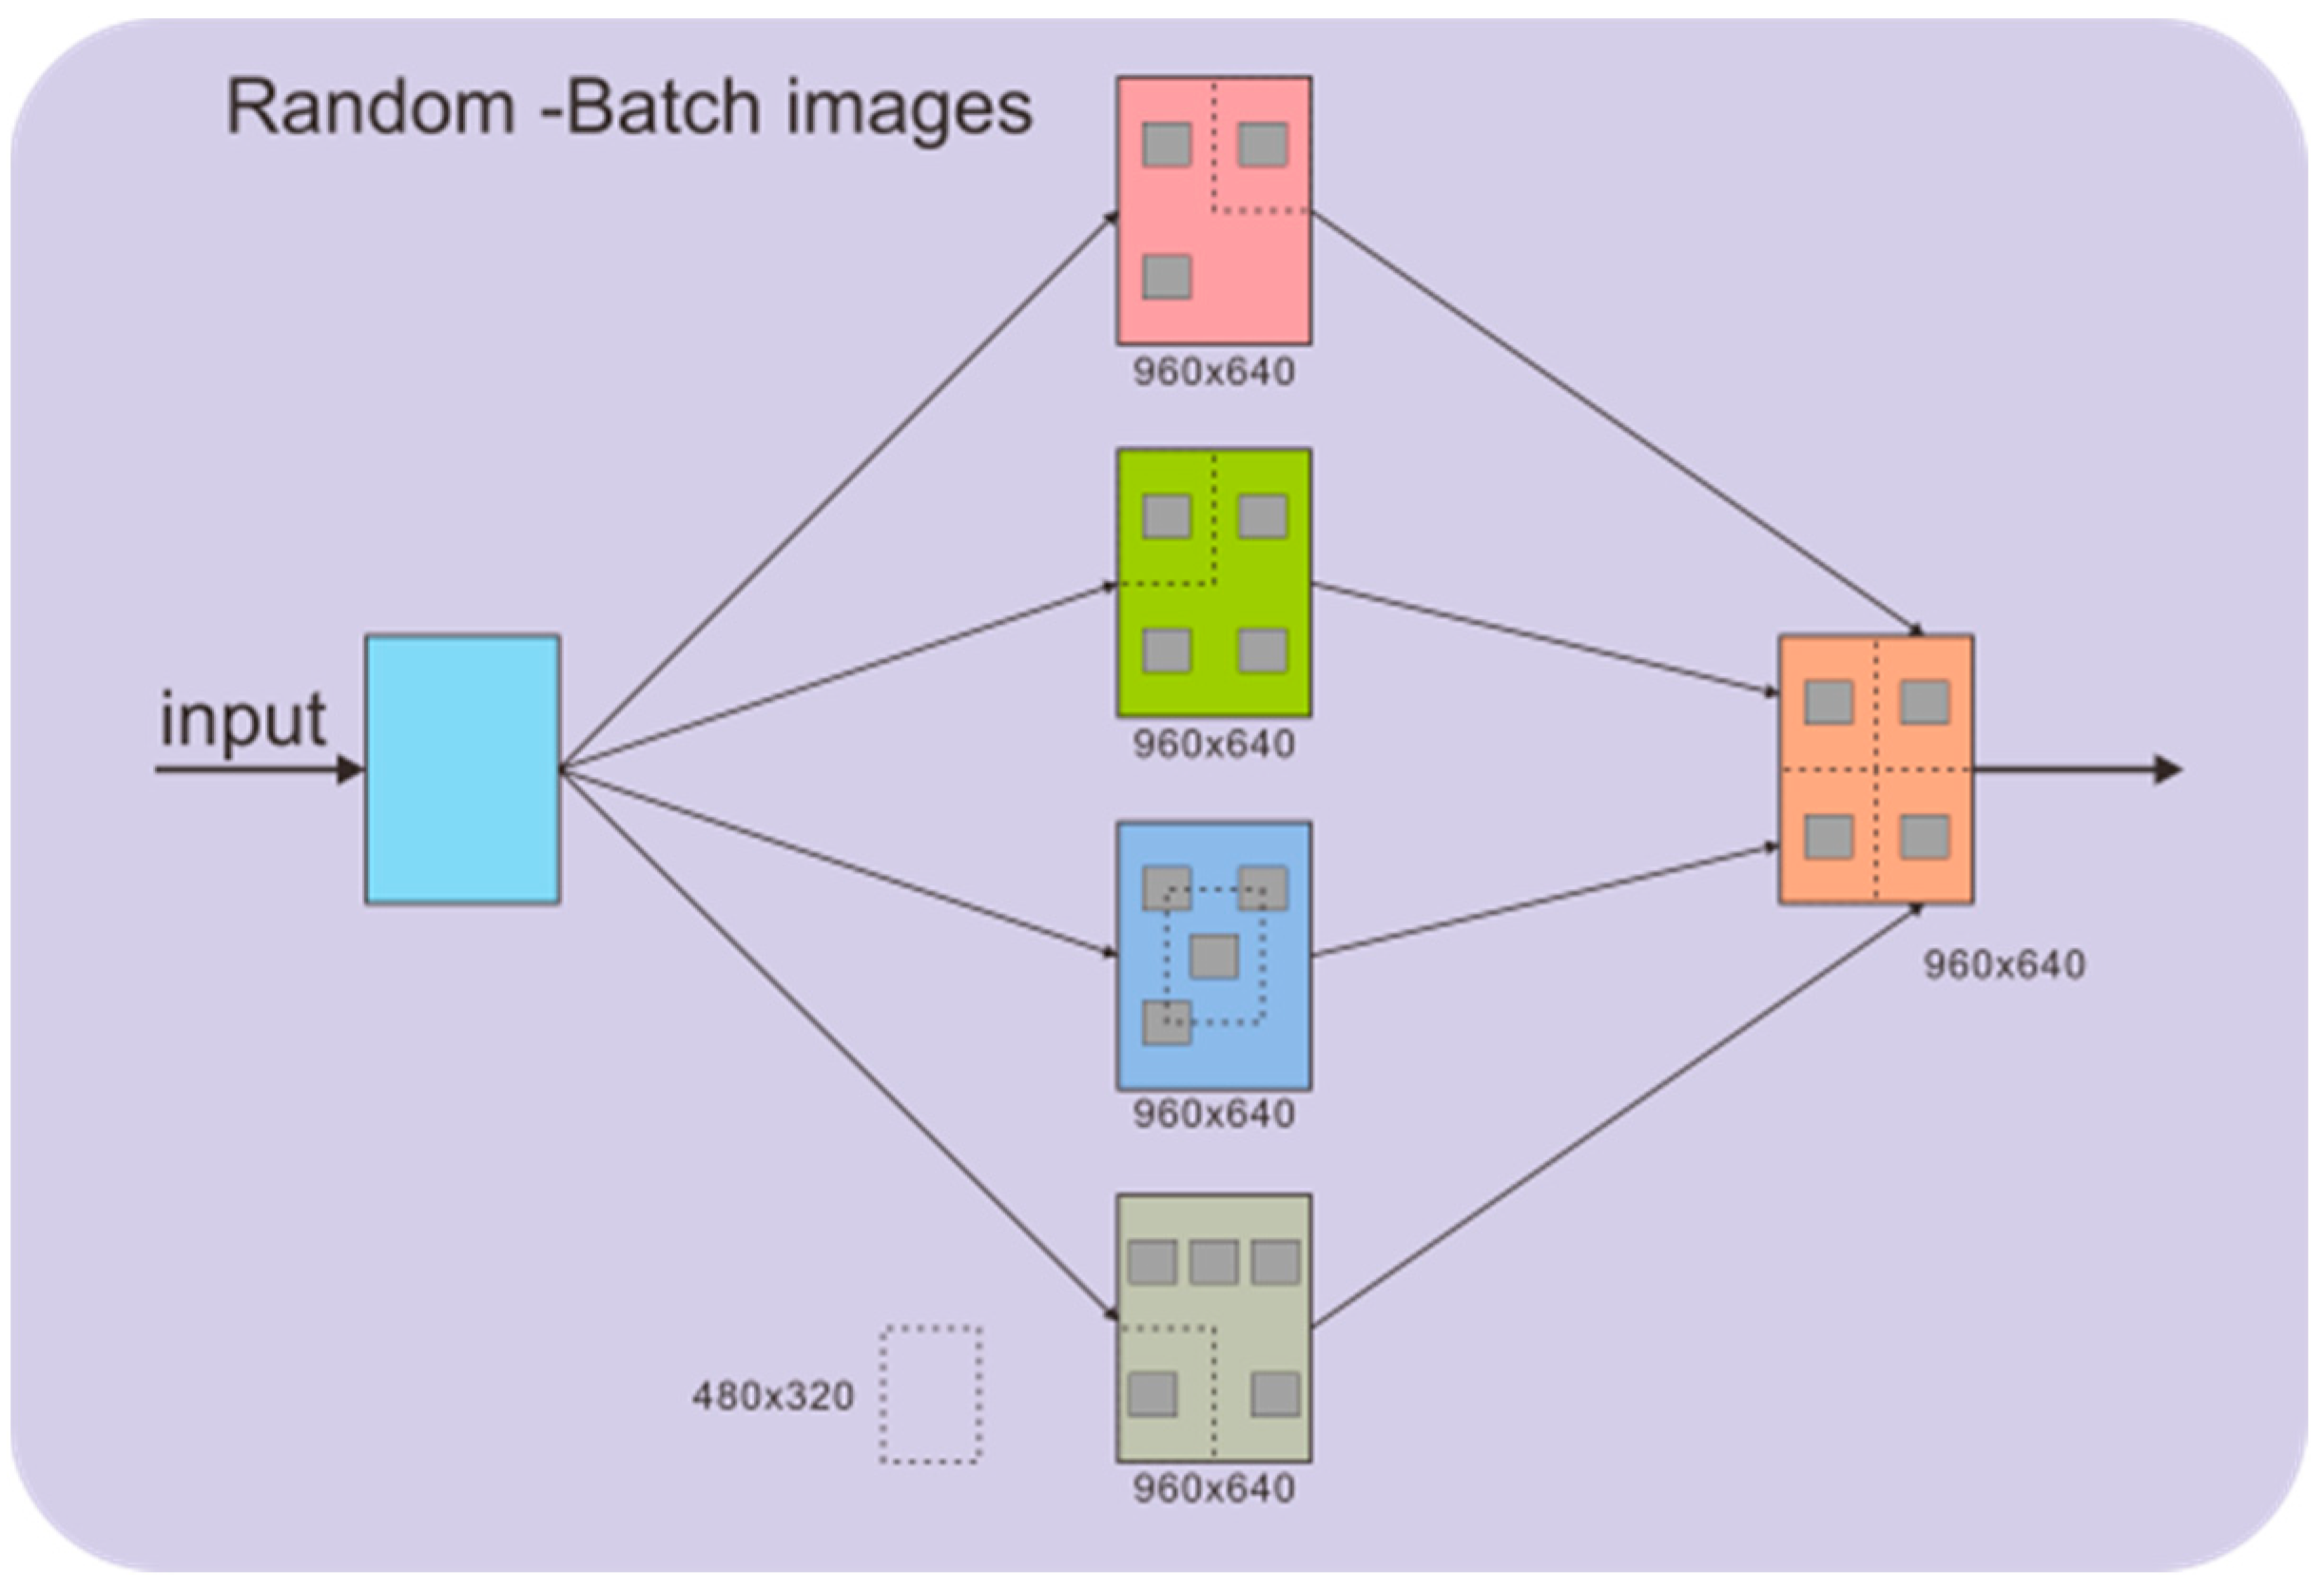
During the data preprocessing stage, the Random-Batch Images enhancement strategy was employed to expand the original dataset. For the original images with a size of 960 × 640, based on the distribution of corn row targets in the images, three different scale-cropping windows (480 × 320, 240 × 160, 120 × 80) were adaptively selected to randomly crop the original images, resulting in a series of sub-image blocks. Subsequently, the sub-image blocks of the same scale were randomly concatenated according to their original sizes to recombine them into an enhanced image of 960 × 640. In summary, the R-Mask R-CNN model constructed by the fusion of random and Mask R-CNN not only expanded the original dataset but also enhanced the recognition ability of the model [
21]. As an example, the implementation principle of Random-Batch Images for the 480 × 320 cropping scale is shown in
Figure 5.
Quantitative analysis shows that the Random-Batch strategy achieves a 5.3-fold equivalent sample expansion (from 950 original images to 5000 training samples) through three-level scale cropping (480 × 320, 240 × 160, and 120 × 80), covering multi-granularity features from global row structures to local textures. Ablation experiments (
Table 4) demonstrate that this data-level optimization alone contributes a 2.4 percentage point improvement in Segm mAP, with particularly significant enhancement in robustness under occlusion scenarios (leaf overlap, uneven illumination), validating the value of multi-scale data augmentation for adaptability in complex field environments.
2.4.2. Feature Extraction Network and Improvement in Convolution Method
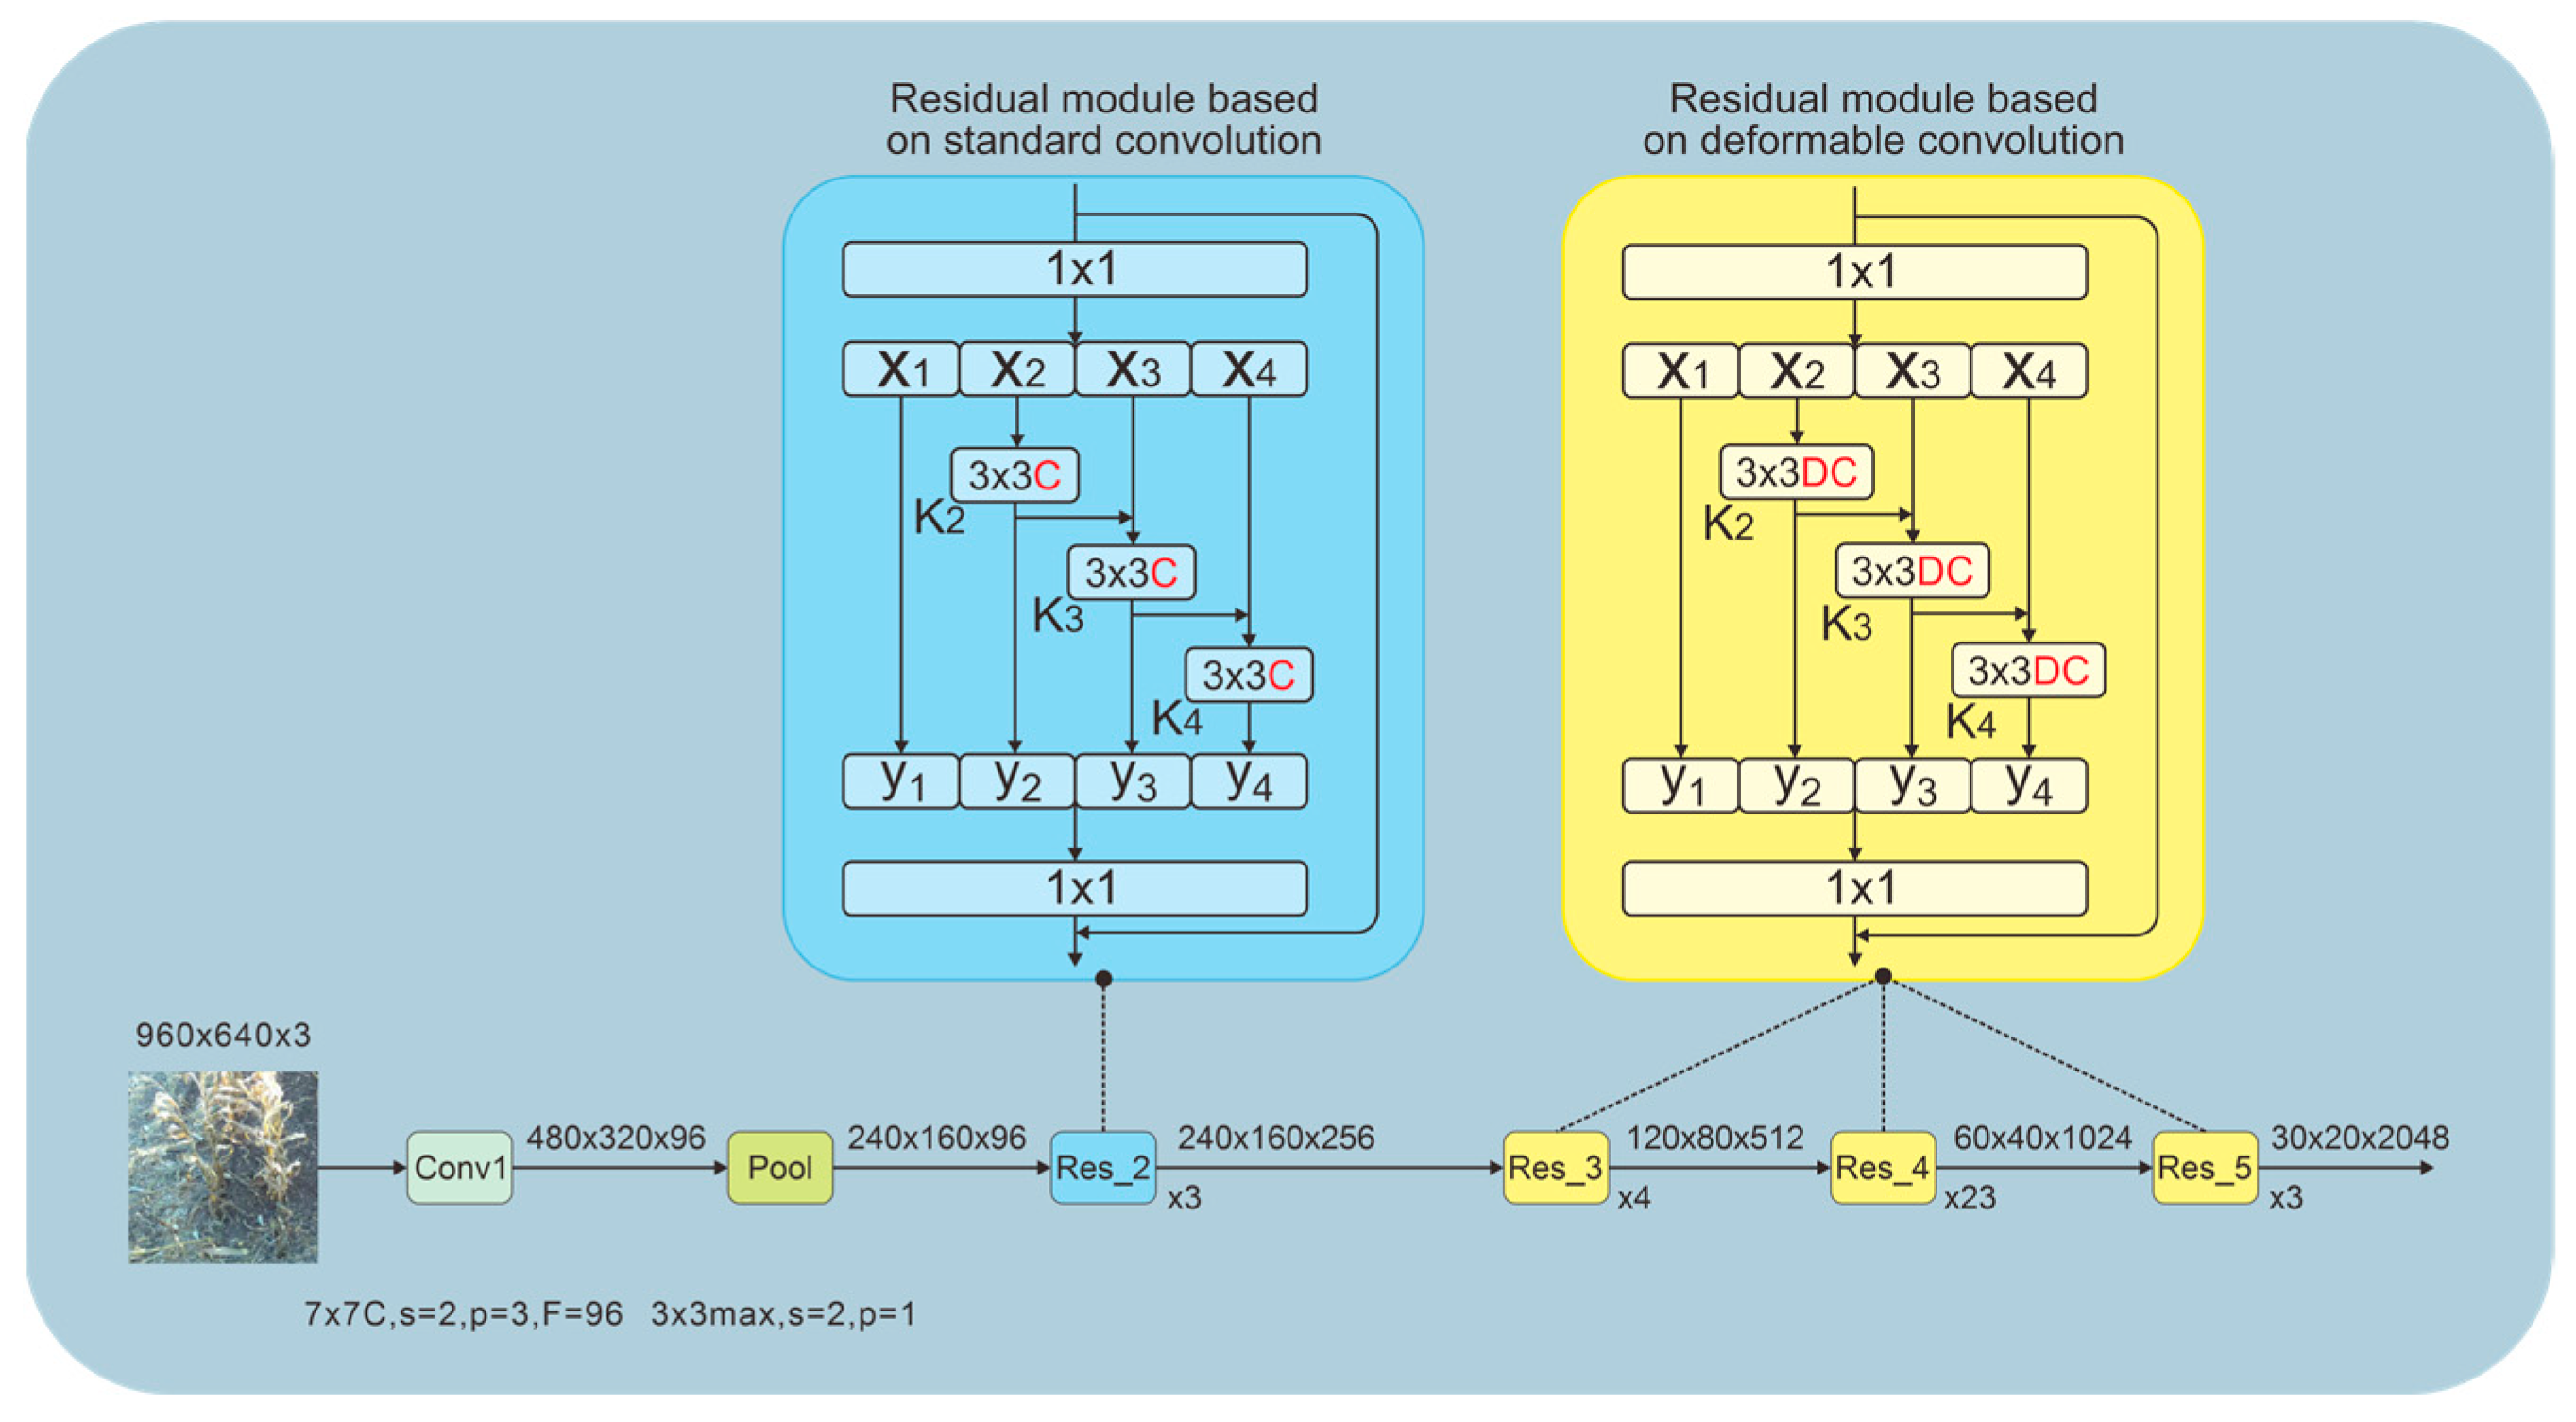
The original ResNet101 residual network of Mask R-CNN only supports the transmission of features of a single scale and is difficult to fully integrate multi-scale information. To address this issue, this study selects Res2Net101 as an alternative backbone network and integrates it with the R-Mask R-CNN model to form the R
2-Mask R-CNN model. Res2Net achieves this by designing a multi-level residual connection structure, dividing the convolution operation into multiple parallel branches and fusing the output of the previous branch in the subsequent branches, thereby gradually expanding the receptive field (such as 3 × 3, 5 × 5, 7 × 7) and enabling parallel transmission and cross-fusion of multi-scale features, effectively enhancing the richness and accuracy of feature extraction. Relevant research indicates that in the underwater target-detection task, the Faster RCNN model using Res2Net101 achieves an mAP@0.5 of 69.1%, which is superior to the 68.7% of the ResNet101 model, verifying the effectiveness of Res2Net in multi-scale feature extraction [
22]. Based on this, to further adapt to the variable posture and complex contours of corn rows, the 3 × 3 standard convolutions in the Res_3 to Res_5 layers of Res2Net101 are replaced with deformable convolutions (DCN), using the offset prediction network to dynamically adjust the sampling points of the convolution kernel, enabling the model to accurately capture the irregular shapes and spatial changes in the target. With the above improvements, the R
2DC-Mask R-CNN model is generated as shown in
Figure 6. Quantitative analysis shows that Res2Net achieves parallel receptive field coverage of 3 × 3, 5 × 5, and 7 × 7 (area expansion ratios of 1:2.8:5.4), increasing the feature retention rate for slender corn rows (aspect ratio > 15:1) by approximately 12% and contributing a 3.7 percentage point gain in mAP (
Table 4, R
2-Mask stage). On this basis, DCN further enables adaptive-sampling offsets (mean 1.6 ± 0.4 pixels) through its offset-prediction network, expanding the effective receptive field by 32% compared with standard convolution and achieving an activation rate of 38% in regions with plant inclination, contributing an additional 1.4 percentage point improvement (
Table 4, R
2DC-Mask stage). Together, these two components form a progressive optimization of “multi-scale foundation followed by geometric fine-tuning,” cumulatively improving Segm mAP from 77.3% to 82.4%.
2.4.3. Improvement in the Mask Network
The Mask branch is the core component of Mask R-CNN. It adds a mask-prediction branch in parallel on top of the bounding box-recognition branch, thereby achieving pixel-level segmentation of the target [
23]. However, the standard Mask branch treats all feature channels equally when processing complex field images, making it difficult to effectively highlight the key semantic information of the corn row targets in background noise (such as dead leaves, soil clumps, and shadows). To address this issue, a channel attention mechanism (channel attention) was introduced into the Mask branch of the R
2D-Mask R-CNN model, ultimately forming the R
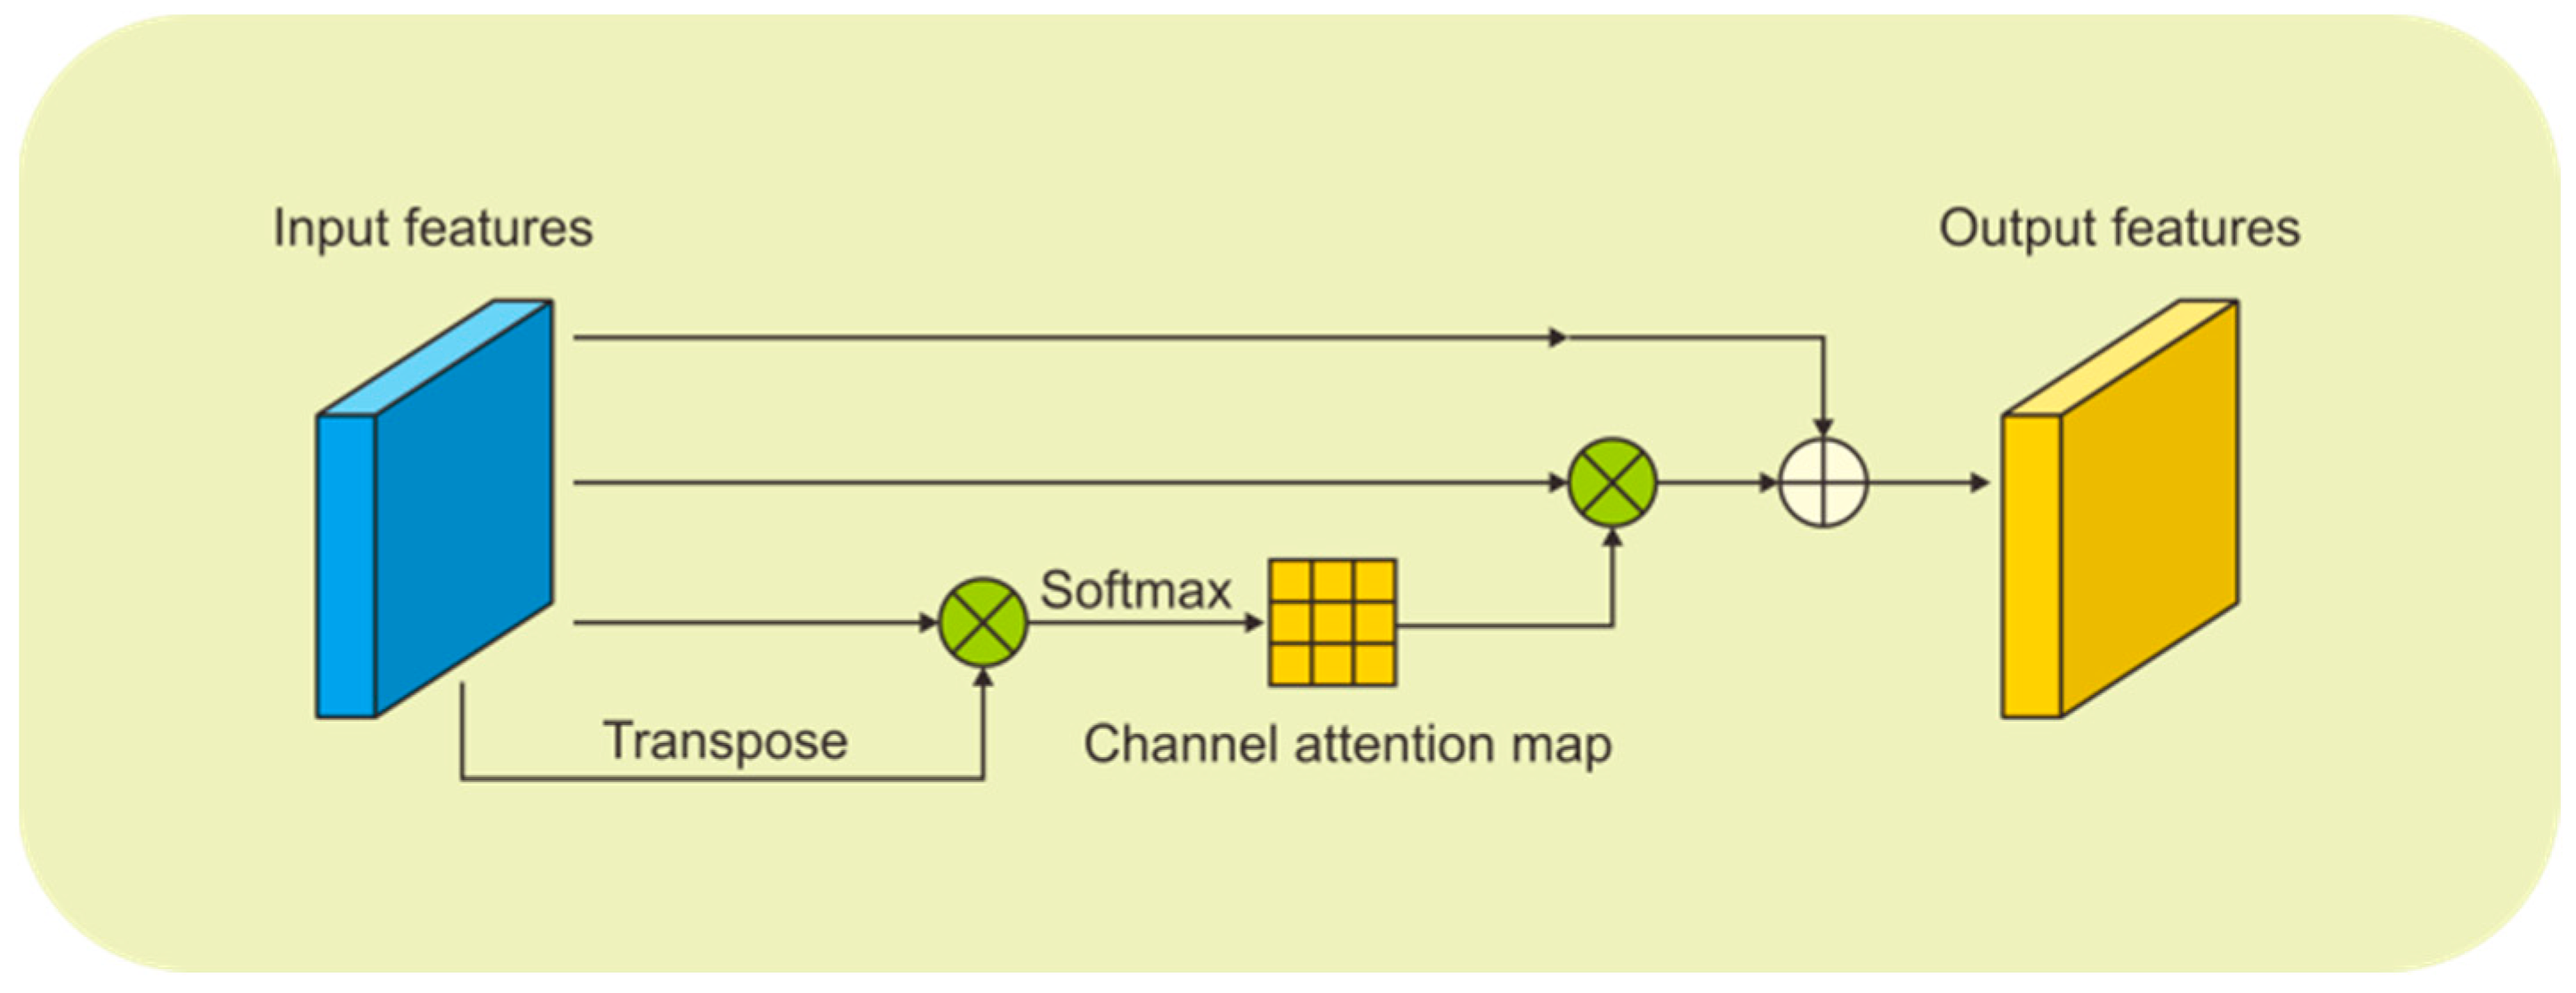
2DC-Mask R-CNN model. By adaptively weighting the feature channels, this mechanism enhances the feature responses related to the corn row and suppresses irrelevant background interference, thereby improving the recognition ability of blurry, slender, or partially obscured corn row targets. This is shown in
Figure 7. The input features are first passed through global average pooling and a transpose operation, after which a channel attention map is generated via the Softmax function. The green “×” symbol in the figure denotes element-wise channel-wise multiplication, where the attention weights are multiplied with the original input features to achieve feature recalibration. Subsequently, the weighted features are fused with the original input through a skip connection, producing the final enhanced output features. This mechanism adaptively learns the importance weights of each channel, effectively suppressing background noise and enhancing the response of corn row-related features.
Feature visualization analysis shows that the channel attention mechanism enhances the average response intensity of corn row-related feature channels by a factor of 2.1, while suppressing the weights of background noise (soil, residual leaves) channels by 68%. This adaptive recalibration mechanism ultimately contributes a 1.1 percentage point improvement in Segm mAP (
Table 4), increasing the overall model accuracy by 8.6 percentage points (from 74.9% to 83.5%) compared with the baseline Mask R-CNN, and significantly improving segmentation continuity in regions with ambiguous boundaries.
2.5. Morphological Optimization of Segmentation Results Based on Erosion and Dilation Operations
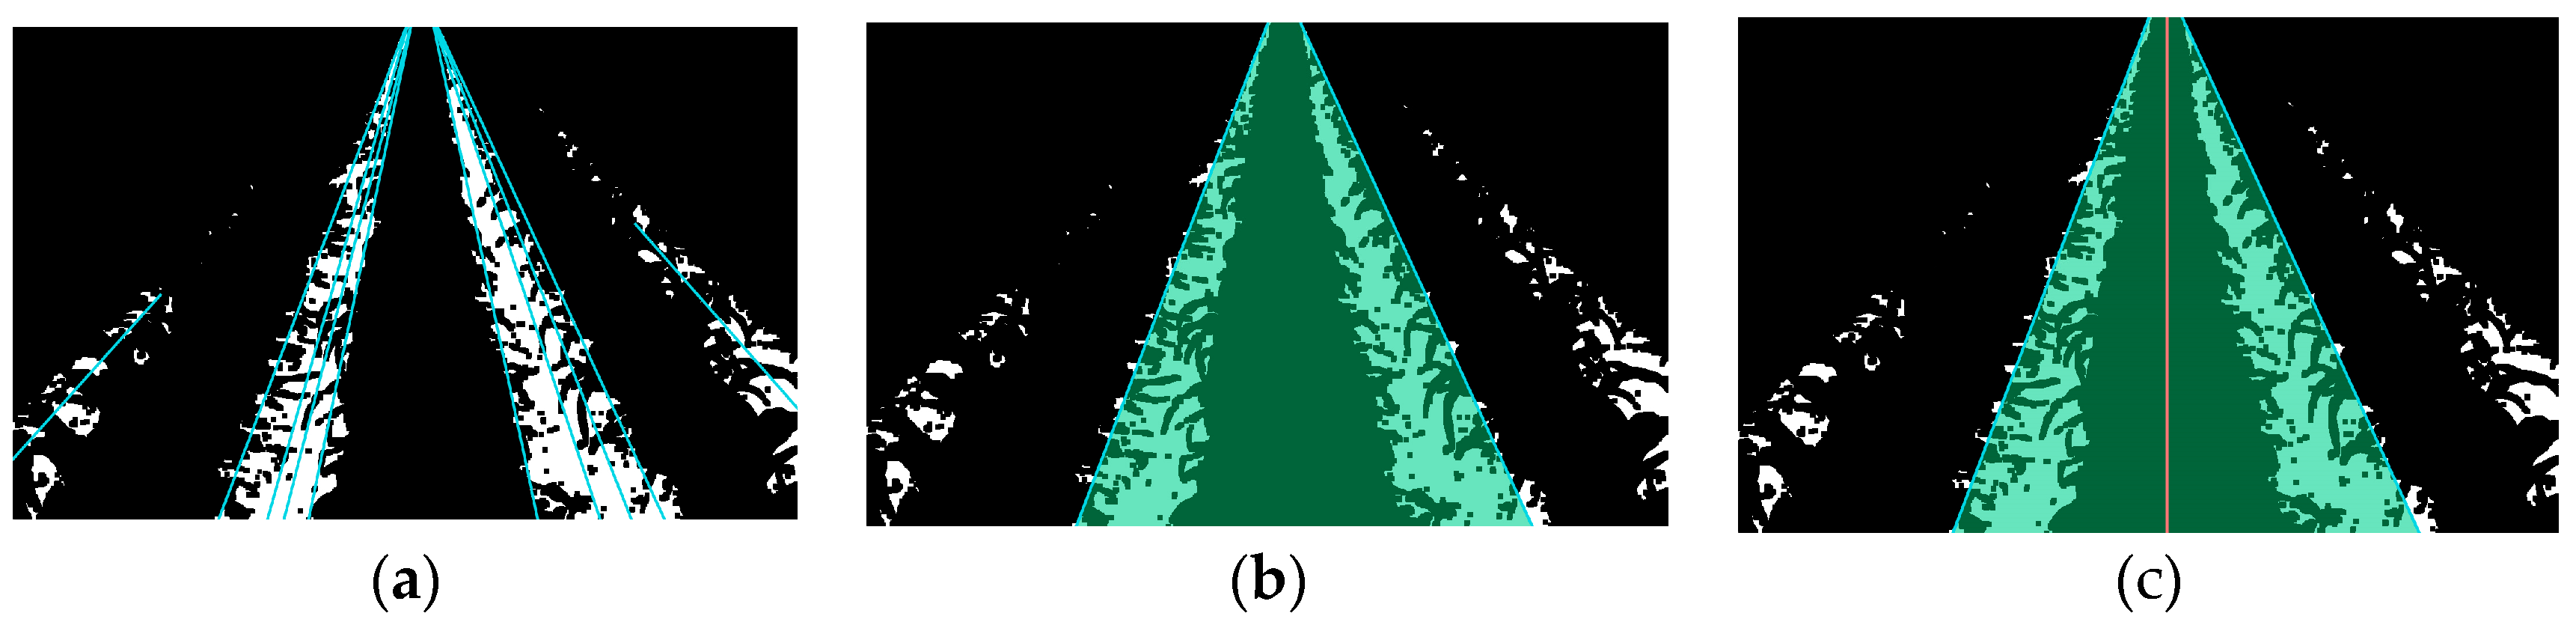
In the binary segmentation map of corn row output by R
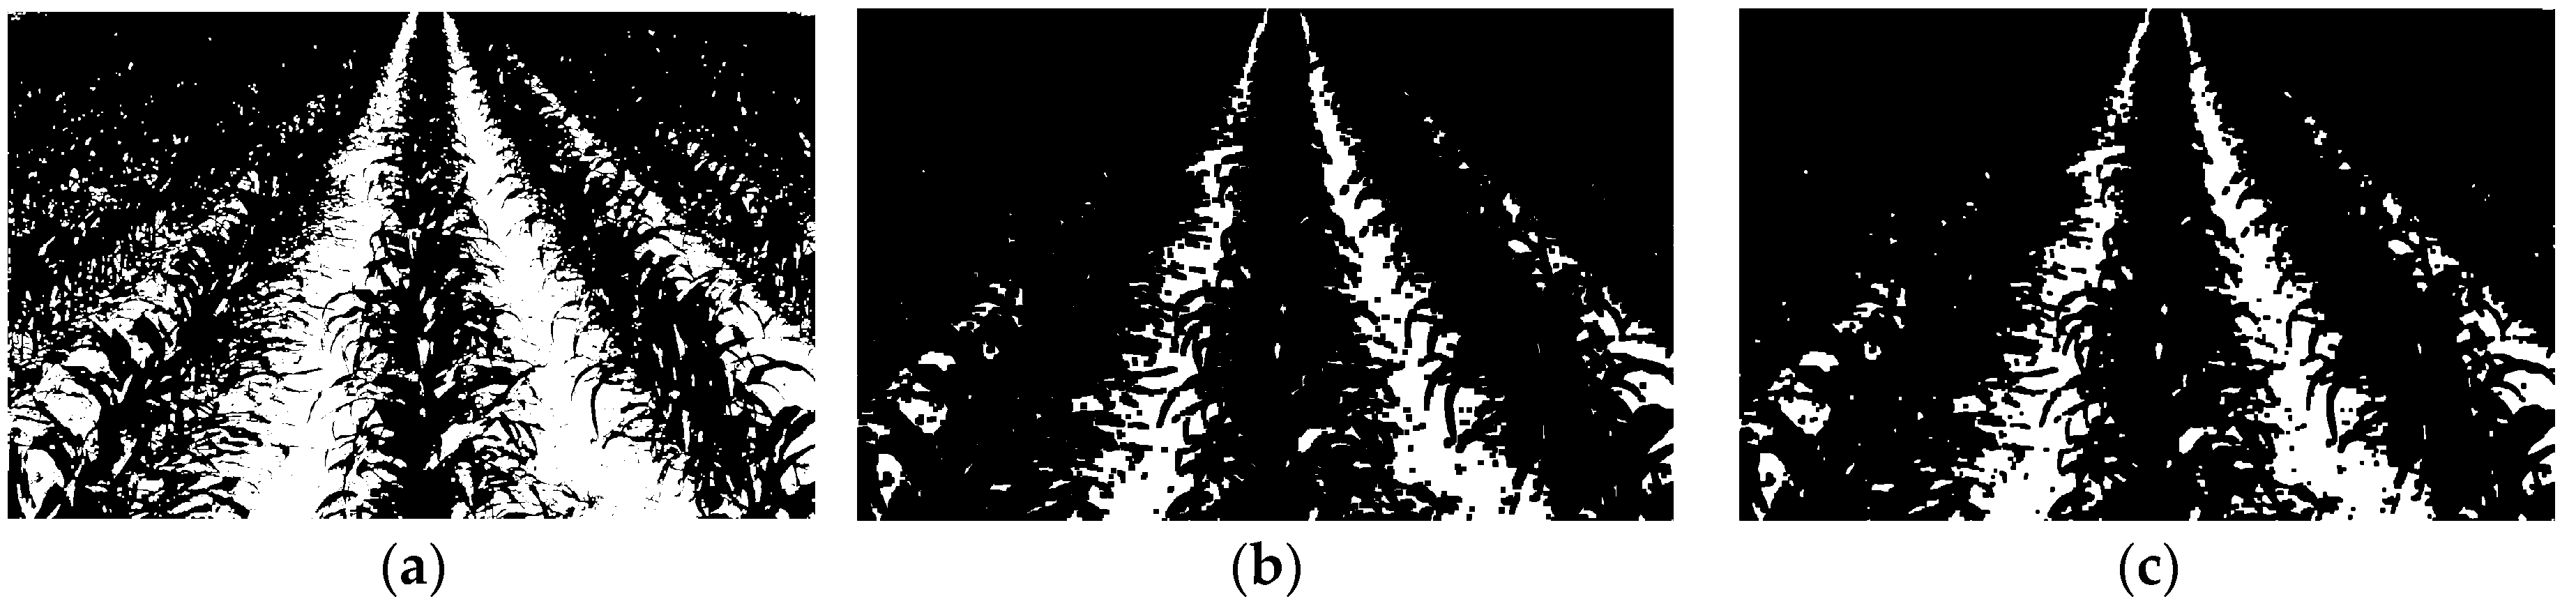
2DC-Mask R-CNN, there are generally fragmented leaf pixels (area < 10) and target area holes caused by missing plants and leaf overlap as shown in
Figure 8a. Such interference will lead to discontinuous segmentation masks and affect the accuracy of subsequent feature extraction. Therefore, a morphological opening operation combining erosion and dilation is introduced for preprocessing [
24,
25]. Firstly, a 3 × 3 structure element is used for erosion operation as shown in
Figure 8b, aiming to remove small-area discrete noises formed by fragmented leaves while ensuring that the main structure of the corn row only undergoes slight and controllable contraction; then, a 5 × 5 structure element is used for dilation operation as shown in
Figure 8c, and its larger neighborhood can effectively fill the significant holes caused by missing plants or occlusion, and restore the contours that were contracted in the erosion step, thereby generating a connected and complete row area.
2.6. Corn Row Selection Based on Connected Domain Analysis
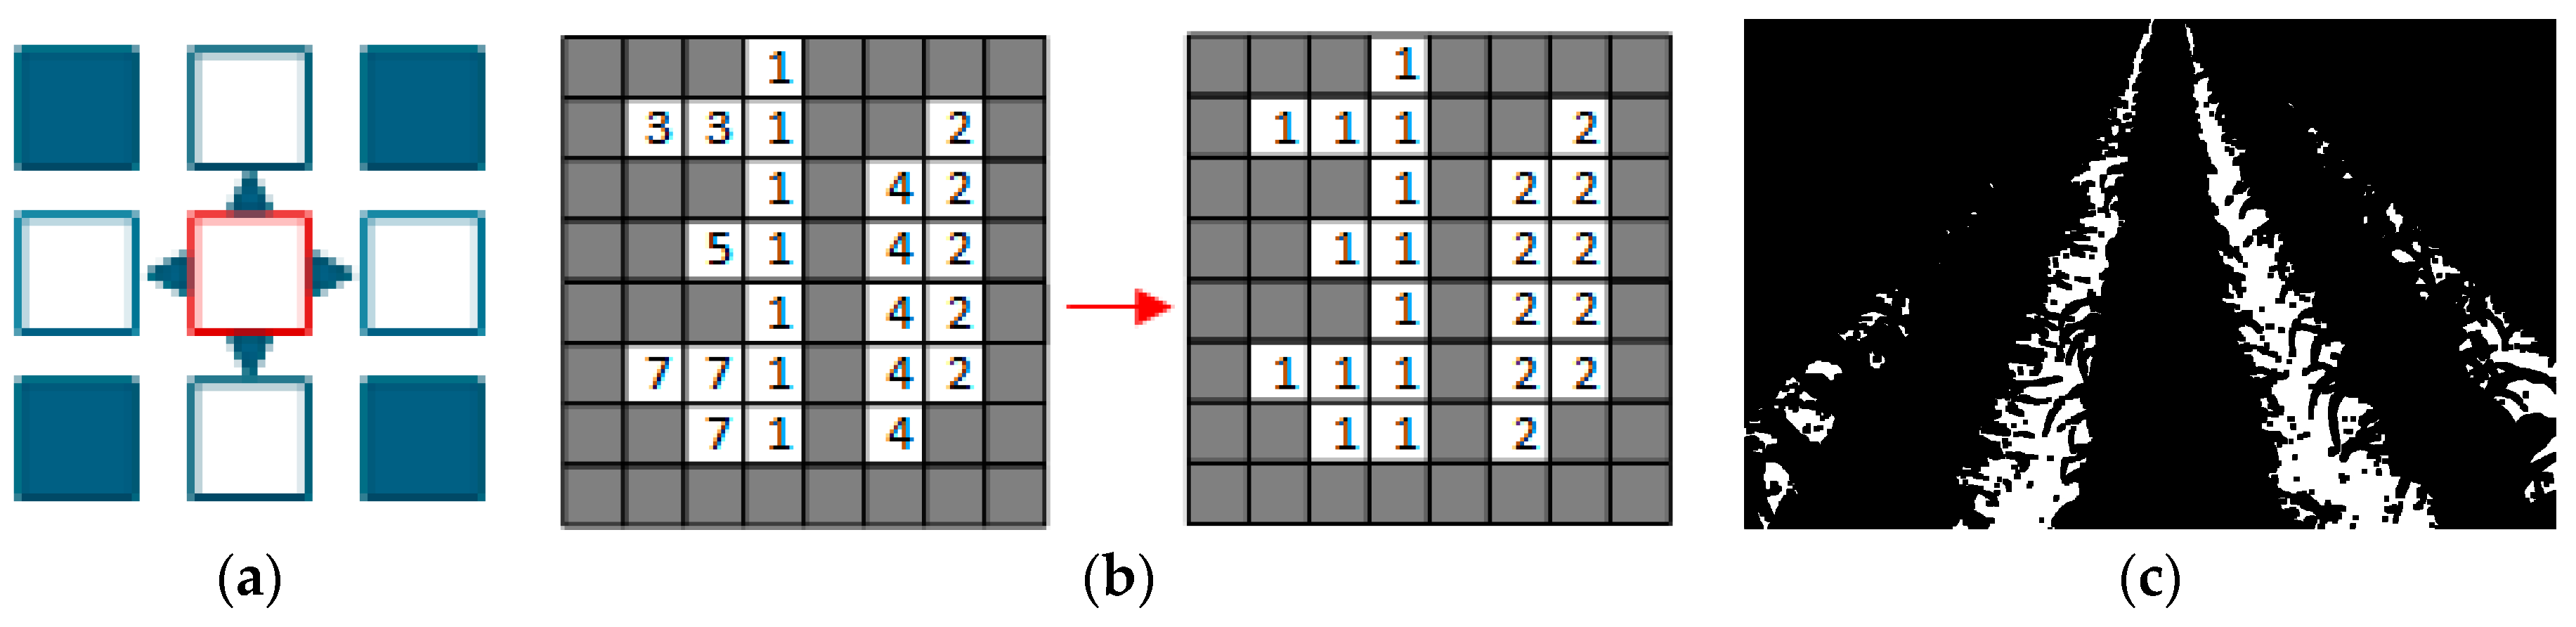
The connected domain analysis technique based on the 4-adjacency rule, as shown in
Figure 9a, is employed to precisely divide the regions and extract the targets from the preprocessed binary-segmented image of the corn rows [
26,
27,
28]. The core of this method is the Two-Pass (two-pass) marking algorithm as shown in
Figure 9b, which can efficiently identify and mark all connected pixel regions in the image, thereby effectively separating the continuous corn row bodies from discrete noise interference (such as remaining leaves, soil clumps). The algorithm first performs a top–down, left-to-right initial traversal scan, assigning temporary marks to the current pixel based on its connection with the upper and left neighboring pixels; then, it conducts a second scan to resolve the equivalence relationships of the marks, merging different marks belonging to the same connected region, ensuring that each independent corn row region obtains a globally unique identifier. Through this process, all continuous corn row pixels in the image are accurately aggregated into several independent connected domains. By setting geometric thresholds such as area and aspect ratio, the interference regions with a too-small area or inconsistent shape can be filtered out, thereby selecting the target connected domain-processing results as shown in
Figure 9c, which correspond to the real corn rows.
2.7. Corn Row Navigation Centerline Fitting Based on Hough Transform
After the initial morphological optimization algorithm is completed, the probability Hough line transformation is used to achieve the precise fitting of the navigation centerline of the corn row. First, the binary skeleton graph
Iskeleton obtained by Zhang-Suen refinement is used as the input [
29,
30], and the set of foreground pixel coordinates is extracted as shown in Equation (1), where (x
i, y
i) represents the pixel coordinates of the skeleton points and N is the total number of skeleton pixels. These coordinates serve as the input for subsequent Hough transform parameter space mapping.
To avoid the problem of infinite slope of the vertical line in the Cartesian coordinate system, the straight line in the image space is described in polar coordinate form, and its core equation is Equation (2):
Among them,
x,
y represents the pixel coordinates of the skeleton,
ρ is the vertical distance from the coordinate origin to the line, with a value range of [−1098, 1098] pixels, and
θ is the angle between the normal line of the line and the positive direction of the x-axis, with a value range of [0, π). The processing is shown in
Figure 10a.
The probability Hough transform is used to randomly sample 50% of the skeleton pixels for parameter space mapping [
31,
32,
33]. Effective lines are selected through the cumulative voting mechanism. The voting criterion is as follows: Equation (3):
Among them,
V(
ρk,
θk) represents the cumulative voting count of the grid cell in the parameter space, and
Tvote = 30 is the empirical voting threshold. At the same time, the minimum length of the straight line
Lmin is set to 50 pixels, and the maximum gap
Gmax is set to 10 pixels. The algorithm-processing results of eliminating false straight lines and broken line segments are shown in
Figure 10b. To obtain the complete centerline of the corn row, the polar coordinate straight line is converted to the slope-intercept form y = kx + b in the Cartesian coordinate system, where Equation (4)
Based on the prior knowledge of the corn rows, the fusion conditions were set as follows: |k1 − k2| ≤ 0.05 and |b1 − b2| ≤ 20 pixels. For the segmented straight lines that met these conditions, the least squares method was used to fit and obtain the complete navigation centerline as shown in Equation (5):
The test results show that the corn rows are approximately horizontal (θ ∈ [−15°, 15°]), the row spacing is 50 to 80 pixels, and the effective length is not less than 200 pixels. This ensures the robustness of the algorithm in complex field scenarios.
2.8. Improved MCC-KF Kalman Filtering Algorithm
In the time series estimation of the navigation centerline of the corn row, the Kalman filter is widely adopted due to its recursive structure and computational efficiency [
34,
35,
36]. However, the standard Kalman filter is based on the minimum mean square error criterion and implicitly assumes that both process noise and observation noise follow a Gaussian distribution. This assumption is often difficult to hold in complex field environments, such as sudden changes in light, instantaneous leaf shading, and mechanical vibrations, etc., which can lead to non-Gaussian noise or outliers in the observed values, significantly reducing the estimation accuracy of the standard Kalman filter. To address these issues, this paper introduces the maximum correntropy criterion (MCC) and constructs the Maximum Correntropy Kalman Filter (MCC-KF) [
37]. This method adaptively suppresses the influence of abnormal observed values through a kernel function, while maintaining the basic framework of the Kalman filter, significantly enhancing the robustness of the system in non-Gaussian noise environments.
2.8.1. State Space Model
Standard Kalman filter assumes Gaussian noise and minimizes mean square error (MSE), which becomes unreliable when field disturbances (sudden illumination changes, occlusions, vibrations) introduce non-Gaussian outliers. MCC-KF replaces MSE with maximum correntropy criterion using a Gaussian kernel to adaptively weight residuals; large errors are exponentially suppressed rather than squared and amplified. This transforms the optimization from error minimization to similarity maximization, achieving theoretical robustness in non-Gaussian environments without sacrificing Gaussian-case optimality.
The state vector X
K at time K is defined as the core geometric parameters of the navigation line and their rate of change is as per Formula (6):
Among them, ∆k represents the lateral deviation, βk represents the heading deflection angle, and both have their respective rate of change.
Assuming that the distance between adjacent frames (time interval ∆
t) is at a constant speed, the state prediction equation is as shown in Formula (7):
Among them, F represents the state transition matrix, P is the state estimation error covariance matrix, and Q is the process noise covariance matrix, which is used to model the uncertainties not included in the model such as speed changes caused by ground bumps.
The observation vector Z
k is directly obtained from the algorithm-fitting results of each frame image, and it includes the lateral deviation ∆
kobs and the heading angle
βkobs as per Formula (8):
2.8.2. The Maximum Correlation Entropy Criterion and Its Fusion in Kalman Filtering
Maximal relevant entropy is a similarity measure based on information theory learning. For the error variable e, its Gaussian kernel form is defined by Formula (9):
This function has a clear statistical significance: when the estimated residual e approaches zero, the value of the kernel function is close to 1; when the residual increases significantly, the value of the kernel function decays exponentially. This characteristic makes the maximum correlation entropy have good robustness against abnormal observations and can effectively suppress the interference of abnormal values on the estimation results. Introducing the maximum correlation entropy criterion into the Kalman filtering framework essentially replaces the traditional minimization of mean square error objective with the maximization of correlation entropy objective. From the perspective of Bayesian estimation, this problem can be equivalently regarded as a weighted least squares problem, and the weight coefficients are determined dynamically by the kernel function based on the current residual. Using the fixed-point iteration theory for solution, the update equation of MCC-KF can be derived as Formula (10). In this equation group,
represents the innovation (residual) between actual observation
and predicted observation; Λ
k is the diagonal weight matrix constructed by the Gaussian kernel function G
σ, which dynamically adjusts weights according to the residual magnitude;
is the modified observation noise covariance;
is the MCC-KF gain matrix; and
is the final state estimate.
From the above derivation, it can be seen that MCC-KF dynamically builds the weight matrix based on the Gaussian kernel function using the new information: when there are outliers in the observations, the new information increases, and the corresponding weights automatically decrease, thereby effectively suppressing the influence of outliers on the state update. When the kernel width tends to infinity, the weight matrix approaches the identity matrix, and MCC-KF degenerates into standard Kalman filtering, which is a special case of standard Kalman filtering. This algorithm’s single-frame processing time is only approximately 0.5 ms more than that of standard KF, meeting the real-time requirements [
38]. When the kernel width
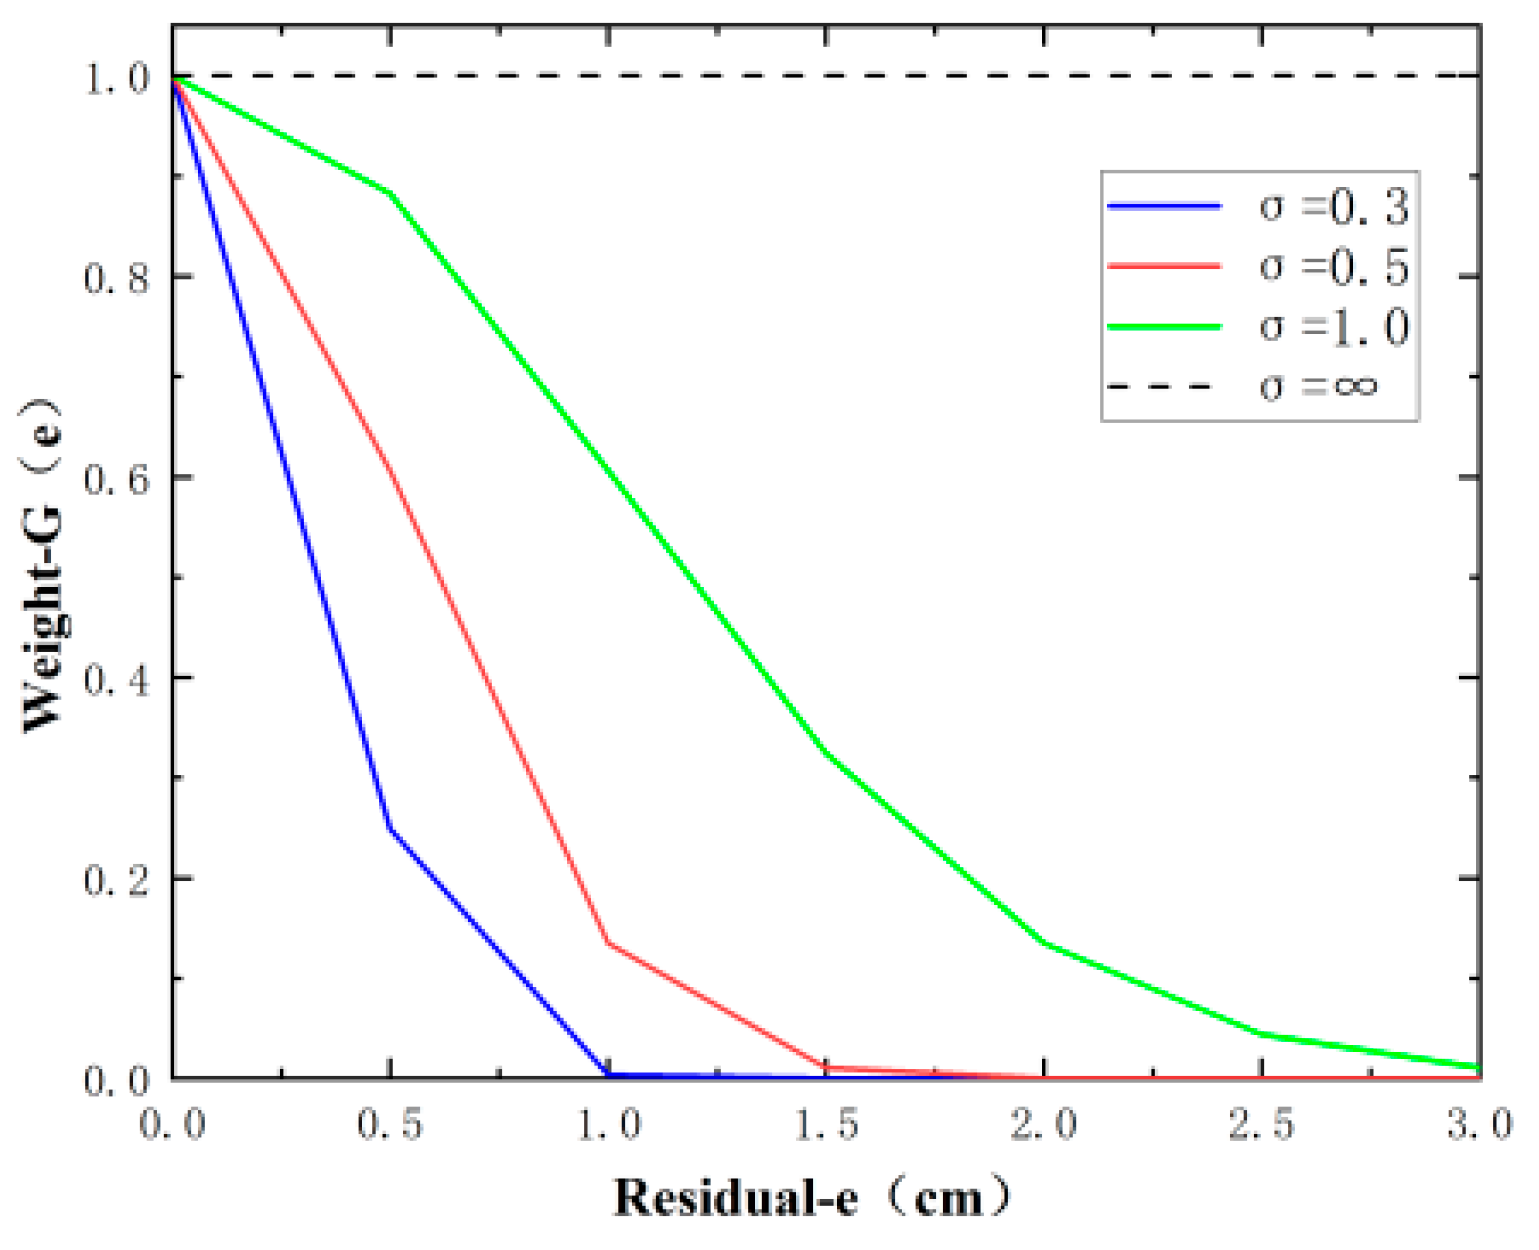
σ is set to 0.5, it can suppress outliers while maintaining normal estimation accuracy. To intuitively illustrate the suppression mechanism of MCC-KF for abnormal observations,
Figure 11 shows the Gaussian kernel function curves under different kernel widths
σ. It can be seen that when the residual e increases, the kernel function value decays exponentially, and the smaller the
σ, the faster the decay. In this system, when
σ = 0.5, the weight has dropped to 0.14 when the residual reaches 2 cm, effectively suppressing the influence of abnormal observations on the state update. When
σ→∞, the kernel function degenerates into a constant 1, MCC-KF degenerates into standard Kalman filtering, and the final navigation line output effect is shown in
Figure 10c. This value was determined through preliminary calibration over the range of 0.3–1.0. When
σ < 0.5, the weight decays too rapidly for normal observations, resulting in overly conservative filtering; when
σ > 1.0, the suppression of abnormal observations becomes insufficient. Given that this paper focuses on validating the effectiveness of the algorithm under typical harvesting conditions (0.5–5.0 km/h, sunny/cloudy skies), a systematic sensitivity analysis of the
σ parameter with respect to different operating speeds and lighting conditions has not been conducted. Adaptive optimization of this parameter under extreme conditions (e.g., high-speed bumpy operation, abrupt changes in strong light and shadows) is left for future study.
2.9. Camera FOV Analysis and Determination of Effective Guidance Distance
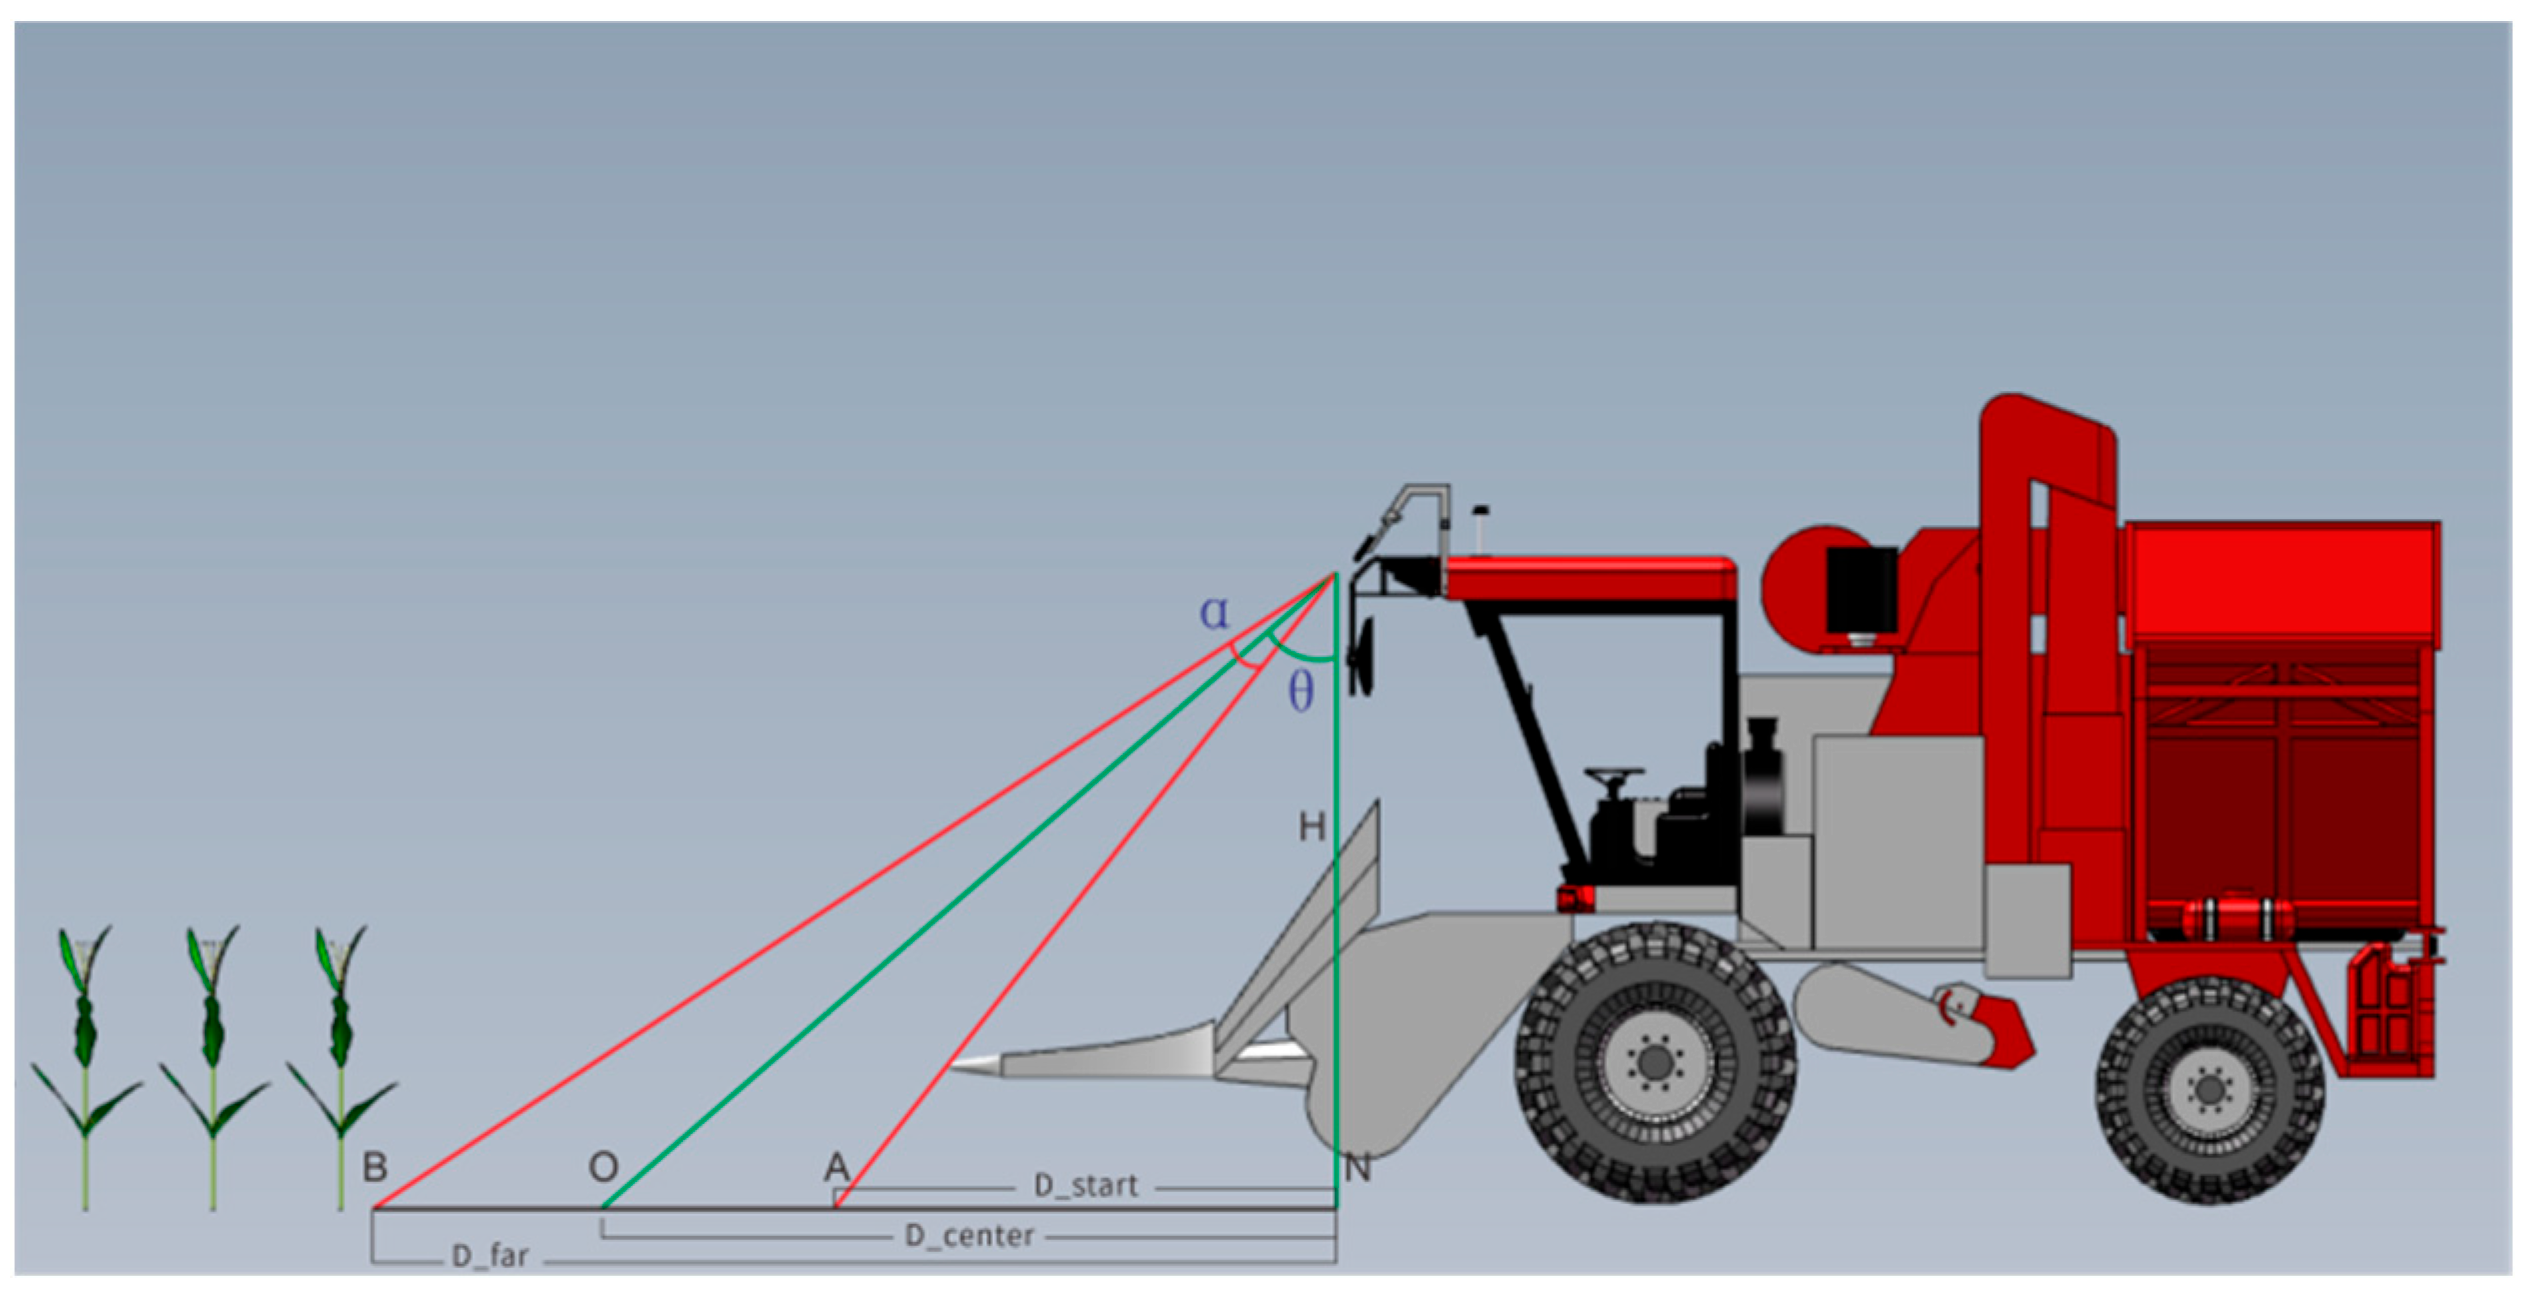
To determine the effective working range of the visual assistance system geometrically, it is necessary to model the installation position of the camera and the field of view coverage, as shown in
Figure 12. Let the vertical installation height of the camera’s optical center from the ground be H, the angle between its optical axis direction and the horizontal plane be
θ, and the vertical field of view angle be α. According to the geometric relationship, the following key distance parameters can be defined: D
center is the horizontal distance from the intersection point of the camera’s field of view centerline and the ground to the ground projection point directly below the camera, which corresponds to the ground projection position of the image center and is an ideal reference point for precise alignment of the system; D
start is the horizontal distance from the intersection point of the camera’s field of view lower boundary and the ground to the ground projection point directly below the camera, which is the theoretical closest point where the system can start detecting the crop rows; D
far is the horizontal distance from the intersection point of the camera’s field of view upper boundary and the ground to the ground projection point directly below the camera, which is the theoretical farthest point where the system can detect the crop rows. Crop rows beyond this distance have too few pixels in the image to be reliably identified. The above parameters are calculated by the following formulas:
In actual operation, the theoretical minimum distance D
start needs to be compared with the safety decision distance S calculated based on the system delay. Let the maximum system delay be T
delay (including image acquisition, algorithm processing, and communication transmission), the maximum operation speed be v
max, and the safety decision distance be
S. To ensure the smoothness and safety of the operation, the larger value between the two is taken as the final effective guiding starting distance D
effective, and its expression is as follows:
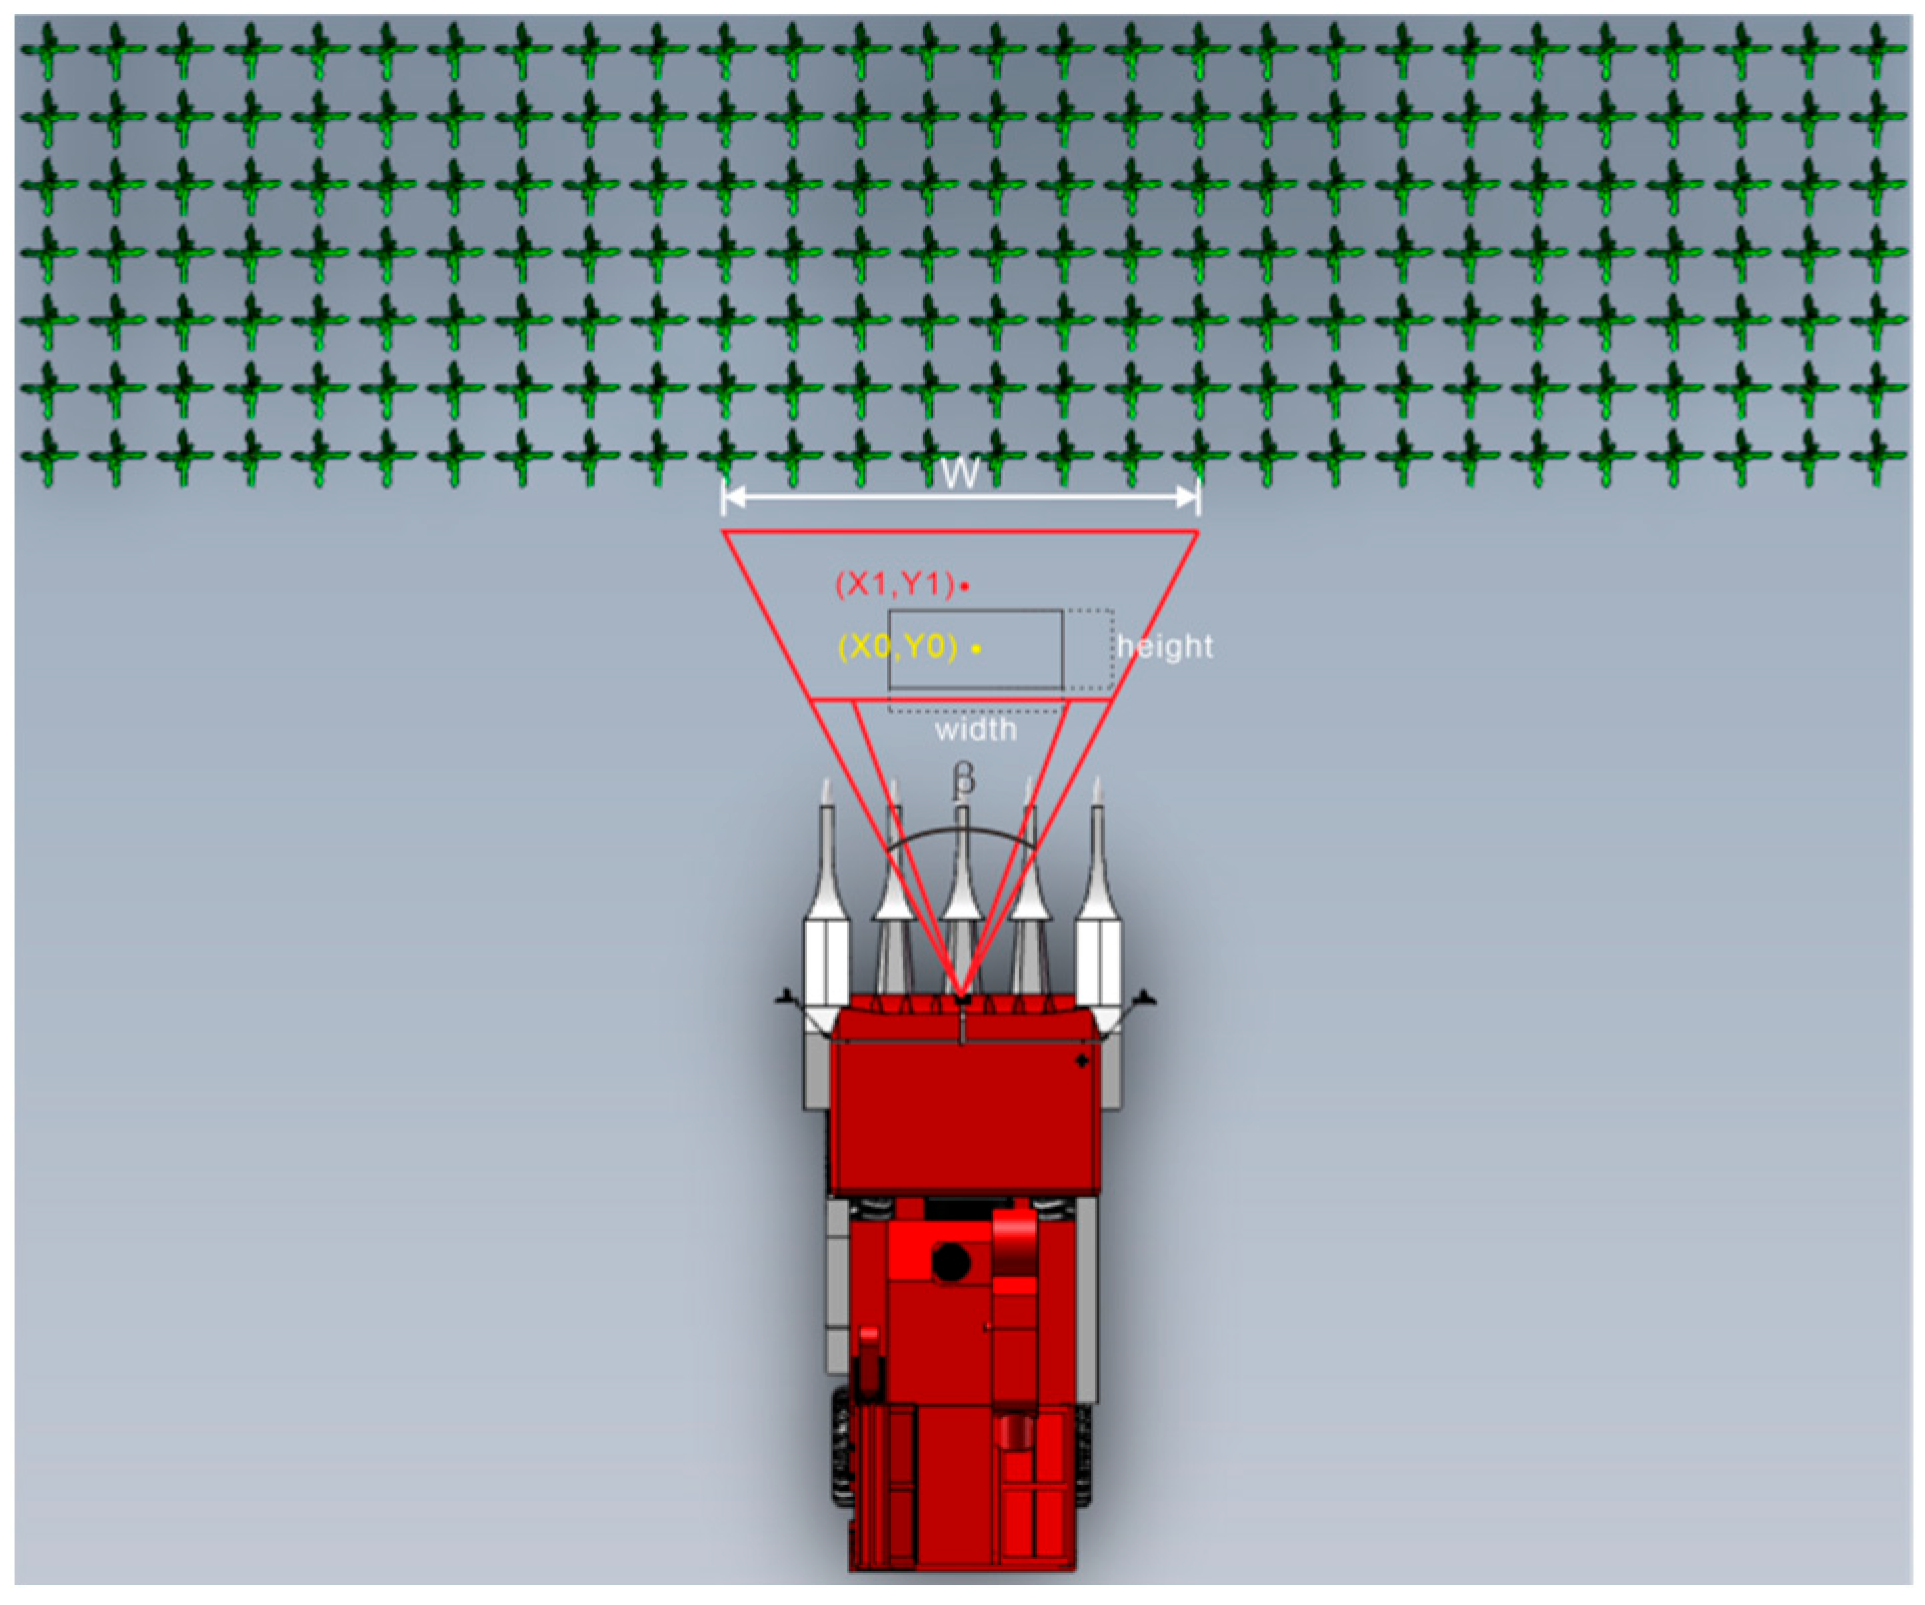
After obtaining the navigation centerline line, the system converts the image coordinates of the guidance marker points on the display screen into the actual positions in the ground coordinate system in front of the vehicle, thereby providing the driver with intuitive spatial-position guidance. As shown in
Figure 13, the preset parameters of the system include the maximum field-of-view distance W, the horizontal field-of-view angle
β, as well as the image pixel height and pixel width. The pixel coordinates of the guidance marker point in the image are (x
0, y
0), and its corresponding actual ground coordinates (x
1, y
1) are calculated by the following formula:
The determined geometric parameters of the camera’s effective field of view, including the effective starting distance Deffective and the farthest detection distance Dfar, provide a crucial visual-perception range constraint for the subsequent multi-source data gateway’s decision-making: when the vehicle is within the visual effective guidance area, the gateway prioritizes the fusion of the visual navigation line; when vision fails or exceeds the effective range, the gateway, based on these geometric constraints and the vehicle’s kinematic information, initiates the compensation mode to ensure the continuity and reliability of the guidance instructions.
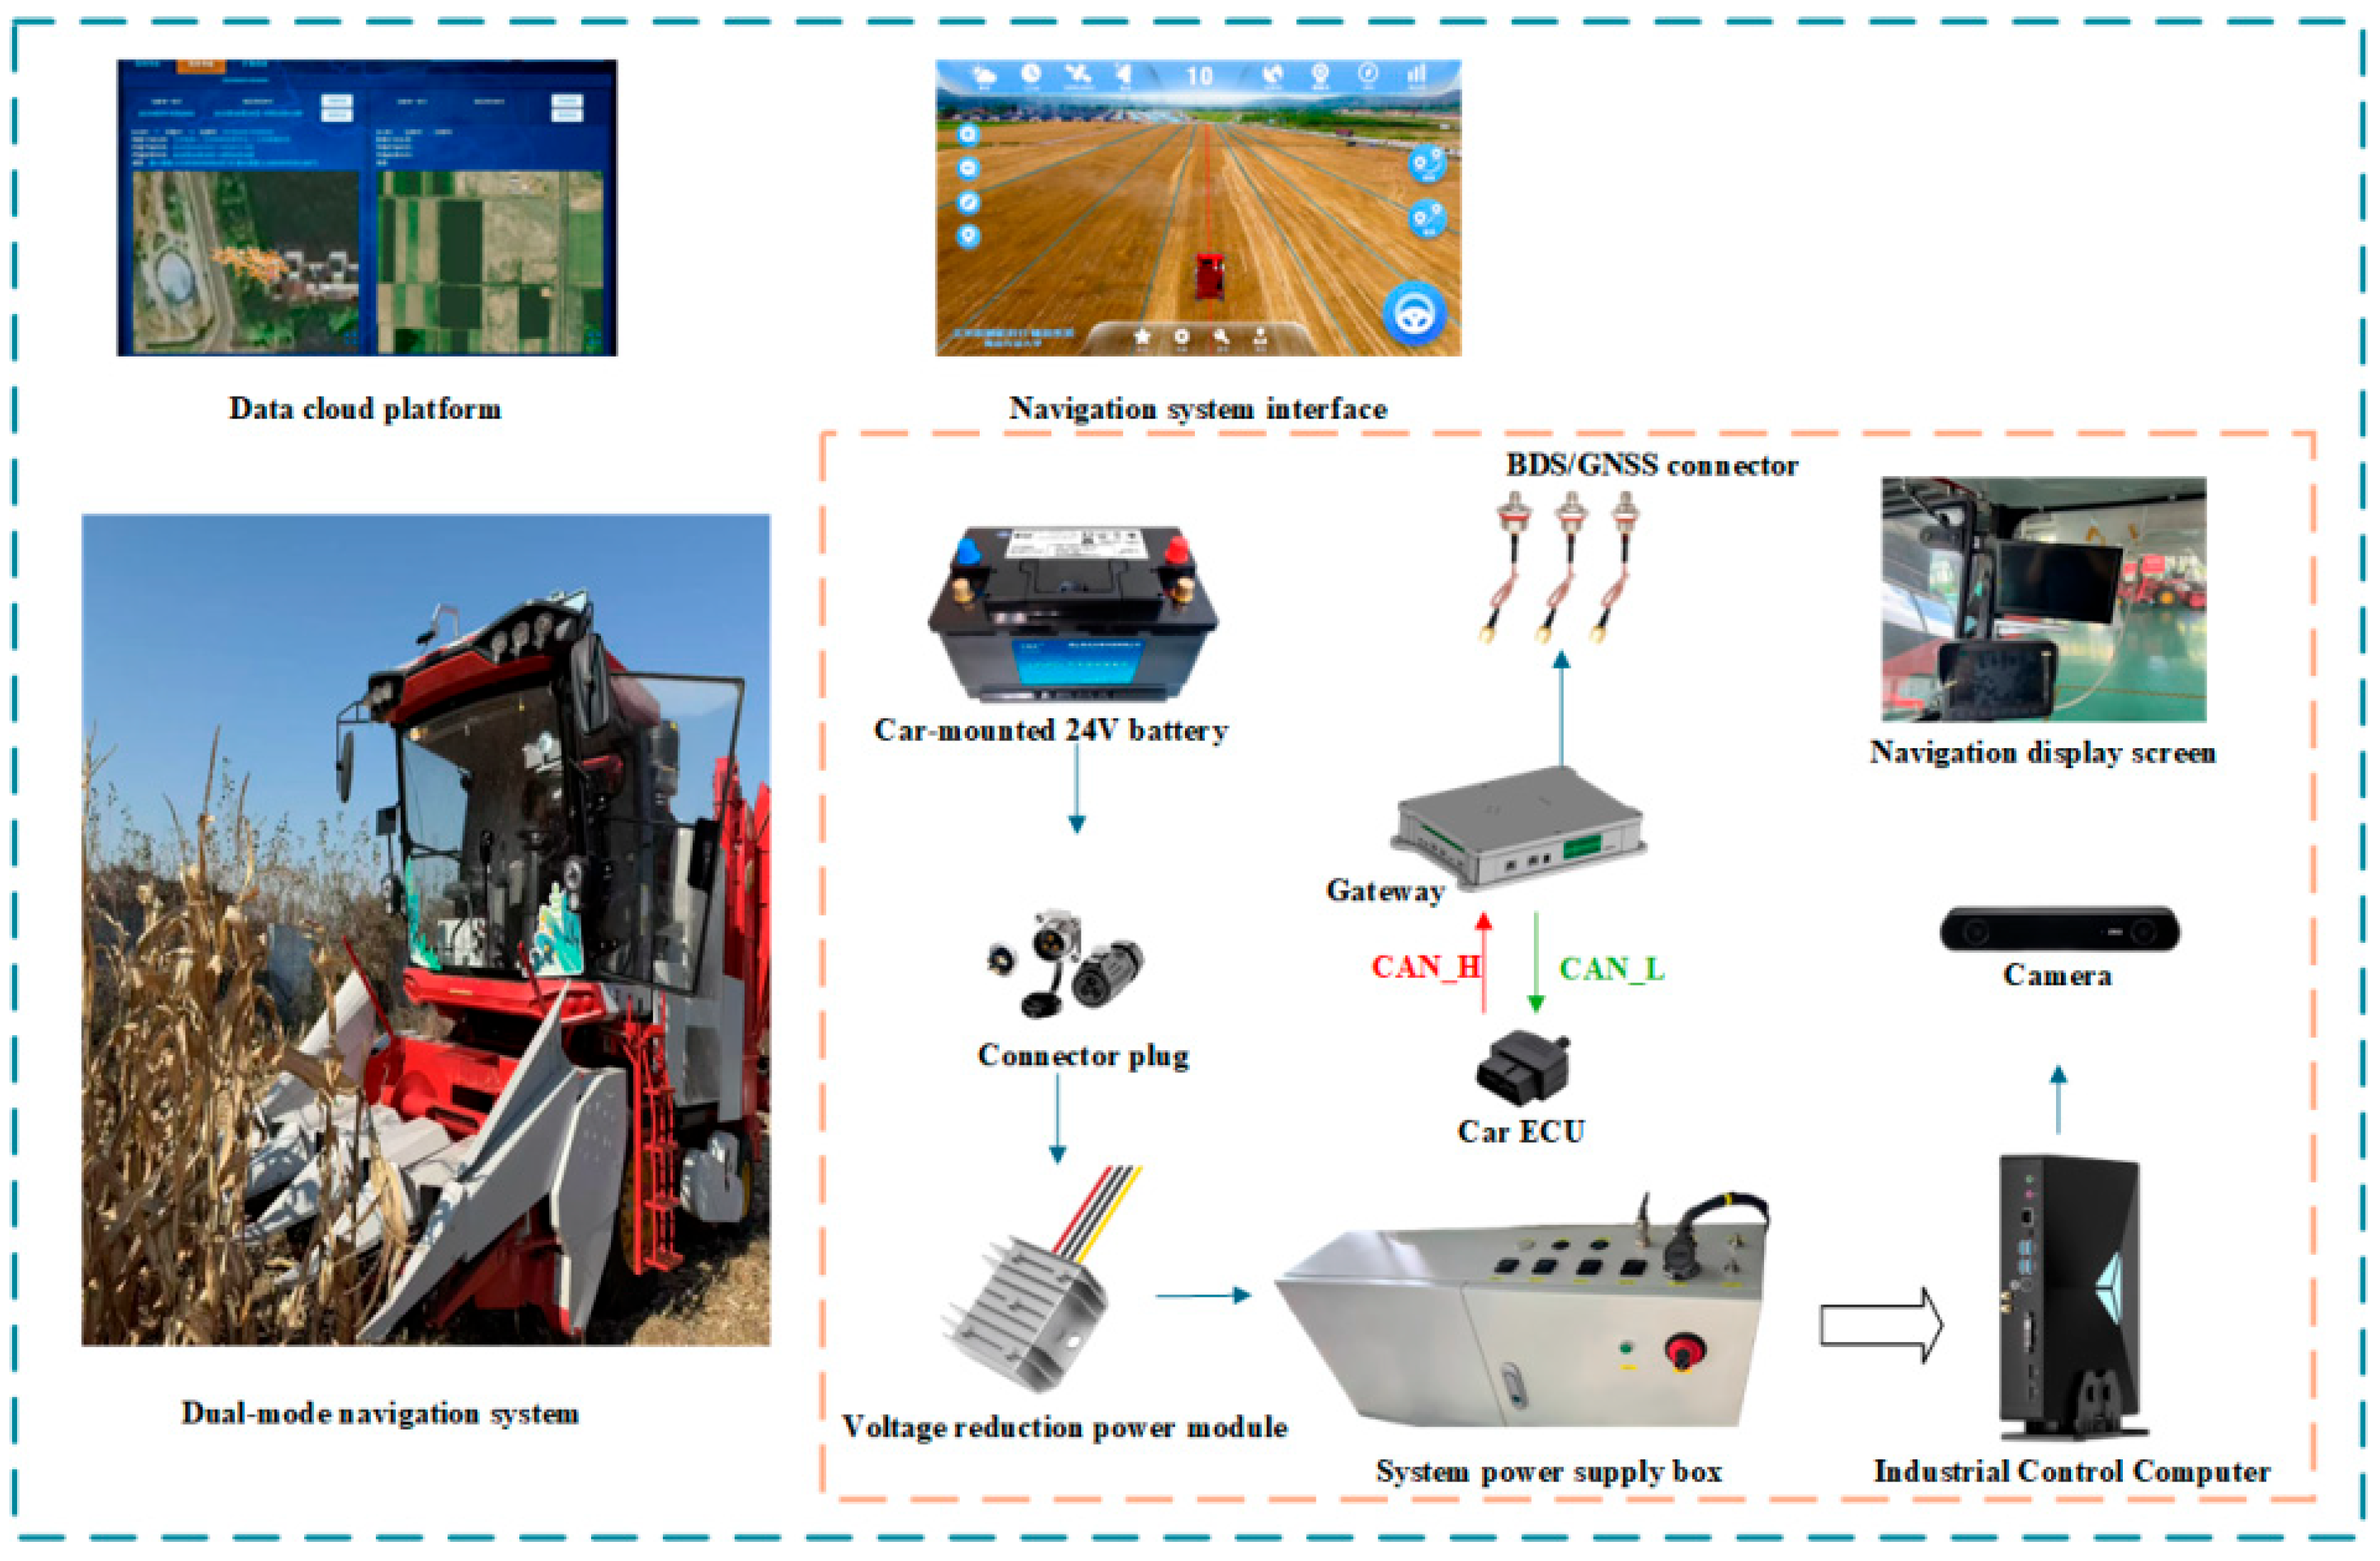
2.10. Job Monitoring and Trajectory Collection System Based on Multi-Source Data Gateway
As the core hardware carrier of the “visual dominance—gateway enhancement” dual-mode navigation system, the intelligent gateway independently developed by our research team is based on the RK3568 processor and realizes real-time fusion and edge computing of multiple sources of data. The gateway receives the R2DC-Mask R-CNN visual-processing results output by the on-board industrial computer through the Ethernet, and simultaneously acquires vehicle kinematic parameters such as speed and steering angle from the CAN network at a 100 Hz rate. The visual centerline and motion information together constitute the observation input and state transition control terms of the MCC-KF algorithm. In the event of a visual signal interruption, it can perform recursive prediction based on the vehicle motion trend, significantly enhancing the robustness of the navigation centerline estimation. Additionally, the gateway integrates BDS/GNSS absolute positioning information and forms redundant verification with the visual navigation line. When the visual confidence is below the threshold, it automatically switches to the compensation mode, generating short-term reliable path predictions based on historical trajectories and absolute positions to ensure the continuous output of guidance instructions.
The gateway implements a confidence-driven adaptive fusion strategy. Visual confidence is calculated from segmentation mask continuity and centerline fitting residual, ranging [0,1]. When >, visual navigation dominates with weight ; when , the system switches to motion-model compensation with dropping below 0.3. During visual failure, the kinematic recursive prediction estimates position through vehicle motion model , using CAN bus velocity and steering angle at 100 Hz. Recovery triggers when > for three consecutive frames, ensuring smooth transition.
The multi-source data is uploaded to the cloud after timestamp synchronization, providing support for subsequent algorithm optimization. This gateway realizes the physical implementation of the dual-mode navigation architecture at the system level, providing reliable multi-source input for R
2DC-Mask R-CNN and MCC-KF algorithms. The system architecture diagram of the multi-source data gateway is shown in
Figure 14.
2.11. Test Method
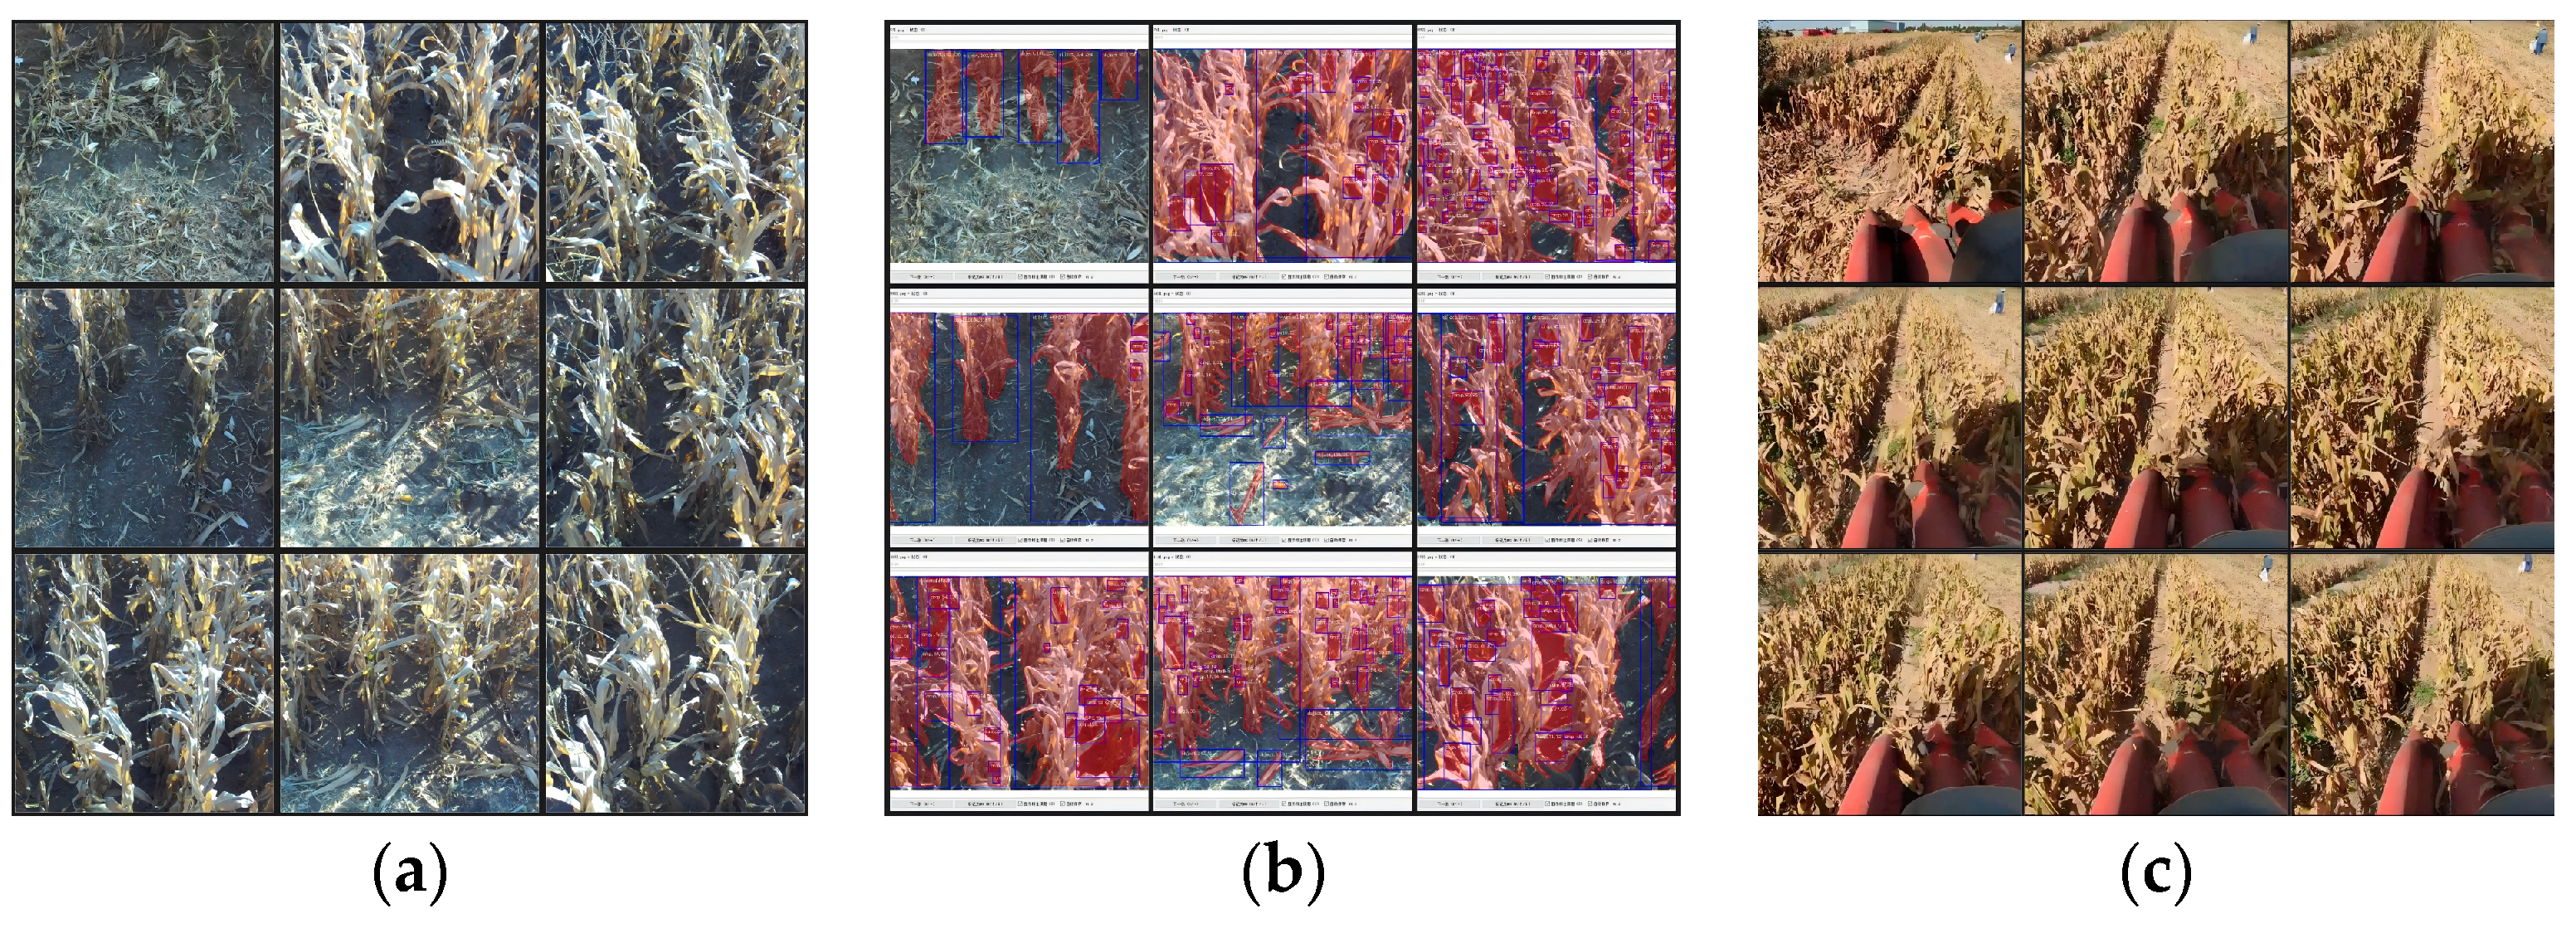
To systematically evaluate the generalization ability of the algorithm in different regions and planting environments, this study constructed a training set and an independent validation set. The training set images were collected from the mature corn field of the Modern Agriculture Science and Technology Demonstration Park of Qingdao Agricultural University on 19 November 2025. A total of 950 original images were obtained during different light periods, as shown in
Figure 15a. The independent validation set was collected from the typical corn-planting area for seed production in Jiuquan City, Gansu Province on 16 September 2025, and contained 400 original images, as shown in
Figure 15c. The light conditions, soil background, and planting-row spacing in this area were significantly different from those of the training set, making it suitable for verifying the algorithm’s cross-regional adaptability. All images were finely labeled, as shown in
Figure 15b.
To expand the data scale and enhance the generalization ability of the model, the Random-Batch Images enhancement strategy was adopted to conduct online augmentation on the original images. This strategy randomly crops and concatenates images at multiple scales, while maintaining the original size of the images, to generate diverse training samples. As a result, the training set was effectively expanded to 5000 images and the validation set to 2000 images. The above datasets were randomly divided into training set, validation set and test set in a ratio of 7:2:1. The performance criterion of the algorithm is whether a single frame image can stably extract the left and right crop row boundaries and fit a reasonable navigation line.
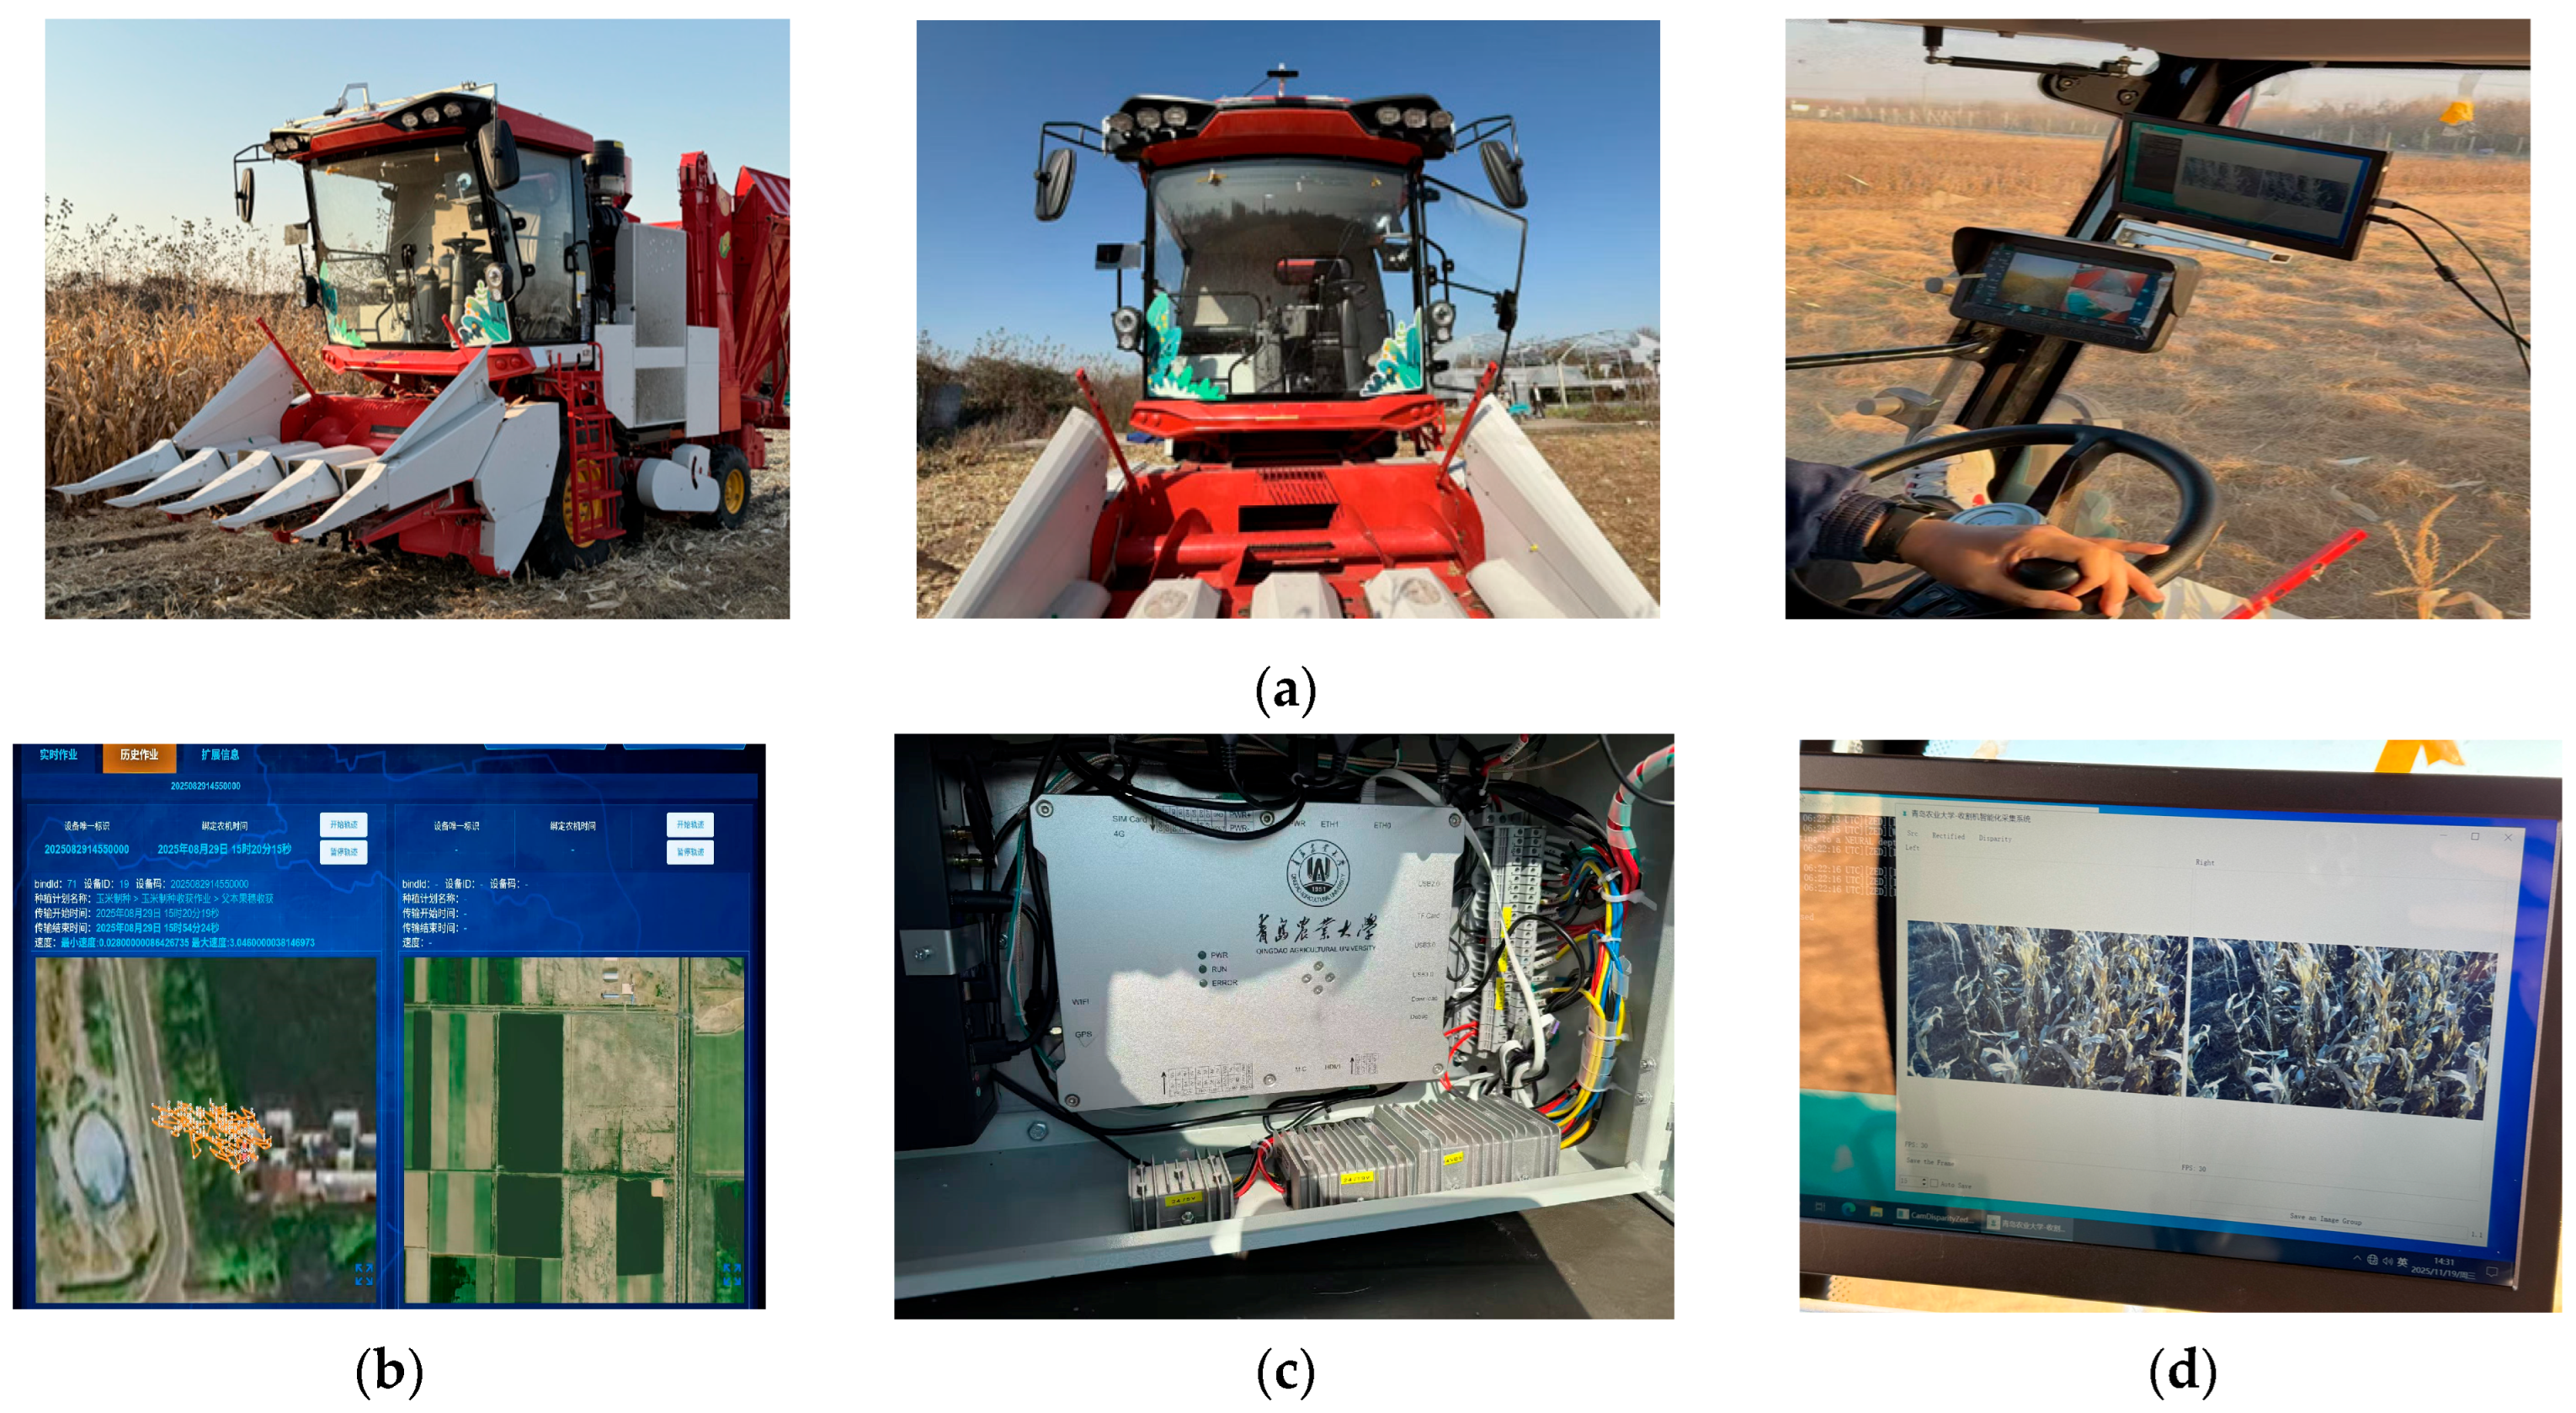
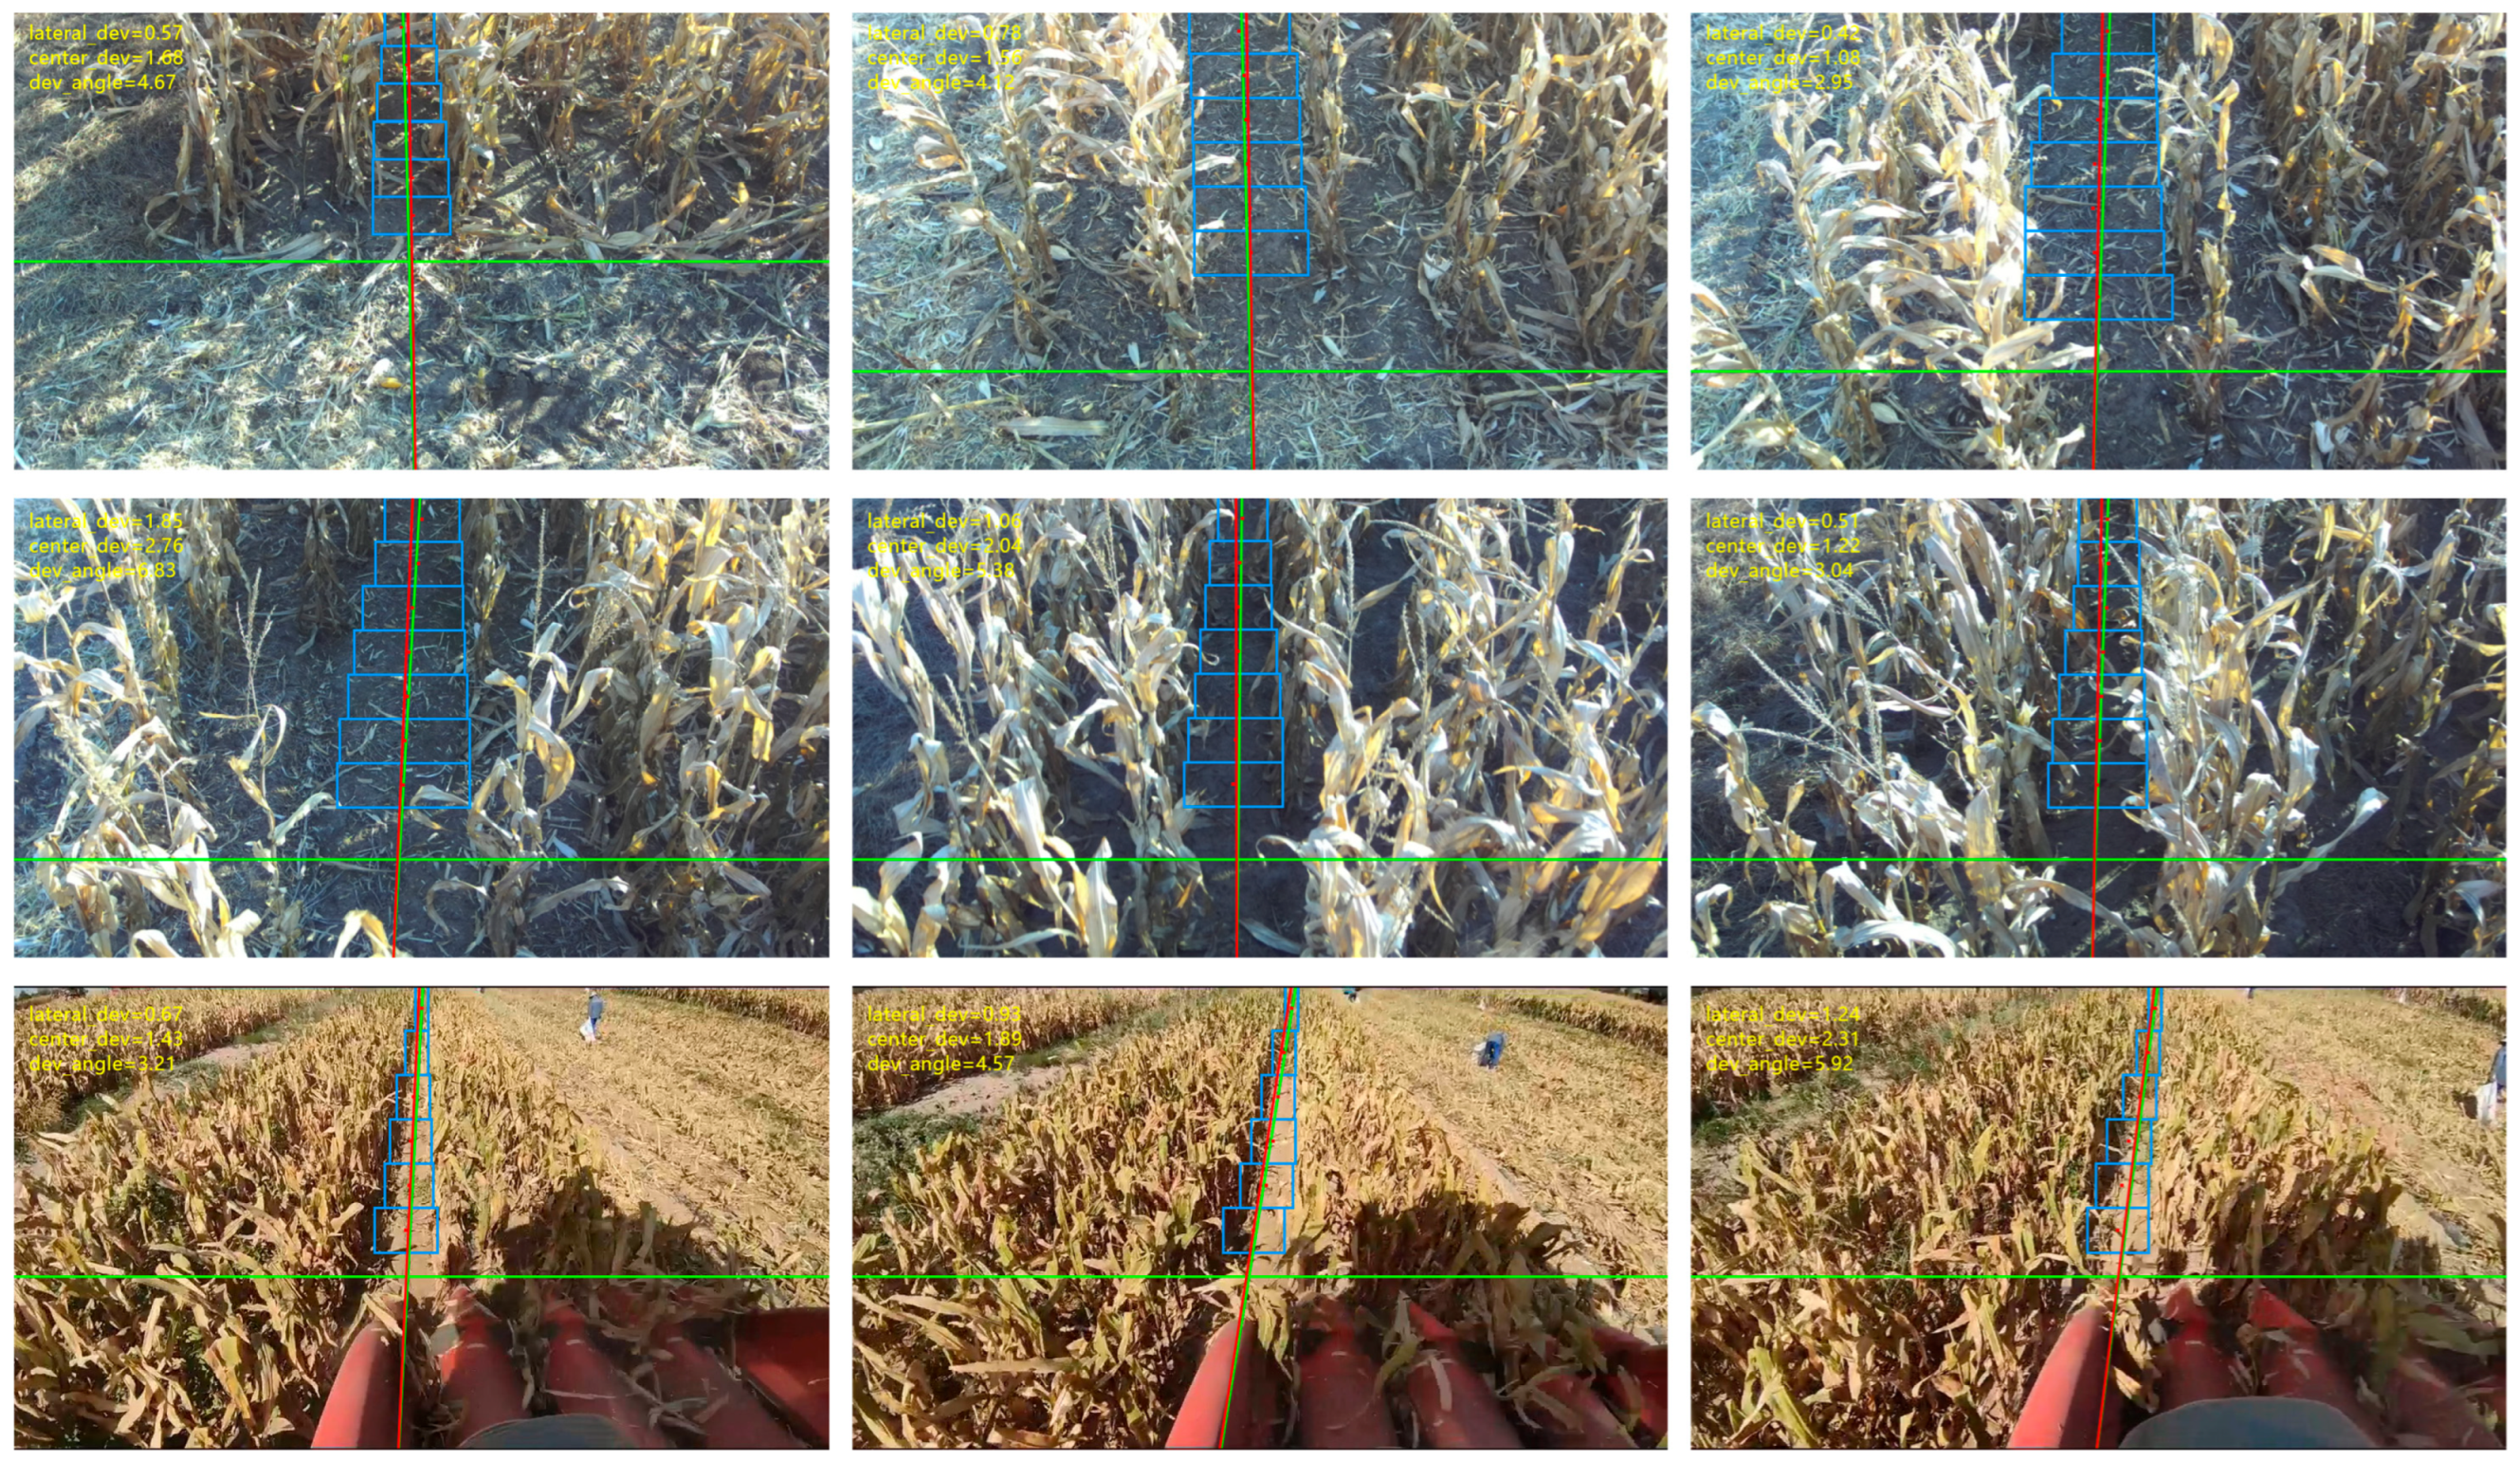
The field real-vehicle verification test was conducted at the Modern Agricultural Science and Technology Demonstration Park of Qingdao Agricultural University. The test field was divided into several 20 m effective test areas, with 5 m buffer sections reserved at both ends. The driver operated at the set speed under the guidance of the system, and the system displayed the navigation line and lateral deviation prompts in real time on the vehicle-mounted display screen. The row accuracy was obtained by comparing the vehicle trajectory data uploaded by the intelligent gateway with the geographic coordinates of the standard corn row centerline, as shown in
Figure 16.
4. Discussion
The navigation robustness of this system stems from three synergistic mechanisms: R2DC-Mask R-CNN ensures segmentation integrity at the perception layer, reducing abnormal observations; MCC-KF dynamically suppresses residual outliers at the estimation layer; and the intelligent gateway enables seamless modality switching at the decision layer. This cascading architecture transforms discrete performance gains into sustained navigation stability. The following elaborates on the scientific discoveries and engineering significance of this study from three dimensions: technical mechanism, performance boundary and system value.
4.1. The Collaborative Optimization Mechanism of the Technical Architecture
R2DC-Mask R-CNN achieves a performance leap through a hierarchical progression of four technologies. Random-Batch enhances data diversity, increasing mAP by 2.4 percentage points; the multi-scale residual structure of Res2Net101 captures the features of slender targets, increasing by 3.7 percentage points; deformable convolution adapts to the geometric deformation of plants, increasing by 1.4 percentage points; channel attention suppresses background interference, resulting in an mAP of 83.5%, an increase of 8.6 percentage points compared to the baseline. This data-to-semantic optimization chain significantly improves the continuity of segmentation in complex field environments.
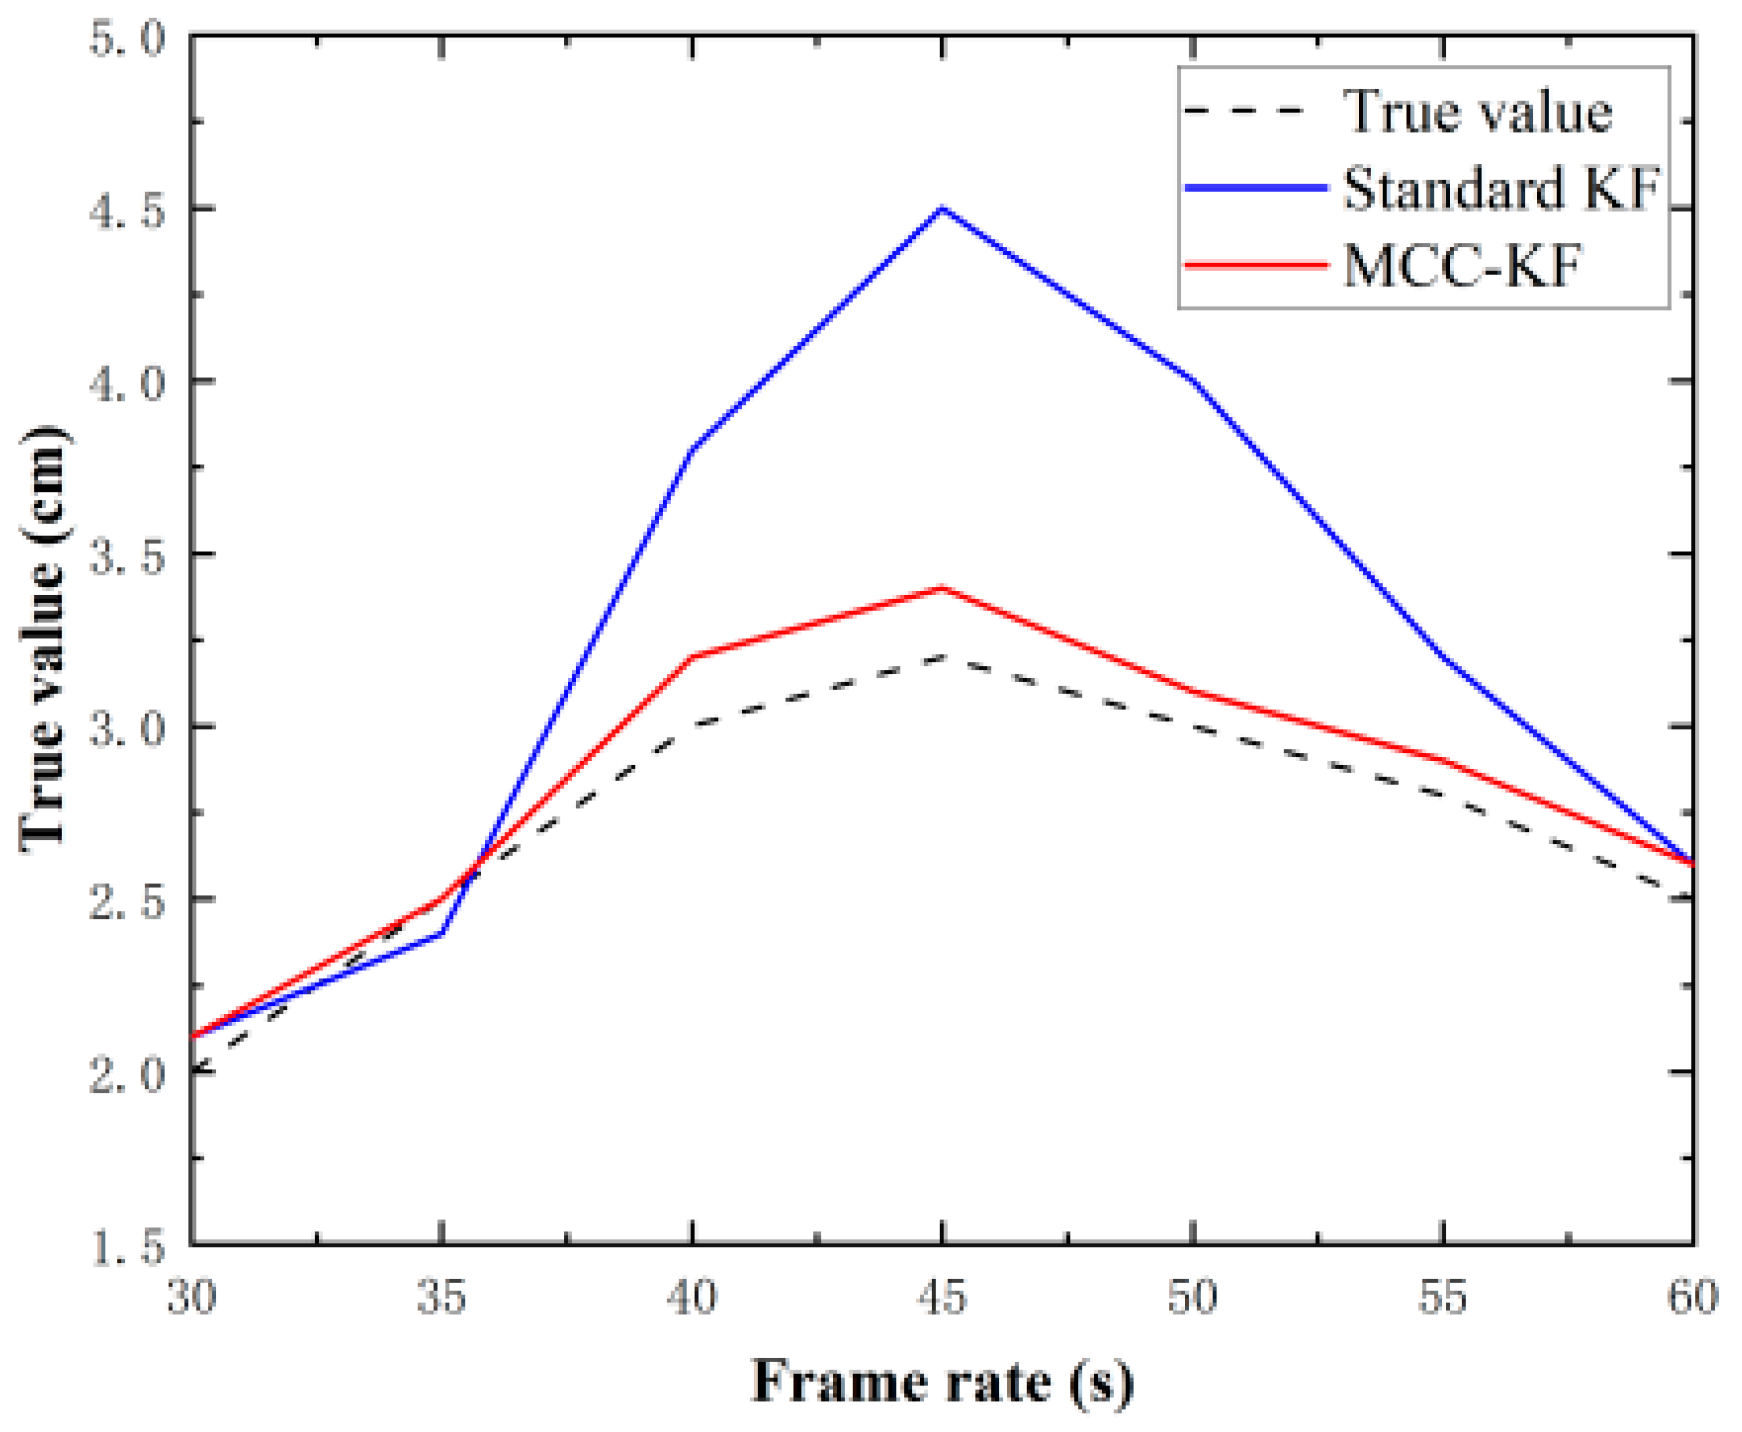
Morphological postprocessing and MCC-KF filtering have achieved dual robustness. The morphological operation is based on prior knowledge to eliminate noise, and it takes less than 2 milliseconds for a single frame. MCC-KF dynamically weights the kernel function, reducing the estimated standard deviation from 0.85 cm to 0.24 cm under abnormal observations, breaking through the Gaussian noise assumption of standard Kalman filtering.
4.2. Adaptive Mechanism of Gateway Integration
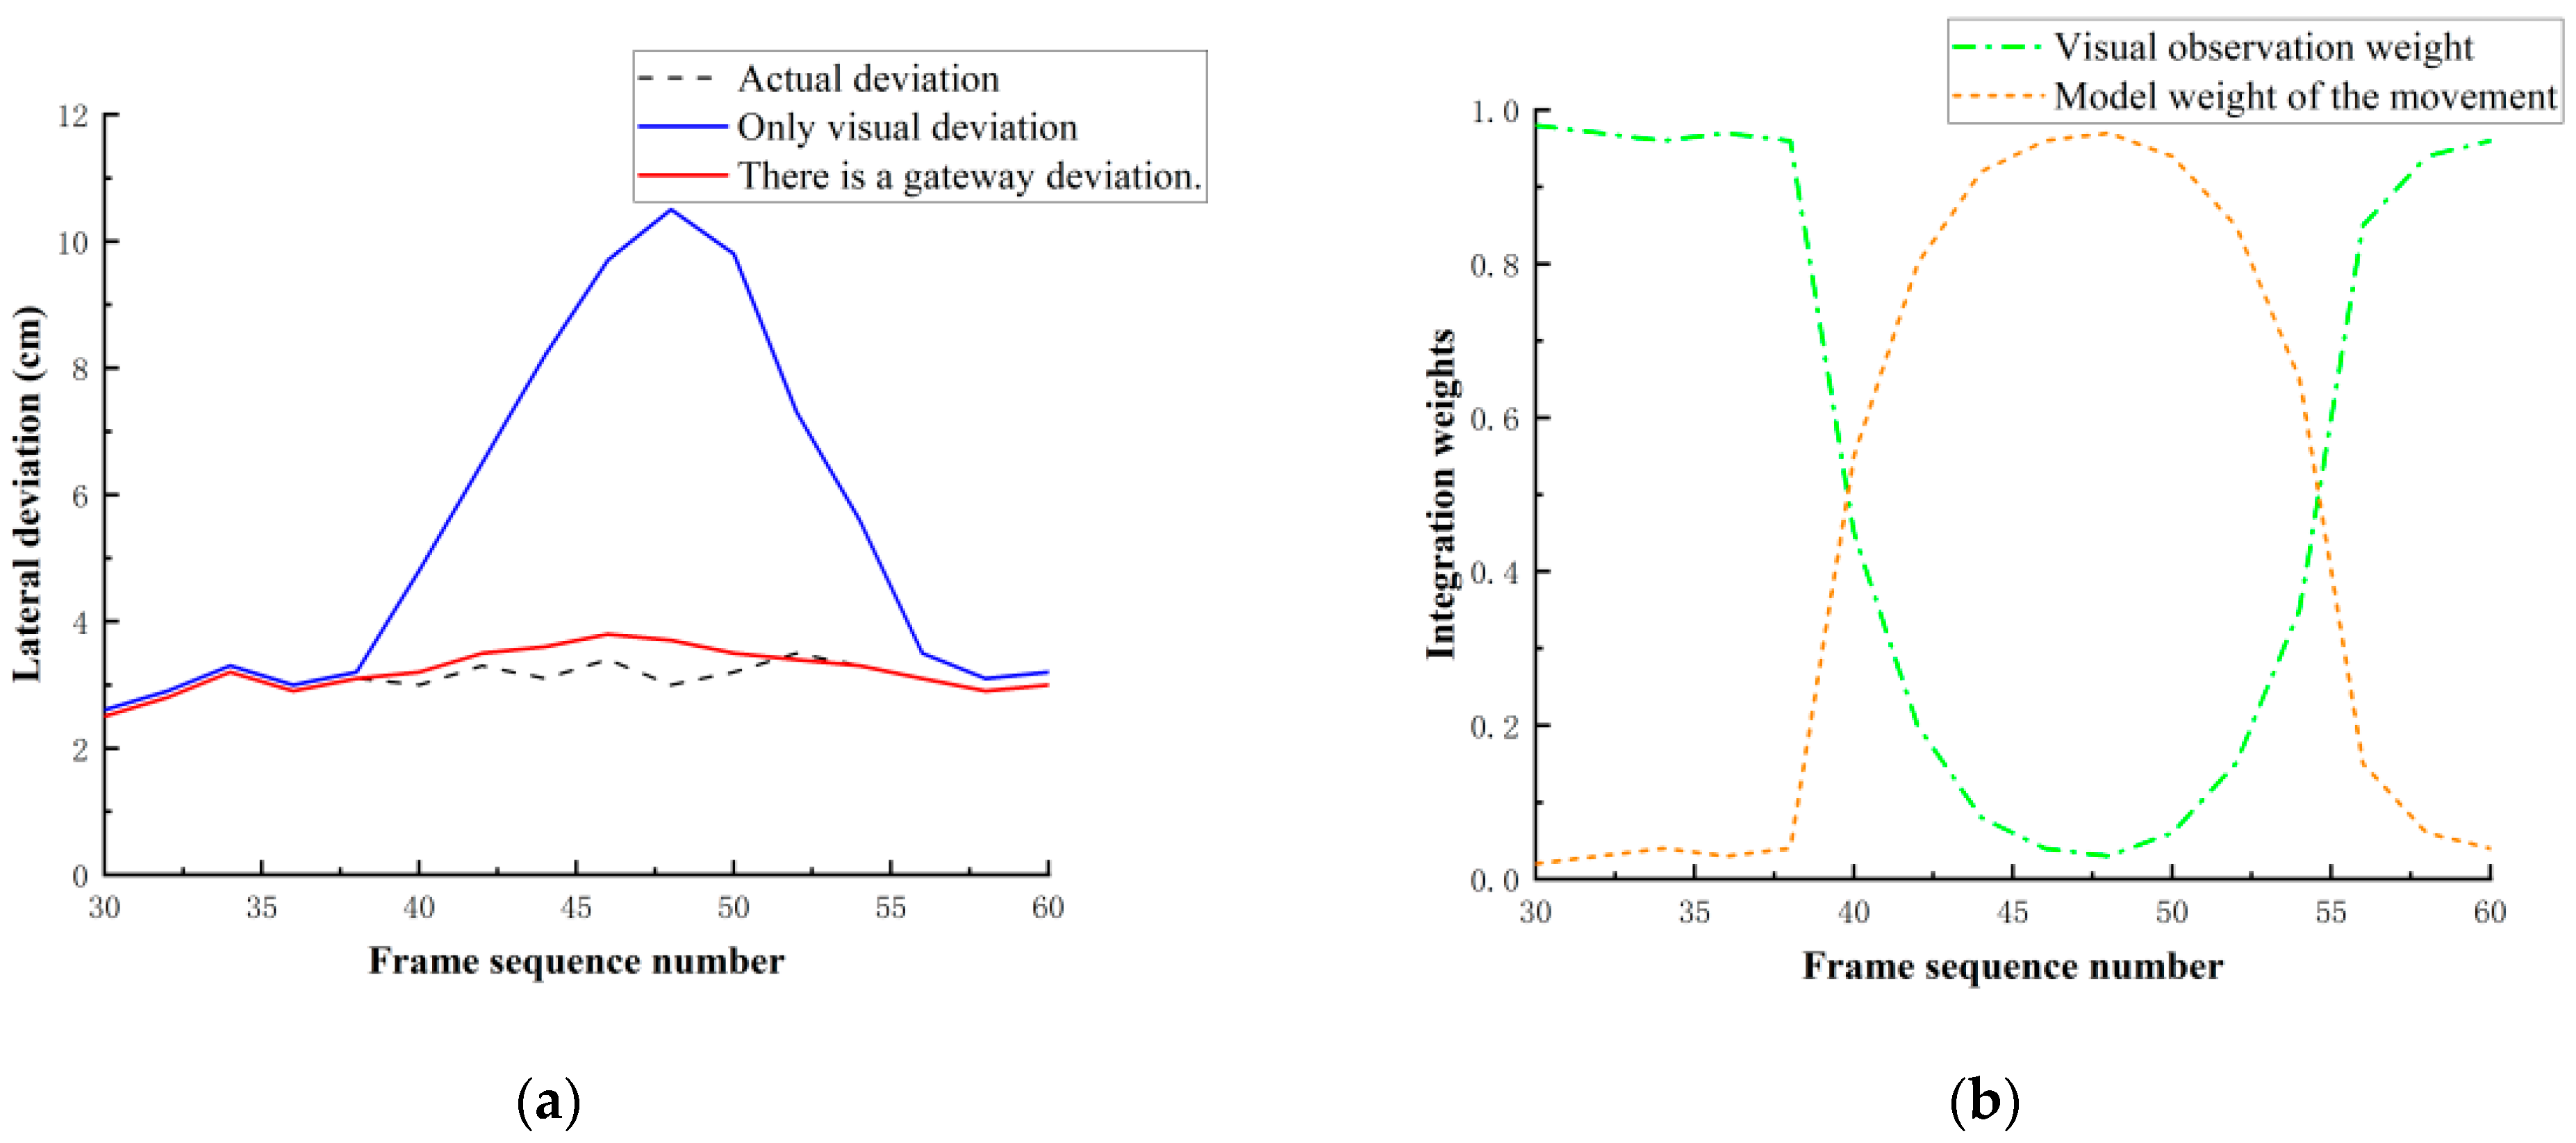
The intelligent gateway enables a smooth transition between the visual and motion models. When the vision fails, the weights are transferred within three frames. During the period when the motion model is dominant, the accuracy is maintained by using vehicle kinematics recursion; after the vision recovers, it returns to the dominant state within one frame. This strategy keeps the average deviation within the failure interval at 3.8 cm, which is 52.7% lower than the pure visual solution and avoids output jumps.
4.3. The Correlation Between Accuracy and the Quality of Harvest Results
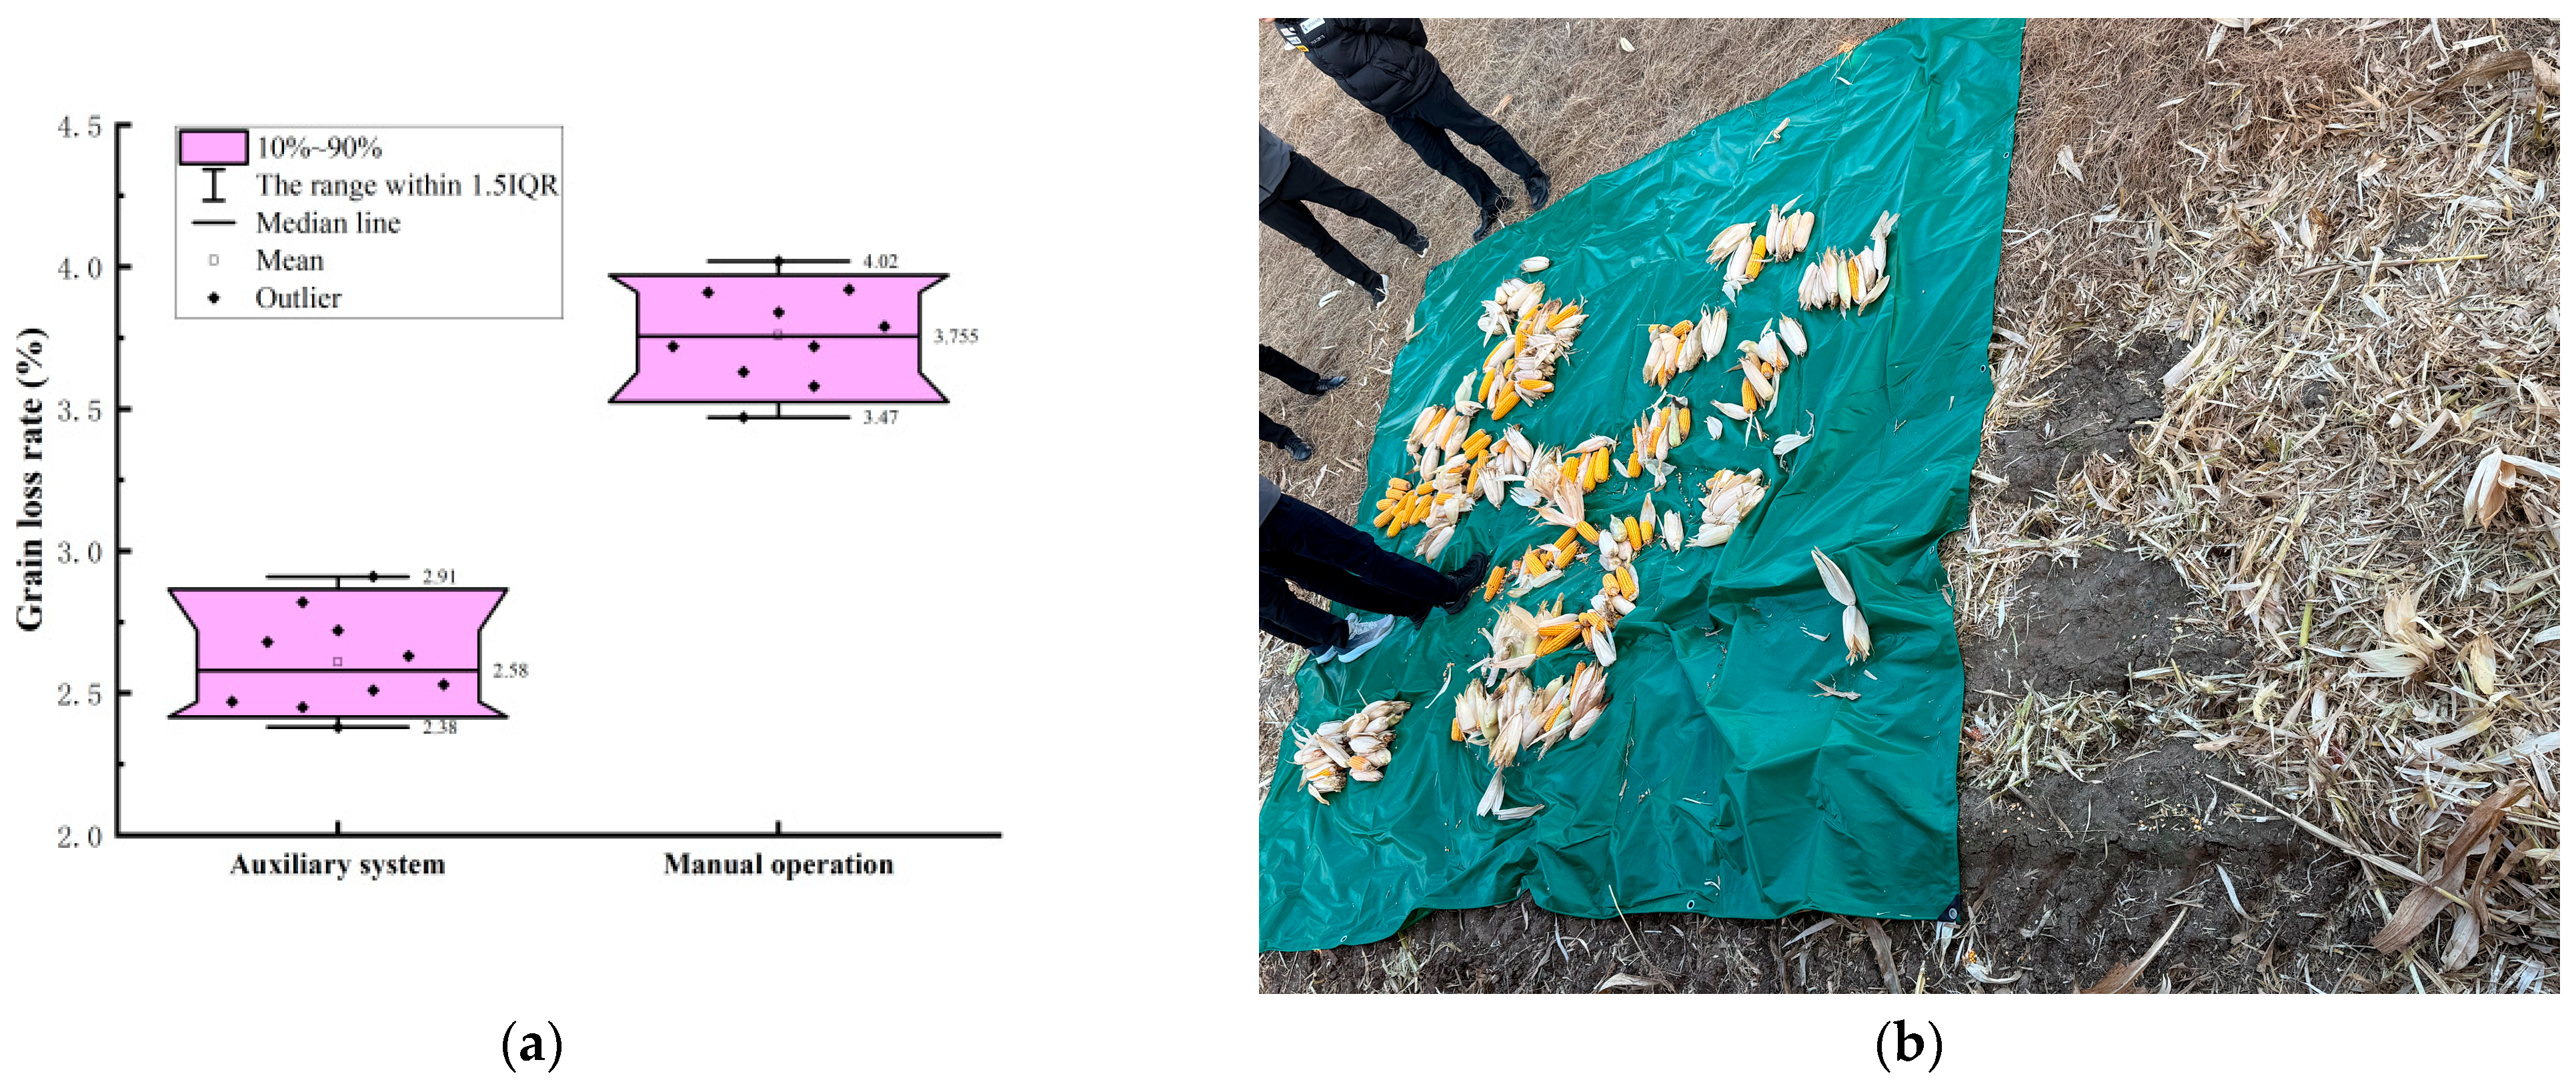
Field trials have verified the causal transmission from precision to quality. The improvement in row precision reduced the number of cutterbar blockages by 75%, the loss of harvested grains from 2.1% to 1.2%, the residual loss from 1.0% to 0.4%, and the overall loss rate by 29.5%.
The system speed adaptability undergoes a transition from linear to non-linear. Precision increases linearly within the range of 0.5–5.0 km/h, and is restricted by motion blur after exceeding 5 km/h. At 6.0 km/h, the deviation is 5.55 cm. The current recommended working speed is within 5 km/h, at which the deviation is less than 6 cm, and the coverage rate of high-quality samples exceeds 96%.
4.4. Limitations and Prospects
This study is limited to sunny/dry ripening conditions. Nighttime and severe lodging scenarios need to be verified; the human–machine delay in the assisted-driving mode remains a bottleneck at high speeds. Future directions include visual–inertial front-end fusion, adaptive frame rate control, and a fully automatic evolution towards a line-controlled chassis.