1. Introduction
Accurate and fine-grained estimates of fruit yield are central to decision-making in modern orchards, affecting harvest logistics, labor planning, storage capacity, and market strategy. Conventional yield estimation relies heavily on manual sampling and visual inspection, which are labor-intensive, subjective, and difficult to scale to commercial production. As a result, vision-based yield monitoring has attracted substantial attention, particularly for high-value crops such as apples. Recent advances in field robotics and precision agriculture have enabled data acquisition at orchard scale using mobile ground platforms equipped with cameras and navigation sensors [
1,
2]. However, achieving reliable yield estimation in real-world orchards remains challenging due to variable illumination, occlusions, fruit clustering, motion blur, and long trajectories spanning thousands of frames.
A key limitation in many vision-only yield pipelines is the lack of geometric consistency across time. Frame-wise detectors can provide apple counts per image, but they suffer from double counting when fruit are observed repeatedly, and under-counting when fruit are missed in individual frames. Temporal association through multi-object tracking can reduce these issues, but tracking alone does not resolve geometric ambiguities, especially when motion is complex or when fruit appearance changes due to viewpoint and illumination. Robust orchard-scale estimation therefore benefits from combining detection and tracking with 3D reasoning, where fruit are reconstructed as landmarks and associated across frames via camera poses.
In parallel, orchard mapping and navigation have progressed rapidly through the adoption of visual-inertial odometry (VIO), stereo depth, and GNSS. Nevertheless, pose estimates produced by such systems can drift, exhibit local inconsistencies, or show misalignment with global coordinate references. Several works have explored sensor fusion and global alignment strategies for agricultural platforms, emphasizing the need for reliable geo-referencing to support downstream tasks such as mapping, yield estimation, and decision support [
3,
4]. This motivates an optimization-based formulation that can reconcile local motion constraints, global positioning cues, and image measurements into a single consistent estimate.
In this work, we present an orchard-scale pose and landmark refinement pipeline based on incremental factor-graph optimization [
5]. Starting from fused raw poses (camera-to-world) and ENU measurements, we (i) triangulate apple landmarks from multi-view 2D tracks, and (ii) jointly refine camera poses and apple landmarks using iSAM2 [
6] with a graph comprising strong relative-motion constraints (between consecutive poses), soft ENU translation priors, and reprojection factors linking poses and landmarks. This formulation explicitly enforces geometric consistency across long sequences while remaining robust to outliers through robust loss models on priors and reprojection residuals. The approach builds on the broader trend of integrating robotic sensing and optimization for scalable agricultural monitoring [
7,
8,
9].
1.1. Motivation and Challenges
Orchard scenes present unique difficulties for vision-based mapping and fruit reconstruction. Apples often appear in dense clusters, are partially occluded by foliage, and exhibit low texture and specular highlights. Camera motion from ground vehicles introduces viewpoint changes and potential motion blur, while the orchard environment yields repetitive structures that can degrade purely visual localization. Additionally, GNSS readings in orchards may suffer from multipath and canopy attenuation, introducing bias and increased noise. These conditions demand a pipeline that (i) uses temporal association to maintain identity consistency, (ii) leverages multi-view geometry to resolve depth, and (iii) fuses relative and global constraints to stabilize long trajectories.
1.2. Contributions
The main contributions of this work are:
A factor-graph formulation to jointly refine camera poses and apple landmarks for orchard trajectories that combines strong raw relative-motion constraints, soft ENU translation priors (after displacement-based alignment), reprojection factors and a separate strong prior on the first pose only. It prevents the entire optimized trajectory and landmark map from drifting or rotating as a whole, thereby fixing the global reference frame of the solution.
A robust landmark initialization strategy using multi-view triangulation from tracked apple observations, with quality gating and configurable view selection to control computational cost on long sequences.
A reproducible orchard-scale evaluation workflow that reports reprojection consistency and pose-change diagnostics, enabling systematic debugging and sensitivity analysis.
1.3. Paper Organization
The remainder of this paper is organized as follows.
Section 2 reviews related work in fruit detection, tracking, agricultural sensing, and optimization-based mapping.
Section 3 describes the proposed pipeline, including ENU alignment, landmark initialization, and the iSAM2 factor-graph formulation.
Section 4 presents experimental results.
Section 5 discusses the results and limitations. Finally,
Section 6 concludes the paper and outlines future directions.
2. Related Work
Orchard-scale yield estimation from vision has increasingly evolved from frame-wise counting into a mapping problem that requires (i) robust fruit perception under strong visual variability, (ii) reliable association to avoid double counting across time and viewpoints, and (iii) geometric reconstruction in a metric and often geo-referenced frame to support orchard analytics. In parallel, advances in SLAM and factor-graph optimization have enabled large-scale state estimation with heterogeneous sensors, motivating pipelines that couple perception with geometry rather than treating them as separate stages. This section reviews prior work most relevant to our end-to-end design—geo-referenced pose estimation (GNSS-VIO), detection and association for counting, multi-view 3D fruit localization, and SLAM back-end refinement—and positions our contribution within this landscape.
2.1. Proximal Sensing Platforms and Orchard-Scale Yield Mapping
Early orchard yield studies relied on limited-view sampling and hand-engineered image processing, which struggles to generalize across illumination, canopy structure, and phenological stage [
10]. Large-scale monitoring requires systematic acquisition strategies and mobile platforms that can scan corridors with repeatable coverage [
11,
12]. Sensor-rich platforms combining cameras with additional modalities (e.g., LiDAR or RGB-D) have enabled orchard mapping beyond per-image detection, supporting canopy/row structure estimation and yield-related spatial products [
1,
13,
14]. Recent work has emphasized persistent mapping and dataset development for long-term orchard monitoring, including metric-semantic representations designed for repeated traversals [
15]. In this context, our SEEmear platform and data collection protocol align with the broader trend toward proximal robotic sensing for permanent crops [
16], while our pipeline specifically targets orchard-block fruit mapping from a single continuous run.
2.2. Fruit Detection and Instance-Level Perception in Orchards
Fruit detection remains the entry point for most vision-based yield pipelines, yet it is challenged by high instance density, foliage occlusion, and strong appearance variation. Deep detectors significantly improved robustness over classical feature/thresholding approaches and enabled practical fruit detection at scale [
2,
17]. Within agricultural detection literature, YOLO-style one-stage detectors are widely adopted due to favorable speed–accuracy trade-offs for embedded deployment, and recent architectural advances further improve feature aggregation and training dynamics [
7,
18]. For orchard-specific counting, apple detection is frequently paired with temporal integration and domain heuristics to mitigate re-detection and partial visibility [
4,
8,
19]. Our work follows this lineage by using modern detection as a high-recall front-end, but differs in how detections are consolidated: we treat association and geometry as first-class components, ultimately validating fruit instances through 3D reconstruction and SLAM refinement.
2.3. Association for Counting: Tracking-by-Detection and Orchard-Specific Pipelines
Avoiding double counting requires associating repeated detections so that each physical fruit contributes once to the final estimate. The dominant multi-object tracking paradigm is tracking-by-detection, which links detections over time using motion models, overlap criteria, and/or appearance embeddings [
20,
21,
22]. These methods have strong empirical performance in general MOT (Multi-Object Tracking) benchmarks, but orchard imagery introduces distinct failure modes: fruits are small, visually similar, frequently clustered, and subject to intermittent occlusion, all of which can increase identity fragmentation and ID switches [
8,
19]. Additionally, traversal patterns with turns and scanning both sides of a row produce abrupt viewpoint changes that can break IoU- and motion-based association. These challenges motivate alternative association primitives (beyond box overlap) and the integration of geometry for verification. Our evaluation of multiple trackers (including IoU/Hungarian baselines, SORT, and ByteTrack) reflects this broader literature, while our final design prioritizes association stability as a prerequisite for reliable multi-view triangulation and map-level de-duplication.
2.4. Point Tracking for Robust Sssociation Under Occlusion and Viewpoint Change
Point tracking has re-emerged as a powerful alternative to box-based association, particularly for small objects and scenes with repeated texture. Modern transformer-based point trackers can follow arbitrary points through occlusion and long temporal gaps, enabling association that is less sensitive to bounding box jitter and partial visibility [
23]. CoTracker introduced joint multi-point tracking that models dependencies among trajectories, improving robustness over independent point tracking [
24]. CoTracker3 further simplified the architecture and proposed a semi-supervised training strategy using pseudo-labeling on real videos, improving robustness while reducing reliance on synthetic supervision [
25]. These developments directly match orchard conditions, where fruits are often partially occluded and appear in dense clusters. Accordingly, our pipeline uses point tracking (CoTracker3) to construct temporally coherent fruit tracks that serve as the association backbone for geometric reconstruction.
2.5. Multi-View 3D Reconstruction, Bundle Adjustment, and Semantic Fruit Mapping
Mapping-oriented yield estimation benefits from multi-view geometry: repeated observations can be consolidated by triangulating fruit into a 3D landmark, naturally reducing double counting and enabling spatial analytics. Video-based apple counting and mapping approaches have demonstrated the value of linking detections through time and projecting results into a common spatial frame [
8,
19]. More broadly, orchard monitoring research has explored spatio-temporal reconstruction and “4D agriculture” concepts, where spatial maps evolve over time [
26]. Traditional structure-from-motion pipelines emphasize triangulation and global refinement via bundle adjustment; systems such as COLMAP exemplify robust multi-view reconstruction in generic settings [
27]. Recently, neural scene representations (e.g., NeRF-based counting) have also been proposed to unify reconstruction and counting, highlighting an alternative direction for multi-view integration [
9]. Our approach remains in the geometric regime: we triangulate fruit landmarks from tracked 2D observations under geo-referenced poses and then refine the joint pose–landmark configuration using factor-graph optimization, which is especially suitable for long orchard traversals with dense observation graphs.
2.6. SLAM, Factor Graphs, and Geo-Referenced Pose Estimation with GNSS-VIO
Accurate 3D mapping requires reliable camera poses. Visual-inertial estimation provides strong short-term motion accuracy but drifts over long traversals unless anchored by global constraints [
28,
29,
30]. In outdoor robotics, GNSS provides global position information and is increasingly fused with VIO/SLAM to obtain metric, drift-controlled trajectories suitable for mapping [
31,
32,
33]. Factor-graph formulations provide a principled framework for combining heterogeneous measurements and priors in a single optimization problem [
5]. iSAM2 extends this framework with incremental smoothing and efficient relinearization, enabling scalable SLAM back-ends for long sequences [
6]. In our system, ZED Fusion API provides per-frame geo-referenced poses in a consistent world frame [
34], which we treat as a globally anchored initialization. We then apply iSAM2 as the SLAM back-end to jointly refine poses and fruit landmarks using dense reprojection constraints, improving multi-view consistency at orchard scale.
2.7. Evaluation Practices for Detection, Tracking, Reconstruction, and Orchard-Scale Yield Products
Evaluation of orchard yield pipelines typically combines detection quality, association stability, geometric consistency, and final counting or yield accuracy. For tracking, metrics that decouple detection and identity behavior are critical for diagnosing whether a tracker is suitable for downstream geometric aggregation. HOTA explicitly balances detection and association accuracy and has become a standard for analyzing tracker behavior under identity fragmentation and ID switches [
35]. In agricultural vision, however, evaluation is rarely limited to tracking alone. Recent orchard-scale systems increasingly report a combination of detection or tracking metrics, geometric reconstruction quality, and task-level outputs such as fruit count, size, or spatial yield products.
For example, Wang et al. combined Grounded-SAM2-based MOTS, structure-from-motion, and DeepSDF-based fruit completion for UAV-based monocular 3D panoptic mapping in orchards and evaluated the system using MOTS metrics, Chamfer distance for 3D shape reconstruction, and diameter error under different occlusion levels [
36]. Their study is relevant because it demonstrates a multi-level evaluation strategy spanning tracking, reconstruction, and orchard deployment. Nevertheless, its main objective is fruit shape completion and phenotyping from UAV imagery, whereas our work focuses on ground-robot, geo-referenced orchard-scale yield mapping with explicit SLAM back-end refinement of poses and landmarks. In particular, our pipeline differs by integrating GNSS–VIO initialization, incremental factor-graph smoothing, multi-view triangulation, and geo-referenced orchard products such as density and mass maps.
Similarly, Pichhika et al. evaluated a YOLOv8s with EKF tracking pipeline for mango yield estimation using both harvest count and manual labeling count, showing the importance of validating counting systems not only with image-level annotations but also with operational agronomic ground truth [
37]. This is closely aligned with our emphasis on orchard-level validation. However, their system remains fundamentally a 2D detection-and-tracking counting pipeline, whereas our method reconstructs explicit 3D fruit landmarks, refines them jointly with the camera trajectory through iSAM2, and produces geo-referenced orchard-scale outputs beyond counting alone.
Other closely related studies also reinforce this multi-layer evaluation view. Liu et al. [
38,
39] combined deep learning, tracking, and structure-from-motion for robust fruit counting and later extended this idea to monocular fruit counting and mapping with semantic data association, highlighting the importance of 3D reasoning for reducing double counting across views. Villacrés et al. [
40] compared tracking-by-detection algorithms for apple orchard production estimation, showing that counting accuracy is highly sensitive to association quality under occlusion and variable illumination. For size-oriented evaluation, Gené-Mola et al. [
41,
42] compared photogrammetry-based apple size estimation methods under occlusion and later studied amodal segmentation for robust on-tree apple size estimation, demonstrating that geometric and occlusion-aware metrics are essential whenever yield products depend on fruit size rather than count alone.
Our evaluation follows this same multi-layer logic but is tailored to a geo-referenced SLAM-based yield pipeline. We analyze association quality using MOT metrics, verify geometric consistency through reprojection statistics and triangulation validity, and report orchard-scale outputs enabled by the refined 3D landmark map, including geo-referenced density surfaces, fruit counts, and mass proxies. In this sense, our work sits at the intersection of agricultural MOT evaluation, multi-view fruit mapping, and SLAM-based orchard-scale yield analytics.
2.8. Positioning of This Work
Prior orchard yield systems often excel in either per-frame detection or platform localization, but integrating (a) occlusion-robust association in dense fruit clusters with (b) geo-referenced 3D fruit reconstruction and (c) SLAM back-end refinement at orchard scale remains less common in a single deployable pipeline. Our work addresses this gap by coupling point-tracking-based association (CoTracker3) with multi-view triangulation under GNSS-VIO geo-referenced poses and by refining the joint pose–landmark state with iSAM2. This design yields a unified orchard-scale map from which counting, spatial density visualization, and size-derived yield proxies can be derived in a consistent global frame.
3. Materials and Methods
3.1. Overview End-to-End Sensing and Reconstruction Workflow
Figure 1 below summarizes the complete end-to-end workflow, from on-board sensing to orchard-level outputs. The pipeline consumes synchronized stereo vision and RTK-GNSS streams, produces a globally referenced camera trajectory via visual-inertial and GNSS data fusion (ZED Fusion), associates apple observations over time using detection-conditioned tracking, reconstructs a 3D apple landmark map by multi-view triangulation, and refines the joint pose–landmark solution using incremental bundle adjustment (iSAM2). The final products include refined camera poses, a refined geo-referenced 3D apple map, orchard-level fruit count, and a size-derived yield proxy in terms of total weight estimates.
Given an image sequence and GNSS fixes , the workflow proceeds through the following stages:
- 1.
Sensors and data acquisition (ZED X + RTK-GNSS): the ZED X provides time-stamped rectified RGB frames (left camera stream used for detection and tracking), while an RTK-capable GNSS receiver provides global geodetic position fixes. Both streams are logged during a single continuous traversal that covers multiple orchard rows on both sides and includes headland turns.
- 2.
Pose estimation and geo-referencing (ZED Fusion: GNSS + VIO): ZED Fusion fuses stereo visual-inertial odometry with GNSS constraints to estimate a globally referenced camera trajectory in the ZED
WORLD frame. Each frame
t is associated with a fused pose
(Equation (
5)) below, enabling consistent projection geometry. Because the
WORLD frame is geo-referenced, the reconstructed 3D landmarks inherit global consistency and can be exported to ENU/ECEF/LLA for mapping.
- 3.
Apple detection and temporal association (SLAM Frontend): apples are detected per-frame using YOLOv9 and filtered by confidence and non-maximum suppression (
Section 3.5). Only detections with confidence above
are used. CoTracker3 then operates in online mode, periodically refreshing queries every 10 frames, to generate temporally coherent tracks representing candidate unique apples.
- 4.
SLAM Backend and 3D reconstruction (iSAM2 incremental bundle adjustment):
for each track
, a single 3D apple center
is initialized by multi-view triangulation using the camera intrinsics
and fused poses
. Robust estimation (RANSAC) and geometric validity checks are applied, including cheirality, reprojection gating, minimum parallax, and a maximum sensing range (
Section 3.8).
The initial pose and landmark configuration are further refined using iSAM2 on a factor-graph formulation dominated by reprojection constraints. This step improves global multi-view consistency across the orchard traversal and yields refined poses and a refined landmark map that serve as the basis for counting and yield analytics.
- 5.
Outputs (mapping, counting, and weight proxy): the final outputs are: (i) refined camera poses, (ii) a refined geo-referenced 3D apple map
suitable for visualization and GIS export, (iii) the orchard-level apple count
(Equation (
31)), and (iv) a size-derived weight proxy computed from reconstructed radii via a density-based model (Equations (
37) and (
38)).
This organization makes the data flow explicit: sensor streams → fused geo-referenced poses → detection and tracking (SLAM front-end) → iSAM2 refinement (SLAM back-end) and 3D reconstruction → orchard-scale products.
3.2. Field Site and Platform
Data is collected in an apple orchard located at the Temperate Climate Fruit Growing Experimental Station (EFCT)—Embrapa Grape and Wine, Vacaria, Brazil in March 2025. The cultivar considered in this work is Fuji. The orchard block also contains Gala rows used primarily as pollinators, although Gala harvesting has been completed before data acquisition, and consequently these rows contain negligible fruit observations in the recorded sequences. The orchard is organized in rows with an approximate inter-row spacing of around m between the Fuji and Gala rows.
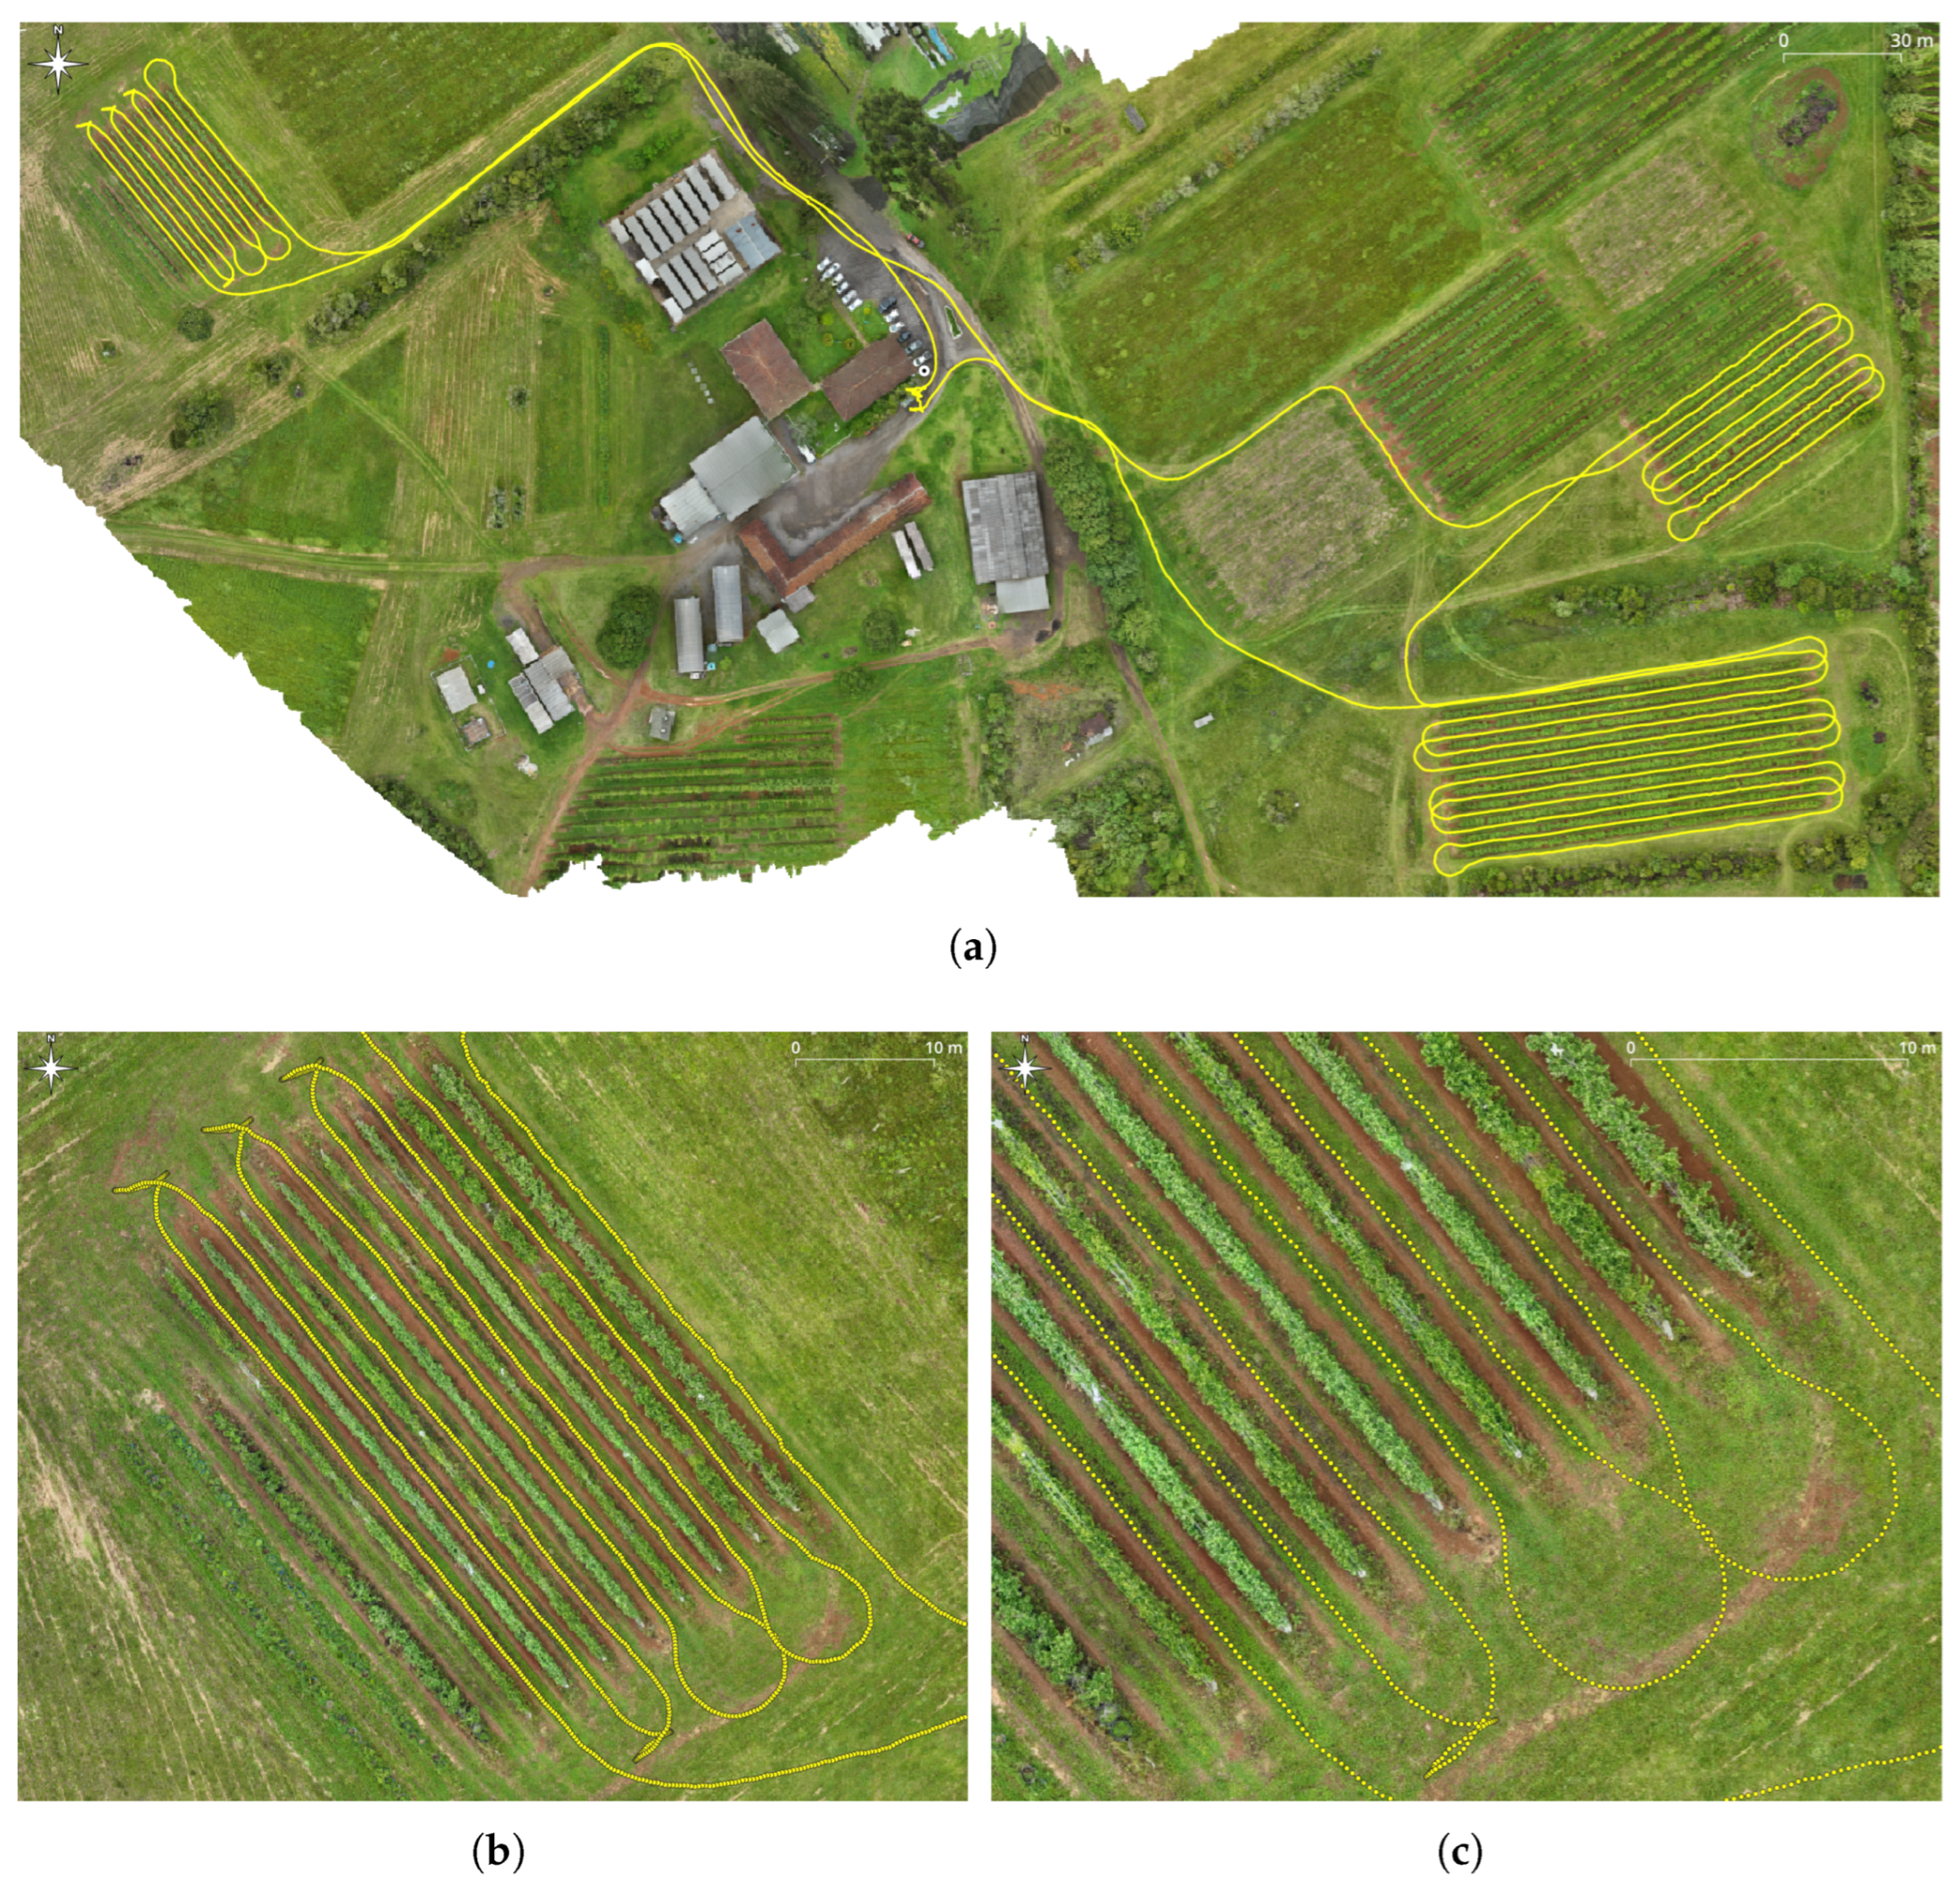
A single continuous run is performed in the afternoon, covering approximately 500 m and traversing four Fuji rows in a continuous path that includes turns and headland maneuvers. The scan covers both sides of the row during traversal, producing strong viewpoint changes that are representative of operational orchard scouting and that stress-test long-horizon association and geometric reconstruction.
Figure 2 below shows the complete acquisition path and the specific palmette-trained plot used for analysis.
Figure 2a shows the full GNSS track of the data collection.
Figure 2b,c show progressively closer views of the palmette orchard, highlighting the maneuvering and inter-row translation present in the trajectory.
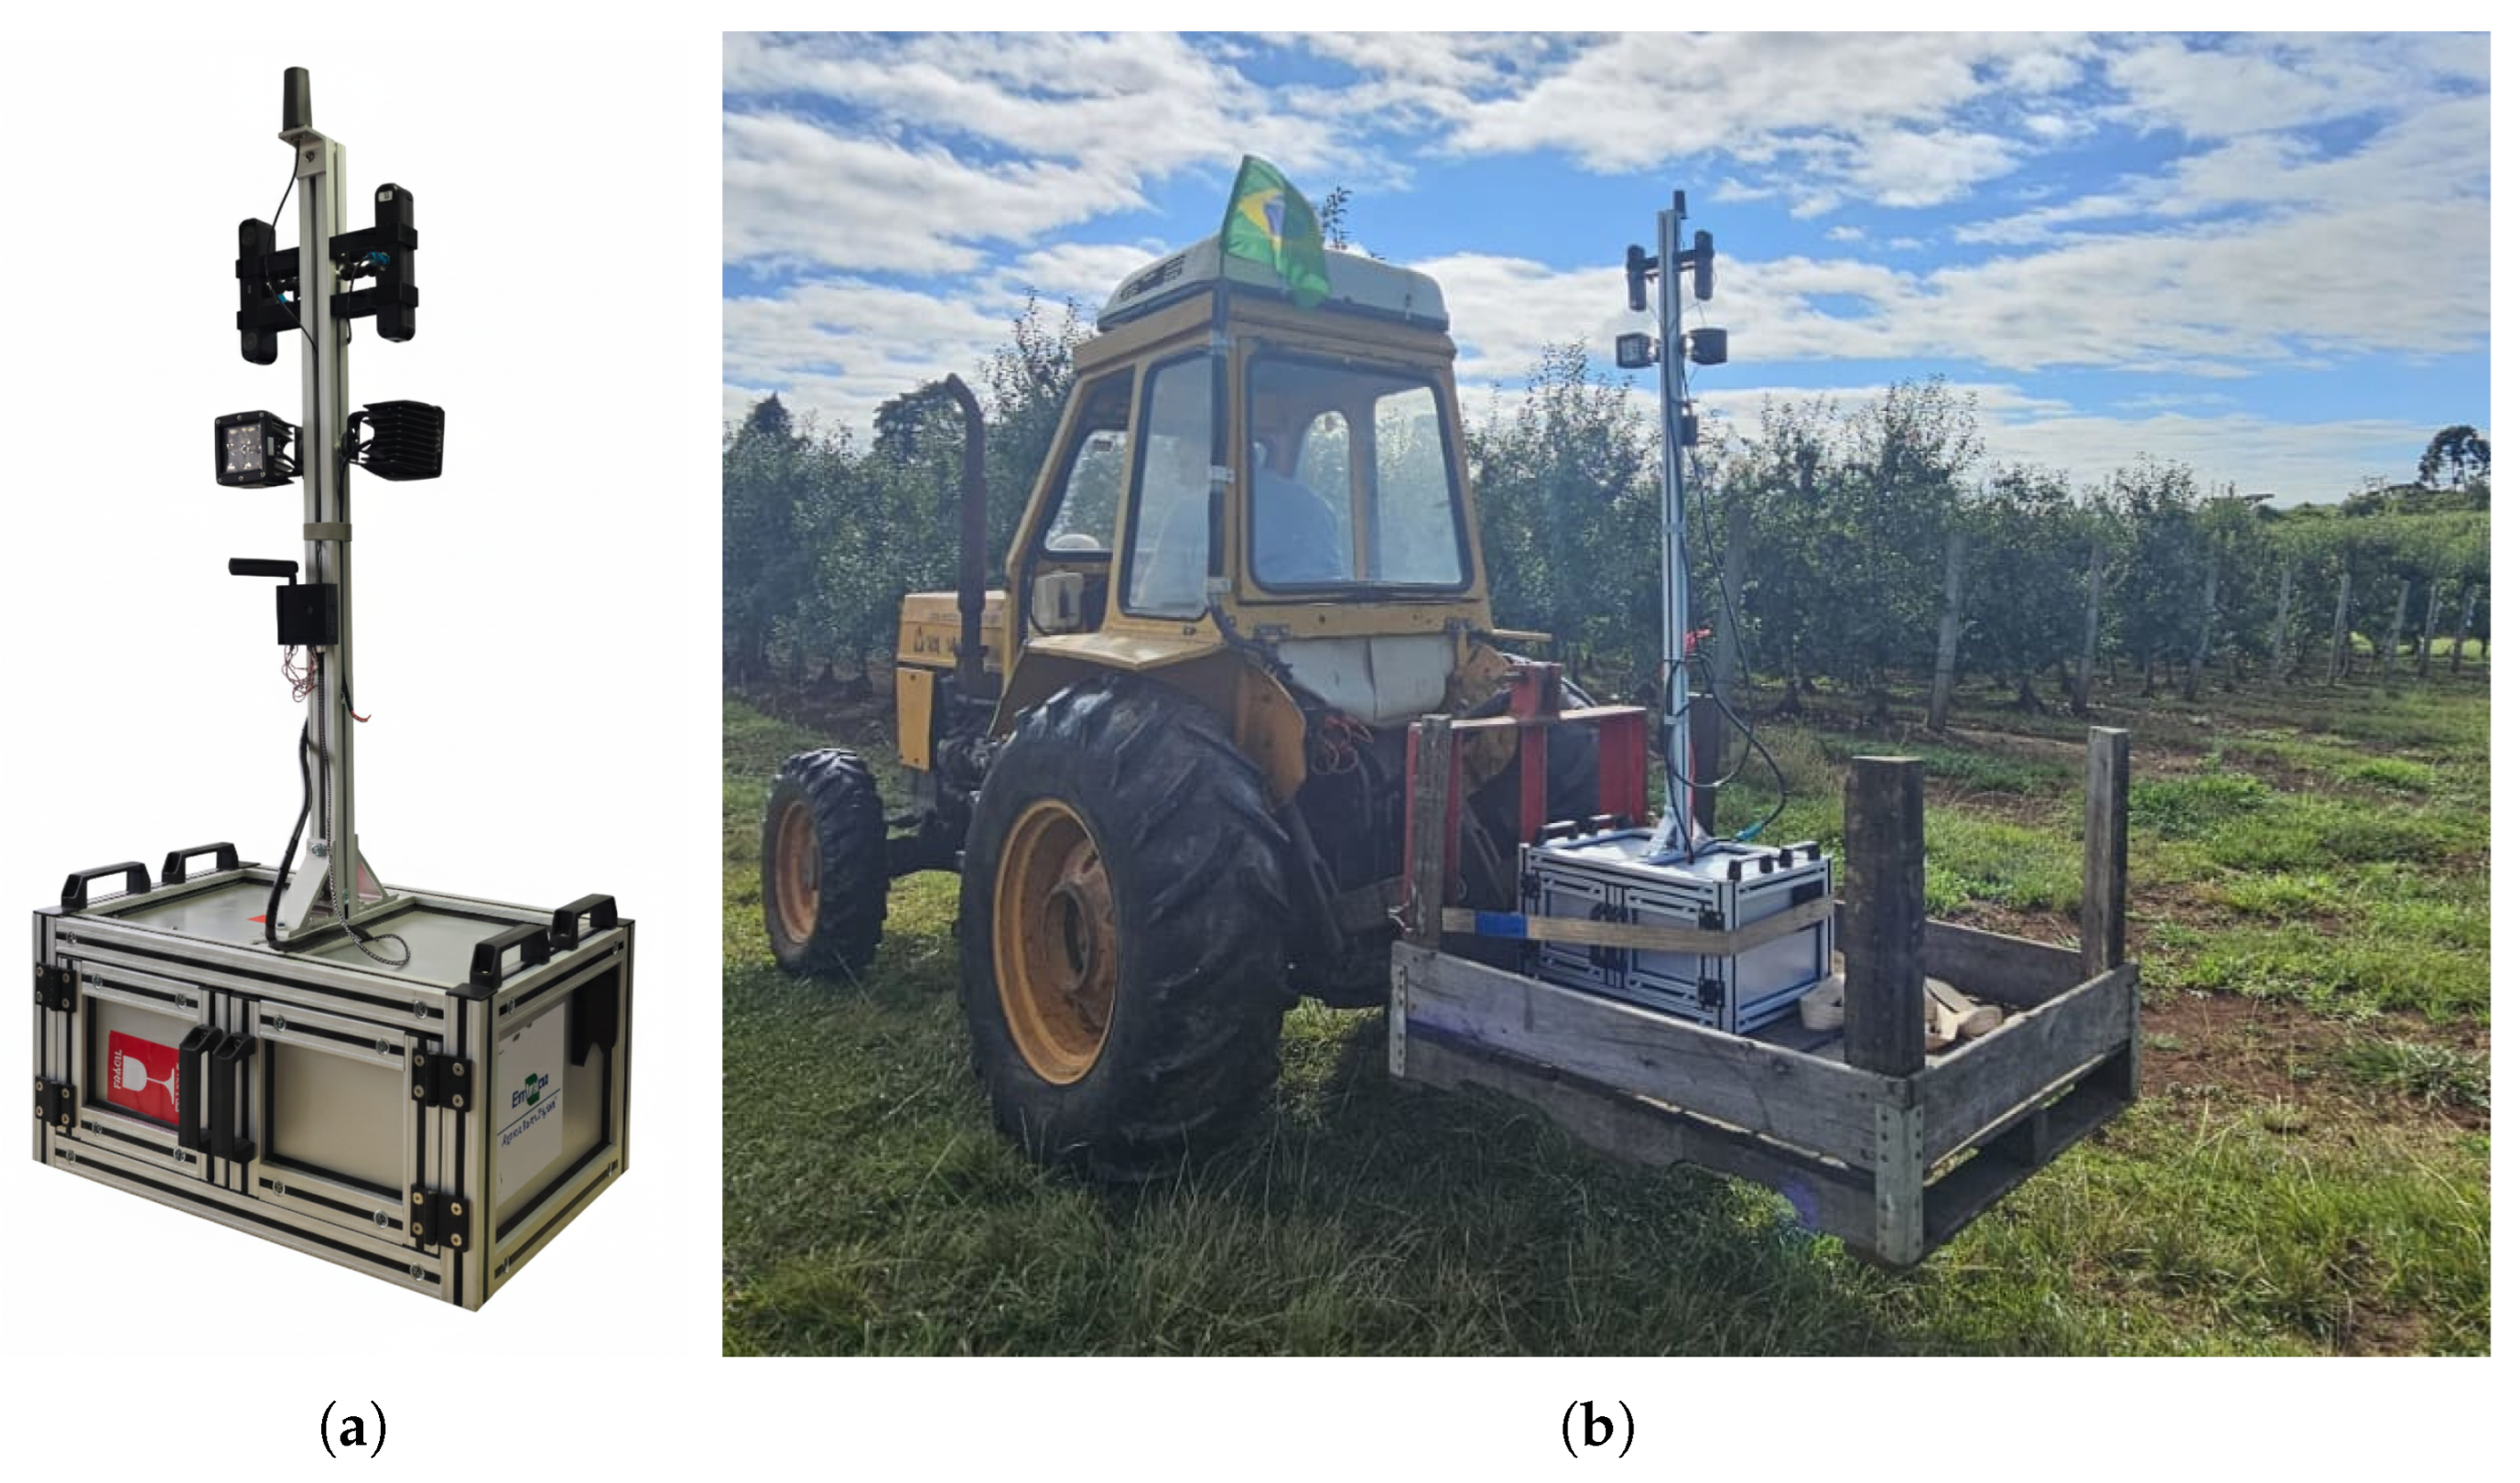
All field data is collected using the SEEmear mobile sensing platform shown in
Figure 3 below, described in detail in [
16]. In brief, SEEmear integrates an on-board compute unit and a co-located sensing head combining: (i) a ZED X stereo camera (wide-angle lens) used for synchronized image acquisition and visual-inertial odometry (VIO), and (ii) an RTK-capable GNSS receiver that provides geodetic fixes (latitude, longitude, altitude). RTK correction is performed using a base station and the trajectory is post-processed (PPK). This work uses the left camera stream as the monocular input for detection and tracking; rectification is performed by the ZED X system during recording.
Apple tree training systems strongly shape plant architecture and canopy porosity, directly affecting light interception, fruit exposure, and the degree of self-occlusion in image-based sensing. Classical central leader systems maintain a dominant main axis with lateral branches, forming a relatively voluminous canopy, whereas spindle (slender axis) systems adapt the central leader to higher-density plantings by promoting a narrower canopy with short, renewable laterals and a higher proportion of fruiting structures close to the axis [
43,
44]. More intensified wall-like architectures can also be obtained with multi-leader training, where multiple vertical axes per plant are supported to form a continuous productive wall with improved light distribution but typically increased within-canopy overlap when viewed from ground-level platforms [
45,
46].
In the EFCT block used in this work, the scanned rows are not all trained identically; in particular, the final scanned row follows a different training configuration with denser canopy structure. This difference is relevant for interpretation of row-level results because denser architectures increase fruit occlusion and reduce the effective visibility time of individual fruits, which can lower track continuity and landmark recall under a single-pass traversal.
3.3. Data Acquisition Protocol and GNSS-VIO Fusion
During acquisition, the platform traversed orchard corridors at approximately 5 km/h. Video frames are recorded at approximately 30 fps and GNSS fixes at 5 Hz. The run produced approximately time-stamped frames and a synchronized fused camera pose sequence obtained from GNSS-VIO fusion.
The camera provides an image stream
with timestamps
at an average rate
. The GNSS provides geodetic fixes
where
denote latitude, longitude, and altitude, at a nominal rate
Hz. ZED Fusion combines VIO with GNSS to generate a metric, geo-referenced camera trajectory in a consistent world reference [
34]. A central property of our workflow is that 3D apple landmarks are reconstructed directly in this geo-referenced
WORLD coordinate system, enabling GIS-ready outputs without a separate post-hoc alignment stage. Accordingly, the aim of this work is not to benchmark alternative odometry modalities such as LiDAR and inertial fusion, but to refine a practical geo-referenced visual-inertial trajectory for fruit landmark reconstruction and yield mapping.
3.3.1. Temporal Synchronization
The fusion module aligns camera and GNSS measurements in time by associating each image timestamp
with the closest GNSS timestamp
:
This nearest-neighbor association is required because the camera (
) and GNSS sampling rates (
) are not equal to each other, i.e.,
.
3.3.2. Spatial Alignment and Calibration Transform
VIO produces a camera trajectory in a local (arbitrary) coordinate system, denoted as frame
V (VIO world). GNSS provides positions in a global geodetic system. ZED Fusion estimates a rigid alignment that maps the VIO world to a GNSS-consistent world frame
W:
The rigid transform estimated by the upstream fusion stage accounts for the sensor-frame alignment required to express the camera trajectory in the geo-referenced WORLD frame. Accordingly, the iSAM2 back-end in this work refines already fused camera poses and does not separately re-estimate the GNSS-antenna-to-camera lever-arm inside the factor graph. Any such extrinsic handling is therefore inherited from the ZED Fusion calibration and fusion pipeline rather than modeled as an additional optimization variable here.
After fusion, each camera pose is expressed in the fused WORLD frame W and inherits geo-referencing; consequently, any 3D point reconstructed in the same WORLD frame also inherits this global reference.
3.3.3. Fused Camera Pose Convention
Let the fused camera pose at time
t be
mapping camera-frame coordinates to
WORLD coordinates. The corresponding inverse (WORLD-to-camera) transform is
The camera center in
WORLD coordinates is
3.4. Camera Model and Projection Geometry
We assume a pinhole camera model with intrinsics
The intrinsics
are obtained from the ZED X calibration corresponding to the acquisition configuration.
For frame
t, the world-to-camera projection matrix is
Given a homogeneous 3D point in
WORLD coordinates
, the homogeneous image projection is
3.5. Apple Detection Using YOLOv9
We detect apples in each rectified RGB frame using YOLOv9. YOLOv9 was selected because the primary objective was to build a practical, end-to-end orchard pipeline with a favorable speed–accuracy trade-off and straightforward deployment on embedded robotic hardware. We therefore prioritized a detector family that is widely adopted in real-time agricultural perception, rather than conducting a broader architectural benchmark against transformer-based detectors. Such comparisons remain relevant future work, particularly for small-object detection in dense and highly cluttered canopy regions. In the present work, the role of the detector is to provide reliable initializations for the tracking module (
Section 3.6), typically obtained from frames captured during favorable viewing geometries arising from camera translation. YOLOv9 is used directly for inference without additional training. For each frame
, YOLO outputs a set of axis-aligned bounding boxes
with confidence score
. We retain detections satisfying
with
. Non-maximum suppression (NMS) is applied with IoU threshold
.
The pixel center of the
i-th detection in frame
t is
In the present pipeline, illumination artefacts may still reduce detector recall locally, but their effect on the final 3D map is partially mitigated by temporally coherent association in the tracker and geometric consistency checks in the downstream stages.
3.6. Temporal Association and Tracking (CoTracker3)
The objective of tracking is to assign a stable identity to each physical apple over its visible duration, producing a set of tracks . This is challenging in orchard environments due to repeated appearance patterns (many visually similar apples), partial occlusions by foliage, and rapid viewpoint changes around turns and during scanning of both sides of the rows.
3.6.1. Tracking Configuration (Online Mode with Periodic Queries)
CoTracker3 is employed in online mode. Only detections satisfying are used to initialize tracking hypotheses. To maintain robustness over long sequences while keeping computation bounded, we periodically refresh the tracker state by providing new query detections every 10th frame. The value was chosen based on the speed of data acquisition, the frame rate, and the visibility of the landmarks in the field of view. This online update mechanism supports continued association through viewpoint changes while avoiding the need to re-process the entire sequence offline.
3.6.2. Track Representation and Minimum Support
A track
k is represented as an ordered set of observations across frames:
where
indexes frames where apple
k is visible. Tracks shorter than
= 5 frames are discarded prior to triangulation to ensure sufficient multi-view constraints. Since each row side is traversed once in a single pass, apples naturally leave the camera field of view as the platform advances; hence tracks terminate when the apple exits the image rather than by long-term re-identification.
3.7. Tracker Selection Protocol and Benchmark
To quantify association quality, we evaluate all trackers using
TrackEval on a representative orchard segment under the MOTChallenge 2D bounding box configuration with IoU threshold 0.5. We report Higher-Order Tracking Accuracy (HOTA) and its decomposition into detection accuracy (DetA) and association accuracy (AssA), the CLEAR MOT metric MOTA, and identity-based metrics (IDF1, IDR, IDP).
Table 1 below reports the comparison results for the different trackers.
CoTracker3 achieves the highest overall tracking quality according to HOTA (42.63%), substantially exceeding the Hungarian baseline (28.13%) and both SORT and ByteTrack (11.98% and 12.34%, respectively). The HOTA decomposition shows that CoTracker3 is particularly effective at maintaining identity over time: AssA reaches 55.97%, compared to 20.42% for Hungarian, 24.41% for SORT, and 38.74% for ByteTrack. Identity metrics further corroborate this behavior: CoTracker3 attains an IDF1 score of 50.75%, whereas Hungarian, SORT, and ByteTrack reach 26.63%, 8.91%, and 6.56%, respectively.
In contrast, the Hungarian baseline achieves higher MOTA (25.44%), driven by fewer false positives, but exhibits severe identity fragmentation, as evidenced by the large number of predicted track IDs (2146) relative to the 253 ground-truth identities. For downstream geometric aggregation, identity persistence is essential because longer and cleaner trajectories provide stronger multi-view constraints and more reliable triangulation. Therefore, we adopt CoTracker as the tracking component for 3D reconstruction and final counting in the main pipeline, as justified.
This behavior reflects the limitations of MOTA in densely occluded orchard scenes. Because MOTA heavily penalizes missed detections, false positives, and identity switches, it can remain low even when a tracker provides trajectories that are sufficiently stable for downstream multi-view geometry. In our application, association persistence is more important than frame-wise detection purity, since longer and cleaner tracks provide stronger constraints for triangulation and SLAM back-end refinement.
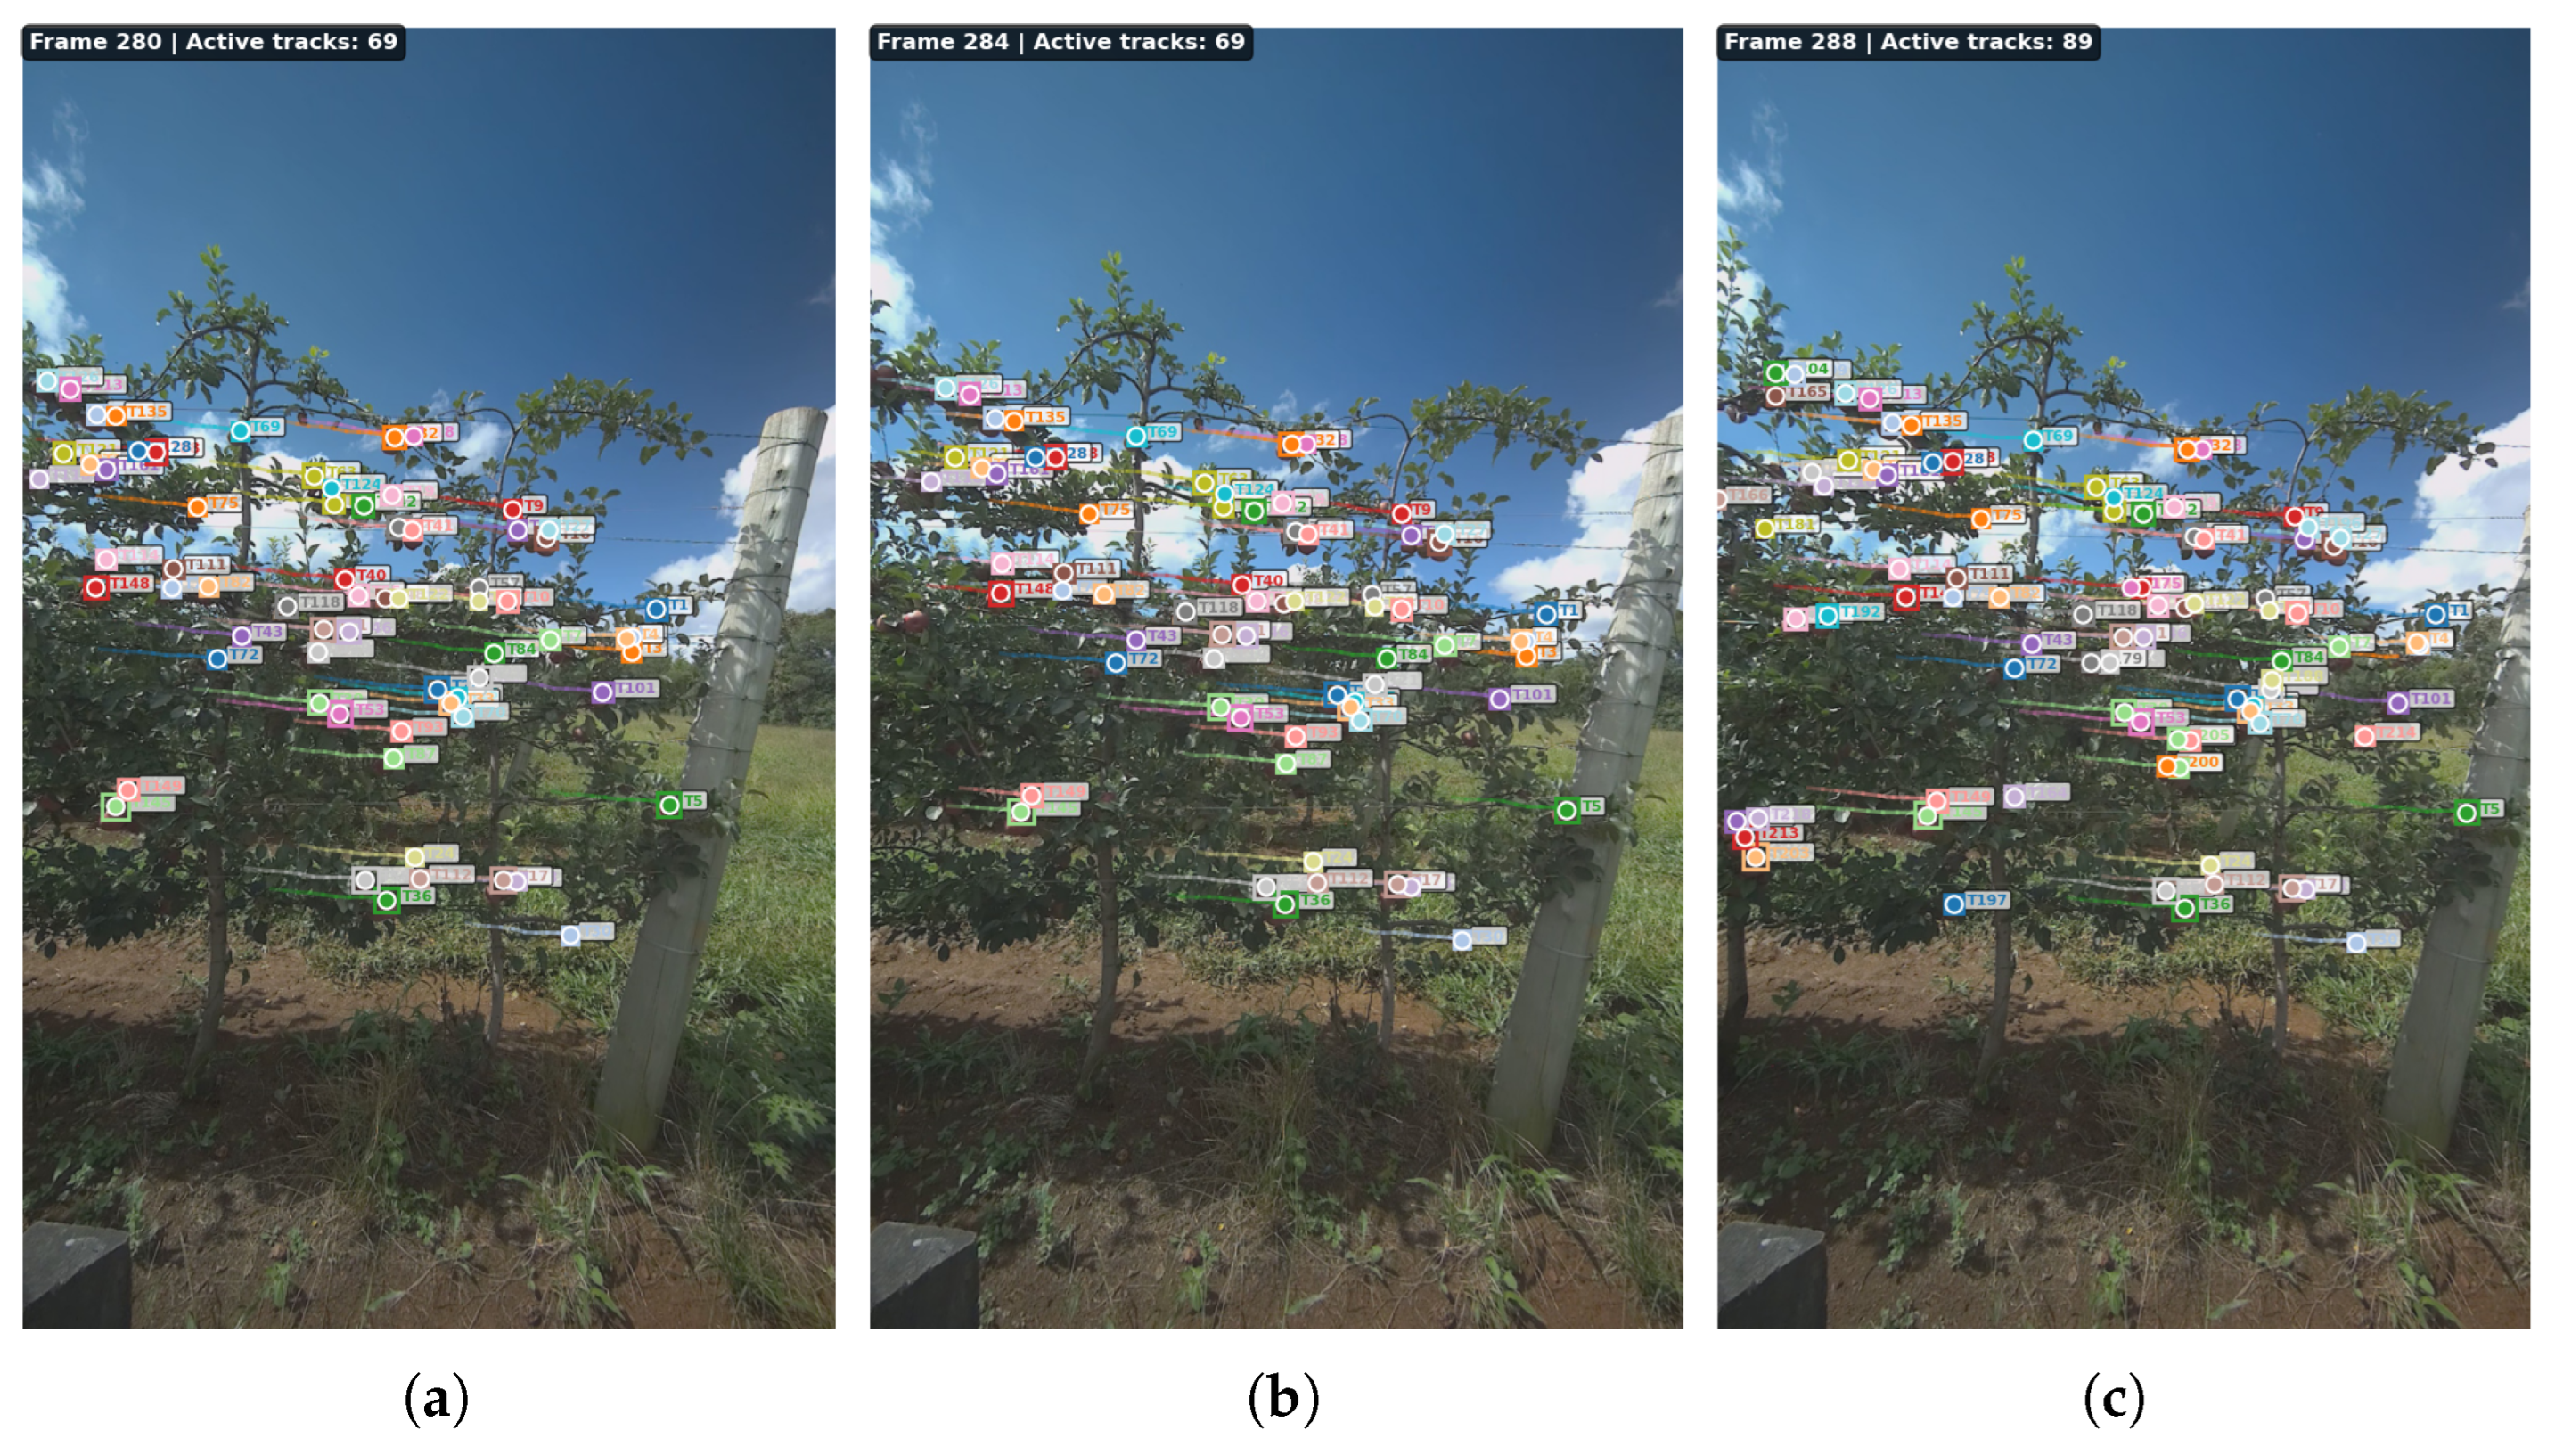
Figure 4 above provides a qualitative illustration of the tracking behavior in a representative orchard segment.
Figure 4a–c show the CoTracker3 outputs of the ZED left camera images with projected tracks and persistent apple IDs. The visualization highlights that CoTracker3 maintains identity continuity across successive frames despite dense fruit clusters, partial occlusions, and appearance similarity, thereby providing longer and cleaner trajectories for triangulation and SLAM back-end refinement.
3.8. 3D Reconstruction by Multi-View Triangulation
Given a track , we estimate a single 3D apple center in WORLD coordinates using multi-view triangulation under fused GNSS-VIO poses. It is important to note that the present reconstruction is not obtained from a single-frame stereo depth value assigned independently to each detection. Instead, each apple center is estimated by pose-based multi-view triangulation from tracked 2D observations across multiple frames. As a result, geometric reliability at larger camera–fruit distances is controlled through multi-view conditioning rather than raw stereo disparity alone, and weak configurations are subsequently filtered by cheirality, reprojection gating, parallax thresholding, and a maximum camera–fruit distance constraint.
3.8.1. Linear Multi-View Triangulation (DLT)
For each observation
, the homogeneous triangulation constraints are
Stacking constraints over frames
yields
The solution is obtained from the right-singular vector corresponding to the smallest singular value:
and dehomogenization yields
.
3.8.2. Cheirality Constraint
For frame
t, the 3D point in camera coordinates is
and we enforce
in inlier views to ensure the point lies in front of the camera.
3.8.3. Reprojection Error
The reprojection of
into frame
t yields
via Equation (
10). The reprojection error is
3.8.4. Robust Triangulation via RANSAC and Geometric Gating
To mitigate outliers induced by tracking jitter and partial occlusions, we apply RANSAC over minimal subsets of views. For a hypothesis
, the inlier set is
where
pixels. We perform RANSAC iterations, retain the hypothesis maximizing
, and re-triangulate using all inliers.
3.8.5. Parallax (Baseline) Quality Filtering
Triangulation becomes ill-conditioned under small baselines. For frames
, define viewing rays
and parallax
We retain reconstructions only if
with
.
3.9. SLAM Refinement via iSAM2 Incremental Bundle Adjustment
Although ZED Fusion yields a geo-referenced trajectory, long orchard traversals with turns, partial occlusions, and repeated structure can still introduce residual geometric inconsistency between camera poses, 2D observations, and triangulated 3D landmarks.
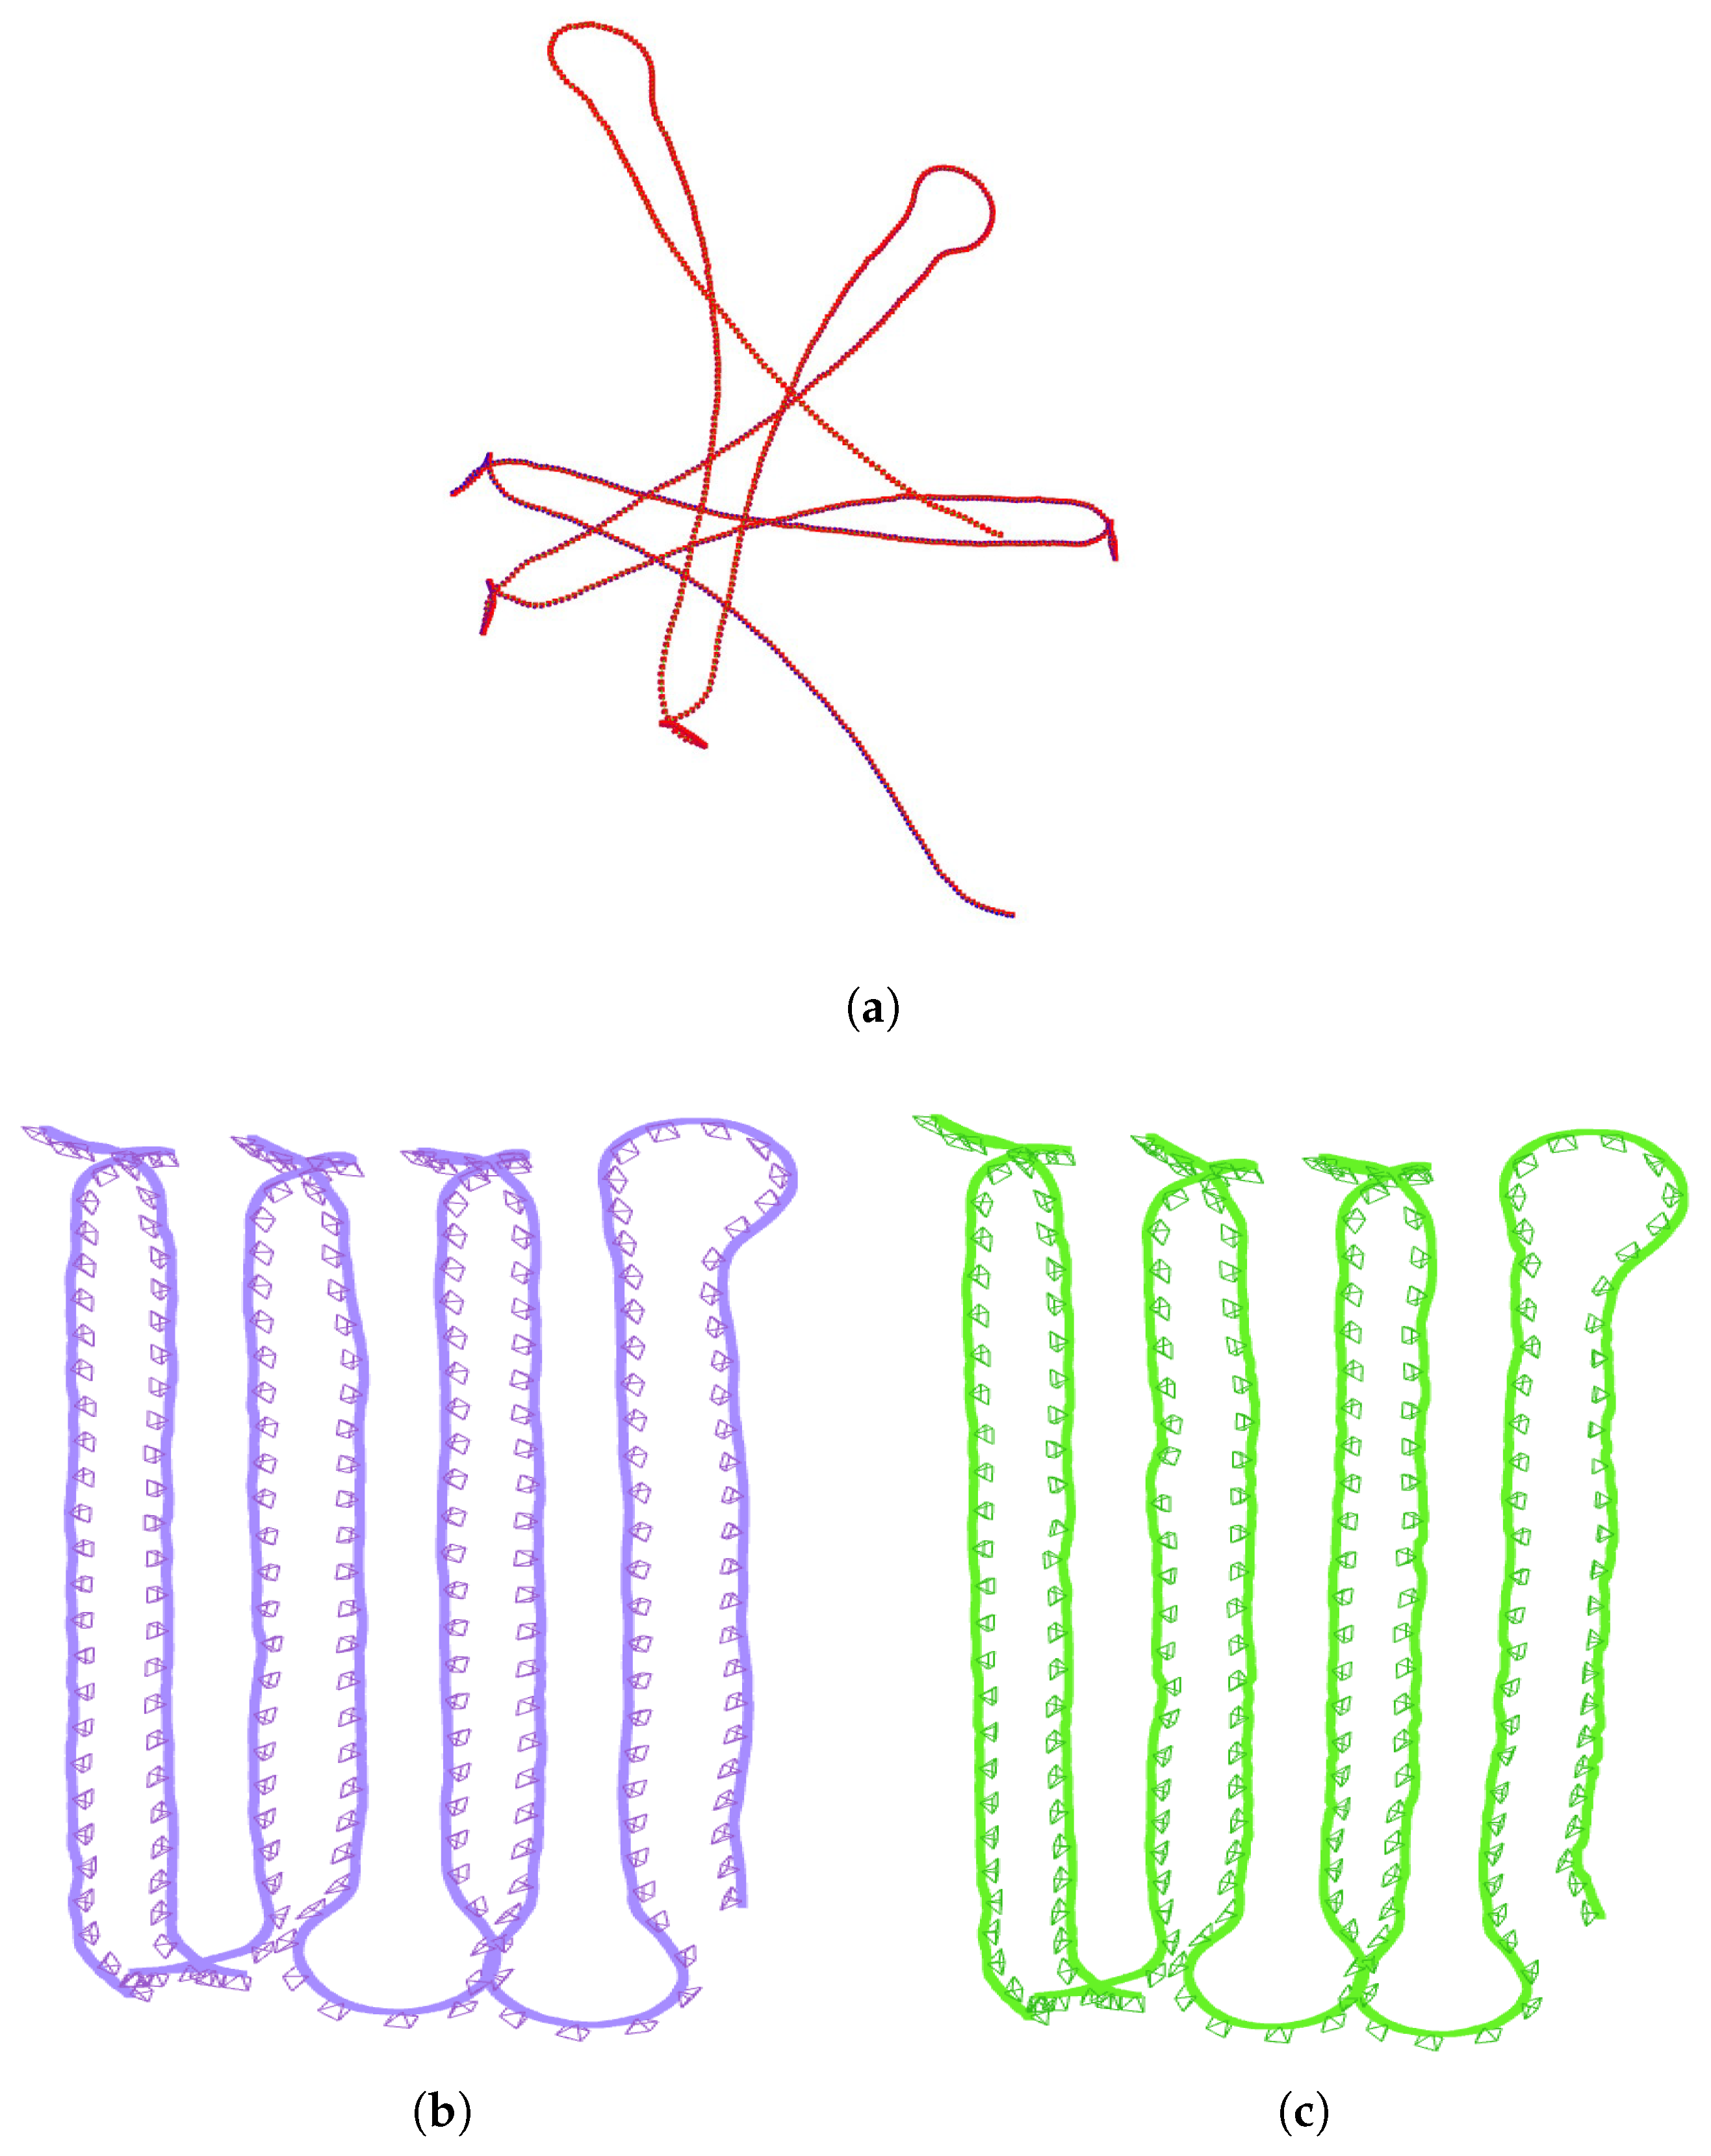
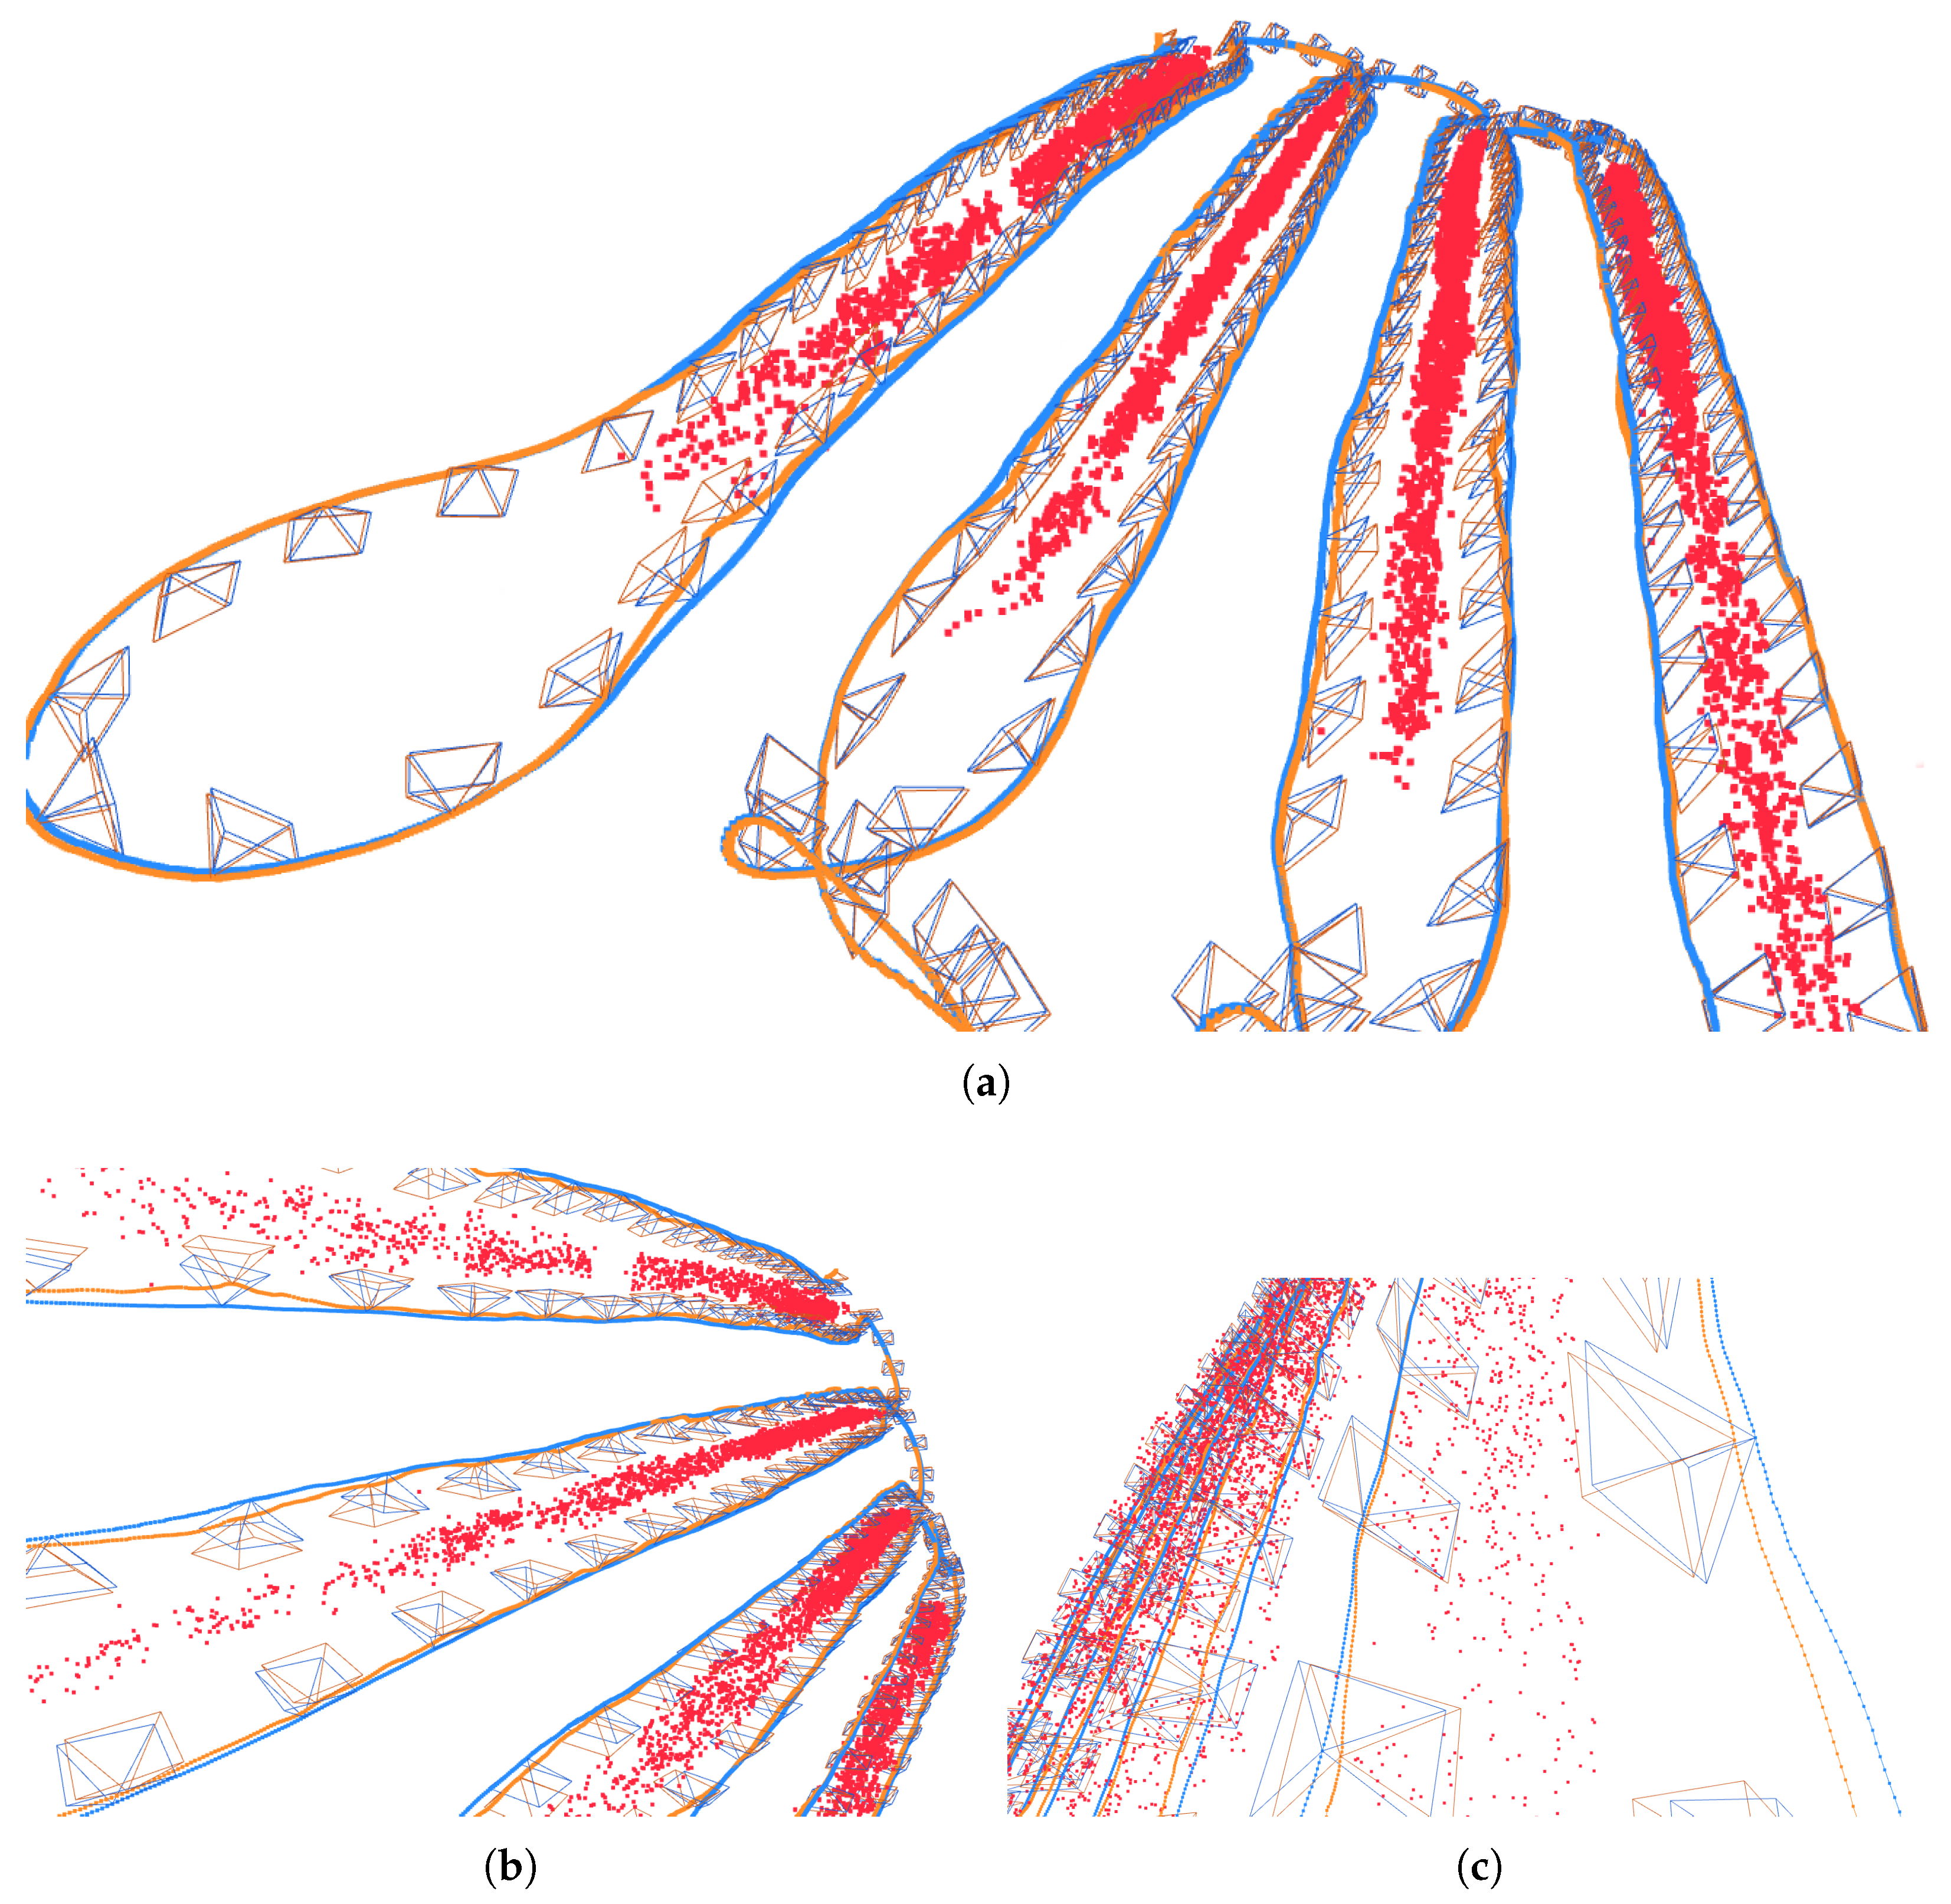
Figure 5 below illustrates the effect of successive levels of refinement on the estimated trajectory.
Figure 5a shows the complete orchard path obtained using only visual–inertial odometry, which exhibits substantial drift.
Figure 5b shows the trajectory after GNSS fusion, which is geo-referenced but still contains enough residual geometric error to produce noticeable reprojection inconsistency over long traversals.
To better understand this error, consider an apple detected in an image. The detector provides its image location in pixels, here approximated by the center of the bounding box. Using the estimated camera pose and the reconstructed 3D landmark position, this 3D apple can be projected back onto the image plane. If the projected pixel location does not coincide with the detected pixel location, the difference is called the reprojection error. Although it is measured in image pixels, its geometric effect can be much larger in 3D space: a small angular error at the camera can correspond to several centimeters, or even tens of centimeters, of spatial displacement when the fruit is several meters away. Over long orchard traversals, these errors accumulate and degrade the global consistency of both the trajectory and the reconstructed apple landmarks.
Figure 5c shows the refined poses after optimization, resulting in a more accurate and globally consistent orchard representation. We therefore refine the joint solution using incremental bundle adjustment based on iSAM2, which we treat as the SLAM back-end of our system: the front-end provides data association (tracks) and initial geometry (triangulated landmarks), while the back-end enforces global consistency through multi-view reprojection constraints, relative-motion constraints, and soft geo-referenced pose priors.
3.9.1. SLAM Formulation: States, Measurements, and Factor Graph
Let
denote camera poses and
denote 3D apple landmarks, both expressed in the fused geo-referenced
WORLD frame
W. The SLAM state is
The measurement set consists of:
- 1.
2D landmark observations
obtained from the tracked detection centers (
Section 3.6);
- 2.
relative-motion constraints between consecutive poses, derived from the fused/raw trajectory;
- 3.
absolute ENU-derived translation priors associated with each pose, obtained from the geo-referenced ZED Fusion trajectory.
Each observation
yields a reprojection constraint
where
is the pinhole projection (Equation (
10)),
are camera intrinsics, and
. Defining the residual
the reprojection cost is
where
is the set of valid track observations and
is the image-space noise covariance.
In addition, the relative motion between consecutive poses is constrained using strong between-pose factors. If
denotes the relative motion measurement between poses
t and
, the corresponding residual is
which preserves local trajectory consistency.
Finally, each pose is softly constrained by an ENU-derived absolute translation prior. Let
denote the ENU translation associated with pose
t from the fused geo-referenced trajectory. Then the prior residual may be written as
where
is the translation component of
. In implementation, this is applied as a pose prior with a very large rotational covariance, so that the prior acts effectively as a soft translation-only constraint. Because the ENU term is not enforced as a hard positional constraint, the optimizer can rely more heavily on the between-pose relative-motion factors and the dense reprojection constraints when the geo-referenced measurements become locally less reliable. Consequently, the factor graph does not eliminate GNSS degradation altogether, but it reduces the propagation of such errors by balancing global translation cues with local geometric consistency.
In addition, each initialized landmark is associated with a prior centered at its DLT-based initialization, which stabilizes the optimization and limits large deviations for sparsely observed landmarks.
Robustness to outliers is handled using a Huber loss on the reprojection factors, which reduces the influence of imperfect detections, tracking jitter, and partial occlusions. In the implementation used for the reported experiments, the Huber parameter is set to . The ENU translation priors and the first-pose gauge prior are modeled as Gaussian pose priors; robust ENU priors can also be used when required.
The resulting graph is therefore a coupled pose–landmark factor graph in which pose nodes
and landmark nodes
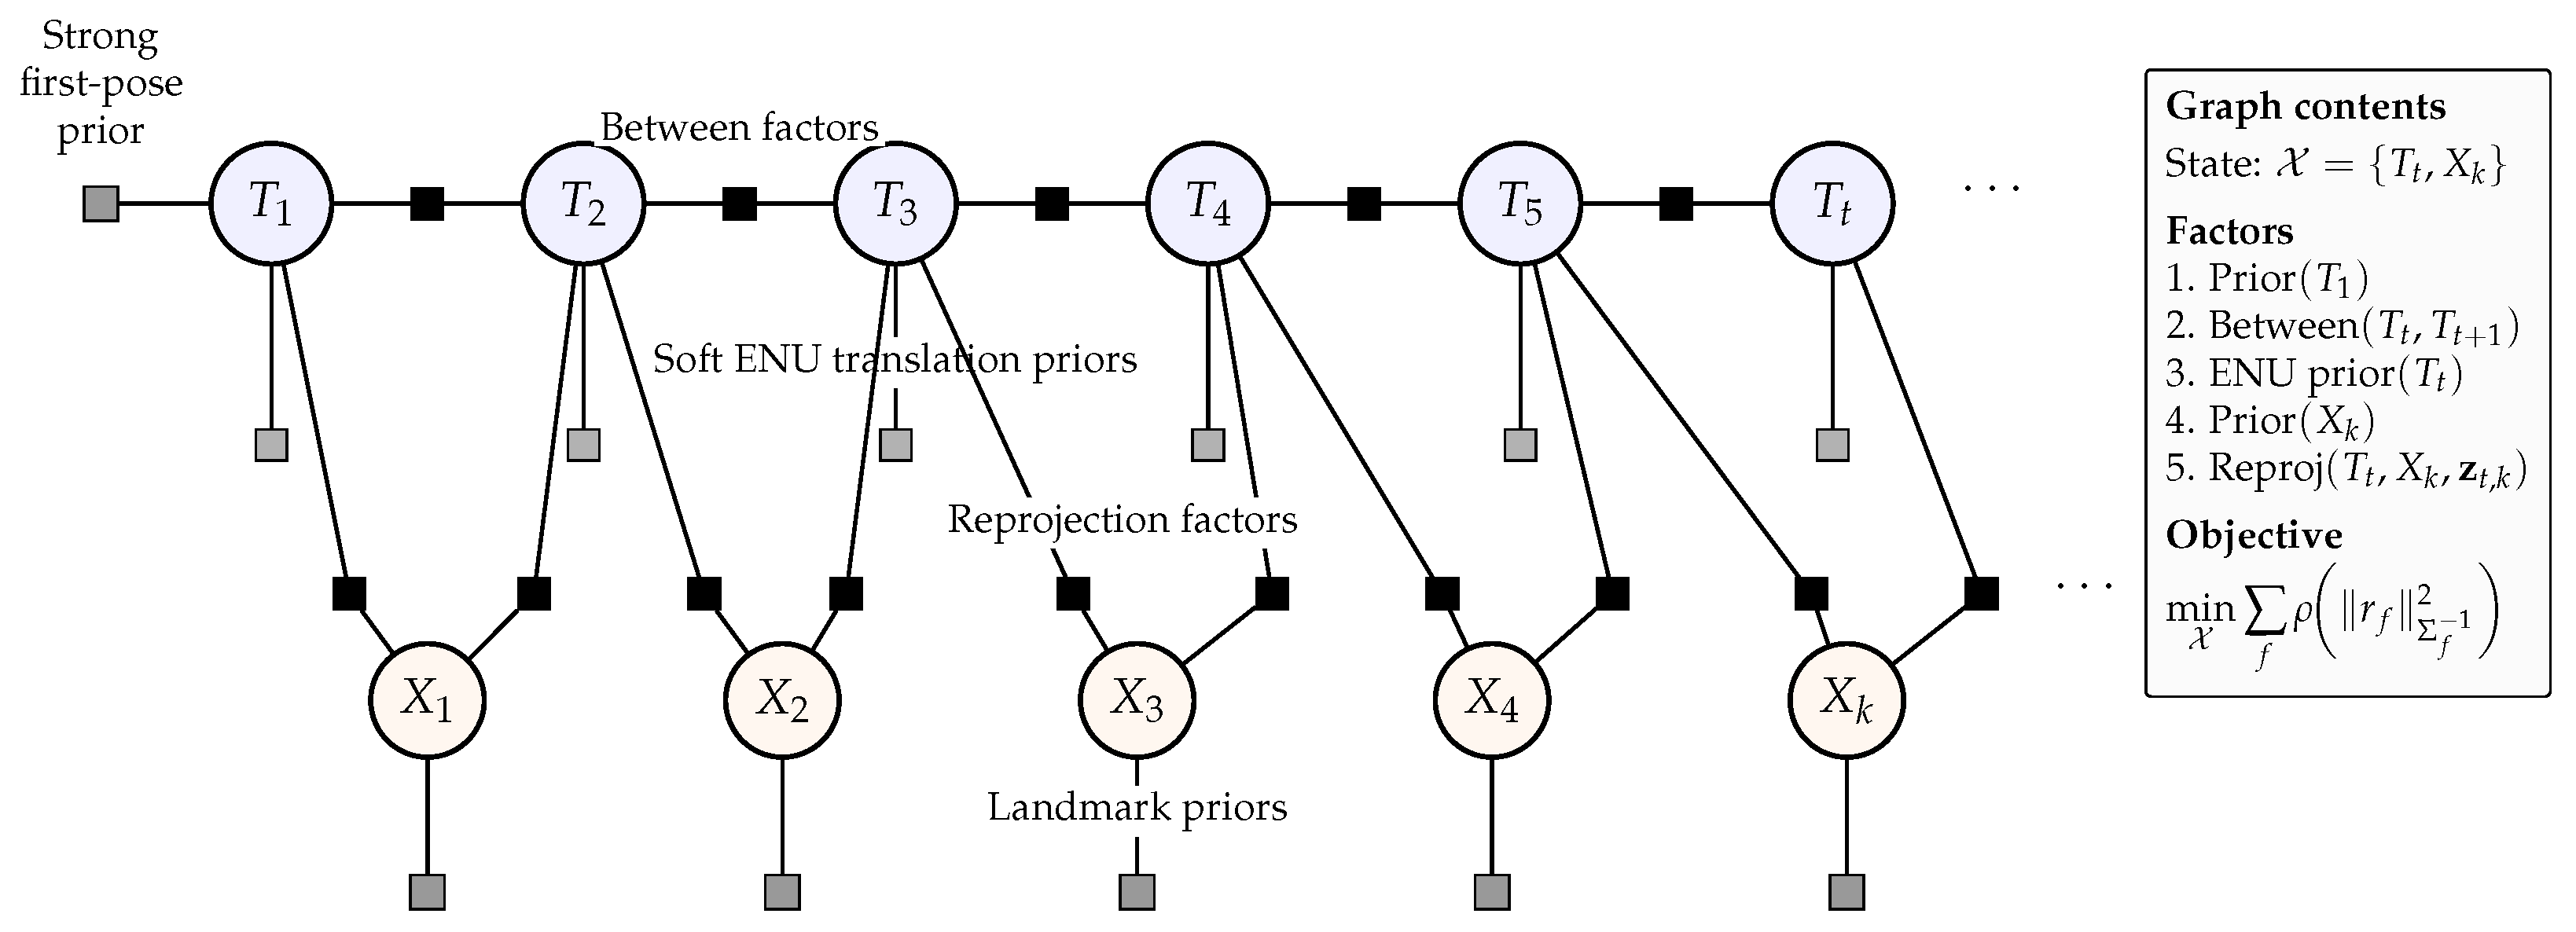
are connected by reprojection factors, pose nodes are linked to one another by relative-motion factors, and each pose is also associated with a soft ENU translation prior. In our setting, this graph is highly observation-rich because apples are tracked across many frames, producing multiple constraints per landmark. In
Figure 6 above, we show a part of the factor graph with the variables and factors along with the generalised objective, where,
is the residual associated with factor
f and
is its covariance matrix. The function
denotes an optional robust loss, for example, Huber loss for reprojection factors in our case.
3.9.2. Front-End/Back-End SLAM Coupling in Our Pipeline
Our overall system follows a classical SLAM decomposition:
Front-end (data association and initialization): YOLOv9 detects apples; CoTracker3 produces temporally consistent tracks
; each track is initialized as a 3D landmark via robust multi-view triangulation (
Section 3.8) subject to cheirality, reprojection gating, and parallax constraints. These steps provide both the measurement correspondences
and an initial
.
Back-end (global consistency/bundle adjustment): iSAM2 refines and jointly by minimizing the combined reprojection, relative-motion, and ENU-prior objective, thereby improving global consistency across long sequences and turns.
This coupling is particularly suitable for orchards: the visual scene is highly repetitive, with similar foliage, fruit appearance, and row structure, so robust association is essential. Once stable correspondences are available, global reprojection consistency becomes a strong geometric cue that can correct residual local drift accumulated by the front-end trajectory estimate.
3.9.3. Incremental Optimization with iSAM2
Direct batch bundle adjustment over all poses and landmarks scales poorly with orchard-length trajectories. iSAM2 performs incremental smoothing and mapping by updating the solution as new variables and factors are introduced.
Given a current estimate
, each nonlinear factor residual is linearized around
:
where
is a perturbation in the tangent space of the state (poses in
and landmarks in
), and
is the Jacobian of the projection residual with respect to the connected variables. Stacking all linearized factors yields the sparse least-squares problem
whose sparsity directly reflects the factor graph topology.
iSAM2 maintains a Bayes tree representation of this factorization and performs localized relinearization and partial re-factorization whenever new factors are introduced. In our pipeline, each new frame contributes:
a new pose node initialized from ZED Fusion,
strong relative-motion factors linking to adjacent poses,
a soft ENU-derived translation prior associated with ,
reprojection factors connecting to existing landmarks,
and, when a new apple track is created and passes the geometric checks, a new landmark node with its associated reprojection factors.
This incremental update pattern corresponds to online SLAM: mapping (landmark refinement) and smoothing (pose refinement) proceed together as observations arrive.
3.9.4. Geo-Referenced Anchoring and Gauge Handling
Bundle adjustment is defined up to a gauge freedom unless explicitly anchored. In our graph, this is handled by applying a strong prior to the first pose, which fixes the reference frame of the optimization. This gauge prior serves a different purpose from the ENU priors and the relative-motion constraints. The first-pose prior removes the global ambiguity of the optimization, the relative-motion factors preserve local trajectory consistency, and the soft ENU translation priors provide global positional guidance throughout the trajectory. Together, these constraints ensure that the refined solution remains in the same geo-referenced coordinate frame used for orchard mapping outputs.
3.9.5. Practical Role of SLAM Refinement in Orchard-Scale Reconstruction
In the proposed pipeline, iSAM2 refinement acts as a consistency-enforcing back-end that:
reduces accumulated multi-view inconsistency between the fused trajectory and track-derived 2D measurements,
stabilizes landmark positions by exploiting repeated observations across multiple frames,
improves turn segments by globally distributing reprojection corrections across connected poses and landmarks,
reduces the effect of residual geo-referencing drift through soft ENU translation priors on each pose,
and produces a refined, globally coherent set of poses and apple landmarks used for counting, density mapping, and yield estimation.
The refined solution is then used as the basis for all downstream orchard analytics reported in
Section 4.
3.10. Geo-Referencing, Outputs, and Yield Proxy
Because reconstruction is performed in the fused geo-referenced
WORLD frame, the final 3D apple landmarks can be exported directly to mapping formats (ENU/ECEF/LLA and KML) and visualized in GIS software. After triangulation and iSAM2 refinement, the orchard-level apple count is
In addition to count, we report a size-derived yield proxy by converting reconstructed radii to volume and mass.
The radius
of the
k-th apple is estimated from its multi-view 2D observations and the optimized 3D geometry. For each observing frame
i, let
and
denote the detected bounding-box width and height in pixels, and let
denote the depth of the reconstructed landmark in the camera frame, obtained from the optimized pose and landmark geometry. Using the pinhole camera model, the apparent metric diameter is estimated separately along the image
x- and
y-directions as
where
and
are the focal lengths in pixels. The per-view diameter estimate is then computed as
and the corresponding per-view radius is
Because each apple is typically observed in multiple frames, the final radius
is obtained as the median of the per-view radius estimates over the selected top views with the largest bounding boxes, which correspond to the most reliable close-range observations:
This yields a robust multi-view radius estimate for each reconstructed apple, which is then used to compute its spherical volume. We use 15 views of each apple in our work, ensuring highly precise radius calculations.
The volume is given as,
and using a bulk density
(kg/m
3), the mass estimate is
yielding the orchard-scale estimate
To obtain a dataset-specific nominal bulk density for the mass proxy, we calibrate
using reference measurement of diameter
cm and mass
g. Under the spherical approximation,
, yielding
We report orchard-scale mass using this calibrated density as the nominal value, and additionally provide a sensitivity interval
kg/m
3 to reflect variability due to cultivar, maturity, and the spherical-shape approximation.
3.11. Implementation Details and Hyperparameters
The complete pipeline can be run on a Jetson AGX Orin, running Linux 35.4.1, using Python 3.10, ZED SDK 5.1.1, and CoTracker3. Images are acquired at 1920 × 1200 pixels and 30 fps. GNSS measurements are logged at 5 Hz. We mention the key hyper-parameters of our pipeline in
Table 2 below.
4. Results
This section reports quantitative and qualitative outcomes of the proposed orchard-scale reconstruction pipeline with iSAM2 refinement. We emphasize (i) reconstruction and optimization behavior at scale, (ii) reprojection consistency before and after optimization, (iii) the magnitude and structure of pose corrections, and (iv) downstream geo-referenced aggregation for orchard-level counting and yield-proxy estimation.
4.1. Reconstruction and Optimization Overview
The full optimization was executed over camera poses and triangulated apple landmarks initialized from multi-frame 2D tracks. From candidate tracks (minimum track length frames, minimum triangulation observations ), a total of 9739 landmarks were successfully initialized by DLT under a reprojection gating threshold of 10 px. The resulting factor graph contained reprojection factors, forming a dense, observation-rich bundle adjustment problem at orchard scale.
After optimization, the 3D reconstruction remained spatially coherent and visually consistent with orchard structure. For qualitative verification, we rendered the refined camera trajectory and landmark cloud in Open3D and applied a maximum camera-to-landmark distance filter of 5 m to remove far-range reconstructions with limited parallax support. This retained 9738 landmarks and produced a stable landmark distribution across the traversed rows.
Figure 7 shows the refined reconstruction from multiple viewpoints.
Figure 7a provides a global overview of the orchard traversal, where the refined trajectory is visually smooth and the landmarks align along the row structure.
Figure 7b highlights a spatial gap in the reconstructed landmark distribution that corresponds to an actual gap in fruit presence along the scanned row, indicating that the reconstruction preserves meaningful orchard-level structure rather than producing a uniformly dense artifact cloud.
Figure 7c provides a closer view of the landmarks and the camera pose frustums.
4.2. Reprojection Consistency Before and After iSAM2 Refinement
Reprojection error provides a direct measure of multi-view geometric consistency between estimated poses, triangulated 3D landmarks, and the underlying 2D measurements. Prior to iSAM2 refinement (i.e., using the ENU-aligned pose initialization and DLT landmark initialization), the reprojection residual distribution was heavy-tailed:
A total of
of residuals exceeded 5 px and
exceeded 10 px. These statistics indicate that although landmark initialization succeeded at scale, the initial joint pose–landmark configuration contained substantial inconsistency, which is expected for long orchard traversals with turns, partial occlusions, and association noise.
After iSAM2 optimization over pose and landmark variables, reprojection residuals were substantially reduced, with a pronounced improvement in the tail:
The proportion of residuals above 10 px decreased to
(from
), while the fraction above 5 px decreased to
. Qualitatively, this improvement corresponds to a reconstruction in which landmarks are more consistently supported across views and the refined trajectory yields tighter agreement between tracked 2D measurements and projected 3D landmarks.
To localize remaining failure modes, we inspected frames with the highest median reprojection error. The worst frames were concentrated around a small set of frame ID ranges (e.g., –9900 and –7825), suggesting localized segments with degraded tracking geometry, reduced landmark support, and/or rapid viewpoint change (consistent with turn and maneuver segments).
4.3. Pose Correction Magnitude and Internal Consistency
To quantify how strongly the refined solution deviates from the ZED Fusion initialization, we measured pose deltas between optimized and initial poses. Across all
poses, iSAM2 applied moderate but non-negligible corrections:
The largest corrections were concentrated near the end of the trajectory (e.g.,
= 11,310–11,319), reaching ∼1.27 m and ∼23.5°. This behavior indicates that the optimizer redistributed accumulated inconsistency across the graph, correcting segments where the initial solution was weakly constrained or affected by drift and association noise.
Importantly, the refined solution remained consistent with local motion constraints. Between-residuals (optimized vs. raw between-measurements) were small:
and normalized residuals (residual/
) remained well-behaved (means
), with worst-case edges remaining below
. This indicates that iSAM2 improved global multi-view consistency primarily through reprojection-driven adjustments while preserving locally smooth motion implied by sequential constraints.
4.4. Orchard-Scale Apple Counting Against Ground Truth
Using the finalized landmark set after geometric filtering and iSAM2 refinement, we compared the total predicted apple count against the orchard ground-truth total. The pipeline produced landmarks versus apples, corresponding to an absolute error of 246 apples and an aggregate undercount of . The ground-truth value is established by physically harvesting the scanned orchard block and manually counting all collected fruits, thereby providing a directly measured reference for quantitative comparison. This result demonstrates that, at the orchard-block scale and under a single continuous scan with turns and strong viewpoint changes, the proposed system provides a close estimate of total fruit cardinality while simultaneously producing a geo-referenced 3D landmark map suitable for downstream orchard analytics.
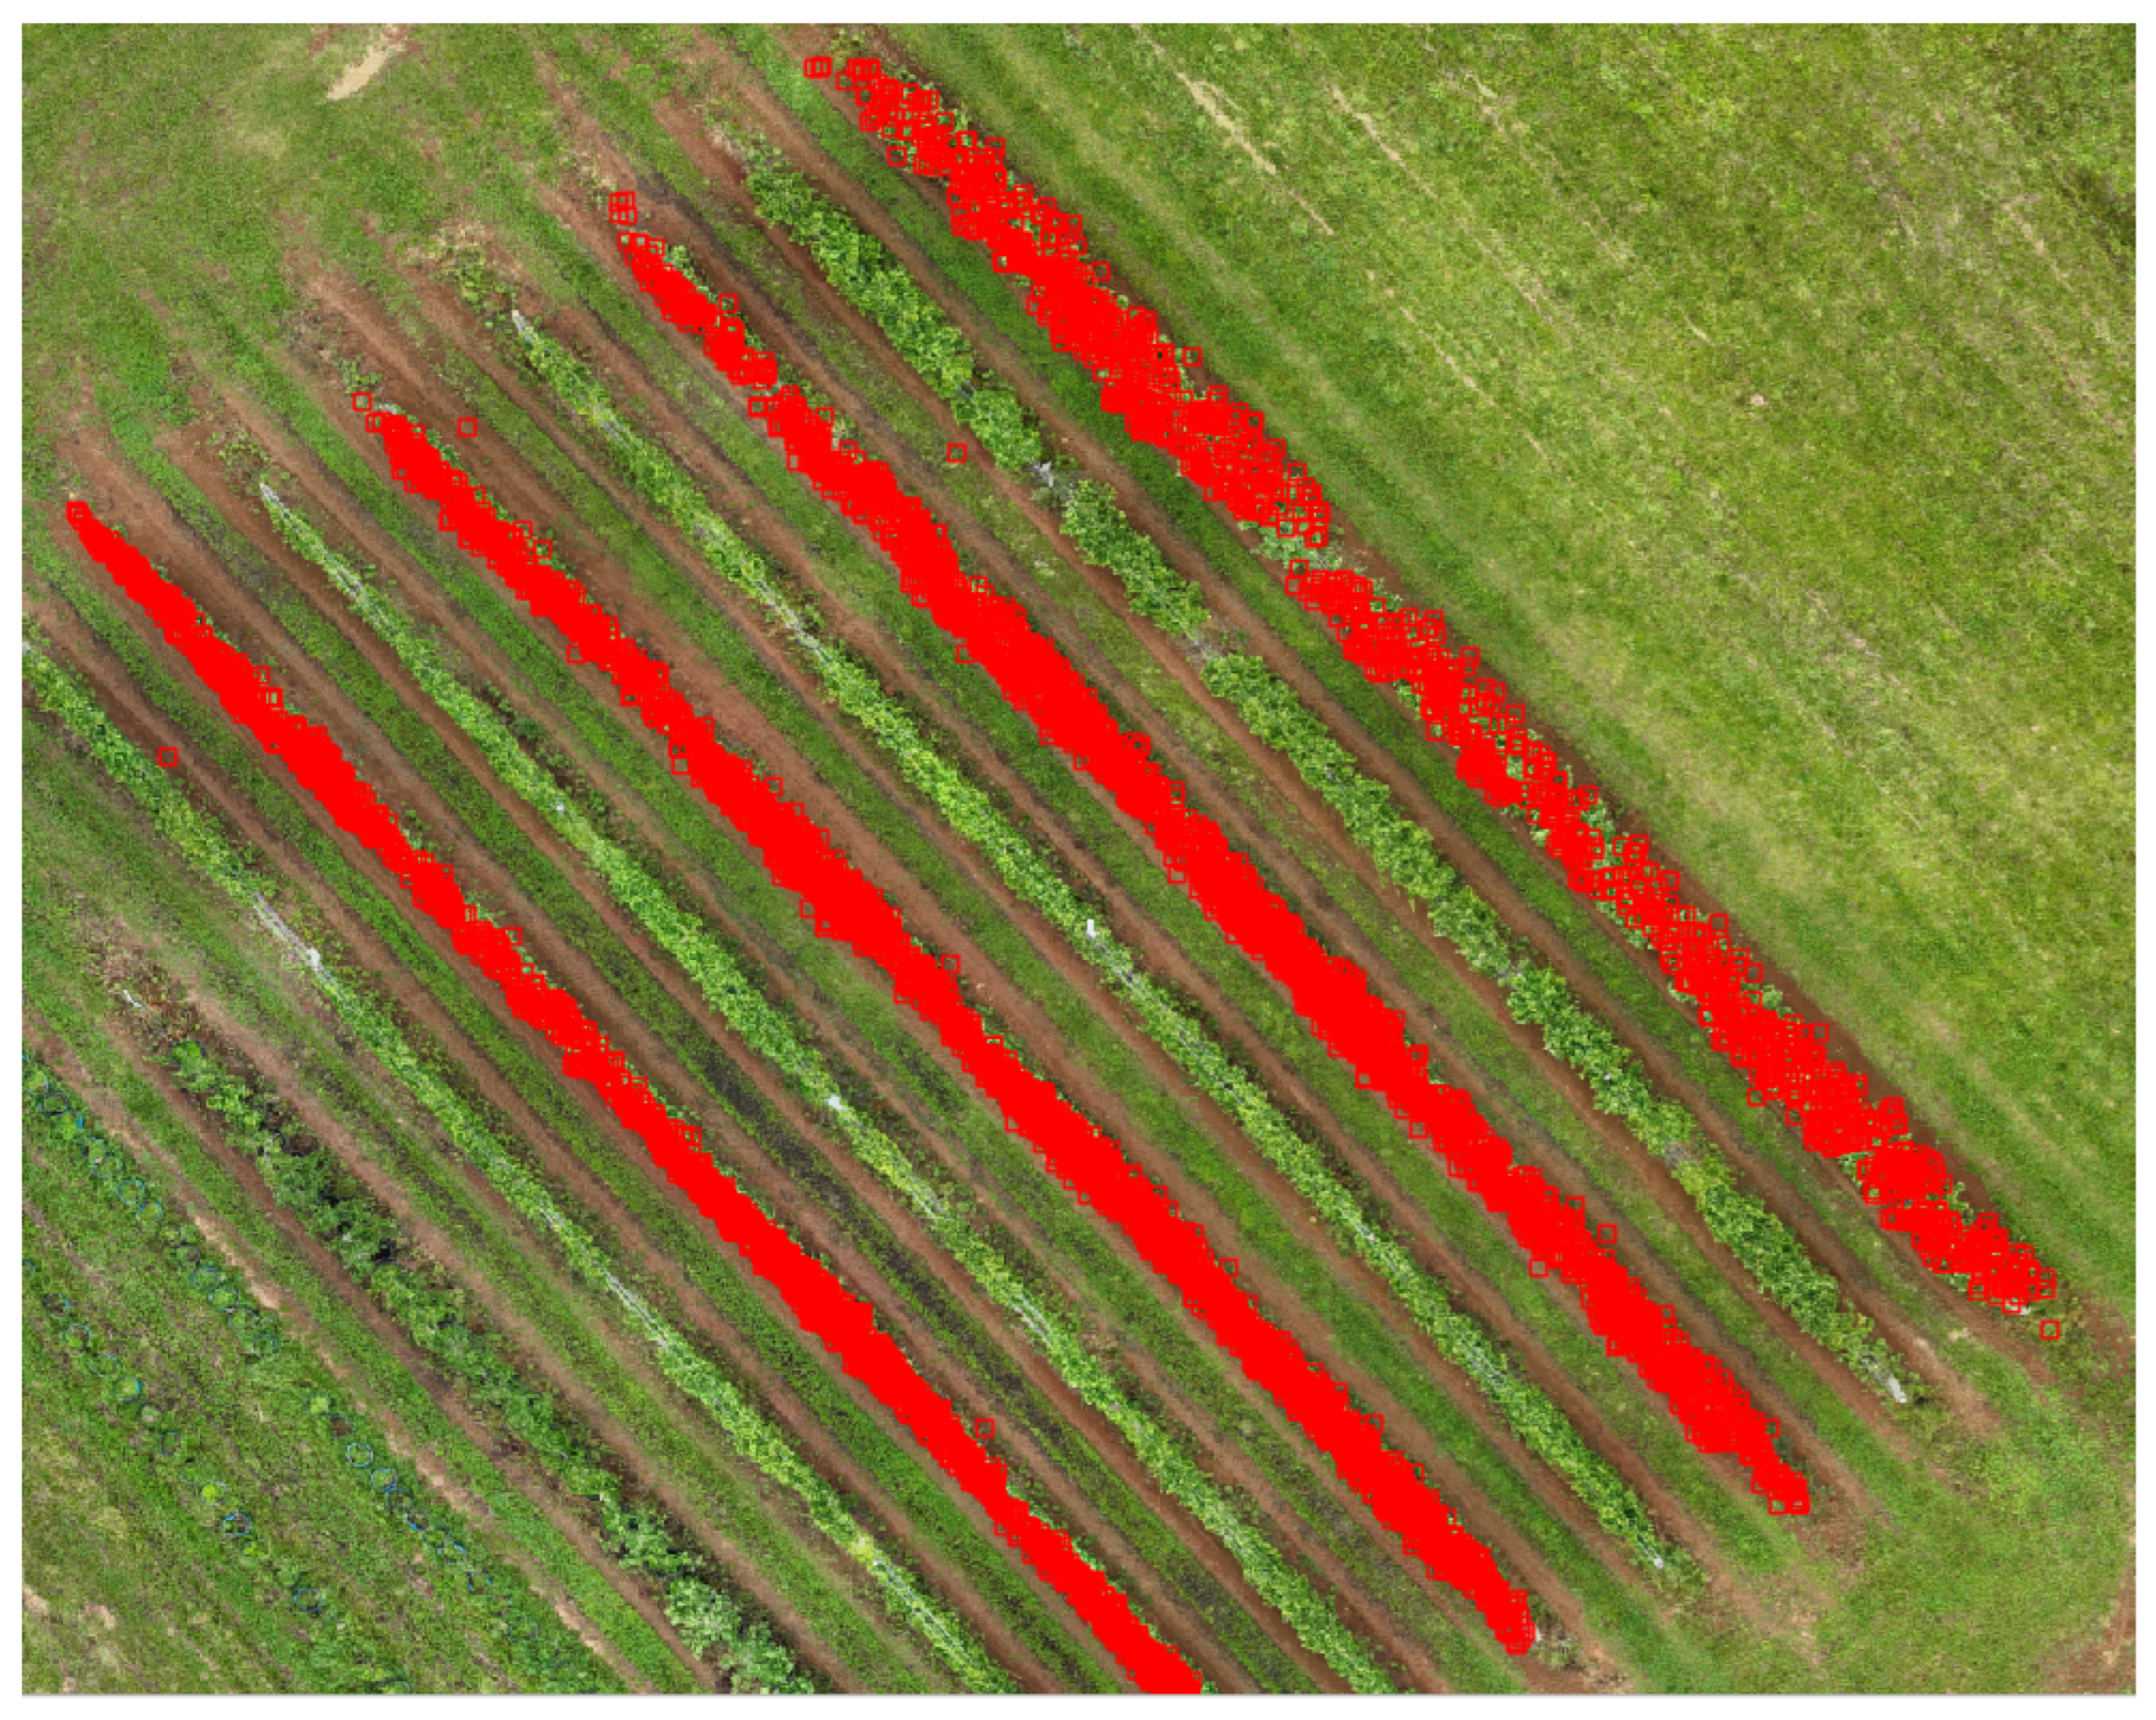
Figure 8 above shows the top-down geo-referenced distribution of the reconstructed apples in QGIS. The aligned rows and the spatial continuity of apple points indicate that the refined pose and landmark solution is consistent with the orchard layout. Qualitatively, the plot also preserves meaningful local structure: for example, in the final row on the right side of the map, a visible gap in the apple distribution coincides with the ground truth where two consecutive trees had no apples, providing qualitative evidence that the reconstruction captures spatial variations in fruit presence rather than producing a homogeneous distribution.
To characterize how counting error is distributed, we report a row-level breakdown in
Appendix A.1.
Row-wise counting bias is influenced not only by perception and geometry, but also by orchard architecture. Training systems alter canopy depth and fruit exposure [
43,
44,
45]. In our dataset, the final scanned row is trained under a different and denser configuration, which increases self-occlusion and reduces the number of frames in which fruits remain visible with sufficient parallax for stable tracking and triangulation. This provides a field-consistent explanation for the stronger undercount observed for that row in
Appendix A.1, relative to the other scanned rows. These factors are consistent with the spatial distribution seen in
Figure 8.
4.5. Geo-Referenced Apple Density Mapping and Size-Derived Yield Proxy
A key outcome of the proposed pipeline is that each detected-and-tracked apple is reconstructed as a geo-referenced 3D landmark in the fused WORLD frame, enabling orchard-scale spatial products in addition to counting. Specifically, the refined landmark set supports: (i) a spatial density map of fruit occurrence and (ii) a size-derived yield proxy obtained from reconstructed fruit radii.
4.5.1. Geo-Referenced Apple Density Map
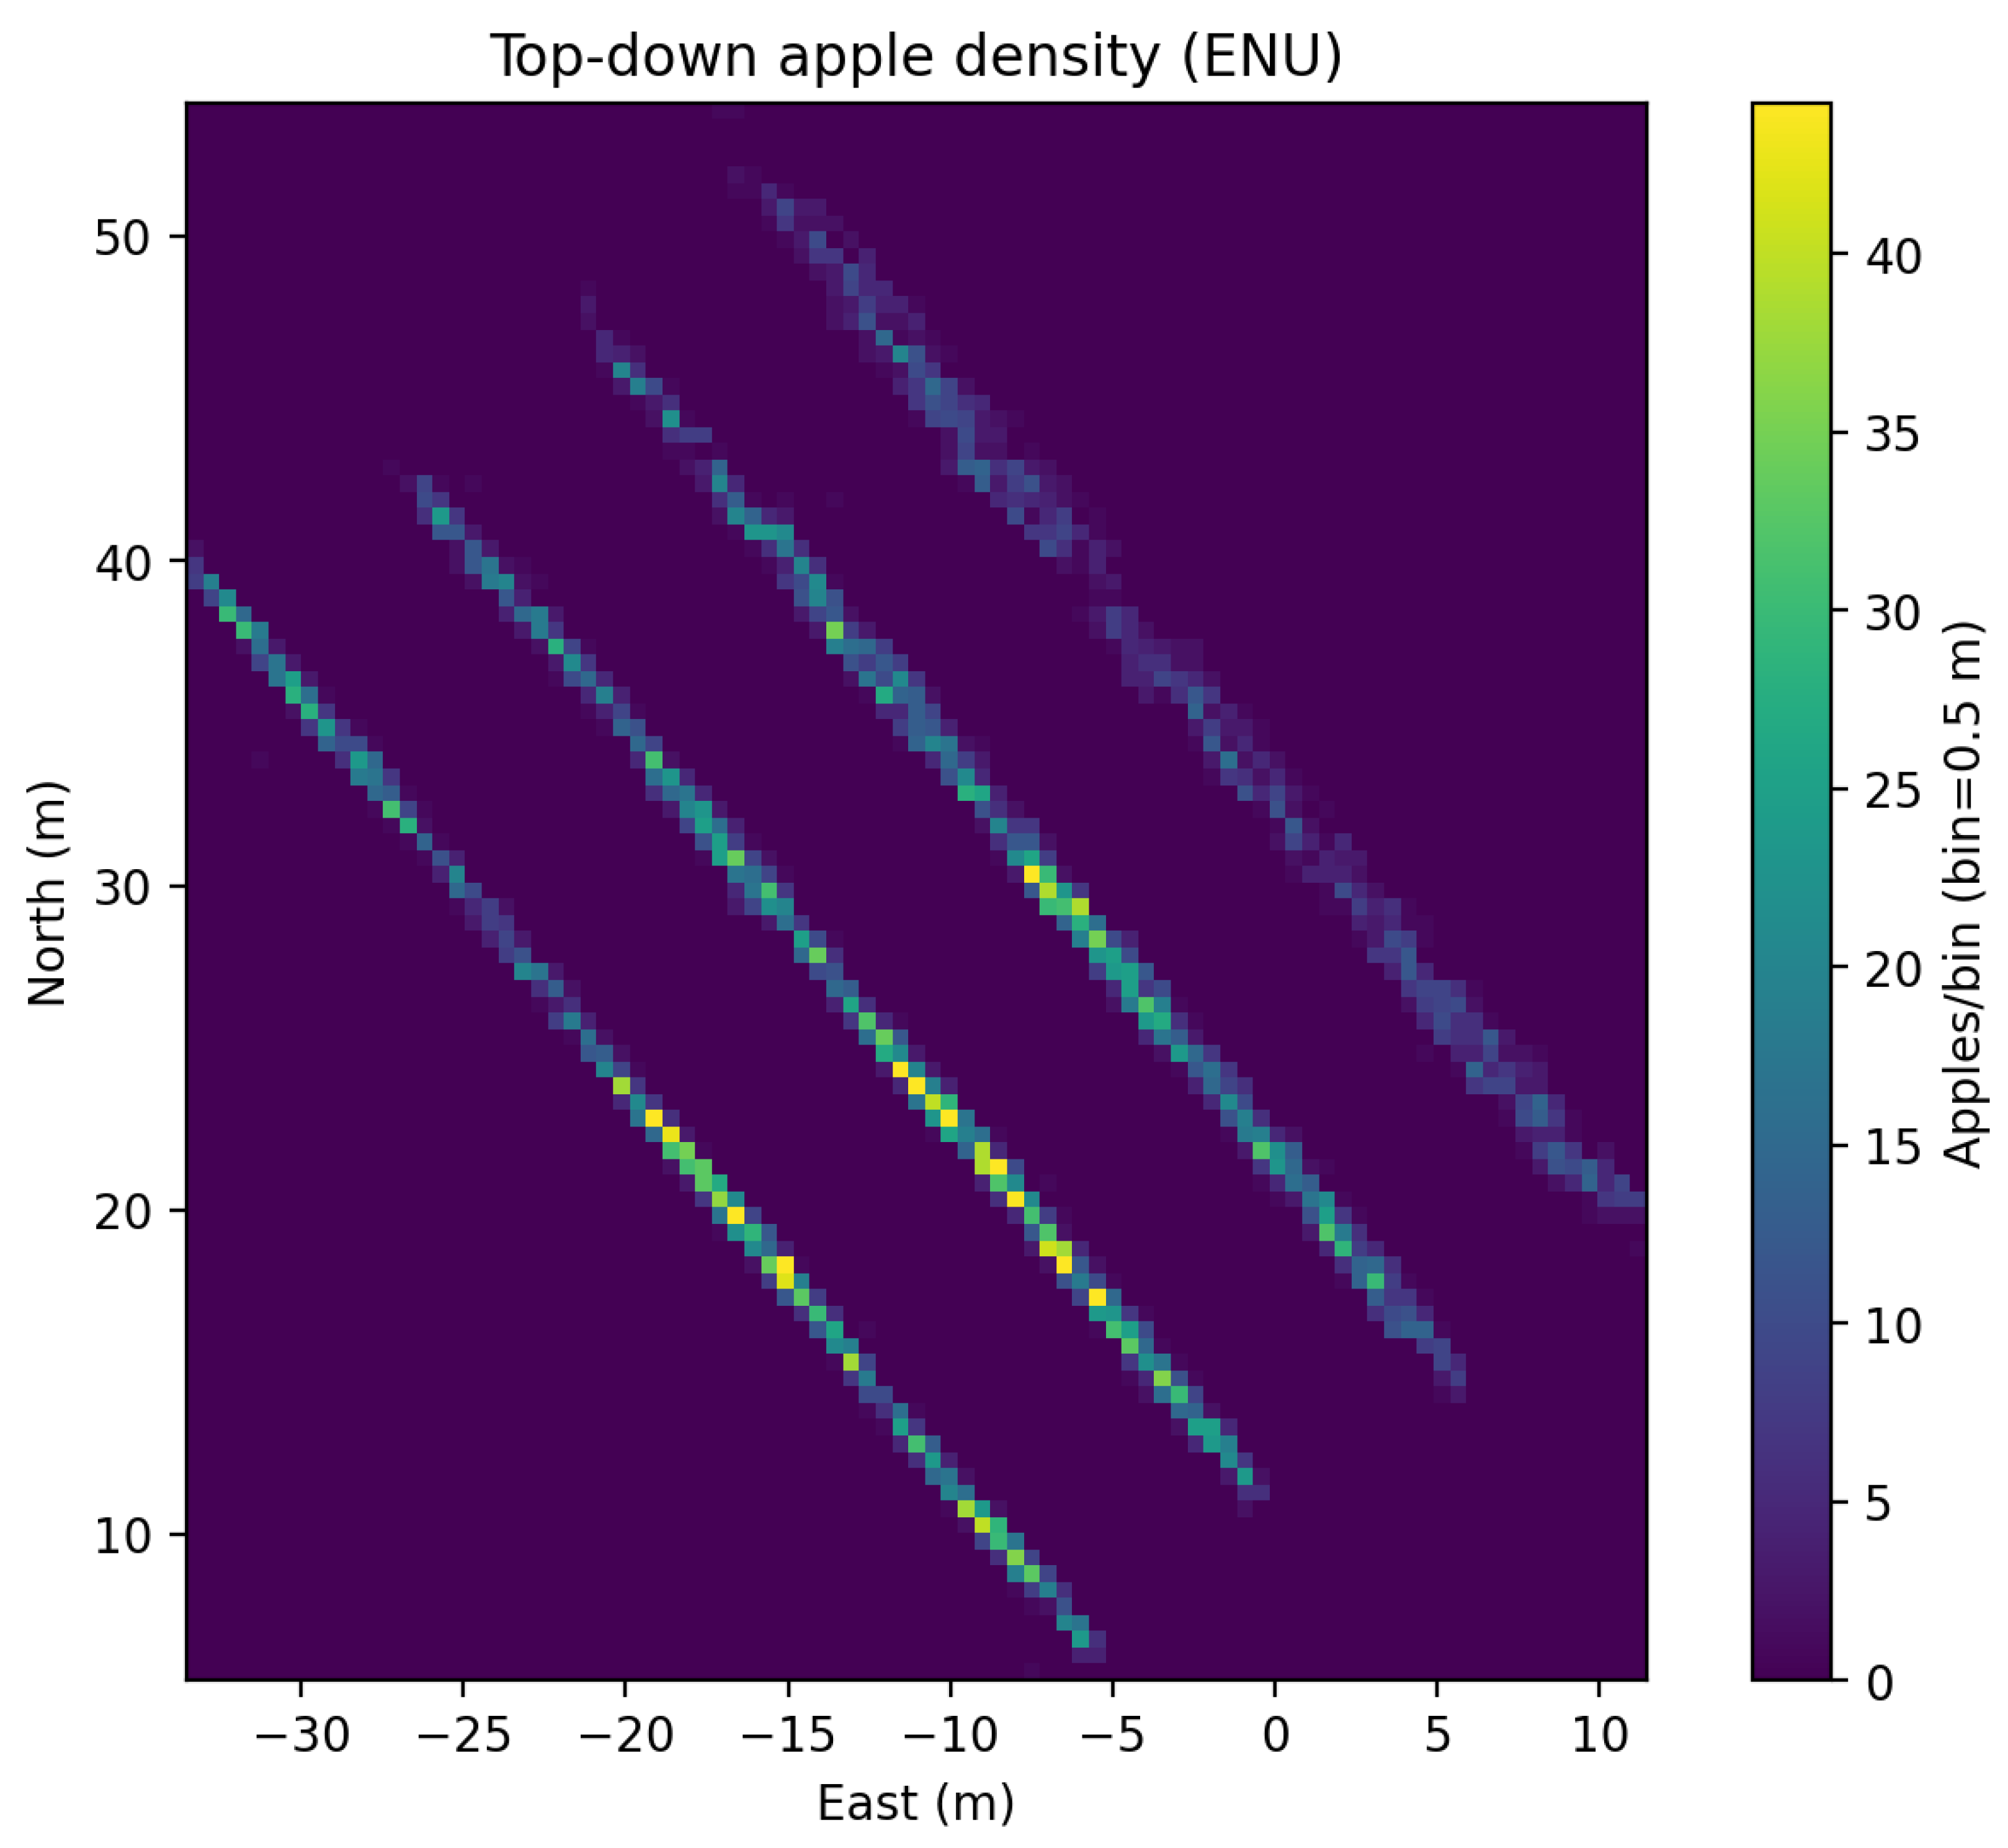
Figure 9 shows a top-down heatmap of reconstructed apples projected into a local ENU coordinate system. The density image is computed by binning apple landmark locations in the horizontal plane. Let
denote the ENU coordinates of apple
k. For a chosen bin size
(m), the 2D density map is the histogram
where
is the indicator function and
indexes grid cells. This representation converts the sparse landmark set into an orchard-scale product that highlights where fruit detections concentrate along the traversed rows and around turns, and it provides a direct substrate for row-wise, block-wise, or corridor-wise aggregation.
4.5.2. Size-Derived Mass Estimate from Reconstructed Radii
In addition to spatial density, the reconstructed apple radii enable an orchard-scale estimate of total mass under a density-based physical model. For each apple
k, the reconstruction provides a radius
(m). Under a spherical approximation, apple volume is given by Equation (
36) and mass is modeled as Equation (
37). where
is apple bulk density (kg/m
3). For the reconstructed set of
apples, using the calibrated density
kg/m
3 (Equation (
39)), we obtain a nominal orchard-scale mass estimate of
kg. Under a conservative density range of
kg/m
3, the estimate varies from
kg to
kg.
Table 3 above summarizes these results.
The reported mass values should be interpreted as a size-derived yield proxy conditioned on (i) the reconstructed radius distribution, (ii) the spherical approximation, and (iii) the assumed bulk density. Nevertheless, Equation (
38) makes the dependence on
explicit, and couples geo-referenced mapping with yield estimation, enabling consistent comparisons between orchard segments under fixed modelling assumptions.
5. Discussion
5.1. End-to-End Integration: From Geo-Referenced Sensing to Orchard-Scale Products
This work demonstrates a fully integrated orchard-scale pipeline that couples multi-sensor geo-referenced pose estimation (ZED Fusion: GNSS-VIO), perception (YOLOv9), long-horizon association (CoTracker3), geometric initialization (multi-view triangulation), and SLAM back-end refinement (iSAM2 incremental bundle adjustment). The key design principle is to enforce multi-view geometric consistency throughout the workflow. Rather than aggregating detections in image space, the proposed method reconstructs fruit as 3D landmarks and refines the joint pose–landmark state, yielding outputs that are inherently compatible with orchard mapping: refined poses, a refined geo-referenced 3D apple map, and derived orchard-level analytics (count, density, and a weight proxy). Liu et al. [
39] similarly employed fruit as landmarks in a structure-from-motion framework, also leveraging multi-view consistency; however, their approach used a Kalman filter and optical flow for tracking, whereas the present work employs a transformer-based tracking solution (CoTracker3).
The geo-referenced pose stream produced by GNSS-VIO fusion provides an important initialization and a global reference. However, orchard traversals (particularly those including turns and repeated structure) still produce residual inconsistencies that propagate into 3D reconstruction if left uncorrected. The proposed approach uses this geo-referenced trajectory as a strong prior but relies on the subsequent SLAM refinement stage to reconcile the fused trajectory with the dense set of multi-view reprojection constraints induced by tracked fruit observations.
5.2. SLAM Interpretation: Front-End Association and Back-End Bundle Adjustment
A useful lens to interpret the system is the classical SLAM decomposition. The front-end is responsible for producing reliable correspondences: YOLOv9 localizes candidate apples in each frame and CoTracker3 associates detections over time into tracklets that approximate persistent landmarks. This step is central in orchards, where appearance is repetitive and occlusions are frequent. The back-end uses these correspondences to enforce a globally consistent solution via factor-graph optimization: each track observation yields a reprojection factor linking the corresponding pose and landmark, producing a dense bipartite graph spanning the full traversal.
In this context, iSAM2 functions as an incremental bundle adjustment back-end that jointly refines camera poses and apple landmarks. The incremental nature of iSAM2 is particularly aligned with orchard-scale sequences, because constraints arrive sequentially as the robot moves and because the number of variables (poses and landmarks) can be large. The resulting refinement improves global consistency without requiring a separate loop-closure infrastructure or marker deployment in the orchard as seen in other works [
47].
5.3. Impact of SLAM Refinement on Trajectory and Reconstruction Quality
The results provide clear evidence that iSAM2 refinement improves geometric consistency relative to both VIO-only and GNSS-VIO fused trajectories. The qualitative comparison in
Figure 5 illustrates progressive stabilization: VIO-only poses exhibit strong drift across the traversal; GNSS-VIO fusion anchors the trajectory globally but still leaves notable residual multi-view inconsistency which causes large errors in fruit localization; and iSAM2 refinement yields a tighter trajectory with substantially reduced reprojection error.
This improvement is consistent with the role of bundle adjustment in distributing error globally through multi-view constraints. Importantly, pose corrections are moderate in magnitude, suggesting that refinement is not arbitrarily deforming the trajectory but rather correcting accumulated inconsistency where constraints are weaker (e.g., late-stage portions and maneuver segments). The fact that between-residuals remain small indicates that local motion regularity is preserved while global reprojection agreement is improved—a desirable property in orchard traversals, where smooth motion along rows must coexist with sharp curvature at headland turns.
5.4. Landmark Stability and Orchard-Scale Structure Preservation
A central question for yield mapping is whether the 3D landmark cloud is both stable and structurally meaningful. The reconstruction results in
Figure 7 indicate that the refined solution yields a coherent landmark distribution aligned with the orchard geometry and robust to viewpoint changes. The presence of spatial gaps consistent with the real orchard (as visible both in 3D renderings and in top-down GIS visualization) suggests that the reconstruction captures genuine variations in fruit presence rather than generating an overly smooth or artificially dense map.
The constraint design used in landmark initialization and filtering (minimum track length, reprojection gating, parallax threshold, and range filtering) supports stability by discarding ill-conditioned triangulations and short-lived detections that are unlikely to yield consistent 3D structure. This combination is especially important in orchards, where occlusion-induced track fragmentation and insufficient parallax for distant fruit can otherwise produce unstable depth estimates.
5.5. Counting Performance and Spatial Diagnostics
At the orchard-block level, the system produces a close estimate of total fruit cardinality (
aggregate undercount), while simultaneously providing a geo-referenced 3D map. This dual output is significant: many counting pipelines can report a number, but cannot support spatial auditing of where fruit instances were reconstructed. Here, the top-down QGIS visualization (
Figure 8) provides a qualitative diagnostic layer that helps interpret counting performance. The alignment of reconstructed points to the orchard rows and the preservation of local gaps consistent with ground observations indicate that the reconstruction is not only quantitatively plausible but also spatially interpretable.
The row-wise breakdown (
Appendix A.1) exhibits heterogeneous bias, which is consistent with orchard field reality. Dense canopy and training-system differences can reduce recall through occlusion, while maneuver-induced viewpoint changes can increase the likelihood of track fragmentation and duplicate landmark creation. These mechanisms also align with the reprojection diagnostics that localize higher-error frame clusters to specific trajectory segments.
5.6. From Point Landmarks to Yield Surfaces: Density and Mass Proxies
The geo-referenced landmark set enables a transition from discrete detections to spatial yield representations. The density heatmap (
Figure 9) summarizes fruit occurrence patterns as a spatial field over ENU coordinates, providing an orchard-scale view of fruit distribution along rows and around turns. This representation supports aggregation at arbitrary spatial resolutions, which is useful for block-level analyses and for comparison across orchard sections.
The weight proxy further extends this representation by associating each landmark with a size-derived mass estimate based on reconstructed radii and a density model. While absolute mass depends on modeling assumptions (spherical approximation and bulk density), the formulation makes this dependence explicit and supports sensitivity analysis through a density range. Although the spherical approximation is a first-order model, more accurate alternatives exist; for example, the geometric neural representation employed by Wang et al. [
36].
It is important to distinguish centroid reconstruction from size estimation. In the present pipeline, each landmark corresponds to an estimated fruit centre obtained from tracked image observations and multi-view triangulation; the fruit size model is applied only afterward to derive radius- and density-based mass proxies. Consequently, variable fruit size does not directly change the projective geometry of the landmark state, but it can indirectly affect centroid accuracy when bounding-box centres deviate from true fruit centres under partial occlusion object detection.
5.7. Limitations and Error Sources
The proposed pipeline is most likely to degrade under three practical conditions. First, low fruit visibility caused by dense canopy, severe leaf-to-fruit occlusion, strong backlighting, rapid viewpoint change, or near-row-end turns—can reduce detector recall, shorten track length, and increase identity fragmentation. In these situations, fewer stable observations are available for triangulation, and some fruit may remain unreconstructed or may generate unstable landmarks. Practical mitigation includes slower traversal in highly occluded segments, stronger detector fine-tuning for orchard-specific imagery, dual-side or repeated-row observation, and the use of more occlusion-tolerant association strategies.
Second, the method may underperform when landmarks are sparse. Because apples serve as the primary visual landmarks in the present implementation, rows or segments with low fruit density provide fewer reprojection constraints to stabilize pose refinement—a limitation inherent to any system that relies on fruit as the primary landmark type [
39]. This may reduce the corrective effect of the SLAM back-end, especially in long segments with limited geometric diversity. A practical mitigation is to augment the graph with additional non-fruit landmarks, such as generic visual feature tracks or structural points, so that optimization does not depend exclusively on fruit visibility.
Third, strong GNSS degradation under dense canopy, poor satellite geometry, or multipath conditions can introduce local inconsistencies in the fused geo-referenced trajectory. In such cases, the soft ENU priors may become less informative, and the solution must rely more heavily on relative-motion constraints and reprojection consistency. Practical mitigation includes stronger outlier handling on the geo-referenced priors, adaptive prior weighting based on GNSS quality indicators, and the integration of complementary depth or ranging sensors such as LiDAR.
From a geometric perspective, triangulation quality also depends strongly on baseline and parallax. Distant fruit, near-fronto-parallel viewing, and short temporal support reduce depth observability, which is why the pipeline applies minimum track-length, reprojection, parallax, and range filters. The consequence is that distant or heavily occluded fruit may be underrepresented in the final map. Multi-sensor depth support, repeated viewpoints, and stronger robust modeling of outlier correspondences are therefore practical directions for improving reliability in these conditions.
The present association pipeline is designed primarily for temporally continuous tracking within a traversal segment and does not explicitly solve long-gap re-identification after a fruit fully disappears and later re-enters the field of view under a strong viewpoint reversal, such as a row-end turn. In such cases, the same fruit may be assigned a new track identity, which is a limitation of the current front-end rather than of the factor-graph back-end.
5.8. Scalability and Operational Feasibility
The incremental SLAM formulation enables scaling to orchard-length sequences with many poses and landmarks. The factor-graph structure and iSAM2 updates support efficient refinement without requiring repeated full batch optimization, making the approach compatible with long runs and dense observation graphs. Although optimization is performed after acquisition in the current study, the architecture supports near real-time operation: detection and tracking can run online, factors can be added incrementally, and smoothing can be performed periodically. This property is important for deployment on robotic platforms that must produce actionable yield maps during continuous orchard operation.
5.9. Future Directions
Several directions are identified to extend and strengthen the proposed framework. From a perception standpoint, integrating additional sensing modalities—such as LiDAR—could improve depth robustness and reduce reliance on motion parallax for distant or occluded fruit. More expressive robust loss functions and explicit outlier modeling within the reprojection factors may further reduce the influence of incorrect correspondences in challenging, cluttered segments. To complement visual fruit landmarks, future work will also explore the use of semantic segmentation to identify rigid, stable scene elements—such as trunks, support poles, and the ground plane—as more reliable anchors for the factor graph, particularly in scenarios where fruit landmarks are absent or scarce.
The current static-scene assumption, which treats fruit landmarks as approximately fixed over the timescale of a single row traversal, is a recognized limitation under wind-induced branch sway. Addressing this will require explicit dynamic-scene modeling, for instance through motion segmentation or branch-motion priors, to prevent transient landmark displacement from degrading track consistency and localization accuracy.
On the localization side, a dedicated investigation into system behavior under controlled GNSS degradation scenarios—including prolonged signal loss, varying canopy density, and severe multipath—is planned, with the aim of providing a rigorous quantitative characterization of drift accumulation and recovery. Incorporating uncertainty propagation from pose and landmark estimates into the density and mass maps would further enable probabilistic yield surfaces, offering better-calibrated confidence measures for agronomic decision support.
A further open problem concerns the potential double-counting of fruit observed from opposing sides of a row during adjacent-row traversals. While preliminary visual inspection suggests that most fruit in the palmette training systems examined are not simultaneously visible from both viewpoints, a systematic evaluation based on fruit-level re-identification across opposing viewpoints is needed to rigorously quantify this effect. Developing robust cross-view fruit association—potentially leveraging appearance descriptors, geometric constraints, or learned re-identification models—represents a meaningful direction for future work.
The system will be evaluated on orchard training systems with larger canopies, greater fruit occlusion, and higher structural variability to assess generalization beyond the conditions examined in the present study. A particularly promising avenue for future work is 4D monitoring [
26]—the integration of 3D reconstruction over time—which enables the analysis of crop development. Lei et al. [
15] recently applied this concept to apple orchards using a multi-sensor setup that includes a LiDAR device. Such spatio-temporal analyses could be carried out using the precise geo-referenced models produced by the present work.
6. Conclusions
This work develops an end-to-end, orchard-scale mapping approach that connects geo-referenced sensing, multi-view perception, and factor-graph optimization into a single coherent workflow for yield assessment. By treating fruit instances as persistent 3D landmarks rather than frame-level detections, the pipeline naturally supports orchard-scale aggregation, spatial auditing, and GIS-compatible outputs while maintaining geometric consistency through incremental SLAM refinement. The results indicate that a tightly integrated front-end (detection and association) and back-end (bundle adjustment) can deliver reliable orchard-block estimates from a single continuous traversal, and can further support derived products such as spatial density representations and size-based yield proxies. Looking forward, the most impactful extensions are to strengthen robustness under dense canopy and rapid viewpoint change, to incorporate uncertainty-aware mapping so that yield products include confidence measures, and to calibrate or learn fruit mass/shape models using limited ground truth samples. These directions would move the system from accurate mapping toward decision-grade yield forecasting, enabling repeated-season monitoring, block-to-block comparability, and real-time deployment on autonomous orchard platforms.




 ,
,