1. Introduction
Beetroot (
Beta vulgaris L.) is an important sugar crop widely cultivated worldwide. Its sugar output makes up about 30% of the world’s total sugar production, making it the second largest source of sugar after sugarcane [
1,
2]. Accurate identification and monitoring of sugar beet seedlings are crucial for assessing the growth status of sugar beets, formulating management measures, and improving yield. Currently, the evaluation of seedling missing rate in sugar beet fields mainly relies on manual on-site calculation. This method is time-consuming and labor-intensive, easily influenced by statisticians’ experience, and thus fails to accurately reflect the actual seedling missing status in the field [
3]. Thus, an efficient, precise and automated monitoring approach for sugar beet seedling absence rate is urgently required to lay a reliable foundation for field seedling replanting and planting density optimization.
In recent years, the advancement of UAV technology has allowed high-frequency acquisition of crop images, thus bringing new opportunities for crop monitoring [
4]. Owing to the advantages of high cost-effectiveness and strong flexibility, UAV platforms have been widely used in field research [
5]. In the field of crop counting based on remote sensing technology, conducting crop counting analysis with the help of UAV mainly involves traditional machine learning and deep learning techniques [
6,
7]. Traditional algorithms (such as threshold segmentation, morphological operations, support vector machine (SVM), and random forest (RF)) have been widely applied to crop detection and counting [
8]. For example, Xia et al. (2019) [
9] collected images of cotton seedlings via a UAV and mosaicked them into an orthomosaic map. They adopted SVM and maximum likelihood method for plant identification. The SVM attained an overall accuracy of 96.65%, which exceeded the performance of the maximum likelihood method. In addition, their method for identifying overlapping plants increased the accuracy by 6.3%. Using the Google Earth Engine (GEE) platform, Fang et al. (2020) [
10] relied on 10 m Sentinel-2 imagery obtained during winter wheat phenological periods for their study. They optimized the hyperparameters of three algorithms—(SVM), (RF), and CART—through grid search and 5-fold cross-validation. Among these algorithms, the SVM achieved an overall accuracy of 94%. Li et al. (2020) [
11] used UAV-acquired high-resolution RGB orthoimages, combining the Excess Green Index and Otsu thresholding to isolate potato plants. A Random Forest classifier was trained on six morphological traits to evaluate the status of crop emergence. The results showed that the correlation coefficient (R
2) with manual assessment reached 0.96. Although these traditional methods have provided new paths for crop monitoring, they suffer from over-reliance on manually designed features. This leads to low learning efficiency and poor generalization ability in complex field environments, thus failing to satisfy the demands of high-precision counting [
12].
Deep learning, with its ability to automatically extract complex features, has delivered impressive performance in object detection, thus unlocking promising opportunities for remote-sensing crop counting [
12,
13]. In recent years, two-stage detection models have continuously demonstrated their technical advantages in the high-precision detection and counting of crop seedlings; Pan et al. (2022) [
14] proposed an improved Faster R-CNN (SGN-D), which uses ResNet50 as the feature extractor. This model introduces the SN-block attention mechanism, and combines FPN-based multi-scale feature fusion with anchor box optimization. On their custom sugarcane seedling dataset, the proposed method achieves an average precision (AP) of 93.67%. Xu et al. (2022) [
15] proposed a two-stage deep learning method to achieve maize seedling segmentation by combining ResNet50 and Mask R-CNN with a new loss function, SmoothLR. On a dataset of 1005 UAV RGB images, average precisions of 96.9% (bounding boxes) and 95.2% (masks) were obtained. Single-stage detection models, with their high efficiency, stand out in instant detection and counting use cases. Ribera et al. (2017) [
16] utilized CNN architectures such as Inception-v3 to directly estimate the number of sorghum plants through a regression task. On their dataset, this approach achieved a Mean Absolute Percentage Error (MAPE) of 6.7%. This thus avoided the limitation of having to preset the maximum number of plants in a classification task. Feng et al. (2023) [
17], based on the YOLOv7 architecture, achieved a detection accuracy of 96.9% in the counting of UAV-monitored cotton seedlings by introducing multi-spectral feature fusion and dynamic anchor box adjustment. Fan et al. (2025) [
18] proposed LUD-YOLO, which is an improvement based on YOLOv8, through a new multi-scale feature fusion mode and lightweight adjustments; the mean average precision (mAP) of LUDY-S on relevant datasets reached 41.7%. Yang et al. (2025) [
19] modified YOLOv5 by adding three CBAMs and merging original UAV RGB and orthophoto image data, achieving 94.3% accuracy on the konjac dataset.
Although deep learning has achieved good results in crop detection and counting tasks in UAV scenarios, its application in the UAV-based recognition and counting of sugar beet seedlings still faces numerous challenges. Existing research predominantly focuses on crops such as sugarcane [
14] and cotton [
17]. However, there is a scarcity of systematic research on beet seedlings, which possess unique morphological characteristics and closely resemble weeds during the seedling stage. Secondly, the embedded computing resources on the unmanned aerial vehicle (UAV) platform are limited, which imposes stringent requirements for the model’s lightweight and real-time efficiency. This makes balancing real-time processing performance while ensuring detection accuracy the core challenge [
20]. Furthermore, the morphological characteristics of sugar beet seedlings in the seedling stage are highly similar to those of field weeds. Coupled with prominent issues in drone imagery (such as large variations in target scale and heavy occlusion), this renders existing models susceptible to missed detections and false positives, thereby lowering the reliability of counting outcomes [
21].
In response to the above challenges, it is of crucial importance to seek a detection framework that combines high precision and high performance. Being an end-to-end real-time detection architecture, RT-DETR discards the Non-Maximum Suppression (NMS) post-processing procedure that traditional object detection models depend on, thereby removing the latency issues caused by this step. Relative to the YOLO series, it notably reduces the model complexity in object detection [
22]. Coupled with its exceptional performance on benchmark datasets, this framework has motivated researchers to explore its deployment across diverse real-world scenarios, providing novel solutions for multiple research fields.
Following the above reasoning, this paper aims to address the core challenges in UAV-based sugar beet seedling detection, such as insufficient recognition accuracy for small targets and the requirements for model lightweighting and real-time performance. In this work, we adopt RT-DETR as the baseline framework to conduct improvements, and further develop a sugar beet seedling recognition model suitable for UAV perspectives. For the task of agricultural small-object detection on UAV edge devices, this work provides a novel improved paradigm for tiny object detection in dynamic-scale scenarios. The main contributions of this study are listed below:
- (1)
Construct a sugar beet seedling dataset that encompasses a variety of real-world planting backgrounds. The data is sourced from drone images under different lighting conditions and ground heights, demonstrating the diversity of the dataset. Additionally, eight data augmentation methods are utilized to further enrich the types of the dataset and reduce the data’s specificity.
- (2)
This paper proposes a lightweight LDH-RTDETR model improved based on RT-DETR, which realizes the precise detection of sugar beet seedlings in the scenes captured by UAV, providing technical support for the intelligent monitoring of sugar beet seedlings during the seedling stage.
- (3)
We verify the efficacy of our proposed model on the complex scene dataset built in this work. Experimental findings show that our model surpasses mainstream approaches across key metrics (precision, recall and mAP50), while keeping low computational overhead and a smaller parameter count.
2. Materials and Methods
2.1. Image Acquisition
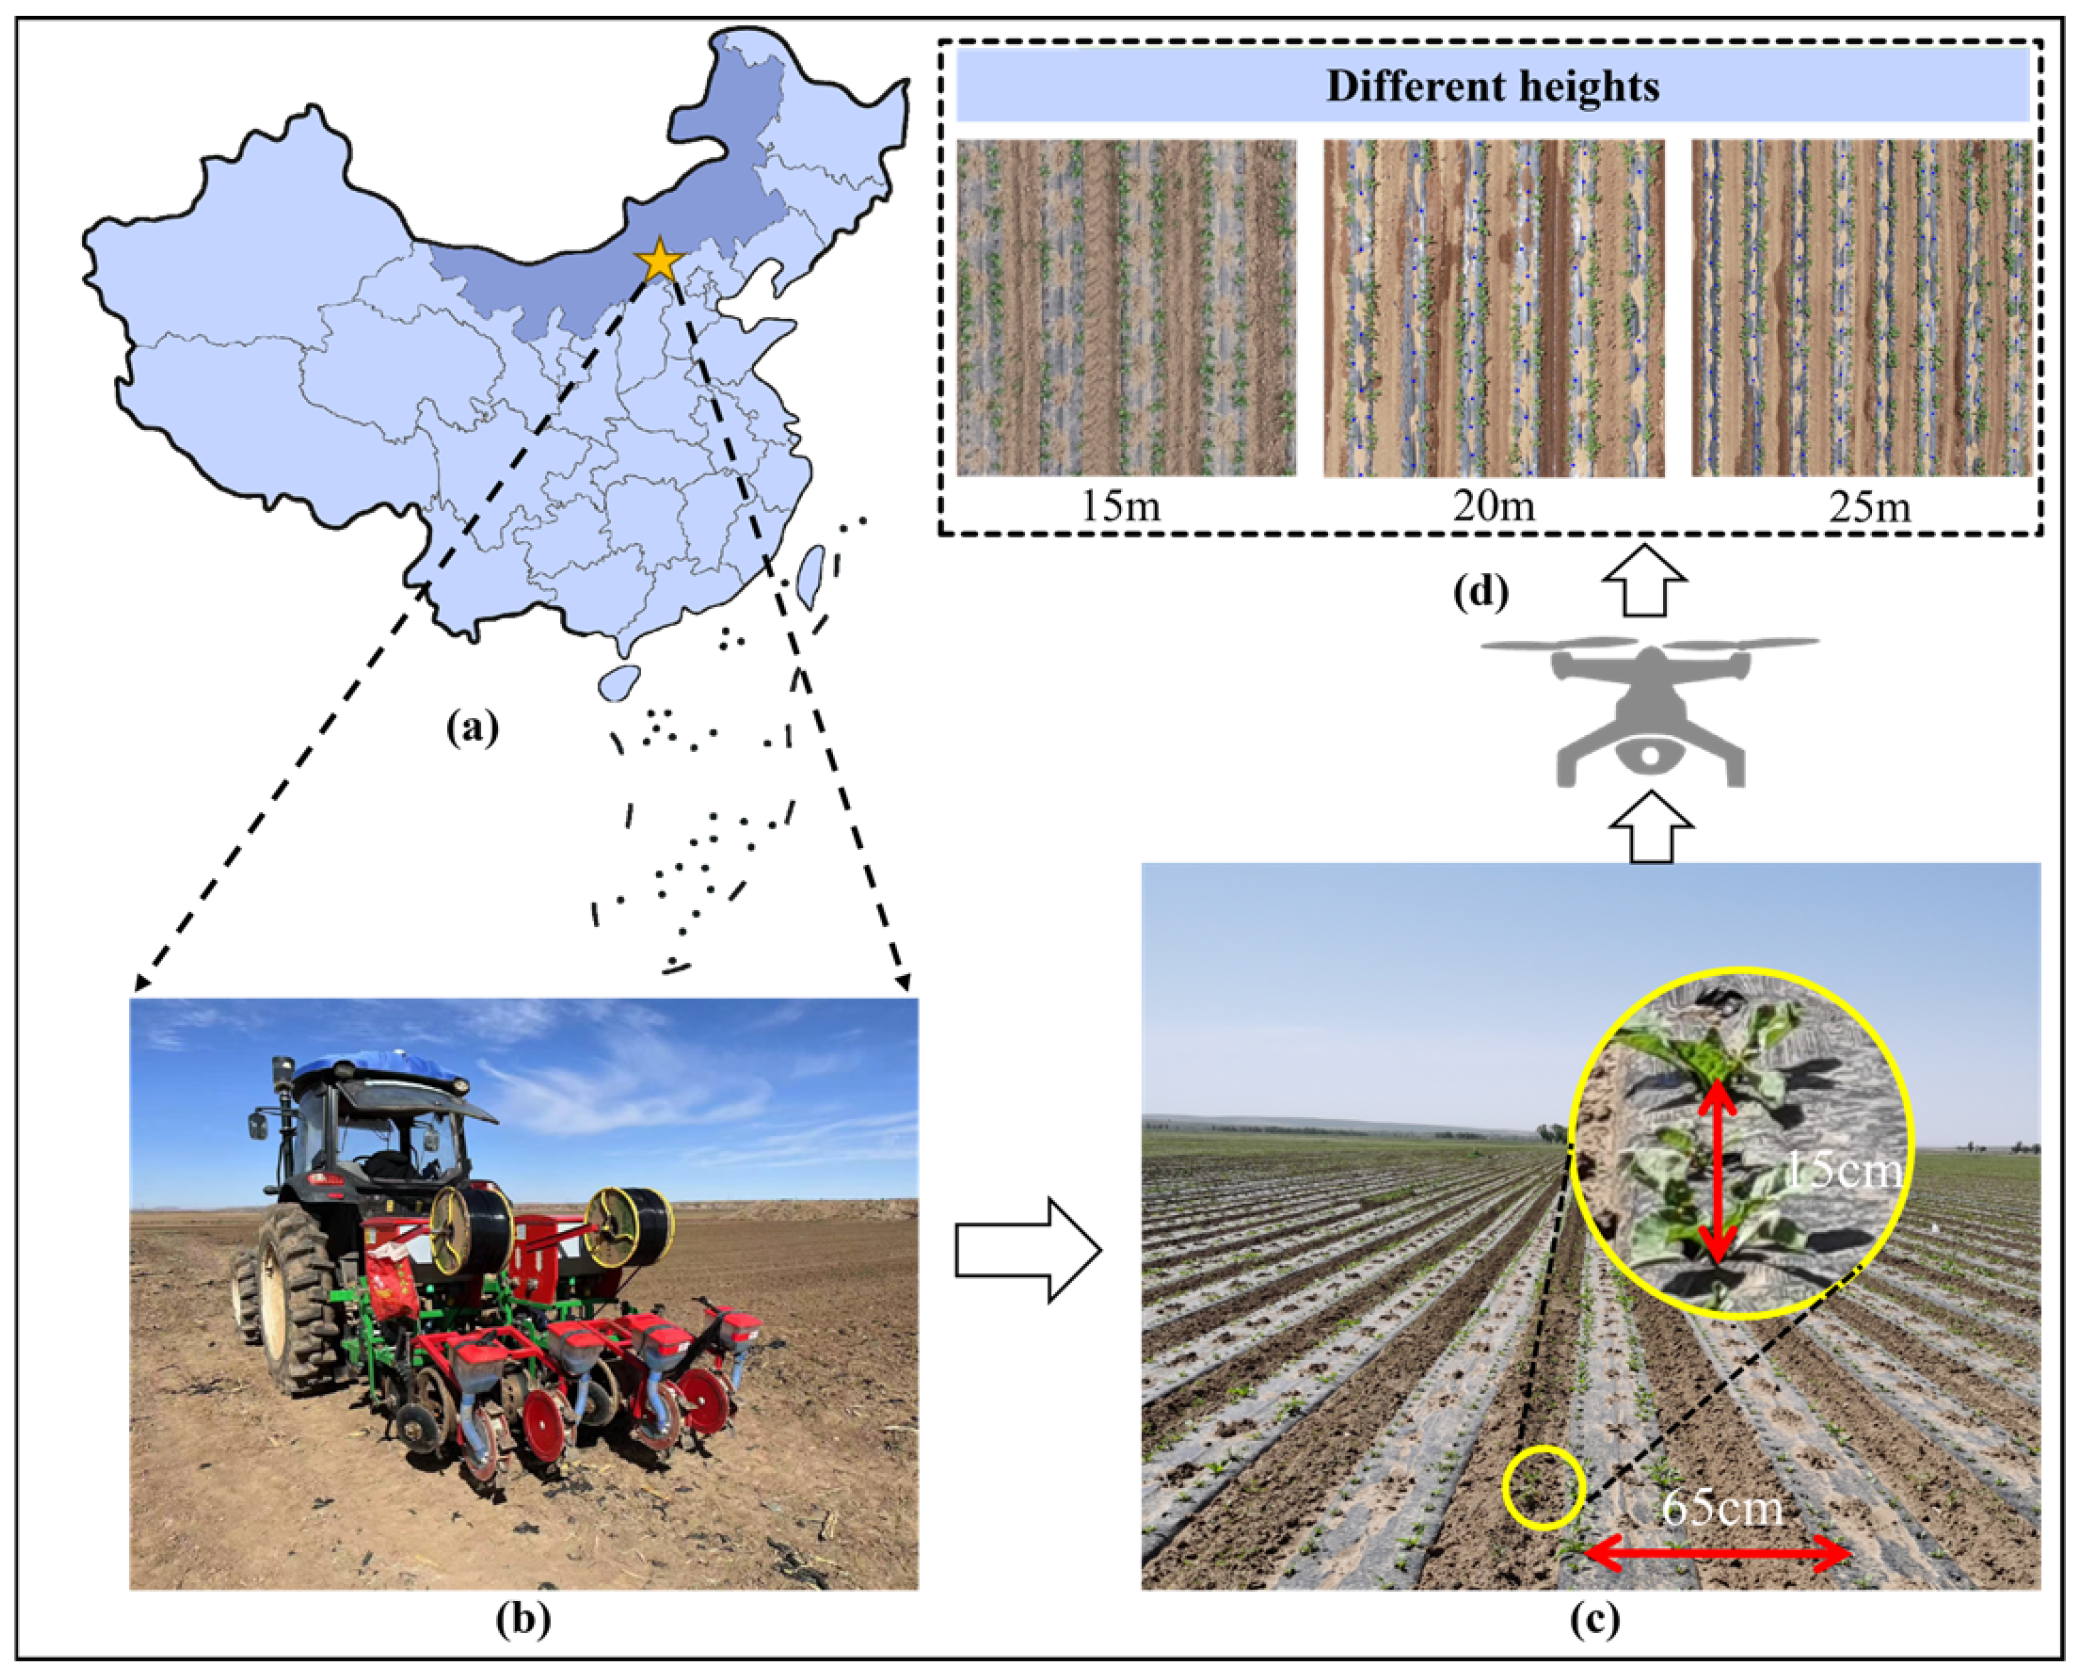
We collected the sugar beet seedling dataset in this study from the Siziwang Banner Sugar Beet Planting Base in Ulanqab City, Inner Mongolia Autonomous Region, China, with its longitude ranging from 110°20′ E to 113°00′ E and latitude spanning 41° N to 43°22′ N. The soil in this region is dominated by chestnut soil, which is not only suitable for sugar beet growth but also has the typical characteristics of an arid and semi-arid agricultural environment, fully ensuring the representativeness of the dataset [
23,
24].
As shown in
Figure 1, sugar beets were sown in rows using a grain seeder in the middle of April 2024, with the sowing parameters set as follows: 65 cm row spacing, 15 cm plant spacing, and 3–5 cm sowing depth. After the sugar beets emerged on 10 June 2024, a DJI Phantom 4 RTK (produced by Dajiang Innovation Technology Company Limited, Shenzhen, Guangdong Province, China)drone was employed for image acquisition, with the drone fitted with an RGB camera. Image acquisition was conducted under weather conditions with no rain and no wind. To obtain diverse samples, the flight period was set to 10:00–12:00 local time, which covers the dynamic variation range of light intensity. The heights of the UAV were set to 15 m, 20 m, and 25 m respectively. The camera was set to the top-down shooting mode, with the following parameter configurations: image format as JPG, resolution of 5472 × 3648 pixels, and ISO value fixed at 100. The exposure parameters were adjusted adaptively according to real-time light conditions to ensure image clarity.
2.2. Data Annotation and Preprocessing
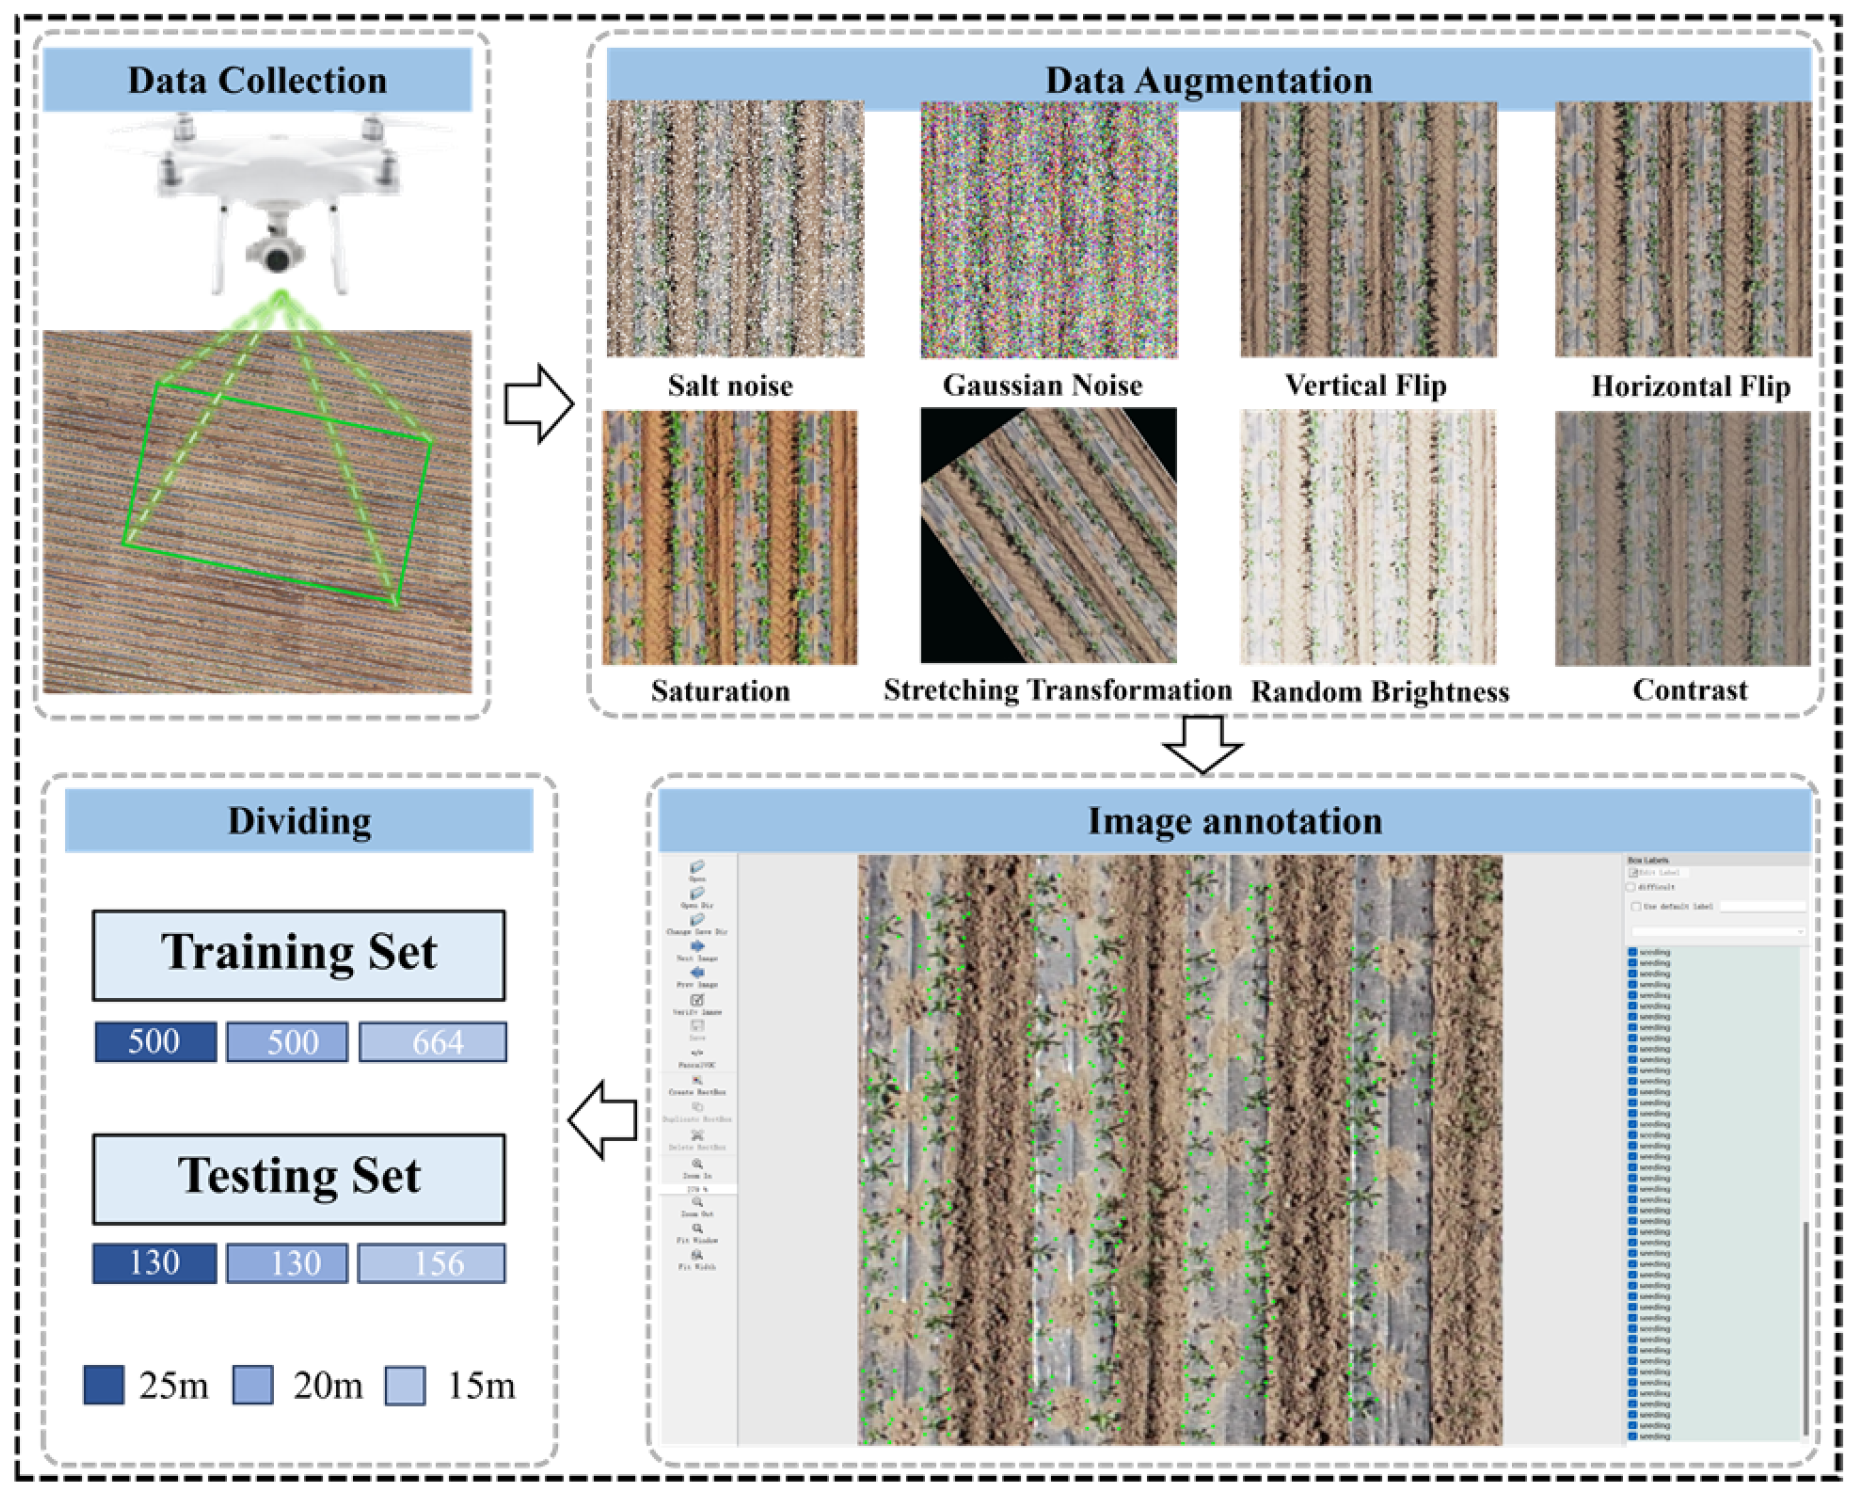
After image acquisition, preprocessing operations such as image registration and mosaicking were performed using DJI Terra software.(v5.1.1) Subsequently, we cropped the original images to 640 × 640 pixels using a fixed-size pixel sliding window, resulting in a total of 1040 original sample images. To improve the model’s stability and generalization capacity, we applied eight kinds of data augmentation techniques to the original images. Among them, adding Ssalt noise and Gaussian noise helps the model cope with unstable environments, while adjusting random brightness and contrast enables adaptation to changes in different weather conditions. Introducing horizontal and vertical flips enriches the data distribution. Additionally, adjusting image saturation and stretching transformation enhances the diversity of images in terms of color and morphology. The 1040 original images were divided into eight groups (130 images per group), with each group processed using one of the eight image augmentation methods. After applying data augmentation, the scale of the dataset was increased to 2080 images. The specific types of the eight data augmentations and their corresponding processing effects are shown in the “Data Augmentation” section of
Figure 2.
We annotated all preprocessed images using the LabelImg annotation tool (
https://github.com/HumanSignal/labelImg, accessed on 1 June 2025), with sugar beet seedlings in each image marked by anchor boxes. Each annotated image corresponds to a label file in TXT format, which contains the target category (sugar beet seedlings), the bounding box’s center position, along with its width and height details. Slight image distortion from UAV flight and positioning deviations, as well as minor manual annotation errors, have been expert-reviewed to ensure acceptability. After the annotation was completed, we randomly split the dataset at an 8:2 ratio: the training set contained 1664 images (including 664 images from the 15 m flight height, 500 from 20 m, and 500 from 25 m), and the validation set contained 416 images (including 156 images from the 15 m flight height, 130 from 20 m, and 130 from 25 m). In brief, after the sugar beet fields were captured by the UAV, the images were cropped to 640 × 640 pixels. After eight types of data augmentation, software annotation, and dataset splitting, the final data were used for subsequent research to clearly present the data research process.
Figure 2 shows the technical route of data acquisition and processing in this study.
2.3. Standard Model
As a real-time end-to-end transformer-based object detection model, RT-DETR is famous for attaining a speed-accuracy balance in multiple tasks [
25]. Several versions of the RT-DETR model have been officially released, such as RT-DETR-r18, RT-DETR-r34, RT-DETR-r50, RT-DETR-r101, and RT-DETR-x (
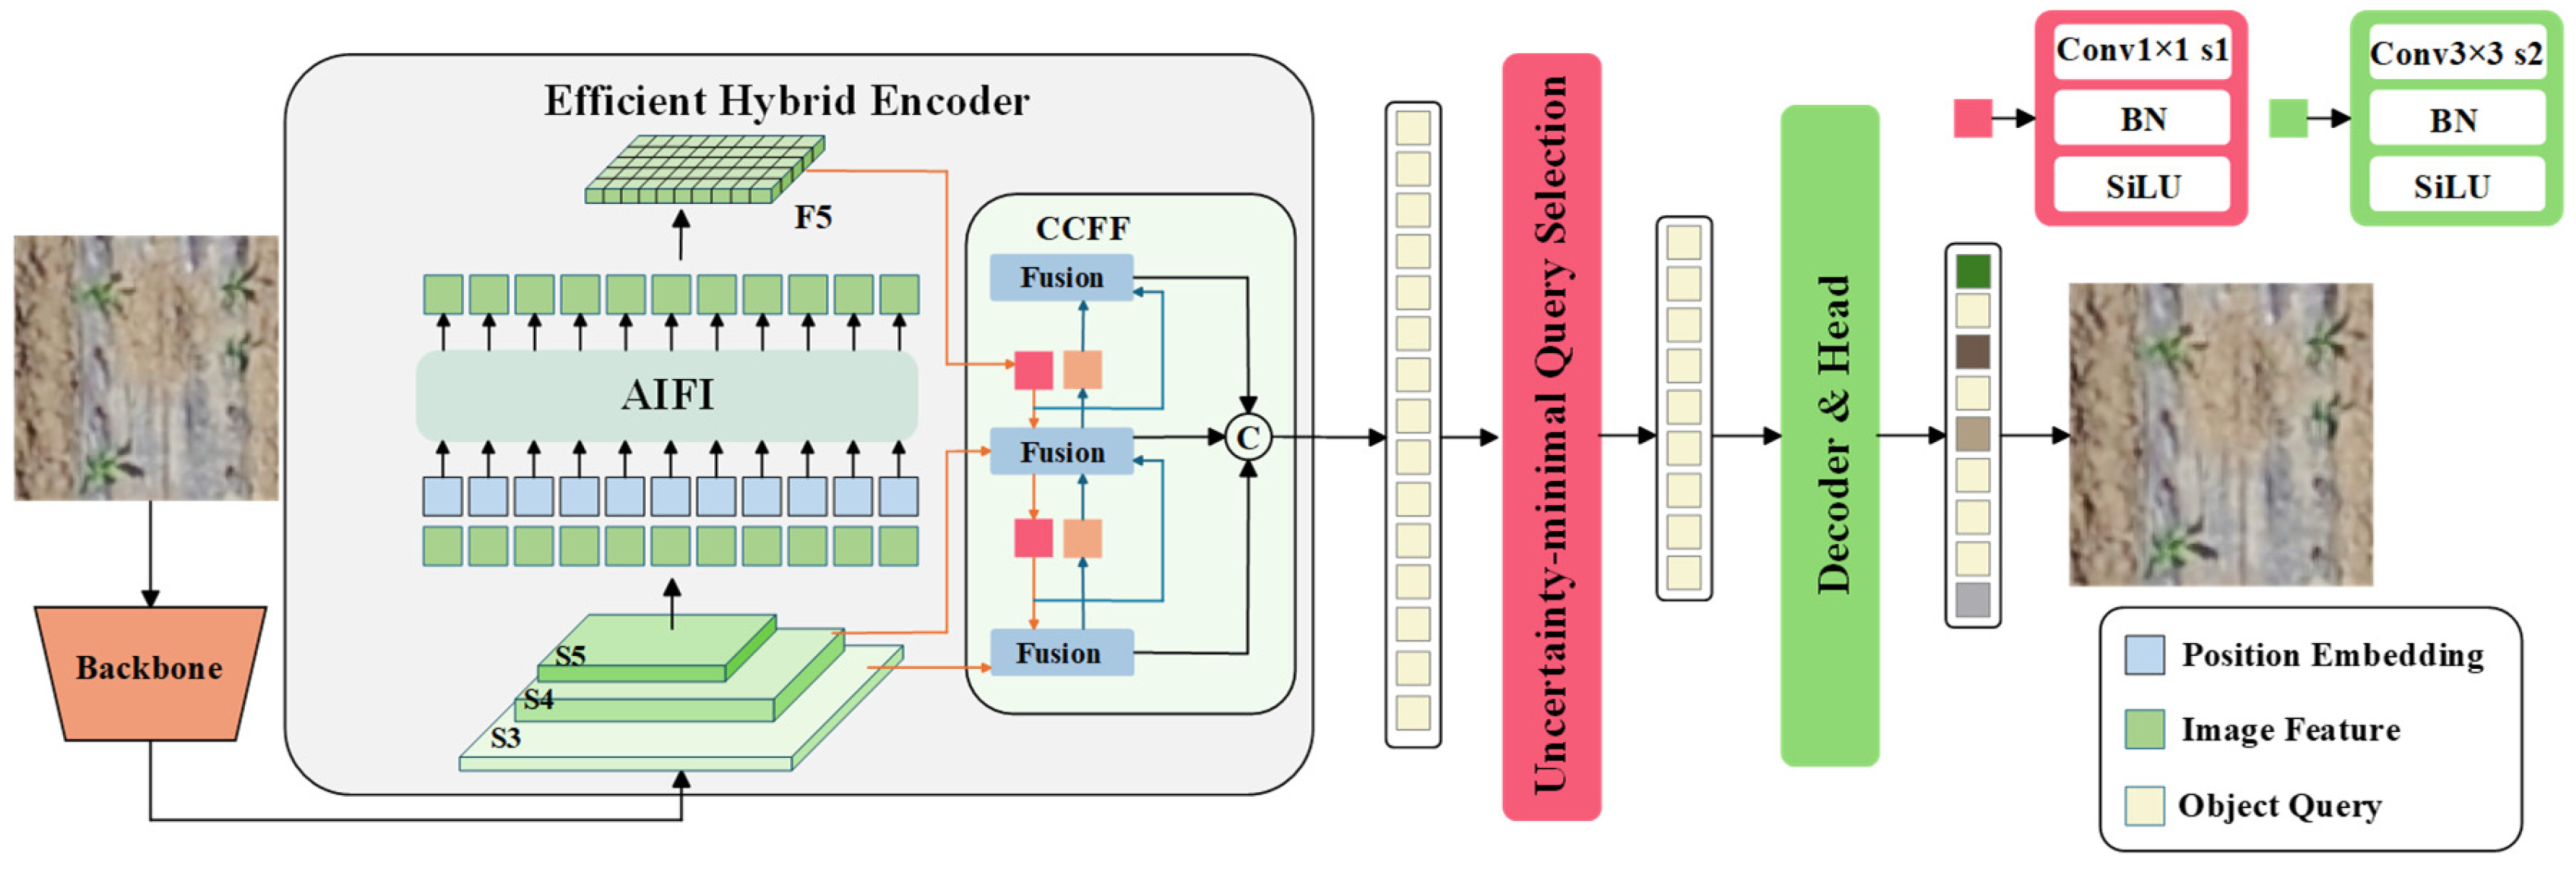
https://github.com/lyuwenyu/RT-DETR, accessed on 20 June 2025). To fulfill the accuracy and lightweight performance needs in our sugar beet detection scenario, RT-DETR-R18, a hybrid encoder, a decoder, and the structure are illustrated in
Figure 3. The backbone adopts ResNet-18, which extracts multi-scale features through layer-wise downsampling. After the output of its last layer is processed by the transformer encoder, it forms the CNN encoder together with the PAFPN neck network. The decoder, derived from the DINO architecture, not only integrates mechanisms such as the deformable transformer. Moreover, it innovatively introduces the “IoU-aware query selection” strategy, which synchronously constrains the classification and localization accuracy of positive samples. Leveraging the advantages of a high-efficiency hybrid encoder and no post-processing steps, this model shows considerable potential in object detection for field scenarios.
2.4. The Overall Architecture of the Improved Model
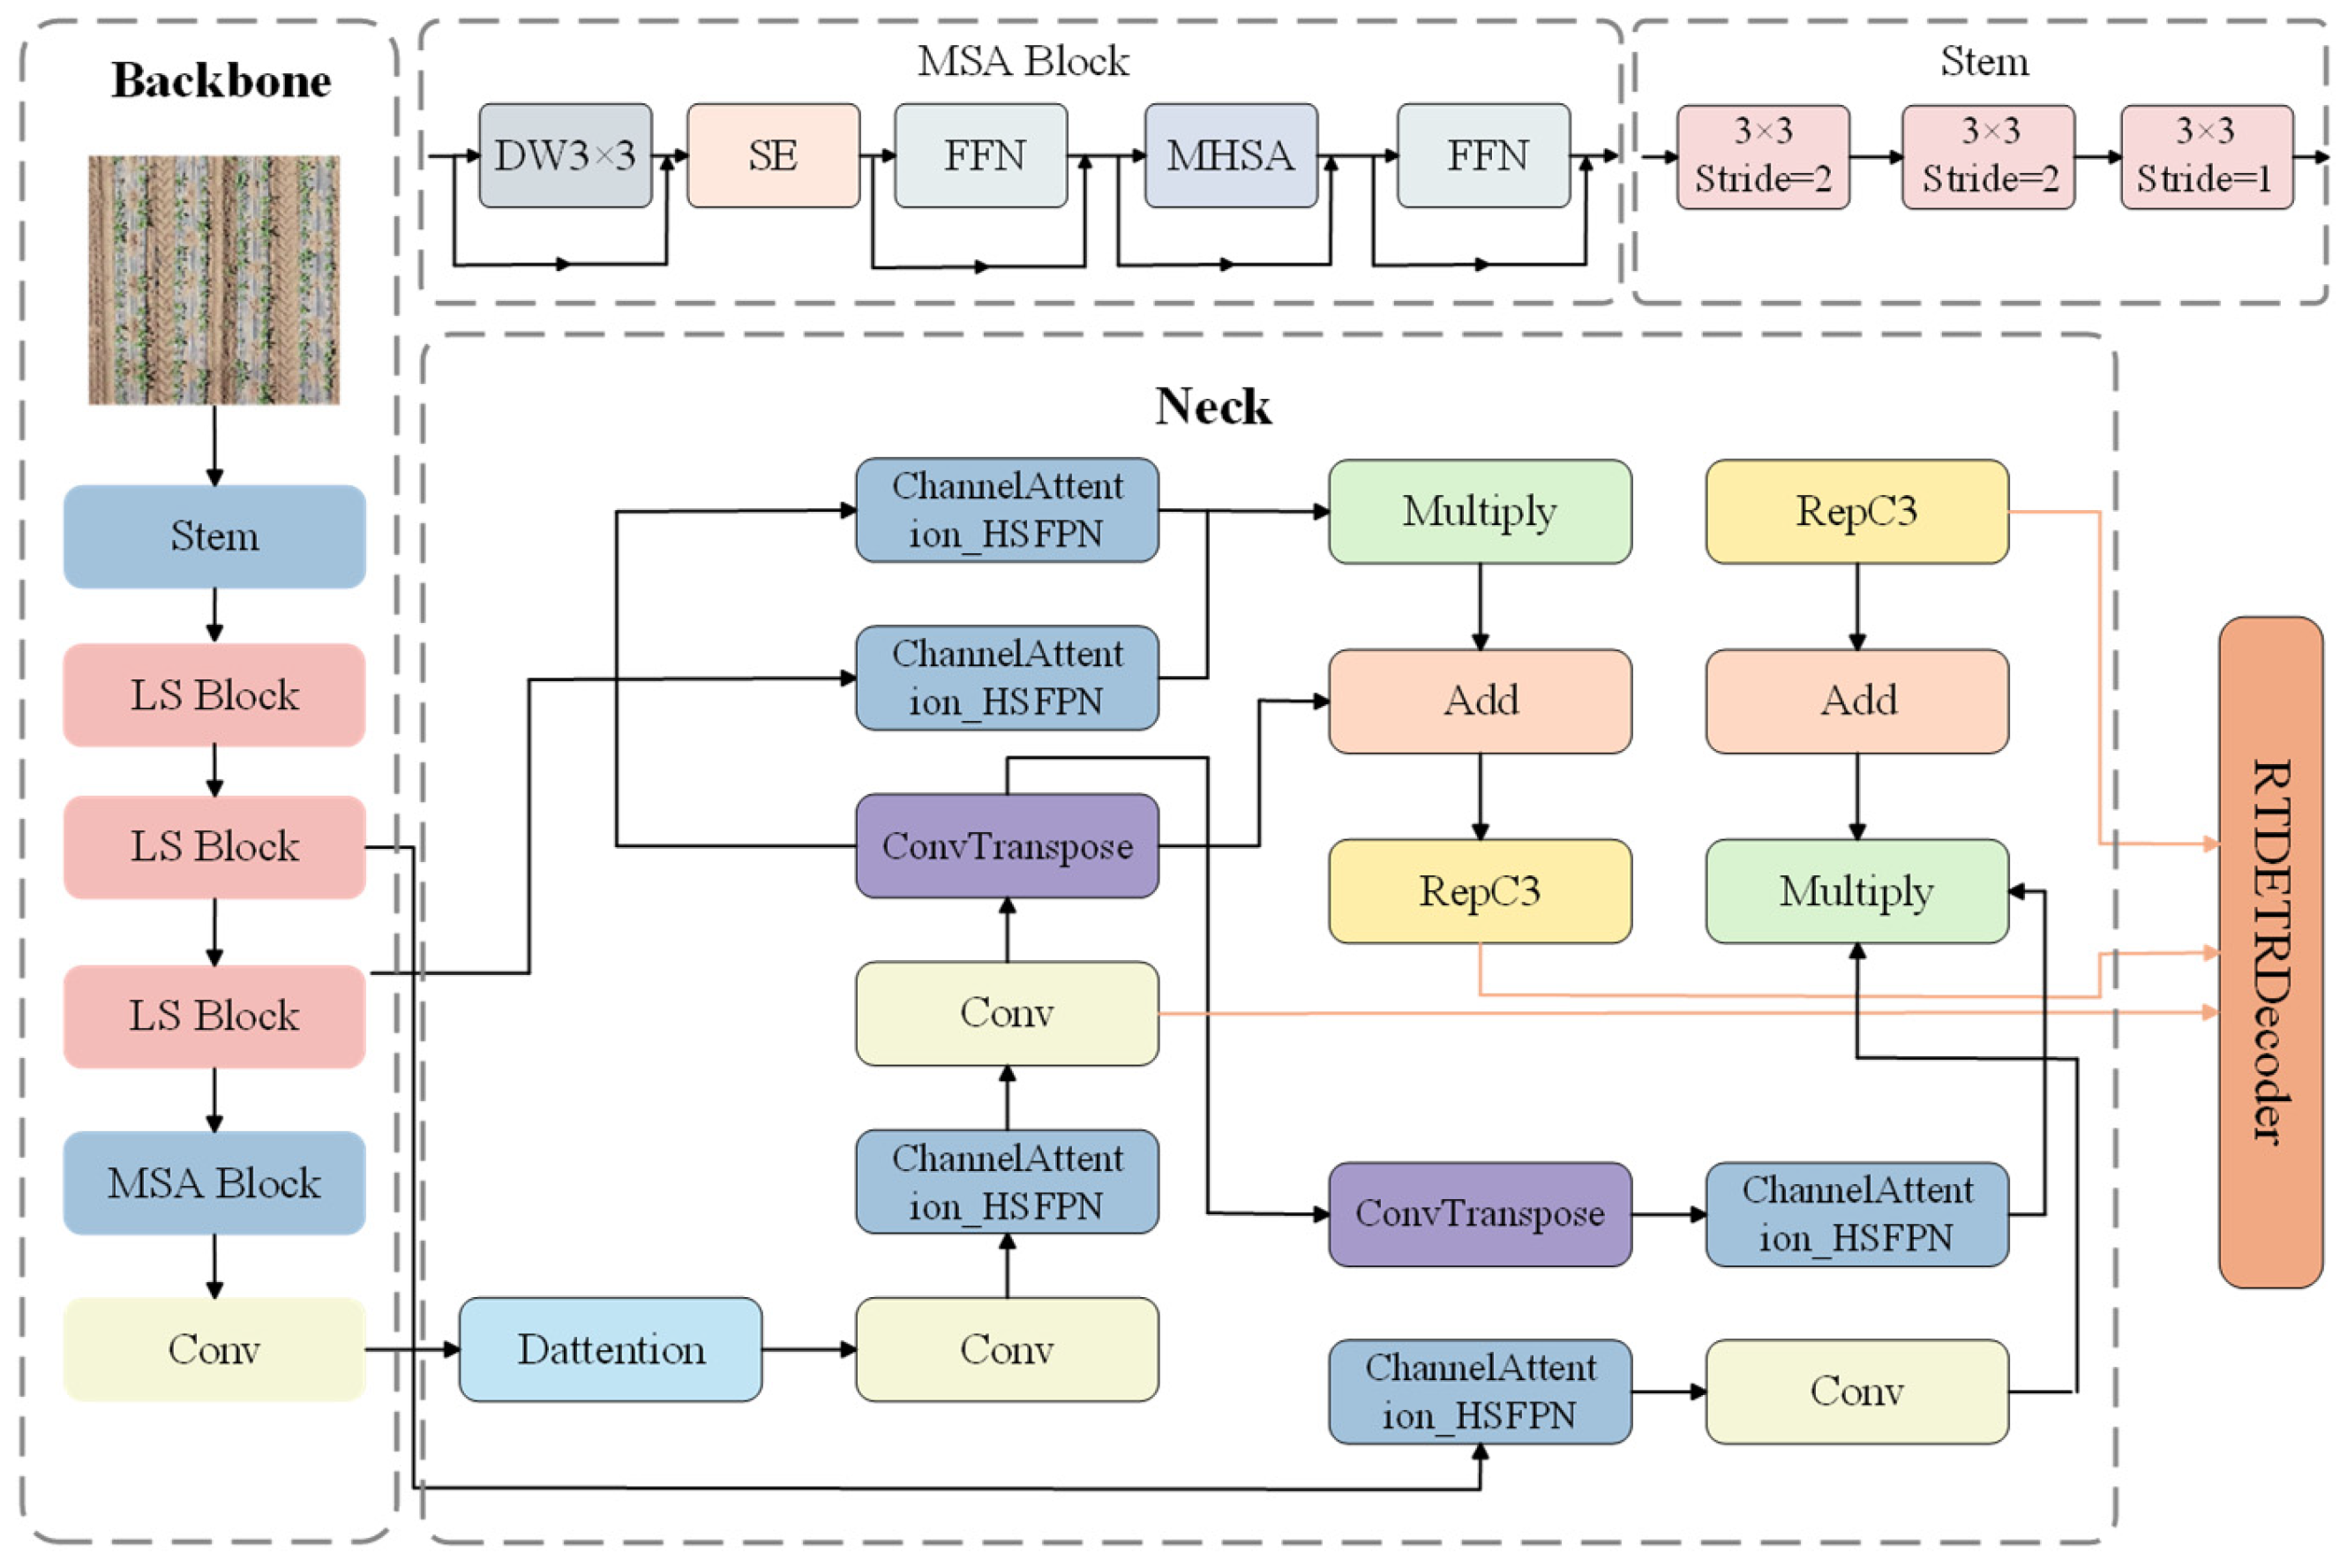
In the scenario of sugar beet seedling detection using UAV, RT-DETR faces two core challenges. First, sugar beet seedlings are tiny in the early stage. Second, in high-altitude images, interference from soil and weeds leads to insufficient detection accuracy for small objects. Additionally, the limited computing power of onboard hardware necessitates model lightweighting to reduce deployment costs. In response to this, LDH-RTDETR is optimized from three aspects: (1) The LSKNet is introduced as the backbone network to reduce the model size. (2) Introduce deformable attention into the encoder to improve fine-grained detection accuracy. (3) Optimize the cross-scale feature fusion module (CCFM) with HS-FPN to enhance detection performance in complicated scenes. Its overall architecture is illustrated in
Figure 4, which intuitively presents the collaborative mechanism of each optimized component.
2.5. LSNet
For scenarios where sugar beet targets occupy a small proportion in UAV high-resolution aerial imagery, traditional models struggle to balance the need for global context capture and local fine-grained feature extraction, and suffer from excessive computational overhead or insufficient generalization ability [
26].
For enhancing the real-time performance and efficiency of RT-DETR, this study substitutes the original ResNet-18 backbone with LSNet. The core design of the network is based on the “See Large, Focus Small” strategy, enabling efficient extraction of seedling features in sugar beet field scenes under limited computational resources [
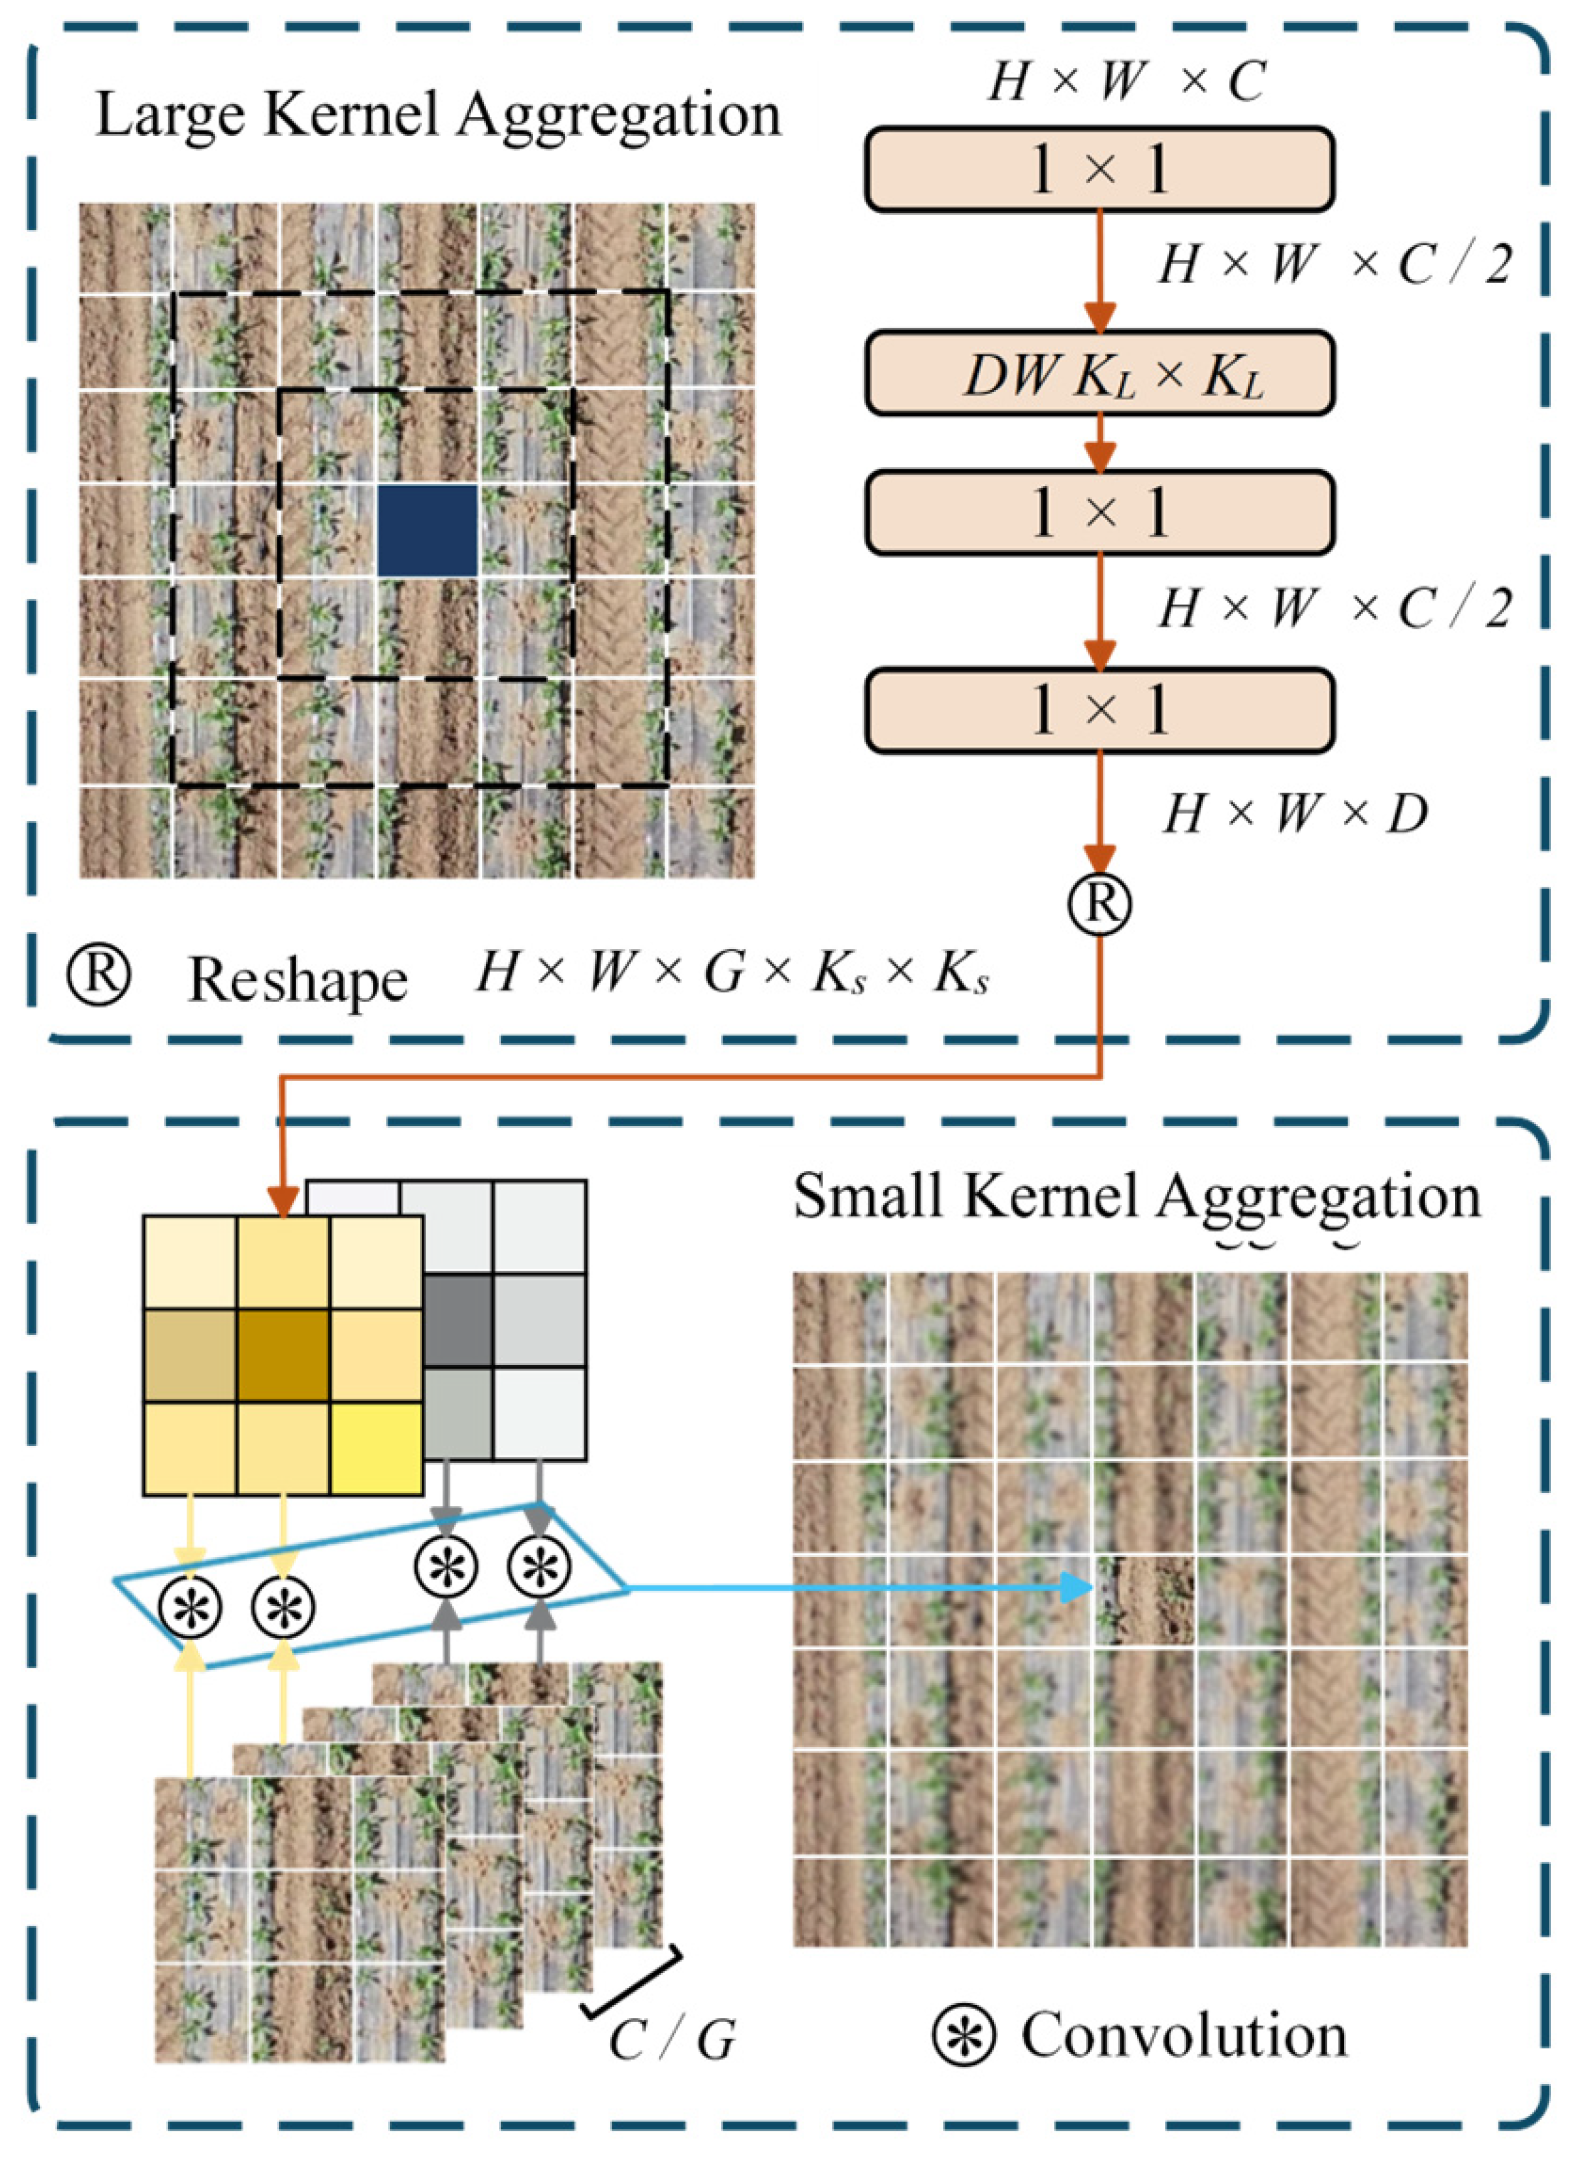
27]. The core module of LSNet is LS convolution, which mainly comprises two key steps: large-kernel perception (LKP) and small-kernel aggregation (SKA), and its architecture is presented in
Figure 5. Given an input feature map
, To reduce computational overhead, LKP initially uses a point-wise convolution (PW) to compress the channel dimension to C/2. Then, a large-kernel depth-wise convolution (DW) with kernel size
(default
= 7) serves to capture long-range contextualized information within the neighborhood. Finally, a point-wise convolution is employed to generate the adaptive weight
, enabling the model to simulate peripheral vision for global scene information capture. The computation of
is given in Equation (1):
where PW denotes the
point-wise convolution,
stands for a kernelized depth-wise convolution with kernel size
, and
is the basic unit for perception and aggregation.
Based on the weights generated by LKP, SKA divides the feature channels into G groups and obtains learnable weights (). These weights are applied to dynamically convolve and aggregate features within a neighborhood, enabling the model to direct more attention to local features. Meanwhile, by employing group convolution, the feature maps and corresponding channel information are convolved in groups, achieving fine-grained fusion of local key features.
The computation of
is given in Equation (2):
where
denotes the dynamic convolution weight of token
for the g-th channel group,
is the kernel size in the small-kernel aggregation, and
is the input unit of the aggregation.
The BasicBlock feature extraction unit in the original ResNet-18 backbone has computational redundancy, which leads to increased overall computational cost and model latency [
28]. In contrast, through the lightweight feature extraction design of LS Block (Lightweight Sequence Block) and the long-range dependency capture design of MSA Block (multi-head self-attention block), LSNet achieves a favorable trade-off between model calculation speed and feature learning capacity [
27]. As depicted in
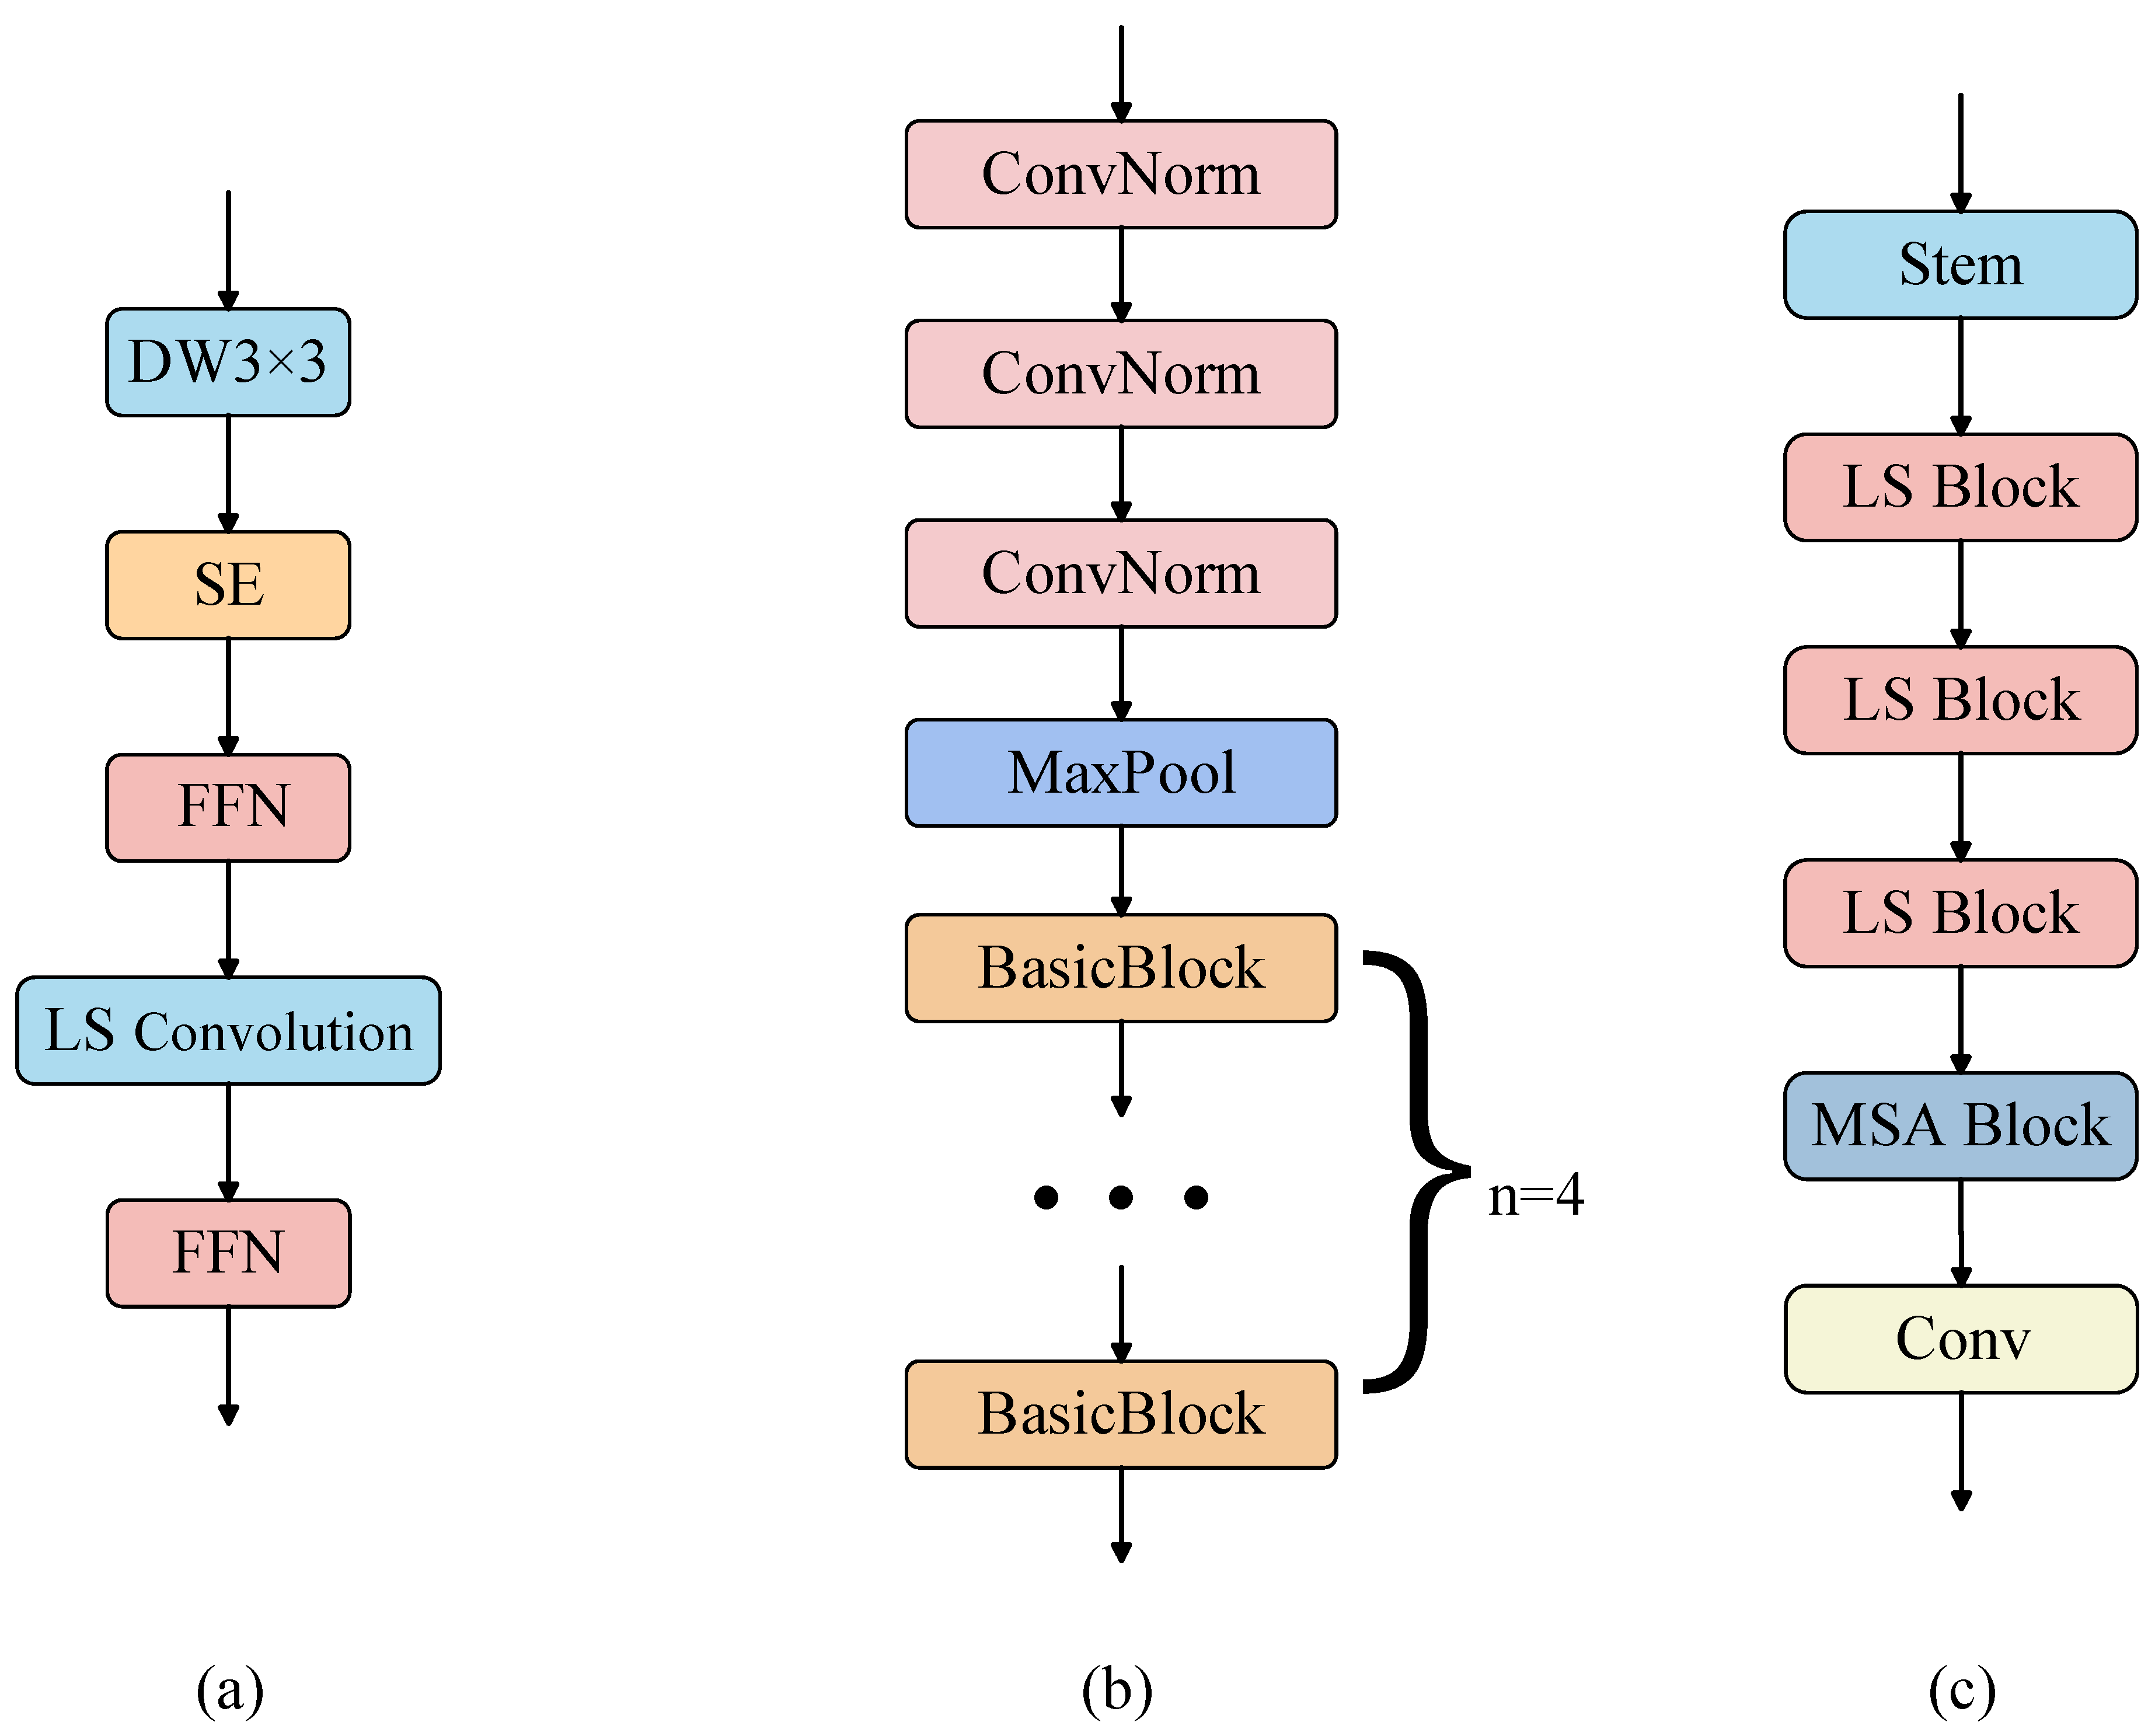
Figure 6c, within the backbone architecture of the enhanced RT-DETR detector, the input image is first mapped to a feature map through the overlapping patch embedding operation of the Stem module. Subsequently, downsampling between different stages is accomplished via depthwise convolution and pointwise convolution. Relative to the baseline backbone shown in
Figure 6b, the revised structure discards the computationally redundant BasicBlock: the first three stages are stacked with LS Blocks, while the final stage integrates the MSA Block. In
Figure 6a, each LS Block comprises LS convolution, skip connection, additional depthwise convolution, SE layer, and feed-forward network (FFN), aiming to enhance feature expression and optimization. Considering that the resolution of the feature map decreases after downsampling by the first three stages of LS Blocks, LSNet incorporates the MSA Block at the final stage to capture long-range dependencies. Additionally, it still integrates depthwise convolution and SE layers to introduce spatial information. Compared with the original ResNet-18 backbone network, this design not only reduces computational cost but also enhances the feature representation capability for multi-scale targets. Ultimately, this effectively improves the real-time detection capability of RT-DETR.
2.6. Deformable Attention
In the scene of drone detection of beet seedlings, the AIFI module struggles with small target recognition and image blur issues [
29]. The main reason is that it tends to extract high-level feature maps. In addition, it is also affected by inherent defects in its self-attention mechanism, leading to feature loss. To solve the above problems, the proposed work adopts the deformable attention mechanism [
30]. By means of learnable offsets, this mechanism can dynamically adjust weight distribution in the process of feature mapping, which effectively strengthens the capability of extracting sugar beet seedling features.
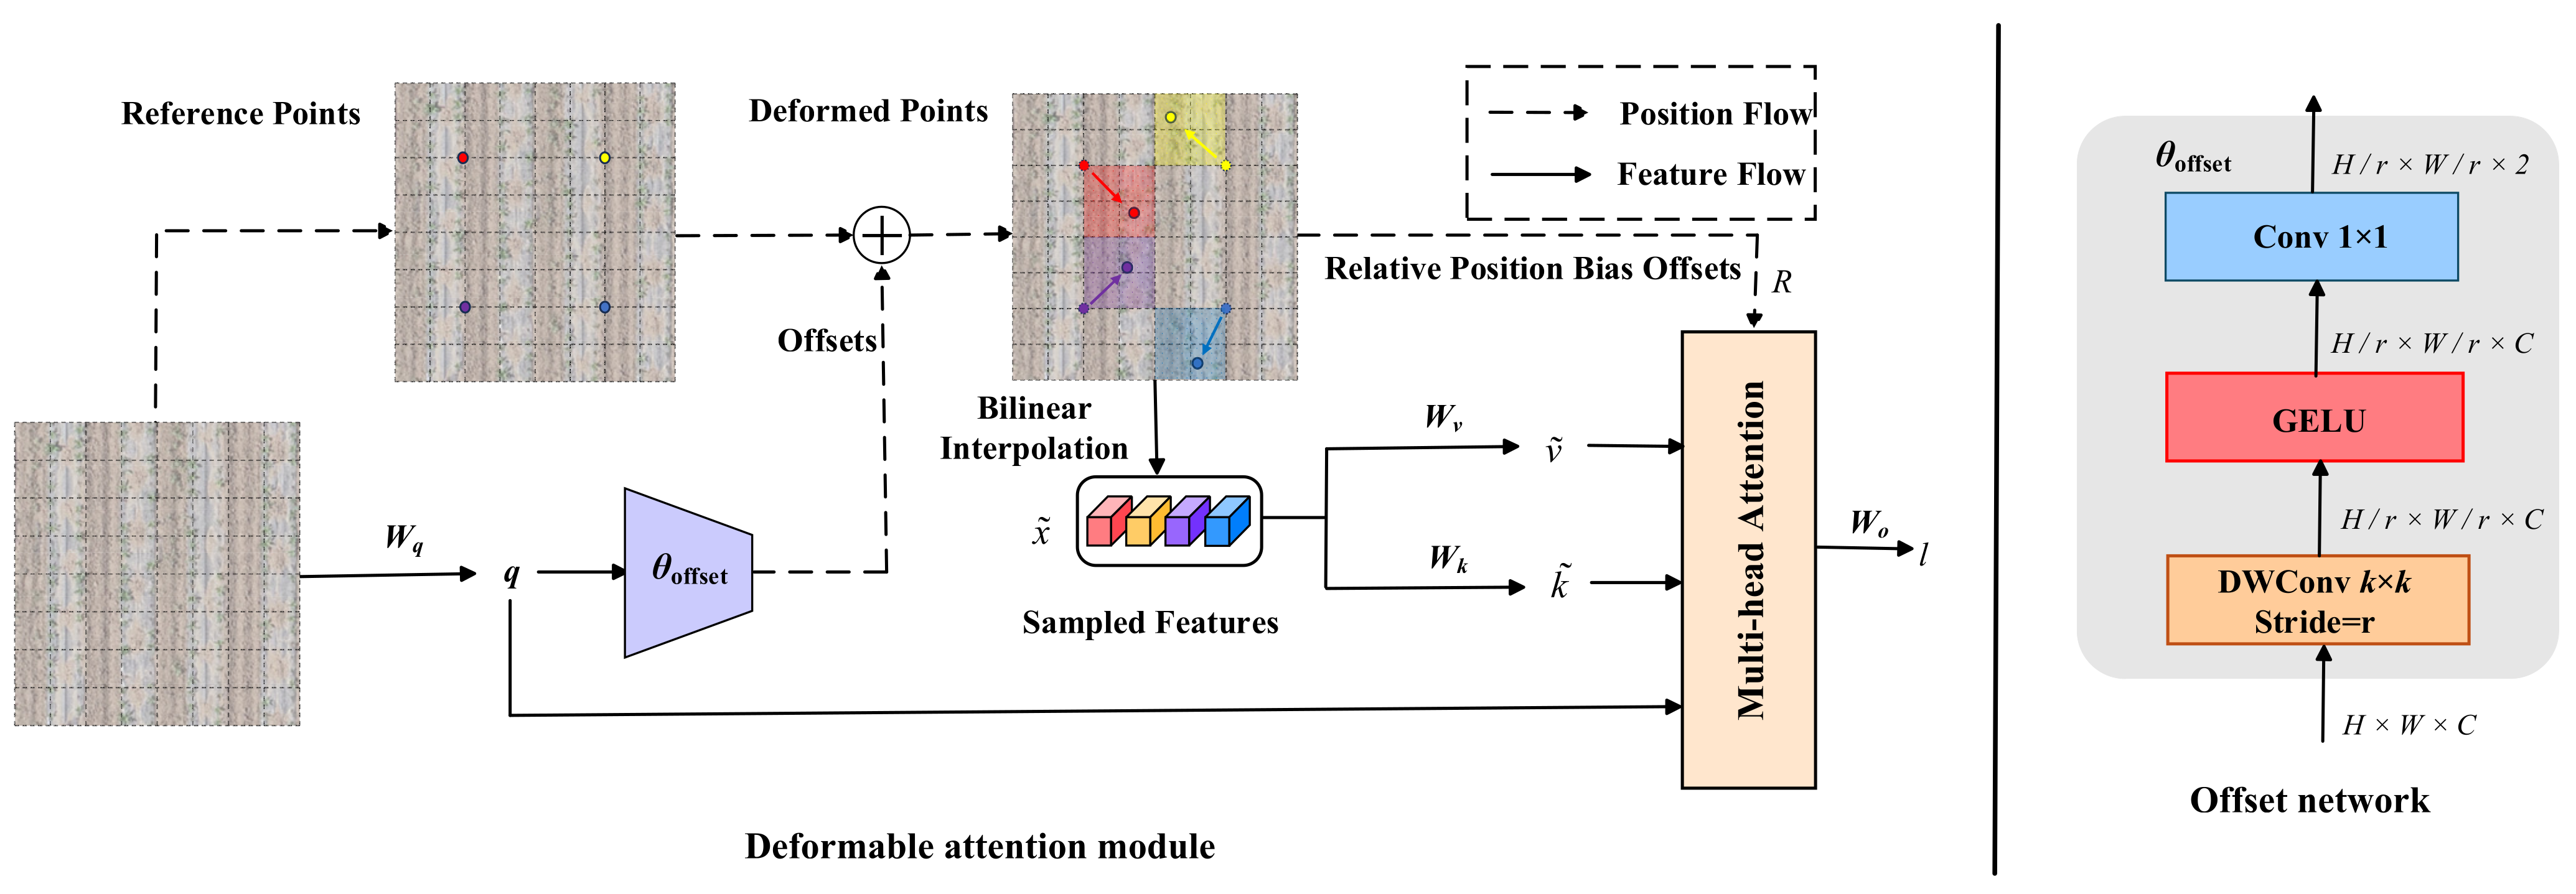
Figure 7 illustrates the working principle of DAttention. First, within the feature map plane, reference points are deployed according to a uniform distribution strategy. The generation of offset parameters for this reference point set depends on query features, and the optimized learning process of offsets is accomplished by the offset generation network. Subsequently, for the aforementioned offset-adjusted feature points, the bilinear interpolation method (referred to as “bilinearly interpolated” in the original text) is used to extract feature information from key regions. After performing a projection operation on the extracted sampled features, deformed keys and deformed values are obtained, which together provide necessary support for the subsequent attention calculation process. Additionally, DAttention further calculates the relative positional offsets between deformed keys and the query grid, and integrates this offset information into the multi-head attention mechanism to supplement critical positional context information.
In this work, the DAttention mechanism is integrated into the original AIFI module to construct a novel DAttention–AIFI structure. To begin with, the module carries out dimension conversion on the 2D S
5 feature maps and transforms them into one-dimensional vector representations. It then inputs this 1D vector into the DAttention–AIFI module to carry out the feature processing workflow. Within this module, the integration of two key units, namely multi-head self-attention (MHSA) and feed-forward network (FFN), supports the refined analysis and adaptive optimization of the input feature information. After the completion of the feature processing workflow, the module further reshapes its output features into a 2D format (denoted as F5), which offers effective input support for the ensuing cross-scale feature fusion phase.
In these equations, DAttn stands for the deformable attention calculation, while Reshape represents the operation that adjusts the feature dimension back to the same shape as S5, and it is the inverse process of Flatten (flattening operation).
This refined deformable attention fusion mechanism dramatically optimizes the model’s feature processing efficiency. Meanwhile, it effectively improves object detection accuracy under complex field conditions through more delicate feature interaction procedures.
2.7. HS-FPN
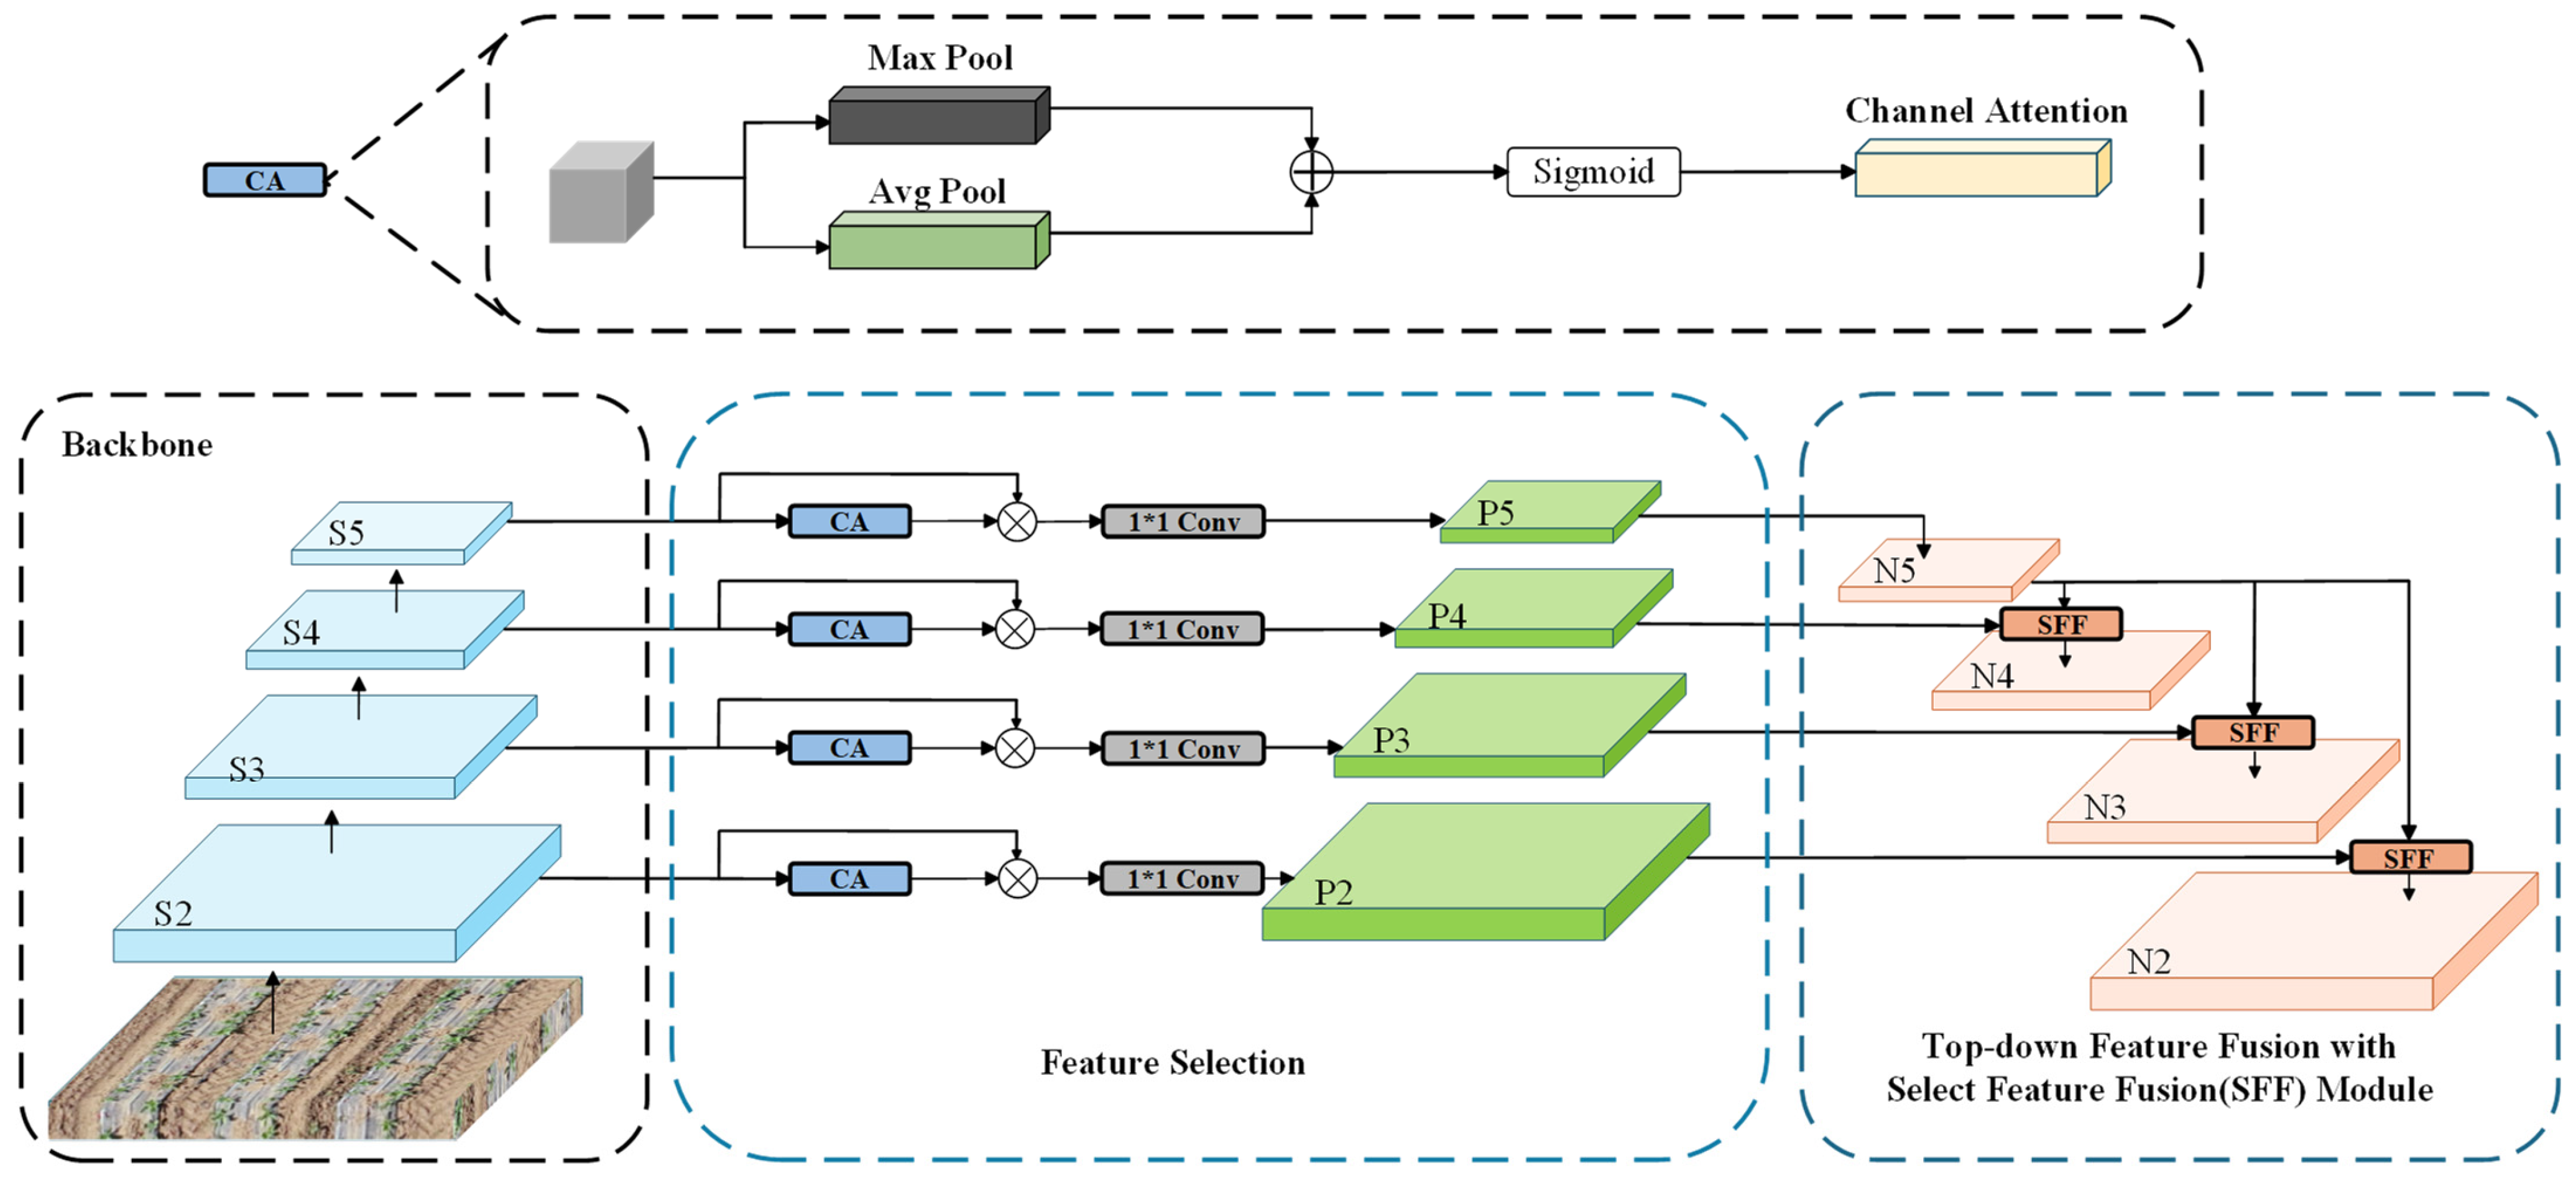
To better tackle the multi-scale detection difficulties arising from dense small targets and image blurring in UAV-captured beet seedling scenarios, we adopted the HS-FPN to build the neck network of our model. As a specialized network architecture developed to address the inherent multi-scale obstacles in dense small-target datasets, HS-FPN is visualized in
Figure 8. Its core working principle consists of two key components: feature extraction and feature fusion, which can notably strengthen the capacity to extract and integrate features from tiny seedling targets and blurred input images [
31].
As illustrated in
Figure 9, Within the feature selection module, multi-scale feature maps are initially subjected to a filtering operation, with the processing object being the feature map
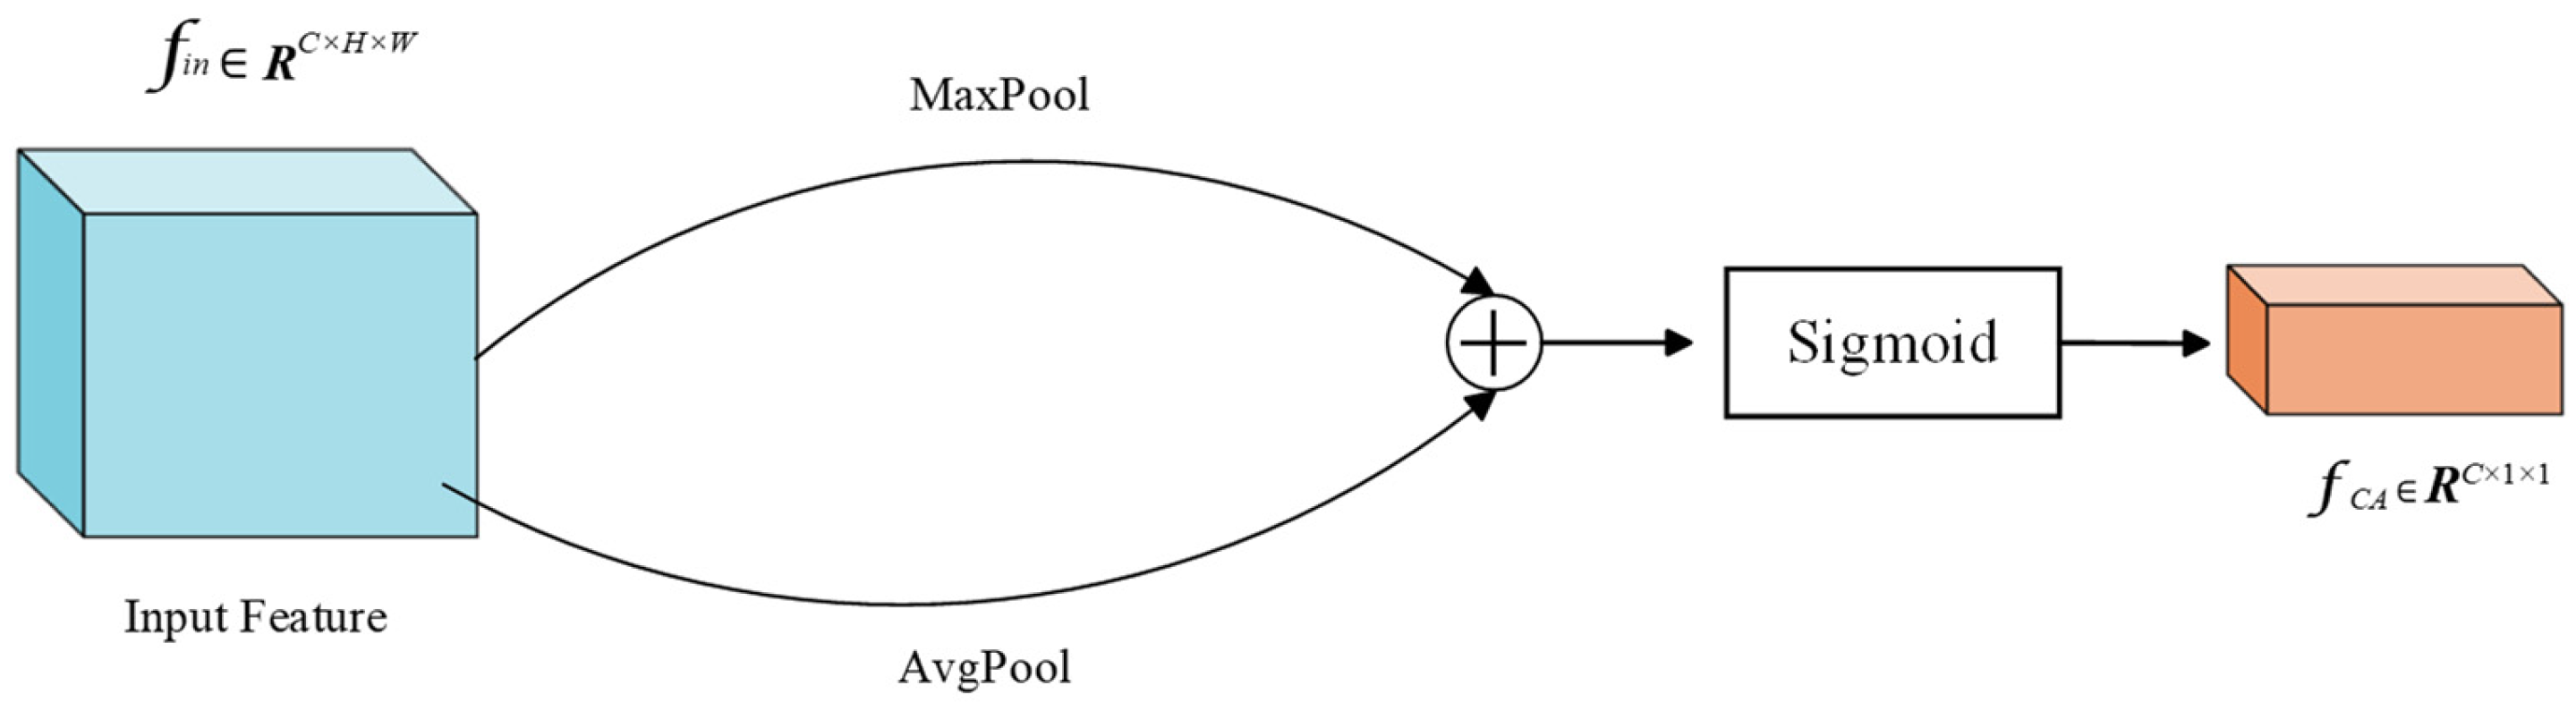
(here, C represents the total number of channels, H stands for the height of the feature map, and W indicates the corresponding width of the feature map). This module enhances target-related features via the channel attention (CA) mechanism: it separately applies global max pooling and global average pooling to the input feature map to extract and combine key channel information. Subsequently, it generates channel weights
through the Sigmoid activation function, thereby highlighting important channels related to sugar beet seedlings and reducing background interference. Meanwhile, dimension matching (DM) ensures that features of different scales are effectively aligned in the channel dimension through pooling operations, adapting to the diversity of target shapes and distributions.
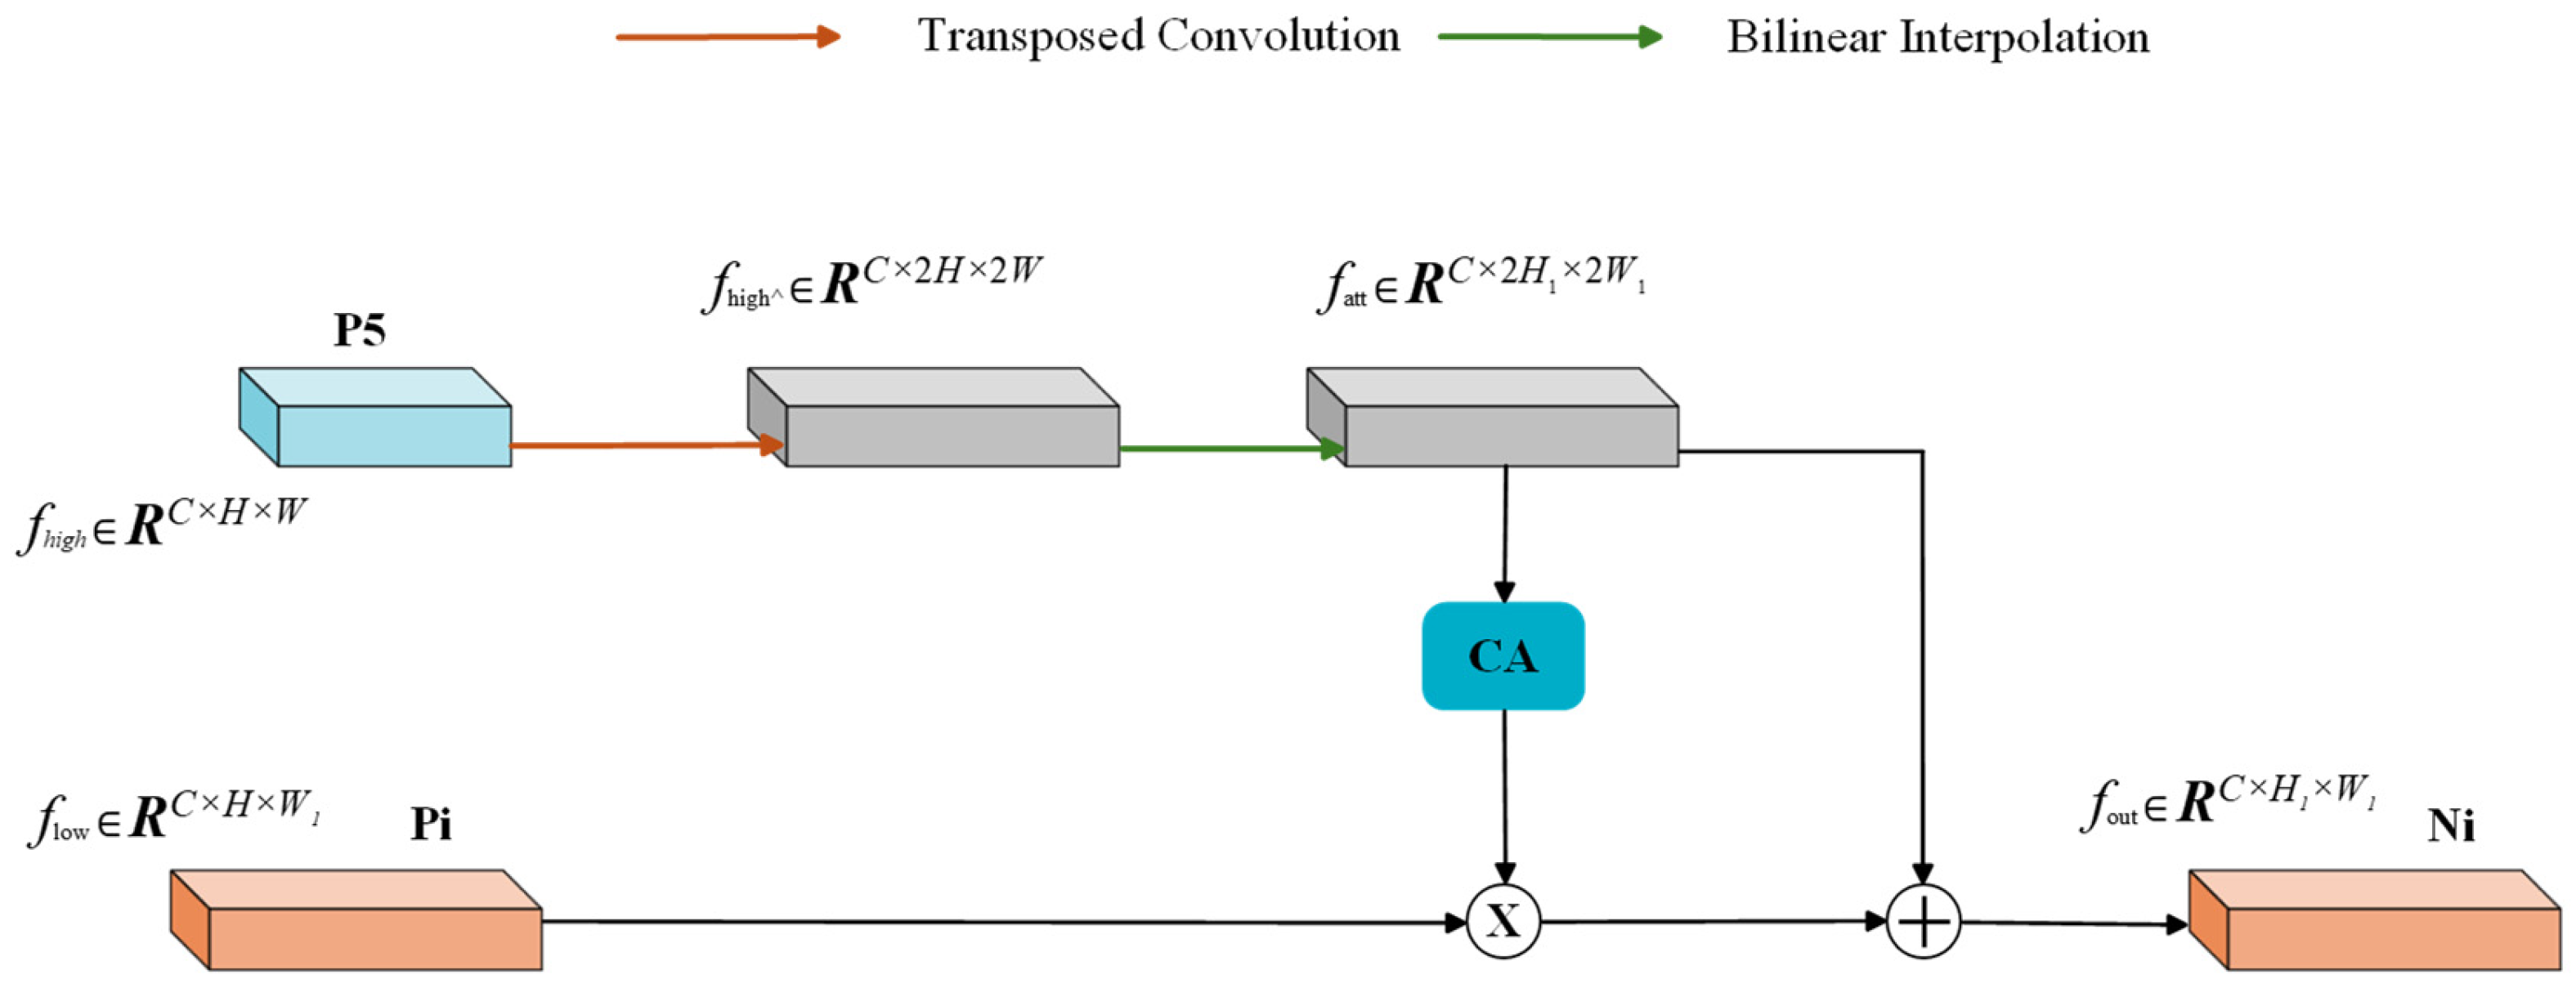
As exhibited in
Figure 10, the designed feature fusion module uses the selective feature fusion (SFF) mechanism to achieve effective integration of both high-level and low-level features. The input high-level feature
is, and the low-level feature is
.
First, the high-level feature is upsampled via a transposed convolution with stride 2 and kernel size 3 × 3, yielding the expanded feature . Subsequently, bilinear interpolation is performed to acquire , which matches the spatial resolution of the low-level feature.
Subsequently, the high-level feature is processed by channel attention (CA), which converts it into attention weights to filter out redundant information in the low-level feature. Ultimately, the refined low-level feature is integrated with the high-level feature, generating the final fused feature
. This process is formulated in Equations (5) and (6).
By virtue of its elaborately designed feature selection and fusion components, the HS-FPN architecture enables the model to stably detect sugar beet seedlings even in complex backgrounds and under fluctuating illumination conditions.
3. Results
3.1. Experimental Environment
To ensure the accuracy of algorithm performance evaluation, this experimental platform is built on the Windows 10 64-bit system. The hardware platform is equipped with an NVIDIA GeForce RTX 3090 Ti graphics card possessing 12 GB of video memory, an AMD Ryzen 7 5700X CPU (eight cores, main frequency of 3.40 GHz), and 32 GB of RAM. In terms of the software environment, Python 3.10 is employed for model implementation, PyTorch 2.4.1 serves as the core deep learning framework, and CUDA 12.6 is configured as the parallel computing toolkit. For specific training parameters, please refer to
Table 1 in this paper.
3.2. Evaluation Indicators
To objectively evaluate the detection performance of the model on UAV-captured sugar beet images, this work adopts several evaluation indicators, including precision (P), recall (R), mean average precision (mAP), Params, FLOPs, and model size. These indexes are adopted to measure the detection accuracy of beet seedlings.
In this work, precision (P) is defined as the proportion of correctly identified seedlings relative to the total number of predicted positive samples. Recall (R) denotes the ratio of correctly detected seedlings to the total number of real targets in the images. Meanwhile, mAP stands for the mean value of average precision (AP) over all classes.
The corresponding calculation formulas are given below:
Among these, true positives (TP) and false positives (FP) stand for the counts of accurately predicted positive samples and erroneously predicted positive samples, respectively. Similarly, false negatives (FN) and true negatives (TN) represent the numbers of misclassified negative samples and correctly identified negative samples, respectively. C indicates the total number of classes in the dataset, K represents the scale of the convolution kernel, while Cin and Cout correspond to the numbers of input and output feature channels, respectively.
3.3. Ablation Experiment
To validate the efficacy of the proposed approach, ablation studies are performed on the LDH-RTDETR model. In this work, RT-DETR is adopted as the baseline framework, and targeted improvements are implemented on both the backbone and neck components. Specifically, the original backbone is substituted with LSNet, and the neck structure is enhanced via the HS-FPN and DAttention modules.
As shown in
Table 2, the recognition accuracy of the original RT-DETR model is 84.1%. The original model has certain limitations. In high-altitude UAV remote sensing images, sugar beet targets occupy only a small number of pixels and are easily disturbed by similar backgrounds, which leads to difficulty in extracting effective distinguishable features. Meanwhile, for practical application scenarios, it is necessary to further achieve model lightweighting.
This study designed eight sets of ablation experiments, denoted as M0 to M8. All experiments were trained and tested under identical experimental setups and datasets to guarantee the comparability of experimental results. As demonstrated in
Table 2, with the integration of each proposed improvement module, the model achieves a significant enhancement in lightweight design while maintaining overall performance. Specifically, when the backbone network is replaced with LSNet, the recall rate and mAP50 of M1 decrease slightly compared with M0, whereas the corresponding FLOPs and model size are reduced by 20.98 G and 10.2 MB, respectively. Subsequently, replacing AIFI in the neck with DAT strengthens the model’s capacity to extract small-target features, further improving its precision. Finally, introducing HS-FPN into the neck network significantly improves the multi-scale target extraction ability. Compared with model M4, the model size stays nearly unchanged, while the precision and mAP50 are increased by 1.8% and 1.7%, respectively. Compared with the original model, the optimized model achieves significant improvements in both precision (increased from 84.1% to 87.7%) and mAP50/% (increased from 88.3% to 90.4%), while maintaining a significant lightweight advantage.
Ablation experiments show that the proposed improvements work together with a clear positive effect. Which verifies the effectiveness of the technical scheme of this study in the UAV-based sugar beet image detection task.
3.4. Performance Comparison Among Different Detection Models
In order to assess the object detection performance of our improved LDH-RTDETR model on UAV-captured sugar beet images, this study selects two classic models (Faster R-CNN [
32] and SSD [
33]), the RT-DETR series (RT-DETR, RT-DETR-L, RT-DETR-R34, RT-DETR-R50) [
22], and the YOLO series [
34,
35,
36] as comparative baselines. Experiments are conducted based on the same UAV sugar beet image test set, with uniform training and testing settings (including input image resolution and total iteration rounds) applied across all models.
Table 3 lists the quantitative results, including precision, recall, mAP@0.5, parameters, FLOPs, FPS, and model size. As can be observed from the table, the traditional Faster R-CNN and SSD models possess substantially larger FLOPs and parameter quantities, which render them unable to satisfy the lightweight deployment needs of UAV platforms. Although YOLOv5-m has superior parameter efficiency and lightweight characteristics, its detection precision is insufficient (precision: 79.6%, mAP@0.5: 85.7%). In contrast, LDH-RTDETR, with a model size of only 43.3 MB (0.8 MB larger than that of YOLOv5-m), achieves a precision of 87.7%, an mAP@0.5 of 90.4%, an inference speed of 82.64 fps, and FLOPs of 63.97 G FLOPs. Specifically, its precision and mAP@0.5 are 8.1% and 4.7% higher than those of the YOLOv5-m model, respectively.
The improved LDH-RTDETR model presented in this work exhibits superior comprehensive performance and presents distinct advantages when applied to sugar beet seedling detection tasks. Specifically, the LDH-RTDETR model achieves higher detection precision than RT-DETR, RT-DETR-L, RT-DETR-R34 and RT-DETR-R50, with improvement margins of 3.6%, 0.5%, 9.5%, and 2% in sequence. The recall is boosted by 0.5%, 13.8%, 1.7%, and 7.1% in sequence. A higher recall demonstrates that the model effectively lowers the occurrence of missed detections, allowing more targets to be successfully recognized. The mAP50 is increased by 2.1%, 2.8%, 4.3%, and 6.8% respectively. A high mAP fully reflects the superior detection accuracy of the model. It also illustrates its strong capability in lowering false detections and maintaining robustness under diverse background and environmental variations. Experimental results demonstrate that the LDH-RTDETR model achieves fast and robust identification, along with precise localization of small sugar beet targets within complex scenes captured by UAV imagery.
3.5. The Comparison Experiment of Lightweight Backbone
Backbone networks, as the core feature extraction modules of deep learning models, have their structural design directly determining the models’ feature representation capability and final performance. Several representative lightweight backbone networks are adopted for comparative experiments to verify the effectiveness of the proposed LSNet. Specifically, RepViT [
37], EfficientViT [
38], MobileNetV4 [
39], and Fasternet [
40] are selected as backbone networks, and evaluations are conducted around three dimensions: number of parameters, computational complexity, and detection precision.
Table 4 illustrates that all lightweight backbone networks achieve different levels of reduction in FLOPs, Params and model size relative to the original RT-DETR backbone. That is, their lightweight levels are all superior to the original structure. LSNet performs the best in the recall rate metric, and its precision and mAP50 are only 0.2% and 0.4% lower than those of the best-performing RepViT, respectively. Nevertheless, the FLOPs, parameter quantity and model size of this model are the largest among all tested models, reaching 71.73 G, 23.14 M, and 44.9 MB respectively. Such characteristics fail to satisfy the lightweight demands of UAV detection scenarios. Compared with RepViT, EfficientViT, Fasternet, and LSNet have all shown better performance in terms of model lightweighting, among which LSNet performs the best in detection performance metrics.
In summary, in the UAV-captured sugar beet image detection task, LSNet performs the best. Its concise lightweight structure sustains strong computational efficiency while guaranteeing reliable detection precision, making it well suited to the computing constraints of UAV applications. LSNet is thus chosen as the backbone network in this work.
3.6. Deployment of Improved RT-DETR on NVIDIA Jetson
In large-scale sugar beet cultivation, real-time seedling recognition is limited by insufficient field network bandwidth and computing power. Consequently, the optimized LDH-RTDETR model is deployed on the NVIDIA Jetson Orin Nano Super NX edge platform with TensorRT acceleration. Experimental findings indicate that the inference latency decreases from 12.1 ms to 9.55 ms, FPS increased from 82.6 to 104.6 (1.26× speedup) with almost unchanged accuracy, providing a high-precision, lightweight and practical solution for field deployment (
Table 5).
3.7. Comparative Analysis of Sugar Beet Recognition Models
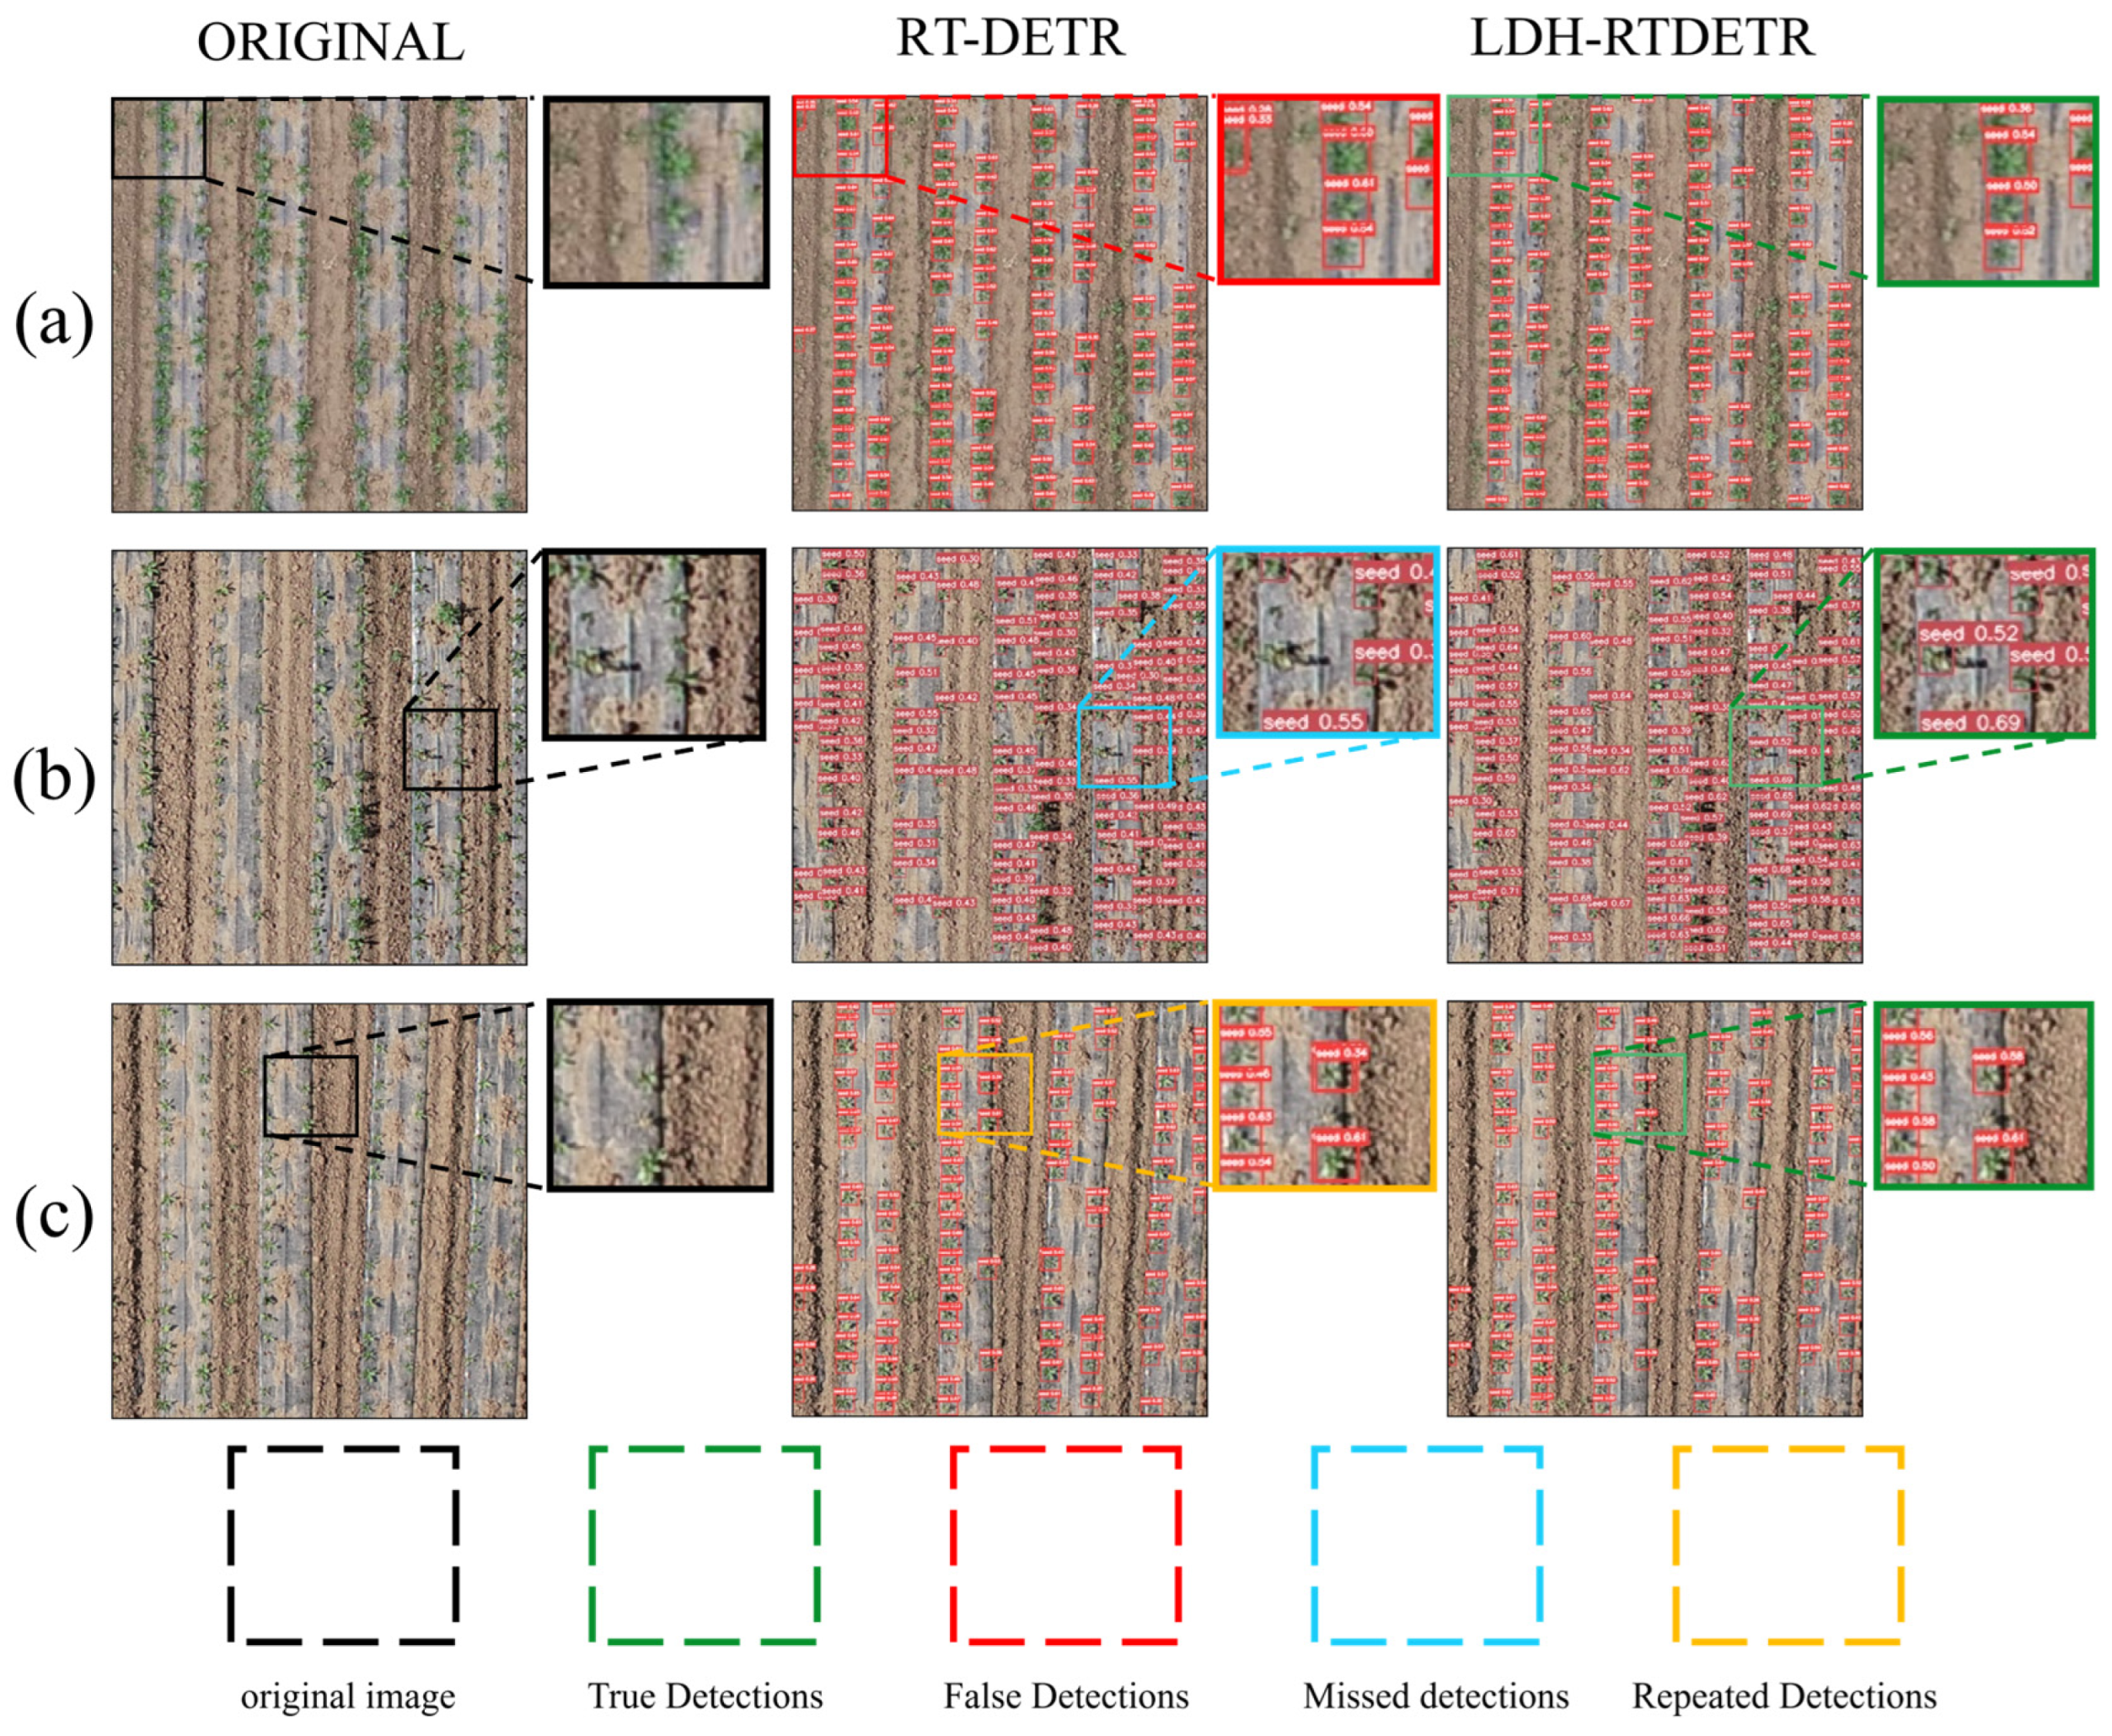
To verify the practical efficacy of the proposed LDH-RTDETR framework, real-time object detection experiments are conducted on sugar beet seedling imagery acquired by UAVs, with the vanilla RT-DETR model serving as the baseline for comparison.
Figure 11 presents the visualization outcomes. The detection results in the corresponding “ORIGINAL” column directly reveal the limitations of the vanilla RT-DETR-r18 model. Its AIFI encoding module adopts a fixed attention mechanism and cannot accurately focus on seedling regions; the “False Detections” boxes in the figure correspond to its misclassification of morphologically analogous weeds (e.g., barnyard grass) and soil clumps as sugar beet seedlings. Since the cross-scale feature fusion module has low feature propagation efficiency for small-sized seedlings, the tiny and weak seedlings in the regions corresponding to “Missed Detections” are not effectively identified. In dense seedling areas, the model’s detection boxes lack sufficient discriminability for dense features, and the “Repetitional Detections” boxes show that it outputs overlapping detection boxes for adjacent seedlings, leading to the problem of repetitive detection. This comparison confirms that LDH-RTDETR, through the dual optimization of the attention mechanism and cross-scale fusion, significantly enhances the feature discrimination and localization capabilities for targets in complex agricultural scenarios.
3.8. Visualization Analysis via Heatmaps
For a deeper investigation into the effect of model optimization, the gradient-weighted class activation mapping (Grad-CAM) method [
41] is adopted to perform visual analysis on the feature response layers of both the original RT-DETR and the improved model.
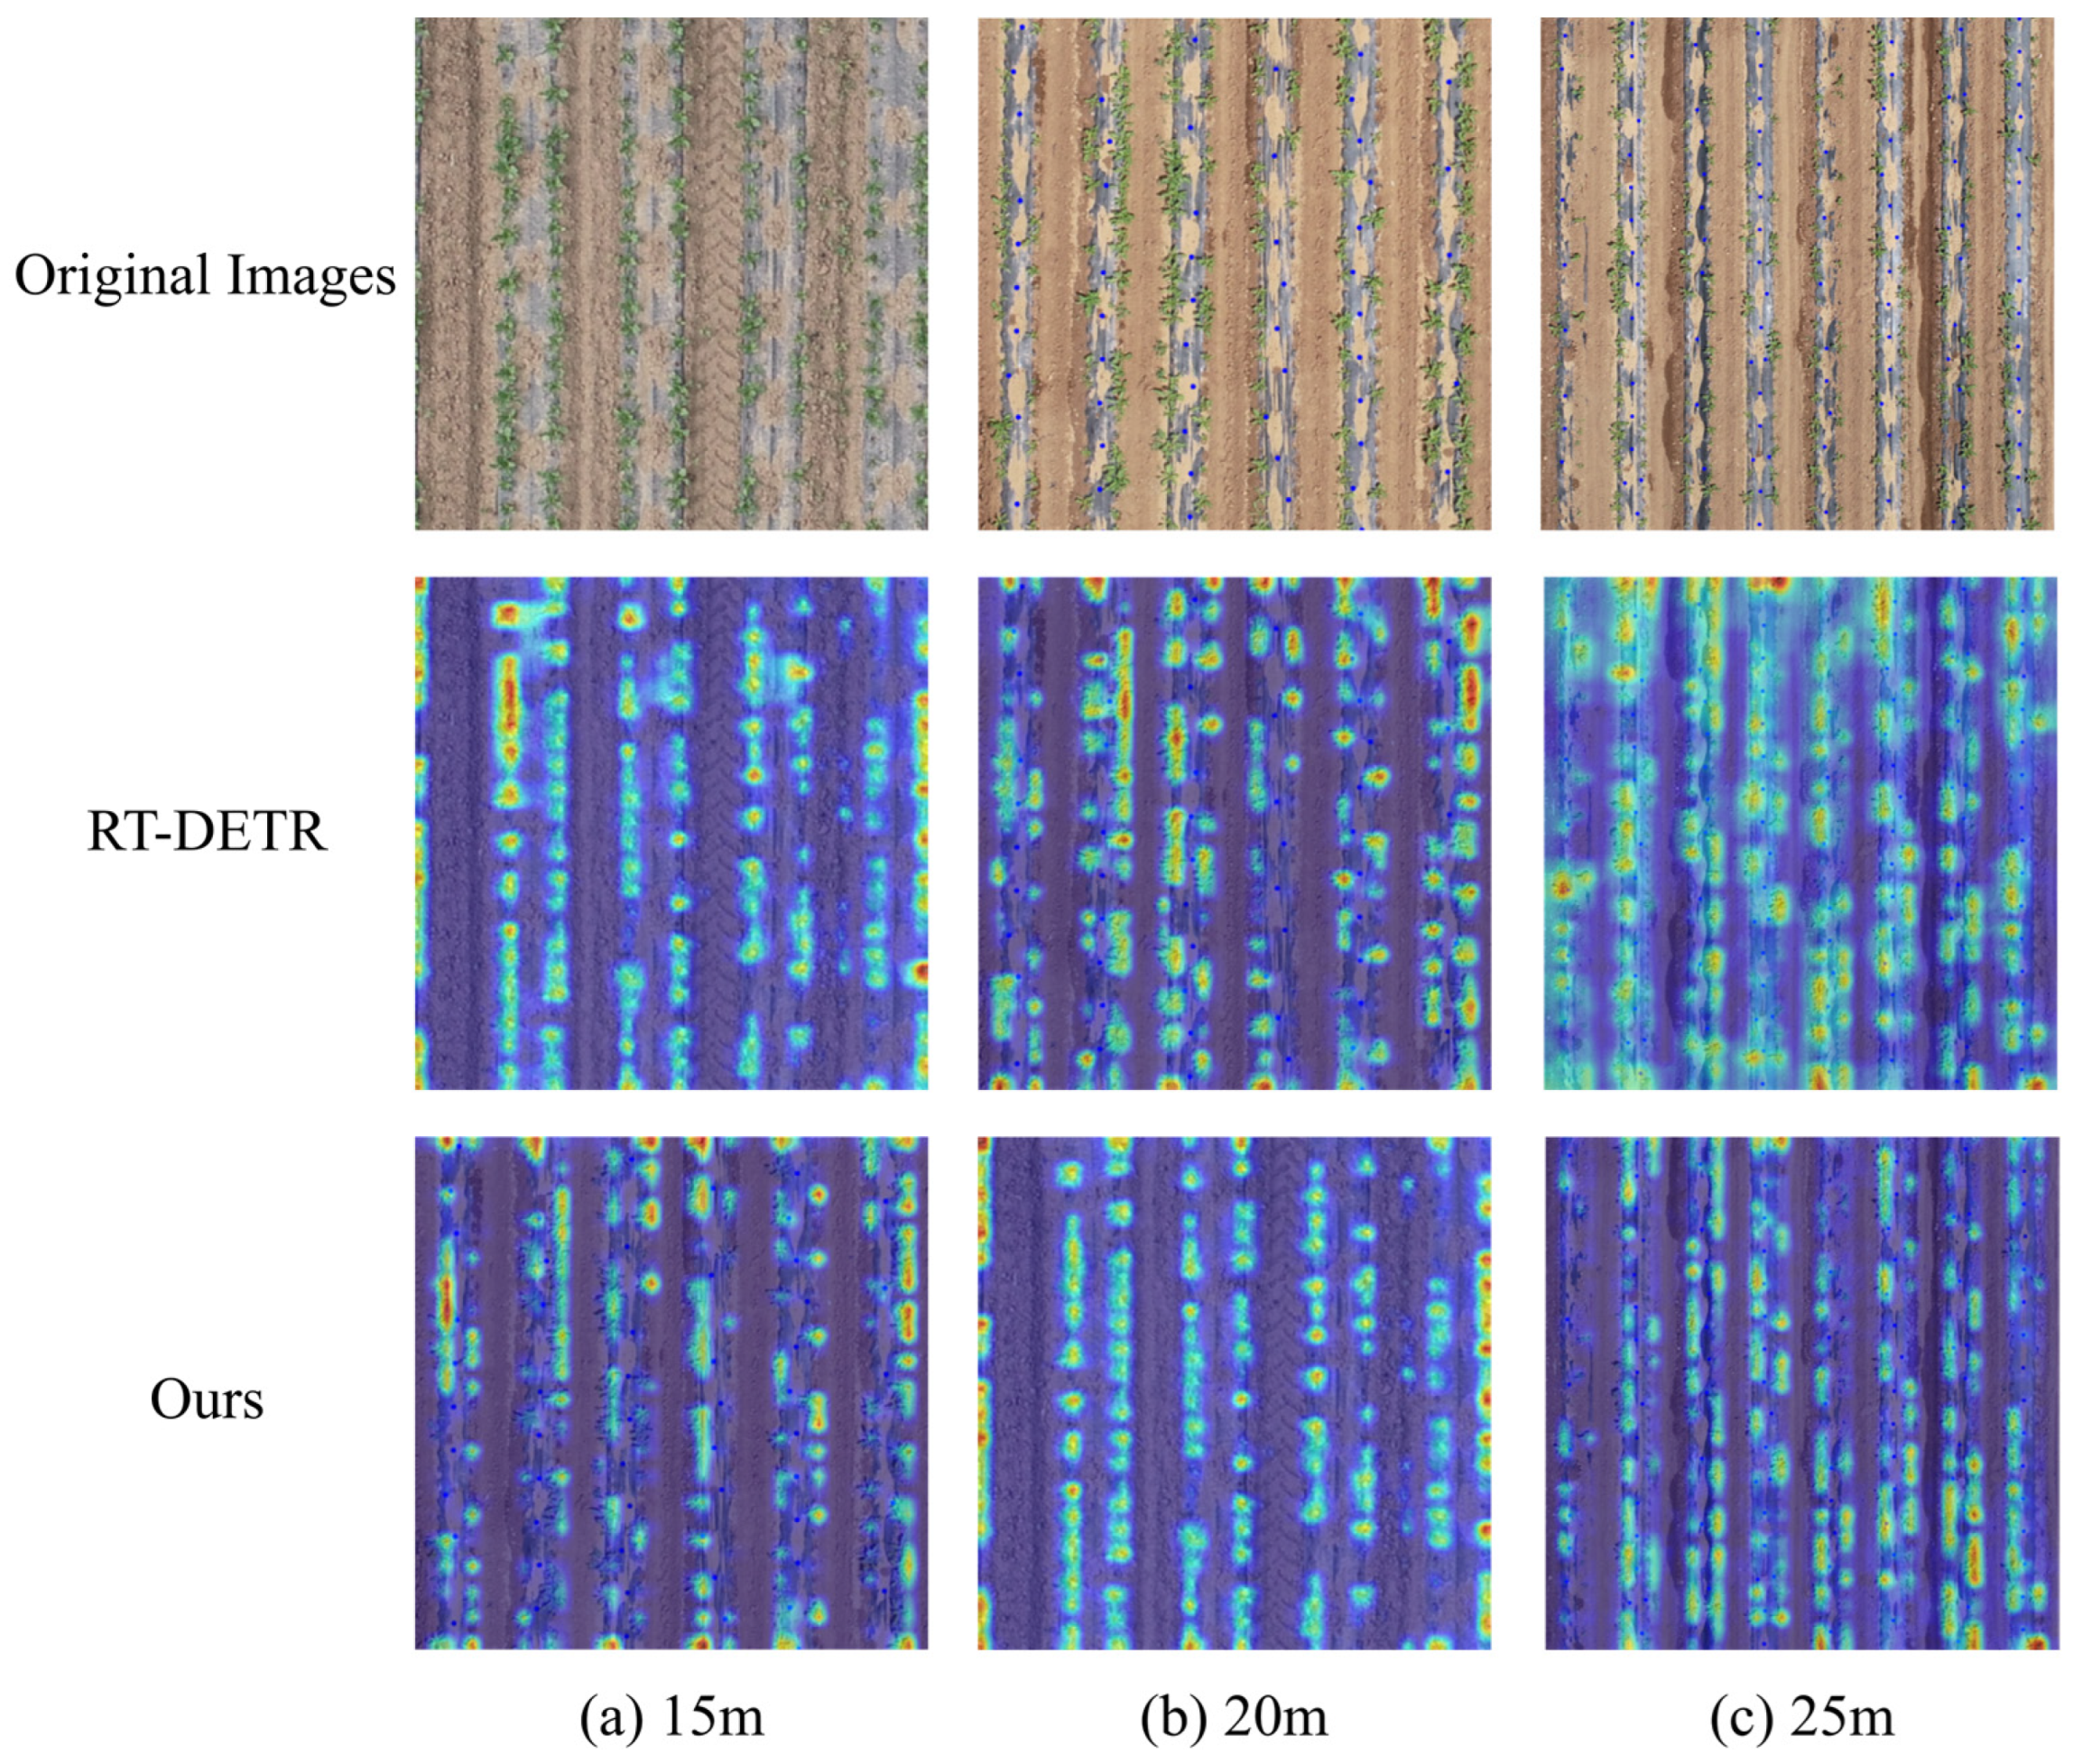
Figure 12 shows that Grad-CAM can observe the distribution characteristics of the model’s regions of interest and generate heatmaps to present the regions focused on by the model during decision-making. Comparative experiments were implemented on sugar beet field images collected at three different observation heights: 15 m, 20 m, and 25 m. From the results of
Figure 11a–c, the improved model can fully utilize multi-scale feature information with thermal responses more concentrated on the seedling bodies, which verifies its effectiveness in detecting multi-scale sugar beet seedlings under complex backgrounds.
4. Discussion
4.1. Improvement Strategies
In the current research on sugar beet seedling detection, the traditional manual counting method has the problems of time-consuming and labor-intensive operation as well as high error rate. Traditional machine learning algorithms rely on manually designed features, leading to insufficient generalization ability in complex field environments. Existing deep learning models have achieved certain progress, but they focus mainly on field weed detection, while specialized research targeting sugar beet seedlings is relatively scarce. Furthermore, it is difficult to strike a balance among lightweight design, real-time inference efficiency, and small-target detection precision in UAV-based scenarios. Conversely, the LDH-RTDETR framework proposed in this work effectively addresses these bottlenecks. It can adapt to the embedded resource constraints of UAV and enhance the small target recognition capability.
The findings from the ablation study demonstrate that, relative to the baseline RT-DETR architecture, all improved modules are effective. Specifically, these modules include the lightweight LSNet network structure, the deformable attention module, and the HS-FPN structure. The large-kernel selection and spatial selection mechanisms’ characteristics of LSNet enable efficient feature extraction; furthermore, replacing the original ResNet-18 backbone network with LSNet enhances feature extraction capability, while cutting the parameter scale by 10.2 MB and lowering computational complexity (FLOPs) by 20.98 G. The introduced deformable attention module can capture multi-scale contextual cues and dynamically adjusting the receptive field size based on target dimensions. Experimental data show that the independent operation of the deformable attention module can increase the detection accuracy and mAP by 2.3% and 1.5% respectively. In the neck network, the introduced HS-FPN structure is composed of a feature screening component module and a feature aggregation unit, which strengthens the ability to capture edge features in leaf overlapping regions and detailed features of weak and small seedlings. Further analysis shows that although the lightweight design of the LSNet network significantly improves computational efficiency, its standalone implementation leads to a marginal 0.68% drop in mAP relative to the baseline model due to the simplification of feature map dimensions. To resolve this contradiction, this study introduces the deformable attention module to compensate for the deficiency in fine-grained feature modeling capability. This module leverages the deformable attention heads of the vision transformer to achieve adaptive perception of target shapes. On this basis, to address insufficient cross-scale feature fusion, the HS-FPN structure is further adopted to replace the original cross-scale feature fusion module (CCFM). It utilizes an adaptive feature selection mechanism to strengthen the cross-layer propagation of effective semantic information, thereby significantly improving small target detection performance. Experimental results validate that the fusion of multiple modules effectively strikes a favorable balance between detection precision and computational cost, thereby attaining the best overall performance.
4.2. Limitations and Future Prospects
To fully assess the generalization capability of the proposed LDH-RTDETR framework, we conduct an in-depth analysis of its representative detection failure cases. Although the model performs well, the current dataset is limited as it was collected only in one site, during a single growing season, and under clear weather conditions, resulting in limited sample diversity that may restrict the model’s capacity to generalize in complicated field scenarios. For instance, it exhibits poor detection performance under overexposure from intense noon sunlight. For the detection deficiencies in overexposure scenarios, future research will expand sample collection in complex scenarios to improve the model’s field generalization ability. Meanwhile, to address the incomplete seedling segmentation problem that easily occurs when processing large-sized field images via subgraph cropping, a reasonable subgraph overlap rate will be set and a cross-subgraph feature fusion strategy introduced to further improve detection performance. In addition, this study plans to expand the collaborative application of the model with agricultural equipment such as seedling replanting robots, enabling detection results to guide field seedling replanting operations and promote the practical field application of the model.