Article

Phenotypic Diversity and Breeding Potential of Passiflora Germplasm Conserved Under Tropical Semi-Arid Conditions for Fruit Yield and Quality

by
Mariana Laurência Nunes de Lima
1,
Onildo Nunes de Jesus
2,
Fábio Gelape Faleiro
3,
Juliana Martins Ribeiro
4 and
Natoniel Franklin de Melo
4,*
1
Programa de Pós-Graduação em Agronomia—Produção Vegetal, Universidade Federal do Vale do São Francisco, Petrolina 56304-917, PE, Brazil
2
Embrapa Mandioca e Fruticultura, Cruz das Almas 44380-000, BA, Brazil
3
Embrapa Cerrados, Planaltina 73310-970, DF, Brazil
4
Embrapa Semiárido, Petrolina 56302-970, PE, Brazil
*
Author to whom correspondence should be addressed.
Agriculture 2026, 16(5), 521; https://doi.org/10.3390/agriculture16050521
Submission received: 22 January 2026 / Revised: 11 February 2026 / Accepted: 24 February 2026 / Published: 26 February 2026
(This article belongs to the Special Issue Fruit Quality Formation and Regulation in Fruit Trees)

Abstract

Passiflora germplasm represents an important genetic resource for improving fruit yield and quality in breeding programs targeting semi-arid environments. This study aimed to assess the phenotypic diversity, genetic parameters, and breeding potential of Passiflora accessions conserved in the Passion Fruit Active Germplasm Bank of Embrapa Semiárido. A total of 55 accessions, predominantly Passiflora cincinnata Mast., were evaluated using morphoagronomic descriptors related to plant, flower, and fruit traits. Quantitative data were analyzed using mixed linear models (REML/BLUP) to estimate genetic parameters, and multivariate analyses were applied to characterize phenotypic divergence. Substantial phenotypic variability was observed, particularly for fruit-related traits. Fruit weight ranged from 43.25 to 142.88 g, pulp weight ranged from 7.86 to 51.37 g, and pulp yield ranged from 17.06% to 40.27% among accessions. Broad-sense heritability estimates for key fruit traits were moderate to high, reaching 0.50 for fruit weight, 0.49 for pulp weight, and 0.36 for pulp yield, indicating favorable prospects for selection. Principal Component Analysis explained 66.0% of the total variation in the first two components, with fruit size, pulp-related traits, and seed number contributing most strongly to accession differentiation. Multivariate analyses consistently identified accessions 1 and 16 as superior for fruit weight and pulp yield, whereas accession 55 combined high fruit weight with elevated soluble solid content (up to 14.24 °Brix) but lower pulp yield. Overall, the observed variability highlights the relevance of Passiflora germplasm conserved under semi-arid conditions as a valuable resource for breeding programs focused on fruit yield, quality, and adaptation to water-limited environments.

1. Introduction

The genus Passiflora L. (Passifloraceae) comprises more than 500 species with pantropical distribution, with Brazil recognized as its main center of diversity and endemism [1,2]. Beyond its botanical relevance, Passiflora is strategically important in tropical and subtropical agriculture, especially due to the cultivation of sour passion fruit (Passiflora edulis Sims), one of the most economically important fruit crops in Brazil [3]. Passion fruit production is largely directed to the fresh fruit and juice industries, where fruit size, pulp yield, soluble solid content, and uniformity are key traits determining market value and profitability [4,5].
Despite its economic relevance, passion fruit production remains constrained by low average yields, susceptibility to biotic stresses, and limited adaptation to adverse environmental conditions, while the narrow genetic base of commercial cultivars represents a major challenge for crop improvement programs [6,7,8]. In Brazil, national yields remain well below the crop’s estimated productive potential, particularly in regions characterized by high temperatures, irregular rainfall, and prolonged drought periods [9,10]. These limitations highlight the urgent need to broaden the genetic base of cultivated passion fruit and to incorporate adaptive traits that enhance fruit production stability and quality under challenging environments.
Semi-arid regions represent one of the most critical scenarios for passion fruit cultivation, as water deficits, thermal stress, and high evaporative demand directly affect flowering, fruit set, and fruit development [11,12]. In this context, wild and native Passiflora species, especially those naturally occurring in the Brazilian Caatinga, constitute valuable genetic resources. Species such as Passiflora cincinnata Mast. exhibit remarkable adaptation to water-limited environments and harbor traits of agronomic interest, including tolerance to abiotic stresses, prolonged flowering periods, resistance to major diseases, and substantial variation in fruit-related traits [13,14]. These attributes make wild Passiflora species promising candidates for pre-breeding and for the development of cultivars better suited to semi-arid agriculture.
Reproductive biology plays a central role in fruit production efficiency in Passiflora. The predominance of allogamy, combined with floral traits such as herkogamy, androginophore length, and stigma positioning, directly influences pollination success and fruit set [15,16,17]. Recent studies have highlighted the relevance of functional herkogamy in Passiflora species, demonstrating that spatial variation between anthers and stigmas, as well as the occurrence of atypical floral morphologies (e.g., increased stigma number), can significantly affect pollination dynamics and fruit production [18]. These findings reinforce the importance of integrating floral phenotyping into breeding-oriented studies, particularly when fruit yield and quality are primary targets.
Plant genetic resources conserved in germplasm banks constitute the foundation of crop improvement programs; however, their effective utilization depends on comprehensive phenotypic characterization, which enables the identification of accessions with superior agronomic performance and breeding potential [19,20]. In Passiflora, although extensive germplasm collections have been established in Brazil, many accessions remain underexplored with respect to fruit-related traits and their genetic control, particularly under semi-arid conditions [13,21]. This knowledge gap limits the strategic use of germplasm in breeding programs aimed at improving fruit yield, quality, and environmental adaptation. In this context, the Passiflora Active Germplasm Bank maintained by Embrapa Semiárido represents a strategic collection composed predominantly of accessions originating from the Brazilian semi-arid region and conserved under field conditions for extended periods. The accessions used in this study include representatives of cultivated and wild Passiflora species, displaying wide phenotypic variation in plant architecture, floral morphology, and fruit size and quality traits. Although detailed agronomic characterization remains limited for most accessions, this germplasm provides a unique opportunity to evaluate phenotypic diversity related to plant, flower, and fruit traits and to identify accessions with superior fruit production potential and adaptation to semi-arid environments.
Plant phenotyping based on classical morphoagronomic descriptors remains a robust, accessible, and cost-effective approach for characterizing genetic diversity in germplasm collections [22,23]. When combined with genetic parameter estimation and multivariate analyses, phenotyping enables the identification of traits under strong genetic control, the structuring of phenotypic diversity, and the selection of divergent and superior accessions [24,25,26]. Such integrative approaches are particularly valuable for public breeding programs and for crops cultivated in marginal environments, where high-throughput phenotyping technologies are often unavailable.
Therefore, the objective of this study was to assess the phenotypic diversity, genetic parameters, and breeding potential of Passiflora accessions conserved in the Embrapa Semiárido germplasm bank using morphoagronomic descriptors, genetic parameter estimation, and multivariate analyses. By emphasizing fruit-related traits and reproductive characteristics, this work aims to support breeding strategies focused on improving fruit yield and quality and to contribute to the efficient and targeted use of Passiflora genetic resources in semi-arid agriculture.

2. Materials and Methods

2.1. Plant Material and Experimental Design

The study was conducted using accessions of Passiflora spp. conserved in the Active Germplasm Bank (AGB) of the Embrapa Semiárido (Petrolina, Brazil), located in Petrolina, Pernambuco State, Brazil (09°09′ S, 40°22′ W). The region is characterized by a semi-arid climate (BSh, Köppen classification), with a mean annual temperature around 26–27 °C, average minimum temperatures around 20–23 °C, and average maximum temperatures around 30–34 °C throughout the year. The mean annual rainfall is low, at approximately 430–445 mm, and relative humidity is generally moderate to low, reflecting the strong evaporative demand typical of semi-arid environments [9,11]. These climatic conditions provide context for the adaptation and performance of the evaluated accessions under field conditions. The Passion Fruit Active Germplasm Bank (AGB) comprises 74 accessions conserved under field conditions, from which 55 were selected for evaluation based on their economic relevance for fruit production and the availability of plant material during the assessment period. Fruit, plant, and flower descriptors were recorded for these accessions, as detailed in Table S1. The evaluated set comprised 51 accessions of Passiflora cincinnata Mast., two accessions of P. edulis Sims f. flavicarpa, one accession of P. setacea DC. and one accession of P. alata Curtis. The accessions originated from different areas of the Brazilian Caatinga biome and have been maintained under field conditions at Embrapa Semiárido since 2005.
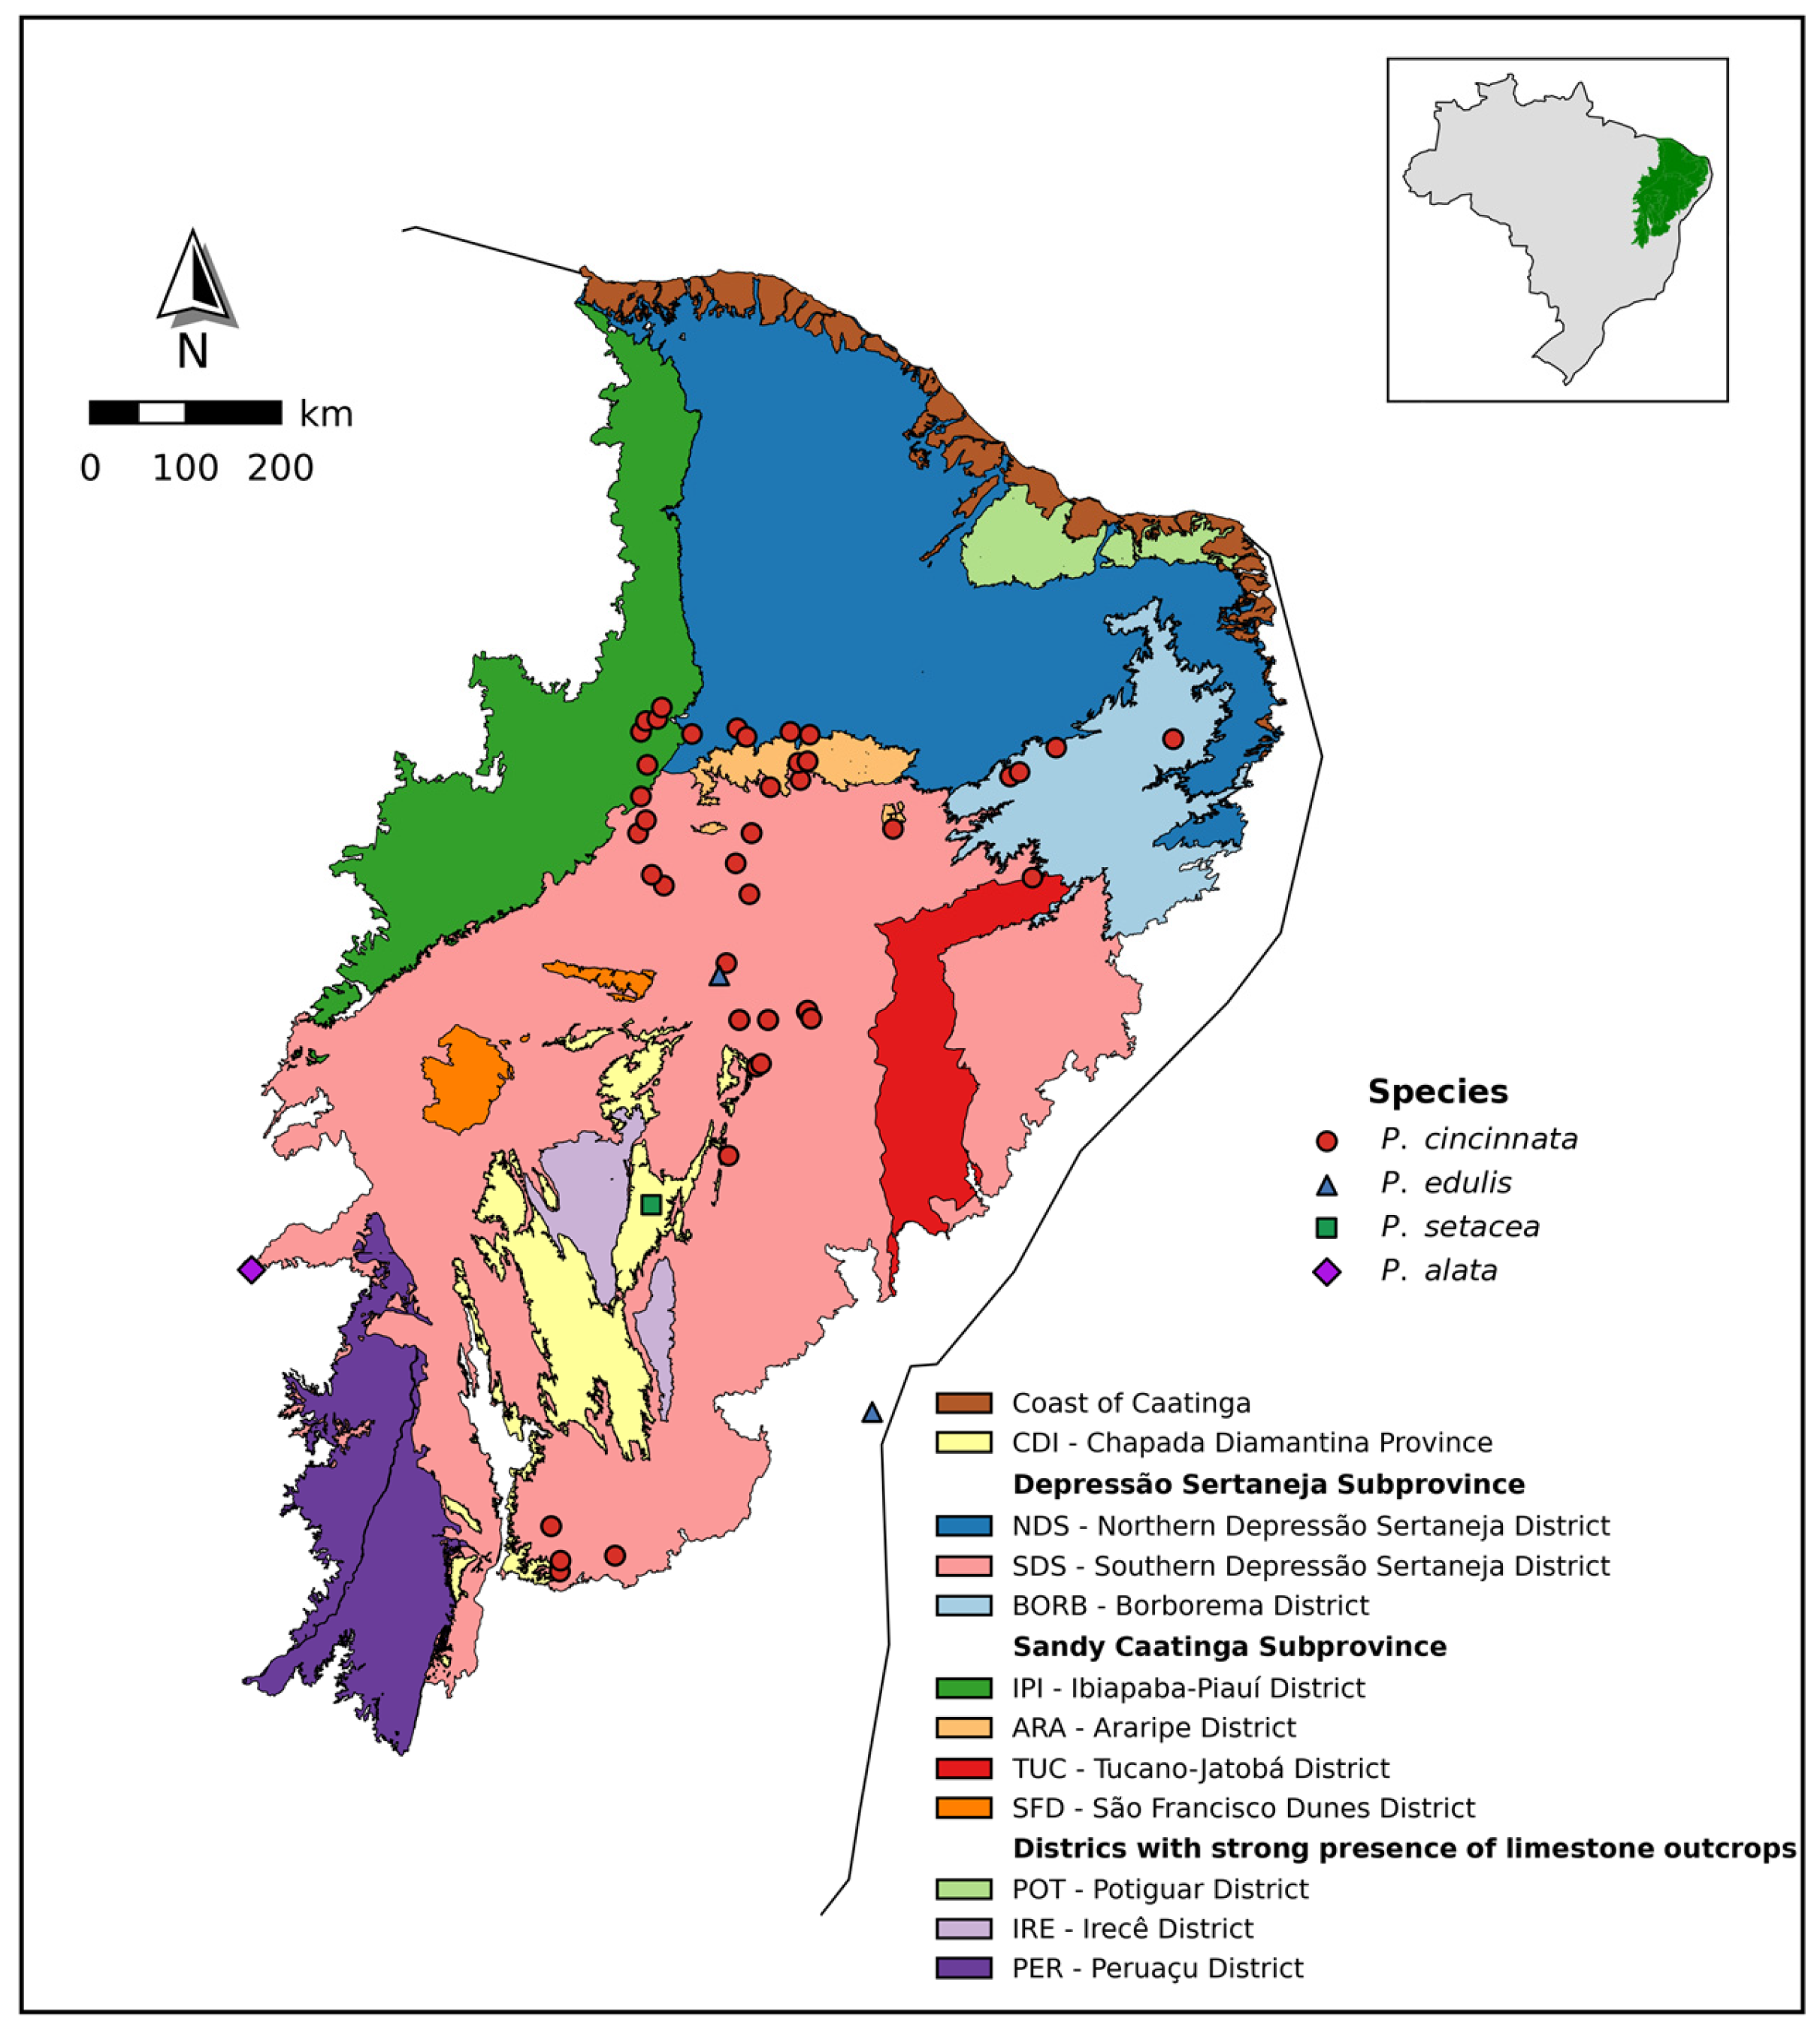
The geographical origin of the accessions is shown in Figure 1, overlaid on the Caatinga biome delimitation proposed by Moro et al. [27]. The map illustrating the geographic context of the study area was generated using R software (v.4.3.1). The base shapefile was obtained from the publicly available dataset provided by [27] and deposited in Figshare. Map construction and graphical editing were performed using the sf, ggplot2, and ggspatial packages in R (v.4.3.1).
The experiment was established under a conventional cultivation system, following standard management practices for passion fruit in the semi-arid region. Plants were obtained from seeds derived from controlled pollination within each accession. Since 2005, the plants in the Active Germplasm Bank have been periodically renewed every five years using newly established seed-derived plants. Plants were grown on trellising systems and managed according to local technical recommendations, including irrigation, fertilization, pruning, and phytosanitary control [28].
The experimental design consisted of a randomized complete block design, with accessions considered as treatments. Each accession was represented by three plants per block, with three blocks, and evaluations were conducted during the productive cycle under uniform management conditions.

2.2. Phenotypic Characterization

Phenotypic characterization was performed using morphoagronomic descriptors, following standardized descriptor lists for Passiflora spp. proposed by Bioversity International and Embrapa [20,29]. Descriptors were grouped into plant, flower, and fruit categories.

2.2.1. Plant Descriptors

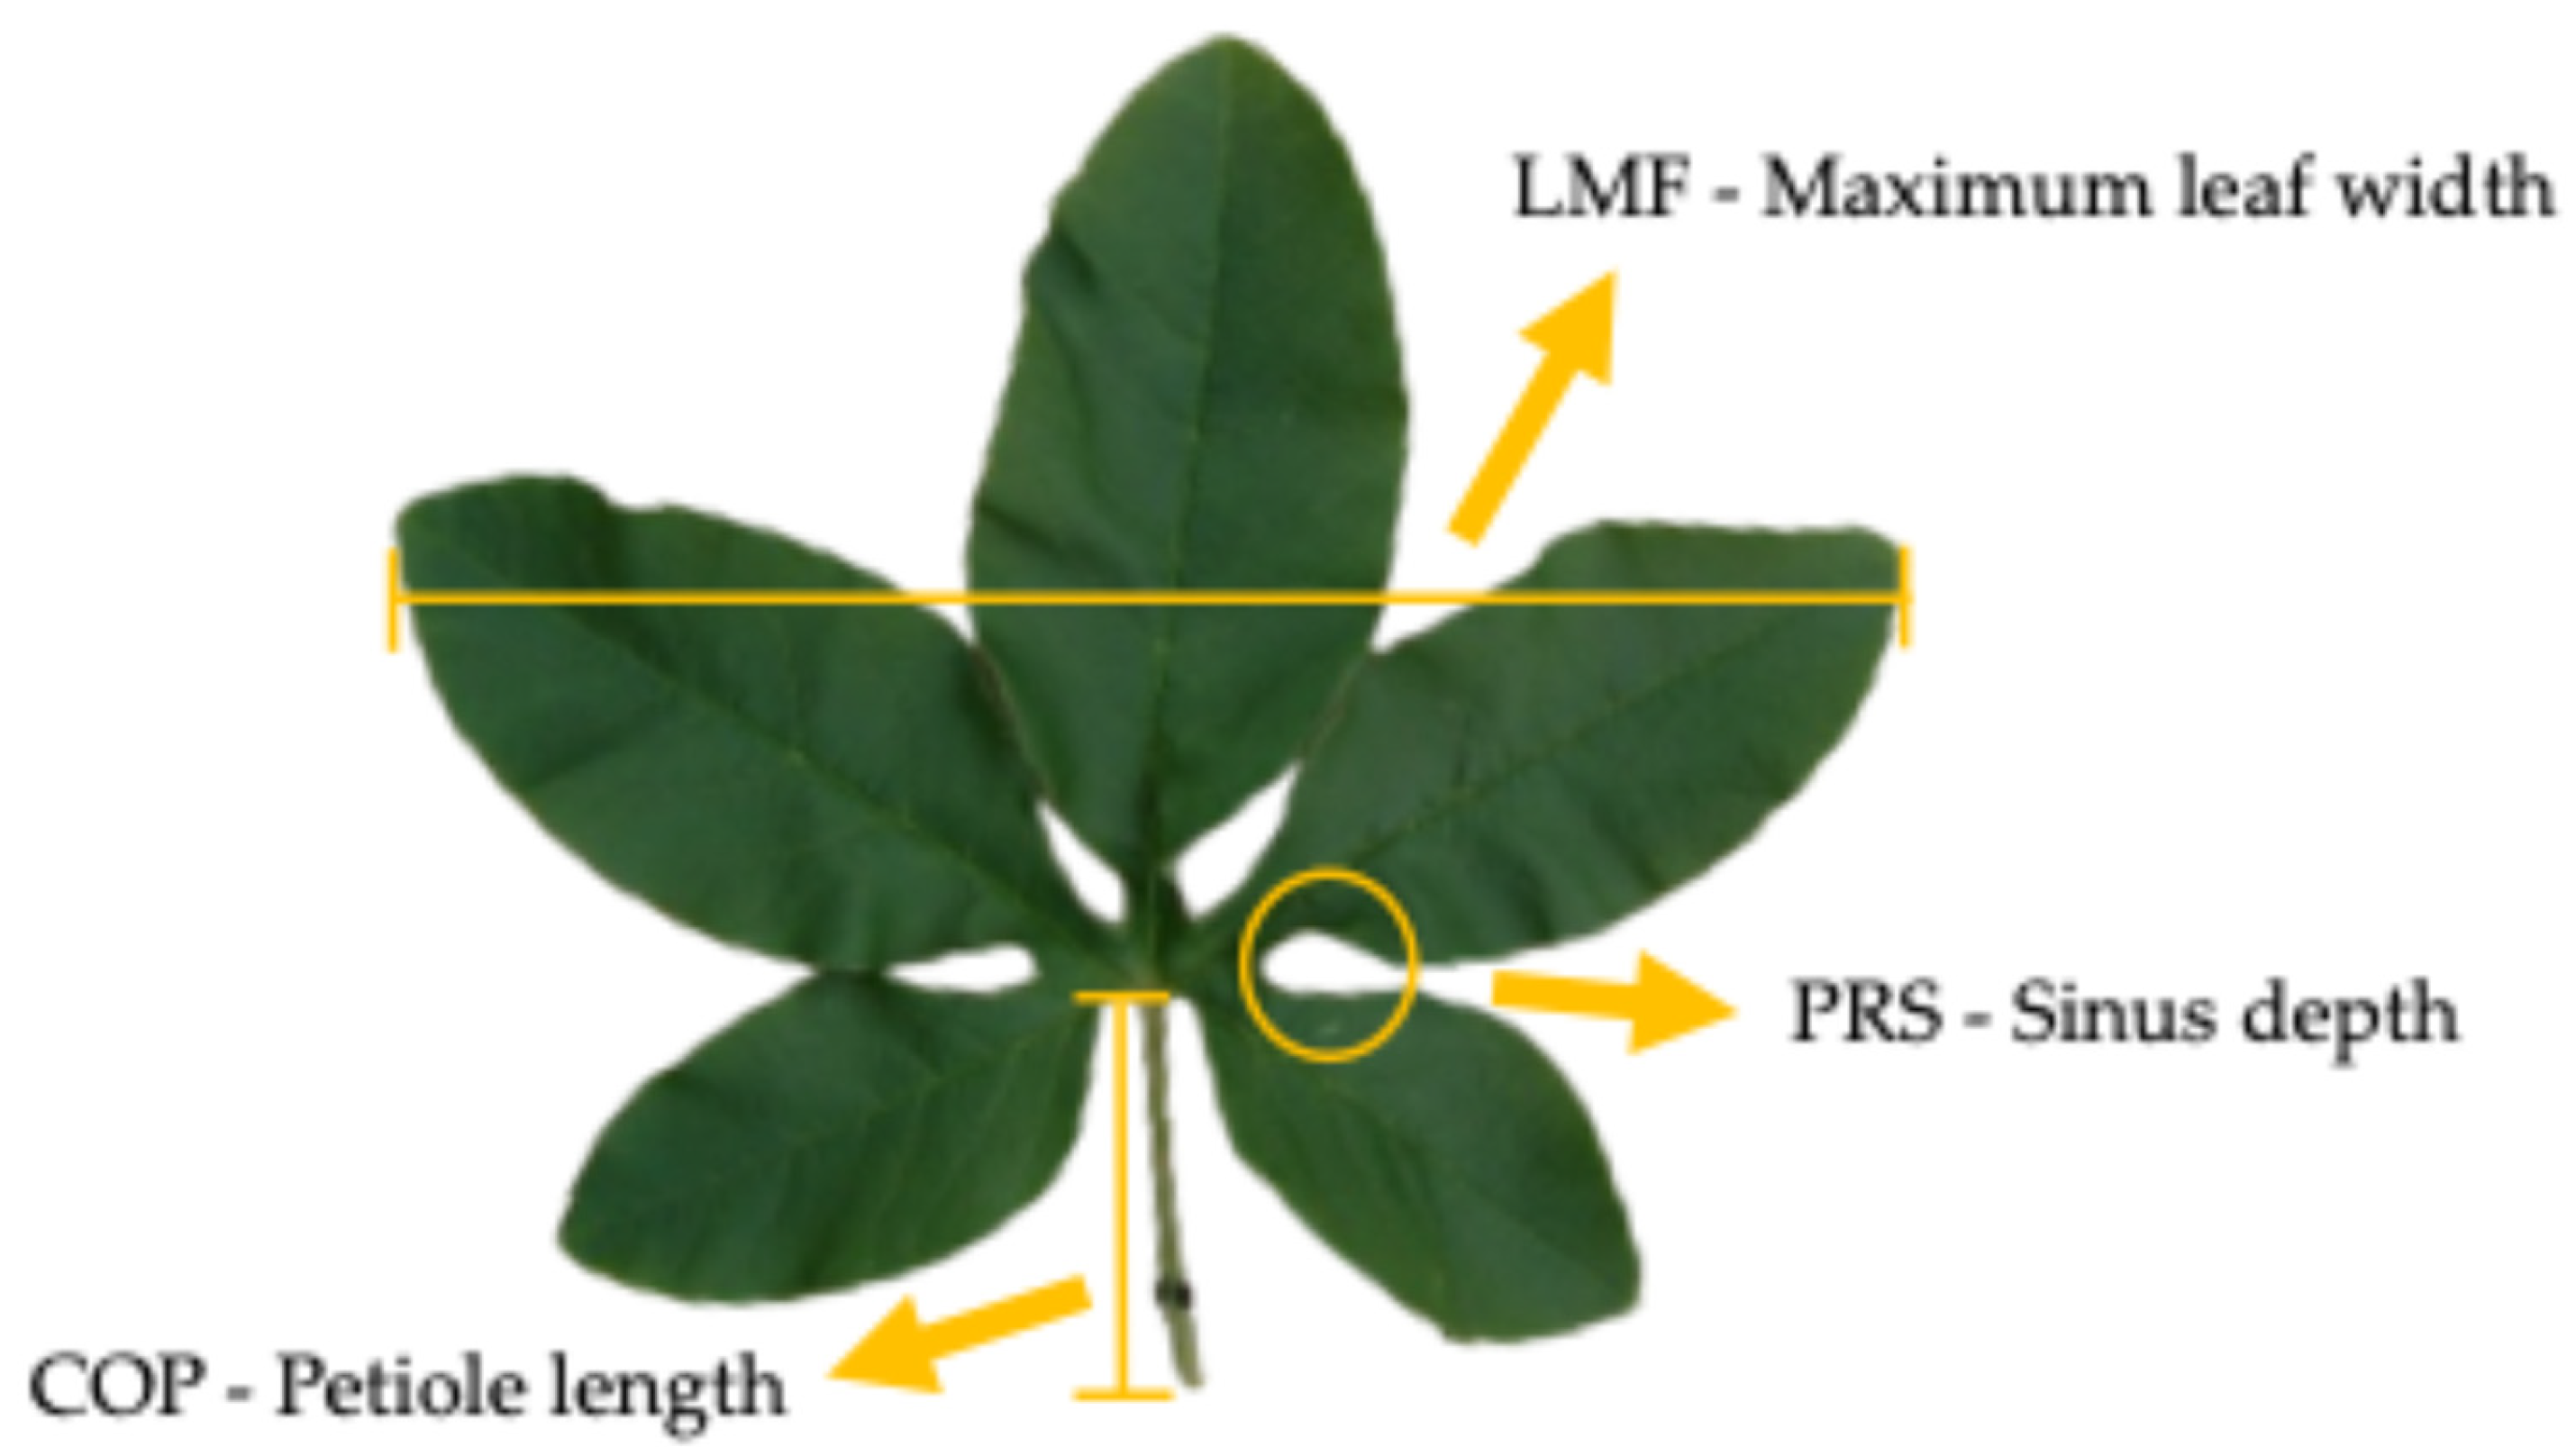
The evaluated descriptors and their coding are summarized in Table 1. Vegetative characterization included quantitative descriptors such as leaf blade length (CLF), maximum leaf width (LMF), petiole length (COP), as well as qualitative descriptors related to leaf shape, margin type, and degree of lobation (Figure 2).

2.2.2. Floral Descriptors

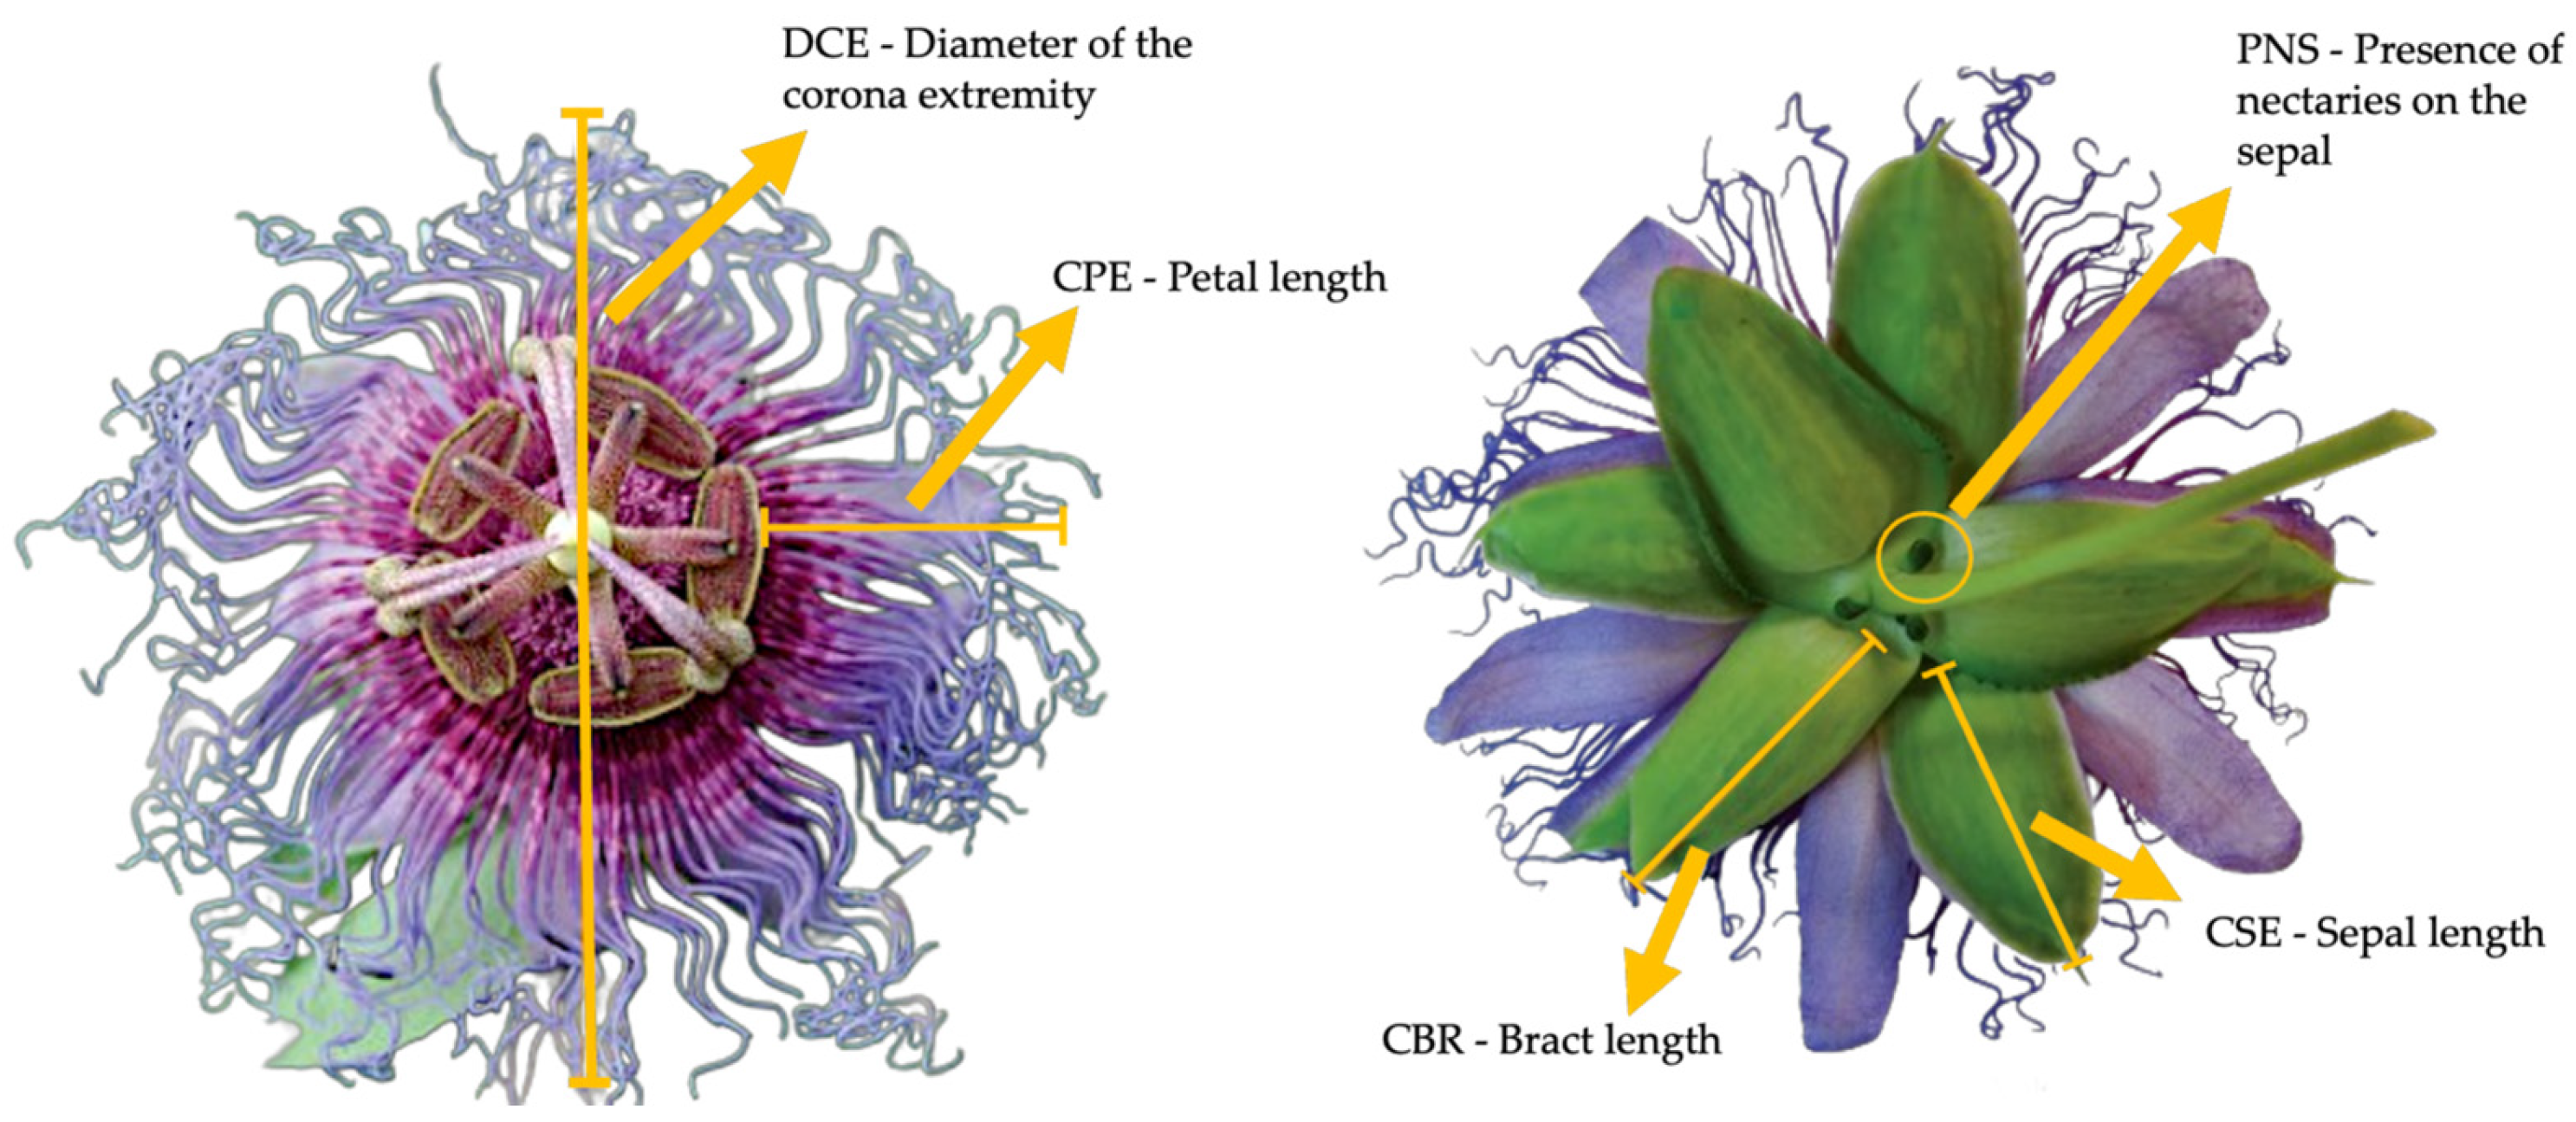
Floral characterization was carried out at anthesis and included quantitative descriptors such as sepal length (CSE), sepal width (LSE), petal length (CPE), bract length (CBR), androginophore length (CAN), and diameter of the corona extremity (DEC).
Qualitative descriptors related to corona morphology, filament coloration, and stigma number were also recorded. The complete list of floral descriptors is presented in Table 1, and representative floral morphologies are illustrated in Figure 3.

2.2.3. Fruit Descriptors

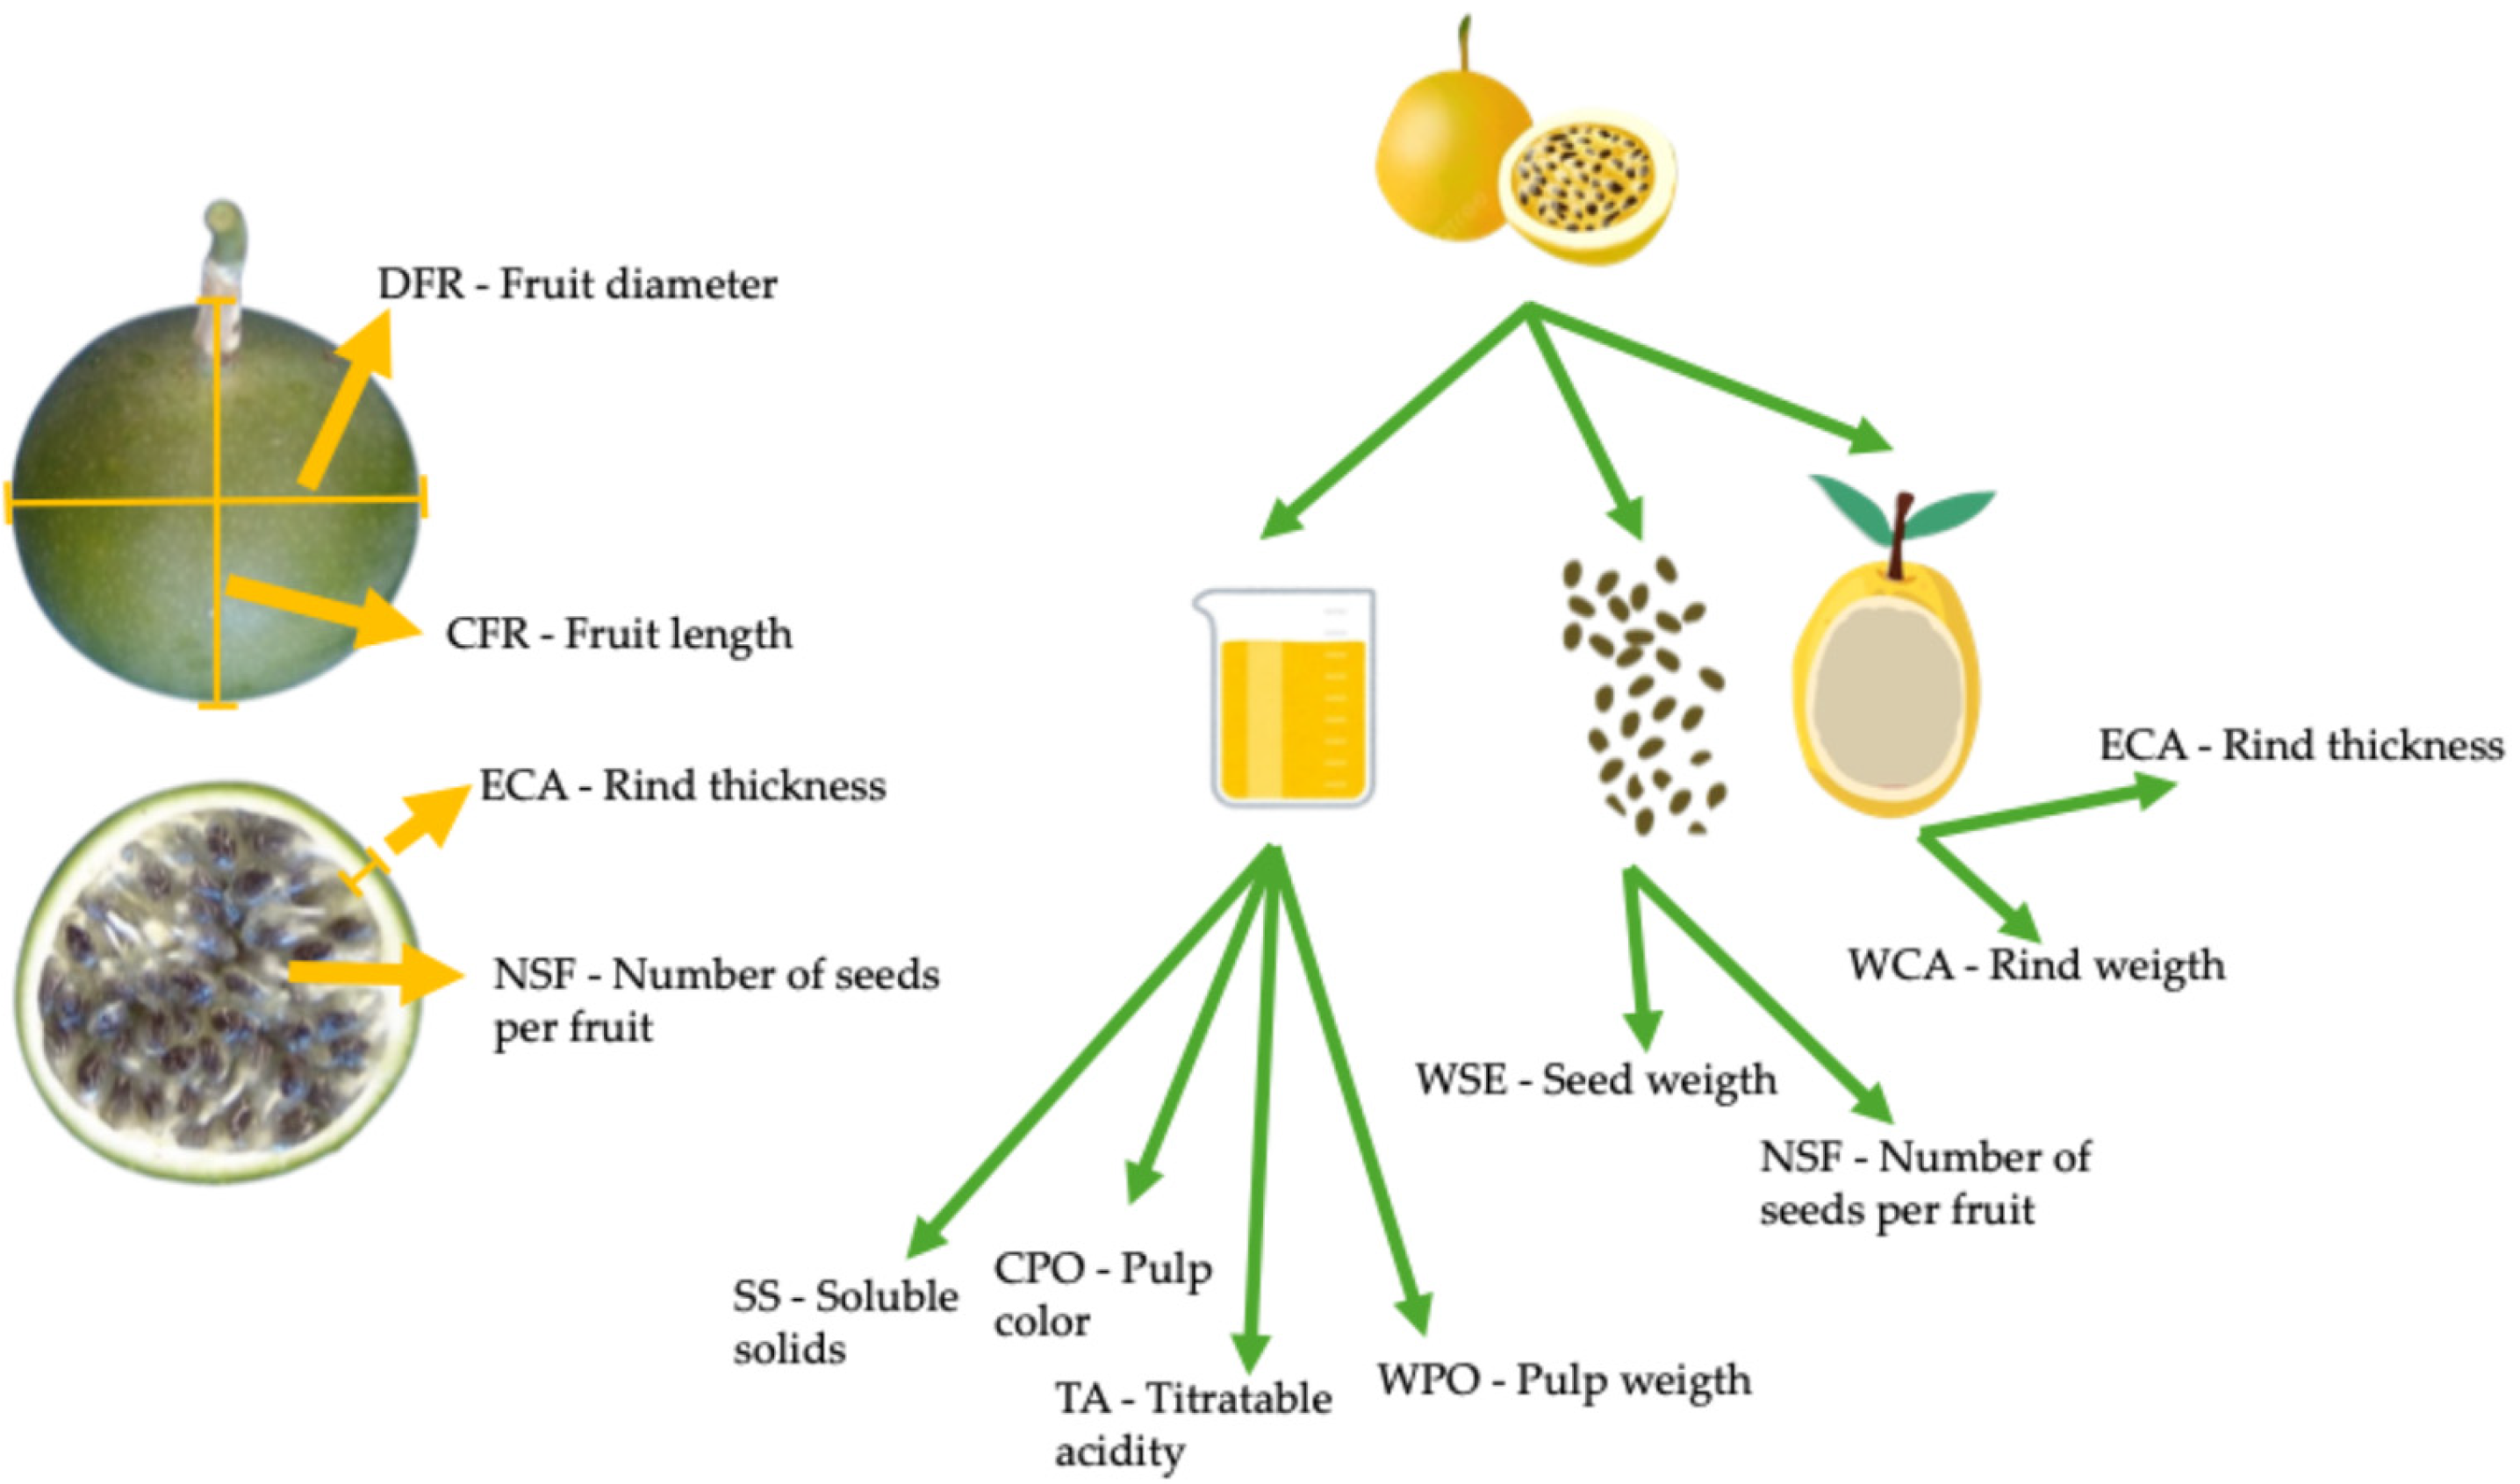
Fruit characterization focused on traits directly related to production and quality, which are critical for fresh market and industrial use. The following quantitative descriptors were evaluated: fruit weight (WFR), fruit length (CFR), fruit diameter (DFR), rind thickness (ECA), rind weight (WCA), pulp weight (WPO), number of seeds per fruit (NSF), pulp yield (RES), soluble solid content (SS, °Brix), titratable acidity (TA), and SS/TA ratio (RT) (Figure 4). Soluble solid content was determined using a digital refractometer, while titratable acidity was measured according to standardized procedures described by the Instituto Adolfo Lutz [30].

2.3. Statistical Analyses

2.3.1. Analysis of Variance and Genetic Parameters

Quantitative data were analyzed using linear mixed models to test for differences among accessions. In these models, accessions were considered as random genotypic effects, blocks were considered as random environmental effects, and variance components were estimated using the REML/BLUP (Restricted Maximum Likelihood/Best Linear Unbiased Prediction) approach [23,24].
Although the evaluated materials do not represent structured genetic populations (e.g., families or breeding populations), each accession was treated as a distinct genotype, which is a standard procedure in germplasm bank evaluations. Under this framework, variance components were estimated to quantify genetic differences among accessions evaluated under uniform field conditions.
Genotypic variance (Vg) was estimated as the variance associated with accession effects (σ2g), residual variance (Ve) as the residual error variance (σ2e), and phenotypic variance (Vf) as the sum of genotypic and residual variances (Vf = Vg + Ve). Broad-sense heritability (h2g) was calculated as the ratio between genotypic and phenotypic variance (h2g = Vg/Vf).
In addition, selection accuracy, genotypic and residual coefficients of variation, and related genetic parameters were estimated based on the predicted genotypic values.

2.3.2. Multivariate Analyses

Multivariate analyses were performed to evaluate phenotypic divergence among Passiflora accessions using quantitative morphoagronomic descriptors. All analyses were conducted using the R programming language (v.4.3.1) within the RStudio (v.4.3.1) environment. The analyses were performed using the MultivariateAnalysis package [31], along with base R functions, including dist(), for the computation of dissimilarity matrices.
To investigate genetic divergence among accessions, three multivariate approaches were applied: Principal Component Analysis (PCA), Tocher clustering, and hierarchical cluster analysis using the Unweighted Pair Group Method with Arithmetic Mean (UPGMA). Prior to analysis, all variables were standardized to zero mean and unit variance (z-score transformation) to ensure comparability among traits, according to the following expression:
Z = X X ̅ s
where X is the original value, X ̅ is the mean of the variable, and s is the standard deviation.
Principal Component Analysis (PCA)
Principal Component Analysis (PCA) was applied to identify the variables that most strongly contributed to total phenotypic variability among accessions. This multivariate technique linearly combines the original variables and reduces them to a set of principal components that cumulatively explain the largest proportion of variance in the dataset. Eigenvalues, the percentage of variance explained by each component, and variable loadings were examined to interpret the contribution of plant, flower, and fruit descriptors to accession differentiation.
Dissimilarity Matrices and Cluster Analyses
Phenotypic dissimilarity among accessions was estimated using the squared standardized Euclidean distance, computed from the standardized data using the dist() function in R. Based on the resulting dissimilarity matrix, two complementary clustering methods were applied.
In the Tocher optimization method, accessions were grouped using the combined dataset of plant, flower, and fruit descriptors, according to the criterion that the mean intra-group dissimilarity must be smaller than the mean inter-group dissimilarity, allowing the identification of groups of more similar genotypes.
Hierarchical cluster analysis was performed using the UPGMA method, generating dendrograms that represent the hierarchical structure of similarity relationships among accessions and the dissimilarity levels at which groups are separated.
Cluster analyses were conducted separately for plant, flower, and fruit descriptors, as well as in an integrated analysis considering all variables, providing both trait-specific and overall perspectives of phenotypic diversity among accessions.

3. Results

3.1. Phenotypic Variability Among Passiflora Accessions

A pronounced phenotypic variability was detected among the evaluated Passiflora accessions for vegetative, floral, and fruit-related traits. Qualitative and quantitative descriptors were used to characterize vegetative and reproductive organs (plant, flower, and fruit).
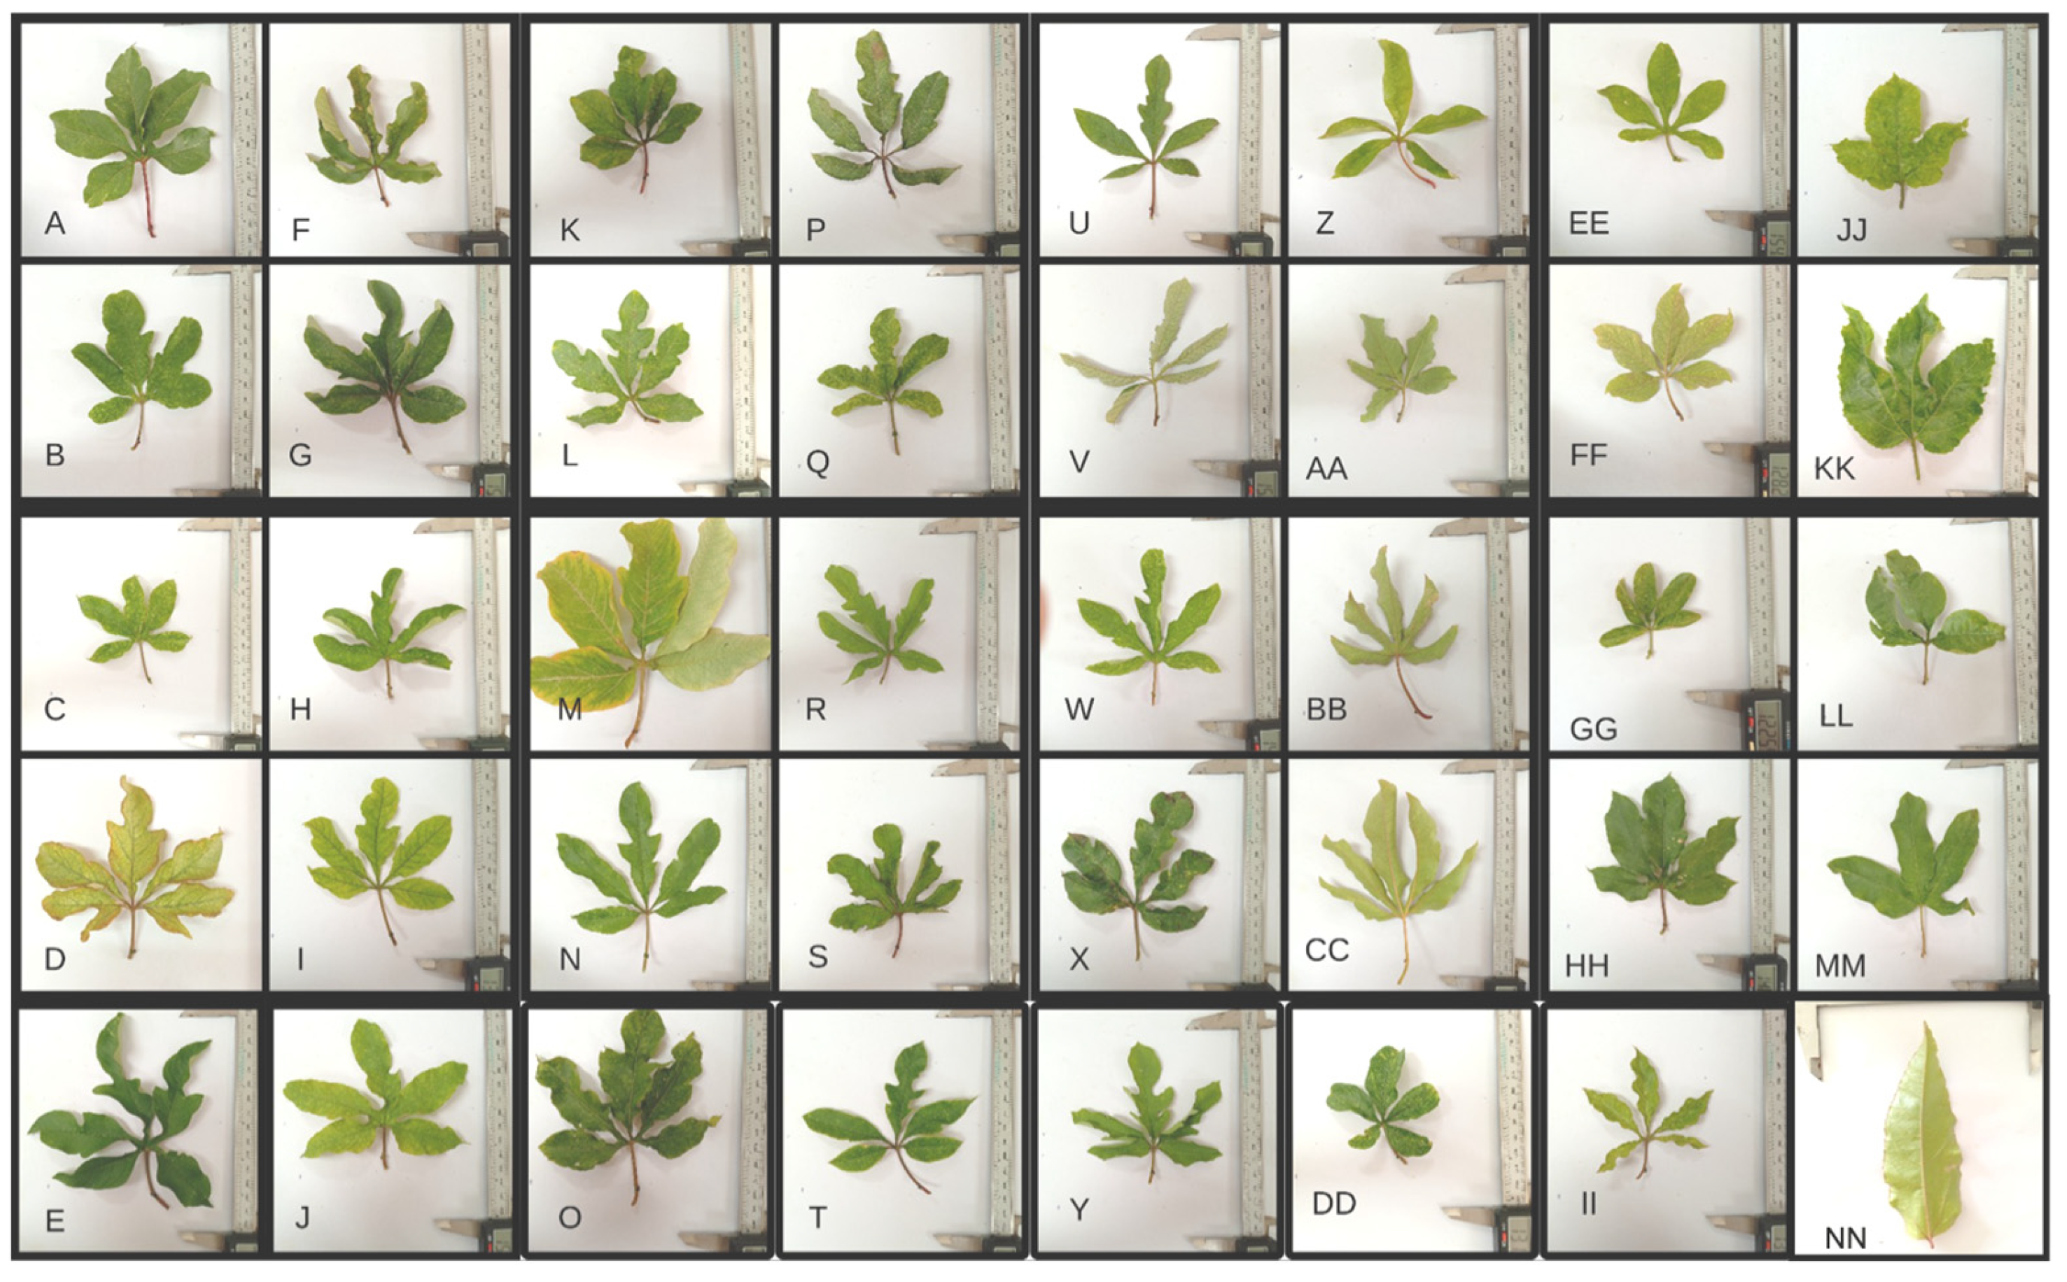
Qualitative descriptors revealed marked variation in leaf morphology, floral structures, and corona characteristics, confirming extensive intra- and interspecific diversity within the germplasm collection. The qualitative leaf trait analysis of 40 passion fruit accessions allowed their classification into eight distinct groups based on leaf shape, number of lobes, margin type, and central lobe morphology, as shown in Table 2 and Table S2 and Figure 5.
Quantitative descriptors showed wide amplitude of variation, particularly for fruit-related traits. Descriptive statistics and analysis of variance indicated significant differences (p < 0.05) among accessions for fruit weight, pulp weight, pulp yield, fruit dimensions, rind thickness, number of seeds per fruit, soluble solid content, and titratable acidity. In contrast, vegetative and floral traits generally exhibited narrower ranges of variation, suggesting a stronger contribution of fruit traits to overall phenotypic divergence.
The results of the analysis of variance for 22 of the 53 evaluated traits are presented in Table 3, Tables S3 and S4. Significant differences (p < 0.01) were detected for all analyzed traits, indicating high phenotypic variability among the accessions and highlighting their importance as a valuable source of genetic diversity for breeding programs.
The coefficient of variation (CV%) differed among traits. Pulp weight (WPO) showed the highest CV (26.45%), whereas the length-to-diameter ratio (RCL) exhibited the lowest value (5.27%), reflecting differences in the degree of phenotypic dispersion among the evaluated characters.
As shown in Table 3, Tables S3 and S4 differences were observed among the mean values obtained for the evaluated descriptors. For clarity and conciseness, mean comparisons for plant and flower descriptors are provided in the Supplementary Material (Tables S3 and S4), while fruit-related traits are presented in Table 3. The traits exhibiting the greatest variability were those related to fruit characteristics (WCA, WFR, WPO, NSF, and WSE), reinforcing their potential for selection, as they are directly associated with yield and the commercial quality of passion fruit. This variability indicates the presence of accessions with superior agronomic performance, which can be exploited in breeding programs aimed at improving fruit productivity and quality.
Marked differences were observed among accessions for fruit-related traits. Accessions 1 and 16 consistently exhibited superior performance, combining high fruit weight, pulp weight, and pulp yield with intermediate rind thickness, a trait combination considered favorable for both fresh consumption and industrial processing. In contrast, a distinct group of accessions showed significantly lower fruit weight and pulp-related traits, indicating reduced productive potential.
Accession 55 also displayed high fruit weight and stood out for fruit quality attributes, particularly elevated soluble solid content. However, this accession differed from accessions 1 and 16 by exhibiting greater rind thickness and comparatively lower pulp weight and pulp yield, reflecting a trade-off between fruit quality and processing efficiency. Despite this limitation, accession 55 represents a promising source of quality-related traits, such as sweetness and rind characteristics.
Regarding seed-related traits, accessions with superior fruit size generally exhibited higher seed numbers, reinforcing the association between seed content and fruit development. Overall, the results highlight accessions 1 and 16 as the most balanced genotypes in terms of yield and processing efficiency, whereas accession 55 represents a complementary genotype with superior quality attributes.
For floral descriptors, significant variation was mainly associated with flower size, with differences in the diameter of the corona extremity contributing most strongly to floral phenotypic diversity among accessions. Vegetative traits also varied among accessions, with leaf size representing the main source of differentiation, although these traits showed a lower contribution to agronomic performance when compared with fruit-related descriptors.

3.2. Analysis of Variance and Genetic Parameters

The analysis of variance confirmed the existence of significant genetic variability for most quantitative traits evaluated. Estimates of genetic parameters obtained using REML/BLUP (Table 4) revealed moderate to high heritability values for key fruit-related traits, including fruit weight, pulp weight, pulp yield, fruit length, and fruit diameter.
These traits also presented high genotypic coefficients of variation and favorable accuracy values, indicating strong genetic control and high reliability of selection based on phenotypic performance. Conversely, some vegetative and floral traits showed lower heritability estimates, reflecting greater environmental influence on their expression.
The predicted genetic gains (Tables S5–S7) further demonstrated that selection based on fruit traits would result in substantial improvements, particularly for fruit weight, pulp weight, pulp yield, and number of seeds per fruit.
Fruit-related traits exhibited the highest heritability estimates (h2g and h2mc) and selection accuracy (Acclon). In particular, rind weight (WCA), fruit diameter (DFR), fruit length (CFR), rind thickness (ECA), and fruit weight (WFR) showed heritability values (h2g and h2mc) above 0.50, selection accuracy greater than 0.80, and relative coefficients of variation (CVr) above 1.0, indicating a strong genetic control of these traits.
For plant and flower descriptors, maximum leaf width (LMF), petal length (CPE), sepal length (CSE), and sepal width (LSE) also exhibited relatively high heritability and accuracy values (>0.60 and >0.80, respectively). Although to a lesser extent, these traits also contribute to the differentiation among accessions.
The analysis of genetic parameters reinforced the existence of accessions with superior performance. For fruit-related traits, accessions 1, 16, and 55 were particularly noteworthy. However, accession 55 showed the highest genetic gain for rind thickness (0.48) and rind weight (39.08), ranking first in the selection order (Table S5). In contrast, this accession did not rank among the top ten for pulp weight (WPO), highlighting an inverse relationship widely reported in the literature, in which fruits with greater rind thickness tend to exhibit lower pulp weight.

3.3. Performance of Accessions for Fruit Production and Quality Traits

Marked differences were observed among accessions regarding fruit production and quality attributes (Table 3). Accessions 1 and 16 exhibited the highest mean values for fruit mass and pulp weight, as well as superior pulp yield, indicating a favorable balance between fruit size and edible portion. These accessions also showed high numbers of seeds per fruit, which is generally associated with improved fruit filling and development.
Accession 55 also presented high fruit weight; however, it differed from accessions 1 and 16 by exhibiting greater rind thickness and comparatively lower pulp yield. Despite this limitation, accession 55 stood out for its elevated soluble solid content (°Brix), indicating superior sweetness and potential sensory quality (Table 3).
The remaining accessions displayed intermediate or lower performance for most fruit-related traits, reinforcing the distinction between high-yielding and quality-oriented genotypes within the collection.

3.4. Principal Component Analysis

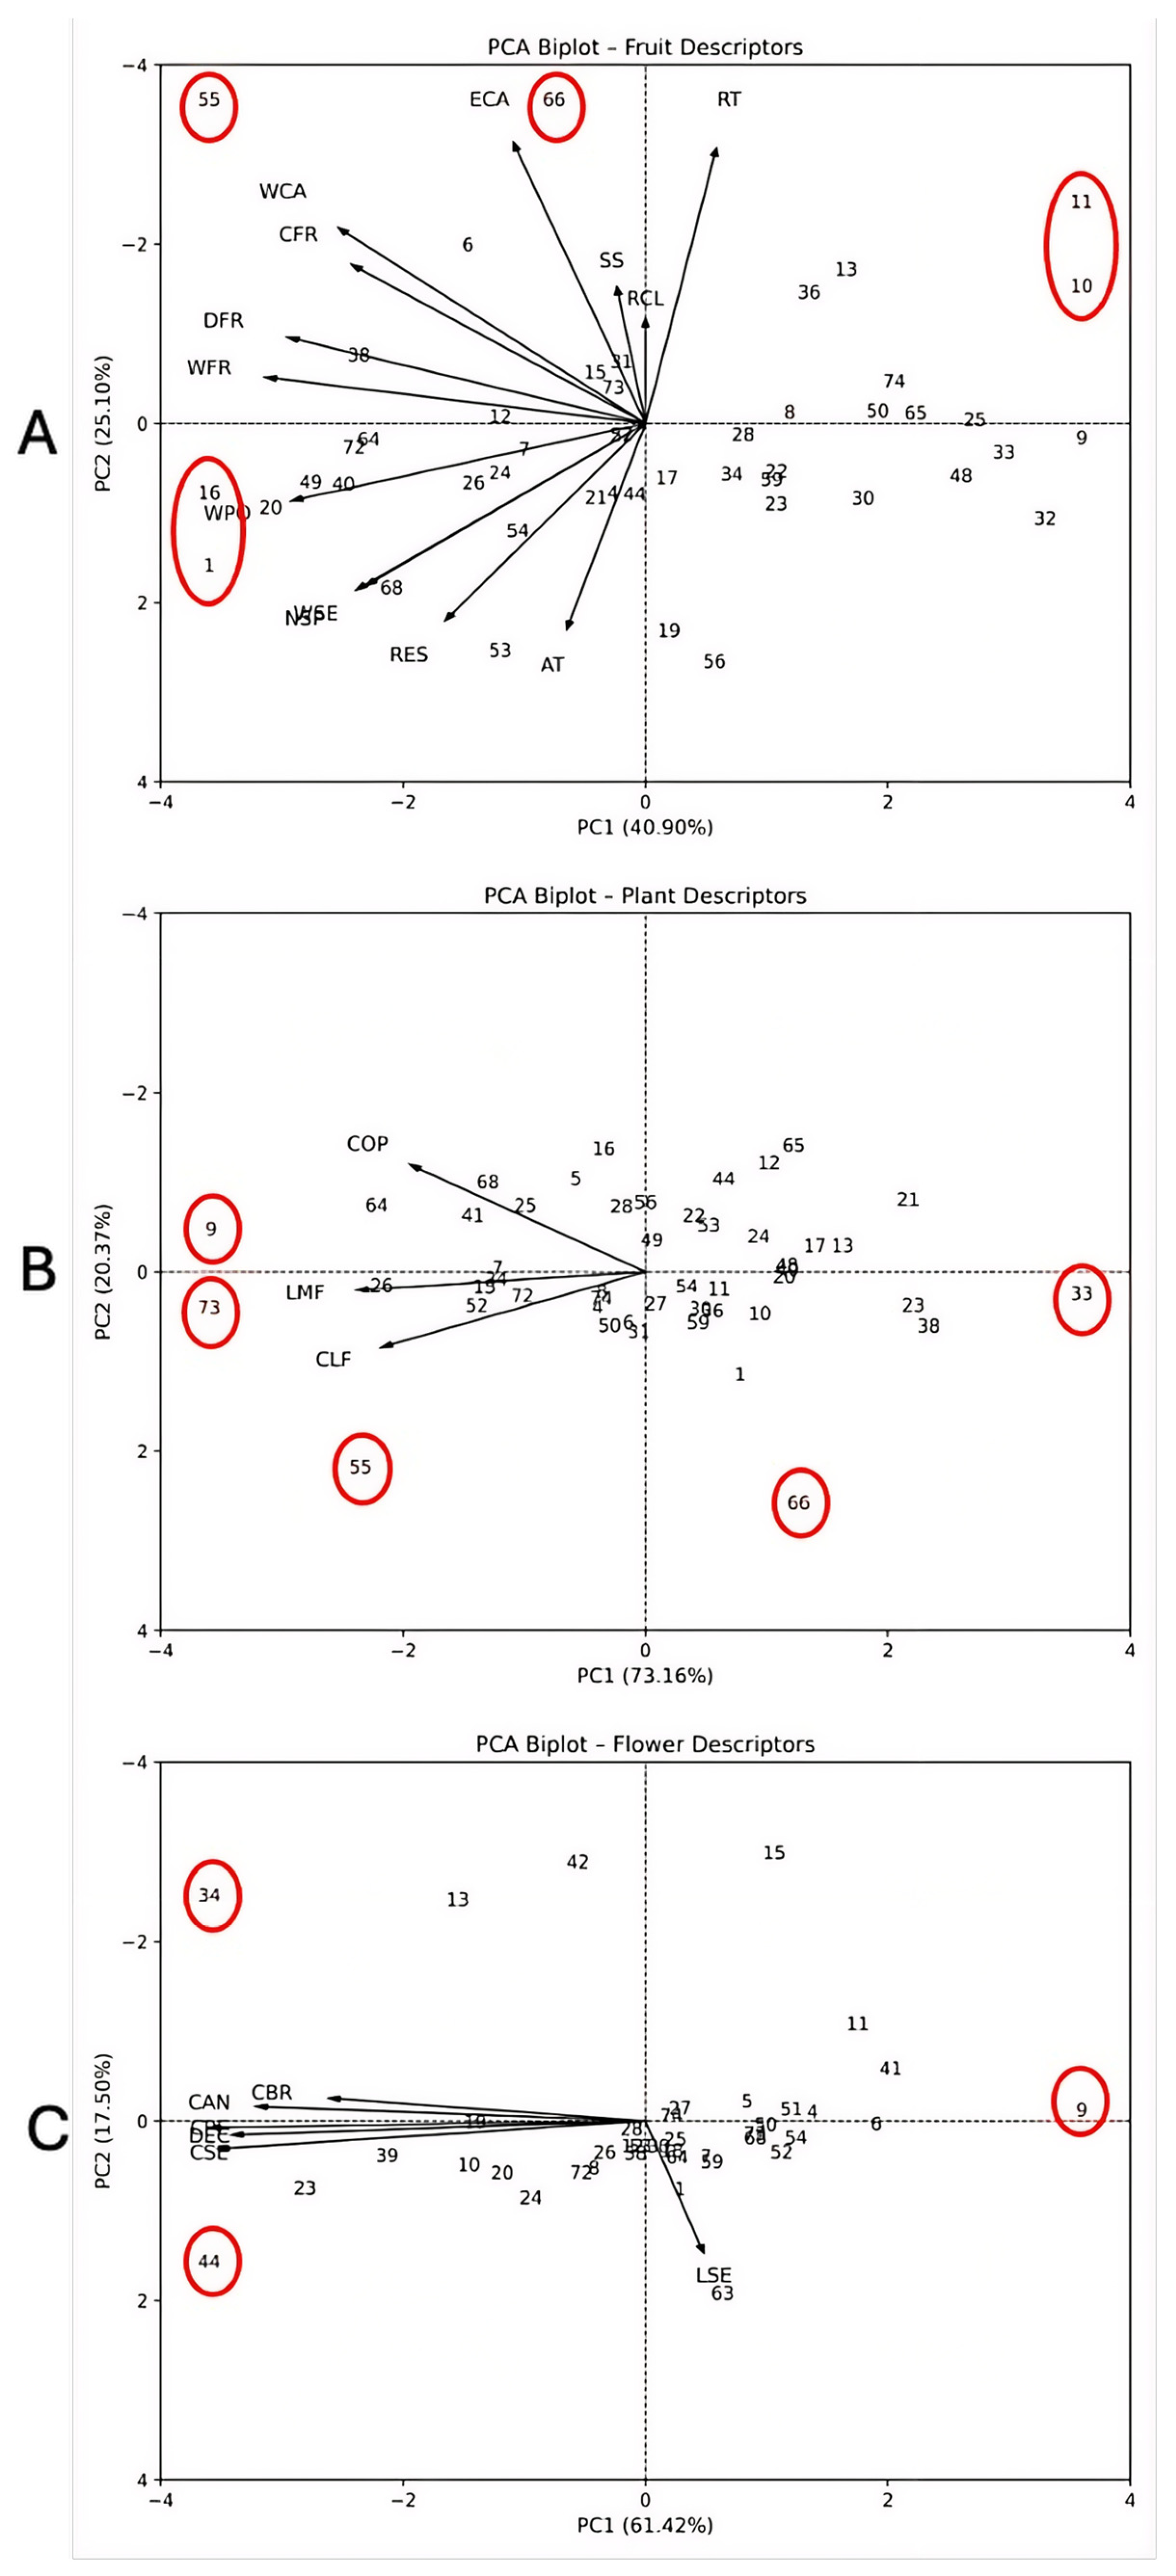
Principal Component Analysis (PCA) was performed separately for fruit, plant, and flower descriptors to investigate patterns of phenotypic variation among accessions (Figure 6). The analyses revealed that fruit-related traits played a prominent role in accession differentiation, as reflected by the proportion of variance explained by the first principal components. In the PCA biplot, the directionality of the axes reflects gradients of trait contribution, with accessions distributed according to the sign and magnitude of their scores along PC1 and PC2.
For fruit descriptors (Figure 6), the first two principal components explained 66.0% of the total variation, while the first four components accounted for approximately 87.0%. The first principal component (PC1; 40.8%) was primarily associated with fruit size, weight, and seed-related traits (fruit diameter, fruit length, fruit weight, rind weight, seed mass, pulp weight, and number of seeds per fruit). Accessions positioned toward the negative direction of PC1 were characterized by higher mean values for these yield-related traits, whereas those located in the positive direction exhibited lower values, indicating reduced productive potential. Accordingly, accessions 1 and 16 clustered in the negative region of PC1, reflecting superior fruit size and pulp-related performance, while accessions 10 and 11 were positioned in the opposite region, associated with lower mean values for these traits.
The second principal component (PC2; 25.17%) was mainly influenced by pulp yield, the SS/TA ratio, and rind thickness, representing a quality-related gradient. Along this axis, accessions 55 and 66 were separated from the remaining accessions, reflecting higher rind thickness and ratio values combined with comparatively lower pulp yield. This positioning indicates a trade-off between fruit quality attributes and processing efficiency.
For floral descriptors, the first two principal components explained 78.9% of the total variation. PC1 was primarily associated with flower size-related traits, whereas PC2 was mainly influenced by sepal width. Accessions positioned along the positive direction of PC2 showed higher mean values for sepal width, while those with high positive PC1 scores were associated with reduced flower size. In this context, accessions 34 and 44 were clearly separated due to their larger floral structures, whereas accession 9 was associated with smaller flower size descriptors.
For plant descriptors, the first two principal components explained 93.52% of the total variation, with PC1 accounting for 73.15% and PC2 for 20.37%. All vegetative traits were strongly associated with PC1, which represented a gradient of leaf and petiole size. Accessions with negative PC1 scores exhibited larger leaf blade length, petiole length, and maximum leaf width, whereas accessions positioned in the positive direction showed reduced vegetative development. Accordingly, accessions 9, 73, and 55 were associated with larger leaf dimensions, while accession 33 was positioned at the opposite extreme, reflecting the lowest mean values for plant traits.
Overall, PCA clearly discriminated accessions based on fruit yield, fruit quality, floral morphology, and vegetative traits. The directionality of PC1 and PC2 facilitated the identification of accessions with contrasting phenotypic profiles, supporting the classification of genotypes with distinct agronomic and breeding potential, as illustrated in Figure 6.

3.5. Cluster Analysis and Grouping of Accessions

Cluster analysis using the Tocher method grouped the passion fruit accessions into 11 distinct clusters, confirming high genetic diversity among the evaluated germplasms. Group 4 was the largest, comprising 28 accessions, followed by Group 3 with 11 accessions (Table 5). Highly divergent accessions (1, 9, 16, 19, and 32) formed single-member clusters, while accessions 55 and 66 grouped together, forming a distinct cluster (Group 6). Low intracluster distances and higher intercluster distances (0.50–1.84) indicate substantial genetic divergence among clusters.
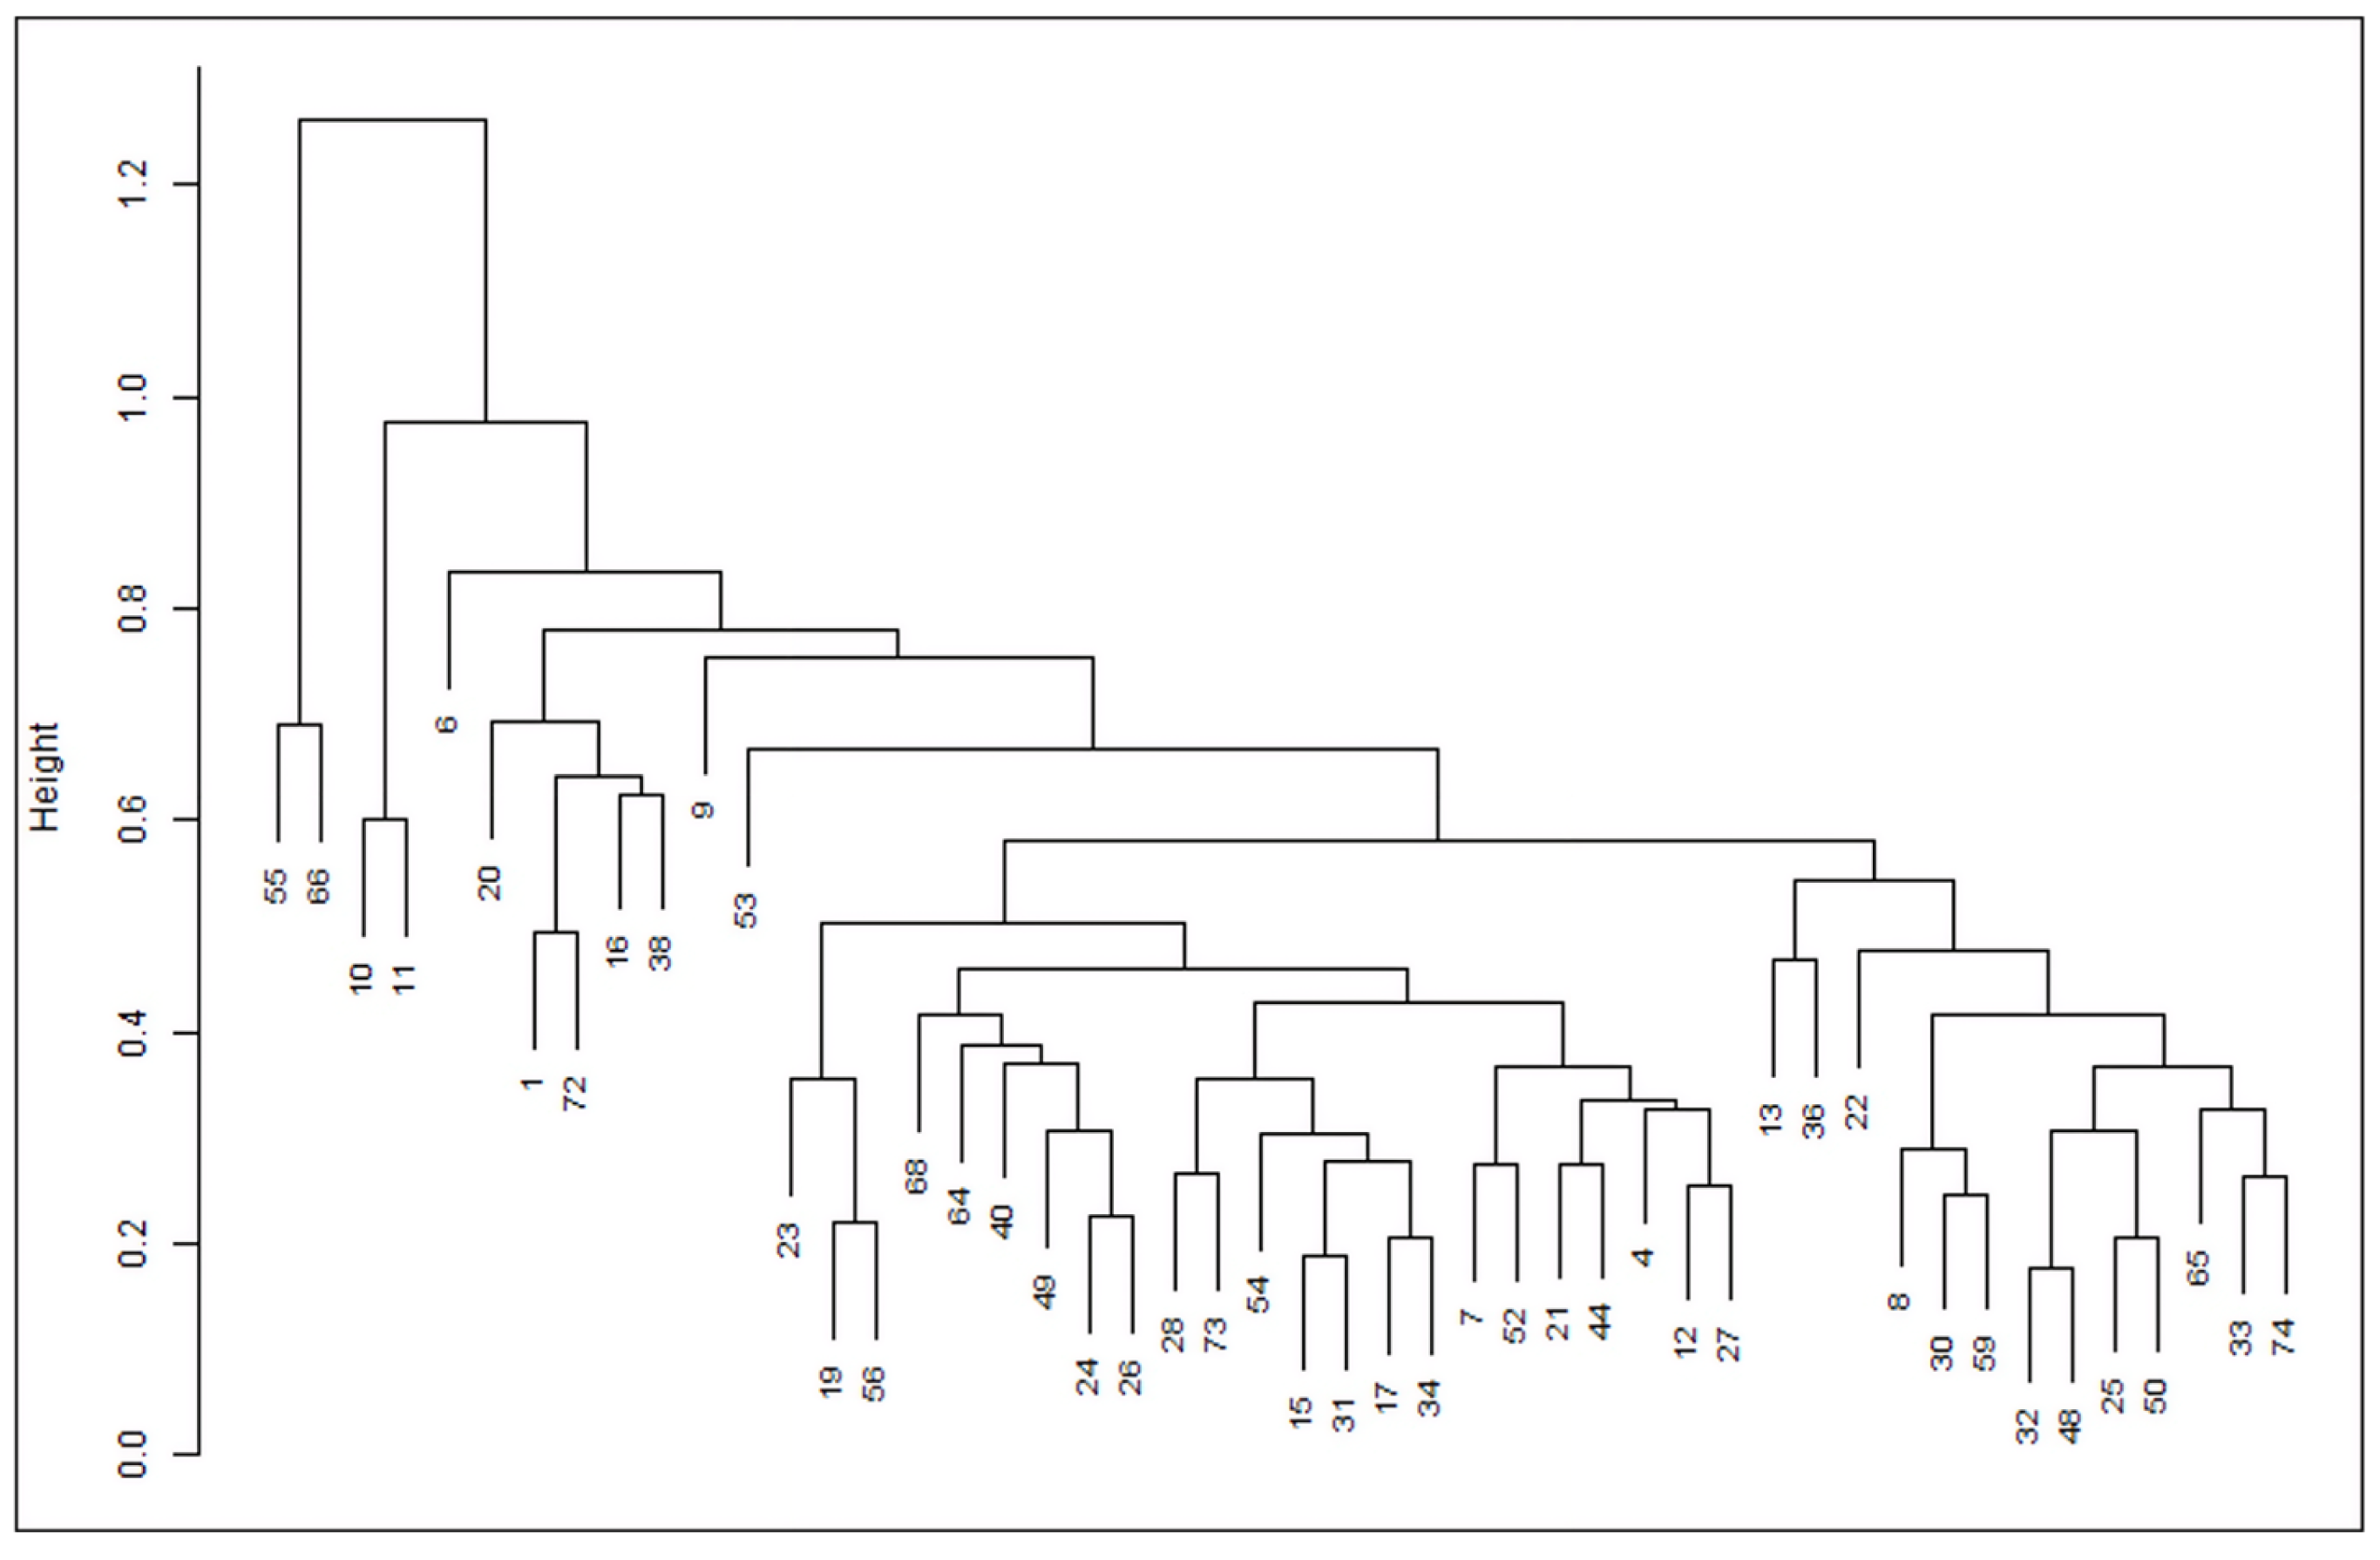
Cluster analyses based on fruit descriptors resulted in the formation of well-defined groups of accessions. For the fruit dendrogram (Figure 7), the formation of small subclusters was observed. Accessions 55 and 66 stood out due to their high dissimilarity, being positioned separately from the remaining accessions, which confirms interspecific differentiation as these accessions belong to P. edulis. Another highly divergent group was formed by accessions 10 and 11, as well as by accessions 1, 72, 16, and 38. In contrast, most accessions formed compact clusters, indicating close genotypic similarity.
In the dendrogram based on plant descriptors (Figure 8), a similar pattern was observed, with most accessions forming clusters with low levels of dissimilarity. Accessions 55 and 66 stood out due to their greater distance from the remaining accessions. Accession 55 clustered with accessions 9 and 73; however, accessions 9 and 73 were more closely related to each other and more similar to the majority of accessions, whereas accession 55 remained more distant.
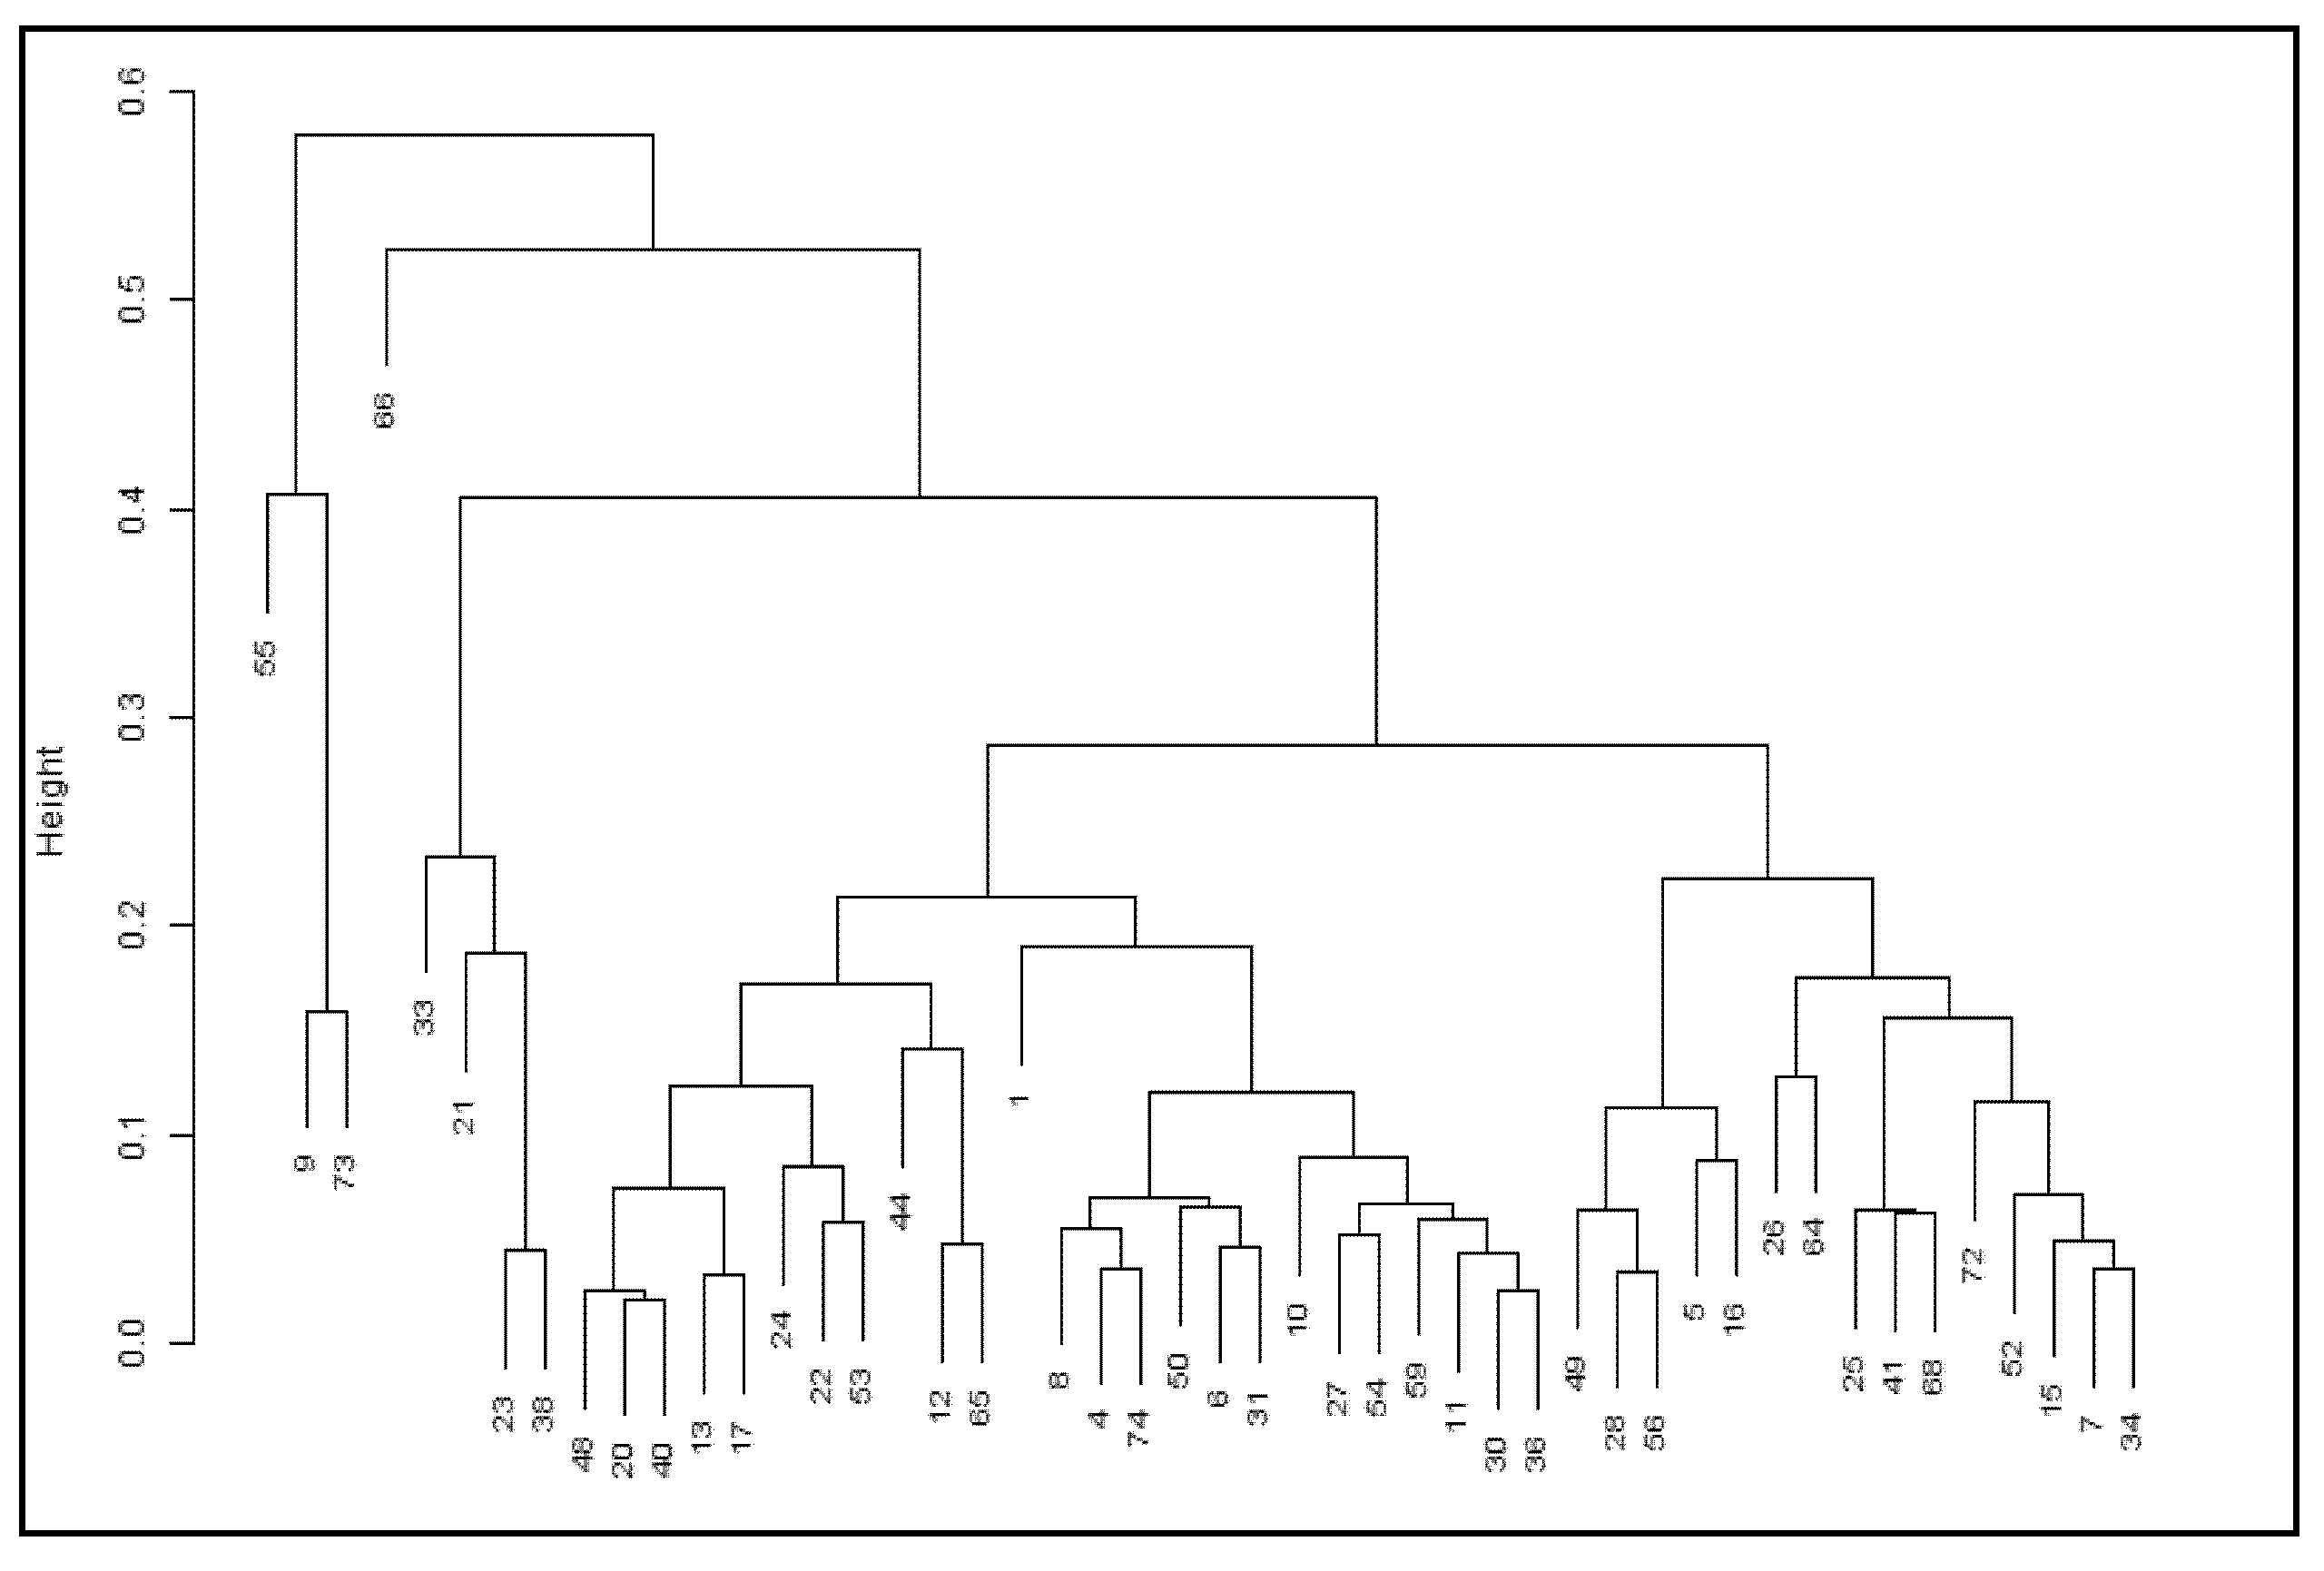
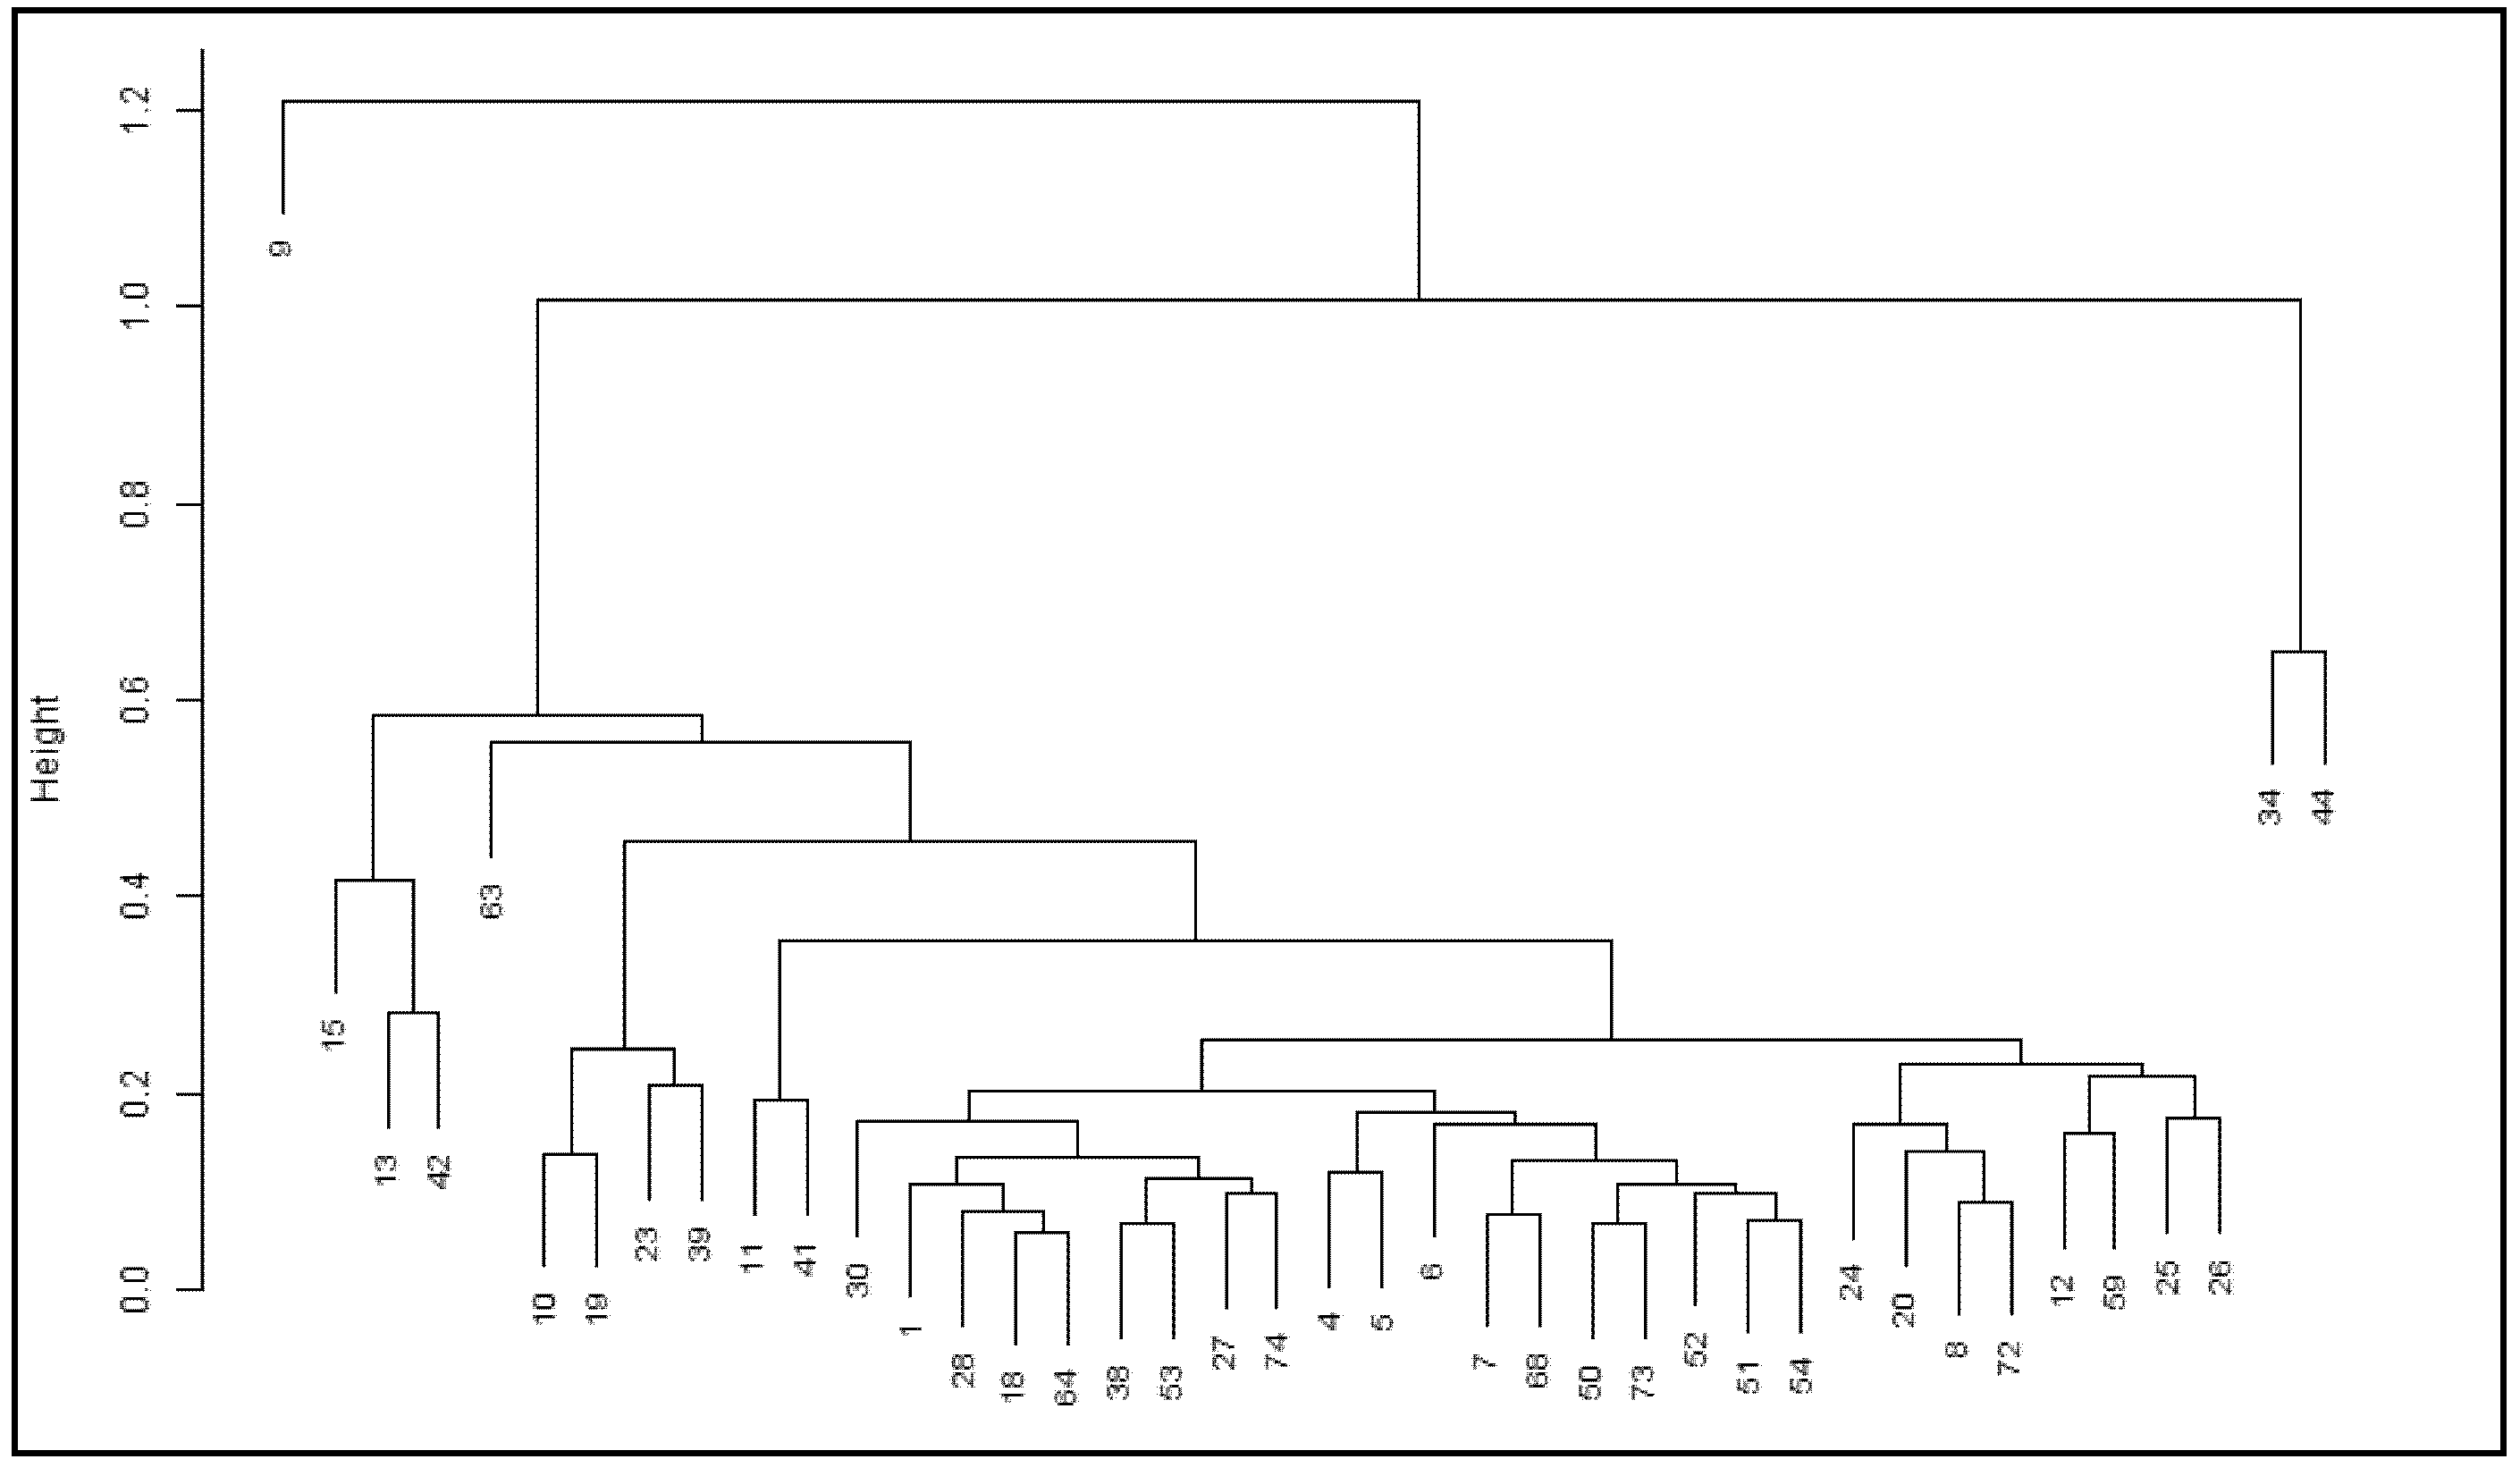
In the dendrogram based on flower descriptors (Figure 9), high dissimilarity was observed between accession 09 and the remaining accessions. Accessions 34 and 44 were more similar to each other but showed high dissimilarity relative to most accessions. Considering a cut-off value between 0.4 and 0.6, distinct clusters were formed, indicating genetic variability among the accessions.
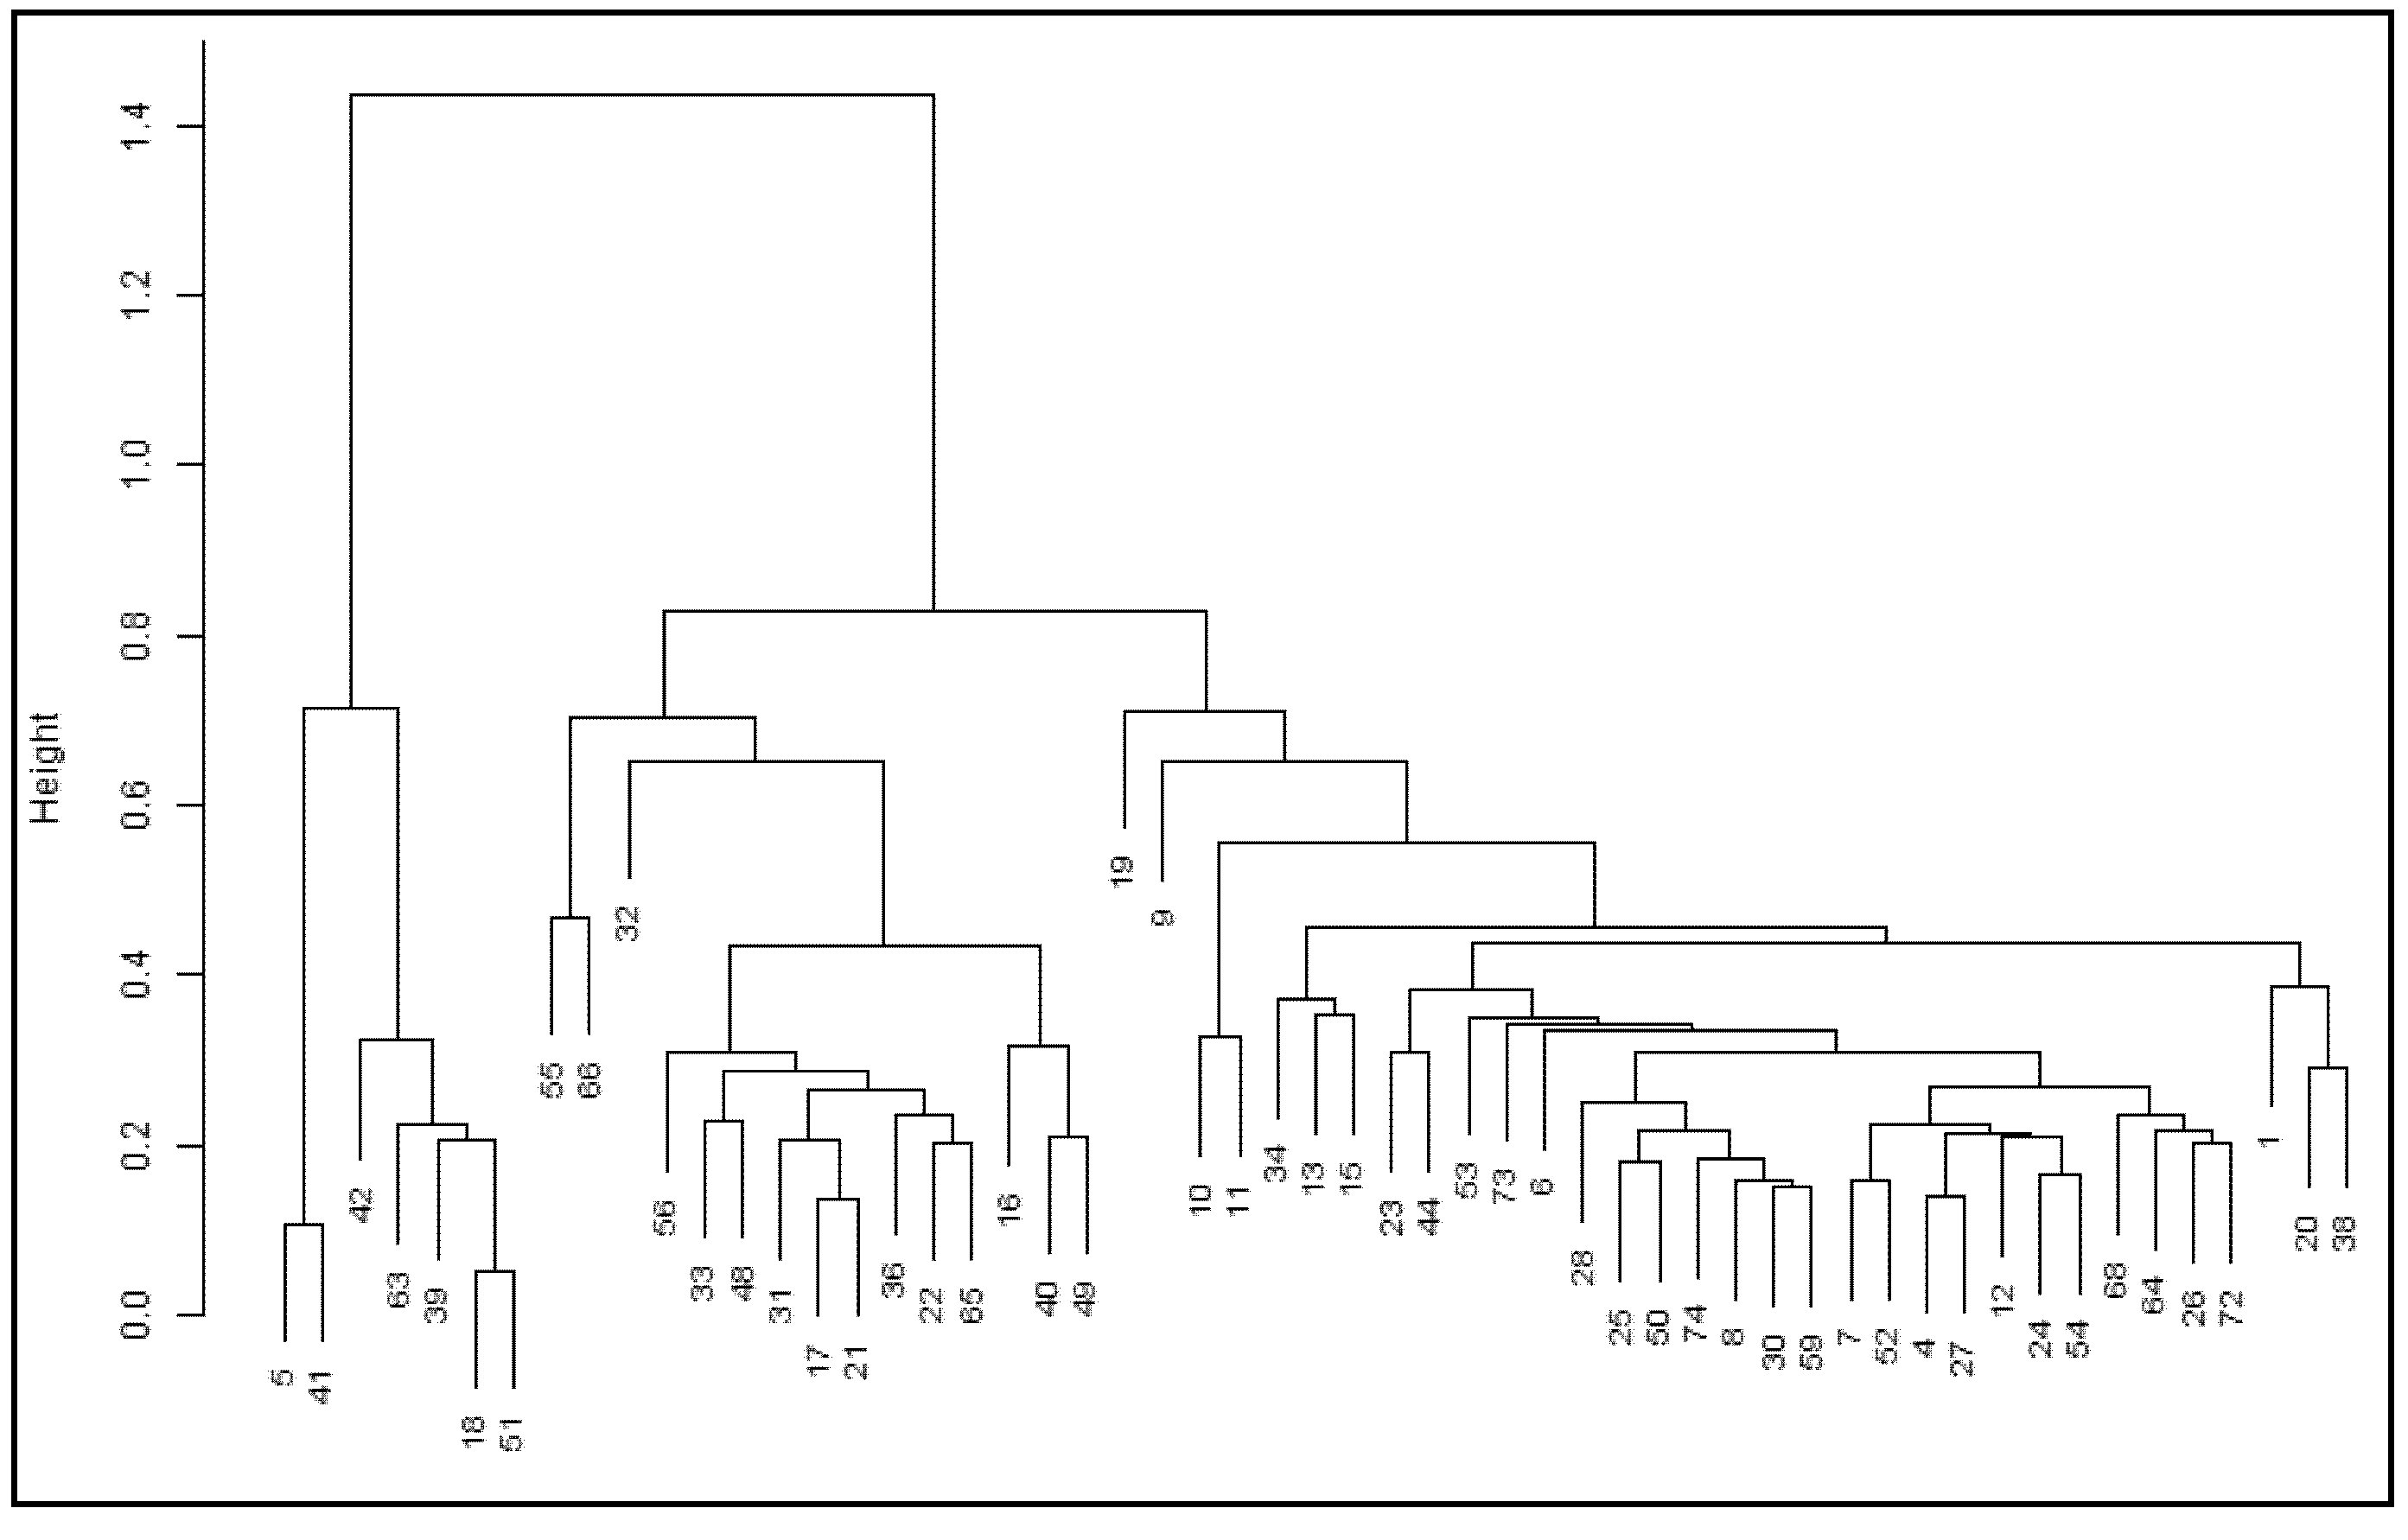
The cluster analysis based on the integrated set of plant, flower, and fruit descriptors resulted in the formation of two main groups (Figure 10). The first group, located on the left side of the dendrogram, comprised accessions 5, 41, 42, 63, 39, 18, and 51, which were closely related to each other but clearly separated from the remaining accessions, indicating a high level of phenotypic divergence.
The second main group was further subdivided into two distinct subgroups. One subgroup included accessions 55, 66, 32, 56, 33, 48, 31, 17, 21, 36, 22, 65, 16, 40, and 49, which showed intermediate dissimilarity among themselves and were clearly differentiated from the first main group. The other subgroup comprised the majority of the remaining accessions, which exhibited high phenotypic similarity and low dissimilarity values, indicating a more homogeneous group.
Overall, the integrated clustering highlighted contrasting phenotypic patterns among accessions and reinforced the presence of distinct groups within the germplasm collection when plant, flower, and fruit descriptors were jointly considered.

3.6. Identification of Promising Accessions for Breeding

Based on the combined evaluation of phenotypic performance, genetic parameters, predicted genetic gains, and multivariate analyses, accessions 1 and 16 were identified as the most promising materials for improving fruit yield and industrial efficiency.
These accessions combine high fruit weight, high pulp yield, and favorable fruit morphology, making them suitable candidates for direct selection or use as parents in breeding programs. Accession 55, although less efficient in terms of pulp yield due to thicker rind, represents a valuable source of quality-related traits, particularly soluble solid content, and may be strategically used in crosses with high-yielding accessions to combine productivity and fruit quality.

4. Discussion

The phenotypic variability observed among the evaluated Passiflora accessions is consistent with the broad diversity reported for the genus in Brazil and confirms the relevance of morphoagronomic descriptors for discriminating germplasm with breeding potential [32]. Previous evaluations involving P. edulis, P. cincinnata, and interspecific populations have consistently demonstrated wide variation in fruit size, pulp-related traits, soluble solids, and yield components, highlighting the importance of these traits for selection and genetic improvement [22,33]. The magnitude and structure of variability detected in the present study fall within the ranges reported in these studies, reinforcing the reliability of the observed patterns.
Fruit-related traits were the main contributors to phenotypic divergence, a result that strongly agrees with earlier multivariate analyses of Passiflora germplasm. Studies applying PCA, clustering, and distance-based methods have shown that fruit weight, fruit length and diameter, pulp yield, and rind characteristics explain most of the total variation, whereas acidity-related traits usually contribute less to overall divergence [34]. This predominance reflects not only the high discriminatory power of fruit descriptors but also their direct economic relevance, as fruit size and pulp yield are decisive attributes for fresh market acceptance and juice processing efficiency [35].
The genetic parameter estimates obtained in this study further support the feasibility of selection based on fruit traits. Moderate to high heritability values for fruit weight, pulp weight, pulp yield, and fruit dimensions agree with reports from breeding populations evaluated using mixed linear models. Studies applying REML/BLUP in sour and sweet passion fruit populations have demonstrated that these traits exhibit sufficient genetic control to allow effective selection under field conditions [36,37]. In particular, REML/BLUP has been highlighted as an efficient approach in Passiflora breeding because it improves the prediction of genotypic values and supports the more reliable ranking of genotypes in unbalanced datasets typical of perennial crop evaluations [34,35,36,37].
From a breeding standpoint, the identification of contrasting accessions represents one of the most relevant outcomes of this work. Accessions 1 and 16 showed superior performance for fruit weight and pulp yield, corresponding to an ideotype oriented toward yield efficiency and industrial processing. Similar ideotypes have been proposed in previous studies, where large fruits with high pulp proportion were identified as priority breeding targets due to their direct impact on juice yield and processing profitability [5]. In contrast, accession 55 exhibited higher soluble solid content, indicating superior sweetness and potential sensory quality. This pattern mirrors results reported in earlier evaluations, where genotypes with high soluble solids often displayed lower pulp yield due to thicker rind, revealing a trade-off between quality and processing efficiency [34].
Multivariate analyses provided a robust framework for interpreting diversity and guiding parent selection. The concordance among PCA, Tocher optimization, and UPGMA clustering indicates that the grouping patterns are biologically meaningful and suitable for breeding purposes. Similar convergence among multivariate methods has been reported in Passiflora studies, where integrated analyses based on multiple descriptors were effective in identifying divergent groups and supporting the selection of parents for recombining complementary traits [35]. Thus, the identification of accessions belonging to distinct multivariate groups provides a rational basis for crosses aimed at broadening the genetic base and maximizing genetic gains.
Although fruit traits were the primary drivers of divergence, reproductive traits may also influence yield indirectly. Studies on P. cincinnata and related species have demonstrated that floral morphology and pollination biology affect fruit set and seed number, particularly under environments where pollinator availability or environmental constraints limit reproductive success [14,18]. These findings indicate that variation in floral traits can contribute to differences in fruit performance and should be considered as complementary information in breeding programs focused on yield stability.
Overall, the results corroborate previous findings and reinforce the value of classical morphoagronomic evaluation combined with mixed-model and multivariate analyses for identifying promising genetic resources in Passiflora. The phenotypic patterns observed here are consistent with those reported in breeding and diversity studies based on the same methodological framework, supporting the conclusion that the evaluated germplasm represents a valuable genetic resource for passion fruit breeding programs [32,34].

5. Conclusions

This study demonstrates that the Passiflora germplasm conserved at Embrapa Semiárido harbors substantial phenotypic and genetic diversity with direct relevance to fruit production and quality. Accessions 1 and 16 emerge as priority materials for improving yield and industrial efficiency, whereas accession 55 represents a key source of quality-related traits, particularly soluble solid content. Together, these accessions provide valuable opportunities for strategic crosses aimed at developing high-yielding, high-quality, and passion fruit cultivars resilient to semi-arid climatic conditions.

Supplementary Materials

The following supporting information can be downloaded at: https://www.mdpi.com/article/10.3390/agriculture16050521/s1, Table S1: Composition of the Passion Fruit Active Germplasm Bank (AGB) and availability of fruit, plant, and flower descriptors for the evaluated accessions of Passiflora spp. Table S2: Qualitative leaf descriptors of Passiflora accessions, including leaf margin (BLF), blade division (DLF), and central lobe characteristics (FAF/PRS). Table S3. Mean values of floral descriptors evaluated in Passiflora accessions. Mean values followed by the same letter within each column do not differ significantly according to the Scott–Knott multiple comparison test (p ≤ 0.05). Summary statistics (mean, SD, CV, and significance levels) are provided at the bottom of the table. ** indicate significance at p ≤ 0.01. Table S4. Mean values of vegetative descriptors evaluated in Passiflora accessions. Mean values followed by the same letter within each column do not differ significantly according to the Scott–Knott multiple comparison test (p ≤ 0.05). Summary statistics (mean, SD, CV, and significance levels) are provided at the bottom of the table. ** indicate significance at p ≤ 0.01. Table S5: Predicted genetic gain estimates for fruit diameter (DFR), fruit length (CFR), length-to-diameter ratio (RCL), rind thickness (ECA), rind weight (WCA), seed weight (WSE), number of seeds per fruit (NSF), soluble solids (SS), titratable acidity (AT), fruit weight (WFR), pulp weight (WPO), and pulp yield (RES) in Passiflora spp. accessions. Where g = genotypic effect; u + g = total genotypic value. Table S6: Predicted genetic gain estimates for sepal length (CSE), sepal width (LSE), petal length (CPE), bract length (CBR), androgynophore length (CAN), and diameter of the corona extremity (DEC) in Passiflora spp. accessions. Where g = genotypic effect; u + g = total genotypic value. Table S7: Predicted genetic gain estimates for leaf blade length (CLF), maximum leaf width (LMF), and petiole length (COP) in Passiflora spp. accessions. Where g = genotypic effect; u + g = total genotypic value.

Author Contributions

Conceptualization, N.F.d.M., O.N.d.J., F.G.F. and M.L.N.d.L.; methodology, M.L.N.d.L. and N.F.d.M.; validation, N.F.d.M., J.M.R. and M.L.N.d.L.; formal analysis, N.F.d.M. and M.L.N.d.L.; investigation, N.F.d.M. and M.L.N.d.L.; resources, N.F.d.M., O.N.d.J., F.G.F.; data curation, N.F.d.M. and M.L.N.d.L.; writing—original draft preparation, N.F.d.M. and M.L.N.d.L.; writing—review and editing, N.F.d.M., M.L.N.d.L. and J.M.R.; visualization, N.F.d.M. and M.L.N.d.L.; supervision, N.F.d.M.; project administration, N.F.d.M., O.N.d.J. and F.G.F.; funding acquisition, N.F.d.M. All authors have read and agreed to the published version of the manuscript.

Funding

This research was funded by Empresa Brasileira de Pesquisa Agropecuária (Grant numbers SEG-10.20.02.12.00.07.01 and SEG- 20.23.02.004.00.05), Capes (L.P.C.N.—Grant number CAPES 0001) and CNPq (N.F.M.—Grant number PQ-306505/2022-3).

Institutional Review Board Statement

Not applicable.

Data Availability Statement

The original contributions presented in this study are included in the article/Supplementary Material. Further inquiries can be directed to the corresponding author.

Acknowledgments

The authors would like to thank the Coordenação de Aperfeiçoamento de Pessoal de Nível Superior (CAPES—0001), Embrapa Semiárido, and the Universidade Federal do Vale do São Francisco. We are grateful to the anonymous reviewers for their constructive comments and insightful suggestions, which substantially improved the quality of this manuscript.

Conflicts of Interest

The authors declare no conflicts of interest.

References

  1. Feuillet, C.; MacDougal, J.M. A new infrageneric classification of Passiflora L. (Passifloraceae). Passiflora 2003, 13, 34–38. [Google Scholar]
  2. Cervi, A.C. Passifloraceae do Brasil: Estudos do Gênero Passiflora L.; Fontqueria: Madrid, Spain, 1997. [Google Scholar]
  3. IBGE. Produção Agrícola Municipal: Culturas Temporárias e Permanentes. Instituto Brasileiro de Geografia e Estatística: Rio de Janeiro, Brazil, 2023. Available online: https://www.ibge.gov.br/explica/producao-agropecuaria/maracuja/br (accessed on 10 January 2026).
  4. Meletti, L.M.M.; Bruckner, C.H. Melhoramento genético do maracujazeiro. In Maracujá: Produção e Qualidade; Bruckner, C.H., Picanço, M.C., Eds.; UFV: Viçosa, Brazil, 2001; pp. 345–385. [Google Scholar]
  5. Santos, J.L.V.; Resende, E.D.; Cenci, S.A.; Maldonado, J.F.M. Productivity and Juice Quality of Different Passion Fruit Cultivars Grown in Northwest Region of Rio de Janeiro. Rev. Bras. Tecnol. Agroindustr. 2023, 17, 4150–4169. [Google Scholar] [CrossRef]
  6. Viana, A.P.; Lima e Silva, F.H.; Glória, L.S.; Ribeiro, R.M.; Krause, W.; Boechat, M.S.B. Implementing genomic selection in sour passion fruit population. Euphytica 2017, 213, 228. [Google Scholar] [CrossRef]
  7. Wu, W.; Ma, F.; Zhang, X.; Tan, Y.; Han, T.; Ding, J.; Wu, J.; Xing, W.; Wu, B.; Huang, D.; et al. Research progress on viruses of Passiflora edulis. Biology 2024, 13, 839. [Google Scholar] [CrossRef]
  8. Ribeiro, C.A.M.; Benedetti, A.R.; Tessmer, M.A.; Soares, N.R.; Bibiano, L.B.J.; Gloria, B.A.; Piedade, S.M.D.S.; Dias, K.O.G.; Vieira, M.L.C. Self-incompatibility and phenotypic assessment of yield and quality in Passiflora alata, an understudied tropical fruit species. Sci. Hortic. 2024, 338, 113666. [Google Scholar] [CrossRef]
  9. Tinôco, I.C.M.; Guedes Bezerra, B.; Lucio, P.S.; Barbosa, L.M. Characterization of Rainfall Patterns in the Semiarid Brazil. Anuário Inst. Geociências 2019, 41, 397–409. [Google Scholar] [CrossRef]
  10. Brito, R.S.; Andrade Neto, R.C.; Andrade, R.A. Survey of sour passion fruit cultivars commercialized in Brazil. Sci. Electron. Arch. 2022, 15, 65–72. [Google Scholar] [CrossRef]
  11. INMET—Instituto Nacional de Meteorologia. Normais Climatológicas do Brasil 1991–2020; Ministério da Agricultura e Pecuária: Brasília, Brazil, 2022. Available online: https://portal.inmet.gov.br/normais (accessed on 5 May 2025).
  12. IPCC. Climate Change 2023: Impacts, Adaptation and Vulnerability; Cambridge University Press: Cambridge, UK, 2023. [Google Scholar]
  13. Araújo, F.P. Caracterização da Variabilidade Morfoagronômica de Maracujazeiro (Passiflora cincinnata Mast.) No Semiárido Brasileiro. Ph.D. Thesis, Universidade Estadual Paulista (UNESP), Faculdade de Ciências Agronômicas, Botucatu, Brazil, 2007. Available online: https://hdl.handle.net/11449/103239 (accessed on 11 February 2026).
  14. Kiill, L.H.P.; Siqueira, K.M.M.; Araújo, F.P.; Trigo, S.P.M.; Feitoza, E.A.; Lemos, I.B. Biologia reprodutiva de Passiflora cincinnata Mast. (Passifloraceae) na região de Petrolina (Pernambuco, Brazil). Oecol. Aust. 2010, 14, 115–127. [Google Scholar] [CrossRef][Green Version]
  15. Barrett, S.C.H. The evolution of plant sexual diversity. Nat. Rev. Genet. 2002, 3, 274–284. [Google Scholar] [CrossRef]
  16. Lloyd, D.G.; Webb, C.J. The avoidance of interference between the presentation of pollen and stigmas in angiosperms. New Zeal. J. Bot. 1986, 24, 135–162. [Google Scholar] [CrossRef]
  17. Armbruster, W.S.; Bolstad, G.H.; Hansen, T.F.; Keller, B.; Conti, E.; Bjerknes, Ø.; Pélabon, C. The measure and mismeasure of reciprocity in heterostylous flowers. New Phytol. 2009, 183, 530–544. [Google Scholar] [CrossRef] [PubMed]
  18. Dai, C.; Galloway, L.F. Do dichogamy and herkogamy reduce sexual interference in a self-incompatible species? Funct. Ecol. 2011, 25, 271–278. [Google Scholar] [CrossRef]
  19. Engels, J.M.M.; Visser, L. A Guide to Effective Management of Germplasm Collections; IPGRI: Rome, Italy, 2003. [Google Scholar]
  20. Bioversity International. Descriptors for Passiflora (Passion Fruit); Bioversity International: Rome, Italy, 2007. [Google Scholar]
  21. Viana, A.P.; Pereira, T.N.S.; Pereira, M.G.; Souza, M.M.; Maldonado, J.F.M.; Amaral Júnior, A.T. Genetic diversity among yellow passion fruit commercial genotypes and among Passiflora species using RAPD. Rev. Bras. Frutic. 2003, 25, 489–493. [Google Scholar] [CrossRef]
  22. Carmo, T.V.B.; Martins, L.S.S.; Musser, R.S.; Silva, M.M.; Santos, J.P.O. Genetic Diversity in Accessions of Passiflora cincinnata Mast. Based on Morphoagronomic Descriptors and Molecular Markers. Rev. Caatinga 2017, 30, 68–77. [Google Scholar] [CrossRef]
  23. Cruz, C.D.; Carneiro, P.C.S.; Regazzi, A.J. Modelos Biométricos Aplicados ao Melhoramento Genético, 3rd ed.; UFV: Viçosa, Brazil, 2014. [Google Scholar]
  24. de Resende, M.D.V. Métodos Estatísticos Ótimos na Análise de Experimentos de Campo; Embrapa Florestas: Colombo, Brazil, 2004; 57p, Available online: https://www.infoteca.cnptia.embrapa.br/infoteca/bitstream/doc/305549/1/doc100.pdf (accessed on 6 February 2026).
  25. Hair, J.F.; Black, W.C.; Babin, B.J.; Anderson, R.E. Multivariate Data Analysis, 7th ed.; Pearson: London, UK, 2014. [Google Scholar]
  26. Mohammadi, S.A.; Prasanna, B.M. Analysis of genetic diversity in crop plants. Crop Sci. 2003, 43, 1235–1248. [Google Scholar] [CrossRef]
  27. Moro, M.F.; Amorim, V.O.; Queiroz, L.P.; Costa, L.R.F.; Maia, R.P.; Taylor, N.P.; Zappi, D.C. Biogeographical Districts of the Caatinga Dominion: A Proposal Based on Geomorphology and Endemism. Bot. Rev. 2024, 90, 376–429. [Google Scholar] [CrossRef]
  28. Souza, S.F.; Ribeiro, V.G. Yellow passion fruit irrigated in different cropping systems. Rev. Bras. Frutic. 2016, 38, e-512. [Google Scholar] [CrossRef]
  29. Jesus, O.N.; Oliveira, E.J.; Faleiro, F.G.; Soares, T.L.; Girardi, E.A. Illustrated Morpho-Agronomic Descriptors for Passiflora spp.; Embrapa: Brasília, Brazil, 2017; Available online: https://www.alice.cnptia.embrapa.br/bitstream/doc/1065191/1/IllustratedmorphoagronomicOnildoNunesFabioFaleiro2017atual.pdf (accessed on 17 February 2025).
  30. Instituto Adolfo Lutz. Métodos Físico-Químicos para Análise de Alimentos, 4th ed.; IAL: São Paulo, Brazil, 2008. [Google Scholar]
  31. Azevedo, C.F. MultivariateAnalysis: Multivariate Analysis for Genetic Divergence Studies. R Package Version 0.5.1. 2024. Available online: https://cran.rproject.org/package=MultivariateAnalysis (accessed on 12 May 2025).
  32. Souza, V.O.; Souza, M.M.; Almeida, A.-A.F.; Barroso, J.P.; Viana, A.P.; Melo, C.A.F. Pre-breeding in Passiflora subrotunda Mast.: Morphological and reproductive characterization at different light levels. HortScience 2018, 53, 949–957. [Google Scholar] [CrossRef]
  33. Sousa, L.B.; Silva, E.M.; Gomes, R.L.F.; Lopes, Â.C.A.; Silva, I.C.V. Characterization and genetic divergence of Passiflora edulis and P. cincinnata accessions based on physical and chemical fruit characteristics. Rev. Bras. Frutic. 2012, 34, 832–839. [Google Scholar] [CrossRef]
  34. Chavarría-Perez, L.M.; Giordani, W.; Dias, K.O.G.; Costa, Z.P.; Ribeiro, C.A.M.; Benedetti, A.R.; Cauz-Santos, L.A.; Silva Pereira, G.; Bachega Feijó Rosa, J.R.; Franco Garcia, A.A.; et al. Improving yield and fruit quality traits in sweet passion fruit: Evidence for genotype by environment interaction and selection of promising genotypes. PLoS ONE 2020, 15, e0232818. [Google Scholar] [CrossRef]
  35. Moraes, M.C.; Geraldi, I.O.; Matta, F.P.; Vieira, M.L.C. Genetic and phenotypic parameter estimates for yield and fruit quality traits from a single wide cross in yellow passion fruit. HortScience 2005, 40, 1978–1981. [Google Scholar] [CrossRef]
  36. Silva, F.H.L.; Viana, A.P.; Santos, E.A.; Freitas, J.C.O.; Rodrigues, D.L.; Amaral Júnior, A.T. Prediction of genetic gains by selection indexes and REML/BLUP methodology in a population of sour passion fruit. Acta Sci. Agron. 2017, 39, 183–190. [Google Scholar] [CrossRef]
  37. Santos, E.A.; Viana, A.P.; Freitas, J.C.O.; Rodrigues, D.L.; Tavares, R.F.; Paiva, C.L.; Souza, M.M. Genotype selection by REML/BLUP methodology in a segregating population from an interspecific Passiflora spp. crossing. Euphytica 2015, 204, 1–11. [Google Scholar] [CrossRef]
Figure 1. Spatial distribution of Passiflora spp. accessions from Northeastern Brazil conserved in the germplasm bank. The Caatinga Domain is shown as a shaded area, and the geographic origin of the accessions is indicated by different colored geometric symbols (circles, triangles, squares, and diamonds). Portuguese terms shown in the figure correspond to official geographic place names and are maintained in their original language.
Agriculture 16 00521 g001
Figure 2. Representative example of a pentalobed leaf of Passiflora cincinnata Mast. The figure illustrates leaf descriptors used for characterization, including maximum leaf width (LMF), petiole length (COP), and depth of the sinus (PRS).
Agriculture 16 00521 g002
Figure 3. Representative floral morphologies of Passiflora accessions at anthesis. Quantitative descriptors included sepal length and width (CSE, LSE), petal length (CPE), bract length (CBR), and diameter of the corona extremity (DEC). Qualitative descriptors related to corona morphology, filament coloration, and stigma number were also recorded.
Agriculture 16 00521 g003
Figure 4. Representative example of fruit morphology and fruit descriptors of Passiflora. The figure illustrates measurements of fruit length (CFR) and fruit diameter (DFR) in the whole fruit, as well as internal fruit traits observed in transverse section, including pulp (juice) yield, seed weight, and rind thickness. Arrows indicate the descriptors and fruit components considered for morphoagronomic characterization.
Agriculture 16 00521 g004
Figure 5. Leaf morphology of Passiflora spp. accessions. Letters indicate the leaf types observed according to qualitative leaf descriptors. Panels (AK) correspond to Group A; (LY) to Group B; (ZCC) to Group C; (DDGG) to Group D; (HH,II) to Group E; (JJ,KK) to Group F; (LL,MM) to Group G; and panel (NN) represents Group H.
Agriculture 16 00521 g005
Figure 6. Principal Component Analysis (PCA) of morphoagronomic descriptors of passion fruit accessions (Passiflora spp.). Panel (A) shows fruit-related descriptors: DFR (fruit diameter), CFR (fruit length), WFR (fruit weight), WCA (rind weight), WSE (seed weight), WPO (pulp weight), NSF (number of seeds per fruit), ECA (rind thickness), RES (pulp yield), and RT (ratio SS/TA). Panel (B) presents plant descriptors: CLF (leaf blade length), LMF (maximum leaf width), and COP (petiole length). Panel (C) displays flower descriptors: CSE (sepal length), CBR (bract length), CPE (petal length), CAN (androgynophore length), DEC (diameter of the corona extremity), and LSE (sepal width). Numbers correspond to the evaluated accessions. Accessions highlighted with red circles indicate genotypes showing distinct positioning in the multivariate space for fruit, plant, and flower descriptors, representing contrasting or superior trait performance as discussed in the Section 3.
Agriculture 16 00521 g006
Figure 7. Hierarchical cluster analysis (UPGMA) of Passiflora accessions based on fruit yield- and quality-related descriptors, using squared standardized Euclidean distance. The dendrogram illustrates the hierarchical relationships among accessions, and the dashed horizontal line indicates the dissimilarity level adopted for group definition. Grouping patterns are consistent with the PCA structure and Tocher optimization results. Each number corresponds to an individual accession.
Agriculture 16 00521 g007
Figure 8. Hierarchical cluster analysis (UPGMA) of Passiflora accessions based on vegetative descriptors, using squared standardized Euclidean distance. The dendrogram depicts hierarchical relationships among accessions, and the dashed horizontal line indicates the dissimilarity level used for group delimitation. Clustering patterns complement the multivariate structure revealed by PCA. Each number corresponds to an individual accession.
Agriculture 16 00521 g008
Figure 9. Hierarchical cluster analysis (UPGMA) of Passiflora accessions based on floral descriptors, using squared standardized Euclidean distance. The dendrogram represents the hierarchical structure of similarity among accessions, with the dashed horizontal line indicating the dissimilarity threshold used to define groups. Results are interpreted in conjunction with PCA and Tocher analyses. Each number corresponds to an individual accession.
Agriculture 16 00521 g009
Figure 10. Hierarchical cluster analysis (UPGMA) of Passiflora accessions based on integrated plant, flower, and fruit descriptors, using squared standardized Euclidean distance. The dendrogram summarizes overall phenotypic divergence among accessions, with the dashed horizontal line indicating the dissimilarity threshold adopted for group definition. Grouping patterns are consistent with PCA and Tocher optimization analyses. Each number corresponds to an individual accession.
Agriculture 16 00521 g010
Table 1. List of morphoagronomic descriptors used for the evaluation of Passiflora accessions.
CategoryCodeDescriptorUnit
PlantCRABranch colorcategorical
PlantPARPresence of anthocyanin in branchespresence/absence
PlantPHEPresence of heterophyllypresence/absence
PlantPESPresence of stipulespresence/absence
PlantCLFLeaf blade lengthcm
PlantLMFMaximum leaf widthcm
PlantPRSSinus depthcm
PlantFOFLeaf shapecategorical
PlantBLFLeaf blade margincategorical
PlantPPFPresence of leaf pubescencepresence/absence
PlantDLFLeaf blade divisioncategorical
PlantFBLFBullate shape of the leaf bladecategorical
PlantCOFLeaf colorcategorical
PlantFAFLeaf apex shapecategorical
PlantPNEPresence of nectaries on the leaf bladepresence/absence
PlantNNENumber of nectariescount
PlantPONPosition of nectaries on the leaf bladecategorical
PlantCOPPetiole lengthcm
PlantNNPNumber of nectaries on the petiolecount
PlantPNPPosition of nectaries on the petiolecategorical
FlowerNNSNumber of nectaries on the sepalcount
FlowerCANAndrogynophore lengthcm
FlowerDECDiameter of the corona extremitycm
FlowerBFCBanding (rings of different colors)categorical
FlowerNACNumber of colored ringscount
FlowerCACPredominant color of the filamentscategorical
FlowerCPEPetal lengthcm
FlowerCFOColor of erect filamentscategorical
FlowerCPPPredominant color of the perianthcategorical
FlowerPABPresence of anthocyanin in bractspresence/absence
FlowerFHPHypanthium shapecategorical
FlowerCBRBract lengthcm
FlowerPNBPresence of nectaries on the bractpresence/absence
FlowerNNBNumber of nectaries on the bractcount
FlowerCSESepal lengthcm
FlowerLSESepal widthcm
FlowerPNSPresence of nectaries on the sepalpresence/absence
FruitWCARind weightg
FruitCACFRind colorcategorical
FruitFFRFruit shapecategorical
FruitDFRFruit diametercm
FruitCFRFruit lengthcm
FruitECARind thicknessmm
FruitRCLLength-to-diameter ratioratio
FruitWFRFruit weightg
FruitWSESeed weightg
FruitNSFNumber of seeds per fruitcount
FruitWPOPulp weightg
FruitCPOPulp colorcategorical
FruitRESPulp yield%
FruitSSSoluble solids°Brix
FruitTATitratable acidity% (citric acid)
FruitRTRatio (SS/TA)ratio
Table 2. Classification of Passiflora accessions based on qualitative leaf descriptors and respective codes.
GroupNo. of AccessionsLeaf Shape/LobationLeaf MarginCentral Lobe Shape *
A11PentalobedSerratedUnidentate
B14PentalobedSerratedBidentate
C4PentalobedSerratedSerrated
D4PentalobedEntire
E2PentalobedCrenate
F2TrilobedSerratedSerrated
G2Trilobed or irregularEntire
H1EntireEntire
* Central lobe shape recorded as a qualitative trait associated with leaf morphology.
Table 3. Mean values of fruit yield- and quality-related descriptors evaluated in Passiflora accessions. Mean values followed by the same letter within each column do not differ significantly according to the Scott–Knott multiple comparison test (p ≤ 0.05). The overall mean, standard deviation (SD), coefficient of variation (CV), and significance levels from the analysis of variance are summarized at the bottom of the table for each descriptor. Measures of genetic parameters are provided in Table 4.
Fruit
AccessionTA
(%)
CFR
(cm)
DFR
(cm)
ECA
(cm)
WCA
(g)
WFR
(g)
WPO
(g)
WSE
(g)
NSF
-
RCL
-
RES
(%)
RTSS
(°Brix)
16.08 b6.44 b6.32 b0.42 c41.18 b129.96 a51.37 a24.27 a380.66 a1.01 c39.49 a1.71 c10.43 b
46.98 a5.8 c5.53 d0.45 c33.35 c82.48 c21.43 d17.77 b306.91 b1.05 b26.29 c1.64 c9.71 b
63.34 c6.84 a5.79 c0.47 c42.78 b101.58 b26.56 c16.52 b262.59 b1.17 a25.92 c2.25 c7.55 b
74.36 c5.79 c5.78 c0.37 d31.37 c97.77 b30.71 c19.47 b313.83 b1.01 c31.51 b2.29 c9.83 b
84.88 c5.66 c5.16 d0.37 d24.67 c75.08 c22.35 d15.51 c281.66 b1.09 b29.63 b2.36 c11.33 a
96.62 a5.08 d4.59 d0.43 c18.95 c48.47 d13.03 e10.5 c137.83 c1.1 b27.23 c1.84 c12.03 a
104.01 c4.54 d4.54 d0.47 c19.18 c45.2 d7.86 e9.33 c155.66 c1 c17.06 c2.57 b10.33 b
113.65 c4.39 d4.97 d0.38 d18.43 c43.25 d10.8 e6.71 c93.33 c0.88 d24.66 c3.66 a13.23 a
125.17 b5.58 c5.93 c0.53 c37.5 b91.77 b24.73 d20.18 b335.5 a0.94 d27.18 c2.09 c10.71 b
133.98 c4.98 d5.46 d0.48 c28.45 c70.33 c16.09 e18.62 b260.58 b0.91 d21.24 c3.23 a11.96 a
154.48 c5.44 c5.72 c0.43 c31.71 c91.01 b30.54 c17.51 b261.22 b0.94 d33.25 b2.66 b11.93 a
165.13 b6.03 b6.94 a0.47 c47.4 b142.88 a43.91 a24.15 a435 a0.87 d30.55 b1.83 c9.51 b
175.2 b5.18 d5.71 c0.38 d27.82 c82.2 c25.96 c16.9 b288.77 b0.91 d31.08 b2.24 c11.61 a
196.52 a5.01 d5.6 c0.34 d25.16 c78.72 c26.59 c19.21 b267.88 b0.89 d33.24 b1.69 c10.87 b
207.37 a5.75 c6.31 b0.54 c39.11 b104.81 b29.78 c27.4 a358 a0.91 d28.29 c1.74 c12.86 a
215.95 b5.36 c5.61 c0.43 c28.56 c80.63 c22.99 d21.43 b350 a0.95 c29.66 b2.02 c11.78 a
224.22 c5.25 d5.4 d0.48 c24.3 c79.76 c20.17 d17.24 b277.66 b0.97 c24.62 c1.78 c7.53 b
236.64 a5.33 c5.24 d0.44 c24.96 c68.53 c21.55 d12.62 c264.5 b1.01 c32.11 b1.78 c11.75 a
245.83 b5.55 c5.96 c0.45 c35.64 b94.88 b30.03 c19.65 b268.27 b0.93 d31.57 b1.97 c11.6 a
255.23 b4.79 d5.06 d0.47 c24.08 c60.69 d15.04 e12.14 c221.5 c0.95 c23.44 c1.99 c10.3 b
266.34 a5.88 c5.87 c0.47 c30.2 c88.08 b31.89 c17.75 b302.33 b1 c36.38 a1.95 c12.36 a
275.72 b5.56 c5.69 c0.5 c30.56 c83.71 c23.85 d18.02 b250.72 c0.98 c28.12 c1.87 c10.71 b
284.46 c5.37 c5.4 d0.38 d24.71 c75.23 c27.56 c14.78 c237 c0.99 c36.69 a2.52 b11.26 a
305.49 b5.53 c4.94 d0.36 d24.32 c62.58 d18.22 d13.08 c283.66 b1.11 a28.51 c1.8 c9.9 b
314.48 c5.23 d5.8 c0.47 c34.03 c88.45 b26.13 c16.84 b290 b0.9 d29.35 b2.6 b11.63 a
326.03 b4.73 d4.95 d0.34 d18.64 c57.33 d11.91 e13.42 c231 c0.95 c20.66 c1.81 c10.93 b
334.3 c4.75 d5.15 d0.32 d18.82 c58.55 d14.43 e11.57 c234.16 c0.92 d24.88 c2.63 b10.11 b
344.57 c5.15 d5.6 c0.37 d27.05 c78.61 c21.18 d18.98 b281.77 b0.92 d26.45 c2.29 c10.27 b
364.35 c5.14 d5.74 c0.59 c29.61 c76.06 c19.46 d12.79 c192.33 c0.89 d25.21 c2.31 c10.26 b
38-5.96 b5.91 c0.5 c42.27 b107.86 b27.82 c27.07 a362.33 a1.01 c25.93 c2.46 b10.4 b
405.4 b5.59 c6.2 c0.46 c32.89 c109.1 b43.62 a18.11 b294.66 b0.9 d39.88 a2.19 c11.86 a
445.29 b5.79 c5.32 d0.4 d26.98 c81.04 c23.76 d20.67 b327.26 a1.09 b29.87 b1.99 c10.02 b
485.69 b4.94 d4.92 d0.37 d23.36 c63.17 d13.4 e14.23 c266.66 b1 c21.18 c1.91 c10.86 b
495.74 b6.07 b6.07 c0.45 c37.03 b108.54 b35.92 b22.74 a340.83 a0.99 c32.68 b1.93 c11.08 b
505.38 b5.32 c5.37 d0.46 c26.48 c67.42 c17.95 d11.95 c190.22 c0.99 c26.57 c1.88 c10.05 b
524.66 c5.71 c5.64 c0.41 d32.49 c91.88 b23.16 d20.4 b275 b1.01 c25.2 c1.96 c9.16 b
535.4 b5.01 d5.96 c0.24 d23.5 c91.41 b33.96 c23.13 a367.66 a0.84 d37.05 a2.28 c12.23 a
545.18 b5.25 d6.02 c0.37 d31.34 c91.56 b32.08 c18.85 b305.16 b0.88 d35.57 a2.16 c11 b
554.33 c7.37 a7.13 a0.95 a73.57 a134.59 a30.69 c11.52 c220.22 c1.03 b21.01 c3.29 a14.24 a
566.83 a4.91 d5.24 d0.34 d25.19 c75.44 c27.41 c14.91 c289.66 b0.94 d36.05 a1.55 c10.56 b
594.99 c5.58 c5.3 d0.34 d27.74 c74.94 c19.46 d15.94 c293.66 b1.05 b25.51 c1.88 c9.43 b
645.21 b6.05 b6.42 b0.41 d40.79 b109.11 b34.96 c18.67 b258.16 b0.94 d32.01 b1.86 c9.76 b
653.87 c5.16 d5.23 d0.38 d22.47 c70.62 c20.64 d12.75 c199.5 c0.99 c28.9 c2.31 c8.95 b
663.84 c7.19 a6.14 c0.71 b45.81 b97.12 b20.79 d7.59 c191.59 c1.15 a19.89 c3.51 a13.39 a
685.69 b5.76 c5.76 c0.48 c27.22 c93.02 b37.82 b18.94 b385 a1 c40.27 a1.76 c9.96 b
725.57 b6.66 a5.81 c0.39 d35.64 b104.99 b36.71 b19.18 b312.25 b1.14 a35.14 a1.93 c10.73 b
735.08 b5.58 c5.76 c0.44 c29.73 c82.24 c26.54 c13 c216.11 c0.95 c32.57 b2.18 c10.71 b
744.5 c5.1 d5.17 d0.43 c26.47 c64.08 d14.68 e15.52 c288.6 b0.97 c23.07 c2.45 b10.72 b
Mean5.195.525.630.4430.7084.5125.1516.86275.180.9829.012.1810.82
CV (%)11.556.986.4315.0320.2718.4326.4519.4720.955.2715.2715.7911.22
Significance**************************
WCA = rind weight (g); WSE = seed weight (g); NSF = number of seeds per fruit; WPO = pulp weight (g); RES = pulp yield (%); DFR = fruit diameter (cm); CFR = fruit length (cm); ECA = rind thickness (cm); WFR = fruit weight (g); RCL = length-to-diameter ratio; SS = soluble solids (°Brix); RT = SS/TA ratio; TA = titratable acidity (%). ** indicate significance at p ≤ 0.01.
Table 4. Estimates of genetic and phenotypic parameters for morphoagronomic traits evaluated in passion fruit accessions, obtained using the REML/BLUP method. Where Vg = genotypic variance; Vbloc = environmental variance among blocks; Ve = residual variance; Vf = phenotypic variance; h2g = broad-sense heritability; C2bloc = coefficient of determination of block effects; h2mc = adjusted heritability; Acclon = selection accuracy; CVgi (%) = genotypic coefficient of variation; CVe (%) = residual coefficient of variation; CVr = relative coefficient of variation (CVgi/CVe); Mean = overall experimental mean.
CategoryDescriptorVgVblocVeVfh2gC2bloch2mcAcclonCVgi (%)CVe (%)CVrMean
PlantCLF0.81430.03280.73971.58680.51320.02070.68770.829312.77212.1731.04927.0653
COP0.33090.00040.33820.66950.49430.00050.66180.813518.57618.780.98923.0968
LMF2.82280.00391.61824.44490.63510.00090.77720.881616.36612.3921.320710.266
FlowerCAN0.09830.00520.37570.47920.20510.01090.34350.586126.21451.2510.51151.196
CBR0.08510.00030.06860.1540.55260.00210.71280.844310.3879.32341.11412.8083
CPE0.16970.00030.15550.32550.52140.0010.68590.828210.1069.67171.04494.0766
CSE0.12410.0020.14550.27170.45690.00730.63040.7948.6679.38480.92354.065
DEC3.69840.111354.40858.2180.06350.00190.11970.34619.70775.5860.26079.7586
LSE0.0160.00040.01090.02730.58610.01520.74620.86388.02566.61891.21251.5756
FruitWCA84.08512.19565.035161.310.52120.07560.72110.849230.87827.1561.137129.697
WSE15.3310.019119.93835.2880.43450.00050.6060.778423.28126.5490.876916.819
NSF274619.0695711.984770.32390.00220.49020.700118.98327.3780.6934276.05
WPO64.6051.50465.629131.740.49040.01140.66320.814330.96731.2110.992225.956
RES21.9543.751935.32861.0340.35970.06150.55410.744415.46619.6190.788330.295
DFR0.24070.00220.20320.44610.53970.00490.70330.83868.70517.99661.08865.6365
CFR0.34160.00140.23670.57970.58930.00230.74270.861810.578.79871.20135.5299
ECA0.01090.00170.00710.01960.55410.0860.75490.868824.84320.0221.24080.4199
WFR379.065.2165369.11753.390.50310.00690.67260.820122.9622.6571.013484.797
RCL0.0050.00730.00510.01740.28970.41820.66480.81546.97327.00230.99581.0168
SS0.97980.00222.63133.61330.27120.00060.42680.65339.065814.8570.610210.918
RT0.17760.02080.21390.41230.43080.05040.62420.7918.38620.1770.91122.292
TA0.67360.09960.77831.55150.43410.06420.63380.796116.61217.8570.93034.9405
CLF = leaf blade length (cm); COP = petiole length (cm); LMF = maximum leaf width (cm); CAN = androgynophore length (cm); CBR = bract length (cm); CPE = petal length (cm); CSE = sepal length (cm); DEC = diameter of the corona extremity (cm); LSE = sepal width (cm); WCA = rind weight (g); WSE = seed weight (g); NSF = number of seeds per fruit; WPO = pulp weight (g); RES = pulp yield (%); DFR = fruit diameter (cm); CFR = fruit length (cm); ECA = rind thickness (cm); WFR = fruit weight (g); RCL = length-to-diameter ratio; SS = soluble solids (°Brix); RT = SS/TA ratio; TA = titratable acidity (%).
Table 5. Clustering of Passiflora accessions obtained using Tocher’s method. Each number corresponds to an individual accession.
GroupAccession Number
Group 118, 51, 39, 63, 42
Group 25, 41
Group 317, 21, 31, 22, 48, 65, 36, 56, 33, 49, 40
Group 44, 27, 52, 59, 8, 30, 74, 50, 25, 28, 7, 54, 24, 12, 26, 72, 64, 68, 6, 73, 53, 23, 44, 15, 20, 38, 34, 13
Group 510, 11
Group 655, 66
Group 71
Group 89
Group 916
Group 1019
Group 1132
Disclaimer/Publisher’s Note: The statements, opinions and data contained in all publications are solely those of the individual author(s) and contributor(s) and not of MDPI and/or the editor(s). MDPI and/or the editor(s) disclaim responsibility for any injury to people or property resulting from any ideas, methods, instructions or products referred to in the content.