Article

Do Integrated CMD Management Practices Increase Cassava Yields? A Local Average Treatment Effect Analysis from Burkina Faso


by
Agnès Ouédraogo
1,*,
Eveline Sawadogo-Compaore
2,
Ezechiel Bionimian Tibiri
3,
Noël Thiombiano
1,
Adama Sagnon
3,
Seydou Sawadogo
3,
Fidèle Tiendrébéogo
4 and
Justin Simon Pita
4
1
Centre d’Etude, de Documentation et de Recherche Economiques et Sociales (CEDRES), Université Thomas Sankara (UTS), Ouagadougou 12 BP 417, Burkina Faso
2
Department of Natural Resources Management and Production Systems, Institut de l’Environnement et de Recherches Agricoles (INERA), Ouagadougou 01 BP 476, Burkina Faso
3
Laboratory of Virology and Plant Biotechnology, Institute of Environment and Agricultural Research (INERA), Ouagadougou 01 BP 476, Burkina Faso
4
Central and West African Virus Epidemiology (WAVE), Scientific and Innovation Hub of Bingerville, Félix Houphouët-Boigny University (UFHB), Abidjan 22 BP 582, Côte d’Ivoire
*
Author to whom correspondence should be addressed.
Agriculture 2026, 16(4), 441; https://doi.org/10.3390/agriculture16040441
Submission received: 8 January 2026 / Revised: 6 February 2026 / Accepted: 7 February 2026 / Published: 13 February 2026

Abstract

Cassava mosaic disease (CMD) is a major constraint to cassava production in sub-Saharan Africa, particularly in Burkina Faso, where it poses a serious threat to rural food security. This study examined the impact of adopting innovative cassava mosaic disease management practices on cassava yields in the Guiriko and Nando regions of Burkina Faso. To address potential biases arising from differences in characteristics between adopters and non-adopters, an econometric approach based on the instrumental variables (IV) method within a counterfactual framework was employed to estimate the local average treatment effect (LATE). The data were drawn from a survey conducted in September 2023 among 511 cassava producers. The results indicate that the adoption of innovative cassava mosaic disease management practices had a positive and statistically significant effect on agricultural yields. Productivity gains were estimated at 29% in the Guiriko region and 41% in the Nando region, highlighting spatial heterogeneity in impacts. These findings suggest that promoting the diffusion of such practices can substantially improve cassava productivity and reduce the vulnerability of rural households. In addition, the analysis showed that socioeconomic and technical factors, including farmers’ age, membership in cassava producer organizations, household income levels, and the use of chemical fertilizers, also influence productivity outcomes. Overall, the study underscores the importance of strengthening agricultural extension services, supporting producer organizations, and promoting appropriate technologies to maximize the benefits of cassava mosaic disease management practices for food security and rural development.

1. Introduction

Cassava (Manihot esculenta Crantz), originally from Latin America, is a major source of calories for more than 800 million people in the tropics and subtropics including around 500 million in Africa [1]. In West Africa, cassava is experiencing a growing interest regarding the diversity of diet and its high yield potential [2,3,4,5]. In addition, it is adapted to wider agroecology, low fertile soils, and drought areas [6,7], suggesting its potential role to tackle hunger in marginal areas.
Despite its importance, cassava faces several constraints that significantly contribute to reducing its productivity [8]. Among these constraints, virus diseases, particularly the cassava mosaic disease (CMD), is the most severe [7,8,9]. The CMD is transmitted through infected planting material and vectors, such as whiteflies (Bemisia tabaci), and induces leaf deformation, chlorosis, and significant reductions in root development, which lead to yield losses up to 70% [10,11,12]. In Burkina Faso, since its first report in 2009, CMD continues to pose a serious threat to cassava production, particularly in smallholder farming systems, where access to healthy cuttings and advice for infected cassava plant management is limited [13,14,15,16]. Therefore, farmers are subjected to an increased production risk and reduced agricultural incomes, driven by the non-adoption of improved farming practices.
To alleviate the impact of virus diseases in cassava cropping systems, the adoption of management practices is crucial. These practices include the use of resistant varieties, the systematic removal of infected plants, and the phytosanitary treatment of cuttings [15,17,18,19]. The positive effects of adopting individual agricultural practice has been previously reported [20], however, several works support that integrated adoption of agricultural practices generates greater and more sustainable benefits in terms of crop yields and the resilience of agricultural systems. In the context of disease management, Sawadogo et al. [21] emphasized the importance of alternative and integrated management strategies that go beyond traditional approaches based solely on field monitoring. Similarly, Nsiah et al. [22] indicated that the adoption of resistant varieties, crop rotations, and intercropping in integrated disease and pest management were more appropriate and sustainable than a single practice.
The benefit of the combined adoption of agricultural practices has further been reported in improving agricultural yields and overall system performance. For instance, in maize cropping, combining optimal planting density, split fertilizer application, and deep tillage led to significantly improved nutrient use efficiency and increased grain yields by 25% to 37% [23]. Similarly, in the context of climate-smart agriculture in Ethiopia, the combined adoption of multiple practices including crop diversification, agroforestry, and adjustments in planting dates reduces yield gaps more effectively than the adoption of a single practice or non-adoption [24]. Moreover, Liang et al. [25] found that integrating complementary agricultural strategies such as crop rotation, no-tillage, organic amendments, and soil microbiome management generated synergistic benefits exceeding the sum of individual effects, with a yield gain reaching 15% to 30%. Finally, Westerberg et al. [26] revealed that farmers who simultaneously applied multiple agroecological practices, including zai pits, stone bunds, assisted natural regeneration, and legume–cereal intercropping, achieved a 77% yield increase compared with farmers who adopted few or no practices. However, the adoption of these practices to support production requires farmer awareness and the accessibility of improved materials.
In this context, since a decade ago, the Regional Center of Excellence for Transboundary Plant Pathogens, Central and West African Virus Epidemiology (WAVE) has established cassava disease survey programs and farmers and agricultural stakeholders training across 14 cassava producing countries to sustain cassava production. Evaluating the impacts of such intervention on the farmers’ ability to manage disease will help to strengthen disease management policies in smallholder farming systems. Indeed, training will increase the adoption of cassava mosaic disease management practices by cassava farmers. Adopting farmers may systematically differ from non-adopters in terms of resource endowments, access to information, risk preferences, or managerial capacity. Consequently, the observed yield differences may reflect pre-existing characteristics rather than the true causal effect of adoption. This selection bias raises concerns regarding the internal validity of existing estimates and limits their usefulness for guiding agricultural policies and extension programs. In the absence of credible causal identification, the available results provide limited decision-making value, particularly in resource-constrained contexts, where the effective targeting of interventions is essential.
This study addresses these gaps by providing a causal evaluation of the impact of integrated cassava mosaic disease management practices on cassava yields in Burkina Faso. Using primary survey data collected from 511 producers in the Guiriko and Nando regions, we adopted an instrumental variables approach model within a counterfactual framework to estimate the local average treatment effect (LATE). Access to CMD specific training was used as an instrument to correct selection bias and unobserved heterogeneity in adoption decisions. The training primarily influences CMD management practice adoption by enhancing the farmers’ technical knowledge and awareness of recommended practices, without directly affecting yields outside this channel, making it a relevant and exogenous instrument.
The study makes three main contributions. First, it provides one of the first causal estimates of the productivity effects of integrated CMD management practices in a smallholder farming context. Second, it extends the application of the LATE framework to the analysis of plant diseases and phytosanitary practices. Third, by comparing two distinct agroecological regions, it highlights regional heterogeneity in adoption effects, offering actionable insights for the geographic targeting of extension services, the design of phytosanitary training programs, and the development of sustainable CMD control strategies.

2. Materials and Methods

2.1. Study Area

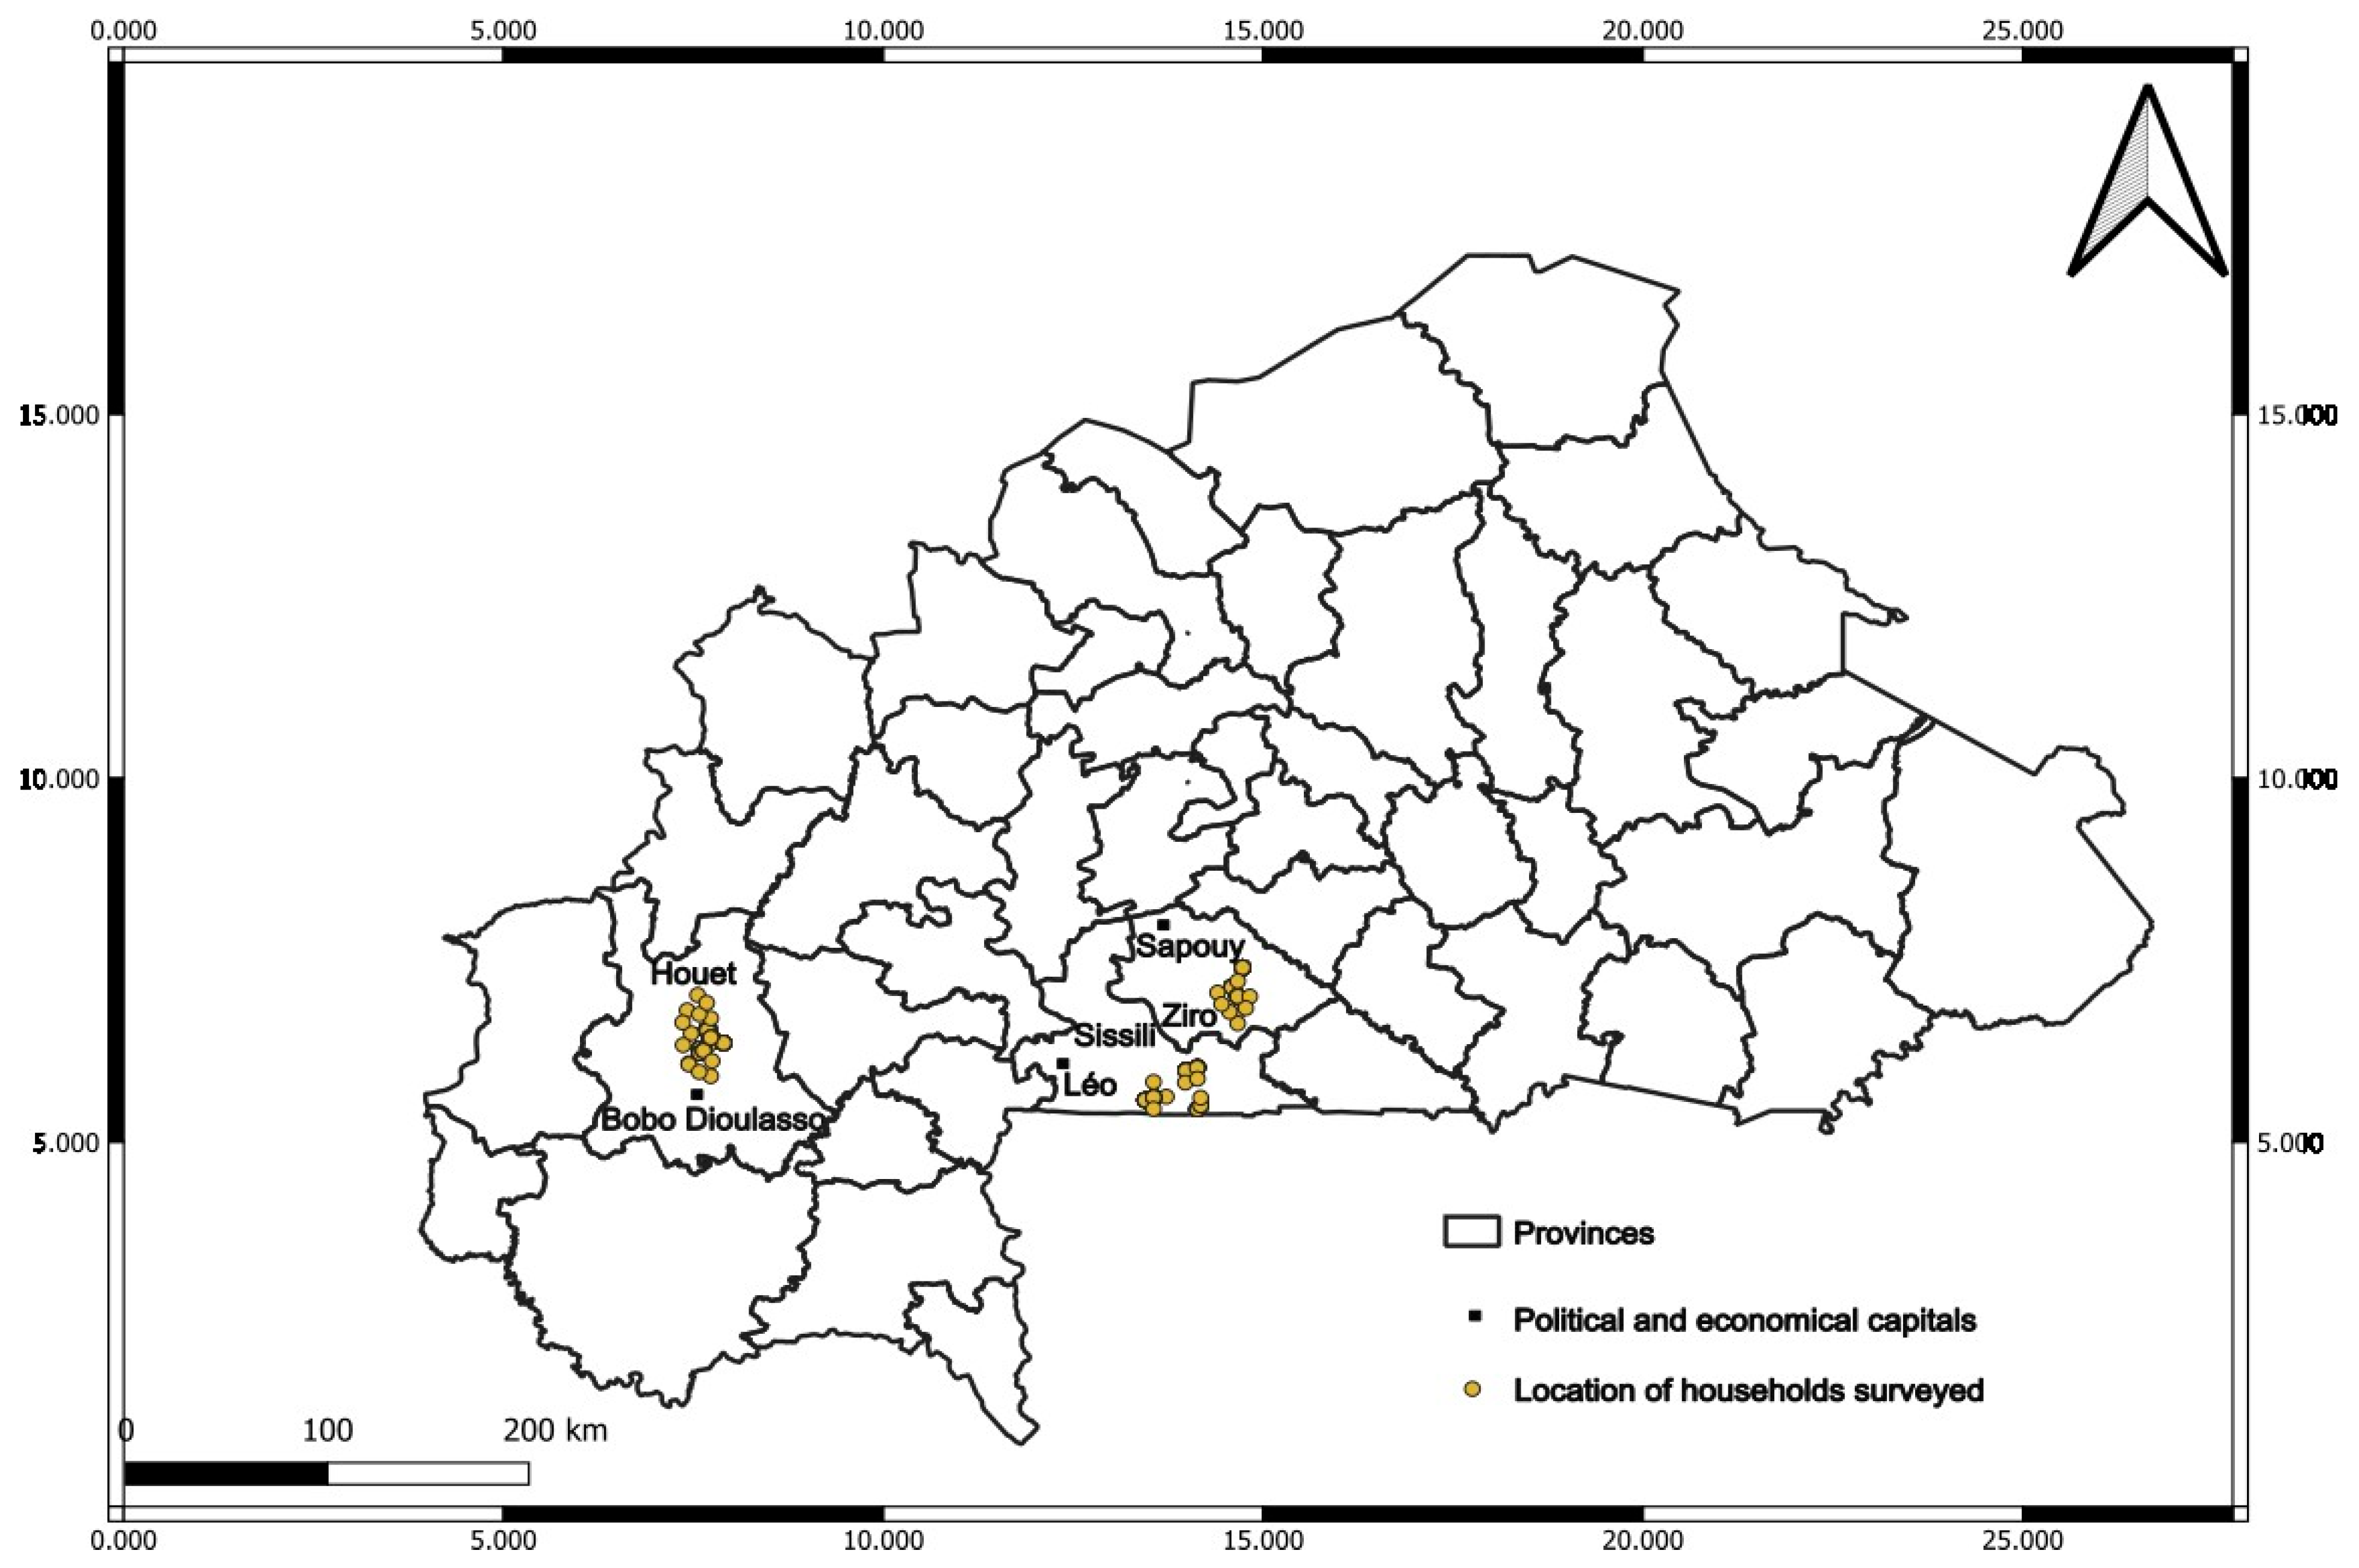
As illustrated in Figure 1, this study was conducted in two agroecological regions of Burkina Faso: Guiriko and Nando. These regions were selected as the study areas for several reasons. First, they host a large number of cassava producers, as cassava is a key crop for local food security. Second, they offer relative accessibility in a challenging security context that Burkina Faso has faced since 2015, which facilitated field data collection. Third, Guiriko and Nando are among the intervention areas of the WAVE (West African Virus Epidemiology) project, which has initiated prevention and control activities targeting cassava viral diseases in these regions. Finally, these regions are characterized by a high prevalence of viral diseases affecting cassava, with a higher incidence observed in the Nando region in 2020. This makes them particularly suitable for analyzing cassava mosaic disease management practices [15,21].
The Guiriko region is located in western Burkina Faso and covers an area of approximately 25,479 km2. It benefits from annual rainfall ranging between 800 and 1100 mm and possesses the densest hydrographic network in the country. The dominant soils consist of organic matter-rich sesquioxides derived from the weathering of tropical ferruginous soils, making them well-suited for agricultural activities. Agriculture therefore represents the main economic activity in the region.
The Nando region is located in the central-western part of the country and covers an area of approximately 21,891 km2. It exhibits a high diversity of soil types, including hydromorphic, tropical ferruginous, ferralitic, sandy, and loamy soils. The climate is both north-Sudanian, with annual rainfall ranging from 600 to 1000 mm, and south-Sudanian, with precipitation exceeding 1000 mm per year. Vegetation cover mainly consists of shrub and tree savannas as well as gallery forests.
For this study, the provinces of Houet, Sissili, and Ziro; the municipalities of Bobo-Dioulasso, Silly, Sapouy, Léo, and Biéha; and the villages of Panamasso, Doufiguisso, Kointou, Santidougou, Kimidougou, Cassou, Thiaburo, Thiagao, Yalé, Nablaliassan, Benaverou, Onliassan, and Silly were randomly selected.

2.2. Sampling

The overall sample was determined using Yamane’s formula [27]:
n = N 1 + N ( e ) 2
where n = sample size, N = number of cassava producers, and e = precision level, set here at 5% (i.e., 0.05).
Therefore, 255 and 256 households were interviewed in the Nando and Guiriko, respectively. The number of households to be surveyed per province, commune, and village was determined using the stratification method [28]. The repartition of these households surveyed during this study is summarized in Table 1.
Questionnaires designed to collect socio-economic and demographic information, data on the adoption and management of cassava mosaic disease, as well as information necessary for the analysis of household yields and well-being, were administered to the cassava producers electronically using tablets equipped with the KoboCollect application.

2.3. Theoretical Framework

From a theoretical perspective, our analysis is grounded in endogenous growth theory. Developed primarily by Romer [29,30,31], this theory highlights the central role of internal factors in driving long-term economic growth. Unlike neoclassical models [32], within the framework of endogenous growth theory, productivity gains arise from the accumulation of technological and cognitive capital generated through innovation, learning, and the adoption of new knowledge within production systems. Applied to agriculture, this perspective suggests that sustainable productivity improvements depend not only on the expansion of traditional inputs but also on the adoption of integrated practices that embody technical innovations and strengthen farmers’ capabilities. In this context, the integrated management of cassava mosaic disease (CMD) can be interpreted as a process of the endogenous accumulation of productive capital. The use of resistant varieties represents a form of embodied technological capital that reduces the biological vulnerability of crops. Regular field inspections contribute to the accumulation of cognitive capital by enhancing farmers’ observational, diagnostic, and decision-making skills. Finally, the phytosanitary treatment of cuttings combines technological and cognitive capital by mobilizing both specific technical knowledge and its practical application. The joint adoption of these practices generates complementary effects and synergies that enhance the overall production system efficiency, in line with the mechanisms predicted by endogenous growth theory. This theoretical framework therefore provides a coherent analytical basis for examining the impact of integrated CMD management practices on cassava productivity.

2.4. Empirical Model

The aim was to estimate the average productivity of innovative CMD management practices that are not adopted. Following the mean treatment effect described in previous reports [33,34,35], we used the counterfactual framework whereby each farmer has two potential outcomes: adopting and not adopting. Specifically, let Y 1 be the potential outcome of a farmer adopting innovative CMD management practices and Y 0 the potential outcome of this farmer if the pratices are not adopted. Thus, the treatment effect for a producer i is measured by the difference between Y 1 i Y 0 i . However, interpreting this difference as a causal relationship between adoption and producer productivity leads to selection bias [36]. If the difference in productivity is positive, it does not a priori indicate a causal relationship. Hence, we cannot conclude that the adoption of practices improves productivity. It may be true that at least some of the differences in production between adopters and non-adopters existed even before the activity. In the attempt to resolve this problem of selection bias and generate unbiased estimates of impact results, experimental (social experiment or randomization) and non-experimental approaches were developed. In this study, the impact of adopting innovative CMD management practices was based on a non-experimental method for several key reasons such as the absence of random assignment due to the free choice of adoption. Producers/adopters decide for themselves whether or not to participate, which means that the composition of the groups (adopters vs. non-adopters) is not random. In addition, the data used in this study were from a cross-sectional survey conducted after the innovation was adopted, and are not the result of an experimental or quasi-experimental design implemented prior to the intervention. This approach draws on economic and econometric theories to guide the analysis and minimize potential errors in impact estimation [37].
Let A i be a binary variable indicating the status of the cassava producer, with A i = 1 if the producer is an adopter and A i = 0 if not. Let Y 1 i and Y 0 i be two (2) random variables that represent the level of the outcome indicator (yield) for individual i if the producer has adopted the practices or not. The impact of adoption on individual i is the difference between this outcome indicator in an adoptive and non-adoptive situation ( α = Y 1 Y 0 ) . The fundamental problem with any impact assessment is that a producer cannot simultaneously be an adopter and a non-adopter of an innovation [37]. It is therefore impossible to observe both Y 1 and Y 0 for the same producer. The impossibility of observing both potential outcomes constitutes the fundamental problem of causal inference [38,39]. Therefore, Y , as represented below, is the only observable value of an outcome indicator.
Y = ( 1 A i ) Y 0 i + A i Y 1 i = Y 0 i + A i ( Y 1 i Y 0 i ) = Y 0 i + α A i
On the other hand, this causal effect can be determined for all producers concerned, as demonstrated by [35], provided that Y 1 i , Y 0 i and A 0 are all independent, given the socio-economic and demographic characteristics of the populations. This is the difference between the average level of the indicator for adopters and non-adopters. This means that the average treatment effect (ATE) can be represented as follows:
A T E = E ( α ) = E ( Y 1 Y 0 ) = E ( Y 1 ) E ( Y 0 )
The impact of adoption can only be credibly assessed if the subpopulation of non-adopters is well-defined and comparable to that of adopters. In other words, the two groups must be similar in all respects, except for the adoption of CMD management innovations. This indicator measures the impact of adoption on an individual drawn at random from the population [33]. We can also identify the average causal effect conditional on treatment, commonly known as ATE1 (Average Treatment Effect on Treated), as follows:
A T E 1 = E ( Y 1 Y 0 / A = 1 )
ATE1 represents the average effect of the treatment on the treated. It is generally different from the ATE parameter, except in the case of perfect adherence to the treatment. However, both ATE and ATE1 estimators are subject to two (2) types of bias [40] due to the difference between observable characteristics (overt bias) and the difference between unobservable characteristics (hidden bias), affecting the producers’ access to information and their decision to adopt or not. To exclude or minimize observable and unobservable biases, the instrumental variables (IV) method is often used [41]. This method assumes the existence of at least one variable z called an instrument, which directly affects adherence status but indirectly affects the results Y 1 and Y 0 once the independent variables X are controlled. It is used to estimate the LATE (Local Average Treatment Effect), which is the average impact for potential adopters.
In this study, the instrumental variable used was access to training (Accform). This is a binary variable equal to 1 if the farmer has received awareness-raising or training on the cassava mosaic disease (CMD) management practices provided, and 0 otherwise. The choice of this instrument was based on the idea that access to information strongly influences the likelihood of adopting agricultural innovations. Indeed, training provides farmers with the necessary knowledge to understand CMD management methods and their benefits, thereby increasing their propensity to adopt these practices. Conversely, in accordance with the validity requirements of an instrument, access to training should not directly affect productivity once adoption is controlled for. Training serves as a channel for information but does not itself modify production conditions if the recommended practices are not actually implemented [42]. Thus, its effect on yield operates solely through its impact on adoption, which satisfies the exclusion restriction assumption.
Two estimators are often calculated for the instrumental variables (VI). The first is the Wald estimator (non-parametric method) proposed by [43], which requires the outcome indicator Y, the ‘adoption status’ variable A, and the instrument z . The second estimator VI is proposed by [41] and is nothing more than a generalization of the first. It was the first estimator used in this research, given that we had only one instrument meeting the conditions of exogeneity and absence of simultaneity.
Considering the following linear equation:
Y i = α 0 + α i X i + β A i + u i  
where Y i = yield (production per hectare); A i = the treatment variable (adoption of CMD management innovations). It is endogenous (i.e., correlated with the residuals u i ; X i = other explanatory variables; α and β are the parameters to be estimated). Let us also consider z as an instrument.
Estimator is calculated as follows:
β = E ( Y / z = 1 ) E ( Y / z = 0 ) E ( A / z = 1 ) E ( A / z = 0 )  
As shown by [44], the instrumental variables estimator does not allow us to measure the average effect on all ‘treated individuals’ but only on a sub-population, the compliers. These are people for whom the instrument has an impact on whether or not they follow the treatment. The population is categorized as follows in the Table 2.
People who always choose the treatment regardless of the value of the instrument, (i.e., such that P ( A = 1   |   z = 1 ) = P ( A = 1   |   z = 0 ) = 1 ) are called always takers. Compliers are the population for which the instrument has an effect, that is, because the instrument has no effect for other populations. Therefore, they either never choose the program (never takers), or they always choose it (always takers). Finally, we can imagine that the ‘defiers’, people for whom the instrument has an effect, are the opposite to that commonly expected. The estimated effect is therefore said to be local. Angrist et al. [44] calls it LATE: the locale average treatment effect.
Conditional   expectation     E ( Y i / z i = 1 ) = E [ Y i 0 + A i ( Y i 1 Y i 0 ) / z i = 1 ]
LATE     β = E [ ( Y i 1 Y i 0 ) / A i ( z = 1 ) A i ( z = 0 ) = 1 ]
To assess the robustness of the baseline estimates, we complemented the LATE analysis with the inverse probability weighted regression adjustment (IPWRA) method. The IPWRA estimator combines propensity score weighting with outcome regression, yielding consistent estimates as long as either the treatment assignment model or the outcome model is correctly specified. This doubly robust property makes IPWRA particularly suitable for robustness checks and provides additional confidence in the stability and reliability of the estimated impacts.
We adopted a logarithmic specification of the yield model to facilitate the economic interpretation of the estimated coefficients and to mitigate potential heteroskedasticity in the residuals. Specifically, the dependent variable, representing cassava yield, is expressed in natural logarithms, while the treatment variable, indicating the adoption of integrated cassava mosaic disease management practices, is introduced as a binary variable.
Within this semi-logarithmic framework, the coefficient associated with the adoption variable can be interpreted as a relative variation in yield.

2.5. Description of Variables

  • Dependent variables
The dependent variable chosen was yield, which here represents the ratio of production obtained to the cassava cultivating area. It is also referred to as land productivity, and is measured in kilograms (kg) per hectare (kg/ha) or tons per hectare (t/ha). Thus, the term productivity used in this document still refers to yield.
  • Adoption variable
The adoption of best practices for managing cassava mosaic disease (PragestCMD) refers to the set of techniques promoted to farmers since 2015 by the WAVE initiative to reduce the spread of the virus [45]. Among these techniques, this study focused on three key practices:
  • Selection of disease-resistant varieties;
  • Regular field inspection, followed by the systematic removal of infected plants (through cutting, burning, or burying);
  • Phytosanitary treatment of cuttings, using pesticides or recommended solutions to eliminate insect vectors, particularly whiteflies.
Farmers who adopt all three practices are classified as “adopters”. In line with previous studies [46,47], we expect this variable to have a positive effect on cassava yield.
Table 3 shows the independent variables and their expected effects on cassava yield.
These variables were selected based on the empirical literature while ensuring the avoidance of multicollinearity in order to guarantee the robustness and reliability of the results.

2.6. Multicollinearity Test

Multicollinearity refers to a situation where one of the explanatory variables in a model is a linear combination of one or more other explanatory variables introduced in the same model. The classic approach to measuring multicollinearity is to examine the variance inflation factors (VIFs). The VIFs assess the increase in the variance of a coefficient due to a linear relationship with other predictors. If all VIFs are equal to 1, this indicates the absence of multicollinearity. On the other hand, if some VIFs are greater than 1, this suggests that the predictors are correlated. If the VIFs exceed 2.5, this means that there is significant multicollinearity [55]. This approach made it possible to include only independent variables with low intercorrelations in the model.

2.7. Statistical Software Used

Excel software was used for the design of the figures, and Stata 16 for the econometric analysis.

3. Results

3.1. Descriptive Statistics

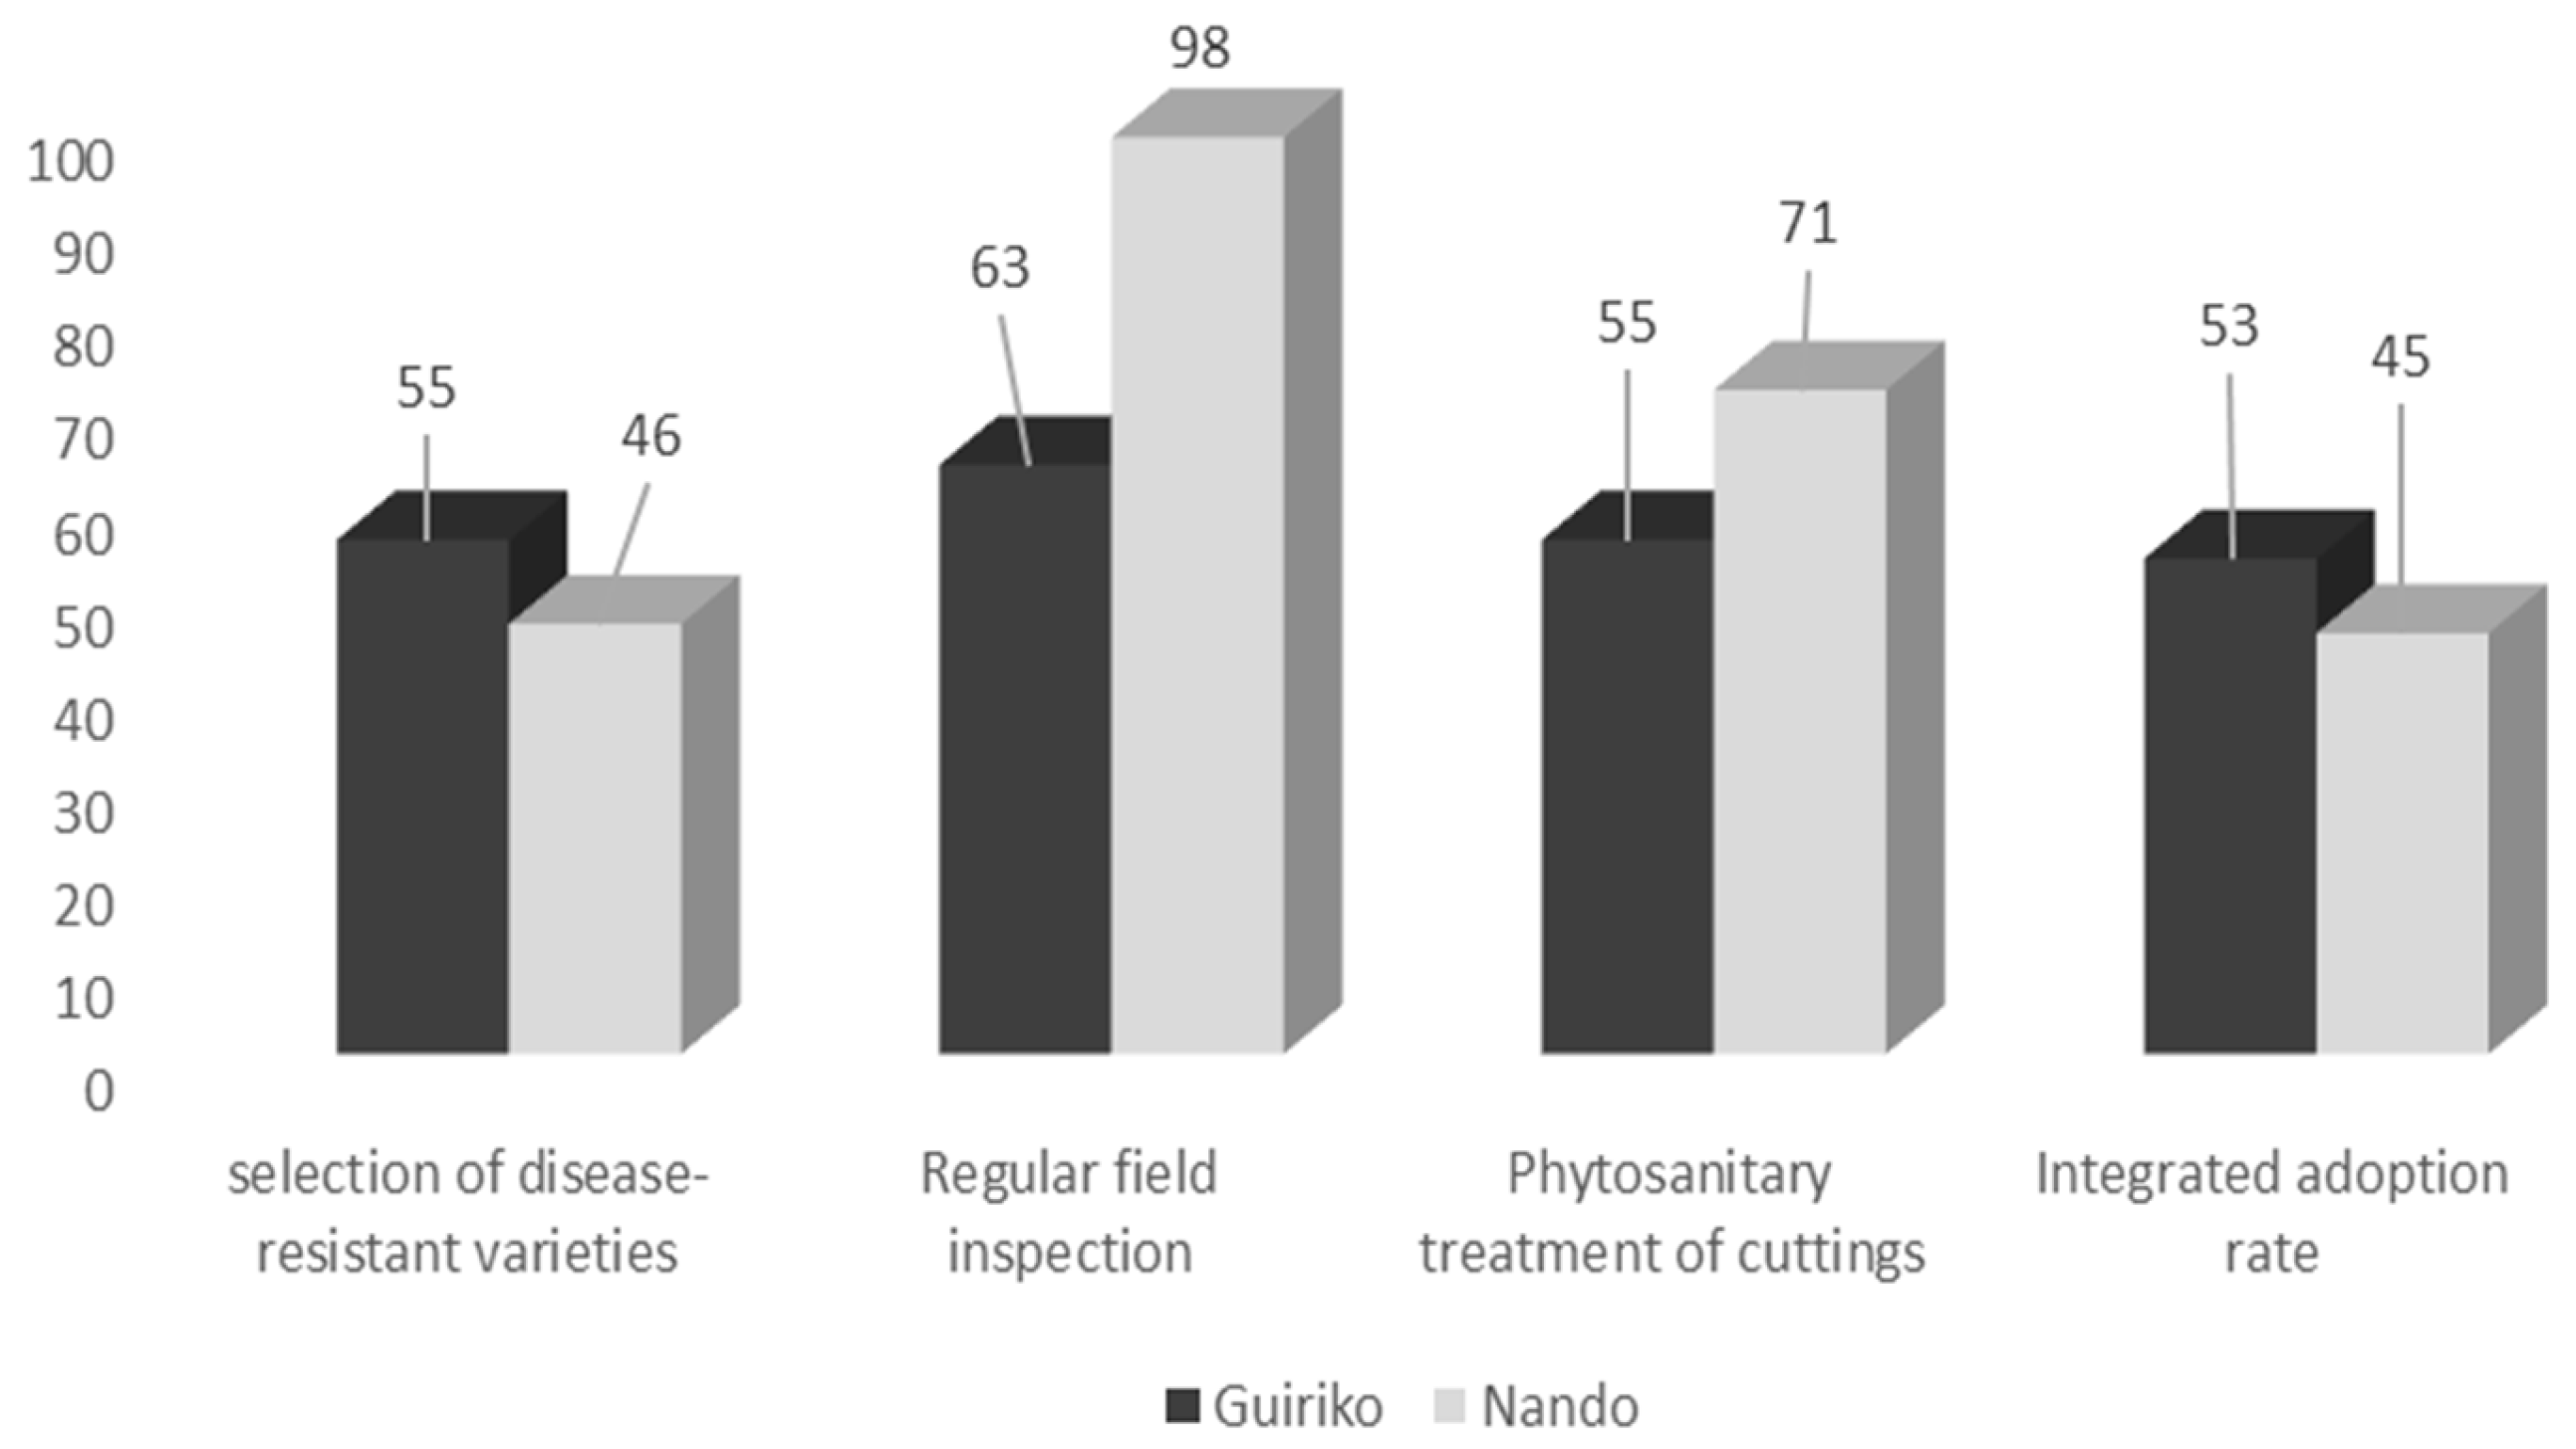
The analysis presented in Figure 2 shows that in the Guiriko region, 55% of producers use varieties that are more tolerant to CMD, 63% regularly inspect their fields to remove infected plants, and 55% treat their cuttings with the recommended solutions before planting. In contrast, in the Nando region, 46% of producers adopt resistant varieties, 98% regularly inspect their fields, and 71% treat their cuttings prior to planting.
However, the integrated adoption rate defined as the percentage of producers who simultaneously adopted all three practices stands at 53% in Guiriko and 45% in Nando. This indicates a higher adoption rate in Guiriko compared to Nando. This difference may be explained by the fact that the dissemination of innovative CMD management practices began earlier in the humid regions of the country, particularly in Guiriko, before being extended to other regions. Producers in this area therefore had more time to become familiar with and adopt these practices.
The analysis of Table 4 shows that producers have an average age of 44.06 years and an average total household income of CFA 2,150,305. In this study, the total household income was proxied by the total consumption expenditures, including both food and non-food expenditures. This choice is grounded in the permanent income hypothesis proposed by Friedman (1957), which posits that households base their consumption decisions on their long-term expected income rather than on their current income, which is often volatile. Consumption expenditures therefore provide a more stable and reliable measure of living standards and economic well-being. Moreover, compared to self-reported income, consumption data are generally less prone to measurement error and underreporting, particularly in rural settings where income sources are diverse, seasonal, and largely informal.
The average distance between the fields and the nearest market exceeded 14 km. The average cassava yield was 9312.25 kg per hectare. However, statistically significant differences were observed between producers who adopted the improved cassava management practices and those who did not, particularly with respect to cassava yield and total household income.
The analysis of Table 5 shows that overall, 87.28% of the sample consisted of men, compared to 12.72% women. Approximately 35.03% of respondents could read and write in at least one local language. Furthermore, 40.51% had at least five years of experience in cassava production. About 41.10% received training on cassava mosaic disease (CMD) management, while 62.82% were members of a local cassava producers’ association. Finally, 21.61% used chemical fertilizers in cassava production.
Regarding adoption status in the Guiriko region, 97.77% of adopters were men, a high proportion largely explained by the predominance of men in the sample. Only 7.40% of adopters could read and write in a local language. The majority (84.44%) had been growing cassava for more than five years. In addition, 94.81% of adopters received training on CMD management, and 65.18% belonged to a local cassava producers’ association. Finally, 55.55% reported using chemical fertilizers in cassava production.
In the Nando region, 73.04% of adopters were men. About 30.43% could read and write in at least one local language. Moreover, 45.22% had more than five years of cassava production experience, indicating a noteworthy level of agricultural expertise. A large majority (68.70%) received training on CMD management, and 93.91% were members of their local cassava producers’ association, reflecting strong integration within farmer networks. Finally, 17.54% of adopters reported using chemical fertilizers.
A comparative analysis between adopters and non-adopters in both regions revealed significant differences in cassava production experience, access to training, membership in producers’ associations, and use of chemical fertilizers, suggesting that these factors play a key role in the adoption of innovative CMD management practices.

3.2. Instrument Validation Test

The analysis of Table 6 shows that the p-value of the Durbin–Wu–Hausman (DWH) test was not significant, which confirms the exogeneity of our instrument. In addition, the analysis of the results in Table A1 and Table A2 in the Appendix shows that there was a significant positive correlation between the instrumental variable (access to training) and the adoption of innovative CMD management practices. In conclusion, our instrument is therefore valid.

3.3. Econometric Results

Table 7 shows that the model assessing the impact of adopting these practices on cassava yields was statistically significant at the 1% level, indicating that the coefficients of the explanatory variables were not jointly equal to zero. The adjusted R2 value of 0.57 suggests that the exogenous variables explained approximately 57% of the variation in yield.
To examine whether the impact varied among adopters, a Wald test was performed. The results led to the rejection of the null hypothesis, implying that at least one of the explanatory variable coefficients is non-zero. This indicates that the impact of adopting innovative CMD management practices is heterogeneous across producers, confirming the adequacy of the model specification used in this study.
The results also show that in the Guiriko region, producers who adopted innovative CMD management practices achieved yields that were 29% higher than those of non-adopters. In addition to the adoption of these innovative practices, variables such as the use of chemical fertilizers (Utilengch), membership in a cassava producers’ association (Apassma), and household total income also significantly influenced cassava yield.
The impact analysis presented in Table 8 indicates that the statistic Prob > F = 0.0000 means that the model was globally significant at the 1% level, implying that the coefficients of the explanatory variables were not jointly equal to zero. The Wald test, also significant at the 1% level, confirmed that the effect of adopting these innovative practices varied across producers. Thus, the specification of the impact model is considered appropriate.
The results further show that the adoption of innovative CMD management practices increased the cassava yield by 41% in the Nando region. Additionally, several other variables significantly influenced the cassava yield, including the producer’s age (Ag), membership in a cassava producers’ association (Apassma), and household total income (Revglo).
Analysis of Table 7 and Table 8 shows that the adjusted R2 value for the Guiriko and Nando regions was approximately 0.58 and 0.12, respectively. The relatively low adjusted R2 observed for the Nando region suggests that cassava yields there are influenced by a broader set of unobserved or omitted factors. This difference can be explained, in part, by the marked contrasts in agroecological and socio-economic conditions between the two regions. Indeed, a given explanatory variable may have a significant effect on yields in the Guiriko region without producing the same impact in Nando, due to differences in production structures, farming practices, varietal diversity, or local environmental constraints.
To ensure comparability of estimates between the two regions, we nonetheless retained an identical set of explanatory variables in the regional models, even though their explanatory power may vary depending on the context. It is also important to emphasize that in the context of causal analyses based on instrumental variable approaches, the main objective is not to maximize the overall explanatory power of the model but to credibly identify the causal effect of adopting cassava mosaic management practices. Thus, despite a lower adjusted R2 in the Nando region, the estimates obtained remain informative and relevant from a causal inference perspective, provided that the identification conditions are satisfied.
The analysis of the results reported in Table 9 indicates that the adoption of management practices leads to a statistically significant increase in yield per hectare. Specifically, adopters experienced an average yield increase of 10.4% in the Guiriko area and 13.3% in the Nando region, relative to the counterfactual scenario of non-adoption. These effects were statistically significant at the 1% level. These findings are consistent with the estimates obtained from the LATE model, which also revealed a positive impact of adoption on agricultural yield, although the magnitude of the estimated effect was larger in that model. The convergence of results across these two methodological approaches, one based on an instrumental variable framework and the other relying on a doubly robust weighted estimator, strengthens the credibility and robustness of the conclusions regarding the positive effect of adopting management practices on agricultural productivity.
With a view to verifying the marginal effects of practices taken individually, Table A3 and Table A4 in the Appendix present complementary estimates of the effects of the practices considered separately. The results indicate that adopting improved varieties in the Nando region was associated with a 37% increase in yield, while the use of plant protection products increased yield by 19% in the Guiriko region. Although significant, these individual effects remained smaller than those observed for integrated adoption, empirically confirming that implementing the practices jointly generates greater productivity gains than adopting them individually.

4. Discussion

The adoption of innovative cassava mosaic disease (CMD) management practices had a positive and statistically significant effect on cassava yield at the 1% level, indicating that farmers who adopt these practices achieve substantially higher productivity than non-adopters. Because the empirical strategy explicitly accounts for selection bias through an instrumental variable approach, the observed yield gains can be credibly interpreted as causal effects attributable to the implementation of CMD management practices rather than to pre-existing differences between farmers. These results provide robust evidence that integrated phytosanitary management plays a decisive role in improving cassava productivity under smallholder conditions.
The magnitude of the estimated impact is consistent with previous empirical findings highlighting the productivity-enhancing effects of disease management strategies in agriculture. For instance, Mudare et al. [56] showed that crop rotation, commonly used to reduce pest and disease pressure, can increase yields, improve nutritional quality, and raise farm income by 14–27% compared with monocropping systems. Similarly, Bugingo et al. [57] reported that seed treatment against foliar diseases improved plant vigor, reduced morbidity, and ultimately led to higher harvest yields. Our results extend this literature by demonstrating that in cassava-based systems, the integrated adoption of CMD management practices yields substantial productivity gains, even in environments characterized by informal seed systems and high disease pressure.
Grower age exhibited a negative and statistically significant relationship with cassava yield. Although counterintuitive, this result may reflect the labor-intensive and technically demanding nature of cassava production and CMD management. Cassava is a long-cycle crop requiring repeated field inspections, the timely removal of infected plants, and careful handling of planting material. Older farmers may face physical constraints that limit their ability to implement these practices effectively. Moreover, younger farmers may be more receptive to new information and more willing to adopt and rigorously apply recommended practices. This finding contrasts with the positive age–productivity relationship reported by [49], suggesting that the role of age may be context-specific and mediated by the technical complexity of the production system.
Membership in cassava producers’ associations had a positive and significant effect on yield, underscoring the importance of social networks and collective action in enhancing farm performance. Farmer organizations facilitate access to information, peer learning, and extension services, thereby reducing information asymmetries related to disease management and input use. Through these networks, producers are more likely to learn about CMD symptoms, recommended control measures, and improved planting material. This result is consistent with earlier studies showing that participation in farmer organizations enhances technology adoption and productivity through improved access to knowledge and institutional support [51].
The use of chemical fertilizers also exerted a positive and significant impact on cassava yield. Many cassava-growing soils in sub-Saharan Africa are severely nutrient-depleted, which constrains root development and amplifies the negative effects of CMD infection. Fertilizer application helps restore soil fertility and improves plant vigor, enabling cassava plants to better withstand disease stress. This finding aligns with evidence from Central Africa indicating that low soil fertility, combined with suboptimal management practices, is a major driver of cassava yield losses [58]. Similarly, Bilong et al. [52] reported substantial increases in fresh tuber yield following fertilizer application in southern Cameroon, highlighting the complementarity between soil fertility management and disease control.
Finally, total household income had a positive and statistically significant effect on cassava productivity, reflecting the role of financial capacity in facilitating farm investment. In contexts where access to formal credit is limited, a higher household income enables farmers to self-finance the purchase of quality inputs, adopt improved practices, and access agricultural services. This result corroborates the findings of [54], who showed that wealthier households were more capable of investing in productivity-enhancing technologies. Income therefore acts not only as an outcome of agricultural performance, but also as a key enabling factor for the adoption and effective implementation of CMD management practices.
Although there are slight agroecological differences between regions of Burkina Faso, the positive impact of adopting CMD management practices on cassava yields can be generalized. Farms share similar characteristics, and farmers face common realities: they exchange cuttings and information, and encounter comparable challenges in accessing resistant planting material, inputs, and agricultural information services. Thus, despite some regional variations, the benefits of adopting these practices are likely to be observed in other regions.

5. Conclusions

This study demonstrates that the adoption of innovative cassava mosaic disease (CMD) management practices significantly increased cassava yields in the Guiriko and Nando regions of Burkina Faso. Farmers who simultaneously implemented regular field inspections, the preparation of clean planting material, and the use of resistant varieties achieved substantially higher productivity, with adoption effects statistically significant at the 1% level. However, while the adoption rate was higher in Guiriko, yield gains were considerably greater in Nando. This discrepancy may be explained by the higher initial CMD severity in Nando, diminishing marginal effects in areas where adoption began earlier, differences in agroecological conditions, and potentially greater adoption intensity among farmers in Nando. The results suggest that expanding and intensifying training programs specifically focused on cassava mosaic disease management, particularly in the Nando region, would help maximize the observed productivity gains. In addition, the role of producer associations should be strengthened as technical intermediaries for the dissemination of management practices and clean planting material. Finally, the joint adoption of practices and the adaptation of interventions to local agroecological conditions appear essential to enhance the effectiveness of CMD management strategies.
An important limitation of this study was the use of self-reported yields from farmers, which may contain errors or overestimations, introducing potential bias in estimating the impact of CMD management practices. Furthermore, the analysis relied on cross-sectional data, which reflect conditions at a single point in time and do not capture year-to-year variations or the dynamic effects of adopting these practices. These limitations should be considered when interpreting the results. Nevertheless, despite these constraints, the observed trends remained consistent and provide reliable insights into the effectiveness of the practices adopted. Future research should investigate the long-term economic impacts of adoption and assess the scalability of these practices in other cassava-producing regions.

Author Contributions

Conceptualization, A.O., E.S.-C. and N.T.; Methodology, A.O. and N.T.; Software, A.O.; Validation, N.T. and F.T.; Formal Analysis, A.O.; Investigation, A.O.; Resources, F.T. and J.S.P.; Data Curation, A.O. and S.S.; Writing Original Draft Preparation, A.O.; Writing Review and Editing, N.T. and A.S.; Visualization, N.T. and A.S.; Supervision, E.S.-C. and E.B.T.; Project Administration, F.T. and J.S.P.; Funding Acquisition, F.T. and J.S.P. All authors have read and agreed to the published version of the manuscript.

Funding

The authors declare that financial support was received for the research, authorship, and/or publication of this article. This study was funded by the European Union (EU) through the Biorisks project executed by the Regional Center of Excellence for Transboundary Plant Pathogens, Central and West African Virus Epidemiology (WAVE) and the Conseil Ouest et Centre Africain pour la Recherche et le Développement Agricoles (CORAF), grant number: CORAF No.: SC001_MC001_UE-WAVECRIS n°FOOD2019/411-531 and the Bill and Melinda Gates Foundation and the United Kingdom Foreign, Commonwealth and Development Office (FCDO; INV-002969; grant no. OPP1212988) to the central and West African Virus Epidemiology (WAVE) Program for root and tuber crops, Université Félix Houphouët-Boigny (UFHB). Under the grant conditions of the Foundation, a Creative Commons Attribution 4.0 Generic License has already been assigned to the author-accepted manuscript version that might arise from this submission.

Institutional Review Board Statement

Not applicable.

Informed Consent Statement

Written and oral statement were obtained from all participants.

Data Availability Statement

The data presented in this study are not publicly available in order to ensure the protection of the participants, compliance with informed consent, and adherence to institutional data ownership regulations. However, the data may be made available upon request from the Institute of Environment and Agricultural Research (INERA), Ouagadougou BP 7047, Burkina Faso. For inquiries, please contact Dr. Eveline Sawadogo-Compaore at compeve@yahoo.fr or ouedraogoagnes6@gmail.com.

Acknowledgments

We would like to express our sincere thanks to everyone who supported us in producing this research document. We would particularly like to thank Sawadogo Boureima and Dèwanou Kant David Ahoya, Benin for their assistance in carrying out this research work.

Conflicts of Interest

The authors declare no conflicts of interest.

Appendix A

Table A1. Estimation of the determinants of the adoption of innovative cassava mosaic disease (CMD) management practices in the Guiriko region.
VariablesCoefficientsStd. Err.tP > |t|[95% Conf. Interval]Sig
Sex−0.4480.139−3.210.002−0.724   −0.173***
Ag−0.0680.068−1.000.319−0.202   0.066
Alphabet0.0080.0650.120.901−0.121   0.137
Exp−0.0290.102−0.290.775−0.231   0.172
Apassma−0.0460.097−0.480.632−0.238   0.145
Utilengch0.0160.0650.250.805−0.113   0.145
Accmarch−0.0100.020−0.520.604−0.050   0.029
Revglo0.1130.0392.860.0050.035   0.192***
Accformt0.5090.2182.330.0210.079   0.939**
Cons0.5010.1473.400.0010.211   0.792***
Mean dependent var0.527SD. dependent var0.500
F (17, 238)91.40Number of obs256
R-squared0.867Prob > F0.000
Adj R-squared0.857Root MSE0.188
*** p < 0.01, ** p < 0.05, indicates statistical significance at 1% and 5%, respectively.
Table A2. Estimation of the determinants of the adoption of innovative cassava mosaic disease (CMD) management practices in the Nando region.
VariablesCoefStd. Err.tP > |t|[95% Conf. Interval]Sig
Sex−0.0890.066−1.340.181−0.221   0.041
Ag0.3620.1512.400.0170.064   0.659**
Alphabet0.0070.0760.100.923−0.143   0.158
Exp0.0410.0580.700.485−0.074   0.156
Apassma0.0120.0730.170.864−0.131   0.157
Utilengch0.3010.1392.160.0320.026   0.577**
Accmarch−0.0600.058−1.030.306−0.175   0.055
Revglo−0.1120.029−3.740.000−0.171   −0.053***
Accformt0.9550.4552.100.0370.057   1.853**
Cons0.0440.1780.250.804−0.307   0.395
Mean dependent var0.450SD. dependent var0.498
F (17, 235)20.16Number of obs253
R-squared0.593Prob > F0.000
Adj R-squared0.563Root MSE0.329
*** p < 0.01, ** p < 0.05 indicates statistical significance at 1% and 5%, respectively.
Table A3. Impact of the adoption of improved varieties on yield in the Nando region.
VariablesCoefStd. Err.tP > |t|[95% Conf. Interval]Sig
Variet0.3740.0517.300.0000.273   0.475***
Sex0.0400.0460.870.386−0.050   0.131
Ag−0.2500.109−2.300.022−0.465   −0.035**
Alphabet0.0250.0520.490.627−0.078   0.129
Exp0.00030.0400.010.994−0.079   0.080
Apassma0.3260.0625.260.0000.204   0.448***
Utilengch0.0890.0691.290.199−0.047   0.225
Accmarch0.0520.0411.250.212−0.029   0.133
Revglo0.0240.0211.150.252−0.017   −0.067
Cons3.5880.13426.680.0003.323 3.853***
Wald test (1251)41.66- 0.000 ***
Mean dependent var (kg/ha)10,058.43SD. dependent var6631.55
F (9, 243)17.57Number of obs253
R-squared0.370Prob > F0.000
Adj R-squared0.347Root MSE0.288
*** p < 0.01, ** p < 0.05, indicates statistical significance at 1% and 5%, respectively.
Table A4. Impact of the adoption of plant protection products on cassava yield in Guiriko.
VariablesCoefStd. Err.tP > |t|[95% Conf. Interval]Sig
Phyto0.1930.0961.990.0480.002   0.384**
Sex−0.0310.090−0.340.732−0.210   0.147
Ag−0.0720.045−1.600.110−0.162   −0.016
Alphabet0.0320.0450.720.475−0.056   0.121
Exp0.1690.0354.810.0000.100   0.239***
Apassma0.0940.0362.600.0100.023   0.166**
Utilengch0.0810.0302.650.0090.020   0.142***
Accmarch0.0140.0121.100.274−0.011   0.039
Revglo0.0300.0142.150.0320.002   −0.058**
Cons3.6830.10235.790.0003.481   3.886***
Wald test (1252)29.80- 0.000 ***
Mean dependent var (kg/ha)8568.991SD. dependent var3949.128
F (9, 246)29.09Number of obs256
R-squared0.462Prob > F0.000
Adj R-squared0.442Root MSE0.178
*** p < 0.01, ** p < 0.05, indicates statistical significance at 1% and 5%, respectively.

References

  1. Vernier, P.; N’Zué, B.; Zakhia-Rozis, N. Le Manioc, Entre Culture Alimentaire et Filière Agro-Industrielle; Éditions Quae: Versailles, France, 2018; ISBN 978-2-7592-2708-2. [Google Scholar]
  2. Kouakou, J.; Nanga Nanga, S.; Plagne-Ismail, C.; Pali, A.M.; Ognakossan, K.E. Production et Transformation du Manioc; CTA: Versailles, France, 2015. [Google Scholar]
  3. Kouame, A.C.; Kreman, K.; Kouadio, K.E.; Bamba, L.; Kouadja, G.S. Effet de l’incorporation de la farine d’épluchures de manioc sur la composition physico-chimique et nutritionnelle des œufs de poule “ISA BROWN”. Rev. Nat. Technol. 2023, 15, 31–38. [Google Scholar]
  4. Chauhan, R.D.; Beyene, G.; Kalyaeva, M.; Fauquet, C.M.; Taylor, N. Improvements in Agrobacterium-Mediated Transformation of Cassava (Manihot Esculenta Crantz) for Large-Scale Production of Transgenic Plants. Plant Cell Tiss. Organ. Cult. 2015, 121, 591–603. [Google Scholar] [CrossRef]
  5. Guira, F.; Some, K.; Kabore, D.; Sawadogo-Lingani, H.; Traore, Y.; Savadogo, A. Origins, Production, and Utilization of Cassava in Burkina Faso, a Contribution of a Neglected Crop to Household Food Security. Food Sci. Nutr. 2017, 5, 415–423. [Google Scholar] [CrossRef] [PubMed]
  6. Dankwa, K.O.; Gimode, W.; Olasanmi, B. A Review of Global Cassava (Manihot Esculenta Crantz) Production Trends, Post-Harvest Physiological Deterioration (PPD) Challenge, and Control Strategies. Discov. Food 2025, 5, 307. [Google Scholar] [CrossRef]
  7. Howeler, R.; Lutaladio, N.; Thomas, G. Produire Plus Avec Moins: Le Manioc Guide Pour une Intensification Durable de la Production; FAO: Rome, Italy, 2013; ISBN 978-92-5-207641-4. [Google Scholar]
  8. FAOSTAT Statistique Sur Le Manioc Au Burkina Faso. 2024. Available online: https://www.fao.org/faostat/en/#data (accessed on 6 February 2026).
  9. Abalo, K.D.; Abotchi, T.; Kola, É. La Production Du Manioc Et Sa Valeur Sociale Et Economique Dans La Prefecture De Vo, Sud-Est Du Togo. Rev. Géographie Lab. Leïdi 2014, 12, 17. [Google Scholar]
  10. Njoroge, M.K.; Mutisya, D.L.; Miano, D.W.; Kilalo, D.C. Whitefly Species Efficiency in Transmitting Cassava Mosaic and Brown Streak Virus Diseases. Cogent Biol. 2017, 3, 1311499. [Google Scholar] [CrossRef]
  11. FAO. MALADIES DU MANIOC en AFRIQUE: Une Menace Majeure Pour La Sécurité Alimentaire; FAO: Rome, Italy, 2010. [Google Scholar]
  12. Adjéi, E.A.; Traoré, K.; Sawadogo/Compaoré, E.M.F.W.; Amoakon, W.J.-L.; Kouassi, N.K.; Kouassi, M.K.; Pita, J.S. Perception and Adoption by Cassava Farmers of the PlantVillage Nuru Application Disseminated in the Agricultural Environment of Côte d’Ivoire: A Case Study in the Departments of Dabou, Bouaké, and Man. Front. Agron. 2024, 6, 1433204. [Google Scholar] [CrossRef]
  13. Tiendrebeogo, F.; Lefeuvre, P.; Hoareau, M.; Traore, V.S.; Barro, N.; Reynaud, B.; Traoré, A.S.; Konaté, G.; Traoré, O.; Lett, J.-M. Occurrence of East African Cassava Mosaic Virus-Uganda (EACMV-UG) in Burkina Faso. Plant Pathol. 2009, 58, 783. [Google Scholar] [CrossRef]
  14. Tiendrébéogo, F.; Lefeuvre, P.; Hoareau, M.; Harimalala, M.A.; De Bruyn, A.; Villemot, J.; Traoré, V.S.; Konaté, G.; Traoré, A.S.; Barro, N.; et al. Evolution of African Cassava Mosaic Virus by Recombination between Bipartite and Monopartite Begomoviruses. Virol. J. 2012, 9, 67. [Google Scholar] [CrossRef]
  15. Soro, M.; Tiendrébéogo, F.; Pita, J.S.; Traoré, E.T.; Somé, K.; Tibiri, E.B.; Néya, J.B.; Mutuku, J.M.; Simporé, J.; Koné, D. Epidemiological Assessment of Cassava Mosaic Disease in Burkina Faso. Plant Pathol. 2021, 70, 2207–2216. [Google Scholar] [CrossRef]
  16. Delêtre, M.; Lett, J.-M.; Sulpice, R.; Spillane, C. Kinship Networks of Seed Exchange Shape Spatial Patterns of Plant Virus Diversity. Nat. Commun. 2021, 12, 4505. [Google Scholar] [CrossRef]
  17. Eni, A.O.; Efekemo, O.P.; Onile-ere, O.A.; Pita, J.S. South West and North Central Nigeria: Assessment of Cassava Mosaic Disease and Field Status of African cassava mosaic virus and East. African cassava mosaic virus. Ann. Appl. Biol. 2021, 178, 466–479. [Google Scholar] [CrossRef] [PubMed]
  18. Houngue, J.A.; Houédjissin, S.S.; Ahanhanzo, C.; Pita, J.S.; Houndénoukon, M.S.E.; Zandjanakou-Tachin, M. Cassava Mosaic Disease (CMD) in Benin: Incidence, Severity and Its Whitefly Abundance from Field Surveys in 2020. Crop Prot. 2022, 158, 106007. [Google Scholar] [CrossRef] [PubMed]
  19. Mouketou, A.; Koumba, A.A.; Gnacadja, C.; Zinga-Koumba, C.R.; Abessolo Meye, C.; Ovono, A.P.M.; Sevidzem, S.L.; Mintsa, R.; Lepengué, A.N.; Mavoungou, J.F. Cassava Mosaic Disease Incidence and Severity and Whitefly Vector Distribution in Gabon. Afr. Crop Sci. J. 2022, 30, 167–183. [Google Scholar] [CrossRef]
  20. Acheampong, P.P.; Addison, M.; Wongnaa, C.A. Assessment of Impact of Adoption of Improved Cassava Varieties on Yields in Ghana: An Endogenous Switching Approach. Cogent Econ. Financ. 2022, 10, 2008587. [Google Scholar] [CrossRef]
  21. Sawadogo, S.; Tiendrébéogo, F.; Tibiri, E.B.; Name, P.E.; Djigma, F.; Traoré, L.; Pita, J.S.; Eni, A.O. Cassava Mosaic Disease in Burkina Faso: Epidemiological Aspects and Disease Management Perspectives. Discov. Agric. 2025, 3, 197. [Google Scholar] [CrossRef]
  22. Nsiah Frimpong, B.; Oppong, A.; Prempeh, R.; Appiah-Kubi, Z.; Abrokwah, L.A.; Mochiah, M.B.; Lamptey, J.N.; Manu-Aduening, J.; Pita, J. Farmers’ Knowledge, Attitudes and Practices towards Management of Cassava Pests and Diseases in Forest Transition and Guinea Savannah Agro-Ecological Zones of Ghana. Gates Open Res. 2021, 4, 101. [Google Scholar] [CrossRef]
  23. Zhou, L.; Jiang, L. Impact of Integrated Agronomic Practices on Maize Yield and Nutrient Use Efficiency. Field Crop 2024, 7, 79–92. [Google Scholar]
  24. Bedasa, Y.; Gemechu, A.; Bedemo, A. Impact of Combined Climate-Smart Agriculture Practices on the Technical Efficiency and Efficiency Yield Gap in Ethiopia. Sci. Rep. 2025, 16, 1719. [Google Scholar] [CrossRef]
  25. Liang, X.; Yu, S.; Ju, Y.; Wang, Y.; Yin, D. Integrated Management Practices Foster Soil Health, Productivity, and Agroecosystem Resilience. Agronomy 2025, 15, 1816. [Google Scholar] [CrossRef]
  26. Westerberg, V. Agroecology Pays Off in Burkina Faso: New Study Shows 77% Yield Gains and Strong Financial Returns Despite Extremely Dry Conditions|FAO. Available online: https://www.fao.org/family-farming/detail/en/c/1754662/ (accessed on 31 January 2026).
  27. Yamane, T. Statistics: An Introductory Analysis; Harper & Row: New York, NY, USA, 1967. [Google Scholar]
  28. Gadiaga, D. Statistiques Appliquées, Inférence Statistique—Introduction de Modèles Linéaires à Une Équation. Available online: https://webusers.i3s.unice.fr/~deneire/statap.pdf (accessed on 2 August 2025).
  29. Romer, P.M. Increasing Returns and Long-Run Growth. J. Political Econ. 1986, 94, 1002–1037. [Google Scholar] [CrossRef]
  30. Romer, P.M. Capital, Labor, and Productivity. Brook. Pap. Econ. Act. Microecon. 1990, 1990, 337–367. [Google Scholar] [CrossRef]
  31. Lucas, R.E. On the Mechanics of Economic Development. J. Monet. Econ. 1988, 22, 3–42. [Google Scholar] [CrossRef]
  32. Solow, R.M.; Swan, T.W. ECONOMIC GROWTH and CAPITAL ACCUMULATION. Econ. Rec. 1956, 32, 334–361. [Google Scholar] [CrossRef]
  33. Heckman, J. Instrumental Variables: A Study of Implicit Behavioral Assumptions Used in Making Program Evaluations. J. Human. Resour. 1997, 32, 441–462. [Google Scholar] [CrossRef]
  34. Imbens, G.; Wooldridge, J. Recent Developments in the Econometrics of Program Evaluation; National Bureau of Economic Research: Cambridge, MA, USA, 2008; p. w14251. [Google Scholar]
  35. Rosenbaum, P.R.; Rubin, D.B. The Central Role of the Propensity Score in Observational Studies for Causal Effects. Biometrika 1983, 70, 41–55. [Google Scholar] [CrossRef]
  36. Diagne, A. Evaluation de l’impact: Synthèse Des Développements Méthodologiques Récents; ADRAO (Association pour le Développement de la Riziculture en Afrique de l’Ouest): Conakry, Guinea, 2003; p. 24. [Google Scholar]
  37. Diagne, A.; Demont, M. Taking a New Look at Empirical Models of Adoption: Average Treatment Effect Estimation of Adoption Rates and Their Determinants. Agric. Econ. 2007, 37, 201–210. [Google Scholar] [CrossRef]
  38. Rubin, D.B. Estimating Causal Effects of Treatments in Randomized and Nonrandomized Studies. J. Educ. Psychol. 1974, 66, 688–701. [Google Scholar] [CrossRef]
  39. Heckman, J.J. Building Bridges between Structural and Program Evaluation Approaches to Evaluating Policy. J. Econ. Lit. 2010, 48, 356–398. [Google Scholar] [CrossRef]
  40. Rosenbaum, P.R. Overt Bias in Observational Studies. In Observational Studies; Rosenbaum, P.R., Ed.; Springer: New York, NY, USA, 2002; pp. 71–104. ISBN 978-1-4757-3692-2. [Google Scholar]
  41. Abadie, A. Semiparametric Instrumental Variable Estimation of Treatment Response Models. J. Econom. 2003, 113, 231–263. [Google Scholar] [CrossRef]
  42. Olounlade, O.A.; Li, G.-C.; Kokoye, S.E.H.; Dossouhoui, F.V.; Akpa, K.A.A.; Anshiso, D.; Biaou, G. Impact of Participation in Contract Farming on Smallholder Farmers’ Income and Food Security in Rural Benin: PSM and LATE Parameter Combined. Sustainability 2020, 12, 901. [Google Scholar] [CrossRef]
  43. Imbens, G.W.; Angrist, J.D. Identification and Estimation of Local Average Treatment Effects. Econometrica 1994, 62, 467–475. [Google Scholar] [CrossRef]
  44. Angrist, J.D.; Imbens, G.W.; Rubin, D.B. Identification of Causal Effects Using Instrumental Variables. J. Am. Stat. Assoc. 1996, 91, 444–455. [Google Scholar] [CrossRef]
  45. Chikoti, P.C.; Mulenga, R.M.; Tembo, M.; Sseruwagi, P. Cassava Mosaic Disease: A Review of a Threat to Cassava Production in Zambia. J. Plant Pathol. 2019, 101, 467–477. [Google Scholar] [CrossRef]
  46. Basse, B.W.; Mbaye, S.; Diop, O. Impact Des Bonnes Pratiques Agricoles Sur Le Rendement Des Cultures d’anacarde (Noix de Cajou) Au Sénégal. STD 2022, 2, 1–15. [Google Scholar] [CrossRef]
  47. Baral, R.; Kafle, B.P.; Panday, D.; Shrestha, J.; Min, D. Adoption of Good Agricultural Practice to Increase Yield and Profit of Ginger Farming in Nepal. J. Hortic. Res. 2021, 29, 55–66. [Google Scholar] [CrossRef]
  48. Awotide, B.A.; Awoyemi, T.T.; Omonona, B.T.; Diagne, A. Impact of Improved Agricultural Technology Adoption on Sustainable Rice Productivity and Rural Farmers’ Welfare in Nigeria. In Inclusive Growth in Africa: Policies, Practice, and Lessons Learnt; Kayizzi-Mugerwa, S., Shimeles, A., Lusigi, A., Moummi, A., Eds.; Routledge: Abingdon, UK, 2016; pp. 216–237. Available online: https://www.taylorfrancis.com/chapters/edit/10.4324/9781315562179-21/impact-improved-agricultural-technology-adoption-sustainable-rice-productivity-rural-farmers-welfare-nigeria-bola-amoke-awotide-taiwo-timothy-awoyemi (accessed on 6 February 2026).
  49. Sidibe, A.K.; Bouare, A.; Kone, B.; Berti, F.; Lebailly, P. Facteurs Determinants de La Productivite Du Riz En Zone Office Du Niger Au Mali: Determining Factors of Rice Productivity in the Office of Niger (on) Area in Mali. Agron. Afr. 2022, 34, 117–129. [Google Scholar]
  50. Kouchélé, S.A.T.; Labiyi, I.A.; Yabi, J.A. Effet Des Sources de Financement Sur La Performance Économique Des Producteurs de Soja (Glycine max (L.) Merr.) Dans Le Pôle de Développement Agricole (PDA-4) Au Bénin. Rev. Afr. D’environnement D’agriculture 2023, 6, 56–66. [Google Scholar]
  51. Wossen, T.; Abdoulaye, T.; Alene, A.; Haile, M.G.; Feleke, S.; Olanrewaju, A.; Manyong, V. Impacts of Extension Access and Cooperative Membership on Technology Adoption and Household Welfare. J. Rural. Stud. 2017, 54, 223–233. [Google Scholar] [CrossRef]
  52. Bilong, E.G.; Abossolo-Angue, M.; Nanganoa, L.T.; Anaba, B.D.; Ajebesone, F.N.; Madong, B.À.; Bilong, P. Organic Manures and Inorganic Fertilizers Effects on Soil Properties and Economic Analysis under Cassava Cultivation in the Southern Cameroon. Sci. Rep. 2022, 12, 20598. [Google Scholar] [CrossRef]
  53. Pinstrup-Andersen, P.; Shimokawa, S. Infrastructures rurales et développement agricole. Rev. D’économie Du Développement 2007, 15, 55–90. [Google Scholar] [CrossRef]
  54. Sossou, C.; Lebailly, P.; Léonard, H.C. Essai de Typologie des Exploitations Agricoles Axées sur le Financement de la Production Agricole au Bénin; SFER: Paris, France, 2013. [Google Scholar]
  55. Johnston, R.; Jones, K.; Manley, D. Confounding and Collinearity in Regression Analysis: A Cautionary Tale and an Alternative Procedure, Illustrated by Studies of British Voting Behaviour. Qual. Quant. 2018, 52, 1957–1976. [Google Scholar] [CrossRef]
  56. Mudare, S.; Jing, J.; Makowski, D.; He, X.; Liang, Z.; Sims, Z.; Wanger, T.C.; Tilman, D.; Zhang, F.; Cong, W.-F. Crop Rotations Synergize Yield, Nutrition, and Revenue: A Meta-Analysis. Nat. Commun. 2025, 16, 9552. [Google Scholar] [CrossRef]
  57. Bugingo, C.; Ali, S.; Yabwalo, D.; Byamukama, E. Optimizing Fungicide Seed Treatments for Early Foliar Disease Management in Wheat Under Northern Great Plains Conditions. Agronomy 2025, 15, 291. [Google Scholar] [CrossRef]
  58. Kintché, K.; Hauser, S.; Mahungu, N.M.; Ndonda, A.; Lukombo, S.; Nhamo, N.; Uzokwe, V.N.E.; Yomeni, M.; Ngamitshara, J.; Ekoko, B.; et al. Cassava Yield Loss in Farmer Fields Was Mainly Caused by Low Soil Fertility and Suboptimal Management Practices in Two Provinces of the Democratic Republic of Congo. Eur. J. Agron. 2017, 89, 107–123. [Google Scholar] [CrossRef]
Figure 1. Maps showing the studied region.
Agriculture 16 00441 g001
Figure 2. Level of adoption of good CMD management practices.
Agriculture 16 00441 g002
Table 1. Breakdown of respondents.
RegionProvinceCommuneVillageNumber of Households Surveyed
GuirikoHouetBobo DioulassoBobo Dioulasso42
Panamasso46
Doufiguisso42
Kointou42
Santidougou42
Kimidougou42
NandoSissiliLéoLéo19
Nablaliassan19
Benaverou19
Onliassan18
SillySilly39
BiéhaBiéha20
Yalé21
ZiroCassouCassou37
SapouySapouy21
Thiaburo,21
Thiagao21
Total 511
Table 2. Typology of individuals according to their treatment compliance behavior.
A = 1|z = 1A = 0|z = 1
A = 1|z = 0Always takersDefiers
A = 0|z = 0CompliersNevers Takers
Table 3. Defining independent variables and their likely effect on yield cassava.
VariablesDefiningCodingLikely EffectReference
SexSex of respondent1 if male
0 if female
+/−[48]
AgAge of respondentNumber of years+[49]
AlphabetThe producer can read or write in at least one local language1 if yes
0 if not
+[49]
ExpExperience in cassava production1 if the farmer has more than 5 years of experience in cassava production
0 if not
+[50]
ApassmaMembership of cassava farmers’ association1 if yes
0 if no
+[51]
UtilengchUse of chemical fertilizer1 if yes
0 if no
+[52]
AccmarchDistance from cassava field to nearest marketKm[53]
RevgloTotal household income in previous yearFCFA+[54]
Table 4. Descriptive statistics of quantitative variables.
Good CMD Management Practices
Mean (Standard Error)
Guiriko RegionNando Region
Overall SampleAdopters (n = 135)Non-Adopters (n = 121)t-testAdopters
(n = 115)
Non-Adopters (n = 140)t-test
Ag44.06
(0.44)
41.97
(0.95)
43.43
(1.03)
0.30044.96
(0.77)
45.87
(0.74)
0.402
Accmarch14.34
(0.43)
12.07
(0.97)
11.68
(0.96)
0.77616.29
(0.73)
17.22
(0.63)
0.335
Revglo2,150,305
(94,391.7)
1,868,352
(119,064.3)
985,572.1
(91,513.37)
0.0002,352,789
(213,894)
3,262,525
(225,706)
0.004
cassava yield (kg/ha)9312.25
(243.32)
11,309.61
(247.26)
5511.27
(223.54)
0.00013,536.59
(745.41)
7201.36
(263.56)
0.000
Standard errors are presented in parentheses.
Table 5. Descriptive statistics of qualitative variables (%).
Good CMD Management Practices
Guiriko RegionNando Region
ModalitiesOverall SampleAdopters (n = 135)Non-Adopters
(n = 121)
Chi2Adopters (n = 115)Non-Adopters (n = 140)Chi2
SexMale87.2897.7799.170.36973.0478.570.303
Female12.722.230.8326.9621.43
AlphabetLiterate35.037.408.260.79930.4337.860.215
Non-literate64.9792.691.7469.5762.14
Exp>5 years40.5184.444.950.00045.22250.001
≤5 years59.4915.5695.0554.7875
AccformtTrained41.1094.812.470.00068.7000.000
Untrained58.905.1997.5331.30100
ApassmaMember62.8265.184.950.00093.91850.023
Not a member37.1834.8295.056.0915
UtilengchUsers21.6155.559.910.00017.542.160.000
No users78.3944.4590.0982.4697.84
Table 6. Durbin–Wu–Hausman test (DWH).
ResidCoefficientStd. Err.P > |t|
Accformt1102510.660
Cons−561790.753
Table 7. Estimation of the impact of adopting innovative cassava mosaic disease (CMD) management practices on yield in the Guiriko region.
VariablesCoefStd. Err.tP > |t|[95% Conf. Interval]Sig
pragestCMD0.2950.0426.960.0000.212 0.379***
Sex0.0420.0800.530.599−0.115 0.200
Ag−0.0090.038−0.240.811−0.084 0.066
Alphabet−0.0010.036−0.030.979−0.073 0.071
Exp−0.0010.040−0.050.961−0.081 0.077
Apassma0.0670.0312.120.0350.004 0.130**
Utilengch0.0750.0272.800.0050.022 0.128***
Accmarch0.0090.0110.860.389−0.012 0.031
Revglo0.0230.0121.890.060−0.001 0.047*
Cons3.6060.08840.680.0003.431 3.780***
Wald test (1252)11.59 0.000 ***
Mean dependent var (kg/ha)8568.991SD dependent var3949.128
F (9246)64.86Number of obs256
R-squared0.587Prob > F0.000
Adj R-squared0.572Root MSE0.156
*** p < 0.01, ** p < 0.05, * p < 0.1 indicates statistical significance at 1%, 5%, and 10%, respectively.
Table 8. Estimation of the impact of adopting innovative cassava mosaic disease (CMD) management practices on yield in the Nando region.
VariablesCoefStd. Err.tP > |t|[95% Conf. Interval]Sig
pragestCMD0.4140.0666.270.0000.284 0.544***
Sex0.0290.0530.550.583−0.076 0.135
Ag−0.3600.128−2.810.005−0.612 −0.107***
Alphabet0.0280.0610.460.643−0.092 0.150
Exp−0.0080.048−0.170.866−0.102 0.086
Apassma0.3340.0724.620.0000.192 0.477***
Utilengch0.1090.0791.370.171−0.047 0.266
Accmarch0.0560.0481.160.247−0.039 0.152
Revglo0.0580.0262.240.0260.007 0.110**
Cons3.6210.15623.110.0003.313 3.930***
Wald test (1251)122.961 0.000 ***
Mean dependent var (kg/ha)10,058.43SD. dependent var6631.55
F (9, 243)12.88Number of obs253
R-squared0.138Prob > F0.000
Adj R-squared0.116Root MSE0.337
*** p < 0.01, ** p < 0.05 indicates statistical significance at 1% and 5%, respectively.
Table 9. Results from the estimation using the IPWRA (inverse probability weighted regression adjustment) method.
Guiriko RegionNando Region
RendhectCoefStd. ErrP > |z|[95% Conf. Interval]CoefStd. ErrP > |z|[95% Conf. Interval]
ATET0.1040.0390.0080.026 0.1820.1330.0430.0020.047 0.219
Disclaimer/Publisher’s Note: The statements, opinions and data contained in all publications are solely those of the individual author(s) and contributor(s) and not of MDPI and/or the editor(s). MDPI and/or the editor(s) disclaim responsibility for any injury to people or property resulting from any ideas, methods, instructions or products referred to in the content.