1. Introduction
Sugarcane is a major economic crop worldwide and plays a central role in sugar production and bioenergy development [
1]. It is widely cultivated in tropical and subtropical regions and represents one of the primary sources of global sugar supply. Consequently, the stability of sugarcane yield has a significant impact on global sugar markets and agricultural economic development. Key phenotypic traits of sugarcane plants, such as plant height, stalk diameter, and leaf area, are not only critical determinants of yield potential, disease resistance, and sugar accumulation capacity but also indispensable indicators in sugarcane breeding and cultivar selection processes [
2]. Therefore, the development of an efficient and accurate three-dimensional (3D) phenotyping system for sugarcane plants is of great scientific and practical significance for advancing precision breeding and industrial applications.
Compared with traditional two-dimensional representations, high-quality whole-plant 3D models are able to more comprehensively preserve the spatial architecture and organ topology of sugarcane plants. Such representations effectively alleviate observation loss caused by severe leaf occlusion and provide a reliable geometric basis for high-throughput phenotypic trait extraction [
3]. As a result, accurate reconstruction of sugarcane plant 3D structures constitutes a fundamental prerequisite for quantitative phenotyping and large-scale phenotypic analysis, especially for crops with complex architectures and dense canopy structures such as sugarcane.
However, for a long time, the quantification of key sugarcane phenotypic traits, such as plant height and leaf area, has predominantly relied on traditional manual measurement methods, which are generally inefficient, labor-intensive, and destructive in nature. For example, Gomes da Silva [
4] and Bellé [
5] estimated sugarcane leaf area using empirical formula-based approaches [
6], while Preet [
7] measured plant height using rulers and quantified leaf area with a CI-203 handheld leaf area meter (CID Bio-Science, Camas, WA, USA). These approaches are typically characterized by strong subjectivity, low efficiency, and limited reproducibility. More importantly, accurate leaf area measurement often requires destructive sampling, making it impossible to continuously monitor the growth and development of the same plant over time. As highlighted by Makraki et al. [
8], such practices also hinder the establishment of end-to-end phenotyping workflows that link image-based trait estimation with standardized ground-truth protocols and operational breeding decisions, such as large-scale screening and selection. Consequently, traditional methods suffer from inherent limitations in accuracy, efficiency, sustainability, and scalability, and fail to meet the increasing demand for non-contact, high-precision, and dynamic phenotyping in modern sugarcane breeding and precision agriculture.
Beyond algorithmic development, recent studies have emphasized that practical plant phenotyping requires end-to-end frameworks that explicitly connect image-based trait estimation with standardized ground-truth protocols, validation rigor, and realistic deployment constraints in breeding and screening scenarios [
8]. In this context, phenotyping systems should not only achieve high reconstruction accuracy but also support reproducible trait validation, non-destructive measurement, and operational feasibility for routine use in selection and decision-making processes.
In recent years, advances in computer vision and 3D reconstruction technologies have opened new avenues for plant phenotyping. Compared with two-dimensional methods, 3D reconstruction techniques exhibit significant advantages in capturing comprehensive and accurate plant structural information [
9]. Existing 3D reconstruction approaches can generally be categorized into active sensing and passive sensing methods. Active sensing technologies, such as light detection and ranging (LiDAR) [
10] and structured-light depth cameras [
11], offer high spatial resolution and measurement stability, and have been widely applied to the precise acquisition of plant canopy structure, plant height, and stem–leaf architecture. Representative applications include the use of handheld LiDAR systems for maize point cloud acquisition and instance segmentation [
12], unmanned aerial vehicle (UAV)-mounted LiDAR for large-scale crop height and canopy width estimation [
13], LiDAR-based extraction of tree branch topology for precision orchard management [
14], dual RGB-D (red–green–blue and depth) camera systems for accurate reconstruction of peanut plants [
15], and robotic platforms integrating multiple LiDAR sensors and cameras for field-scale reconstruction of sugar beet, soybean, and maize [
16]. Despite their advantages, active sensing devices are often costly and require complex data acquisition and processing pipelines, which limits their large-scale deployment in agricultural production.
On the other hand, passive sensing techniques represented by Structure-from-Motion (SfM) combined with Multi-View Stereo (MVS) [
17,
18] have also been extensively applied in plant phenotyping due to their cost-effectiveness and operational flexibility. For instance, He et al. [
19] reconstructed 3D soybean plant models using SfM-MVS and accurately measured plant height, projected leaf area, and leaf inclination angles. Choudhury et al. [
20] proposed the 3DPhenoMV method, which integrates voxel overlap consistency checks and point cloud clustering to achieve precise separation and phenotypic analysis of maize leaves and stems at later growth stages. However, these methods are highly dependent on image quality, illumination conditions, and surface texture [
21]. For crops with complex architectures and densely interlaced leaves, such as sugarcane, reconstruction accuracy can be severely degraded, leading to insufficient phenotypic data quality. Compared with other tall crops such as maize, sugarcane typically exhibits longer and more flexible leaves with severe self-occlusion, and the stalk–leaf structure is more tightly interwoven, which further increases the difficulty of feature matching and reliable 3D reconstruction.
Neural Radiance Fields (NeRF) [
22], as an emerging class of implicit 3D reconstruction methods, enable high-precision 3D structure recovery from multi-view 2D images and have demonstrated remarkable potential in fine-grained object reconstruction. Recently, NeRF-based approaches have also been introduced into plant phenotyping research. Arshad et al. [
23] evaluated multiple NeRF variants for maize reconstruction under indoor and outdoor conditions, demonstrating their capability to generate detailed and realistic plant models. Yang et al. [
21] developed PanicleNeRF for accurate and low-cost 3D reconstruction of rice panicles in field environments, while Saeed et al. [
24] proposed the PeanutNeRF pipeline for efficient peanut plant reconstruction and pod detection. Nevertheless, NeRF methods typically require long training times and substantial computational resources, and their performance is highly sensitive to image quality and viewpoint coverage [
25]. Achieving efficient and robust reconstruction for crops with complex and highly occluded structures, such as sugarcane, therefore remains challenging.
More recently, 3D Gaussian Splatting (3DGS) [
26] has been proposed as an efficient explicit scene representation method, enabling high-quality reconstruction and real-time rendering through Gaussian-based modeling. Preliminary studies have shown the potential of 3DGS in agricultural scenarios [
27]. However, systematic investigations of its application to plant 3D phenotyping, particularly for structurally complex crops such as sugarcane, are still limited.
In summary, although significant progress has been made in plant 3D reconstruction and phenotyping, there remains a lack of systematic and efficient methods for high-fidelity 3D phenotypic analysis of sugarcane plants with complex structures using consumer-grade, low-cost data acquisition devices. To address this gap, this study integrates 3D Gaussian Splatting (3DGS) with a YOLOv8x-seg [
28] instance segmentation model to construct a high-precision 3D reconstruction and phenotyping framework for potted sugarcane plants in a controlled environment. Specifically, instance segmentation is used to isolate the plant foreground and reduce background interference during reconstruction, while 3DGS provides an efficient explicit representation for high-fidelity modeling with substantially reduced training time compared with typical NeRF-based methods. Furthermore, a geometry-based point cloud scale calibration and coordinate alignment strategy is introduced to achieve accurate mapping from scale-ambiguous 3D reconstructions to real-world physical dimensions, which currently relies on the circular rim geometry of the pot and is therefore most suitable for potted plants.
The specific objectives of this study are to: (a) accurately extract sugarcane plant masks from 2D images; (b) achieve high-quality 3D reconstruction of sugarcane plants using 3DGS; and (c) estimate key phenotypic traits, such as plant height and leaf area, in a non-destructive manner (with leaf area extraction involving a semi-automatic workflow), to provide reliable quantitative support for sugarcane breeding decisions. Overall, this work represents an early attempt to combine recent 2D instance segmentation techniques with 3DGS for sugarcane phenotyping, demonstrating the feasibility of high-fidelity 3D reconstruction and trait quantification from smartphone-acquired images for precision breeding applications.
2. Materials and Methods
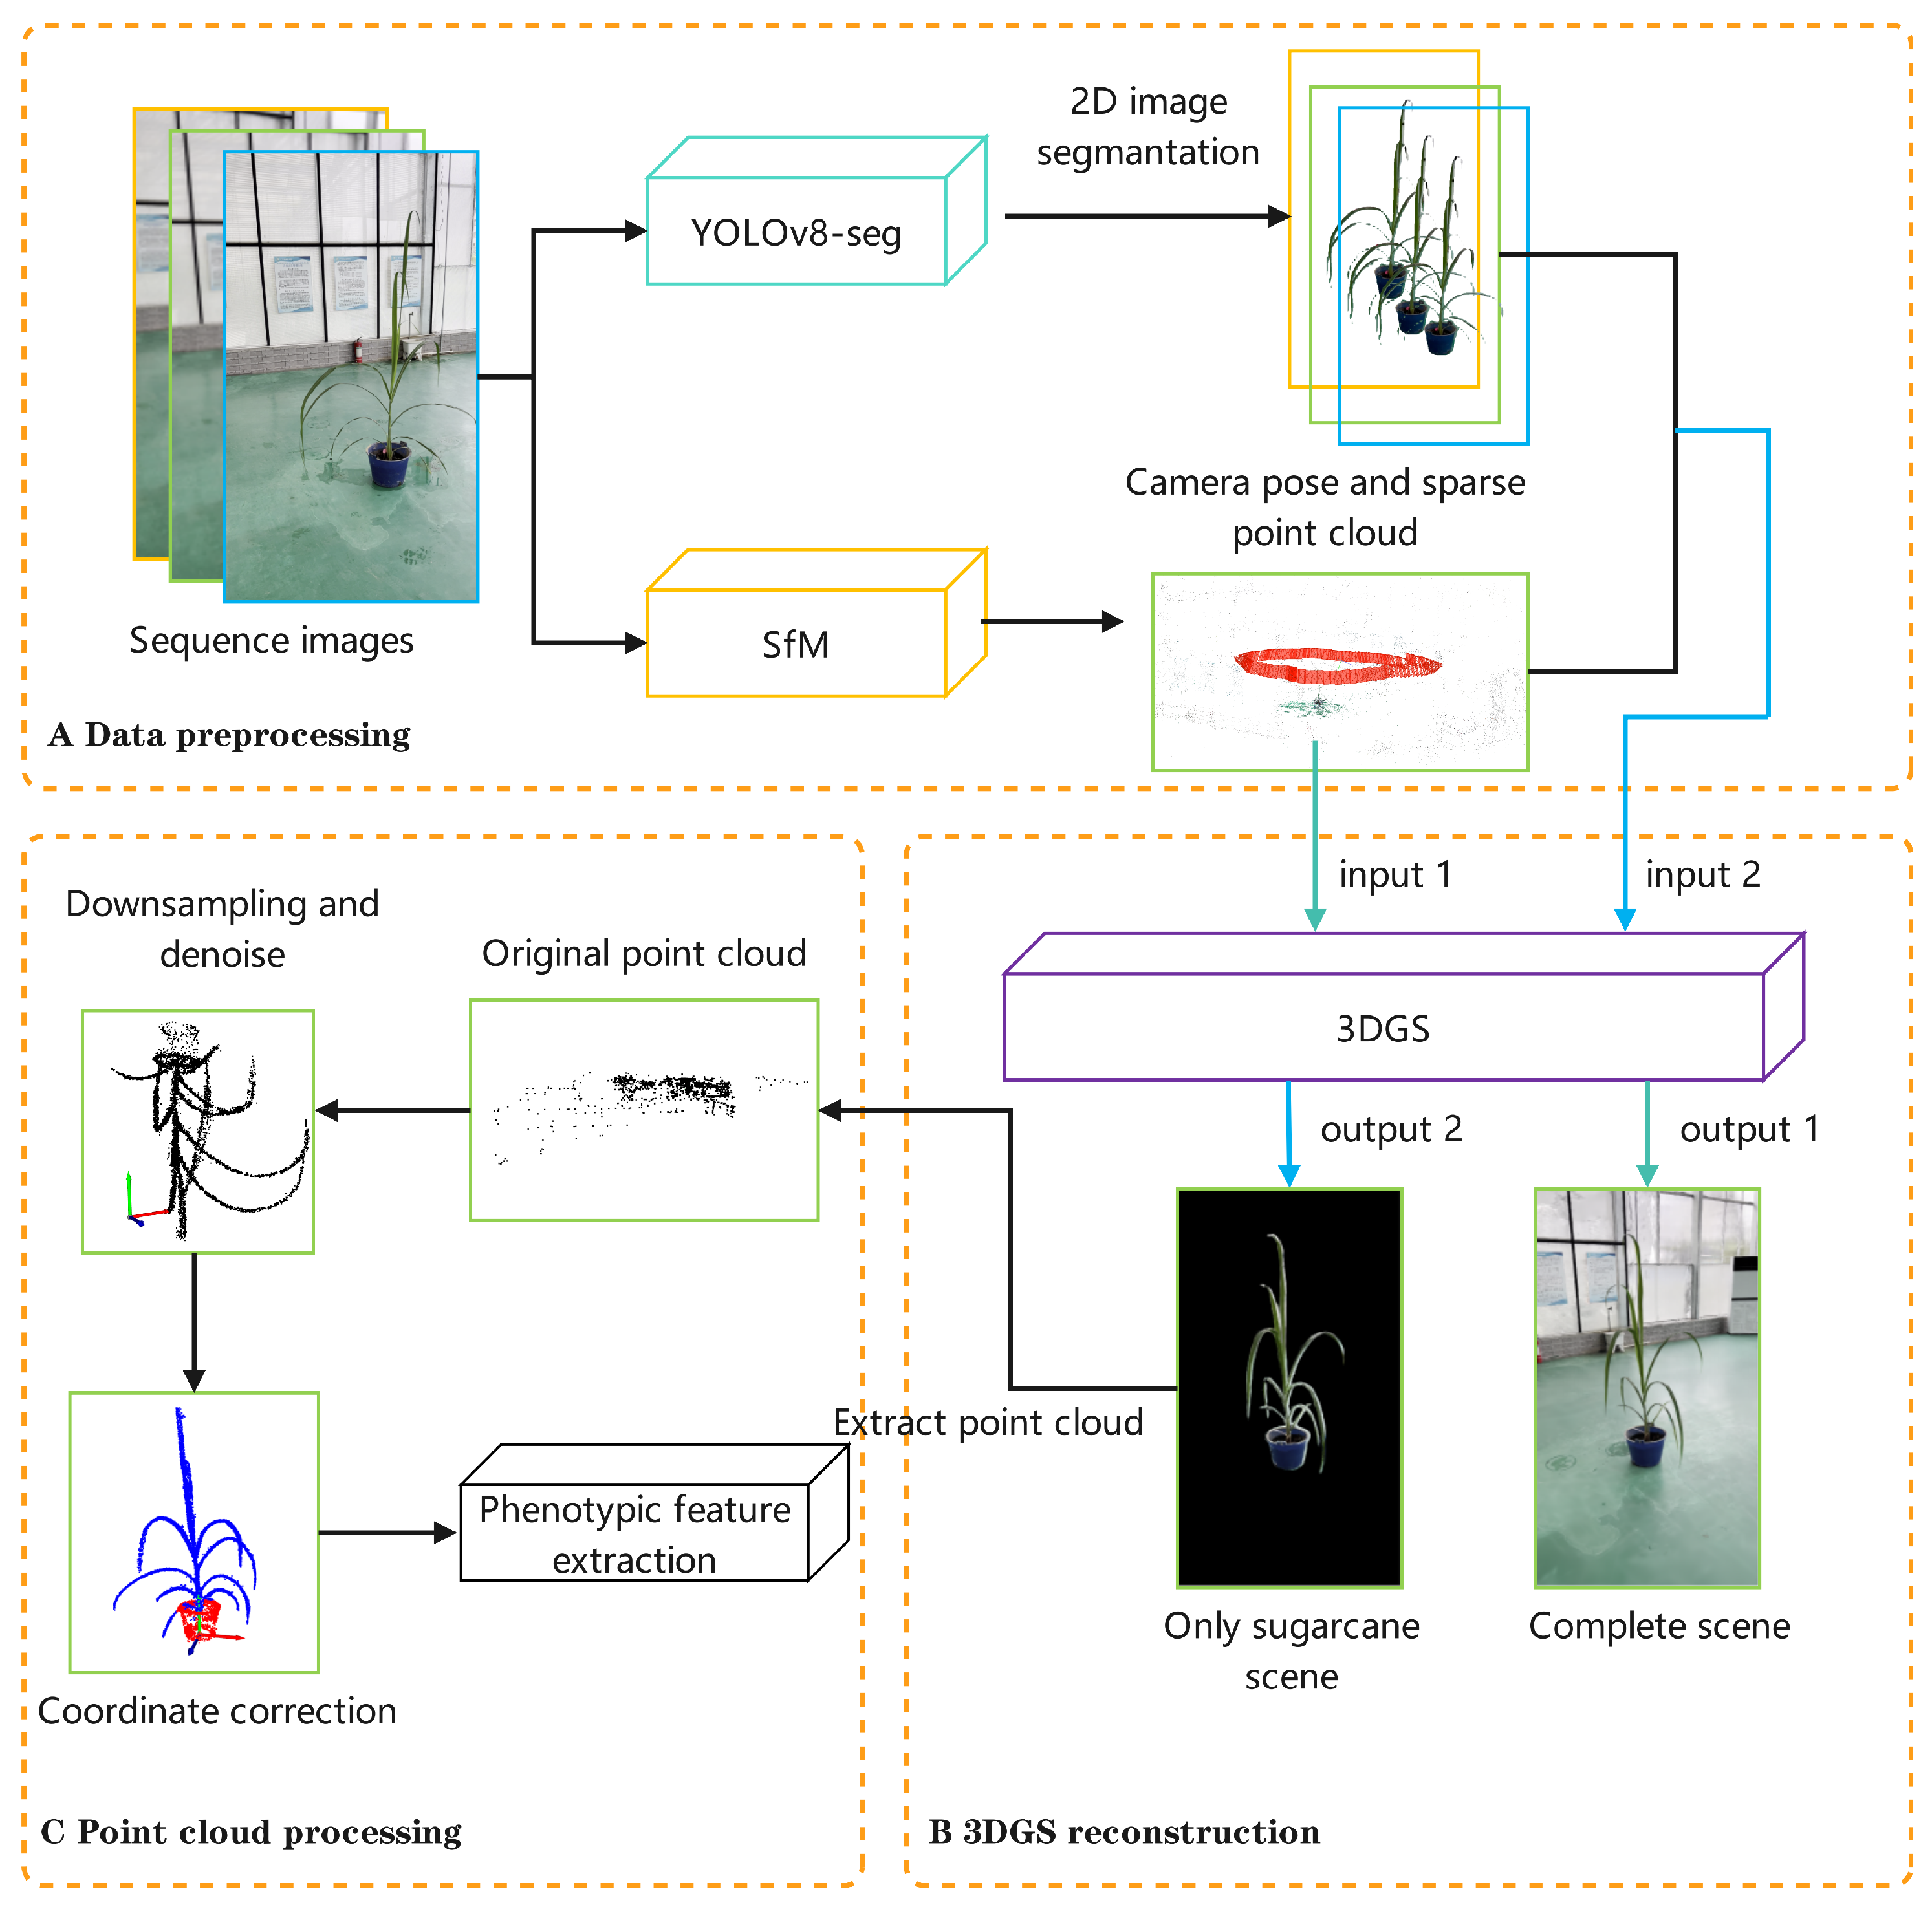
To evaluate the feasibility of 3D Gaussian Splatting (3DGS) for sugarcane three-dimensional reconstruction and non-destructive phenotypic measurement, we propose a comprehensive framework that integrates data acquisition, 3DGS-based reconstruction, and automated phenotypic trait estimation. The overall workflow of the proposed framework, including its major processing steps, is illustrated in
Figure 1.
2.1. Materials and Data Acquisition
The experimental materials were collected from a three-dimensional greenhouse at the Sugarcane Research Institute of the Guangxi Academy of Agricultural Sciences, China. The tested material was the widely cultivated sugarcane variety GT42. To evaluate the applicability of the proposed method at different growth stages, two batches of sugarcane plants were selected: Batch A with a growth period of 80 days and Batch B with a growth period of 60 days. In total, 45 sugarcane plants were included in the experiments, consisting of 30 plants in Batch A and 15 plants in Batch B. Each sugarcane plant was recorded only once at its corresponding growth stage.
At the time of data acquisition, Batch A plants exhibited heights ranging from approximately 127 to 192 cm (mean: 161.8 cm) with leaf numbers between 9 and 14 (mean: 11.67 leaves), whereas Batch B plants showed heights of approximately 120 to 171 cm (mean: 150.33 cm) and leaf numbers ranging from 8 to 12 (mean: 9.83 leaves). These differences reflect the distinct morphological characteristics associated with different growth stages. All samples were cultivated individually in pots filled with soil substrate. The planting pots were plastic truncated-cone containers with a height of approximately 24 cm, an upper diameter of about 20 cm, and a lower diameter of about 16 cm. During data acquisition, efforts were made to ensure that the entire planting pot was visible in the images, which facilitates subsequent scale calibration and coordinate alignment. Data from both batches were acquired under the same environmental conditions using an identical acquisition protocol and devices.
Image data were acquired using a smartphone in video mode. Specifically, an iPhone 13 Pro Max was used for data collection. Videos were recorded at a resolution of 1080p (approximately 1920 × 1080 pixels) with a frame rate of 30 FPS and stored in MP4 format. The wide-angle main camera was used for acquisition (equivalent focal length of 26 mm, aperture f/1.5), with optical image stabilization enabled. During recording, automatic exposure (AE) and automatic white balance (AWB) were locked to ensure imaging consistency, while ISO and shutter speed were not manually adjusted.
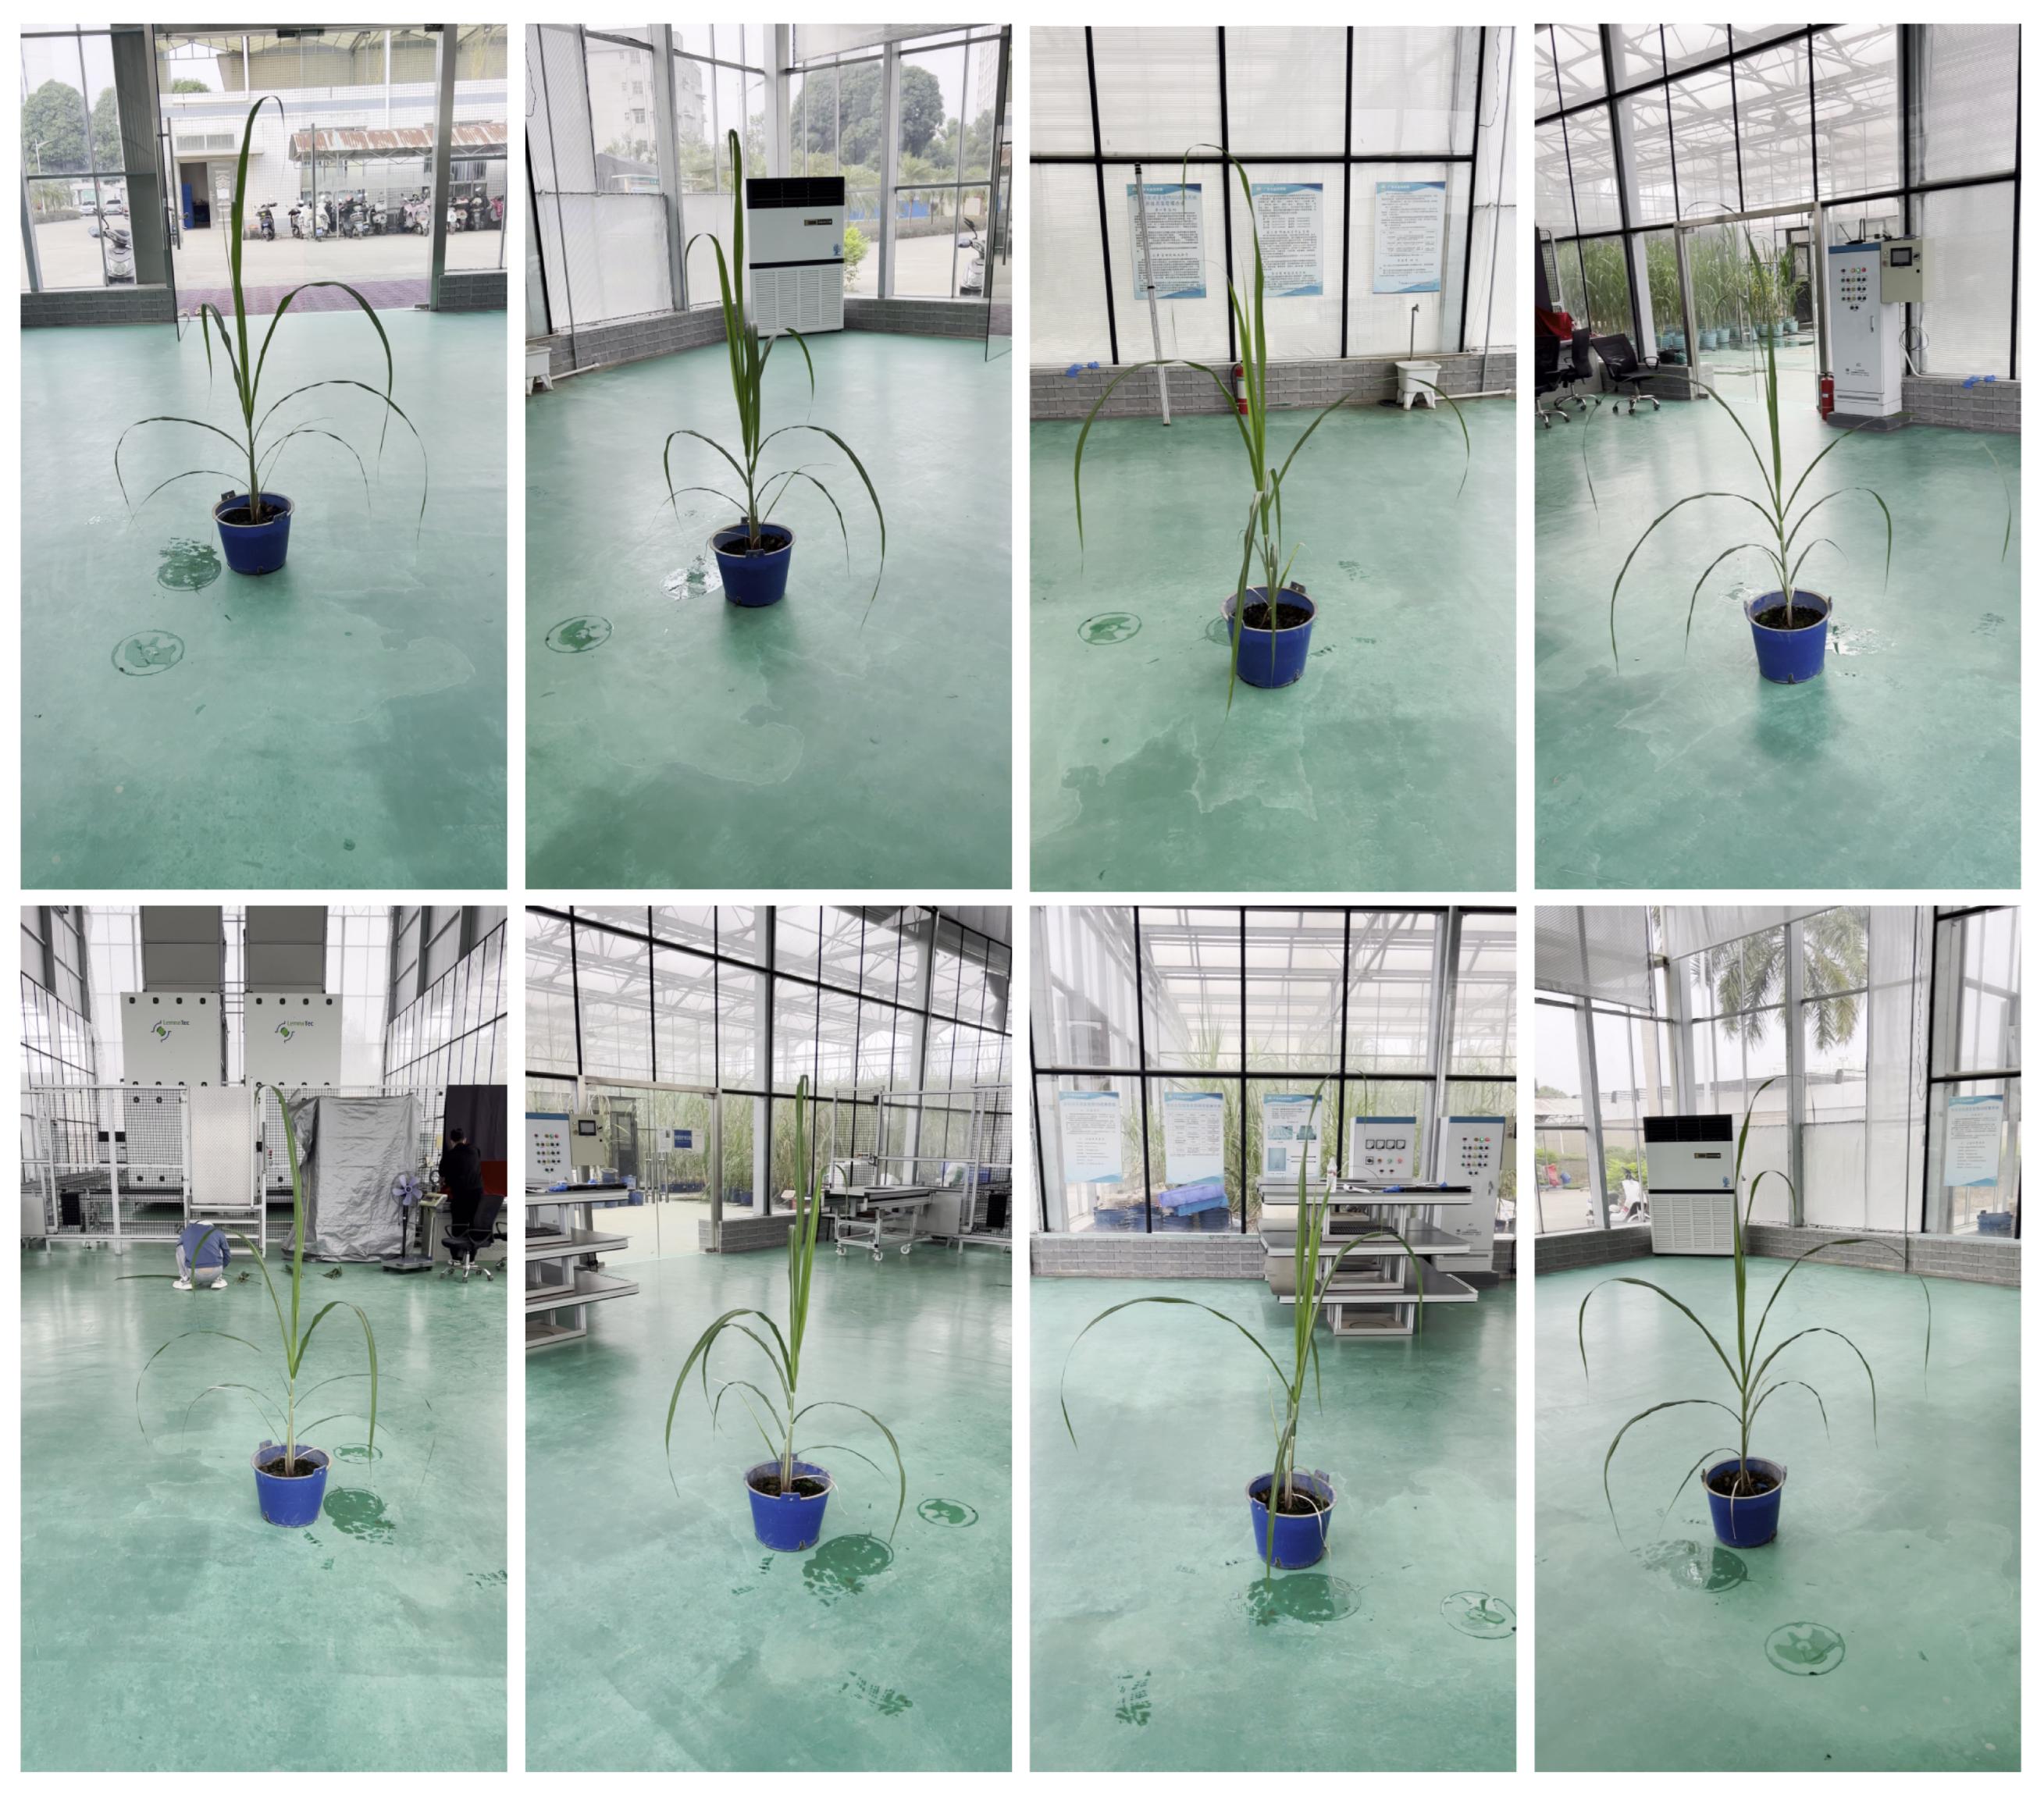
The camera was operated in a handheld manner and kept approximately horizontal, moving around the plant at a radius of about 70 cm with the stem center as the reference height, completing a full circular trajectory. The recording duration for each plant was controlled within 50–60 s. Each video sequence was subsequently processed using OpenCV to uniformly extract 120 frames at equal temporal intervals, which were then saved as PNG images for 3D reconstruction.
Data collection was conducted under diffuse lighting conditions inside the greenhouse to minimize strong reflections and specular highlights. The greenhouse environment was enclosed, with no direct sunlight and no natural wind, and image acquisition was performed during low-airflow periods to reduce leaf motion, temporal inconsistency, and motion blur.
Figure 2 illustrates the data acquisition setup and shows representative images of the same sugarcane plant captured from different viewpoints.
2.2. Data Preprocessing
2.2.1. Camera Pose Estimation Based on COLMAP Sparse Reconstruction
Sparse point clouds and accurate camera pose information are essential prerequisites for implementing 3DGS-based sugarcane reconstruction. After video acquisition, 120 images were uniformly sampled from each video sequence to construct the training dataset for scene reconstruction. Camera pose estimation was then performed using COLMAP, a widely used structure-from-motion (SfM) software for multi-view 3D reconstruction. COLMAP automatically extracts feature points from multi-view images and performs robust feature matching, enabling accurate recovery of camera extrinsic parameters (position and orientation) and intrinsic parameters (such as focal length and principal point offset) through sparse reconstruction. By applying this procedure, precise camera poses for all images were obtained within a unified coordinate system, providing a reliable geometric reference for subsequent 3D sugarcane point cloud reconstruction.
In the sparse reconstruction stage, an average of approximately 57,956 sparse points were reconstructed for each sugarcane scene, with a mean reprojection error of about 0.84 pixels, indicating stable feature matching and reliable camera pose estimation quality.
2.2.2. Two-Dimensional Instance Segmentation Based on YOLOv8x-Seg
To accurately remove background regions from the original two-dimensional (2D) images and generate precise sugarcane plant masks for improving 3D reconstruction quality, a YOLOv8x-seg model was employed for instance segmentation. YOLOv8, developed by Ultralytics, is a deep learning-based real-time object detection and classification framework that has been widely applied to object detection, image classification, and instance segmentation tasks. While the base YOLOv8 model focuses on object detection and outputs bounding boxes and class labels, the extended YOLOv8-seg version additionally predicts pixel-level segmentation masks for each detected instance, enabling fine-grained instance segmentation.
YOLOv8 provides multiple model scales to accommodate different performance requirements, including YOLOv8n, YOLOv8s, YOLOv8m, YOLOv8l, and YOLOv8x. Among them, YOLOv8x is the largest model in the YOLOv8 family and generally achieves superior accuracy in instance segmentation tasks, with top performance reported on the standard COCO benchmark. Therefore, the YOLOv8x-seg model was selected in this study for sugarcane plant instance segmentation.
For training the YOLOv8x-seg model, sugarcane images were annotated using the open-source labeling tool Labelme. Pixel-level masks of sugarcane plants were generated through polygon-based annotation to precisely delineate plant regions. Labelme is a widely used image annotation tool that supports both semantic and instance segmentation and allows exporting annotations in formats compatible with YOLOv8x-seg training. In total, 300 sugarcane images were manually annotated. These images were split into training (200 images), validation (50 images), and test (50 images) sets based on plant identity, ensuring that images of the same sugarcane plant only appeared in one subset to avoid data leakage caused by multi-view redundancy. All annotations were performed by a single experienced annotator to maintain labeling consistency; therefore, inter-annotator agreement analysis was not conducted.
To enhance model generalization, data augmentation techniques were applied only to the training set, expanding the training data from 200 to 1200 images. Five augmentation types were used, each generating 200 additional samples: brightness increase, brightness decrease, Gaussian blur, random rotation, and scale variation. Each augmented image was generated using only one transformation. For brightness adjustment, enhancement factors were randomly sampled in the range of 1.05–1.30, and darkening factors in the range of 0.70–0.95. Gaussian blur was applied with a standard deviation randomly sampled from 0.4 to 1.6. Random rotations were uniformly sampled within , using reflection padding to avoid boundary artifacts. Scale variation was performed with scaling factors randomly sampled from 0.80 to 1.25.
The YOLOv8x-seg model was trained for 500 epochs on the augmented training dataset, with an initial learning rate of 0.01, which was decayed to 0.001 using a cosine annealing schedule. The batch size was set to 24, and the AdamW optimizer was used for training. All training and inference processes were conducted on a workstation running Ubuntu 18.04, equipped with an Intel i9-10900K CPU (32 GB RAM) and an NVIDIA RTX 3090 GPU.
In terms of inference efficiency, segmentation of 120 images for a single sugarcane plant required approximately 2 min on the NVIDIA RTX 3090 GPU, corresponding to an average inference time of about 0.5 s per image. This runtime performance is further discussed in
Section 3.4.
2.3. 3D Sugarcane Reconstruction Based on 3DGS
In this study, sugarcane three-dimensional reconstruction is performed using multi-view two-dimensional PNG images, the sparse point cloud reconstructed by COLMAP, and the corresponding camera pose information. Based on these inputs, 3D Gaussian Splatting (3DGS) is employed to train and reconstruct the 3D structure of sugarcane plants, enabling an accurate transformation from multi-view 2D observations to a coherent 3D representation.
Unlike Neural Radiance Fields (NeRF), which adopt an implicit scene representation, 3DGS explicitly represents the target scene as a collection of three-dimensional Gaussian primitives. Each Gaussian is parameterized by a mean position
and a covariance matrix
, and its spatial contribution is defined as
where
denotes the Gaussian center and
describes its spatial extent.
In practice, the initial Gaussian means
are initialized from the sparse point cloud obtained via SfM. Specifically, each sparse point reconstructed by COLMAP is used to initialize one Gaussian primitive, with
set to the point position and the initial covariance
initialized as a small isotropic sphere. Each Gaussian is further parameterized by the following attributes: (a) center position
; (b) spherical harmonics (SH) coefficients
for representing view-dependent color; (c) a rotation parameter
expressed as a quaternion; (d) scale parameters
; and (e) an opacity value
. The covariance matrix
is constructed by combining rotation and scaling as
where
converts the unit quaternion
into a rotation matrix.
To optimize the Gaussian parameters, 3D Gaussians are projected onto the image plane through differentiable rendering. Under a local linear approximation of the perspective projection, the corresponding two-dimensional covariance matrix
is obtained as
where
denotes the Jacobian matrix of the projection function evaluated at the Gaussian mean.
The final pixel color is computed using front-to-back alpha compositing over all
N Gaussians contributing to the pixel:
where
represents the color of the
i-th Gaussian (evaluated from its SH coefficients), and
denotes its effective opacity contribution.
For implementation, the official 3D Gaussian Splatting framework (
https://github.com/graphdeco-inria/gaussian-splatting accessed on 26 March 2025) proposed by Kerbl et al. is adopted for Gaussian optimization. The initial number of Gaussians is determined by the number of sparse points reconstructed by COLMAP, with one Gaussian initialized per sparse point. All hyperparameters, including regularization terms, optimization settings, and training schedules (e.g., iteration numbers), follow the configurations and experimental protocols described in the original 3DGS implementation. In this study, a separate 3DGS model is trained for each sugarcane plant. Empirically, visually complete and geometrically consistent reconstructions can be achieved after approximately 7000 iterations, while extending training to 30,000 iterations further improves fine structural details and perceptual quality.
2.4. Phenotypic Trait Extraction
2.4.1. Point Cloud Preprocessing
The sugarcane point cloud reconstructed by 3DGS is typically large in scale and may contain noise introduced by camera accuracy, environmental conditions, and the acquisition process. In addition, the reconstructed point cloud is scale-ambiguous and may not be aligned with the real-world coordinate system. Therefore, prior to phenotypic trait extraction, the raw point cloud is subjected to downsampling, denoising, and coordinate/scale correction to ensure accuracy and efficiency.
- (1)
Point cloud downsampling and denoising.
First, a voxel grid filtering strategy is applied to uniformly downsample the raw point cloud. A regular voxel grid is constructed in 3D space, and the point closest to the voxel center is retained as the representative point. This step effectively reduces the number of points while preserving the overall geometric structure of the sugarcane plant.
Second, statistical outlier removal is employed to eliminate noise points. For each point, the mean Euclidean distance to its k nearest neighbors is computed. A global mean and standard deviation are then estimated from all neighborhood distances, and points whose neighborhood mean distance exceeds a predefined threshold are identified as outliers and removed. This operation improves point cloud quality while retaining fine structural details.
Finally, farthest point sampling (FPS) is used to further reduce redundancy and improve point distribution uniformity. FPS iteratively selects the point that is farthest from the existing sampled set, ensuring comprehensive geometric coverage with a reduced number of points. These steps collectively produce a clean and compact point cloud suitable for subsequent phenotypic analysis (see
Figure 1C).
- (2)
Coordinate and scale correction.
Since the reconstructed point cloud lacks an absolute physical scale and may exhibit orientation bias, accurate scale calibration and coordinate alignment are required. To this end, we exploit a geometric prior of the planting pot, which provides a regular shape with known physical dimensions. An automated correction method based on Random Sample Consensus (RANSAC) is proposed, where the pot is treated as an embedded spatial reference. By reconstructing the pot geometry from the point cloud, the scale factor and coordinate transformation can be reliably estimated. The procedure is summarized in Algorithm 1.
- (1)
Pot geometry fitting.
The pot geometry is modeled by fitting two circular rims corresponding to the pot bottom and top edges. The model consists of two circles
and
, denoted as
. Each circle is defined as
where
center represents the circle center,
radius denotes the circle radius, and
normal_vector indicates the circle normal. RANSAC is employed to robustly estimate these parameters from the raw point cloud, with a fixed iteration number of
N = 16,000, enabling reliable model fitting under noise and outlier conditions (e.g., sparse leaf points). Notably, the method does not require the two circles to be strictly parallel, which improves robustness to real-world scanning conditions.
- (2)
Scale calibration.
Let
be the vector connecting the centers of the two fitted circles, which defines the principal axis of the pot. The reconstructed pot height is computed as
Given the known physical height of the pot
(measured as 24 cm using a measuring tape), a global scale factor is obtained as
This scale factor is applied uniformly to the entire sugarcane point cloud to convert the reconstruction scale into real-world units.
- (3)
Coordinate system alignment.
To achieve a physically interpretable coordinate system, a new world coordinate frame is defined based on the fitted pot geometry. The origin is set at the center of the bottom circle
. The
Z-axis is defined as the normalized principal axis of the pot,
which is perpendicular to the pot bottom plane and points upward from the pot base toward the rim.
In contrast to approaches that explicitly enforce semantic orientations for the horizontal axes, the proposed method imposes constraints only on the vertical direction. The
X–
Y plane is implicitly defined as the orthogonal complement of the
Z-axis, ensuring that it is parallel to the pot bottom plane. Any orthonormal basis spanning this plane is acceptable, as subsequent phenotypic measurements depend solely on the vertical alignment. Accordingly, an orthonormal rotation matrix
is constructed by aligning the reconstructed
Z-axis with the real-world vertical direction, while the remaining axes are obtained through orthogonal completion. Together with the translation vector
and the scale factor
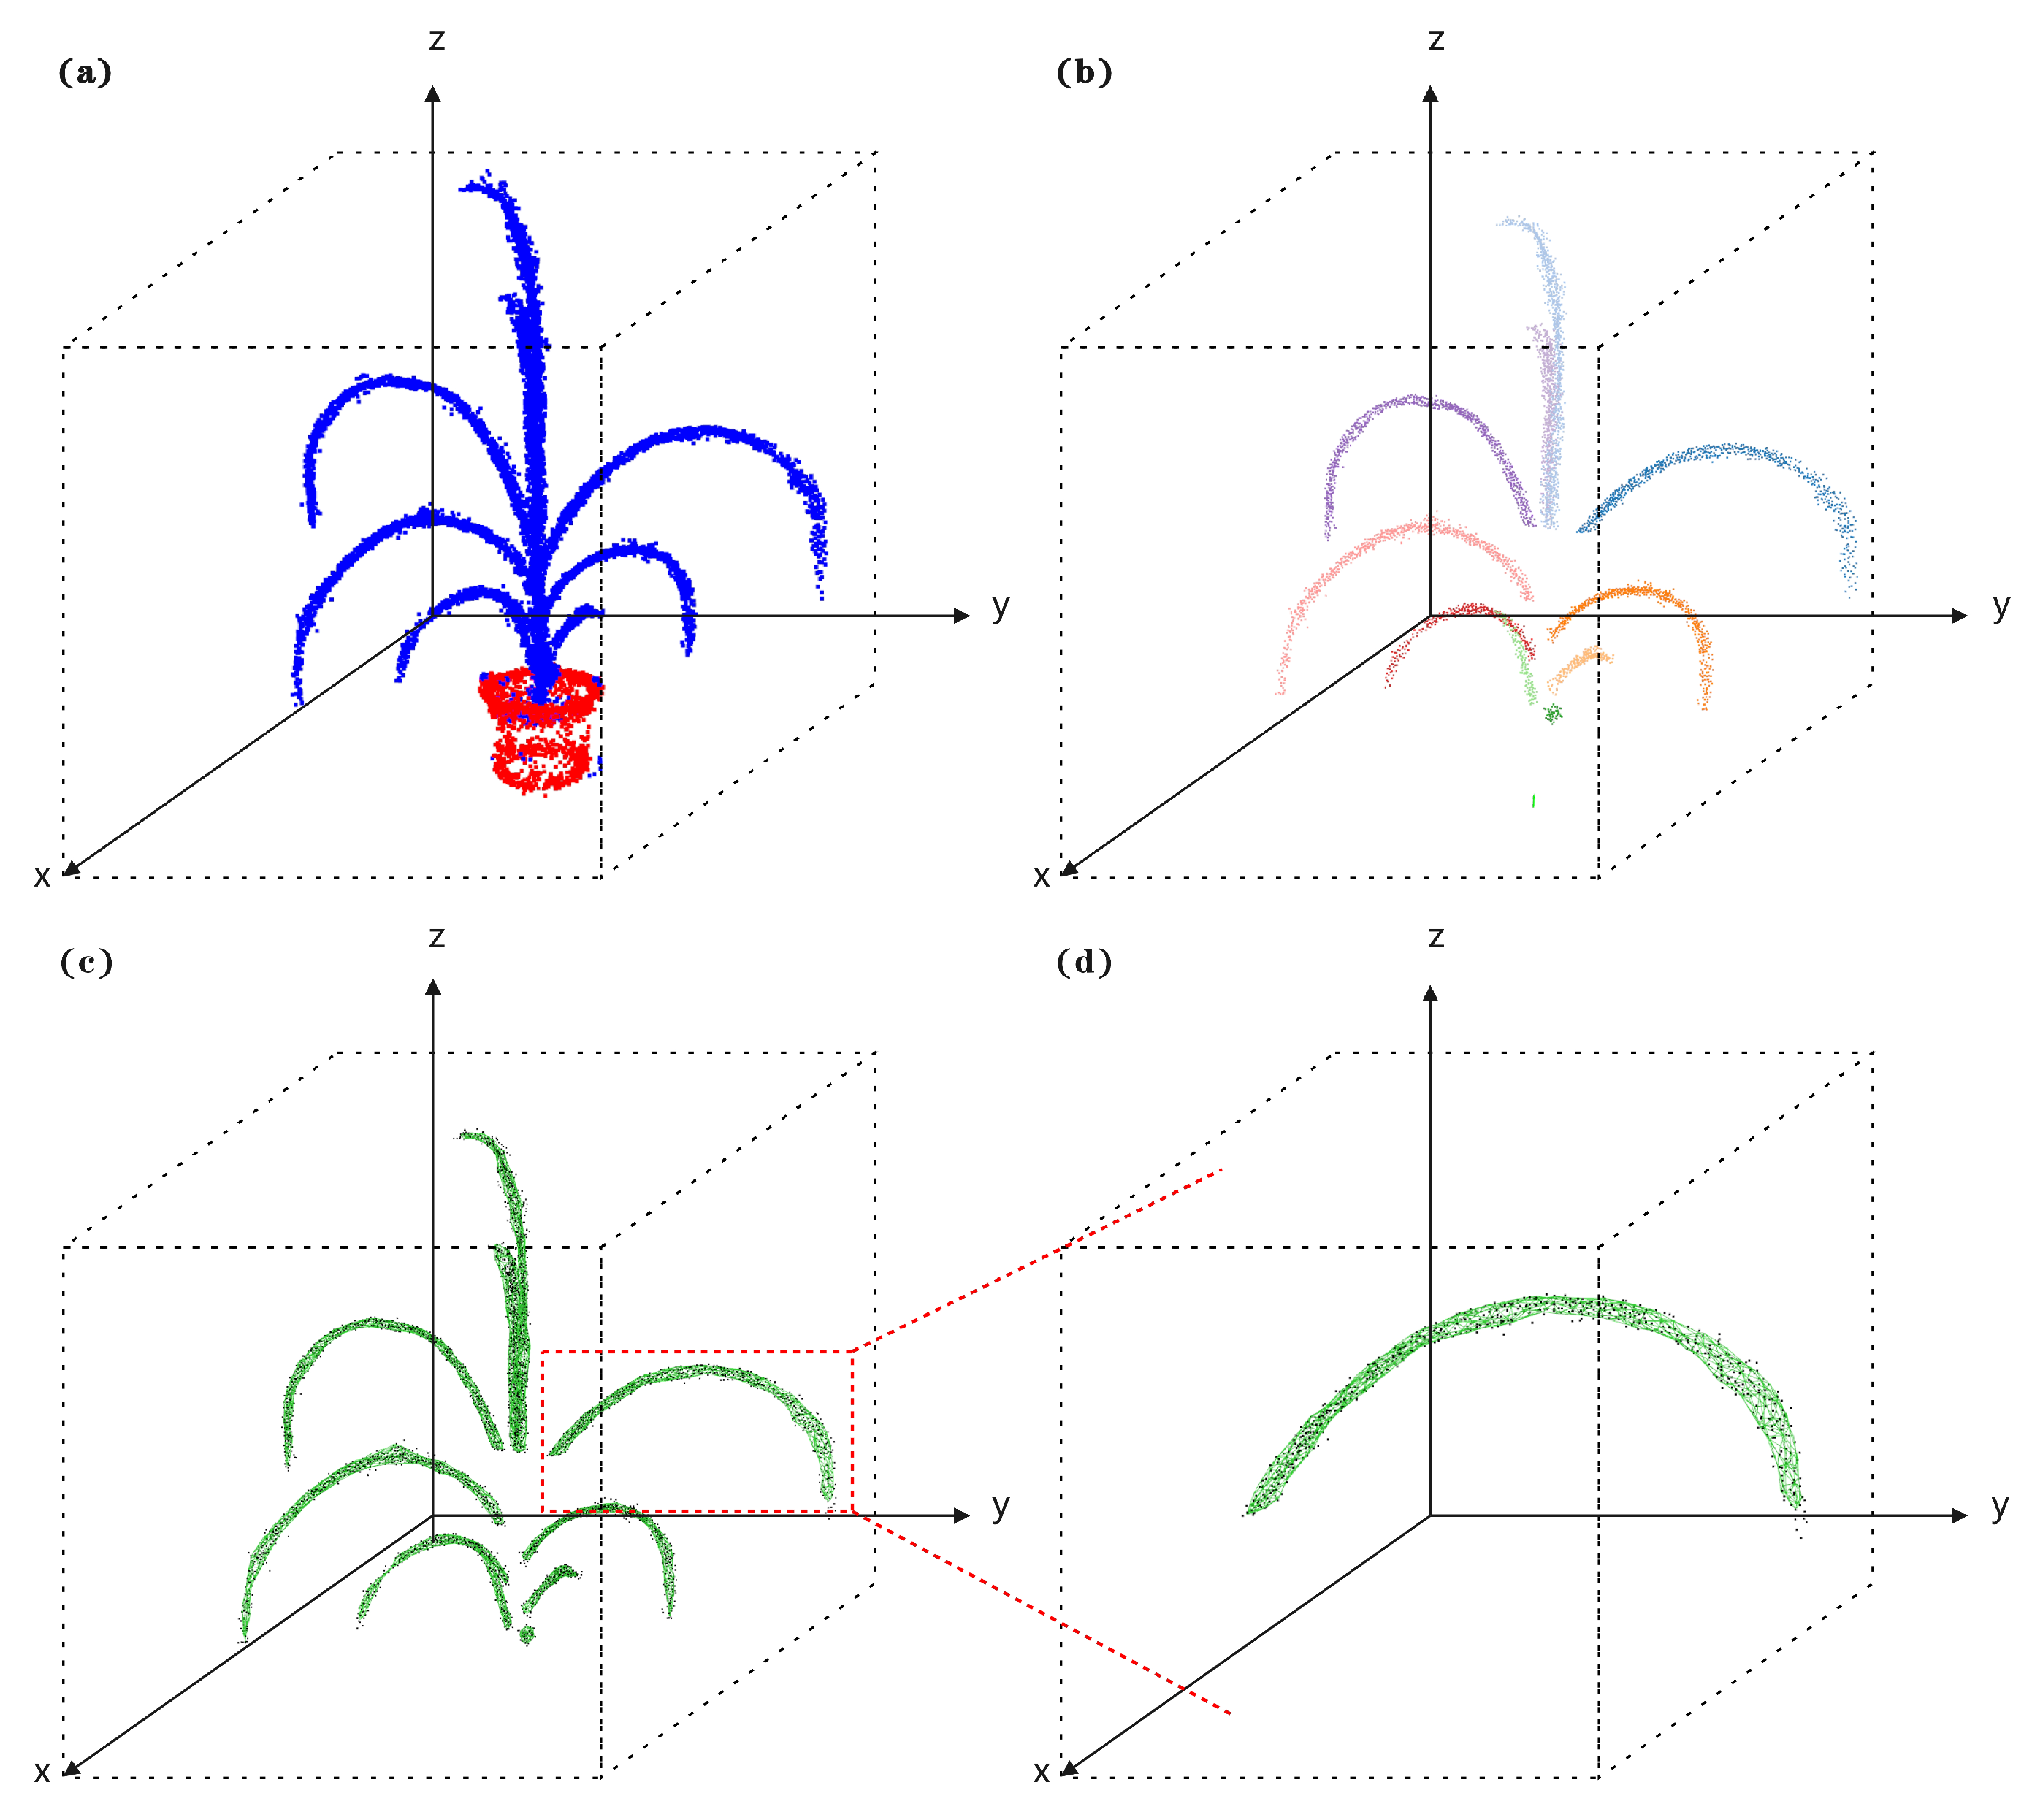
r, this transformation is applied to the entire point cloud to achieve coordinate and scale normalization. The alignment result is shown in
Figure 3a.
| Algorithm 1: Automatic point cloud correction algorithm based on dual-circle fitting |
| 1: | procedure AUTOCORRECTPOINTCLOUD▹Inputs: raw point cloud P, pot height , threshold θ, iterations N |
| 2: | |
| 3: | |
| 4: | |
| 5: | |
| 6: | |
| 7: | for to N do |
| 8: | |
| 9: | |
| 10: | |
| 11: | |
| 12: | if then |
| 13: | |
| 14: | |
| 15: | |
| 16: | end if |
| 17: | end for |
| 18: | |
| 19: | ▹ Step 2: compute scale factor |
| 20: | |
| 21: | ▹ Step 3: compute coordinate transform |
| 22: | ▹ No semantic constraint on X–Y; any orthonormal completion |
| 23: | |
| 24: | |
| 25: | |
| 26: | for each point p in do ▹ apply transform |
| 27: | |
| 28: | |
| 29: | end for |
| 30: | return |
| 31: | end procedure |
2.4.2. Computation of Sugarcane Phenotypic Traits
Based on the corrected sugarcane point cloud and the segmented skeleton representation, key phenotypic traits, including plant height and leaf area, are computed as follows.
- (1)
Plant height.
Plant height is defined as the vertical distance between the highest point of the sugarcane point cloud and the pot bottom plane. After coordinate correction, the pot bottom plane corresponds to
. The reconstructed plant height is computed as
where
and
denote the mean values of the highest and lowest percentile point sets along the
Z-axis, respectively, which improves robustness against outliers and isolated noise points. The real plant height is then obtained by applying the scale factor:
- (2)
Leaf area.
To quantify leaf surface area, individual leaves are manually segmented (see
Figure 3b) using a 3D point cloud processing software. All leaf segmentations were performed by a single operator. For each sugarcane plant, the manual leaf segmentation process required approximately 1–2 min. Operator-dependent variability was not quantitatively assessed in this study and is acknowledged as a limitation.For each leaf, Delaunay tetrahedralization is first performed to construct an initial volumetric mesh. An alpha-shape algorithm with parameter
is then applied to extract the surface triangular mesh (
Figure 3c,d). In this study, the parameter
is automatically selected within the range of 0.05–0.20 through a grid search strategy to balance surface completeness and noise suppression, and the value yielding the best mesh quality is adopted for leaf area computation. The area of a single triangular facet is computed as
where
are the vertices of the triangle. The total leaf area is obtained by summing the areas of all
N triangular facets:
2.5. Ground-Truth Phenotypic Measurements
To evaluate the accuracy of the proposed phenotypic estimation framework, ground-truth measurements of plant height and leaf area were independently obtained through manual measurements and destructive sampling.
2.5.1. Plant Height Measurement
The ground-truth plant height was measured using a telescopic measuring rod. The vertical distance from the ground level to the highest naturally occurring point of the plant canopy was recorded as the plant height. Measurements were conducted on the same day as image acquisition to ensure temporal consistency between image data and ground-truth values. For plants with curved or bending leaves, the vertical height of the highest point was recorded rather than the leaf length along its curvature, ensuring that the measured height corresponds to the vertical growth dimension used in the 3D reconstruction-based estimation.
2.5.2. Leaf Area Measurement
The ground-truth leaf area was obtained through destructive sampling. After image acquisition, selected sugarcane plants were harvested, and all leaves were carefully detached. Each leaf was flattened and scanned using a leaf area meter (LI-COR, Model LI-3000A; LI-COR Biosciences, Lincoln, NE, USA) to obtain accurate surface area measurements. The total leaf area per plant was computed as the sum of all individual leaf areas. Due to the destructive nature and labor intensity of this process, leaf area validation was conducted on a subset of the experimental plants.
2.6. Performance Metrics
To comprehensively evaluate the performance of the proposed method in 2D instance segmentation, 3D reconstruction, and phenotypic parameter estimation, multiple evaluation metrics are adopted from the perspectives of classification accuracy, reconstruction quality, and regression precision. The definitions of these metrics are described as follows.
2.6.1. Evaluation Metrics for 2D Instance Segmentation
For the 2D instance segmentation task, the performance of the YOLOv8x-seg model is evaluated using the F1-score and the mean Intersection over Union (Mean IoU). The Intersection over Union (IoU) measures the overlap between the predicted segmentation mask and the ground-truth mask, which is defined as
where
P denotes the predicted segmentation region and
G denotes the corresponding ground-truth region. The Mean IoU is computed as the average IoU over all test samples, reflecting the overall segmentation consistency of the model.
The F1-score is a harmonic mean of Precision and Recall, defined as
where Precision and Recall are given by
Here, , , and denote the numbers of true positive, false positive, and false negative pixels, respectively. The F1-score provides a robust measure of segmentation performance, especially under class-imbalanced conditions.
2.6.2. Evaluation Metrics for 3D Reconstruction Quality
To quantitatively assess the performance of different methods in sugarcane 3D reconstruction, three commonly used metrics are employed from the perspectives of pixel-level fidelity, structural consistency, and perceptual similarity: Peak Signal-to-Noise Ratio (PSNR), Structural Similarity Index Measure (SSIM), and Learned Perceptual Image Patch Similarity (LPIPS).
PSNR evaluates the pixel-wise difference between the reconstructed image and the reference image and is defined as
where
denotes the maximum possible pixel value of the image (for 8-bit images,
), and MSE is the mean squared error defined as
with
and
representing the pixel intensities of the reference image and the reconstructed image at the
i-th pixel, respectively. A higher PSNR value indicates lower pixel-level reconstruction error.
SSIM measures the similarity between two images from the perspectives of luminance, contrast, and structural information, and is more consistent with human visual perception. Given two images (or image patches)
x and
y, SSIM is defined as
where
and
are the mean intensities of images
x and
y,
and
are their variances, and
denotes the covariance between
x and
y. The constants
and
are used to stabilize the division and are defined as
where
L is the dynamic range of the pixel values (for 8-bit images,
), and the commonly used parameters are
and
. The SSIM value ranges from 0 to 1, with higher values indicating greater structural similarity.
LPIPS is a deep feature-based perceptual similarity metric that measures the distance between two images in the feature space of a pretrained convolutional neural network. Given two images
x and
y, LPIPS is defined as
where
denotes the feature map extracted from the
l-th layer of the pretrained network,
represents the channel-wise normalized feature map,
and
are the spatial dimensions of the feature map,
is a learned channel-wise weight vector, and ⊙ denotes element-wise multiplication. A lower LPIPS value indicates higher perceptual similarity.
2.6.3. Evaluation Metrics for Phenotypic Parameter Estimation
For the estimation of phenotypic traits such as plant height and leaf area, multiple regression metrics are employed to comprehensively evaluate estimation accuracy, including the coefficient of determination (), mean absolute error (MAE), mean absolute percentage error (MAPE), and root mean square error (RMSE).
The coefficient of determination
measures the proportion of variance in the ground-truth data explained by the estimated values and is defined as
where
and
denote the ground-truth value and the estimated value of the
i-th sample, respectively, and
is the mean of the ground-truth values. An
value closer to 1 indicates stronger estimation performance.
The MAE, MAPE, and RMSE quantify the absolute error magnitude, relative error proportion, and sensitivity to large errors, respectively, and are defined as
By jointly considering these metrics, the accuracy and robustness of the proposed method in sugarcane phenotypic parameter estimation can be comprehensively evaluated.
3. Results
3.1. Two-Dimensional Image Segmentation
Experimental results demonstrate that the customized YOLOv8x-seg model trained in this study exhibits excellent instance segmentation performance for sugarcane plants on an independent test set. The model achieves an average F1-score of 85.25% and a mean Intersection over Union (Mean IoU) of 74.45%, indicating high accuracy and robustness in sugarcane plant identification and segmentation tasks.
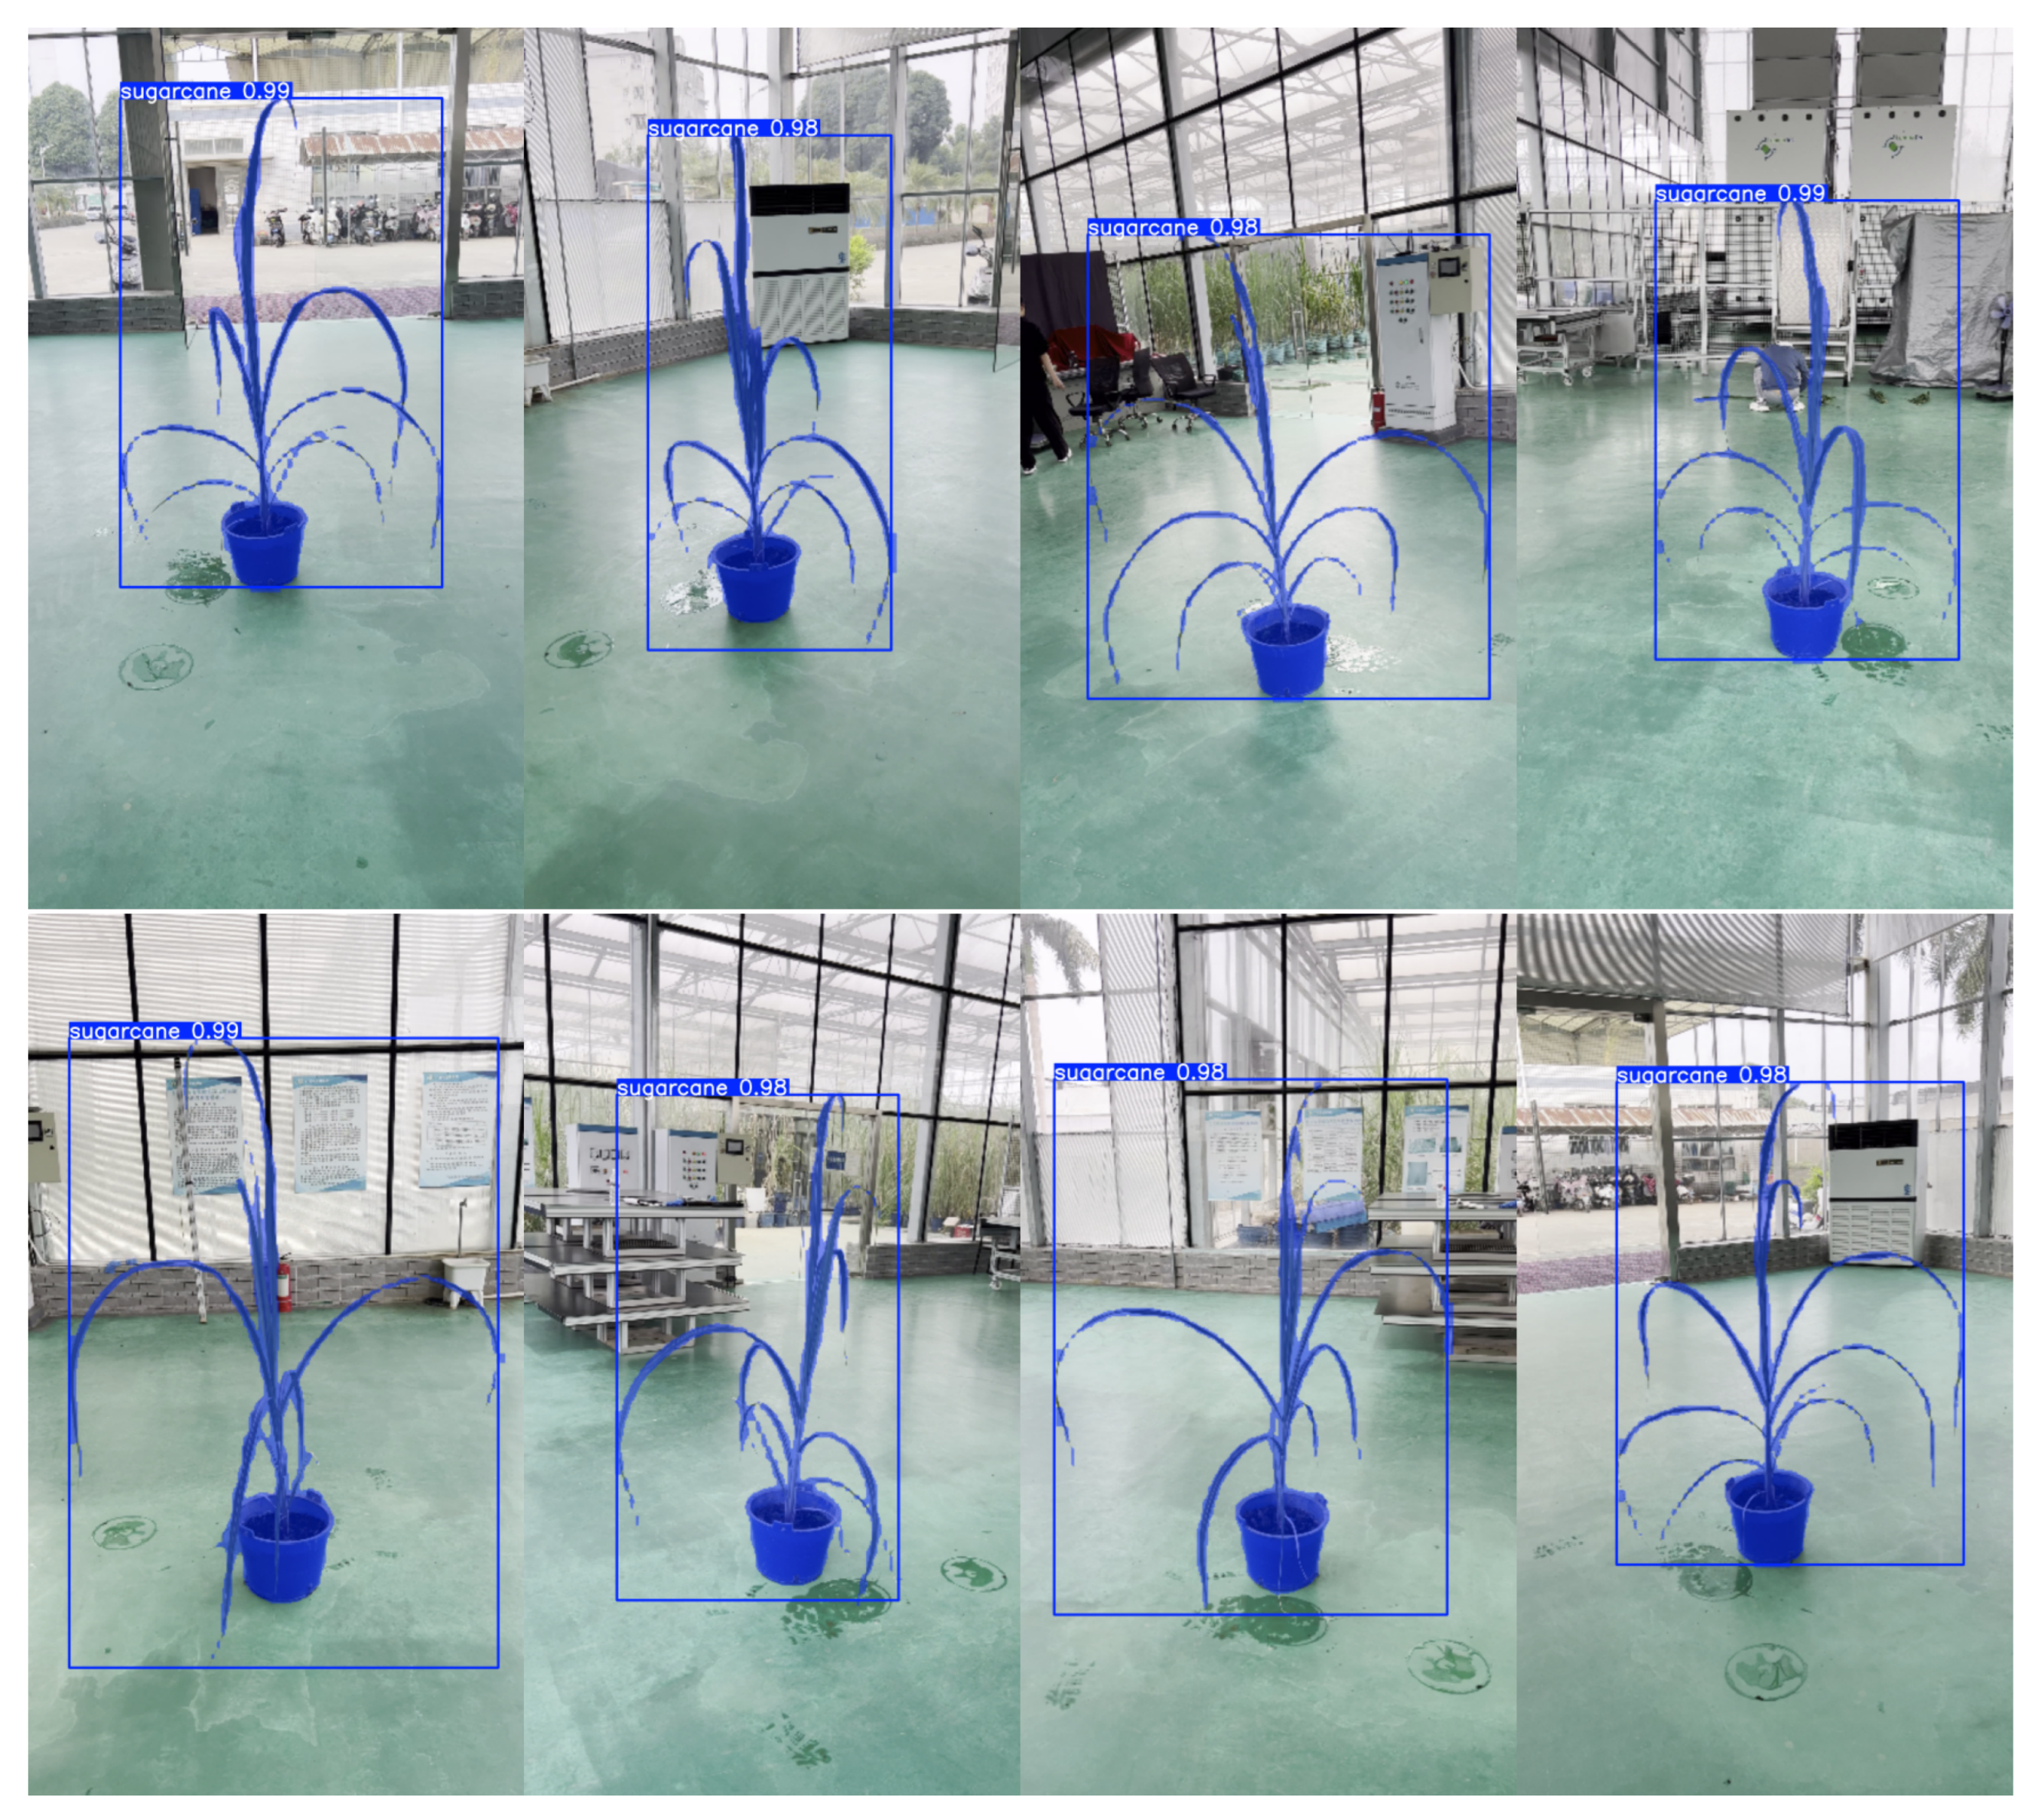
As shown in
Figure 4, the qualitative results clearly illustrate that the YOLOv8-seg model generates high-quality segmentation masks with sharp boundaries and coherent shapes, accurately capturing the morphological characteristics of sugarcane plants. Even in regions with leaf overlap and complex structural details, the model maintains stable segmentation performance and reliably delineates plant contours, demonstrating strong feature representation and generalization capabilities.
Overall, the YOLOv8-seg model performs consistently well across key evaluation metrics and is capable of accurately handling sugarcane instance segmentation under complex scene conditions, highlighting its high precision, robustness, and practical applicability within the proposed phenotyping pipeline.
3.2. Sugarcane 3D Reconstruction
Figure 5 and
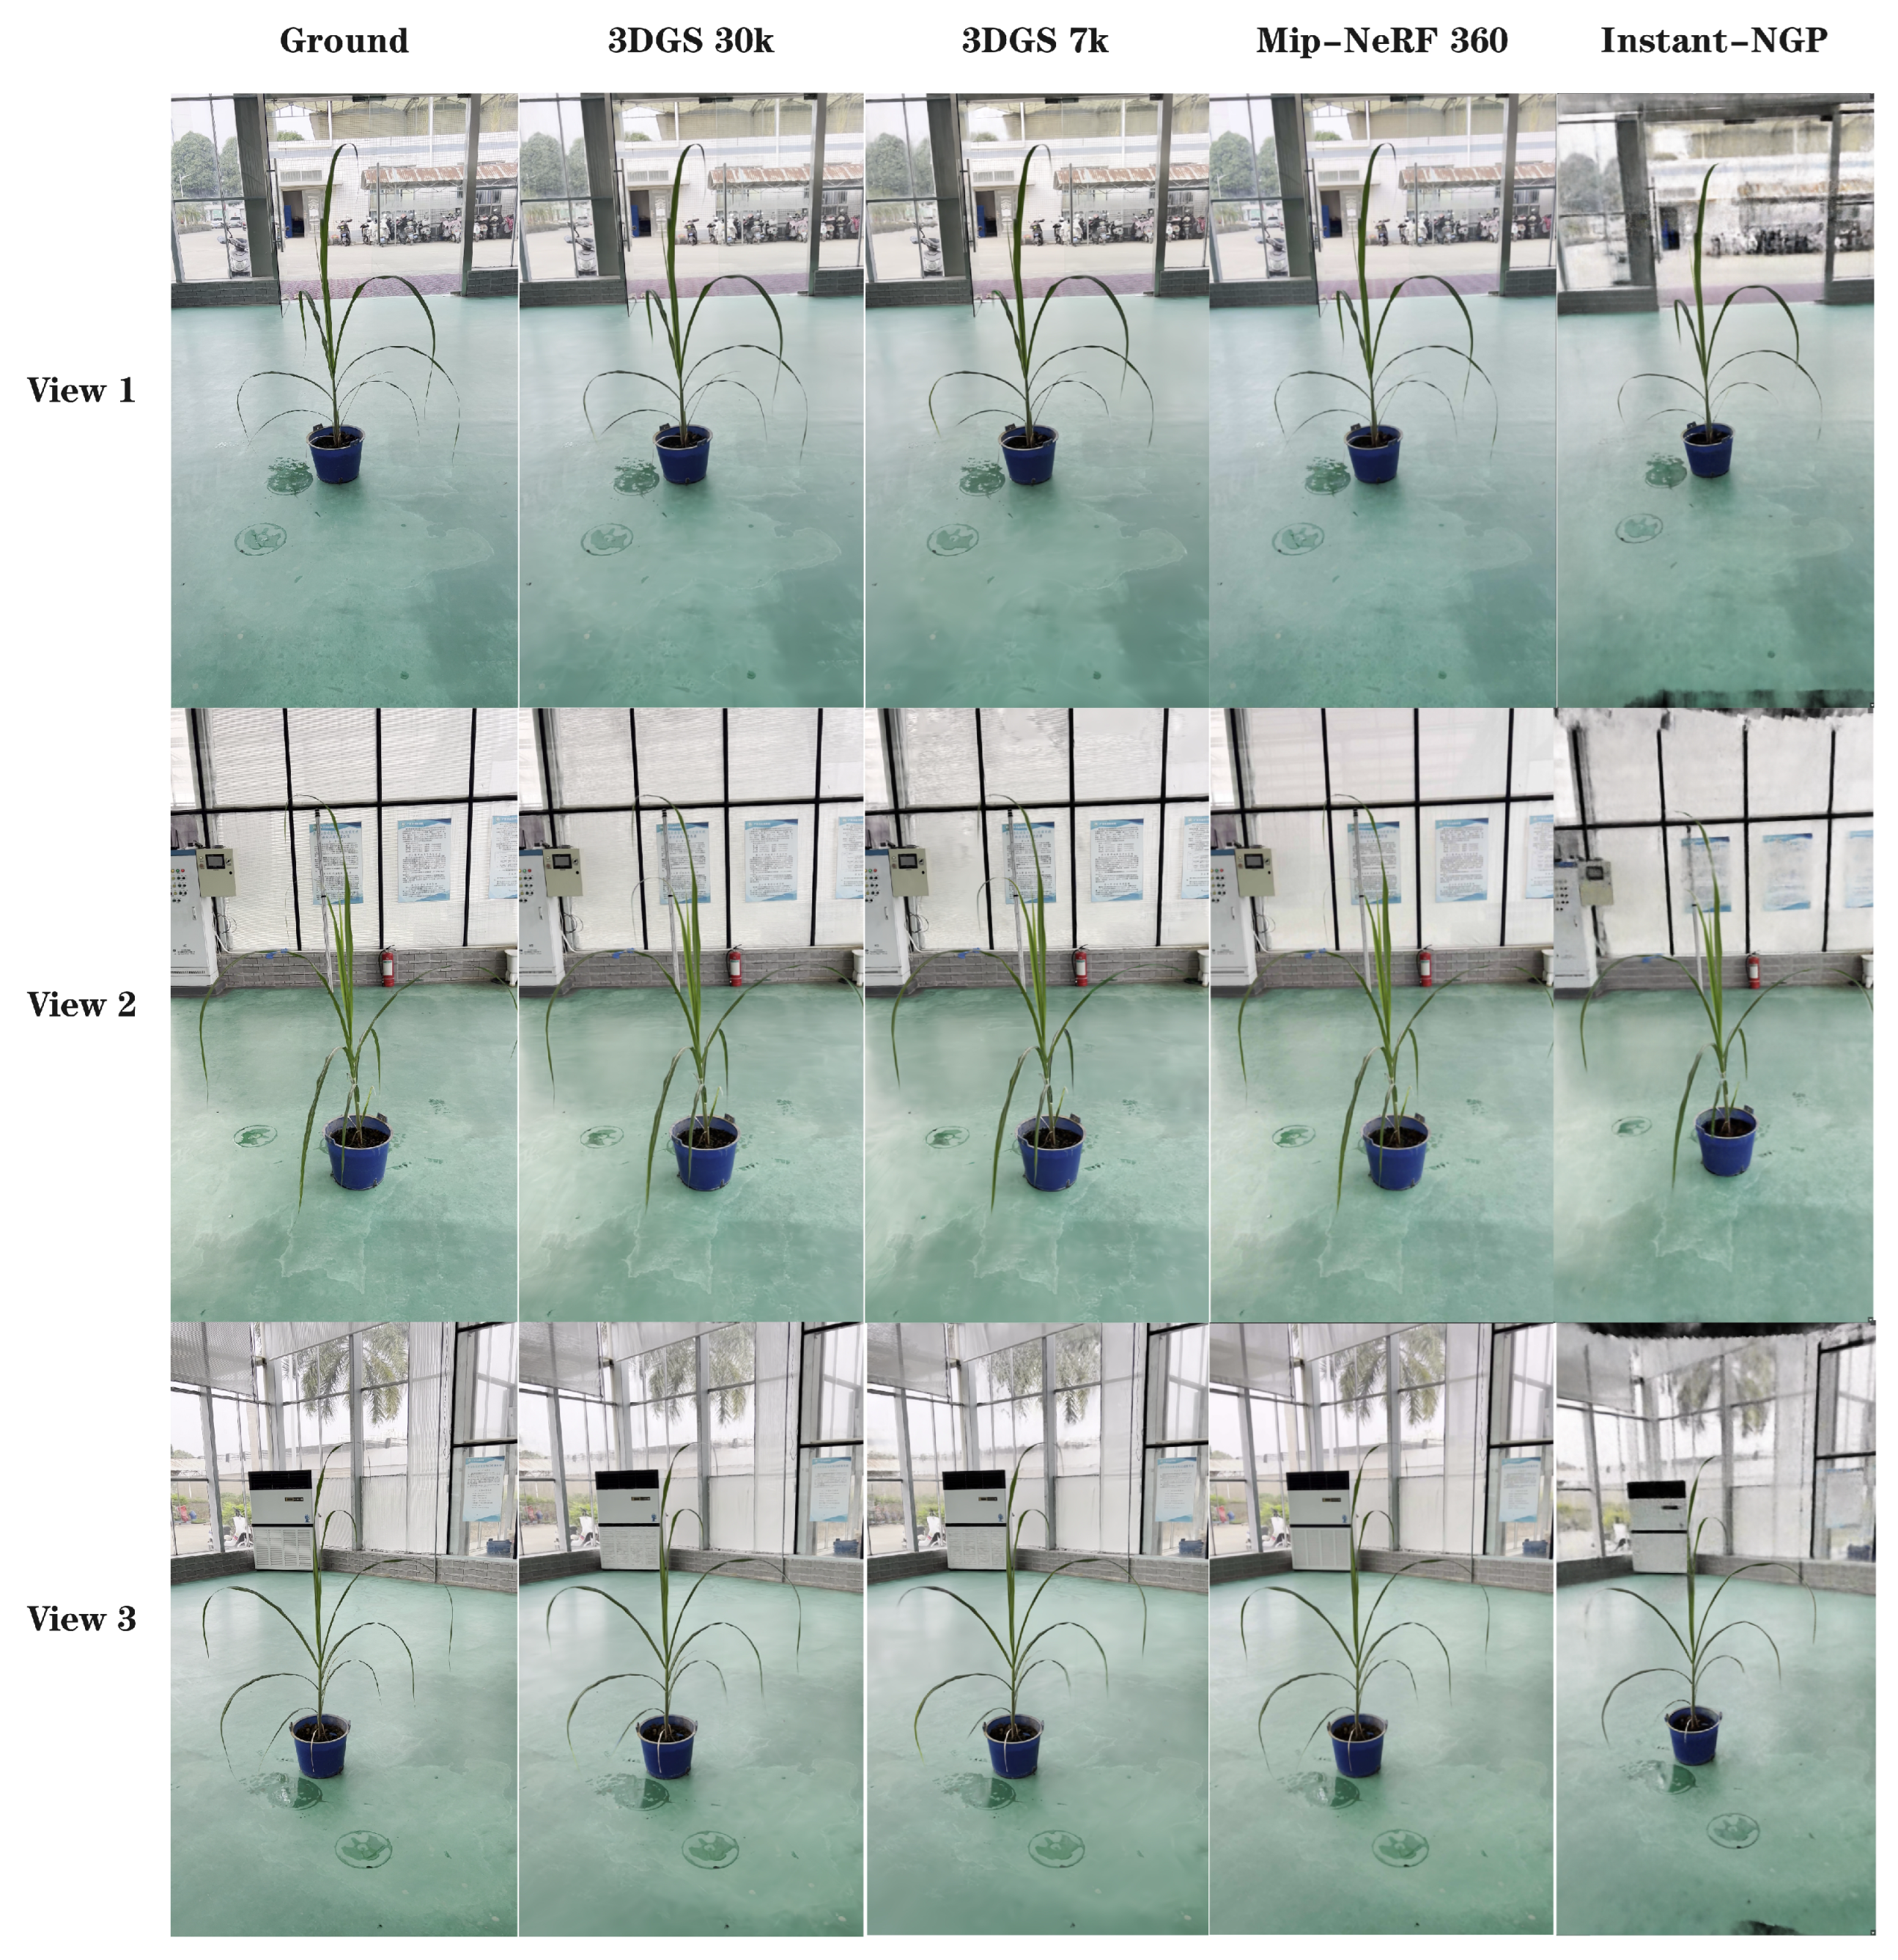
Table 1 present a comparative evaluation of sugarcane 3D reconstruction results obtained using 3D Gaussian Splatting (3DGS) and two representative NeRF-based methods, Instant-NGP and Mip-NeRF360. As observed from the visual comparisons in
Figure 5, all three methods are able to reconstruct the overall geometry of the sugarcane plant in the main target region, indicating their basic capability to capture the global plant structure. However, noticeable differences exist among the methods in terms of reconstruction quality and fine-detail representation.
Specifically, Instant-NGP exhibits insufficient overall sharpness, with pronounced blurring effects, particularly in peripheral regions of the scene, which limits its ability to faithfully reconstruct complex plant structures. Both Mip-NeRF360 and 3DGS achieve more accurate and visually consistent reconstructions. The 3DGS model trained for 7k iterations shows minor missing details in fine structures such as thin leaves and branches, but the overall plant geometry remains intact. With extended training to 30k iterations, 3DGS further improves its reconstruction fidelity, producing visual results comparable to those of Mip-NeRF360, making the two methods difficult to distinguish in terms of subjective visual quality.
Quantitative comparisons of reconstruction quality, computational efficiency, and resource consumption are summarized in
Table 1. All reported values represent the averages of multiple independent runs to improve result stability and reliability. In terms of reconstruction quality metrics, Mip-NeRF360 achieves the highest PSNR value (33.14 dB), indicating superior performance in pixel-level error minimization. In contrast, the 3DGS model trained for 30k iterations attains the best SSIM (0.821) and LPIPS (0.211) scores, suggesting improved structural similarity and perceptual consistency. Notably, the 3DGS-7k model also yields balanced performance across all metrics, while Instant-NGP consistently underperforms in reconstruction quality.
Significant differences are also observed in computational efficiency. The 3DGS-7k model requires only 7 min 12 s for training, making it the most efficient approach, followed closely by Instant-NGP (7 min 42 s). Increasing the training iterations of 3DGS to 30k raises the training time to 40 min 27 s, whereas Mip-NeRF360 requires an exceptionally long training time of 49 h 12 min. In terms of rendering speed, 3DGS demonstrates a clear advantage, achieving 160 FPS and 130 FPS for the 7k and 30k models, respectively, compared with 12 FPS for Instant-NGP and only 0.14 FPS for Mip-NeRF360.
Regarding memory consumption, Mip-NeRF360 has the smallest model size (9.5 MB), followed by Instant-NGP (31 MB). In contrast, the 3DGS models require substantially more memory due to the explicit storage of Gaussian parameters, with model sizes of 1.04 GB and 1.69 GB for the 7k and 30k versions, respectively.
Considering reconstruction quality, training efficiency, rendering performance, and memory usage collectively, the 3DGS model trained for 7k iterations is selected for subsequent sugarcane point cloud extraction. This configuration provides a favorable balance between reconstruction fidelity and computational cost, making it more suitable for practical applications.
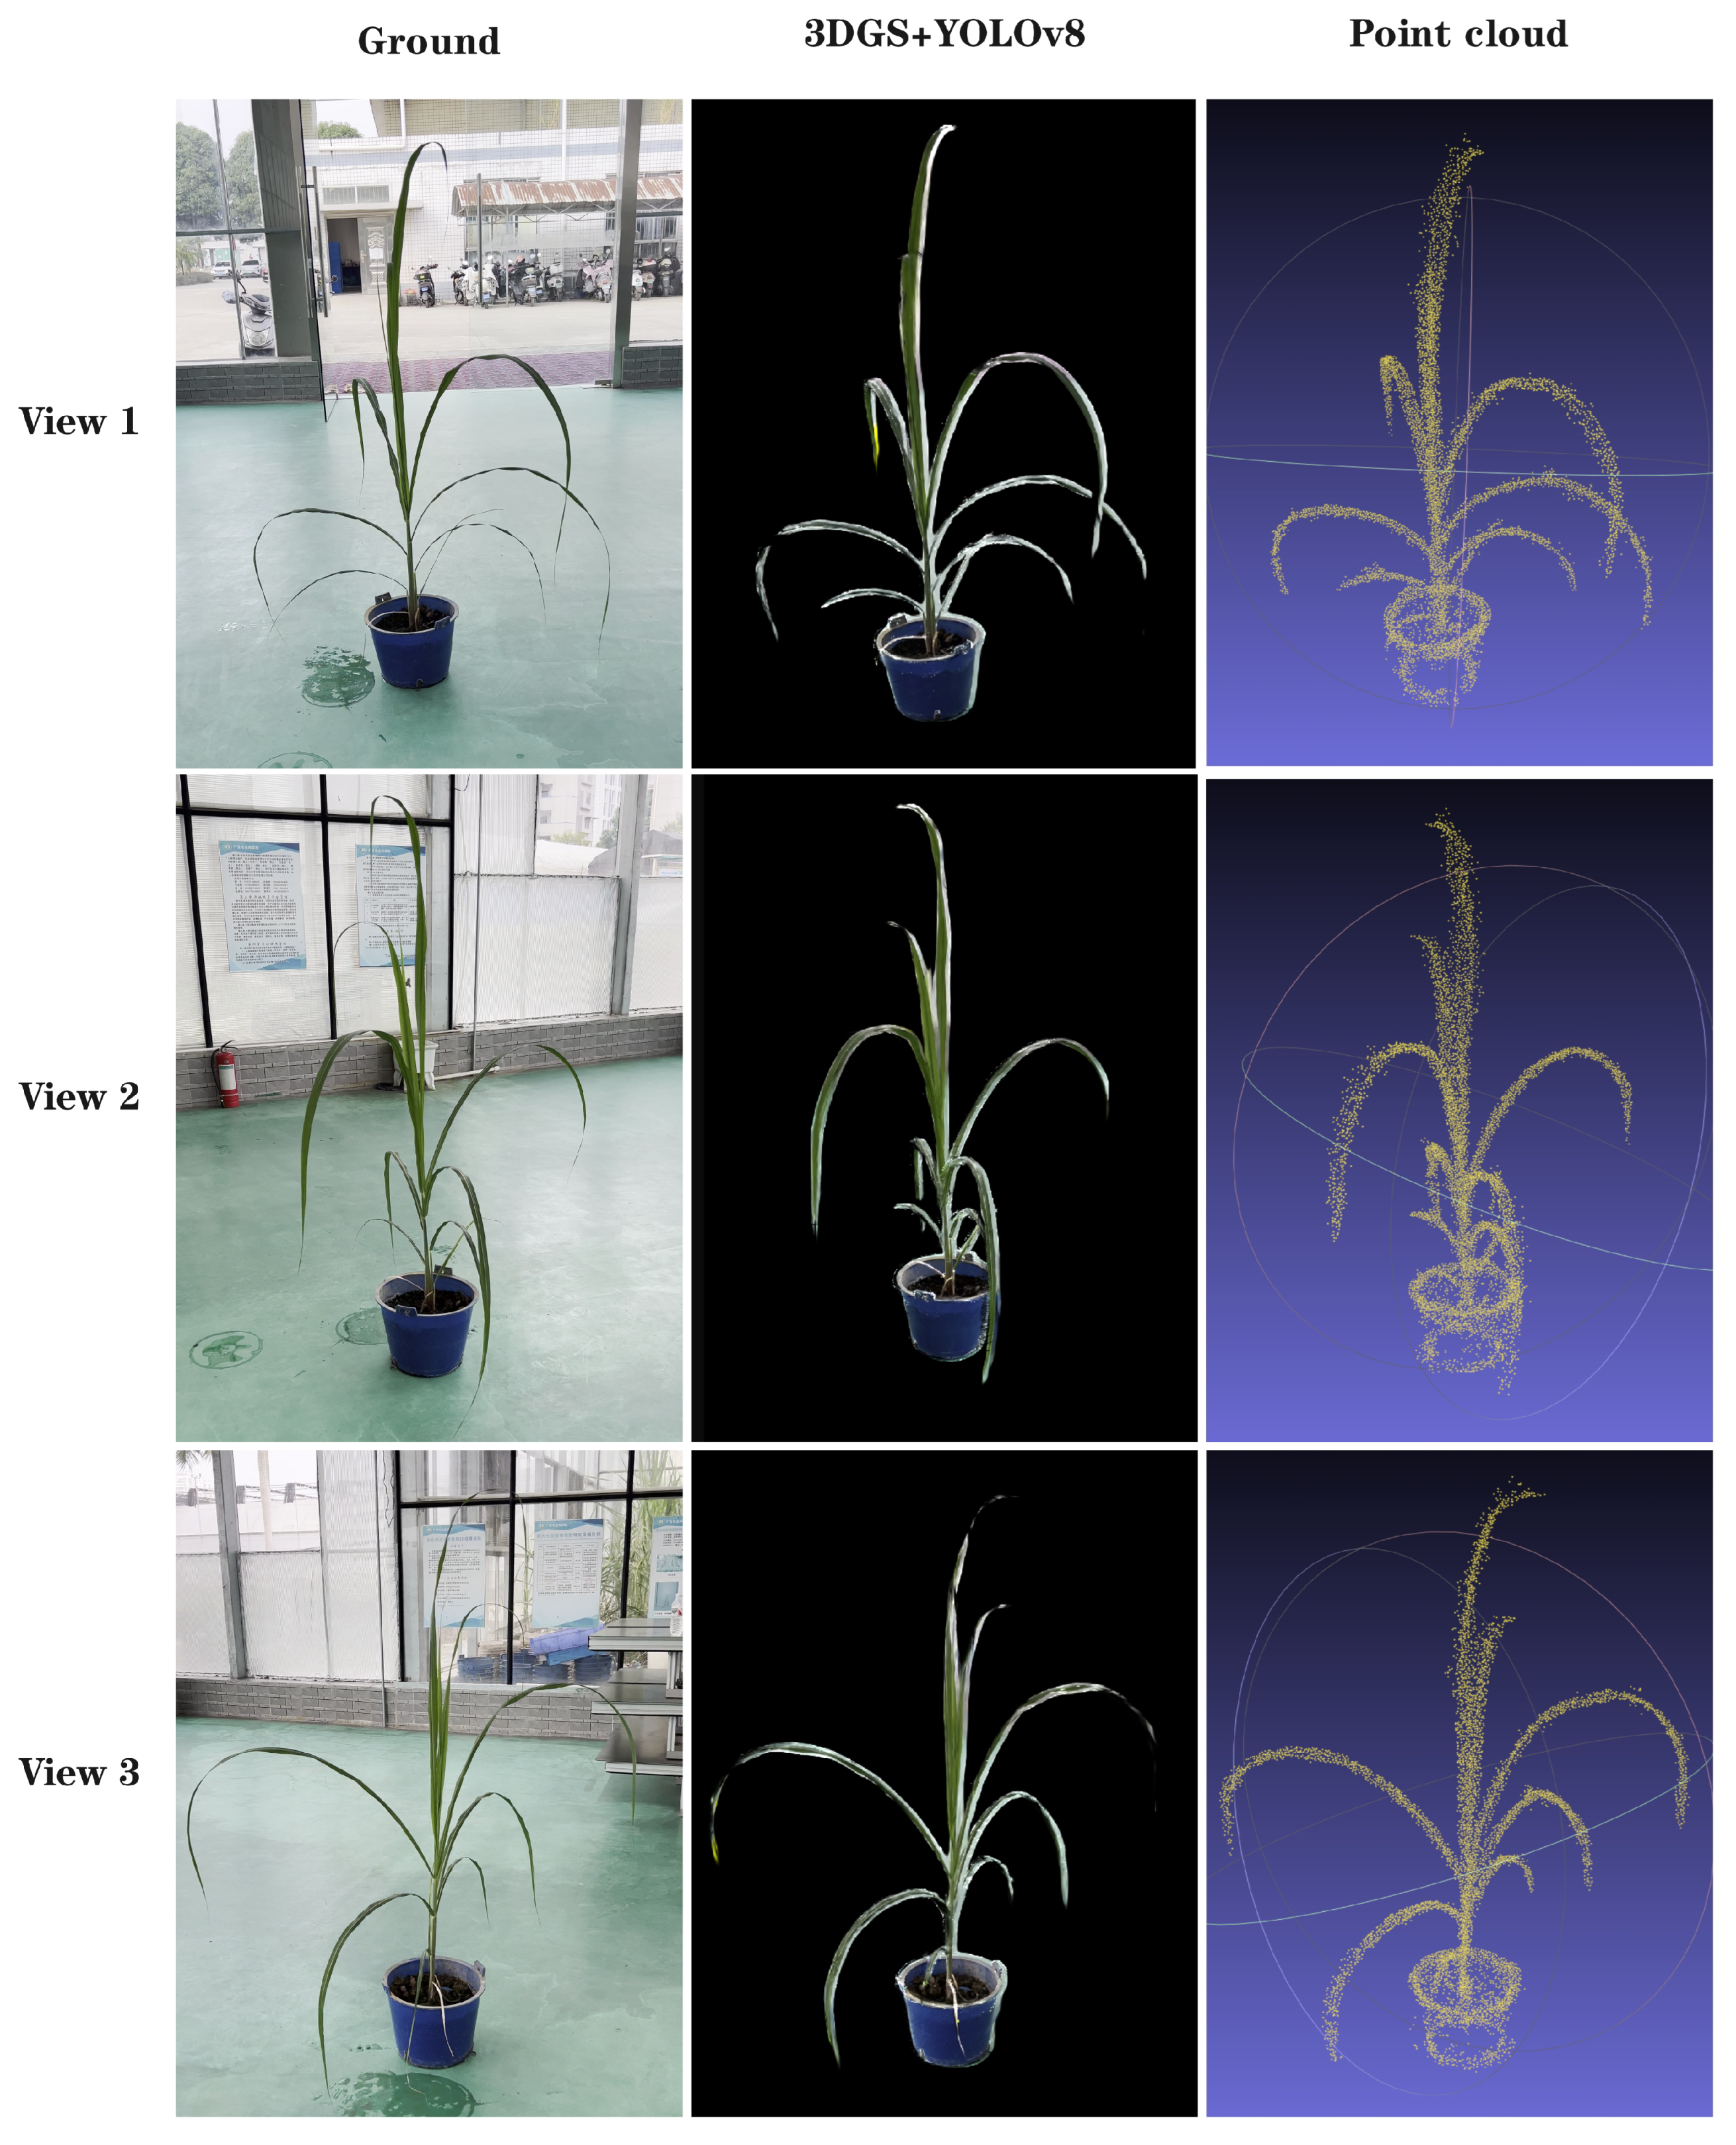
Figure 6 presents the original images alongside the reconstructed results obtained using the YOLOv8 segmentation-constrained 3DGS-7k model, as well as the extracted sugarcane point clouds. The results demonstrate that the extracted point clouds preserve the overall plant structure with high integrity, providing a reliable data foundation for subsequent sugarcane phenotypic parameter estimation.
3.3. Phenotypic Parameter Estimation
To systematically evaluate the adaptability of the proposed 3D reconstruction and phenotypic parameter estimation framework across different sugarcane growth stages, two batches of sugarcane plants collected at different times were selected for performance comparison. Batch A consisted of plants grown for 80 days, while Batch B included plants grown for 60 days. The estimation performance of the proposed method was evaluated for two key phenotypic traits: plant height and leaf area.
3.3.1. Plant Height Estimation
For plant height estimation, 30 sugarcane samples were selected from Batch A and 15 samples from Batch B. The estimation performance exhibited noticeable differences between the two batches.
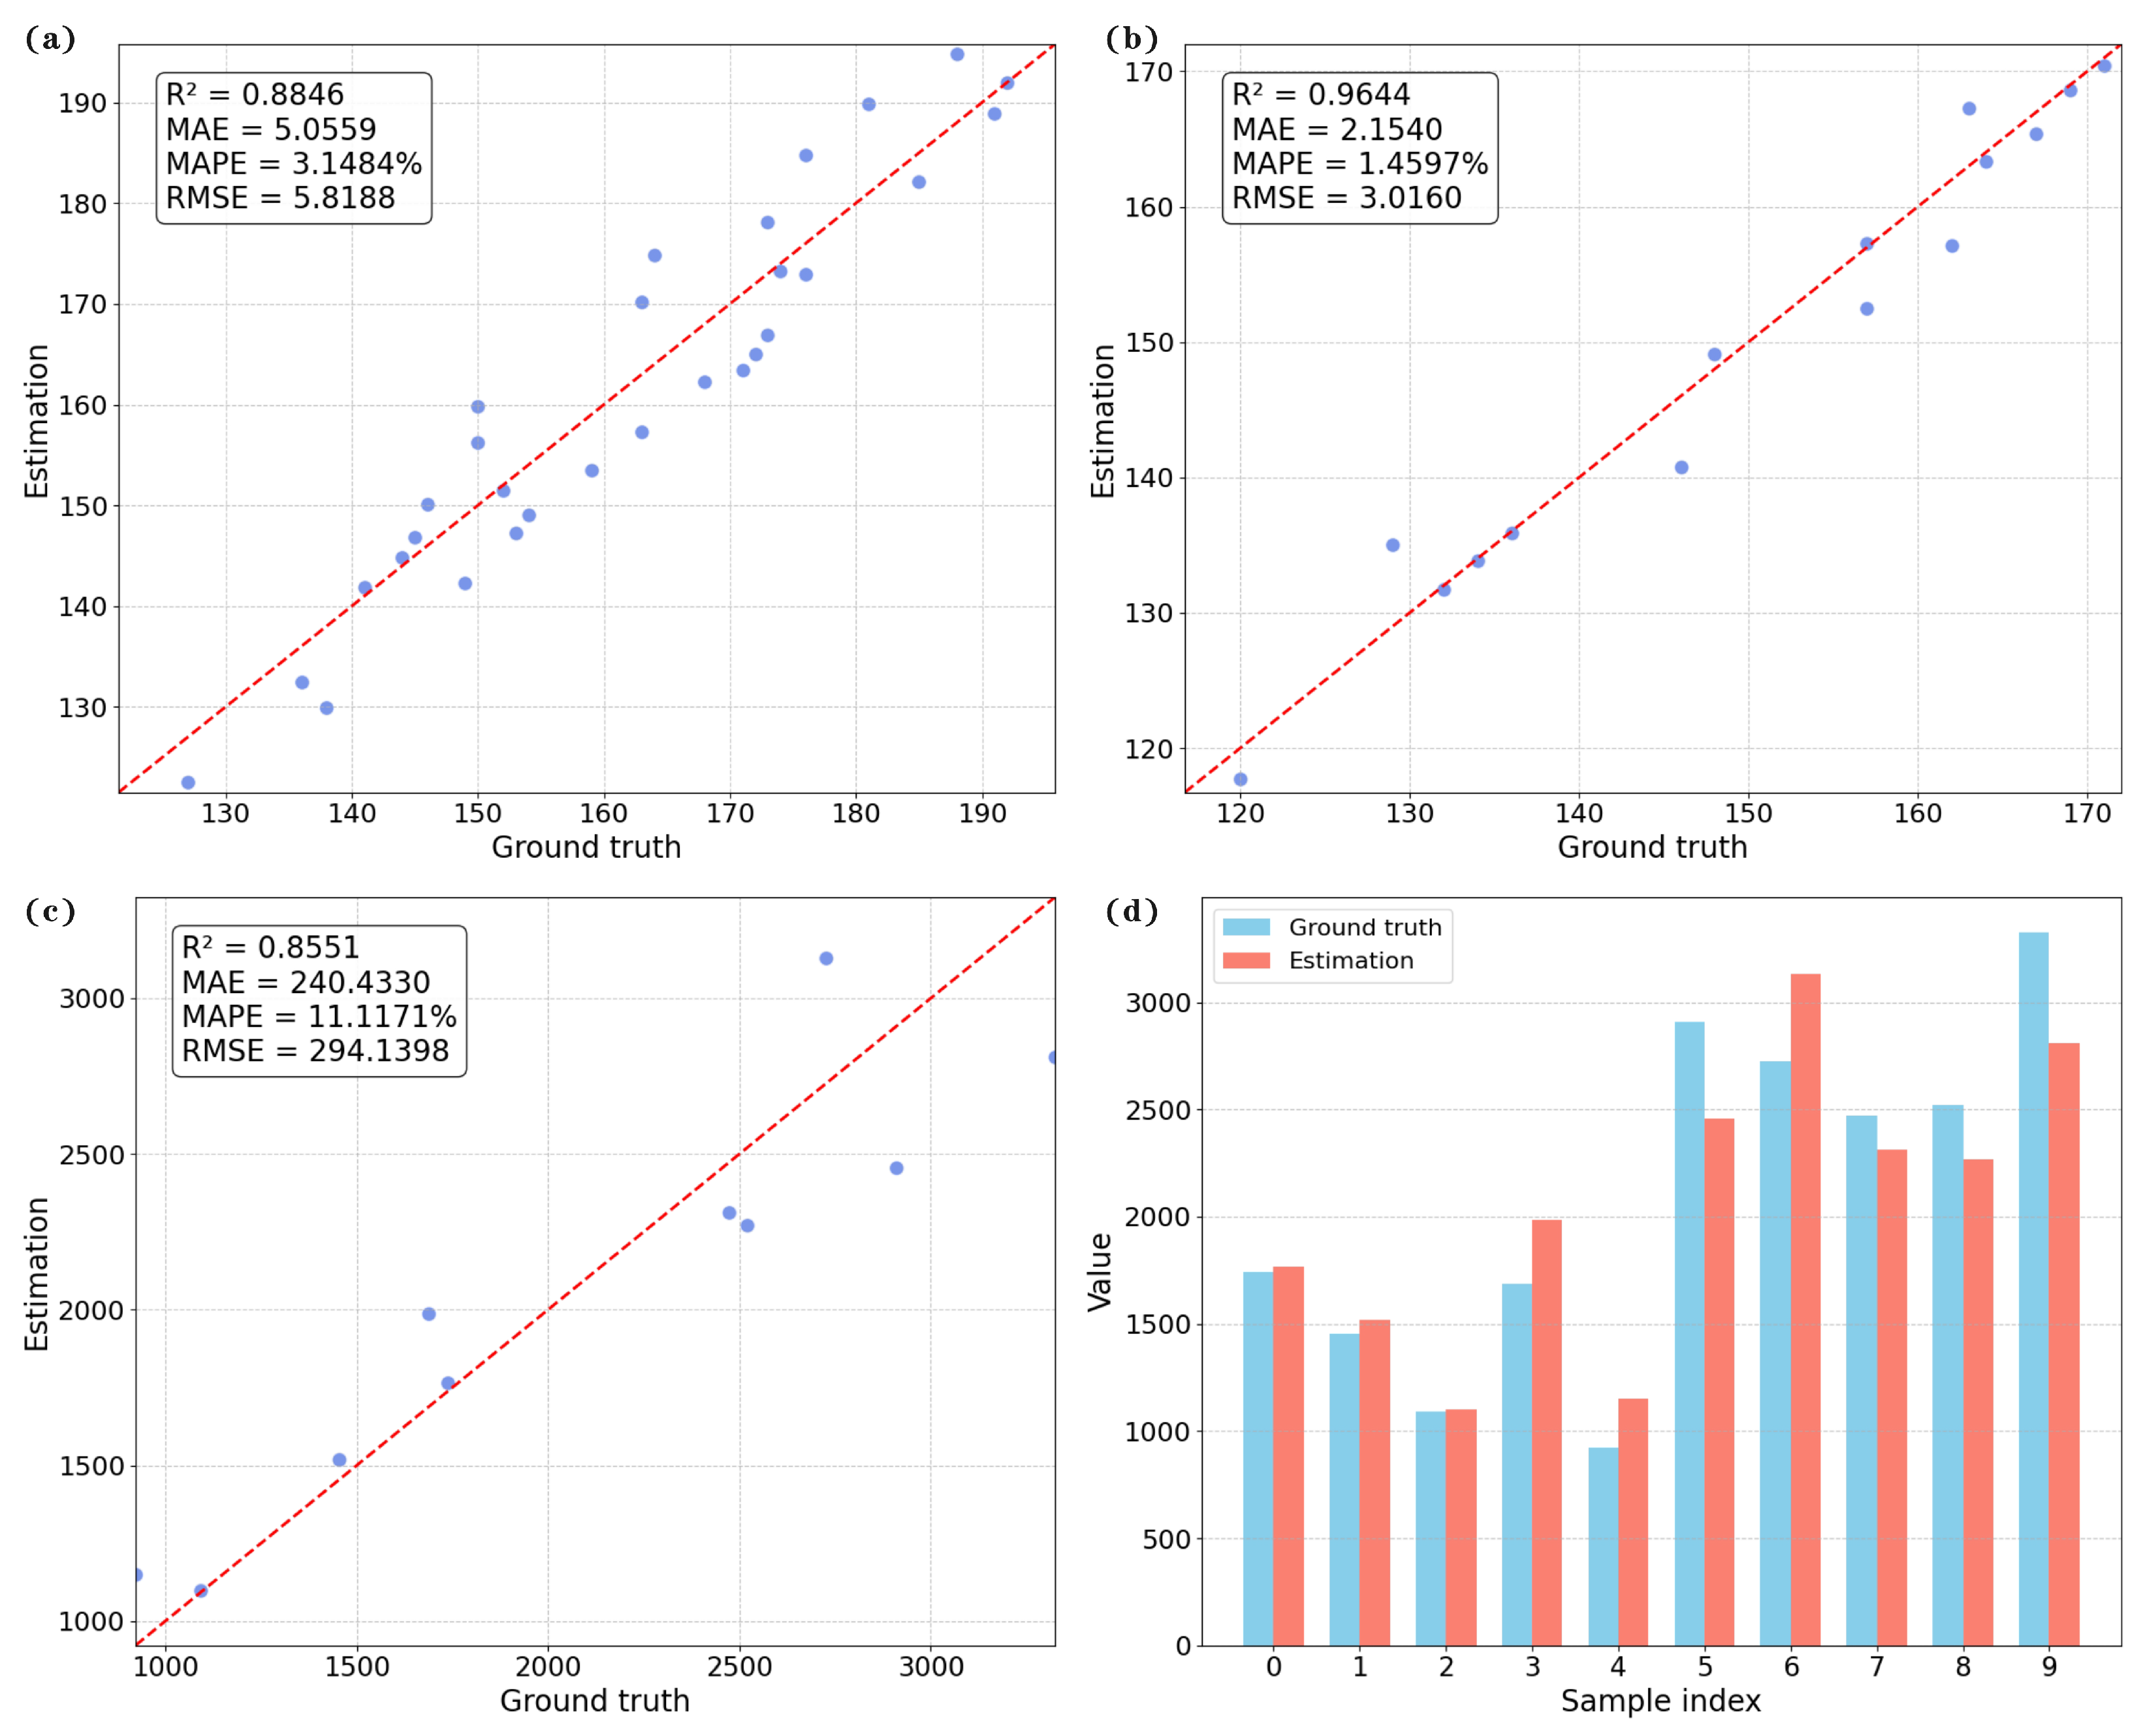
For Batch A, the coefficient of determination () reached 0.8846, with a mean absolute percentage error (MAPE) of 3.1484%, a mean absolute error (MAE) of 5.0559 cm, and a root mean square error (RMSE) of 5.8188 cm. These results indicate that the proposed method provides reasonable estimation accuracy for more mature sugarcane plants, although certain systematic or random errors remain.
In contrast, substantially improved performance was observed for Batch B. The plant height estimation achieved an value of 0.9644, with a MAPE of 1.4597%, an MAE of 2.1540 cm, and an RMSE of 3.0160 cm, demonstrating highly accurate and stable estimation capability for sugarcane at earlier growth stages.
The observed performance discrepancy can be largely attributed to differences in plant morphology across growth stages. Compared with Batch A, which exhibits taller plants, increased leaf bending, and more severe occlusion, sugarcane plants in Batch B are characterized by simpler structures, more regular postures, and less complex canopy architectures. These characteristics reduce the difficulty of 3D reconstruction and geometric feature extraction, thereby leading to improved height estimation accuracy.
To visually illustrate the estimation performance across growth stages, scatter plots of estimated versus measured plant heights for Batch A and Batch B are presented in
Figure 7a and
Figure 7b, respectively. These plots clearly demonstrate differences in fitting quality and error distribution, further supporting the stage-dependent analysis of the proposed method.To improve result reliability, the complete reconstruction and phenotypic estimation pipeline was repeated multiple times for each plant, and all reported regression metrics represent averaged results across repeated runs. The corresponding
values showed only minor fluctuations across repetitions, indicating stable and reproducible estimation performance.
3.3.2. Leaf Area Estimation
For leaf area estimation, five sugarcane plants were randomly selected from each batch, resulting in a total of ten samples for joint evaluation. Due to the destructive nature of ground-truth leaf area measurement, which requires harvesting plants and removing all leaves for scanning, only a limited number of samples were selected for validation. Specifically, five plants from each batch were randomly chosen (ten in total) for destructive leaf area measurement. This sampling strategy avoids excessive loss of experimental plants but inevitably limits the statistical power of leaf area validation, which is further discussed as a limitation in the Discussion section. This mixed-sample setting was designed to assess the generalization capability of the proposed method under varying morphological conditions, such as differences in leaf density and structural complexity.
The estimation results on the combined dataset yielded an value of 0.8551, with an MAE of 240.433 cm2, a MAPE of 11.1171%, and an RMSE of 294.1398 cm2. Despite the limited sample size and notable structural variability among plants, the proposed method maintained relatively strong estimation performance, indicating its ability to capture structural variation in leaf surface area.
To compensate for the limited visual interpretability of correlation analysis under small-sample conditions, a combination of scatter plots and bar charts was employed for result visualization (
Figure 7c,d). The scatter plot illustrates the global relationship between estimated and measured values, while the bar chart provides a direct comparison for individual samples. This complementary visualization strategy helps reveal potential sources of estimation error, which are mainly associated with leaf occlusion, segmentation inaccuracies, and local reconstruction noise. It should be noted that these factors are identified based on qualitative visual analysis and empirical observation rather than independent quantitative decomposition, as the current experimental setup does not allow explicit isolation and separate measurement of each error source.
Overall, the proposed sugarcane 3D modeling and phenotypic parameter estimation framework demonstrates good robustness and adaptability across different growth stages. Near application-level accuracy is achieved for plant height estimation in early-stage sugarcane plants (, MAPE ), while reliable explanatory power is retained for more structurally complex plants. In addition, leaf area estimation exhibits stable correlation and consistent visual agreement under mixed-sample conditions, validating the potential of the proposed method for non-destructive sugarcane phenotyping and future high-throughput field applications.
3.4. Workflow Efficiency and Computational Performance
Table 2 summarizes the average time consumption of each stage in the complete workflow. The results indicate that the overall processing time is well controlled and suitable for practical use.
During data acquisition, multi-view images of a single sugarcane plant can be captured within approximately 1 min, reflecting the simplicity of the acquisition process and minimal environmental requirements. The data preprocessing stage requires approximately 15 min, primarily dominated by camera pose estimation (about 13 min), while 2D image segmentation based on the YOLOv8 model takes only around 2 min.
The 3D reconstruction stage based on 3D Gaussian Splatting requires approximately 7 min on average to generate a structurally complete sugarcane model. Subsequently, phenotypic parameter estimation from the reconstructed point cloud takes about 3 min, mainly involving geometric analysis.
Overall, the entire pipeline from data acquisition to phenotypic parameter estimation can be completed within approximately 30 min per plant. This significantly reduces the time cost of 3D phenotyping while maintaining high reconstruction quality, demonstrating that the proposed method offers a favorable balance between accuracy and computational efficiency and is well suited for rapid single-plant phenotypic analysis under laboratory conditions.
4. Discussion
4.1. Main Findings and Mechanism Interpretation
This study proposes a sugarcane three-dimensional phenotyping framework that integrates YOLOv8-seg and 3D Gaussian Splatting (3DGS), enabling high-quality two-dimensional segmentation, robust three-dimensional reconstruction, and automated estimation of key phenotypic traits under conditions of complex plant structure and severe leaf overlap.
At the segmentation stage, the YOLOv8x-seg model achieved satisfactory performance on the constructed dataset, as reflected by the F1-score and Mean IoU reported in
Section 3.1. In particular, the generated masks exhibited well-aligned boundaries in scenes with leaf interlacing and partial stem occlusion, providing relatively clean foreground inputs for subsequent 3D reconstruction. It should be noted that mask fragmentation or local missing regions may still occur in certain viewpoints; however, experimental results indicate that such segmentation errors do not exert a decisive influence on the final reconstruction quality.
The underlying reason lies in the redundancy and complementarity introduced by multi-view observations. Even if a local structure is incompletely segmented in one view, it is often captured in other viewpoints. During the joint optimization of 3DGS, multi-view information is effectively fused through explicit Gaussian representations and differentiable projection mechanisms, thereby compensating for incomplete single-view segmentation at the global geometric level. Similar multi-view redundancy mechanisms have been widely discussed in SfM- and NeRF-based reconstruction studies [
17,
22]. These findings suggest that, within multi-view-based 3D phenotyping workflows, single-frame segmentation accuracy is not the sole bottleneck; rather, viewpoint coverage and cross-view consistency play a more critical role.
At the phenotypic parameter level, experimental results reveal clear performance differences in plant height estimation across growth stages. Sugarcane plants at early growth stages exhibit relatively simple structures and more regular postures, resulting in significantly higher reconstruction accuracy and plant height estimation performance than those at later stages. As plants mature, increased leaf number, enhanced curvature, and more complex canopy architectures introduce greater reconstruction uncertainty and quantification error. In contrast, leaf area estimation maintains relatively high correlation across samples with varying structural complexity. These observations indicate that plant morphological complexity is a key factor influencing the accuracy of 3D reconstruction and phenotypic parameter estimation, and should be jointly considered in both data acquisition strategies and algorithm design.
Quantitative observations support this interpretation. In this study, Batch A plants exhibited greater structural complexity, with plant heights ranging from approximately 127–192 cm (mean 161.8 cm) and leaf numbers ranging from 9 to 14 (mean 11.67 leaves), whereas Batch B plants showed relatively simpler architectures, with heights of approximately 120–171 cm (mean 150.33 cm) and leaf numbers ranging from 8 to 12 (mean 9.83 leaves). The denser canopy structure and stronger self-occlusion in Batch A increase reconstruction difficulty and geometric uncertainty, thereby reducing phenotypic estimation accuracy.
Interestingly, although later-stage plants exhibit higher structural complexity, the correlation performance of leaf area estimation remains relatively stable across growth stages. This phenomenon is likely attributed to multi-view redundancy: even when local leaf regions are partially occluded or incompletely reconstructed in certain views, complementary information from other viewpoints compensates for local losses. Moreover, leaf area represents a global integral quantity and is therefore less sensitive to localized reconstruction errors than height estimation. Similar robustness mechanisms in multi-view-based phenotyping have been discussed in previous studies, suggesting that multi-view fusion plays a key stabilizing role in global trait estimation. In addition, plant growth is often accompanied by changes in leaf structural and optical properties, such as increased thickness, enhanced curvature, and variations in surface reflectance, which may influence the accuracy of image-based phenotypic trait extraction [
29]. However, in our dataset, the average single-leaf area did not show substantial variation across growth stages, and the use of multi-view imaging likely compensated for these effects, resulting in comparable leaf area estimation performance between the two stages.
4.2. Comparison with Existing Studies
Existing studies have shown that plant 3D modeling methods still face notable challenges when dealing with crops characterized by complex architectures, slender leaves, and severe self-occlusion. Traditional SfM–MVS-based approaches offer advantages such as low cost and flexible deployment; however, they are prone to feature matching failures in densely interlaced leaf scenes, leading to discontinuous point clouds or local reconstruction loss. Active sensing technologies, such as LiDAR and depth cameras, generally provide higher geometric accuracy and robustness, but their high equipment cost and complex acquisition procedures limit their applicability in large-scale field experiments or breeding programs.
In recent years, NeRF and its variants have demonstrated strong capabilities in fine-detail reconstruction for crops such as rice and peanut. Nevertheless, prior studies have reported that these methods typically require long training times and substantial computational resources, and may still suffer from incomplete reconstruction in scenes with complex leaf structures or severe occlusion [
25].
Against this background, this study conducts both qualitative and quantitative comparisons between 3DGS and two representative NeRF-based methods, namely Instant-NGP and Mip-NeRF360. Experimental results indicate that Mip-NeRF360 achieves the highest PSNR, reflecting its advantage in pixel-level reconstruction accuracy, while 3DGS trained for 30k iterations attains the best SSIM and LPIPS scores, demonstrating superior structural consistency and perceptual quality. Instant-NGP, by contrast, exhibits relatively weaker performance in both overall reconstruction quality and visual fidelity.
In terms of computational efficiency, 3DGS exhibits a clear advantage. A structurally complete reconstruction can be obtained with only 7k training iterations, requiring substantially less training time and achieving significantly higher rendering speed than Mip-NeRF360, while maintaining comparable reconstruction quality. These results indicate that 3DGS achieves a more favorable balance between reconstruction accuracy and computational efficiency in complex plant scenes.
Overall, the YOLOv8-seg-constrained 3DGS approach proposed in this study enables high-quality sugarcane reconstruction and point cloud extraction without reliance on expensive acquisition hardware. Although the current experimental scale remains limited, the results suggest that this method offers a promising compromise among performance, efficiency, and practicality. These findings are consistent with previous reports indicating that NeRF-based methods often require long training times and substantial computational resources for complex plant reconstruction, which may limit their efficiency in large-scale applications. Given the relative scarcity of studies focusing on sugarcane 3D reconstruction and phenotypic analysis, this work can be regarded as an early exploration in this research direction, providing methodological references and experimental evidence for future studies.
4.3. Limitations and Challenges
Despite the encouraging performance achieved under experimental conditions, several limitations remain and warrant further investigation.The limitations of the proposed framework mainly involve environmental dependency, reconstruction fidelity, computational efficiency, automation degree, and generalization capability, which are discussed as follows:
Environmental dependency. During data acquisition, wind-induced leaf motion may cause SfM feature matching failures, thereby affecting camera pose estimation and subsequent 3DGS reconstruction. Similar issues have been reported in SfM- and NeRF-based field plant reconstruction studies [
18,
23]. Future work may mitigate this issue through synchronized multi-camera capture or high-speed shutter imaging to reduce temporal inconsistency.
Insufficient detail reconstruction. In regions with highly dense or severely interlaced leaves, 3DGS may still produce blurred boundaries or local missing structures, which can affect the accuracy of leaf area estimation. Potential improvements include incorporating boundary-aware losses during 2D segmentation or adopting multi-modal inputs that combine RGB and depth information.
Computational efficiency constraints. On the current RTX 3090 GPU platform, modeling and phenotypic parameter estimation for a single sugarcane plant require approximately 26 min. While acceptable for small-scale experiments, this remains insufficient for large-scale, high-throughput field applications. This limitation has also been identified as a major bottleneck for NeRF-based methods in agricultural scenarios [
25,
27]. Future optimization may involve model lightweighting, parallel processing, and workflow acceleration.
Difficulty in stem–leaf separation. Due to the intertwined structure of sugarcane stems and leaves, automatic separation in point clouds remains challenging, limiting the extraction of more complex traits such as stem height and leaf angle. Skeleton extraction algorithms or point cloud semantic segmentation networks may be integrated to enhance stem–leaf discrimination.
Environmental and varietal generalization. This study was conducted under controlled greenhouse conditions (diffuse lighting, low wind disturbance) and on a single sugarcane variety (GT42). Such controlled conditions may introduce a bias toward optimal environments and limit direct generalization to field scenarios involving variable illumination, wind disturbance, and multi-varietal morphological diversity. Furthermore, validation was performed on a limited number of growth stages and batches. Future studies should extend the framework to multi-variety datasets and outdoor field environments to comprehensively evaluate robustness and generalization capability.
Partial automation. Although the proposed framework is non-contact and largely automated, the current leaf area estimation still relies on manual point cloud segmentation of individual leaves. This semi-manual step reduces the level of full automation and high-throughput potential. However, compared with traditional destructive leaf area measurement (which requires harvesting and scanning leaves, typically taking ∼10 min per plant), the manual point cloud segmentation is non-destructive and requires only approximately 1–2 min per plant, representing a substantial efficiency improvement. Future work will focus on integrating automatic stem–leaf separation, skeleton extraction, and point cloud semantic segmentation to achieve fully automated leaf area extraction.
4.4. Application Prospects and Future Directions
Overall, the proposed method demonstrates strong practical potential under laboratory conditions. It should be emphasized that the term “low-cost” in this study primarily refers to the data acquisition stage, where only a consumer-grade smartphone is required for image capture. In contrast, the current data processing and reconstruction pipeline relies on high-performance GPU computation (e.g., RTX 3090), reflecting a trade-off between low-cost sensing and high-cost computing. This “low-cost sensing–high-performance computing” paradigm is increasingly common in modern vision-based phenotyping systems. With the growing availability of cloud computing and GPU resources, the practical impact of computational cost is expected to decrease. Nevertheless, future research should focus on algorithmic optimization and model acceleration to reduce hardware dependency and improve scalability.It enables efficient, non-destructive estimation of key traits such as plant height and leaf area, reducing manual labor and destructive sampling, and providing reliable support for early-stage breeding selection. The robustness observed in sugarcane, a crop with complex structure, further suggests potential applicability to other tall crops such as maize and sorghum.
For large-scale field deployment, the primary challenges remain wind-induced mismatches and system efficiency. The former may be alleviated through synchronized multi-camera acquisition and more robust pose estimation strategies, potentially incorporating IMU data when necessary. The latter relies on further lightweight and parallel implementations of 3DGS, as well as more efficient view acquisition and data organization strategies. With continuous improvements in both sensing hardware and computational algorithms, the proposed framework is expected to evolve from single-plant or small-batch analysis toward plot-level high-throughput phenotyping, and to support more advanced organ-level trait estimation such as stem length, leaf angle, and phyllotaxy, thereby providing robust quantitative support for crop phenotyping and precision breeding [
9].