Article

Multi-Source Monitoring of High-Temperature Heat Damage During Summer Maize Flowering Period Based on Machine Learning


1
Luohe Meteorological Bureau, Luohe 462300, China
2
Henan Institute of Meteorological Sciences, Zhengzhou 450003, China
3
Henan Key Laboratory of Agrometeorological Support and Applied Technique, China Meteorological Administration, Zhengzhou 450003, China
4
Collaborative Innovation Center on Forecast and Evaluation of Meteorological Disasters, Jiangsu Key Laboratory of Agricultural Meteorology, School of Ecology and Applied Meteorology, Nanjing University of Information Science & Technology, Nanjing 210044, China
5
Zaozhuang Meteorological Bureau, Zaozhuang 277800, China
6
Key Laboratory for Meteorological Disaster Prevention and Mitigation of Shandong, Jinan 250031, China
*
Author to whom correspondence should be addressed.
Agriculture 2026, 16(2), 207; https://doi.org/10.3390/agriculture16020207

Submission received: 10 November 2025 / Revised: 11 January 2026 / Accepted: 11 January 2026 / Published: 13 January 2026

Abstract

With the intensification of global climate change, high temperatures have emerged as a major abiotic stressor adversely affecting summer maize yields in North China. This study presents a high-resolution monitoring framework for Henan Province. First, an hourly, high-resolution (0.02° × 0.02°) near-surface air temperature dataset was generated by fusing Himawari-8 satellite observations, ERA5 reanalysis data, and ground-based measurements through a machine learning approach. Among the tested algorithms (support vector regression, random forest, and XGBoost), XGBoost achieved the best performance (R2 = 0.933 and RMSE = 0.841 °C). Second, a High-Temperature Damage Index (HTDI) was constructed using hourly temperature thresholds of 32 °C and 35 °C, respectively. The index exhibited a statistically significant but modest negative correlation with ear grain number (R2 = 0.054 and p = 0.0007). Spatial assessment revealed intensified heat damage in 2024 (average HTDI = 0.51; over 67% of the area experienced moderate or worse damage) compared to 2023 (average HTDI = 0.22), with severe damage concentrated in south–central and east–central Henan. This approach surpasses the limitations of conventional daily scale assessments by enabling refined, hourly monitoring of high-temperature heat stress. It not only advances the deep integration of remote sensing and machine learning in agricultural meteorology but also provides technical support for addressing food security challenges under climate change.

1. Introduction

With the intensification of global climate change, the frequency and intensity of extreme high-temperature events are continually increasing, making them one of the primary meteorological disasters affecting agricultural production [1]. Summer maize, as an important grain crop in Northern China, is extremely sensitive to high temperatures during its flowering period. High-temperature heat damage directly impairs pollen viability and the pollination process, thereby reducing the seed setting rate and ear grain number, which ultimately leads to a decline in yield [2,3,4]. Located in the Huang-Huai-Hai Plain, Henan Province is a major area of summer maize production in China, accounting for over 10% of the national planting area and contributing significantly to total yield [5]. However, in recent years, extremely high-temperature events during the summer maize flowering period have occurred with increasing frequency, consequently intensifying the threat of heat damage to crop yields. Studies have shown that high-temperature heat damage can reduce summer maize yields by 10% to 30%, with losses exceeding 50% in extreme cases [6,7]. Therefore, strengthening the monitoring of high-temperature heat damage—which is crucial for steadily increasing summer maize yields—has become a key task for ensuring food security in China amidst increasingly scarce arable land resources.
The impact of high-temperature heat damage on the maize flowering period has become a focus of current agrometeorological research. Studies indicate that pollen viability begins to decline significantly when temperatures exceed 32 °C, and these detrimental effects are exacerbated above 35 °C, leading to reduced fertilization and seed setting rates [8,9]. High temperatures shorten lifespan of silk and reduce pollen germination capacity; in severe cases, this can lead to a substantial reduction in ear grain number, directly affecting yield [10]. The maize flowering period coincides with the high-temperature season in Henan Province. This concurrence is exacerbated by the increasing frequency of extreme climate events, posing greater risks to crop yields in the context of global warming [11]. Daily maximum temperature data from meteorological stations, which are the primary data source in existing studies, lack refinement. They are insufficient for capturing and quantifying the duration of high temperatures or for accurately reflecting the geographical spatial distribution of physiological stress through the interpolation of station observations [12]. Therefore, utilizing high-resolution hourly temperature grid data to assess high-temperature heat damage during the summer maize flowering period holds significant academic and practical value.
Traditionally, large-scale temperature monitoring has relied on the spatial interpolation of point-based meteorological station data, which often lacks the spatial information needed to capture local terrain and land cover. Remote sensing technology has developed rapidly in recent years. Geostationary satellites such as Himawari-8 and Fengyun-4A (FY-4A) provide new monitoring capabilities with high temporal resolution (e.g., a 10 min to 1 h revisit capability) and multiple spectral bands. Their thermal infrared data are particularly valuable for near-surface air temperature inversion [13,14,15]. Conversely, grid data generated by interpolating meteorological station observations using traditional methods such as Kriging or inverse distance weighting are often insufficient to capture the effects of complex terrain and variations in local microclimate [16]. By contrast, machine learning methods, with their advantages in nonlinear modeling and multi-source data fusion, have emerged as a promising approach for retrieving high spatiotemporal resolution temperature datasets. For example, Wang et al. [17] used random forest (RF) to invert land surface temperature over the Qinghai–Tibet Plateau, achieving an RMSE of 1.89 K. Similarly, Qi et al. [18] applied XGBoost to optimize inversion accuracy, reporting performance significantly better than that of traditional split-window algorithms (RMSE < 2 K). These studies demonstrate the capability of machine learning to effectively fuse meteorological and remote sensing data, improve spatial accuracy, and provide new methods for monitoring temperature inversion and heat damage.
This study aims to precisely assess high-temperature heat damage during the summer maize flowering period through a three-steps framework: (1) inverting hourly near-surface air temperature grid data for 2023–2024 by integrating Himawari-8 satellite data, ERA5 reanalysis, and meteorological station observations using machine learning; (2) constructing a High-Temperature Damage Index (HTDI) based on hourly station data (2011–2024) and records of ear grain numbers to quantify the impacts of high-temperature duration, accumulated heat, and frequency; and (3) generating spatial distribution maps of heat damage for 2023–2024 by applying the HTDI to the inverted temperature data. Based on the physiological thresholds discussed, we hypothesize that the number of hours above 35 °C within 2–5 days after tasseling is a better predictor of kernel number reduction per ear than metrics based on 32 °C. This framework addresses the limitations of traditional methods, particularly their insufficient spatiotemporal resolution. It provides a new pathway for the precise assessment of high-temperature heat damage to summer maize in Henan Province, promotes the application of remote sensing and machine learning in agrometeorology, and offers a scientific basis for assessing agricultural disasters in the context of climate change.

2. Materials

2.1. Study Area

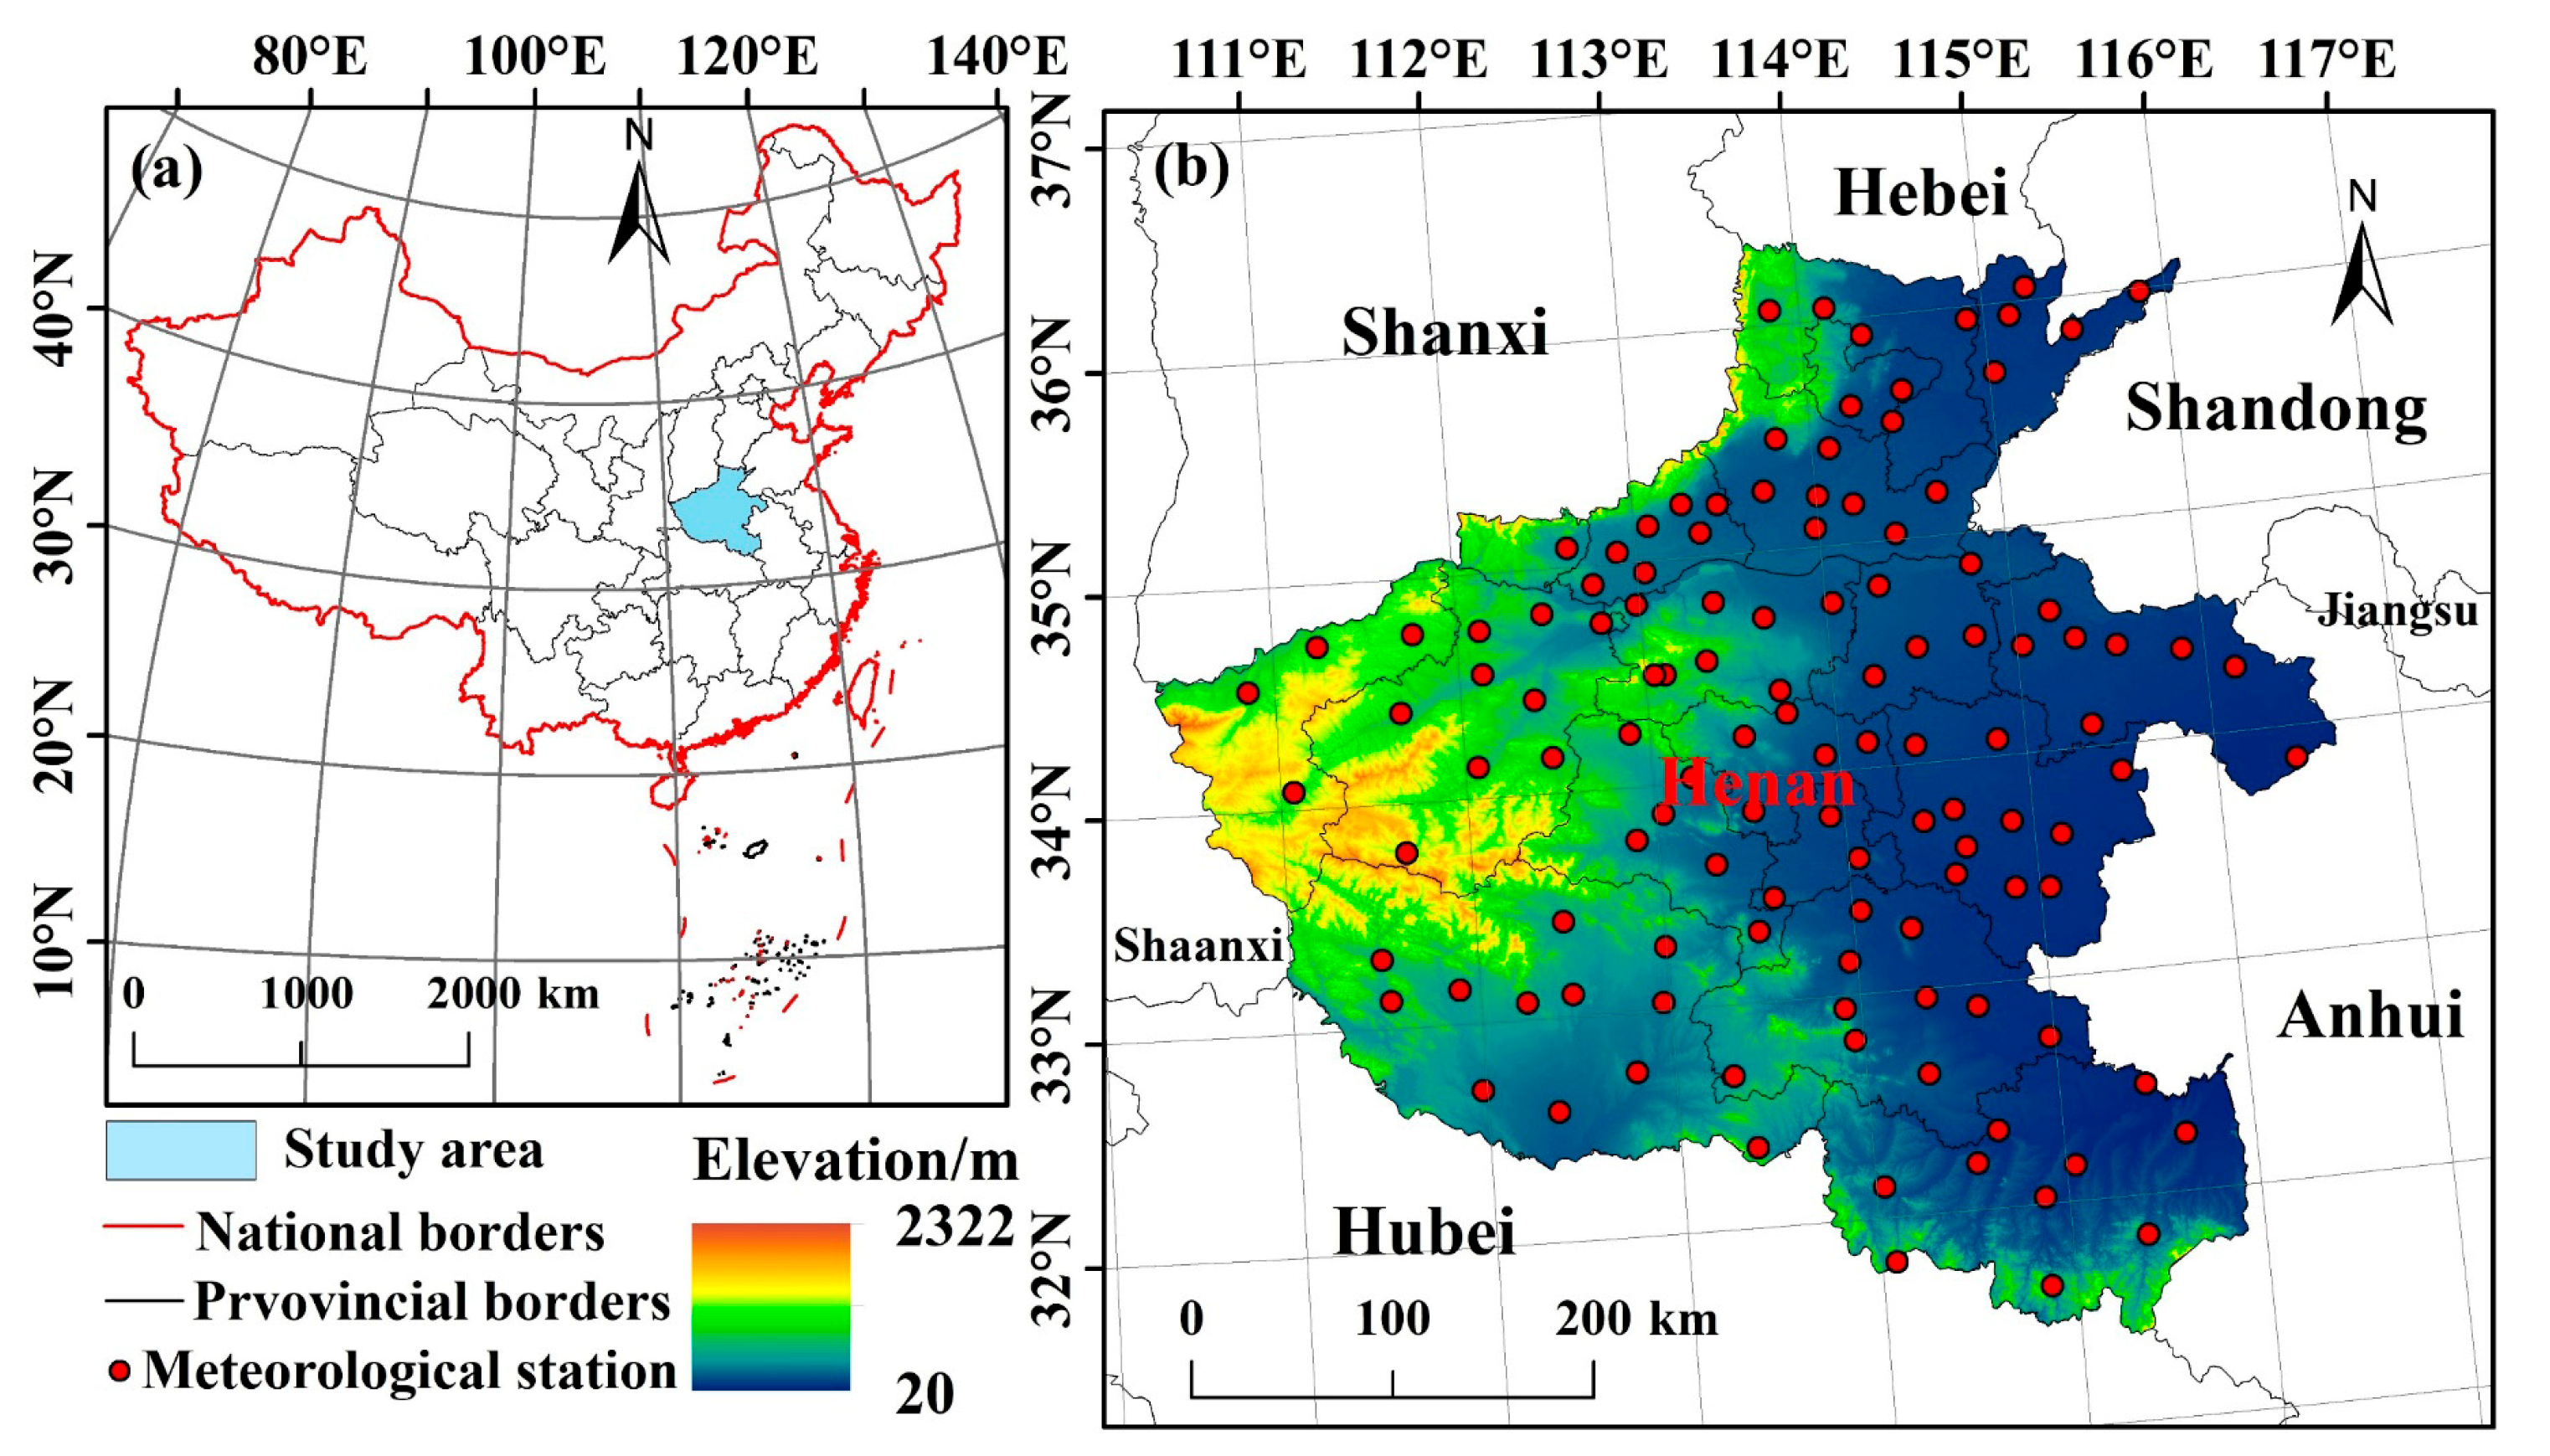
Henan Province is located in the central–eastern part of China, within the Huang-Huai-Hai Plain, with geographical coordinates ranging from 31°23′ N to 36°22′ N and 110°21′ E to 116°39′ E; it covers a total area of approximately 167,000 km2 (Figure 1). The terrain is higher in the west, consisting mainly of mountains and hills such as the Taihang, Funiu, and Dabie Mountains. The eastern part has lower terrain and comprises the vast Huaihe River Plain and Nanyang Basin. The diverse topography influences the spatial distribution of near-surface air temperature and heat transfer processes. The province has a warm temperate monsoon climate, characterized by an annual average temperature of 12.8–15.5 °C and precipitation of 500–900 mm, which decreases from southeast to northwest. It experiences four distinct seasons, with hot and rainy summers (average temperature 25–28 °C; precipitation 400–600 mm). As a major area of grain production in China, Henan Province has its summer maize primarily planted in the central–eastern plains. Summer maize is typically sown in early June and harvested in late September, with a growth period of 100–120 days. Flowering occurs sequentially from late July to early August, progressing from south to north, and generally concludes by August 10 in most parts of the province.

2.2. Data

2.2.1. Meteorological Station Data

The hourly temperature observation data used in this study were obtained from the National Meteorological Information Center of the China Meteorological Administration. The data cover the period from 21 July to 10 August for each year from 2011 to 2024. This dataset exhibits high spatiotemporal resolution and good continuity, providing reliable ground-truth support for both constructing and validating the remote sensing-based near-surface air temperature inversion model and the summer maize flowering period HTDI model. A total of 119 national meteorological stations are currently operational in the province. Their relatively even distribution enables them to represent the climatic characteristics of different terrain types and agricultural ecological zones effectively. The spatial distribution of these stations within Henan Province is shown in Figure 1.

2.2.2. Himawari-8 Data

The remote sensing data used in this study come from the Himawari-8 geostationary meteorological satellite operated by the Japan Meteorological Agency. The satellite has been in official operation since 2015, with a temporal resolution of 10 min and spatial resolutions of 2 km and 5 km [19]. It is equipped with 16 multi-spectral bands covering visible light, near-infrared, mid-infrared, and thermal infrared, making it suitable for various atmospheric and surface parameter inversions [20]. This study selected hourly data (at the start of each hour) from 21 July to 10 August in 2023 and 2024, mainly using products with a resolution of 2 km, including thermal infrared bands 11, 13, 14, and 15. Data were accessed from the “P-Tree System” platform of the Japan Aerospace Exploration Agency, and preprocessing included necessary band selection, reprojection, and resampling.

2.2.3. ERA5 Data

The reanalysis meteorological data used in this study were obtained from the ERA5-Land dataset (ECMWF/ERA5_LAND/HOURLY) produced by the European Centre for Medium-Range Weather Forecasts (ECMWF). The data cover the period from 21 July to 10 August for both 2023 and 2024, with hourly temporal resolution and a spatial resolution of approximately 0.1° (about 11 km). Compared to its predecessor, ERA-Interim, the ERA5 dataset offers significant improvements in its representation of resolution and physical processes [21] and is widely used in high-precision meteorological analysis and modeling.
Based on previous research [15,22], multiple variables closely related to ground temperature were selected for ERA5 as input features. These include temperature_2m, dewpoint_temperature_2m, leaf_area_index_high_vegetation, leaf_area_index_low_vegetation, surface_net_solar_radiation, surface_solar_radiation_downwards, surface_thermal_radiation_downwards, surface_net_thermal_radiation, soil_temperature_level_1, and volumetric_soil_water_layer_1. Collectively, they represent key drivers of surface temperature across three categories: radiation, soil moisture and thermal conditions, and vegetation.

2.2.4. Other Data

This study also utilized several auxiliary datasets: spatial distribution data for maize planting in Henan Province, a digital elevation model (DEM), and administrative boundary vector data for the province. The maize spatial distribution data were sourced from the “National Maize 500 m Resolution Spatiotemporal Distribution Dataset” [23], provided by the National Geographic Resource Science SubCenter. These data were used to mask the inverted temperature grid, thereby extracting hourly near-surface air temperature information specifically for maize-planting areas. The DEM data uses the SRTM 30 m resolution elevation product released by NASA to introduce terrain factors as auxiliary variables for the temperature inversion model. Administrative boundary vector data for Henan Province (at provincial, city, and county levels) were obtained from the official 2024 dataset (map approval number: GS (2024) 0650) and were used for boundary extraction and regional clipping. In addition, data on maize ear grain numbers during the flowering period, statistically collected across Henan Province from 2011 to 2023, were used to establish the HTDI based on hourly data.

2.2.5. Data Preprocessing

Since the remote sensing data used in this study were obtained from multiple platforms with different spatial resolutions and coordinate systems, uniform spatiotemporal processing of various data was required before model construction. All remote sensing data preprocessing was completed using Python 3.12, including clipping, projection transformation, time alignment, and spatial resolution unification to ensure consistency between different data sources in spatial and temporal dimensions. For datasets with varying resolutions (e.g., Himawari-8, ERA5, maize distribution, and DEM), resampling was uniformly conducted using the bilinear interpolation method. All data were standardized to a spatial resolution of 0.02° × 0.02° (approximately 2 km × 2 km), providing a foundation for subsequent temperature inversion modeling and maize area extraction.

3. Method

3.1. Construction of Machine Learning-Based Near-Surface Air Temperature Model

3.1.1. Feature Extraction and Sample Generation

This study ultimately selected 15 feature variables (Table 1) from the multi-source data described in Section 2.2 (including Himawari-8, ERA5, and DEM data) to construct the training samples required for the machine learning model. The 15 features were selected based on their established physical relationship with near-surface air temperature, as supported by prior research [15,22]. Python 3.12 scripts were used to match preprocessed grid data (spatial resolution of 0.02° × 0.02°) with hourly observed temperatures from 119 national meteorological stations in Henan Province. The 119 meteorological stations were mapped to grid files, and their row and column numbers were located; all input feature values were extracted according to these indices. Then, the input features and temperature records were matched by observation time. To ensure data quality, strict quality control was implemented on the generated “feature–target” sample set, removing records containing null values, setting physically reasonable thresholds for temperature and key radiation variables to exclude abnormal samples beyond reasonable ranges. After the above processing, the final cleaned sample dataset was obtained, covering meteorological data from 21 July to 10 August in 2023 and 2024, with approximately 59,000 valid samples per year, providing a reliable data foundation for subsequent model training.

3.1.2. Model Construction

Three regression models, support vector regression (SVR), RF, and XGBoost, were selected to compare the performance of different machine learning algorithms for near-surface air temperature inversion, and to help provide high-precision temperature retrievals for monitoring high-temperature heat damage during the summer maize flowering period. All three models are based on the Python platform, using scikit-learn (SVR, RF) and the XGBoost library, respectively. Their inversion accuracies were evaluated using training and testing sets.
SVR, as a regression variant of the support vector machine, maps input features into a high-dimensional space via kernel functions and defines an optimal hyperplane for regression analysis. This method demonstrates excellent generalization capability for small-sample and high-dimensional data and has been widely used in estimating meteorological elements and modeling environmental variables [24]. However, SVR is sensitive to the choice of kernel function and hyperparameters, and its training efficiency is relatively low with large-scale datasets. RF enhances model stability and accuracy by building a large number of decision trees and aggregating their predictions. It possesses strong anti-noise characteristics and nonlinear modeling capability and has been widely used in land surface temperature estimation and meteorological variable inversion [25]. RF can automatically evaluate feature importance, with low parameter tuning requirements, although high-dimensional data scenarios have large computational resource overheads. By contrast, XGBoost employs a gradient-boosted decision tree algorithm, combined with parallel computing and regularization strategies, which significantly improves training speed and model generalization ability. Its processing ability for large-scale, multi-source data is particularly outstanding, especially in capturing complex nonlinear relationships [26,27].
The high-quality sample dataset of approximately 59,000 instances generated in the previous section was randomly split into a training set and a testing set in an 80:20 ratio. All three models were then trained using their default parameters. Model performance was comprehensively evaluated on the testing set using the coefficient of determination (R2), root mean square error (RMSE), and mean absolute error (MAE). The evaluation results will provide a basis for subsequent model selection and inversion applications.

3.2. High-Temperature Heat Damage Evaluation Method

3.2.1. Selection of High-Temperature Indices During Summer Maize Flowering Period

According to maize cultivation data in China, 77.7~84.5% of flowering occurs 2~5 days after tasseling and lasts for 3 to 4 days; tasseling generally spans 7~10 days [12]. July 21 to August 10 was the study period selected to accommodate regional climate conditions and the growth characteristics of the main cultivars in Henan Province.
The main thresholds used for HTDI screening during the flowering period were daily maximum temperature, including high-temperature days and cumulative temperatures exceeding 32 °C and 35 °C, to evaluate the impact of high temperature on pollen viability and fertilization rate in existing studies [8,9,28]. To more finely characterize the intensity of high-temperature heat damage, this study replaces high-temperature days with high-temperature hours and the cumulative daily highest temperature with cumulative hourly temperatures exceeding 32 °C and 35 °C to evaluate the degree of heat damage during the high-temperature summer maize flowering period. This indicator can reflect the duration and intensity of high temperatures on an hourly scale, an important reference value for formulating refined warning levels.
To ensure the reliability of subsequent correlation analysis between these indices and yield, data quality control was performed on the observed ear grain number records. This process involved removing outliers and samples with missing data, resulting in 210 valid samples for the final statistical analysis (Section 4.2.1).

3.2.2. Assessment of High-Temperature Heat Damage During Summer Maize Flowering Period

The high-temperature hours (HH), total heat (TH), and high-temperature frequency (HF) during the summer maize flowering period were statistically calculated for each grid cell in this study. Measurements were based on the hourly near-surface air temperature dataset obtained during the process described in Section 3.1. High-temperature hours are defined as the total number of hours where temperature ≥ T 0 (32 °C or 35 °C) during the flowering period, denoted as HH 32 , HH 35 ; TH is defined as the sum of all hourly temperatures satisfying T h T 0 during this period, denoted as TH 32 , TH 35 . HF is defined as the proportion of high-temperature hours compared to the total effective hours, and is used to measure the relative frequency of high-temperature events, denoted as HF 32 , HF 35 . This indicator can directly reflect the heat load of high-temperature events on the summer maize flowering period [29]. The formulas are as follows:
HH T 0 = h = 1 N I , T h T 0
TH T 0 = h = 1 N T h , T h T 0
HF T 0 = HH T 0 N
where I is the indicator function, which is 1 if the condition is met and 0 otherwise; T h is the temperature at the h hour; N is the effective hours for the grid (excluding missing records).
To more accurately reflect the relative severity of high-temperature conditions in different years, this study normalized the above six indicators (three each for ≥32 °C and ≥35 °C) based on hourly temperatures from 21 July 2011 to 10 August 2024 over the past 14 years in Henan Province. Min–max standardization is used to ensure comparability between different indicators. The average related indicators ≥32 °C and ≥35 °C for each station each year were employed to obtain the HTDI for ≥32 °C and ≥35 °C, denoted as H T D I 32 and H T D I 35 , respectively:
HTDI 32 = HH 32 * + TH 32 * + HF 32 * 3
HTDI 35 = HH 35 * + TH 35 * + HF 35 * 3
In the formula, indicators with “*” represent normalized values.
Considering that temperatures above 35 °C have a more severe impact on maize pollen viability and seed setting rate [12], this study adopted differential weighting for the two groups of indicators, determining that the weight for HTDI 32 is 0.4 and HTDI 35 is 0.6 through trial and error. The HTDI is calculated as shown in Formula (6), with the range of values for this indicator being 0–1; the larger the value, the higher the risk of heat damage.
HTDI = 0.4 × HTDI 32 + 0.6 × HTDI 35

4. Results

4.1. Near-Surface Air Temperature

4.1.1. Evaluation of Near-Surface Air Temperature Model

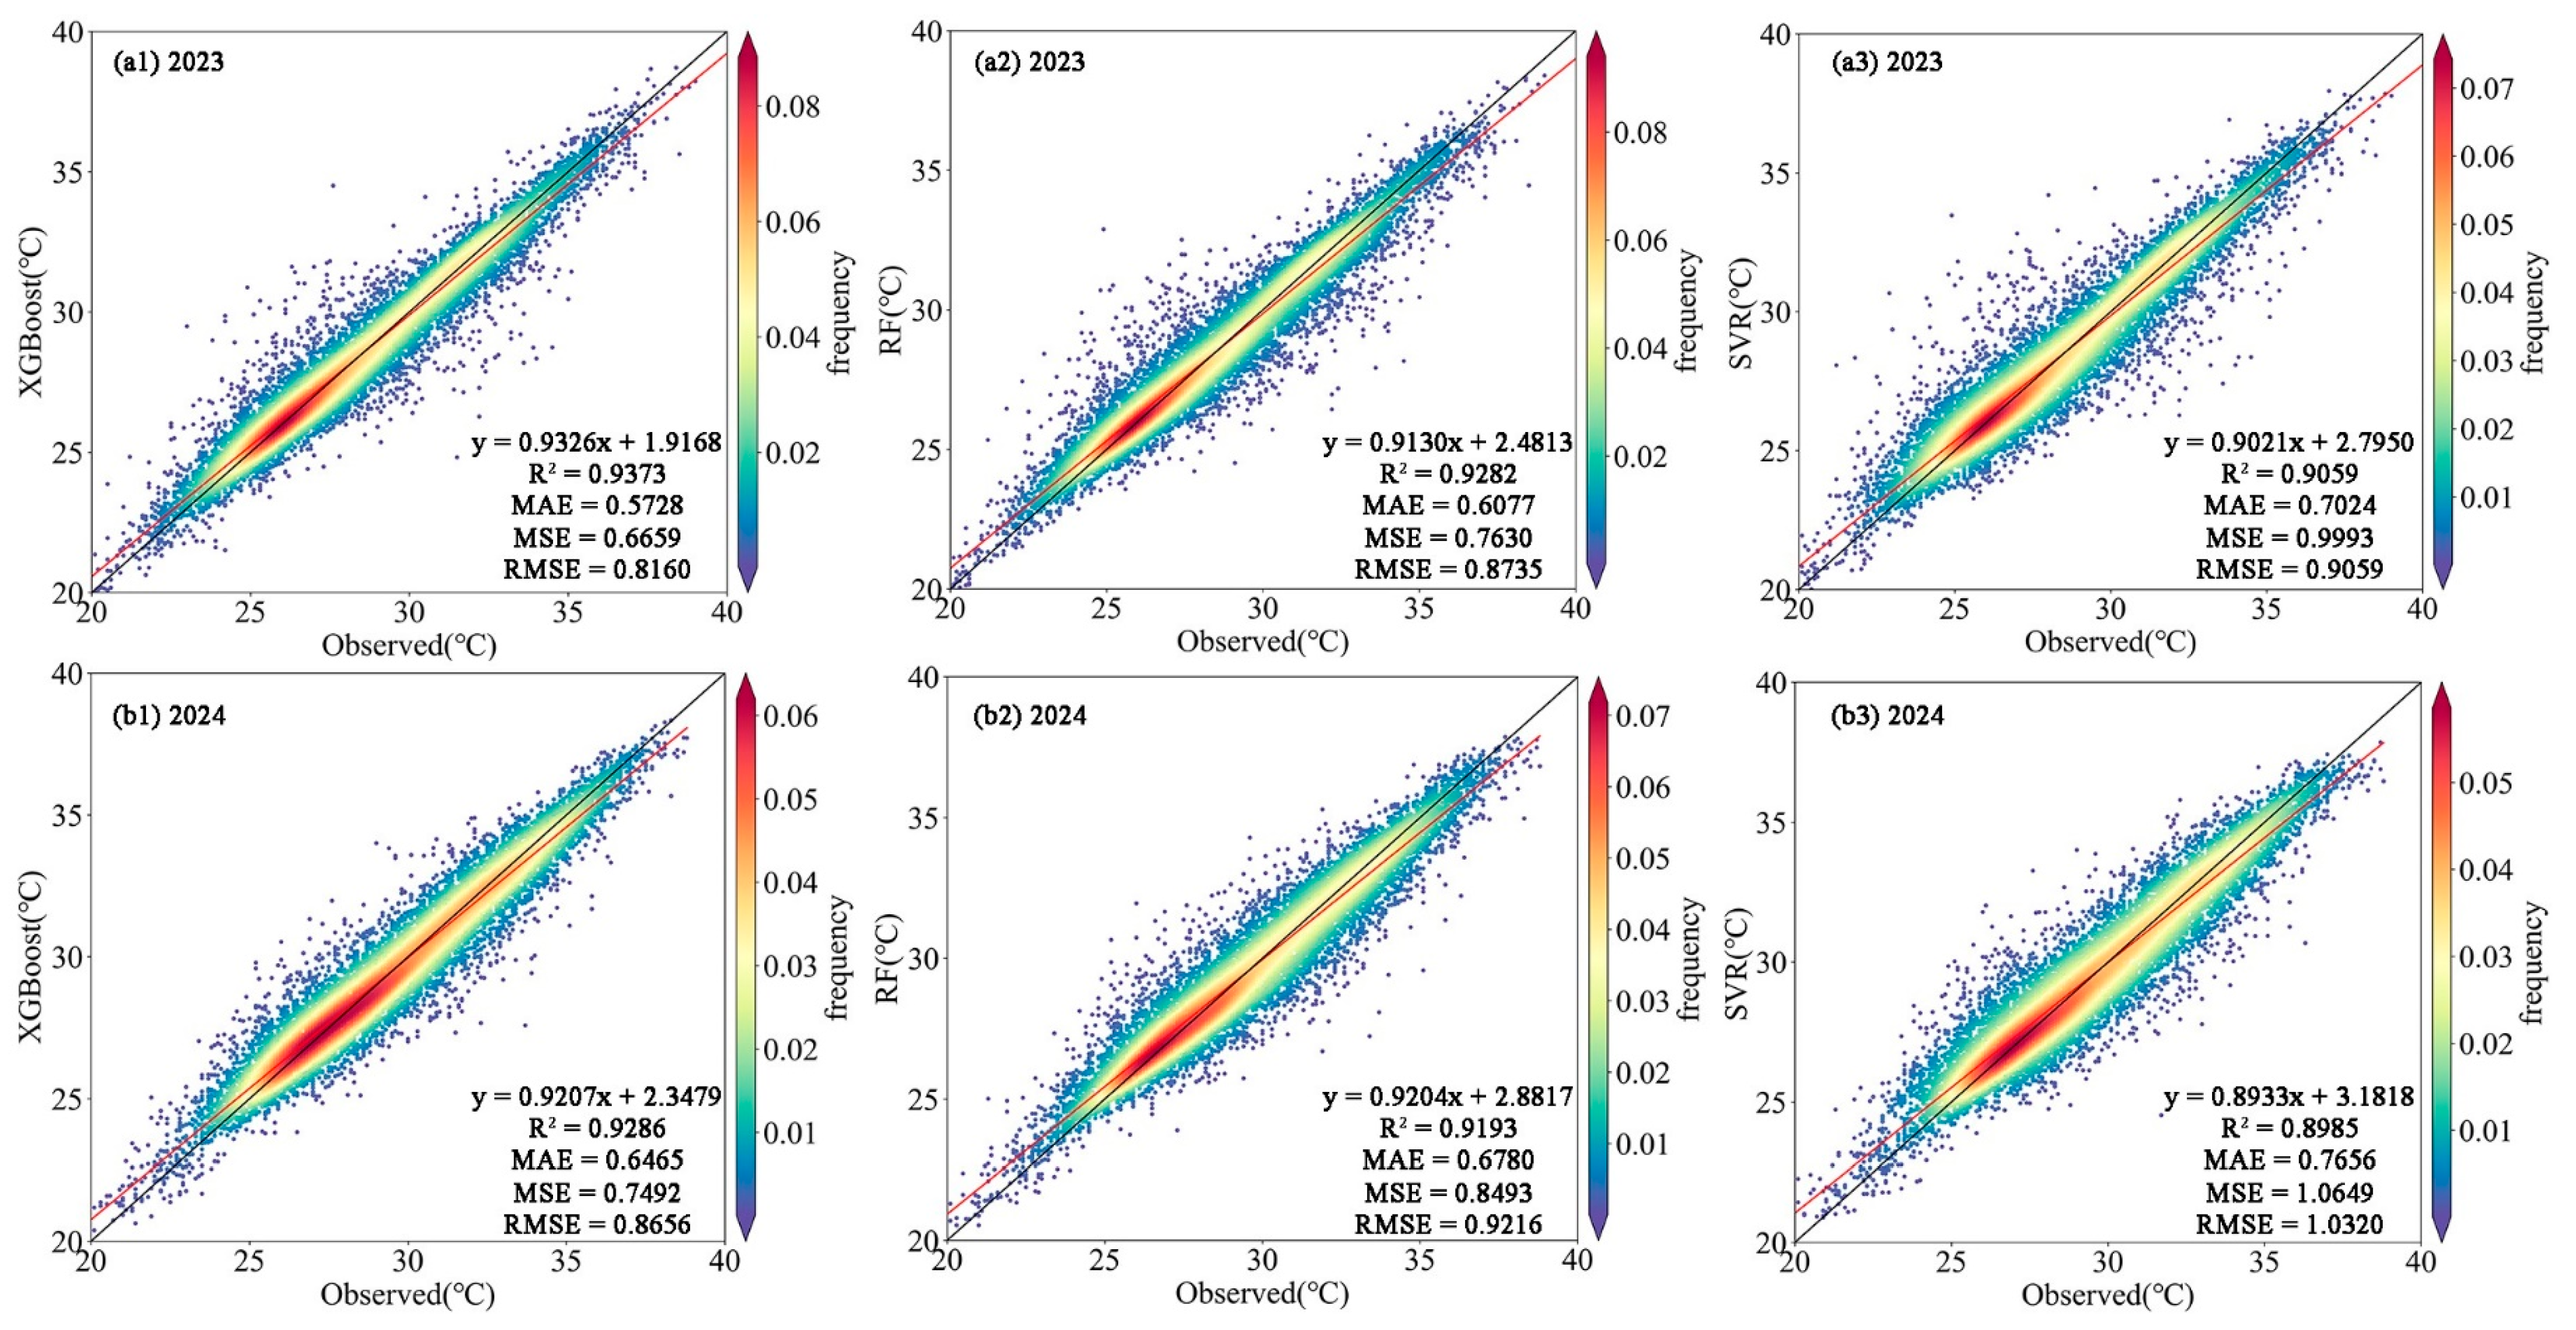
The results are shown in Figure 2 and Table 2. The XGBoost model performed best for all indicators, with a comprehensive slope of 0.9267, R2 of 0.9330, MAE of 0.6097 °C, MSE of 0.7076 (°C)2, and RMSE of 0.8408 °C, superior to RF (R2 of 0.9238, MAE of 0.6429 °C) and SVR (R2 of 0.9022, MAE of 0.7340 °C). The density scatter plot shows that the predicted values of XGBoost are closest to the observed values with a concentrated scatter distribution, indicating its high accuracy under complex meteorological conditions. From the inter-annual changes, the model’s performance in 2023 was slightly better than in 2024: for instance, the MAE of XGBoost increased from 0.5728 °C in 2023 to 0.6465 °C in 2024. XGBoost demonstrates strong adaptability and robustness to multi-source data fusion because of its gradient boosting framework, making it suitable for high-precision inversion tasks. The performance of RF and SVR decreases sequentially, with SVR performing worse under extreme temperature conditions. The high accuracy of XGBoost provides reliable support for subsequent high-temperature monitoring during the summer maize flowering period.
To rigorously assess the model’s capacity for temporal generalization, we conducted a cross-year validation. This approach directly simulates applying a model from one year to the independent samples of another year. Concretely, we used the pre-trained 2023 model to predict all 2024 samples, and the pre-trained 2024 model to predict all 2023 samples. A complete comparison of within-year and cross-year performance is presented in Table 3.
The cross-year validation provides a conservative yet realistic performance estimate (mean R2 ≈ 0.71, RMSE ≈ 1.72 °C) for forecasting applications, in contrast to the optimistic estimate from the within-year validation (mean R2 ≈ 0.93, RMSE ≈ 0.84 °C). This marked difference confirms the presence of a spatiotemporal autocorrelation that inflates performance when training and testing data are drawn from the same year and period. Crucially, the cross-year results demonstrate that the model retains substantial predictive power (R2 > 0.70) even when applied to a fully independent year. This level of accuracy is sufficient to reliably capture the relative spatial patterns and inter-annual variations in high-temperature exposure that are central to heat damage analysis. The consistency between the two cross-validation directions underscores the robustness of this conclusion. Given its superior and stable performance across all validations, the XGBoost model was selected for subsequent spatial inversion.
To enhance model interpretability, SHAP analysis revealed that predictions of the XGBoost model were primarily driven by ERA5’s T2M (40.2%), Himawari-8’s B11 (11.01%), and ERA5’s DL (9.29%) (Table 4), which is consistent with the physical mechanism of temperature formation. An examination of station-level prediction errors indicated relatively uniform performance across the plains where summer maize is predominantly cultivated, with slightly higher variability observed in western mountainous areas.

4.1.2. Inversion Results of Near-Surface Air Temperature

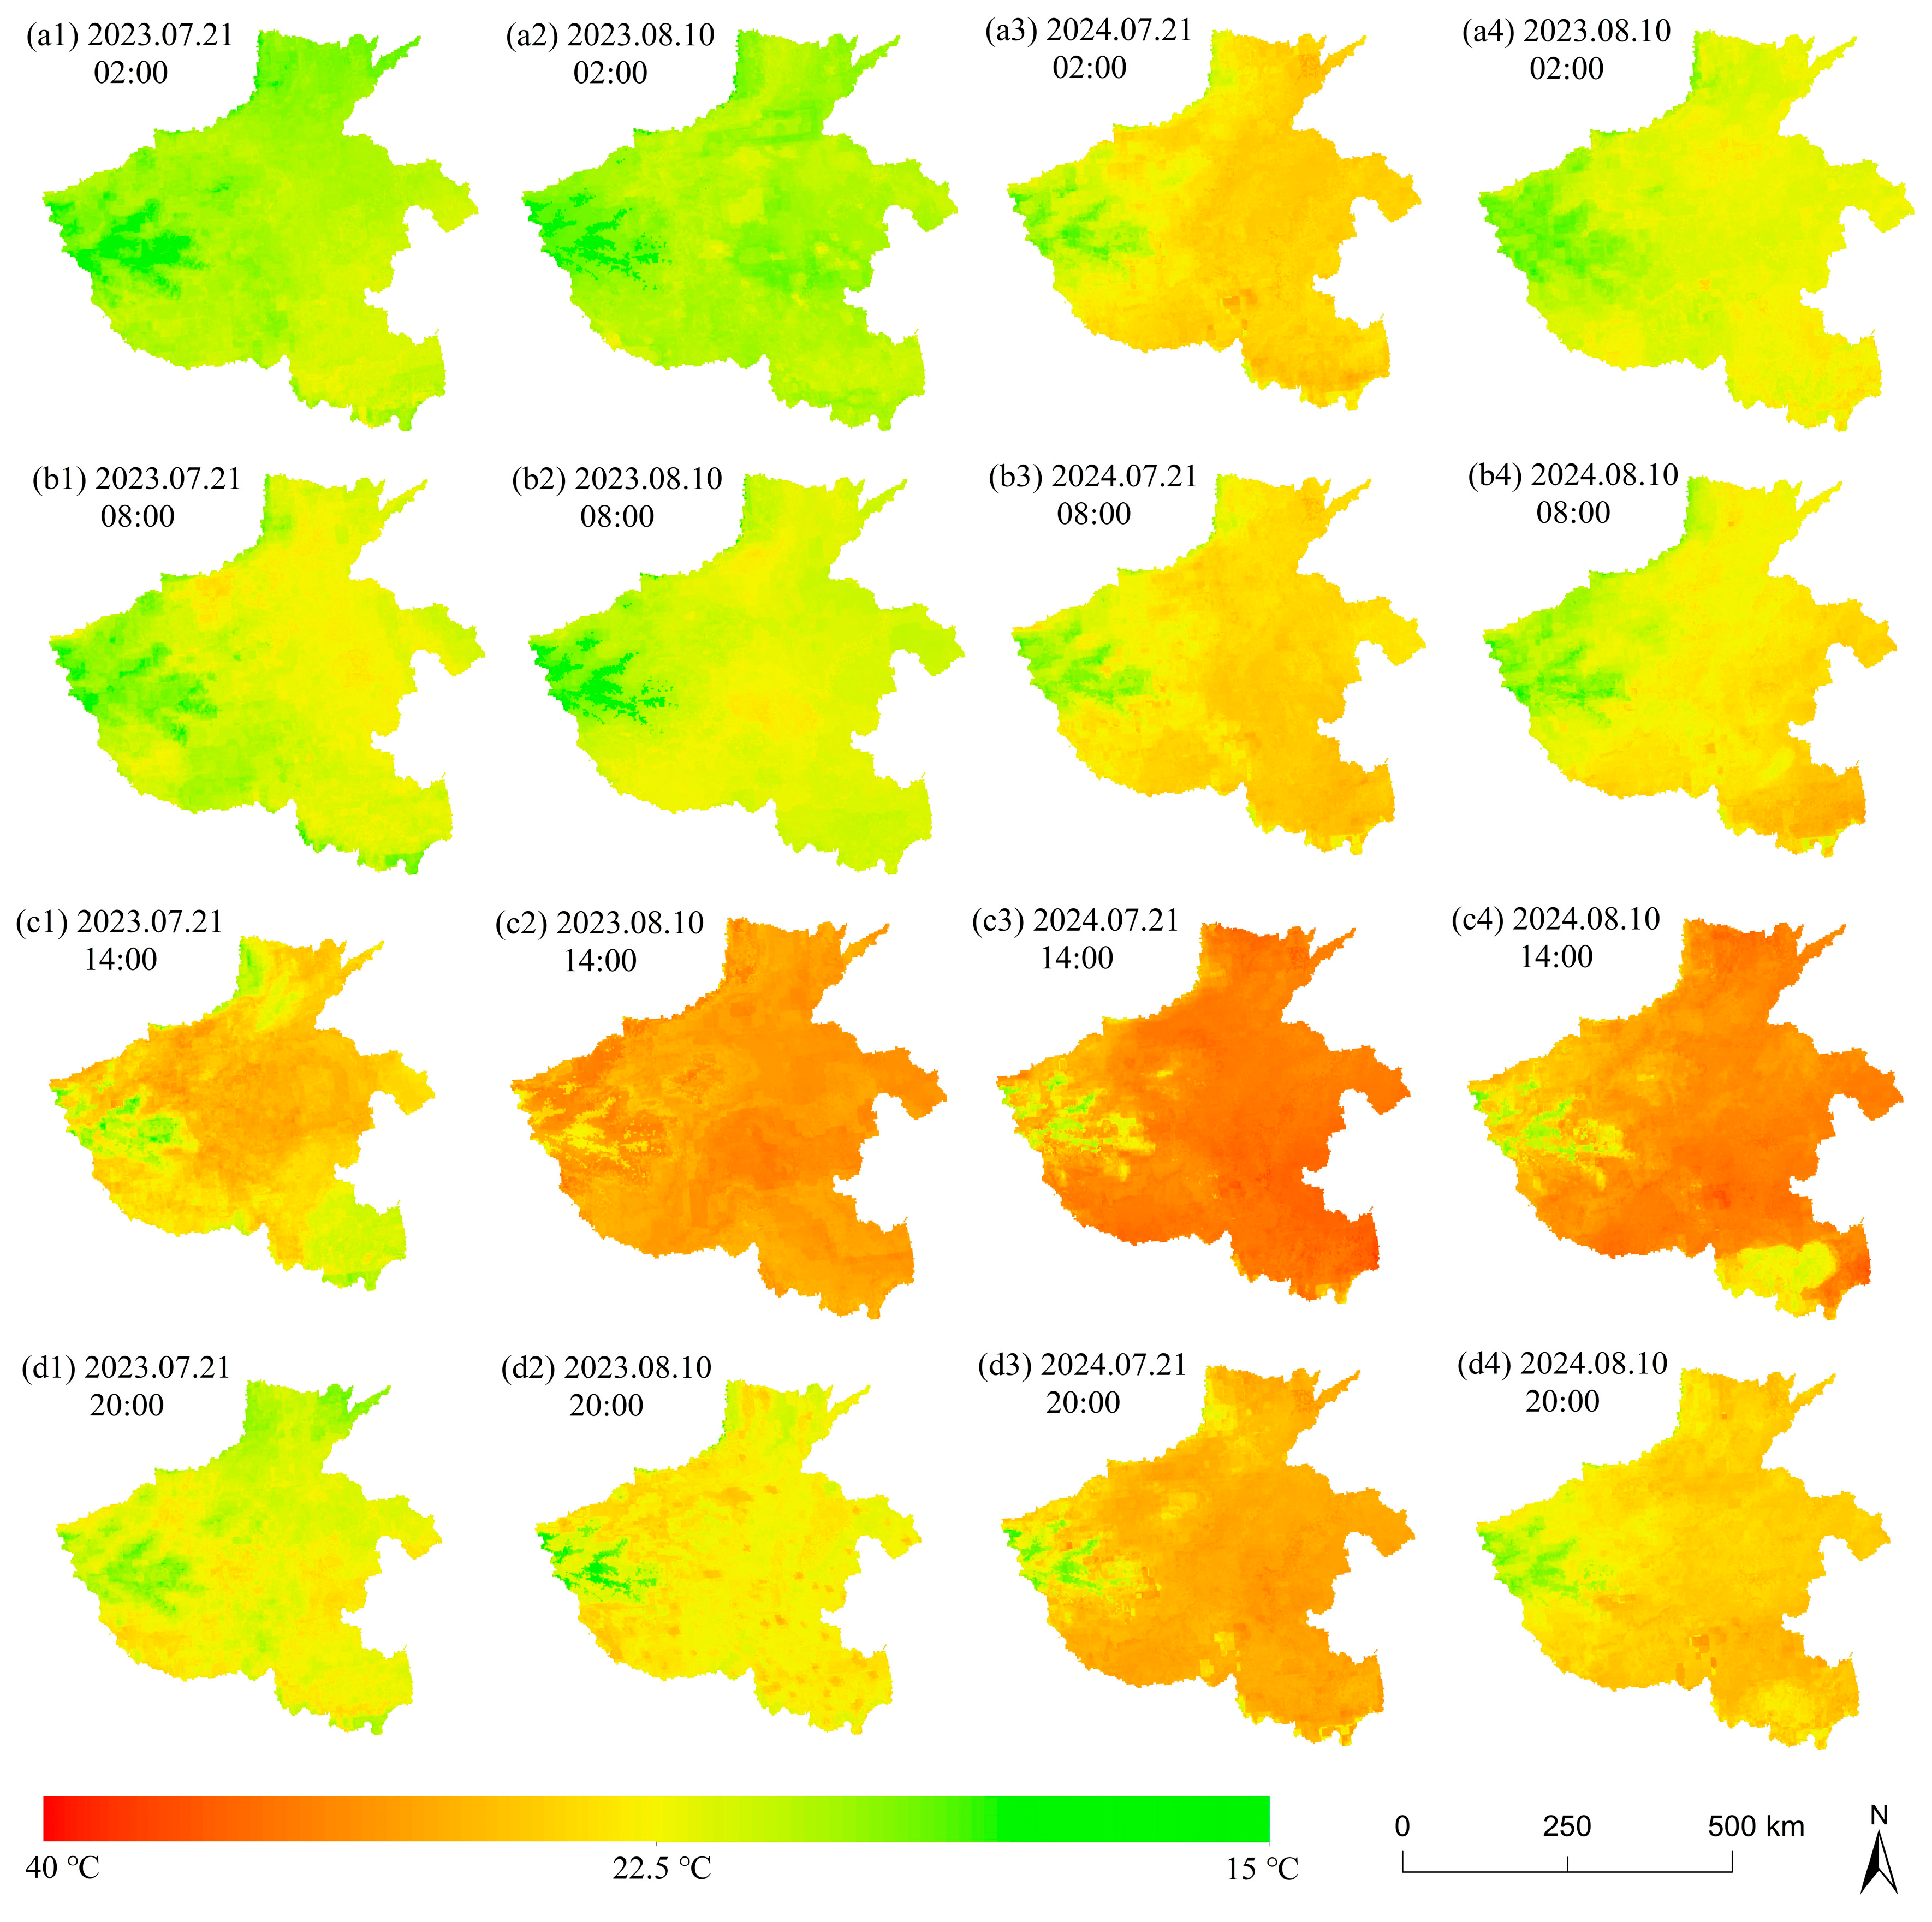
Based on the XGBoost model, which achieved an overall accuracy with a mean R2 of 0.9330, MAE of 0.6097 °C, and RMSE of 0.8408 °C (Table 2), the spatial distribution of hourly near-surface air temperature during the summer maize flowering period (21 July to 10 August) in 2023 and 2024 was inverted, and the results are shown for the representative times of 02:00, 08:00, 14:00, and 20:00 in Figure 3. The near-surface air temperature spatial distribution shows clear regional characteristics in Henan Province, with higher temperatures in the southeast and relatively lower temperatures in the west and north. Daytime temperatures are generally about 10 °C higher than at nighttime, reflecting significant diurnal temperature variations. In addition, the near-surface air temperature during the summer maize flowering period in 2024 (29.10~30.50 °C) was about 2 °C higher than in 2023 (27.10~28.50 °C), so heat damage during the summer maize flowering period would be greater in 2024.

4.2. Assessment of HTDI During the Summer Maize Flowering Period

4.2.1. Correlation Analysis Between HTDI and Ear Grain Number

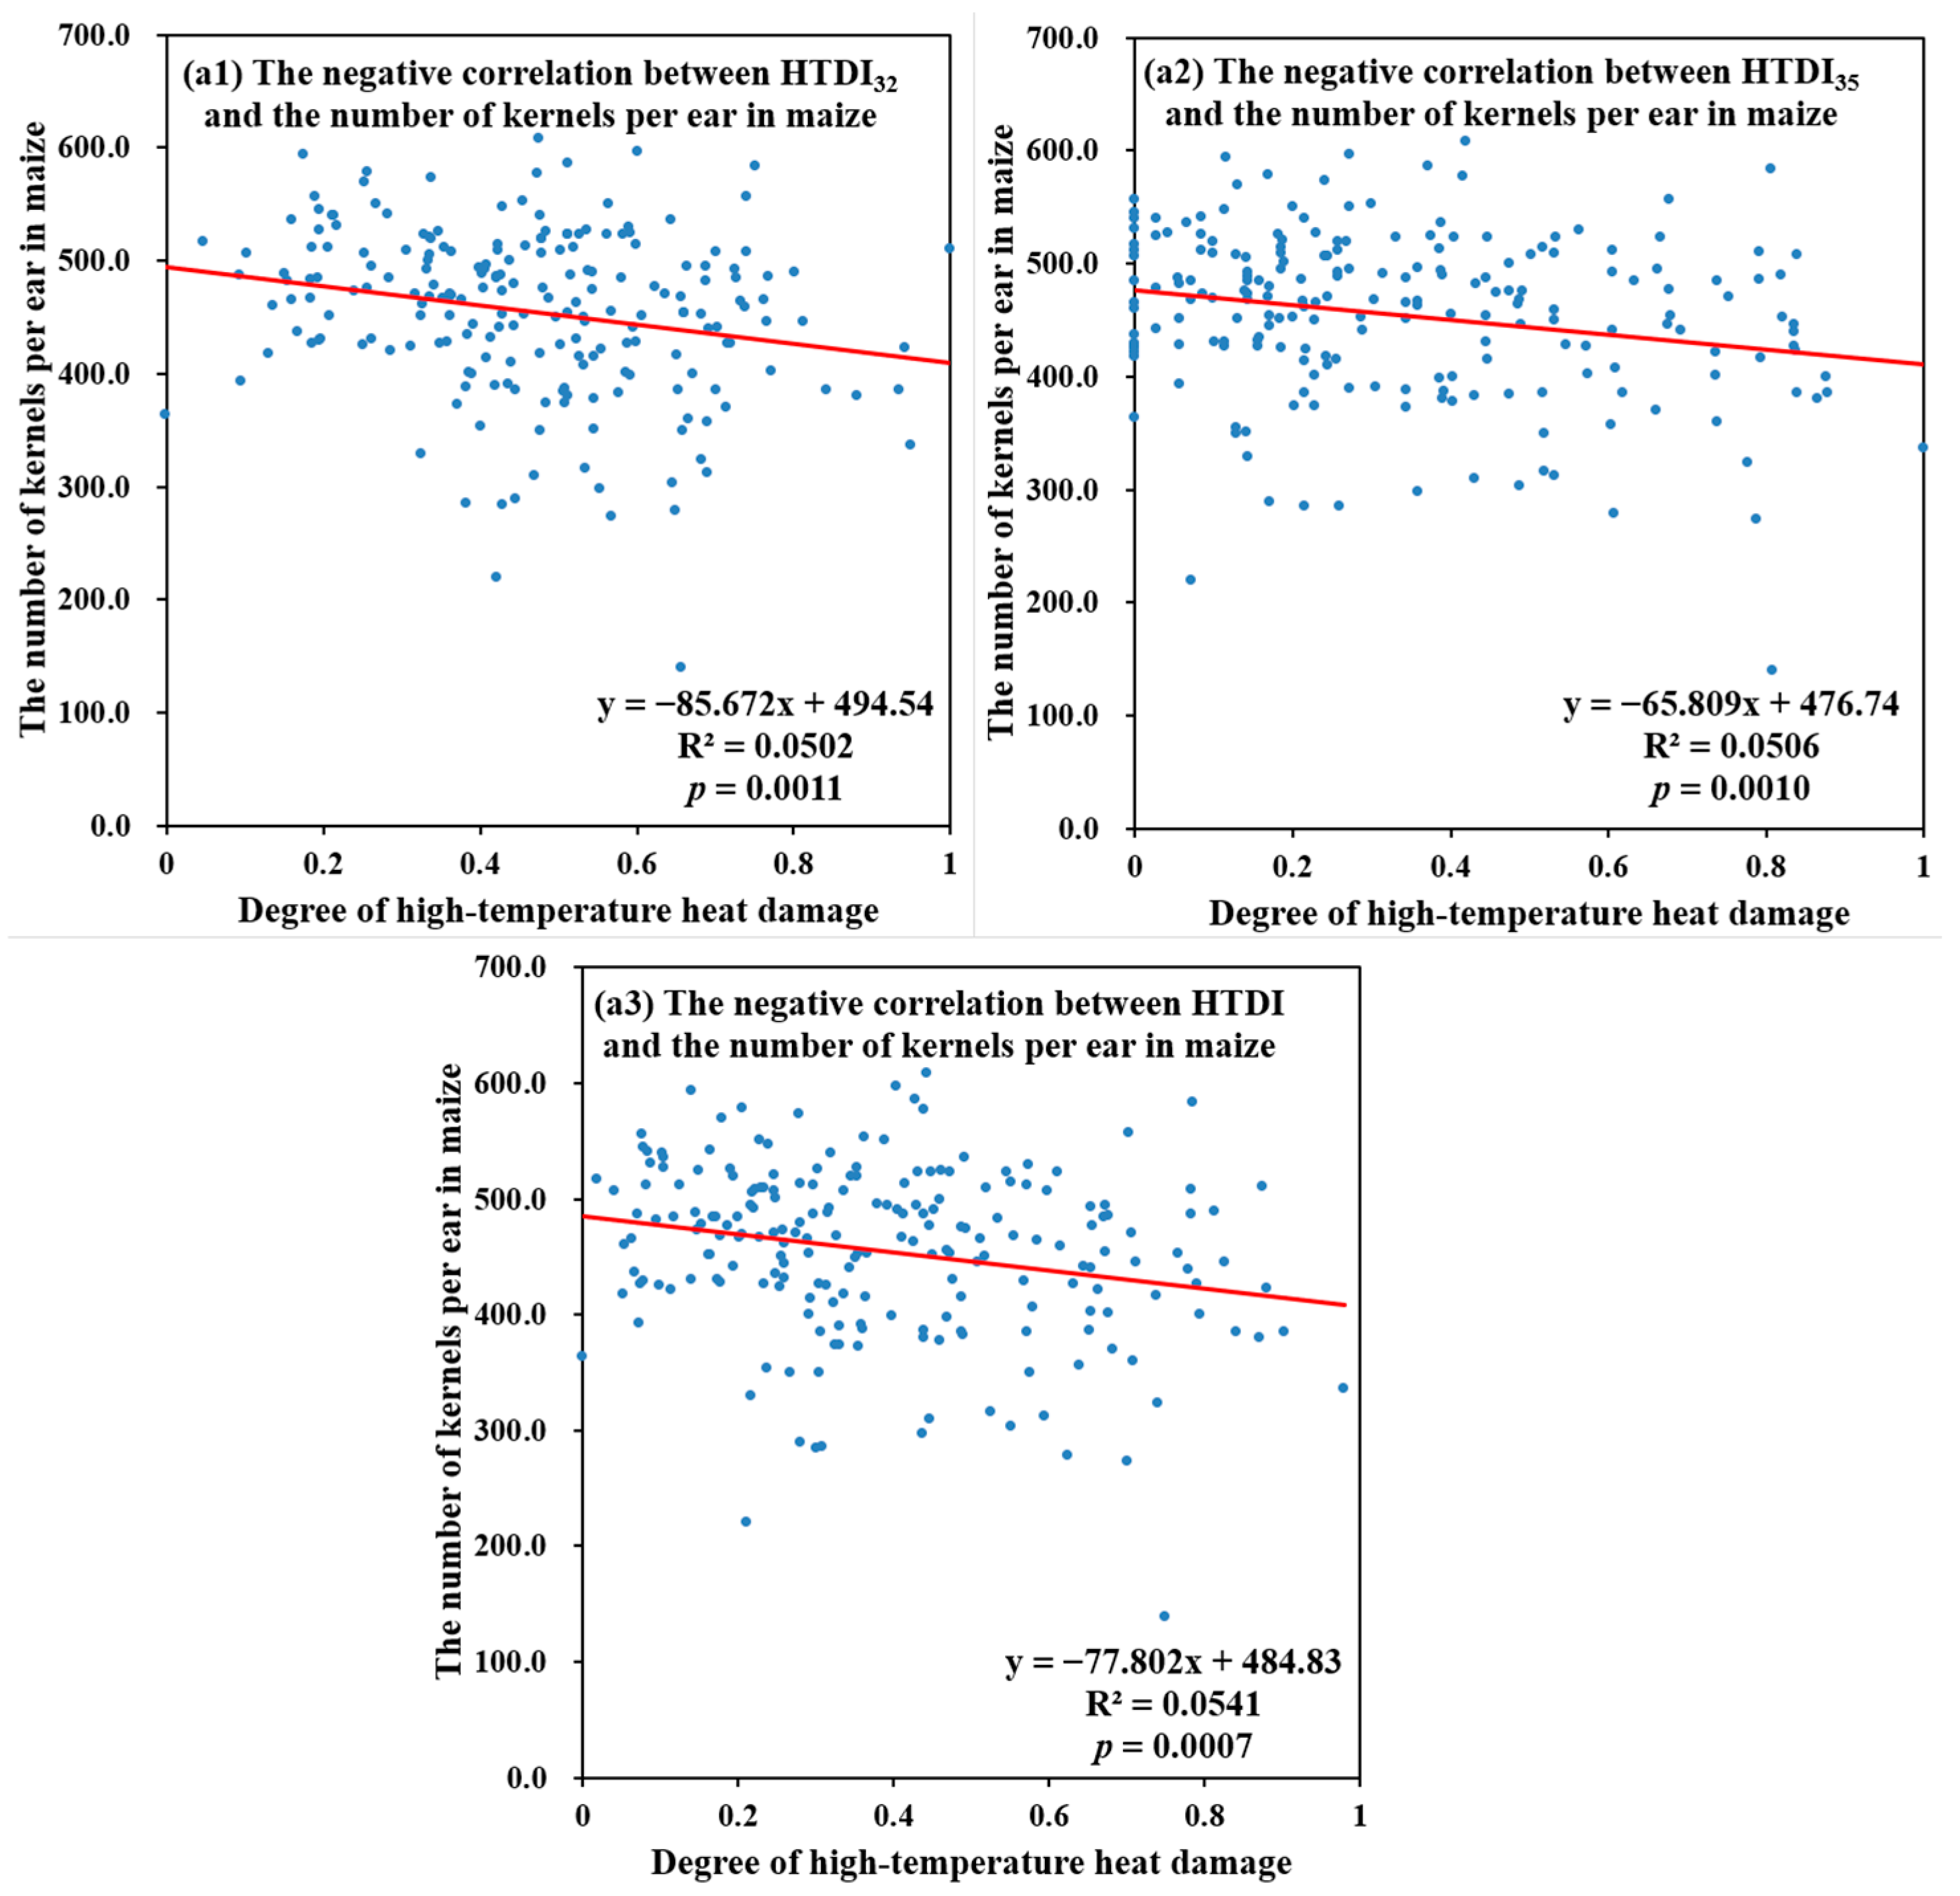
Correlation analysis between hourly temperature data from 21 July to 10 August in 2011 to 2024 and the corresponding data of maize ear grain numbers from 18 agrometeorological stations in Henan Province were adopted to quantitatively assess the impact of high-temperature heat damage during the flowering period on summer maize yield. Based on 210 valid samples (after quality control; see Section 3.2.1), a significant negative correlation was identified. Each sample corresponded to an ear grain number and a set of indicators, reflecting high-temperature damage during the flowering period (i.e., HTDI 32 , HTDI 35 , and HTDI ).
Linear regression relationships between different high-temperature indicators and ear grain number were calculated based on the samples. Scatter plots with regression lines and corresponding regression statistics are shown in Figure 4. The results show that THDI32, THDI35, and HTDI have an extremely significant negative correlation with grain number. HTDI 32 was correlated with a fitting slope of −85.672 and a coefficient of determination of R2 = 0.0502 at a significance level of p = 0.0011; HTDI 35 was correlated with a slope of −65.809, R2 = 0.0506, and p = 0.0010; HTDI showed the most significant correlation with a slope of −77.802, R2 = 0.0541, and p = 0.0007. The significance level (p value) of the regression coefficients and the model’s goodness of fit (R2) indicate that high temperatures during the flowering period have an obvious inhibitory effect on maize seed setting rate. This statistically robust relationship confirms the index’s effectiveness in capturing the spatial patterns and inter-annual variability of heat stress that impact yield. Due to the multiple temperature thresholds and high-temperature intensities considered in this study, HTDI shows the strongest correlation and discrimination ability among the three models, and can more effectively quantify the damage of high-temperature heat to maize yield.

4.2.2. Spatiotemporal Patterns of Heat Damage Based on the HTDI During Summer Maize Flowering Period of Henan Province (2023 and 2024)

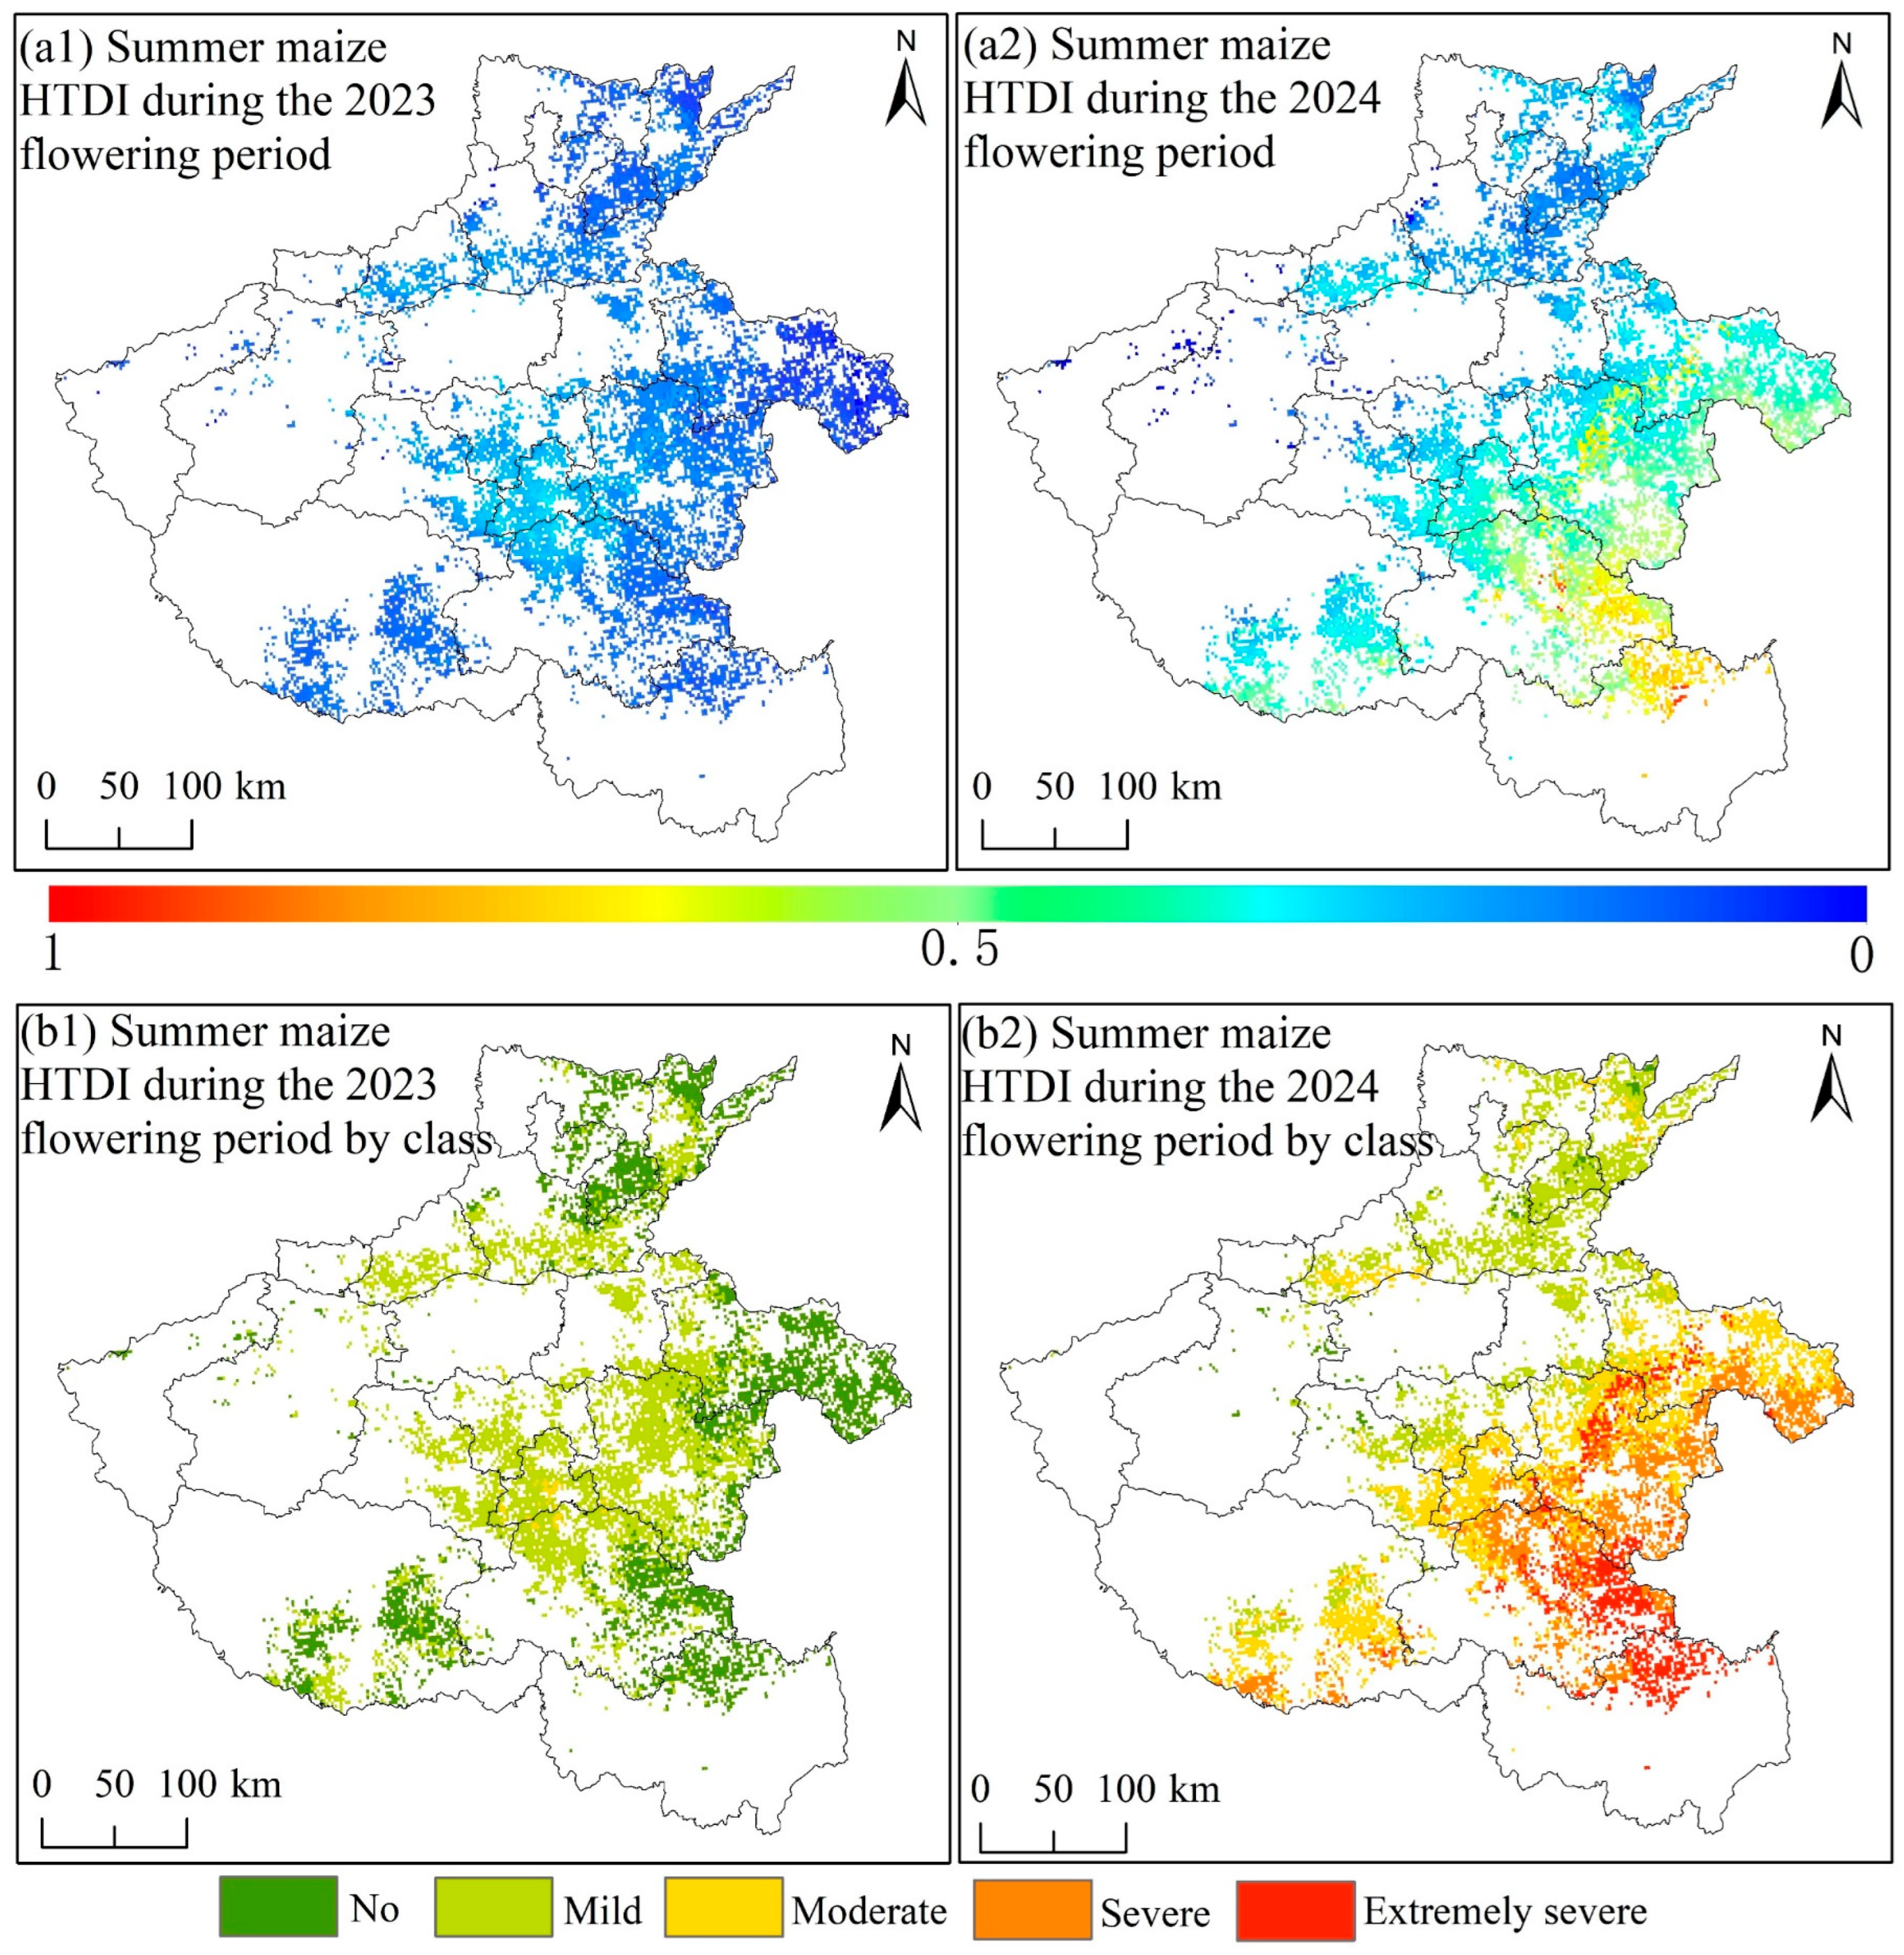
The HTDI was calculated for the summer maize flowering period in 2023 and 2024, based on near-surface air temperature data (Section 4.1) in maize planting areas. The calculation results are shown in Figure 5(a1,a2). To more intuitively display the distributions of various heat damage levels, this study divided the HTDI into five levels: “no heat damage [0–0.2), mild heat damage [0.2–0.4), moderate heat damage [0.4–0.6), severe heat damage [0.6–0.8), and extremely severe heat damage [0.8–1.0]”. Graded rendering was also performed on the spatial results of the HTDI in 2023 and 2024, as shown in Figure 5(b1,b2).
As shown in Figure 5 and Table 5, the pixel values of the HTDI during the summer maize flowering period in 2023 ranged from 0.05 to 0.48, with an average of 0.22 in the maize areas of the province. The overall degree of heat damage was mild. Most areas had lower HTDI values, with 44% of areas not having any heat damage. These areas were mainly distributed in the cities of Shangqiu and Kaifeng in eastern Henan, Puyang City in the north, and Nanyang City in the southwest. Most other areas experienced mild heat damage, accounting for 55.14%. Overall, more than 95% of the summer maize distribution areas in Henan Province experienced mild heat damage at low levels in 2023. By contrast, the spatial pattern of the HTDI during the summer maize flowering period in 2024 changed significantly; the ranges of pixel values expanded to 0.01–1.00, and the regional average HTDI reached 0.51, showing significantly enhanced high-temperature stress levels. According to statistics, more than 67% of the maize areas in Henan Province were at moderate levels or above, with areas of extremely severe heat damage accounting for more than 11%. According to the spatial distribution, areas with moderate or higher levels of heat damage were mainly found in the central–south and central–east parts of Henan, with extremely severe heat damage in central–south Zhumadian, North Xinyang, and the central part of Zhoukou. The graded results further verify a general increase in heat damage levels in 2024, showing significant differences in inter-annual characteristics.

5. Discussion

5.1. Discussion of Near-Surface Air Temperature Inversion

This study has significantly improved the accuracy and efficiency of near-surface air temperature inversion through strict quality control and multi-source feature selection. The results show that different machine learning models exhibit notable variations in accuracy for the near-surface air temperature inversion task. For example, in the study by Sebbar et al. [29], XGBoost achieved R2 ≈ 0.99 and RMSE ≈ 0.83 °C, which was significantly higher than the performance of SVR (R2 ≈ 0.97 and RMSE ≈ 1.20 °C). Similarly, in the downscaling study of ERA5/CMIP6 low-resolution T-a in the Eastern Mediterranean by Blizer et al. [30], XGBoost also demonstrated superior performance in training efficiency and feature fusion. In addition, the comparative study based on FY-4A remote sensing data by Zhou et al. [31] showed that the XGBoost model can significantly reduce MAE and RMSE. These studies collectively indicate that the gradient boosting framework of XGBoost possesses a stronger ability to handle complex nonlinear relationships in near-surface air temperature inversion with multi-source remote sensing and meteorological auxiliary variables, making it an ideal model choice.
Compared to studies that applied Kriging interpolation, machine learning-based near-surface air temperature inversion demonstrates clear advantages in representing spatial distribution [32,33]. Multiple downscaling inversion studies have suggested that machine learning methods can integrate multi-source information, including satellite brightness temperature, meteorological reanalysis data, and terrain. The resulting temperature grids better reflect the spatial heterogeneity driven by terrain and reduce artifacts, such as the “bull’s-eye” effect or insufficient smoothing, which are often produced by traditional station-based interpolation methods [34,35,36]. The model performance in 2023 was slightly better than that in 2024, which may be influenced by inter-annual meteorological variations or data quality [37]. The inversion accuracy during the daytime (08:00, 14:00) was higher than at night (20:00, 02:00), which is consistent with the differences in thermal radiation signals between day and night [38]. The multi-channel brightness temperature data from Himawari-8 includes cloud information, which helps mitigate the negative effects of cloud interference on the inversion process. This makes the data derived from hourly temperature grids more reliable and superior to that from traditional station interpolation methods.
Compared with previous studies, the hourly grid data produced in this study are superior to traditional daily scale satellite products (such as MODIS or Landsat) in terms of spatial resolution (0.02°) and temporal fineness, thereby compensating for their shortcomings in monitoring short-term change [39,40]. This facilitates an understanding of the spatiotemporal temperature characteristics during the summer maize flowering period in Henan Province. Future research will integrate additional data sources to refine the model, with the goal of building a real-time high-temperature monitoring platform and enhancing agricultural disaster warning capabilities.

5.2. Discussion of High-Temperature Heat Damage During the Summer Maize Flowering Period

The core mechanism of high-temperature heat damage during the summer maize flowering period lies in its interference with pollen development and pollination dynamics. Specifically, when temperatures exceed 32 °C, pollen tube growth is hindered, and fertilization efficiency decreases; when temperatures rise above 35 °C, pollen sterility may occur, leading to a sharp reduction in the number of ear grains [41]. Existing studies predominantly construct heat damage indices based on daily maximum temperatures, such as the cumulative number of high-temperature days or composite climate indicators, to evaluate the negative impact on seed setting rate [42]. This study utilizes hourly grid data to calculate high-temperature hours, accumulated temperature, and frequency for constructing the HTDI. The results have an extremely significant negative correlation between the HTDI and ear grain number, which is consistent with the findings of the traditional daily scale study by Wang et al. [43]. However, the method proposed here offers advantages in capturing intra-day high-temperature peaks and spatial heterogeneity. For instance, it reveals regional risks associated with longer high-temperature durations in southeastern Henan Province.
While temperature is the primary driver of heat stress, its impact is modulated by other environmental factors, most notably humidity and soil moisture. High relative humidity or vapor pressure deficit can exacerbate or alleviate heat stress by affecting plant transpiration and pollen dehydration [44,45,46]. Similarly, adequate soil moisture can enable cooling through transpiration, mitigating rises in canopy temperatures under high air temperature conditions [47]. Although our study utilized multi-source data, including D2M and SWVL1 from ERA5 as input features for temperature inversion, the constructed HTDI in this phase focused solely on temperature-derived metrics. This focus was intentional to establish a robust, high-resolution thermal baseline and to isolate the direct, quantifiable relationship between refined temperature exposure (hourly and spatially continuous) and yield loss. Future research should explicitly integrate these modulating variables—for instance, by developing a composite stress index that combines hourly temperature with concurrent humidity or soil water deficit metrics—to capture the more complex physiological reality of compound stress events [48].
This study focuses on temperature thresholds but does not consider auxiliary factors such as soil moisture and relative humidity. Humidity can regulate the degree of heat damage; high-humidity environments may alleviate high-temperature-induced dehydration stress, while low humidity levels amplify the risk of pollen inactivation [44,47]. Although research on temperature–humidity interaction mechanisms remains limited, this study prioritizes the dominant role of temperature to highlight the contribution of hourly data to model refinement. In the future, the HTDI model could be expanded by integrating humidity data and evapotranspiration data to explore the dynamic impacts of compound stresses on the physiological responses of summer maize, thereby enhancing model robustness. In addition, this study does not account for thresholds above 38 °C, which is critical for extreme events and often regarded as the heat tolerance limit for maize. Even brief exposure to such temperatures can inhibit enzyme activity and damage cellular membrane structures, leading to permanent yield losses [49]. A key next step will be to implement sensitivity analyses using nonlinear models that capture threshold effects and temperature–humidity interactions. In the context of climate change, the frequency of extreme high-temperature events is increasing. Future research should therefore integrate higher temperature thresholds and multi-source satellite data to improve prediction of the spatiotemporal evolution of extreme heat damage.

6. Conclusions

This study developed an hourly near-surface air temperature estimation model for the summer maize flowering period in Henan Province, integrating multi-source remote sensing and meteorological data with machine learning algorithms. The XGBoost model achieved the best performance (R2 = 0.9330; RMSE = 0.8408 °C), significantly improving the spatiotemporal resolution of retrieved near-surface air temperature. The developed HTDI revealed a significant negative correlation between high temperatures and maize ear grain number (R2 = 0.0541; p = 0.0007). Spatial distribution maps of heat damage for 2023–2024 were generated, which showed that heat damage in 2023 was overall mild (average HTDI = 0.22; cases with no heat damage accounted for 44%), whereas in 2024, the damage intensified (average HTDI = 0.51; moderate and higher levels of damage accounted for 67%) and was primarily distributed in the central–south and central–east regions. This framework addresses key limitations of traditional assessments that rely on daily maximum temperature from meteorological stations by introducing hourly, high-resolution monitoring. We acknowledge that the current temperature-derived HTDI explains a limited portion of yield variance, which is subjected to multiple confounding factors not considered here, including dynamic phenology, humidity, and agronomic management. Nonetheless, this study presents a refined approach for spatiotemporal monitoring of heat stress risk during a critical stage of crop growth, underscoring the utility of integrating multi-source remote sensing and machine learning in agricultural meteorology. In the future, this model could be expanded to incorporate factors such as humidity, with the aim of building a real-time warning system to help address food security challenges under climate change.

Author Contributions

X.W.: Conceptualization, Methodology, Visualization, Writing—Original Draft, Writing—Review and Editing; H.T.: Conceptualization, Methodology, Formal analysis, Supervision, Writing—Review and Editing, Corresponding Author; L.C.: Formal analysis, Writing—Review and Editing; F.Z.: Visualization, Formal analysis, Writing—Review and Editing; L.X.: Writing—Review and Editing. All authors have read and agreed to the published version of the manuscript.

Funding

This research was funded by the National Key Research and Development Program of China (Grant No. 2024YFD2301301), the Henan Provincial Key Scientific and Technological Projects (Grant Nos. 242102321027 and 242102320028), and the Innovation and Development Project of China Meteorological Administration (Grant No. CXFZ2025J057). The APC was funded by the National Key Research and Development Program of China (Grant No. 2024YFD2301301).

Data Availability Statement

The meteorological station temperature data used in this study were obtained from the National Meteorological Information Center of the China Meteorological Administration (CMA), covering hourly temperature observations from 21 July to 10 August during 2011–2024 (http://data.cma.cn/, accessed on 10 December 2024). The Himawari-8 satellite data were provided by the Japan Aerospace Exploration Agency (JAXA) through the P-Tree System platform (accessed on 20 December 2024). ERA5-Land reanalysis data were obtained from the European Centre for Medium-Range Weather Forecasts (ECMWF) (https://cds.climate.copernicus.eu/datasets/reanalysis-era5-land?tab=download, accessed on 10 January 2025). The maize spatial distribution dataset was obtained from the National Geographic Resource Science SubCenter, National Earth System Science Data Center, National Science and Technology Infrastructure of China (http://www.geodata.cn/data/datadetails.html?dataguid=219380530206209&docId=153, accessed on 12 January 2025). Digital elevation model (DEM) data at 30 m resolution were obtained from NASA (https://www.earthdata.nasa.gov/topics/land-surface/digital-elevation-terrain-model-dem, accessed on 15 January 2025).

Conflicts of Interest

All authors listed in the manuscript are aware of the submission. The authors declare no conflicts of interest.

References

  1. Mahajan, S.; Thakur, P.; Das, S.; Sharma, R.P.; Manuja, S.; Jha, P.K.; Saini, A.; Sahoo, C.; Fayezizadeh, M.R. Impression of contemporary heat stress complexities in agricultural crops: A review. Plant Growth Regul. 2025, 105, 1805–1823. [Google Scholar] [CrossRef]
  2. Lu, M.H.; Gong, Z.H.; Chen, R.G.; Huang, W.; Li, D.W. High temperature stress on crop pollen: A review. Chin. J. Appl. Ecol. 2009, 20, 1511–1516. [Google Scholar] [CrossRef]
  3. Zhang, S.Y. Effects of High Temperature Stress on Reproductive Organ Development and Yield of Summer Maize. Master’s Thesis, Hebei Agricultural University, Baoding, China, 2019. [Google Scholar] [CrossRef]
  4. Waqas, M.A.; Wang, X.; Zafar, S.A.; Noor, M.A.; Hussain, H.A.; Azher Nawaz, M.; Farooq, M. Thermal Stresses in Maize: Effects and Management Strategies. Plants 2021, 10, 293. [Google Scholar] [CrossRef]
  5. Zhang, X.; Ma, L.; Gilliam, F.S.; Wang, Q.; Li, C. Effects of raised-bed planting for enhanced summer maize yield on rhizosphere soil microbial functional groups and enzyme activity in Henan Province, China. Field Crops Res. 2012, 130, 28–37. [Google Scholar] [CrossRef]
  6. Liu, P.; Yin, B.; Gu, L.; Zhang, S.; Ren, J.; Wang, Y.; Duan, W.; Zhen, W. Heat stress affects tassel development and reduces the kernel number of summer maize. Front. Plant Sci. 2023, 14, 1186921. [Google Scholar] [CrossRef]
  7. Wei, S.; Liu, J.; Li, T.; Wang, X.; Peng, A.; Chen, C. Effect of High-Temperature Events When Heading into the Maturity Period on Summer Maize (Zea mays L.) Yield in the Huang-Huai-Hai Region, China. Atmosphere 2020, 11, 1291. [Google Scholar] [CrossRef]
  8. Xu, C.L.; Huang, X.S.; Wang, C.X.; Tang, J.H.; Lu, C. A study of the collection, drying and storage of maize pollen. J. Henan Agric. Sci. 1996, 8, 8–10. [Google Scholar] [CrossRef]
  9. Xu, M.L. Effect of Temperature on Viability of Corn Silk. J. Zhejiang Agric. Sci. 2002, 3, 120–122. [Google Scholar]
  10. Liu, M.Y.; Huang, Y.D.; Li, Z.; Lv, X.L.; Gu, M.Q.; Liao, S.H.; Dong, X.; Gao, Y.B.; Gao, Z.; Wang, P.; et al. High Temperature Disrupts Maize Silk Function Through Metabolic and Oxidative Dysregulation. Plant Cell Environ. 2025, 49, 378–397. [Google Scholar] [CrossRef] [PubMed]
  11. Yang, L.; Song, J.; Hu, F.; Han, L.; Wang, J. Monitoring the Impact of Heat Damage on Summer Maize on the Huanghuaihai Plain, China. Remote Sens. 2023, 15, 2773. [Google Scholar] [CrossRef]
  12. Li, S.; Fang, W.; Liu, T.; Ma, Z.; Noor, M.A.; Liang, L.; Ma, W.; Xue, C. Meteorological pre-warning grade of high temperature during flowering stage for summer maize in North China Plain. Int. J. Plant Prod. 2023, 17, 193–203. [Google Scholar] [CrossRef]
  13. Choi, Y.-Y.; Suh, M.-S. Development of Himawari-8/Advanced Himawari Imager (AHI) Land Surface Temperature Retrieval Algorithm. Remote Sens. 2018, 10, 2013. [Google Scholar] [CrossRef]
  14. Fan, J.; Lin, H.; Han, Q.; Chen, L.; Tan, S.; Li, W. Validation of FY-4A/AGRI LST and High Temporal–Spatial Resolution Analysis of Surface Heat Resources in Hunan Province, Central China. Atmosphere 2023, 14, 1777. [Google Scholar] [CrossRef]
  15. Liu, Z.H.; Weng, S.S.; Zeng, Z.; Ding, M.-H.; Wang, Y.-Q.; Liang, Z. Hourly land surface temperature retrieval over the Tibetan Plateau using Geo-LightGBM framework: Fusion of Himawari-8 satellite, ERA5 and site observations. Adv. Clim. Change Res. 2024, 15, 623–635. [Google Scholar] [CrossRef]
  16. Schneck, T.; Telbisz, T.; Zsuffa, I. Precipitation interpolation using digital terrain model and multivariate regression in hilly and low mountainous areas of Hungary. Hung. Geogr. Bull. 2021, 70, 35–48. [Google Scholar] [CrossRef]
  17. Wang, X.; Zhong, L.; Ma, Y. Estimation of 30 m land surface temperatures over the entire Tibetan Plateau based on Landsat-7 ETM+ data and machine learning methods. Int. J. Digit. Earth 2022, 15, 1038–1055. [Google Scholar] [CrossRef]
  18. Qi, Y.; Zhong, L.; Ma, Y.; Fu, Y.; Wang, X.; Li, P. Estimation of land surface temperature over the Tibetan plateau based on Sentinel-3 SLSTR data. IEEE J. Sel. Top. Appl. Earth Obs. Remote Sens. 2023, 16, 4180–4194. [Google Scholar] [CrossRef]
  19. Bessho, K.; Date, K.; Hayashi, M.; Ikeda, A.; Imai, T.; Inoue, H.; Kumagai, Y.; Miyakawa, T.; Murata, H.; Ohno, T.; et al. An introduction to Himawari-8/9—Japan’s new-generation geostationary meteorological satellites. J. Meteorol. Soc. Japan. Ser. II 2016, 94, 151–183. [Google Scholar] [CrossRef]
  20. Damiani, A.; Irie, H.; Horio, T.; Takamura, T.; Khatri, P.; Takenaka, H.; Nagao, T.; Nakajima, T.Y.; Cordero, R.R. Evaluation of Himawari-8 surface downwelling solar radiation by ground-based measurements. Atmos. Meas. Tech. 2018, 11, 2501–2521. [Google Scholar] [CrossRef]
  21. Hersbach, H.; Bell, B.; Berrisford, P.; Hirahara, S.; Horányi, A.; Muñoz-Sabater, J.; Nicolas, J.; Peubey, C.; Radu, R.; Schepers, D.; et al. The ERA5 global reanalysis. Q. J. R. Meteorol. Soc. 2020, 146, 1999–2049. [Google Scholar] [CrossRef]
  22. Wang, N.; Tian, J.; Su, S.; Tian, Q. A Downscaling Method Based on MODIS Product for Hourly ERA5 Reanalysis of Land Surface Temperature. Remote Sens. 2023, 15, 4441. [Google Scholar] [CrossRef]
  23. Qiu, B.; Hu, X.; Chen, C.; Tang, Z.; Yang, P.; Zhu, X.; Yan, C.; Jian, Z. Maps of cropping patterns in China during 2015–2021. Sci. Data 2022, 9, 479. [Google Scholar] [CrossRef] [PubMed]
  24. Lee, M.K.; Moon, S.H.; Yoon, Y.; Kim, Y.-H.; Moon, B.-R. Detecting anomalies in meteorological data using support vector regression. Adv. Meteorol. 2018, 2018, 5439256. [Google Scholar] [CrossRef]
  25. Xu, S.; Cheng, J.; Zhang, Q. A Random Forest-Based Data Fusion Method for Obtaining All-Weather Land Surface Temperature with High Spatial Resolution. Remote Sens. 2021, 13, 2211. [Google Scholar] [CrossRef]
  26. Belgiu, M.; Drăguţ, L. Random forest in remote sensing: A review of applications and future directions. ISPRS J. Photogramm. Remote Sens. 2016, 114, 24–31. [Google Scholar] [CrossRef]
  27. Chen, T.; Guestrin, C. Xgboost: A Scalable Tree Boosting System. In Proceedings of the 22nd ACM SIGKDD International Conference on Knowledge Discovery and Data Mining, San Francisco, CA, USA, 13–17 August 2016; pp. 785–794. [Google Scholar] [CrossRef]
  28. Jiang, Z.B.; Tao, H.B.; Wu, T.; Wang, P.; Song, Q.F. Effects of High Temperature on Maize Pollen Viability. J. China Agric. 2016, 21, 25–29. [Google Scholar]
  29. Sebbar, B.-e.; Khabba, S.; Merlin, O.; Simonneaux, V.; Hachimi, C.E.; Kharrou, M.H.; Chehbouni, A. Machine-Learning-Based Downscaling of Hourly ERA5-Land Air Temperature over Mountainous Regions. Atmosphere 2023, 14, 610. [Google Scholar] [CrossRef]
  30. Blizer, A.; Glickman, O.; Lensky, I.M. Comparing ML Methods for Downscaling Near-Surface Air Temperature over the Eastern Mediterranean. Remote Sens. 2024, 16, 1314. [Google Scholar] [CrossRef]
  31. Zhou, K.; Liu, H.; Deng, X.; Wang, H.; Zhang, S. Comparison of machine-learning algorithms for near-surface air-temperature estimation from FY-4A AGRI data. Adv. Meteorol. 2020, 2020, 8887364. [Google Scholar] [CrossRef]
  32. Wang, M.; He, G.; Zhang, Z.; Wang, G.; Zhang, Z.; Cao, X.; Wu, Z.; Liu, X. Comparison of Spatial Interpolation and Regression Analysis Models for an Estimation of Monthly Near Surface Air Temperature in China. Remote Sens. 2017, 9, 1278. [Google Scholar] [CrossRef]
  33. Hassani, A.; Santos, G.S.; Schneider, P.; Castell, N. Interpolation, satellite-based machine learning, or meteorological simulation? A comparison analysis for spatio-temporal mapping of mesoscale urban air temperature. Environ. Model. Assess. 2024, 29, 291–306. [Google Scholar] [CrossRef]
  34. Oduro, C.; Osibo, B.K.; Amankwah, S.O.Y.; Khan, S.; Kedjanyi, E.A.G.; Darteh, O.F.; Geng, Y.; Mensah, A.O.; Wu, N. Leveraging machine learning for accurate air surface temperature prediction to enhance climate adaptation strategies in Ghana. J. Afr. Earth Sci. 2025, 233, 105877. [Google Scholar] [CrossRef]
  35. IDW (Geostatistical Analyst). Available online: https://pro.arcgis.com/en/pro-app/3.3/tool-reference/geostatistical-analyst/idw.htm?utm_source (accessed on 1 November 2025).
  36. Wang, J.; Tang, B.H.; Zhu, X.; Fan, D.; Li, M.; Chen, J. A comparative analysis of five land surface temperature downscaling methods in plateau mountainous areas. Front. Earth Sci. 2025, 12, 1488711. [Google Scholar] [CrossRef]
  37. Wang, F.; Tian, D. Multivariate bias correction and downscaling of climate models with trend-preserving deep learning. Clim. Dyn. 2024, 62, 9651–9672. [Google Scholar] [CrossRef]
  38. Sekertekin, A.; Bonafoni, S. Sensitivity Analysis and Validation of Daytime and Nighttime Land Surface Temperature Retrievals from Landsat 8 Using Different Algorithms and Emissivity Models. Remote Sens. 2020, 12, 2776. [Google Scholar] [CrossRef]
  39. Wan, Z. MODIS Land Surface Temperature Products Users’ Guide; Institute for Computational Earth System Science, University of California: Santa Barbara, CA, USA, 2006; Volume 805, p. 26. Available online: https://lpdaac.usgs.gov/documents/447/MOD11_User_Guide_V4.pdf (accessed on 10 November 2025).
  40. Chen, W.; Pinker, R.T.; Ma, Y.; Hulley, G.; Borbas, E.; Islam, T.; Cawse-Nicholson, K.-A.; Hook, S.; Hain, C.; Basara, J. Land surface temperature from GOES-east and GOES-west. J. Atmos. Ocean. Technol. 2021, 38, 843–858. [Google Scholar] [CrossRef]
  41. Wang, H.M. Influence of high temperature stress on physiological indexes and yield components of maize in Hetao irrigation district. J. Arid Meteorol. 2015, 33, 59–62. [Google Scholar]
  42. Li, D.; Sun, Y.; Sun, Y. Use of integrated climatic index to determine high temperature damage to summer maize at florescence in the Huaibei Plain. Chin. J. Eco-Agric. 2015, 23, 1035–1044. [Google Scholar] [CrossRef]
  43. Wang, L.J. Spatiol-Temporal Characteristics of Drought, Heat and Its Effect on Yield for Summer Maize in Huang-Huai-Hai Plain, China; China Agricultural University: Beijing, China, 2018; Available online: https://kns.cnki.net/kcms2/article/abstract?v=-djcopRf0qHyR9g04mhY7re3-1Ros2dV28wQhuOOzQjOac5xX3OZ_4839mx2yMIXZE3St6iq4oZ_6GilxFQO_RUMrjlvc3NWIeRAsV7XU-TeWqHy3LC8snMBB4TqHPGbfdn5N48gLVPYqxapyuvngqPUUrVgjP5Nb2AodhdURaMC2jVH89mkN8WJCt2rjqyl&uniplatform=NZKPT&language=CHS (accessed on 10 November 2025).
  44. Iovane, M.; Cirillo, A.; Izzo, L.G.; Di Vaio, C.; Aronne, G. High Temperature and Humidity Affect Pollen Viability and Longevity in Olea europaea L. Agronomy 2022, 12, 1. [Google Scholar] [CrossRef]
  45. Yang, Z.; Sinclair, T.R.; Zhu, M.; Messina, C.D.; Cooper, M.; Hammer, G.L. Temperature effect on transpiration response of maize plants to vapour pressure deficit. Environ. Exp. Bot. 2012, 78, 157–162. [Google Scholar] [CrossRef]
  46. Wang, X.; Luo, N.; Zhu, Y.; Yan, Y.; Wang, H.; Xie, H.; Wang, P.; Meng, Q. Water replenishment to maize under heat stress improves canopy temperature and grain filling traits during the reproductive stage. Agric. For. Meteorol. 2023, 340, 109627. [Google Scholar] [CrossRef]
  47. Dong, X.; Li, B.; Yan, Z.; Guan, L.; Huang, S.; Li, S.; Qi, Z.; Tang, L.; Tian, H.; Fu, Z.; et al. Impacts of high temperature, relative air humidity, and vapor pressure deficit on the seed set of contrasting maize genotypes during flowering. J. Integr. Agric. 2024, 23, 2955–2969. [Google Scholar] [CrossRef]
  48. Zhu, P.; Burney, J. Untangling irrigation effects on maize water and heat stress alleviation using satellite data. Hydrol. Earth Syst. Sci. 2022, 26, 827–840. [Google Scholar] [CrossRef]
  49. Li, T.; Zhang, X.P.; Liu, Q.; Liu, J.; Chen, Y.-Q.; Sui, P. Yield penalty of maize (Zea mays L.) under heat stress in different growth stages: A review. J. Integr. Agric. 2022, 21, 2465–2476. [Google Scholar] [CrossRef]
Figure 1. Location, geographical context, and distribution of meteorological stations in the study area. (a) Location of Henan Province within China. (b) Topography and distribution of the 119 national meteorological stations used in this study within Henan Province.
Agriculture 16 00207 g001
Figure 2. Density scatter plot of training models based on different machine learning algorithms from 2023 to 2024. The black and red solid lines indicate the 1:1 reference line and the linear regression fit, respectively.
Agriculture 16 00207 g002
Figure 3. The near-surface temperature inversion result map based on XGBoost.
Agriculture 16 00207 g003
Figure 4. Comparison chart of the negative correlation between different HTDIs and the number of kernels per ear of maize. The blue dots represent the original data points (density scatter), and the red lines indicate the linear regression fits.
Agriculture 16 00207 g004
Figure 5. Spatial result map of heat damage during the summer maize flowering period in 2023 and 2024.
Agriculture 16 00207 g005
Table 1. Feature variables employed.
ProductAbbreviationContentUnit
Digital elevation modelDEMAltitudem
Himawari-8B11Brightness temperature of band 11k
B13Brightness temperature of band 13k
B14Brightness temperature of band 14k
B15Brightness temperature of band 15k
ERA5D2Mdewpoint_temperature_2mk
T2Mtemperature_2mk
LAI_HVleaf_area_index_high_vegetationm2 m−2
LAI_LVleaf_area_index_low_vegetationm2 m−2
DSsurface_net_solar_radiationJ/m2
DSCSsurface_solar_radiation_downwardsJ/m2
DLsurface_thermal_radiation_downwardsJ/m2
STL1soil_temperature_level_1k
SSRsurface_net_thermal_radiationJ/m2
SWVL1volumetric_soil_water_layer_1m3 m−3
Table 2. Training model results based on different machine learning algorithms from 2023 to 2024.
XGBoostRFSVR
Year20232024Mean20232024Mean20232024Mean
Slope0.93260.92070.92670.91300.90240.90770.90210.89330.8977
R20.93730.92860.93300.92820.91930.92380.90590.89850.9022
MAE (°C)0.57280.64650.60970.60770.67800.64290.70240.76560.7340
MSE (°C)20.66590.74920.70760.76300.84930.80620.99931.06491.0321
RMSE (°C)0.81600.86560.84080.87350.92160.89760.90591.03200.9690
Table 3. Performance of the XGBoost model for within-year and cross-year validation schemes.
Validation SchemeTraining DataTesting DataR2MAE (°C)MSE (°C)2RMSE (°C)
Within-Year2023 (80%)2023 (20%)0.93730.57280.66590.8160
Within-Year2024 (80%)2024 (20%)0.92860.64650.74920.8656
Cross-Year2023 (80%)2024 (100%)0.70741.39462.99771.7314
Cross-Year2024 (80%)2023 (100%)0.71681.38432.90241.7036
Table 4. Feature importance ranking based on mean absolute SHAP values for the XGBoost model.
Feature NameMean |SHAP| ValueContribution (%)
T2M1.691540.20
B110.463311.01
DL0.39109.29
STL10.32687.77
DEM0.21535.12
SWVL10.18574.41
B150.16543.93
LAI_LV0.14093.35
DS0.13233.15
DSCS0.10882.59
SSR0.10222.43
LAI_HV0.08752.08
D2M0.07951.89
B140.06451.53
B130.05281.26
Table 5. Statistics of heat damage level during the summer maize flowering period in Henan Province from 2023 to 2024.
Heat DamageProportion of the Area in 2023 (%)Proportion of the Area in 2024 (%)
No44.001.80
Mild55.1430.47
Moderate0.8632.83
Severe0.0023.10
Extremely severe0.0011.80
Disclaimer/Publisher’s Note: The statements, opinions and data contained in all publications are solely those of the individual author(s) and contributor(s) and not of MDPI and/or the editor(s). MDPI and/or the editor(s) disclaim responsibility for any injury to people or property resulting from any ideas, methods, instructions or products referred to in the content.